Embed Size (px)
Citation preview
1
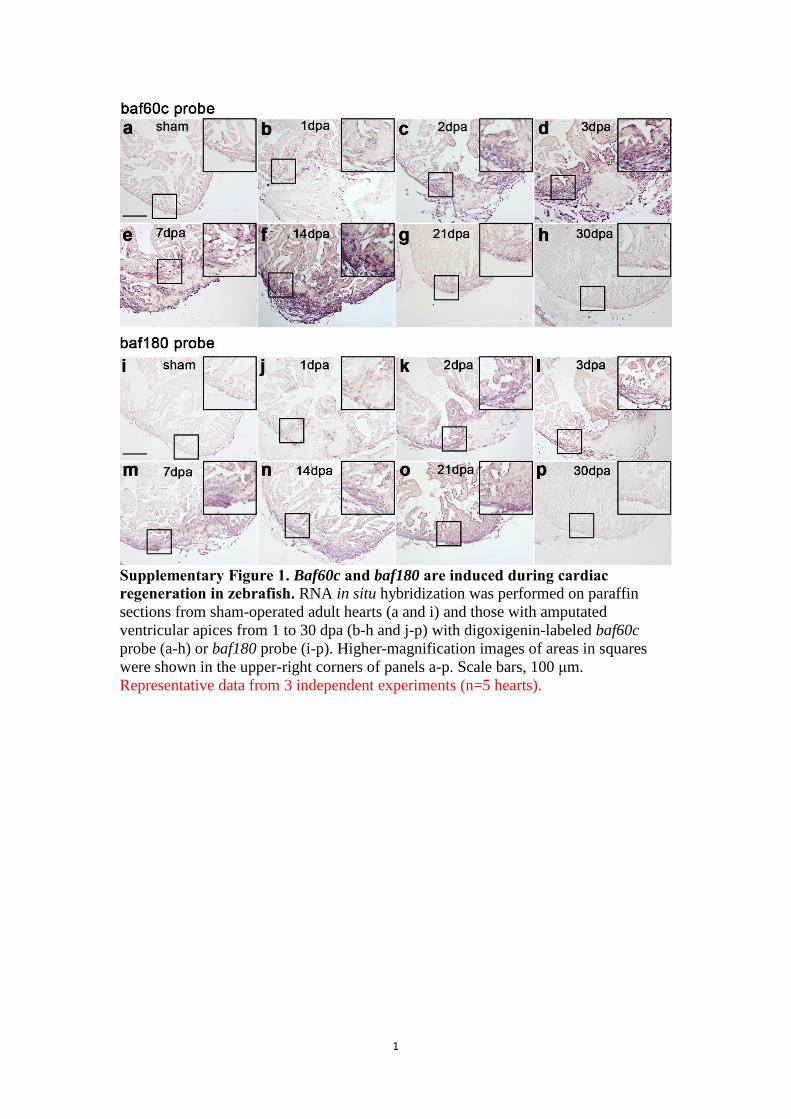
Supplementary Figure 1. Baf60c and baf180 are induced during cardiac
regeneration in zebrafish. RNA in situ hybridization was performed on paraffin
sections from sham-operated adult hearts (a and i) and those with amputated
ventricular apices from 1 to 30 dpa (b-h and j-p) with digoxigenin-labeled baf60c
probe (a-h) or baf180 probe (i-p). Higher-magnification images of areas in squares
were shown in the upper-right corners of panels a-p. Scale bars, 100 μm.
Representative data from 3 independent experiments (n=5 hearts).
2
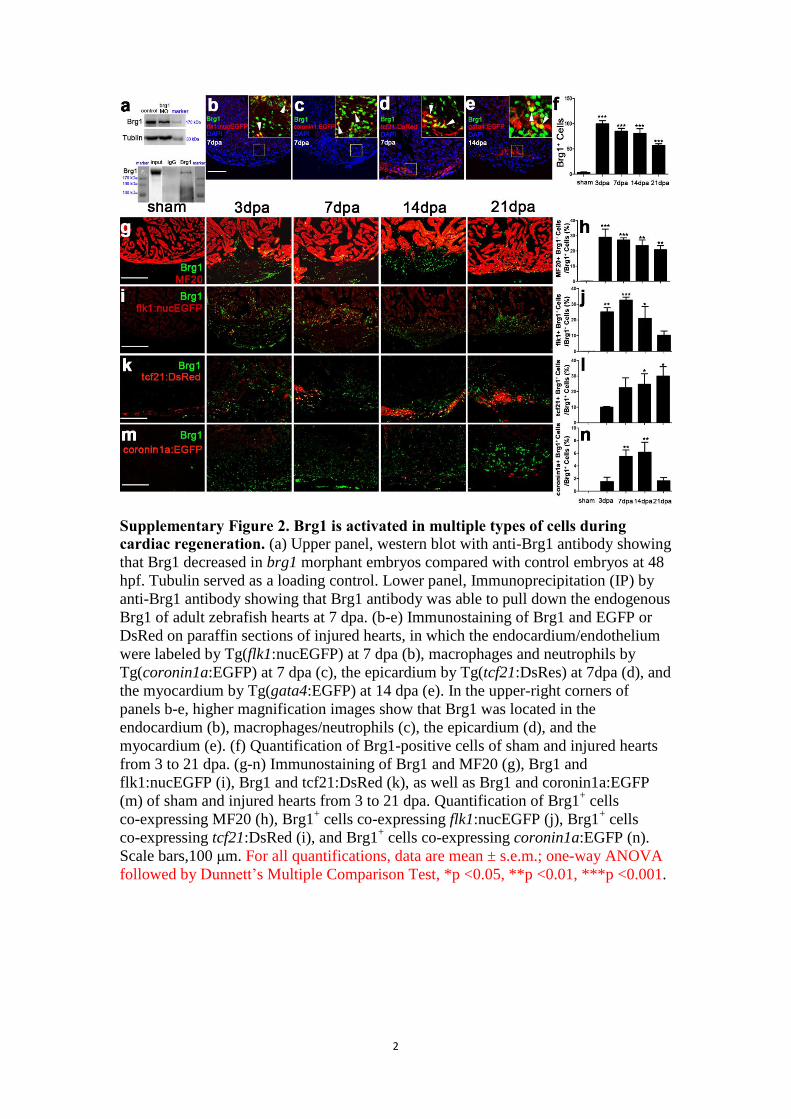
Supplementary Figure 2. Brg1 is activated in multiple types of cells during
cardiac regeneration. (a) Upper panel, western blot with anti-Brg1 antibody showing
that Brg1 decreased in brg1 morphant embryos compared with control embryos at 48
hpf. Tubulin served as a loading control. Lower panel, Immunoprecipitation (IP) by
anti-Brg1 antibody showing that Brg1 antibody was able to pull down the endogenous
Brg1 of adult zebrafish hearts at 7 dpa. (b-e) Immunostaining of Brg1 and EGFP or
DsRed on paraffin sections of injured hearts, in which the endocardium/endothelium
were labeled by Tg(flk1:nucEGFP) at 7 dpa (b), macrophages and neutrophils by
Tg(coronin1a:EGFP) at 7 dpa (c), the epicardium by Tg(tcf21:DsRes) at 7dpa (d), and
the myocardium by Tg(gata4:EGFP) at 14 dpa (e). In the upper-right corners of
panels b-e, higher magnification images show that Brg1 was located in the
endocardium (b), macrophages/neutrophils (c), the epicardium (d), and the
myocardium (e). (f) Quantification of Brg1-positive cells of sham and injured hearts
from 3 to 21 dpa. (g-n) Immunostaining of Brg1 and MF20 (g), Brg1 and
flk1:nucEGFP (i), Brg1 and tcf21:DsRed (k), as well as Brg1 and coronin1a:EGFP
(m) of sham and injured hearts from 3 to 21 dpa. Quantification of Brg1+ cells
co-expressing MF20 (h), Brg1+ cells co-expressing flk1:nucEGFP (j), Brg1
+ cells
co-expressing tcf21:DsRed (i), and Brg1+ cells co-expressing coronin1a:EGFP (n).
Scale bars,100 μm. For all quantifications, data are mean ± s.e.m.; one-way ANOVA
followed by Dunnett’s Multiple Comparison Test, *p <0.05, **p <0.01, ***p <0.001.
3
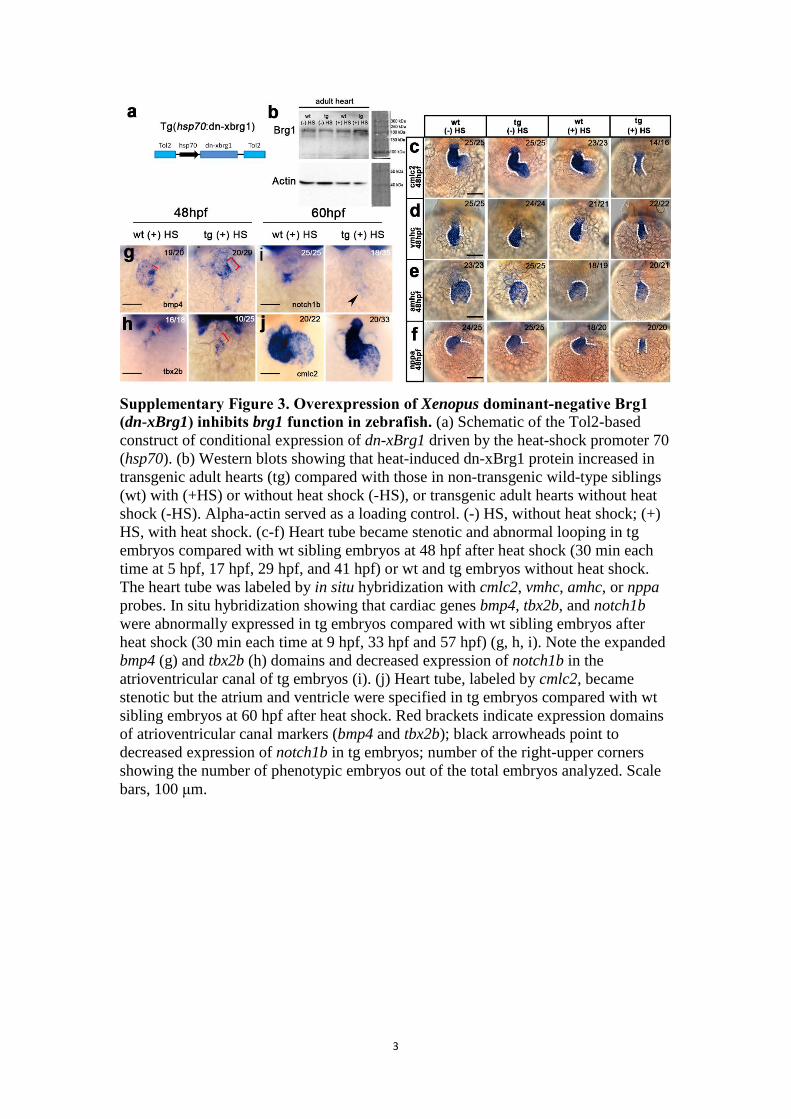
Supplementary Figure 3. Overexpression of Xenopus dominant-negative Brg1 (dn-xBrg1) inhibits brg1 function in zebrafish. (a) Schematic of the Tol2-based
construct of conditional expression of dn-xBrg1 driven by the heat-shock promoter 70
(hsp70). (b) Western blots showing that heat-induced dn-xBrg1 protein increased in
transgenic adult hearts (tg) compared with those in non-transgenic wild-type siblings
(wt) with (+HS) or without heat shock (-HS), or transgenic adult hearts without heat
shock (-HS). Alpha-actin served as a loading control. (-) HS, without heat shock; (+)
HS, with heat shock. (c-f) Heart tube became stenotic and abnormal looping in tg
embryos compared with wt sibling embryos at 48 hpf after heat shock (30 min each
time at 5 hpf, 17 hpf, 29 hpf, and 41 hpf) or wt and tg embryos without heat shock.
The heart tube was labeled by in situ hybridization with cmlc2, vmhc, amhc, or nppa
probes. In situ hybridization showing that cardiac genes bmp4, tbx2b, and notch1b
were abnormally expressed in tg embryos compared with wt sibling embryos after
heat shock (30 min each time at 9 hpf, 33 hpf and 57 hpf) (g, h, i). Note the expanded
bmp4 (g) and tbx2b (h) domains and decreased expression of notch1b in the
atrioventricular canal of tg embryos (i). (j) Heart tube, labeled by cmlc2, became
stenotic but the atrium and ventricle were specified in tg embryos compared with wt
sibling embryos at 60 hpf after heat shock. Red brackets indicate expression domains
of atrioventricular canal markers (bmp4 and tbx2b); black arrowheads point to
decreased expression of notch1b in tg embryos; number of the right-upper corners
showing the number of phenotypic embryos out of the total embryos analyzed. Scale
bars, 100 μm.

4
Supplementary Figure 4. Inhibition of brg1 impairs cardiac regeneration. (a-d)
Three wild-type (wt) sibling hearts (a-b) and 3 dn-xBrg1 transgenic (tg) hearts (c-d) at
30 dpa with heat shock treatment from 5dpa to 30dpa were subjected to serial
sections, and half of sections were then used for AFOG staining (a, c) and half for
MF20 immunofluorescence staining (b, d). Higher-magnification images of areas in
squares were shown in the right side of panels a and c. Note cardiac fibrosis (black
arrowheads) and compromised myocardial regeneration (dashed lines) in tg hearts (c,
d) compared with perfect heart regeneration in wt sibling hearts (a, b). Scale bars, 100
μm. (e) Quantification of defective hearts; the number of well-regenerated hearts
(white) or defective hearts (black) in each group was indicated in each bar (n=13 for
sibling and n=14 for dn-xBrg1 transgenic total hearts). (f) Heat-induced lethality of wt
siblings (n=18) and tg zebrafish (n=25) after heat shock at 14 dpa and 30 dpa.
5
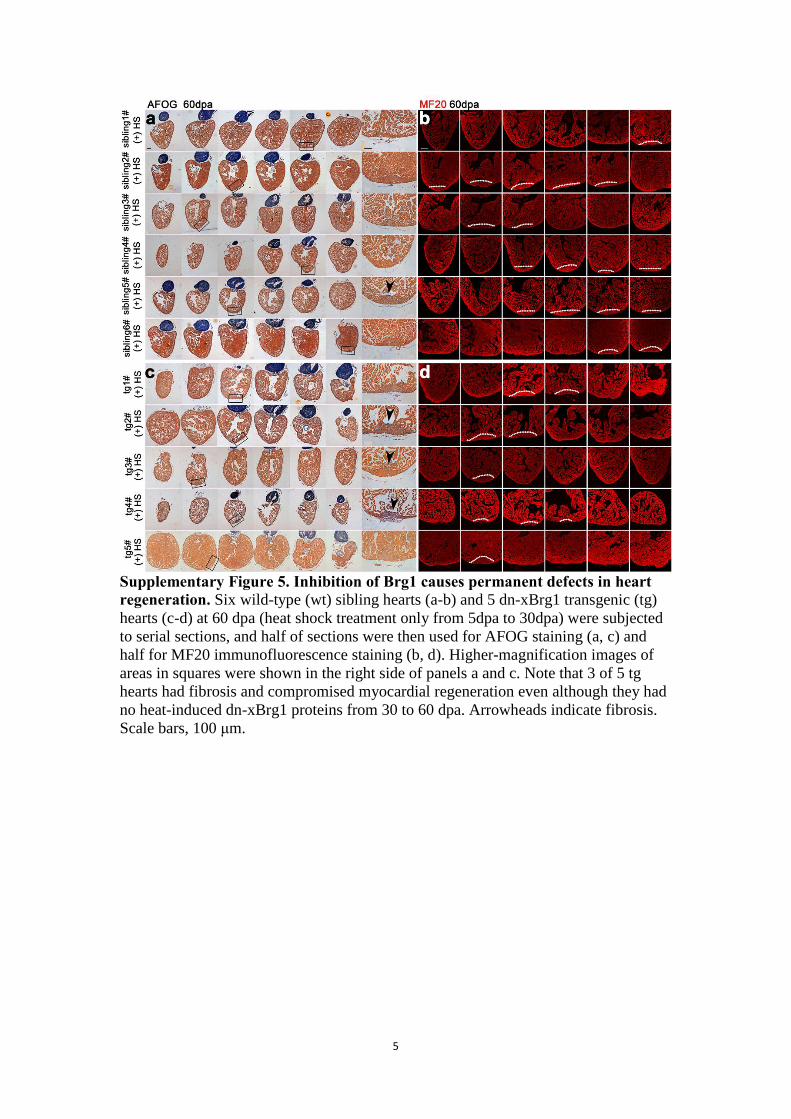
Supplementary Figure 5. Inhibition of Brg1 causes permanent defects in heart
regeneration. Six wild-type (wt) sibling hearts (a-b) and 5 dn-xBrg1 transgenic (tg)
hearts (c-d) at 60 dpa (heat shock treatment only from 5dpa to 30dpa) were subjected
to serial sections, and half of sections were then used for AFOG staining (a, c) and
half for MF20 immunofluorescence staining (b, d). Higher-magnification images of
areas in squares were shown in the right side of panels a and c. Note that 3 of 5 tg
hearts had fibrosis and compromised myocardial regeneration even although they had
no heat-induced dn-xBrg1 proteins from 30 to 60 dpa. Arrowheads indicate fibrosis.
Scale bars, 100 μm.

6
Supplementary Figure 6. Cardiomyocyte-specific overexpression of brg1 is not
sufficient to induce myocyte proliferation. PCNA+/Mef2C
+ proliferating
cardiomyocytes were not increased in uninjured Tg(myl7:CreER;
ubi:loxP-DsRed-STOP-loxP-Brg1) transgenic hearts (b) compared with uninjured
control Tg(ubi:loxP-DsRed-STOP-loxP-Brg1) hearts (a). Hearts were induced by
tamoxifen for 24hr, and 7 days post inducement paraffin heart sections were costained
for PCNA (green), Mef2C (red) and DAPI (purple). n=3; Scale bar, 100μm.
7
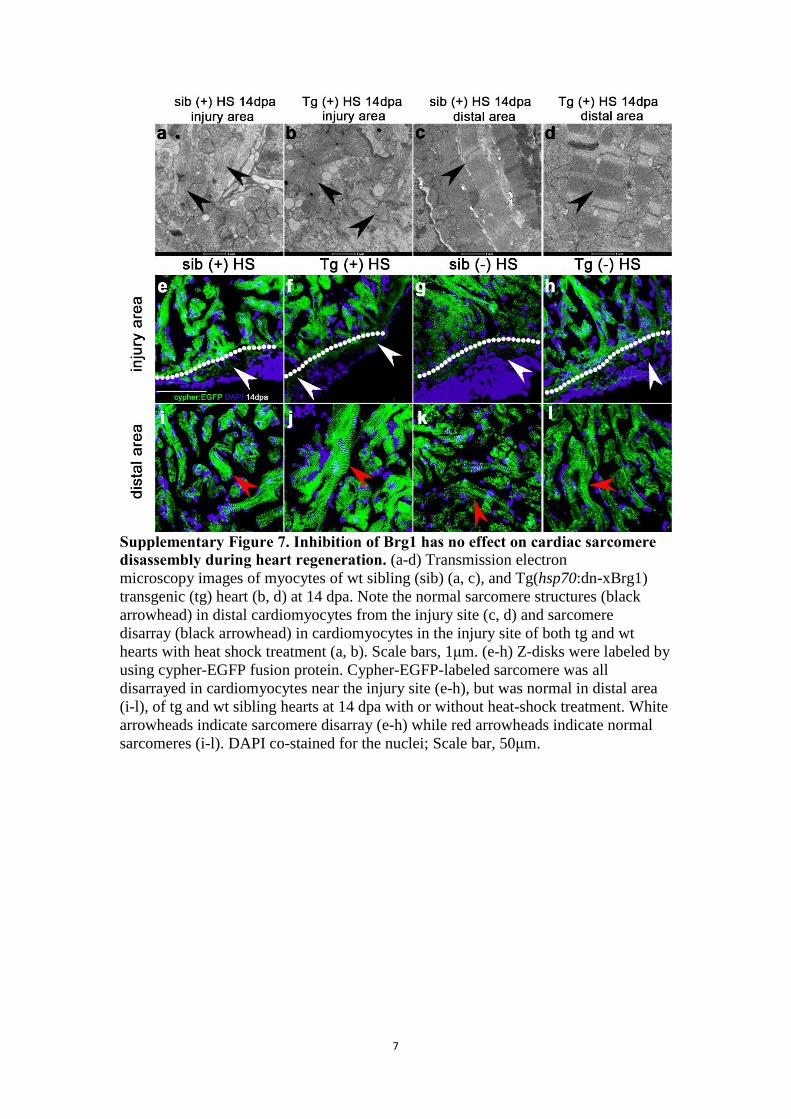
Supplementary Figure 7. Inhibition of Brg1 has no effect on cardiac sarcomere
disassembly during heart regeneration. (a-d) Transmission electron
microscopy images of myocytes of wt sibling (sib) (a, c), and Tg(hsp70:dn-xBrg1)
transgenic (tg) heart (b, d) at 14 dpa. Note the normal sarcomere structures (black
arrowhead) in distal cardiomyocytes from the injury site (c, d) and sarcomere
disarray (black arrowhead) in cardiomyocytes in the injury site of both tg and wt
hearts with heat shock treatment (a, b). Scale bars, 1μm. (e-h) Z-disks were labeled by
using cypher-EGFP fusion protein. Cypher-EGFP-labeled sarcomere was all
disarrayed in cardiomyocytes near the injury site (e-h), but was normal in distal area
(i-l), of tg and wt sibling hearts at 14 dpa with or without heat-shock treatment. White
arrowheads indicate sarcomere disarray (e-h) while red arrowheads indicate normal
sarcomeres (i-l). DAPI co-stained for the nuclei; Scale bar, 50μm.

8
Supplementary Figure 8. Inhibition of brg1 impairs cardiac regeneration. (a-c)
BrdU+/Mef2C
+ proliferating cardiomyocyte were comparable between wt sibling
hearts (a) and dn-xBrg1 transgenic hearts (b) at 14 dpa without heat shock treatment
[(-) HS]. (c) Percentages of BrdU+/Mef2C
+ cardiomyocytes in the injured area. (d-f)
PCNA+/ Mef2C
+ proliferating cardiomyocytes (arrowheads) decreased in dn-xBrg1 tg
hearts (e) compared with wt sibling hearts (d) at 14 dpa with heat shock treatment. (f)
Quantification of cardiomyocyte proliferation assessed by PCNA+/ Mef2C
+ staining
Scale bars, 100 μm. Data presented are mean ± s.e.m.; paired Student’s t-test, sample
numbers are listed under each group, ** p < 0.01.
9
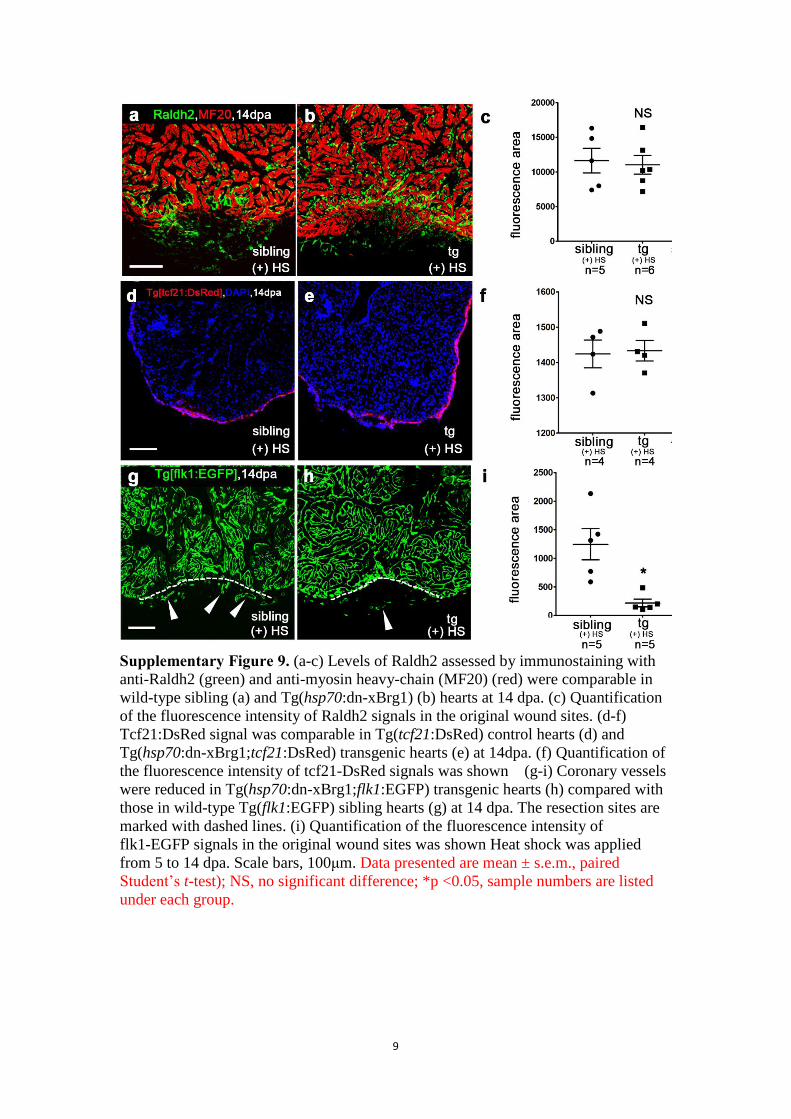
Supplementary Figure 9. (a-c) Levels of Raldh2 assessed by immunostaining with
anti-Raldh2 (green) and anti-myosin heavy-chain (MF20) (red) were comparable in
wild-type sibling (a) and Tg(hsp70:dn-xBrg1) (b) hearts at 14 dpa. (c) Quantification
of the fluorescence intensity of Raldh2 signals in the original wound sites. (d-f)
Tcf21:DsRed signal was comparable in Tg(tcf21:DsRed) control hearts (d) and
Tg(hsp70:dn-xBrg1;tcf21:DsRed) transgenic hearts (e) at 14dpa. (f) Quantification of
the fluorescence intensity of tcf21-DsRed signals was shown (g-i) Coronary vessels
were reduced in Tg(hsp70:dn-xBrg1;flk1:EGFP) transgenic hearts (h) compared with
those in wild-type Tg(flk1:EGFP) sibling hearts (g) at 14 dpa. The resection sites are
marked with dashed lines. (i) Quantification of the fluorescence intensity of
flk1-EGFP signals in the original wound sites was shown Heat shock was applied
from 5 to 14 dpa. Scale bars, 100μm. Data presented are mean ± s.e.m., paired
Student’s t-test); NS, no significant difference; *p <0.05, sample numbers are listed
under each group.

10
Supplementary Figure 10. cdkn1a and cdkn1c are induced in Tg(myl7:CreER;
ubi:DsRed-dn-xBrg1) transgenic hearts. (a-h) RNAScope in situ hybridization
analysis with cdkn1a (a-d) and cdkn1c (e-h) probes on frozen sections of injured
control Tg(ubi:DsRed-dn-xBrg1) hearts (a, c, e, g) and injured Tg(myl7:CreER;
ubi:DsRed-dn-xBrg1) transgenic hearts (b, d, f, h) at 7dpa after 4-HT induction.
Panels c, d, g and h are high-magnification images of areas in squares in panels a, b, e
and f. Black arrowheads indicate the RNAScope signals. (i-p) Bright-field views of
cdkn1a (i-l) and cdkn1ca (m-p) expression by RNAscope in situ hybridization, which
were merged with MF20 antibody confocal images, on frozen sections of injured
Tg(ubi:DsRed-dn-xBrg1) hearts (i, k, m, o) and injured Tg(myl7:CreER;
ubi:DsRed-dn-xBrg1) transgenic hearts (j, l, n, p) at 7dpa after 4-HT induction. Panels
k, l, o and p are high-magnification images of areas in squares in panels i, j, m and n.
White arrowheads show RNAScope signals in cardiomyocytes. Scale bars, 100 μm.
11
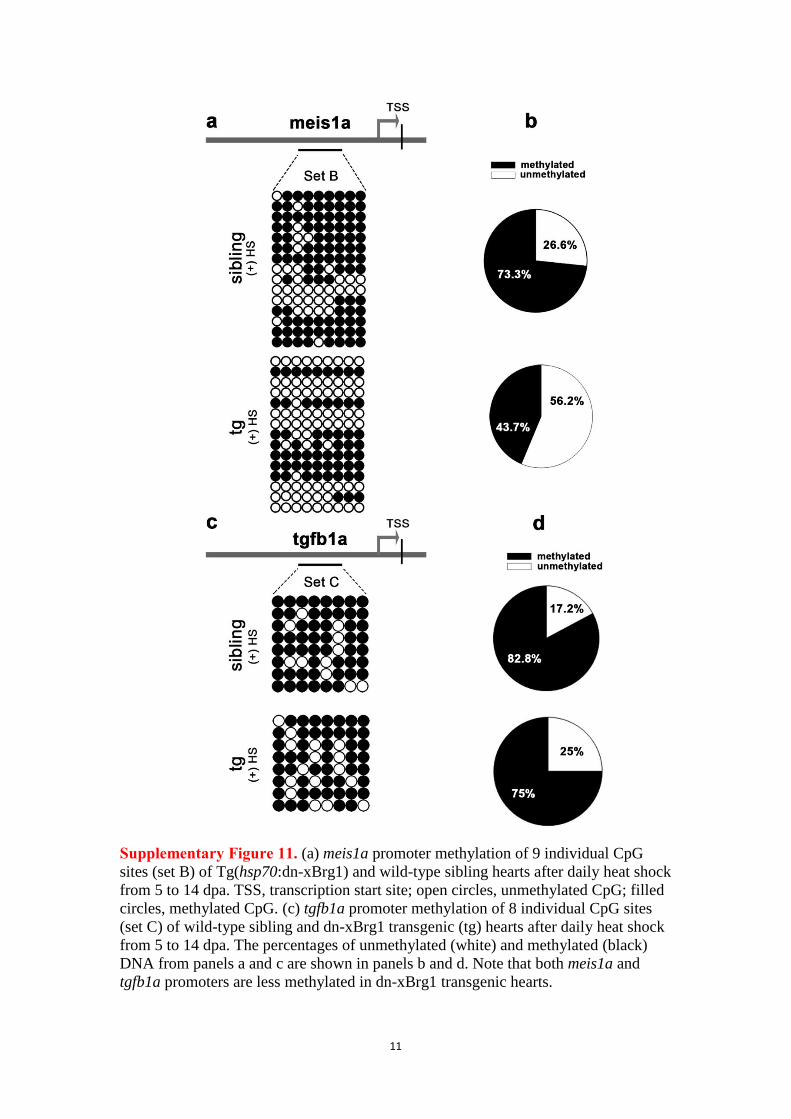
Supplementary Figure 11. (a) meis1a promoter methylation of 9 individual CpG
sites (set B) of Tg(hsp70:dn-xBrg1) and wild-type sibling hearts after daily heat shock
from 5 to 14 dpa. TSS, transcription start site; open circles, unmethylated CpG; filled
circles, methylated CpG. (c) tgfb1a promoter methylation of 8 individual CpG sites
(set C) of wild-type sibling and dn-xBrg1 transgenic (tg) hearts after daily heat shock
from 5 to 14 dpa. The percentages of unmethylated (white) and methylated (black)
DNA from panels a and c are shown in panels b and d. Note that both meis1a and
tgfb1a promoters are less methylated in dn-xBrg1 transgenic hearts.
12
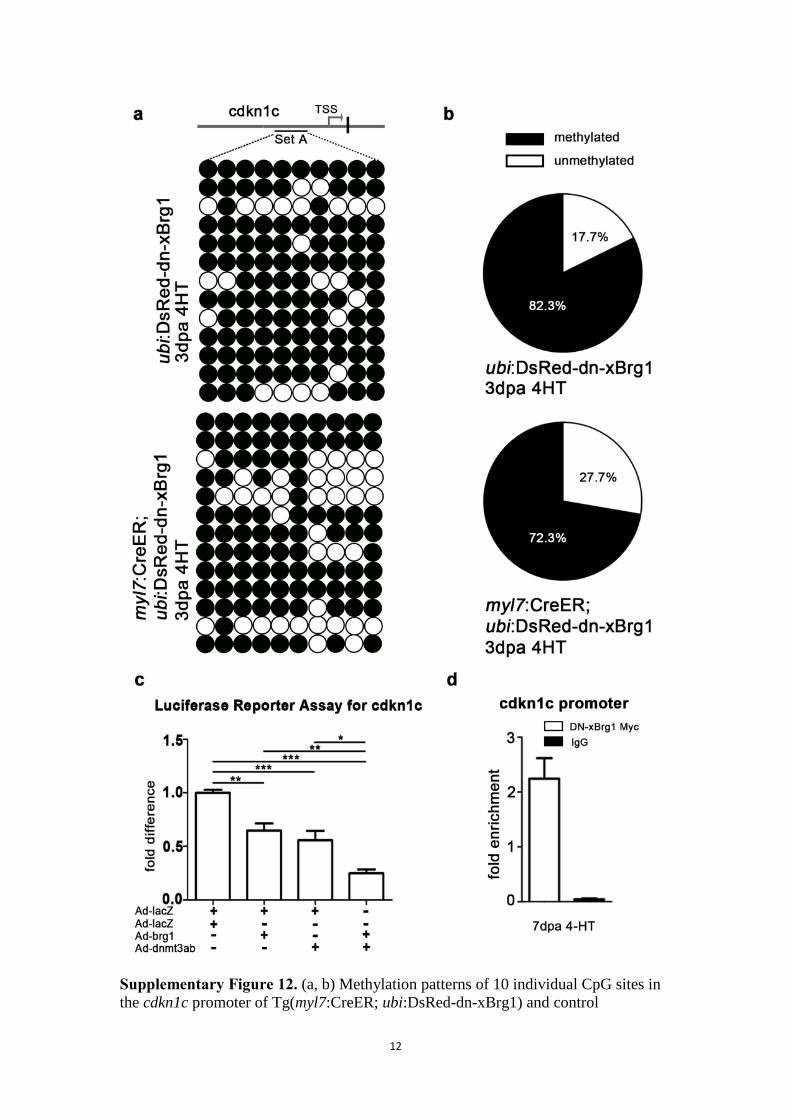
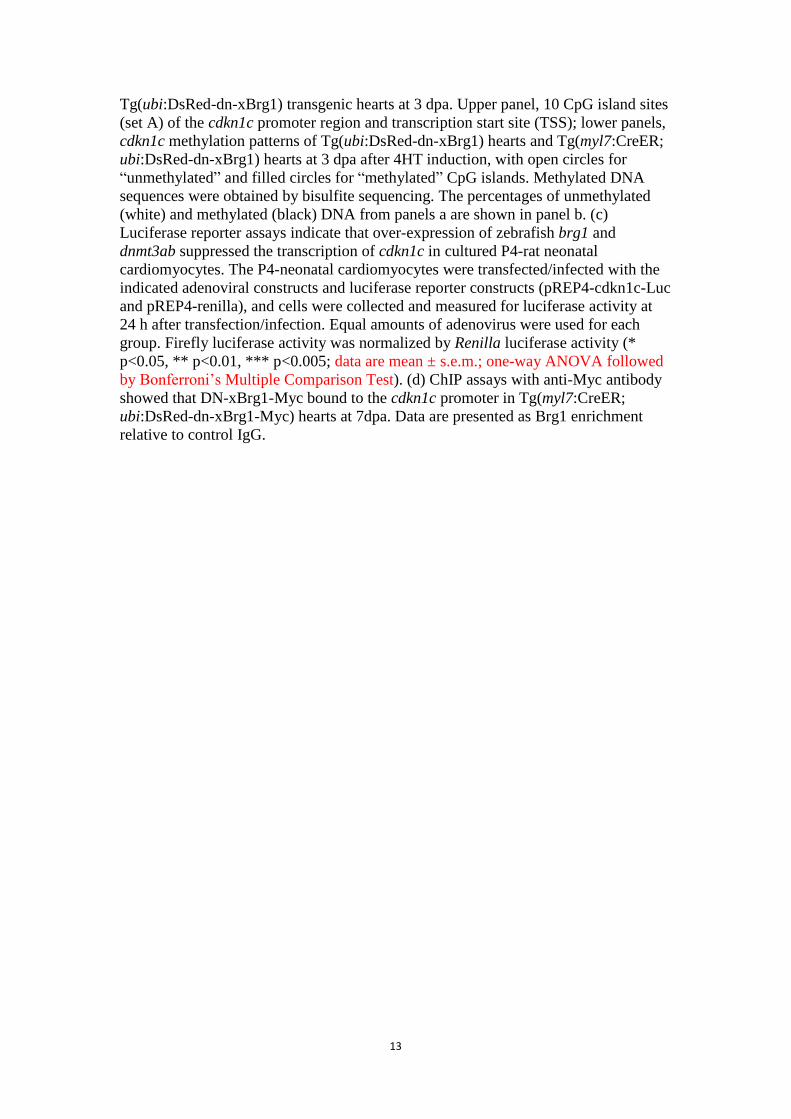
Supplementary Figure 12. (a, b) Methylation patterns of 10 individual CpG sites in
the cdkn1c promoter of Tg(myl7:CreER; ubi:DsRed-dn-xBrg1) and control
13
Tg(ubi:DsRed-dn-xBrg1) transgenic hearts at 3 dpa. Upper panel, 10 CpG island sites
(set A) of the cdkn1c promoter region and transcription start site (TSS); lower panels,
cdkn1c methylation patterns of Tg(ubi:DsRed-dn-xBrg1) hearts and Tg(myl7:CreER;
ubi:DsRed-dn-xBrg1) hearts at 3 dpa after 4HT induction, with open circles for
“unmethylated” and filled circles for “methylated” CpG islands. Methylated DNA
sequences were obtained by bisulfite sequencing. The percentages of unmethylated
(white) and methylated (black) DNA from panels a are shown in panel b. (c)
Luciferase reporter assays indicate that over-expression of zebrafish brg1 and
dnmt3ab suppressed the transcription of cdkn1c in cultured P4-rat neonatal
cardiomyocytes. The P4-neonatal cardiomyocytes were transfected/infected with the
indicated adenoviral constructs and luciferase reporter constructs (pREP4-cdkn1c-Luc
and pREP4-renilla), and cells were collected and measured for luciferase activity at
24 h after transfection/infection. Equal amounts of adenovirus were used for each
group. Firefly luciferase activity was normalized by Renilla luciferase activity (*
p<0.05, ** p<0.01, *** p<0.005; data are mean ± s.e.m.; one-way ANOVA followed
by Bonferroni’s Multiple Comparison Test). (d) ChIP assays with anti-Myc antibody
showed that DN-xBrg1-Myc bound to the cdkn1c promoter in Tg(myl7:CreER;
ubi:DsRed-dn-xBrg1-Myc) hearts at 7dpa. Data are presented as Brg1 enrichment
relative to control IgG.
14
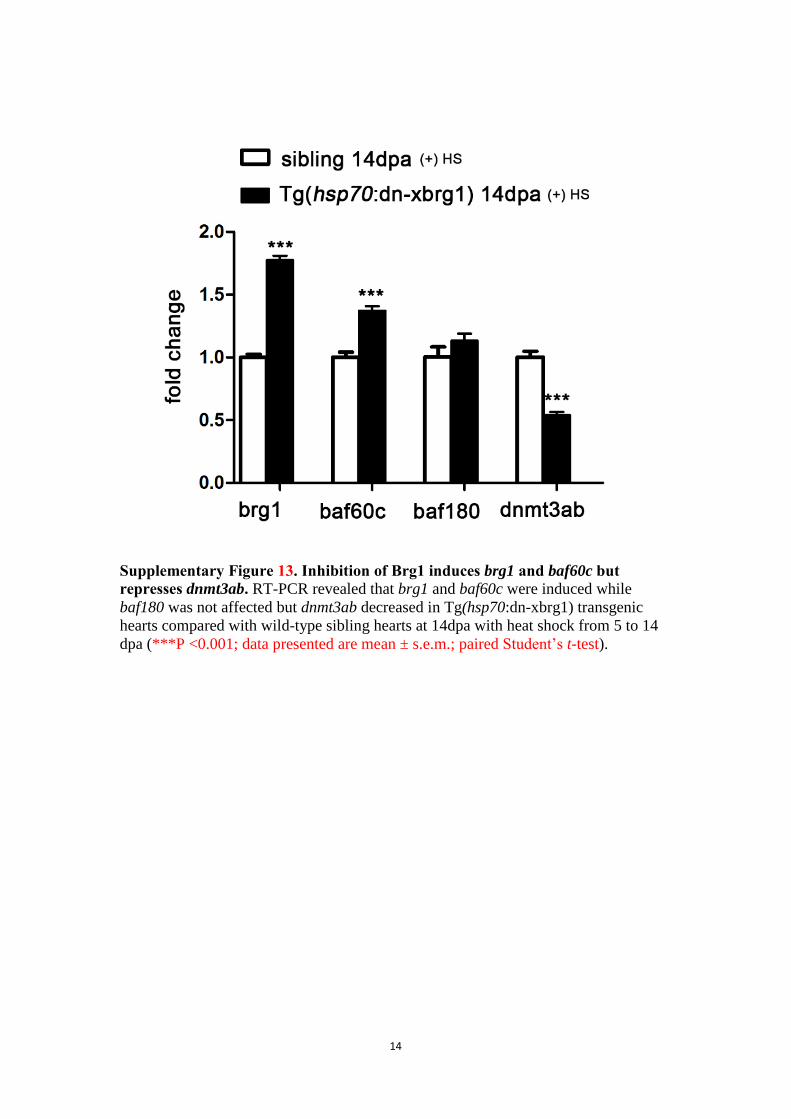
Supplementary Figure 13. Inhibition of Brg1 induces brg1 and baf60c but
represses dnmt3ab. RT-PCR revealed that brg1 and baf60c were induced while
baf180 was not affected but dnmt3ab decreased in Tg(hsp70:dn-xbrg1) transgenic
hearts compared with wild-type sibling hearts at 14dpa with heat shock from 5 to 14
dpa (***P <0.001; data presented are mean ± s.e.m.; paired Student’s t-test).
15
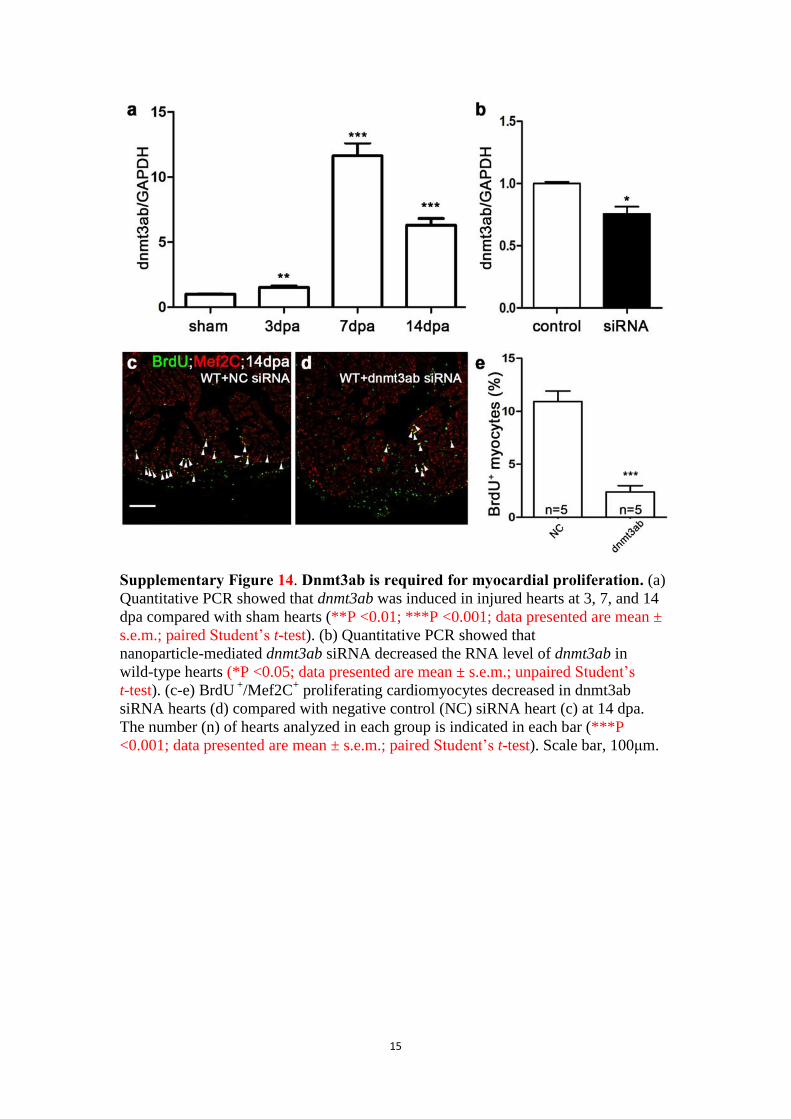
Supplementary Figure 14. Dnmt3ab is required for myocardial proliferation. (a)
Quantitative PCR showed that dnmt3ab was induced in injured hearts at 3, 7, and 14
dpa compared with sham hearts (**P <0.01; ***P <0.001; data presented are mean ±
s.e.m.; paired Student’s t-test). (b) Quantitative PCR showed that
nanoparticle-mediated dnmt3ab siRNA decreased the RNA level of dnmt3ab in
wild-type hearts (*P <0.05; data presented are mean ± s.e.m.; unpaired Student’s
t-test). (c-e) BrdU +
/Mef2C+ proliferating cardiomyocytes decreased in dnmt3ab
siRNA hearts (d) compared with negative control (NC) siRNA heart (c) at 14 dpa.
The number (n) of hearts analyzed in each group is indicated in each bar (***P
<0.001; data presented are mean ± s.e.m.; paired Student’s t-test). Scale bar, 100μm.

16
Supplementary Figure 15. Simultaneous siRNA knockdown of either cdkn1a or
cdkn1c increases myocardial proliferation in dn-xBrg1 transgenic hearts. (a, b)
Quantitative PCR showed that another independent siRNA for cdkn1a (a) or cdkn1c
(b) decreased the RNA levels of cdkn1a and cdkn1c in wild-type hearts at 2 dpa.
Control, cdkn1a 2# (a), or cdkn1c 2# (b) siRNA were injected at 1 dpa. The RNA
level was normalized to GAPDH (**p <0.01, ***p < 0.001; data presented are mean
±s.e.m.; paired Student’s t-test). (c-f) BrdU+/Mef2C
+ proliferating cardiomyocytes
increased in dn-xBrg1 transgenic hearts at 14 dpa injected with either cdkn1a 2# (d)
or cdkn1c 2# (e) compared with control NC siRNA (c). Statistics of panels c-e is
shown (f) (*p <0.05, ***p <0.001; data are mean ± s.e.m.; one-way ANOVA
followed by Dunnett’s Multiple Comparison Test; nc served as control). The number
(n) of hearts analyzed in each group is indicated in each bar; heat shock was applied
from 5 to 14 dpa. Scale bar, 100μm.

17
Supplementary Figure 16. Knockdown of CDK inhibitors in wild-type hearts
had minimal effects on myocardial proliferation. BrdU+/Mef2C
+ proliferating
cardiomyocytes (white arrowheads) were comparable among negative control (NC)
siRNA (a), cdkn1a siRNA (b), cdkn1a 2# siRNA (c), cdkn1c siRNA (d), or cdkn1c 2#
siRNA-treated (e) wild-type hearts at 14 dpa, consistent with low-level of cdkn1a and
cdkn1c in wild-type injured hearts. (f) Statistics of panels a-e. The number (n) of
hearts analyzed in each group is indicated in each group. Scale bar, 100μm.
18
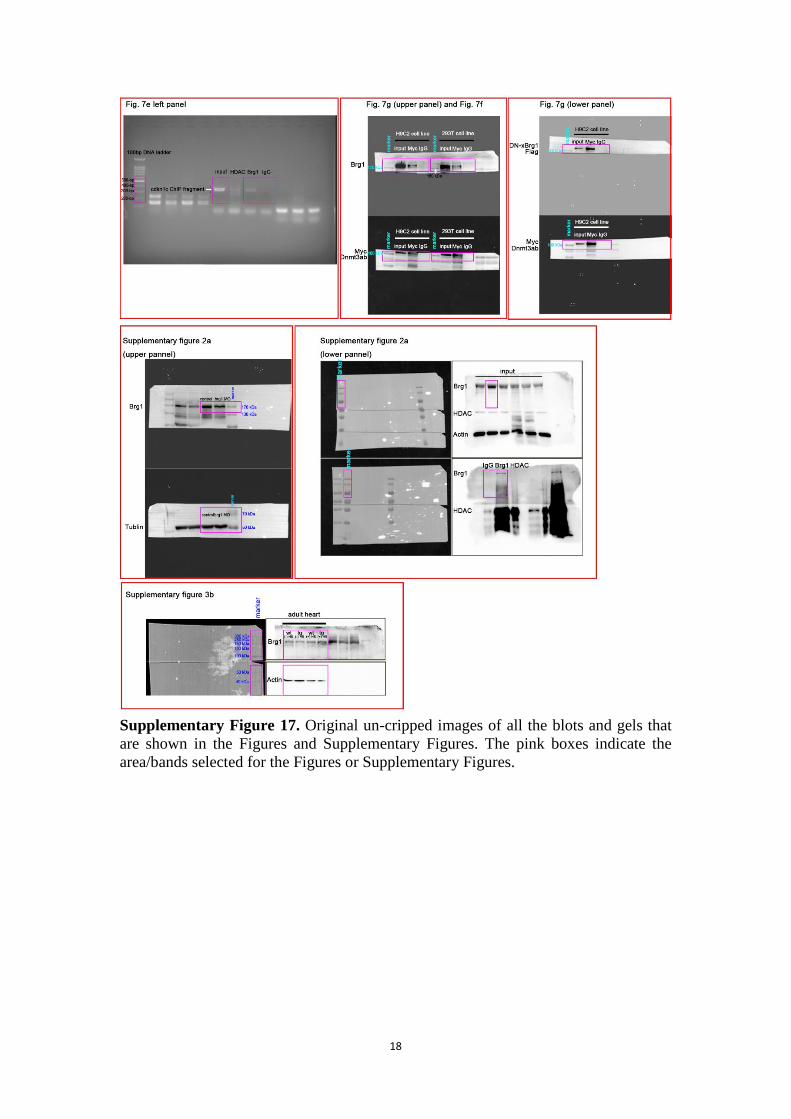
Supplementary Figure 17. Original un-cripped images of all the blots and gels that
are shown in the Figures and Supplementary Figures. The pink boxes indicate the
area/bands selected for the Figures or Supplementary Figures.

19
Supplementary Table 1. PCR primer sequences brg1-F ATGTCCACTCCTGACCCACCCATGGGCGGGAC
brg1-R ATCTTCCTCGCTGCCACTAGCC
dnmt3ab-F ATGAACTCAATGGAGGACCATGGCG
dnmt3ab-R TTAAGTTCCGACGCAGGCGAAGTAC
cdkn1a-RT-F GCTGCACTCCCGCATGAAGT
cdkn1a-RT-R CACTAGACGCTTCTTGGCTTGGT
cdkn1ba-RT-F TCAGCACGCCGAGGAAACGA
cdkn1ba-RT-R CTGGCGAAGTAGTCGATGGTGAG
cdkn1bb-RT-F ACGGGAATCACGACTGTAGGGTAA
cdkn1bb-RT-R TCTGGGCGTTCGGGTCACTT
cdkn1c-RT-F AGGCGATTTCAGAGGACACTTTGC
cdkn1c-RT-R GGAAGCGTCTCCTGTTGCGTTAA
cdkn1d-RT-f AGCTCTGCTGCATTTCGCATCTAT
cdkn1d-RT-r AATGTCCTCCTCCTGCCTCTTCAA
Meis1a-RT-f TTGGCAACAAATCTTCGCTTGGAA
Meis1a-RT-r TCCTGGTCAGCTTTCGCAACAA
meis1b-RT-f CCAATGTTCAATCCAGGAGATCCA
meis1b-RT-r GCAGCATCCTCGTCTGTCCAT
meis2a-RT-f CTTCATGTCTGATGAGCTAGTCCT
meis2a-RT-r ACGCTGCGTTAATGATCGGAG
meis2b-RT-f AGCACACATCTGACACAAATTCCA
meis2b-RT-r ACTTAGCCTTACAAGAGCACTGTT
meis3-RT-f TTCACGCTTCTGCTGCTACATTCT
meis3-RT-r ACTGCACCAACTCCTCATACCTCT
baf60c-RT-f GCTTGTTCCAGAGTCACAGGCATA
baf60c-RT-r GCATCAGGCTTGGCAGCGTTA
baf180-RT-f GGATGCTTCTGGATGCTGTGTTGA
baf180-RT-r GTATTCGGTGTGCGATGCTCTTCA
col1a1a-RT-f CCAGACGGCACCAAGAAGAACC
col1a1a-RT-r GTTGACGCAAGTCTCGCCAGTT
col1a2-RT-f GTGAAGATGGCAACAATGGCAGAC
col1a2-RT-r AGGAAGACCACGACCACCTCTC
TGFb2-RT-f CCACAGCGGTCAGTCTCCACAT
TGFb2-RT-r GACAGGCTCCTGCACAGAAGTTG
TGFb3-RT-f GCCGCTCACCATCCTCTACTAC
TGFb3-RT-r GGACCGAACATTACACGCTACAG
vimentin-RT-f AACCTGACCTGACCGCTGCT
vimentin-RT-r CTGACGCTCCAGAGACTCATTCG
dnmt3ab-RT-f ATGAACTCAATGGAGGACCATGGCG
dnmt3ab-RT-r TTAAGTTCCGACGCAGGCGAAGTAC
cdkn1c-chip-F GCAGCAGCTCCATGTCGATTCT
cdkn1c-chip-R AGTTGGTCTTATGGTGGTGTAGGC
cdkn1c-promoter-f GTTGGTCTTATGGTGGTGTAGGC
cdkn1c-promoter-r AAGTTCAATAACAATATACCAA
brg1 probe F GCCAGAGGAAGGAGGTGGATTAC
brg1 probe R GGTCTTCCTCACTGTCGTCATCACT
baf60c probe F GCAGCAGGCCGTACAGAACCGAAAC
baf60c probe R AGGGTCGGGGGGCAGTAAAAGGTTG
baf180 probe F CAATTAAGAAAGTGTTTGCCCAGAG
baf180 probe R TGGGGTTTTTGATCTGATGGTAGT
cdkn1c-methy-f TGTGTGTAAGACTCTACTTTATGTAACAAG
cdkn1c-methy-r GAGGAACATACCCTCTGGATATCTC
tgfb1a-methy-f TTTTTGATTTTTAAAGGTGTTTTAG
tgfb1a-methy-r AACACAACACTTACTAACTAACCTCC
meis1a-methy-f TGGTGTGTGTATTTGTGTGTTTTTA
meis1a-methy-r CATAATCTCTACTCCCAAACTCCAA
20
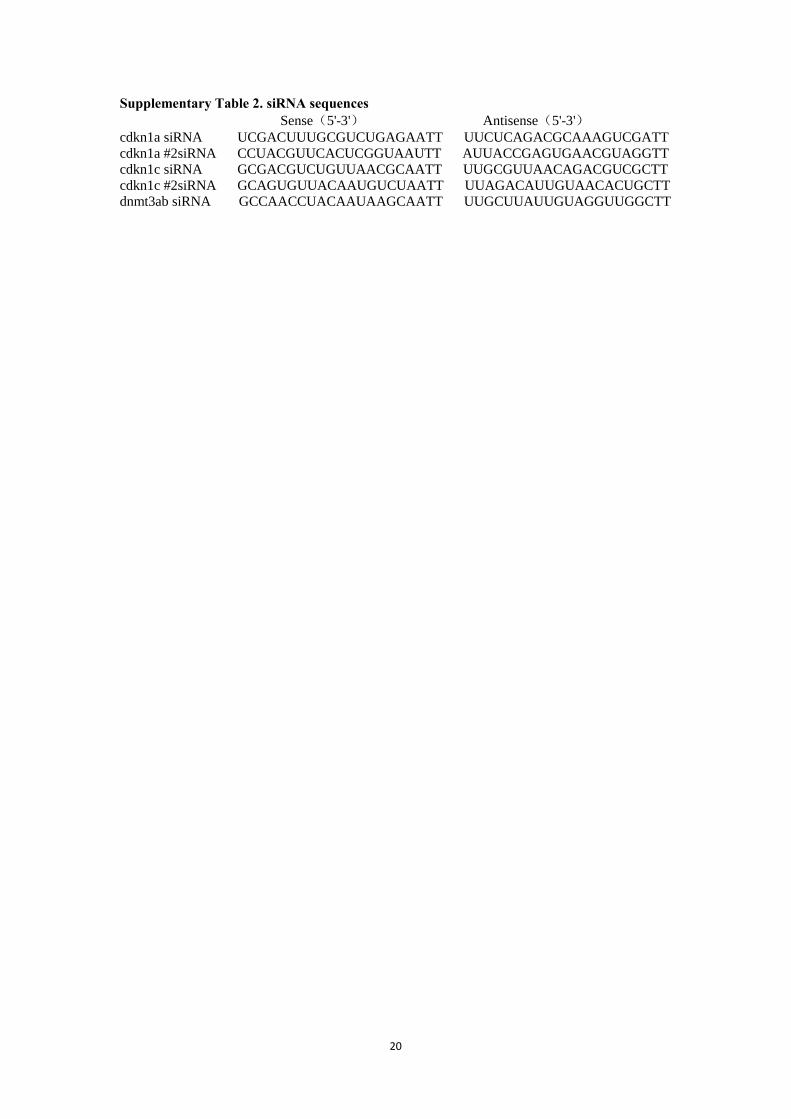
Supplementary Table 2. siRNA sequences
Sense(5'-3') Antisense(5'-3')
cdkn1a siRNA UCGACUUUGCGUCUGAGAATT UUCUCAGACGCAAAGUCGATT
cdkn1a #2siRNA CCUACGUUCACUCGGUAAUTT AUUACCGAGUGAACGUAGGTT
cdkn1c siRNA GCGACGUCUGUUAACGCAATT UUGCGUUAACAGACGUCGCTT
cdkn1c #2siRNA GCAGUGUUACAAUGUCUAATT UUAGACAUUGUAACACUGCTT
dnmt3ab siRNA GCCAACCUACAAUAAGCAATT UUGCUUAUUGUAGGUUGGCTT