Embed Size (px)
Citation preview

Badger Creek Lake Watershed Management Plan
Vision Statement
Badger Creek Lake and watershed will be a valuable natural resource by sustaining a healthy ecosystem, balancing quality of life, maintaining productivity and prosperity,
and preserving and enhancing aquatic biodiversity.
Approved – March 2012 (Plan will be updated on a 5-year cycle; years 2017, 2022, 2027, and 2032)
Prepared by: Todd Sutphin, State Watershed Coordinator
Iowa Soybean Association

Badger Creek Lake Watershed Management Plan Page 2
Badger Creek Lake Watershed Management Plan Table of Contents 1. Executive Summary ....................................................................................... 3
2. Community Based Planning .......................................................................... 43. Watershed Characteristics ............................................................................ 64. Pollutant(s) and Impairment(s) ................................................................... 195. Pollutant Source Assessment ...................................................................... 246. Goals and Objectives ................................................................................... 307. BMP Targets and Load Reduction ................................................................ 328. Water Quality Monitoring Plan ................................................................... 389. Phased Implementation Schedule, Load Reductions and Milestones .......... 4010. Public Outreach/Education ......................................................................... 4411. Resource Needs .......................................................................................... 49

Badger Creek Lake Watershed Management Plan Page 3
1. Executive Summary Badger Creek Lake was added to the Iowa 303(d) Impaired Waters List in 1998 for a siltation and nutrient enrichment impacts identified by the Iowa Department of Natural Resources (IDNR). The lake remained on Iowa’s Section 303(d) list until the completion of a TMDL in 2002 which moved the waterbody to Category 4a of the 303(d) list. The 2002 TMDL identified phosphorus as the pollutant of concern for the nutrient enrichment impairment and sediment as the cause of the siltation impairment. Additional monitoring conducted from 2004 through 2008 by Iowa State University and University Hygienic Laboratory (UHL) identified violations of the state’s water quality criterion for pH and the presence of nuisance algal growth. Both contribute to the impairment of Badger Creek Lake, but are addressed by the current TMDL. The lake opened in 1980 and a number of retention ponds were constructed within the watershed to prevent sediment delivery to the lake. Funding was secured in 2007 for targeted implementation efforts but additional work is still needed throughout the watershed. The identified source of the sediment loading is from nonpoint source pollution within the watershed.
In 2010, an IDNR sponsored Watershed Planning Grant was awarded to the Madison County Soil and Water Conservation District (SWCD) for purposes of developing this watershed management plan. Watershed assessment work began in 2011 and included land use and stream investigations. In 2012, the Madison SWCD hired a watershed planner from the Iowa Soybean Association to compile all information gathered into a watershed plan. The TMDL (2002) load capacity for allowable sediment delivery to Badger Creek Lake is 3,809 tons per year, and allowable phosphorus delivery is 7,487 pounds per year. Based on current watershed assessments estimated sediment delivery to Badger Creek Lake is 14,658 tons per year, and phosphorus is estimated at 19,055 pounds per year. This total is well above the allowable load capacity identified in the TMDL. Based on the current sediment loading estimates, the watershed management plan outlines a 544 ton per year reduction for sediment, and a 707 pound
per year reduction for phosphorus over a 20-year planning cycle. This equates to 10,883 tons per year reduction in sediment and 14,147 pounds per year reduction in phosphorus (a 74% reduction for both). This reduction will reduce non-point source pollution to below TMDL levels in the Badger Creek Lake watershed .
This plan is also intended to build the foundation for continued improvement efforts within the Badger Creek Lake watershed, and be a catalyst for additional watershed improvement projects within Madison County and surrounding areas.
Badger Creek Lake Watershed Management Plan Page 4
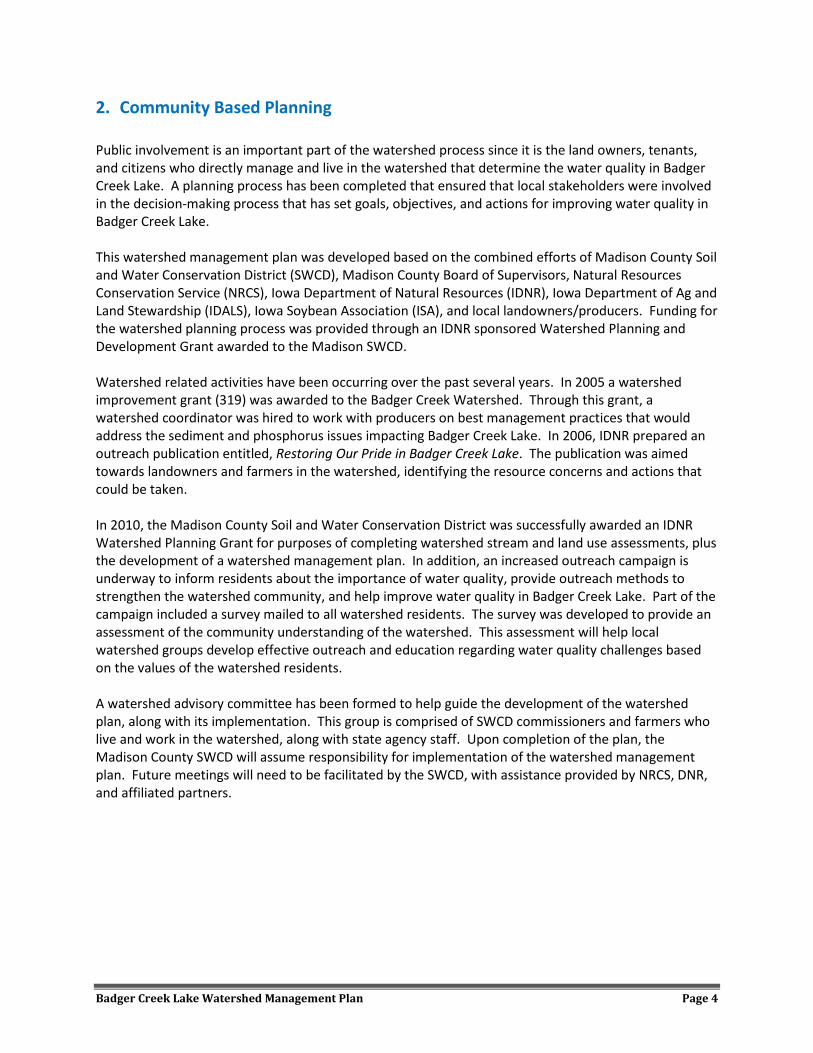
2. Community Based Planning Public involvement is an important part of the watershed process since it is the land owners, tenants, and citizens who directly manage and live in the watershed that determine the water quality in Badger Creek Lake. A planning process has been completed that ensured that local stakeholders were involved in the decision-making process that has set goals, objectives, and actions for improving water quality in Badger Creek Lake. This watershed management plan was developed based on the combined efforts of Madison County Soil and Water Conservation District (SWCD), Madison County Board of Supervisors, Natural Resources Conservation Service (NRCS), Iowa Department of Natural Resources (IDNR), Iowa Department of Ag and Land Stewardship (IDALS), Iowa Soybean Association (ISA), and local landowners/producers. Funding for the watershed planning process was provided through an IDNR sponsored Watershed Planning and Development Grant awarded to the Madison SWCD. Watershed related activities have been occurring over the past several years. In 2005 a watershed improvement grant (319) was awarded to the Badger Creek Watershed. Through this grant, a watershed coordinator was hired to work with producers on best management practices that would address the sediment and phosphorus issues impacting Badger Creek Lake. In 2006, IDNR prepared an outreach publication entitled, Restoring Our Pride in Badger Creek Lake. The publication was aimed towards landowners and farmers in the watershed, identifying the resource concerns and actions that could be taken. In 2010, the Madison County Soil and Water Conservation District was successfully awarded an IDNR Watershed Planning Grant for purposes of completing watershed stream and land use assessments, plus the development of a watershed management plan. In addition, an increased outreach campaign is underway to inform residents about the importance of water quality, provide outreach methods to strengthen the watershed community, and help improve water quality in Badger Creek Lake. Part of the campaign included a survey mailed to all watershed residents. The survey was developed to provide an assessment of the community understanding of the watershed. This assessment will help local watershed groups develop effective outreach and education regarding water quality challenges based on the values of the watershed residents. A watershed advisory committee has been formed to help guide the development of the watershed plan, along with its implementation. This group is comprised of SWCD commissioners and farmers who live and work in the watershed, along with state agency staff. Upon completion of the plan, the Madison County SWCD will assume responsibility for implementation of the watershed management plan. Future meetings will need to be facilitated by the SWCD, with assistance provided by NRCS, DNR, and affiliated partners.

Badger Creek Lake Watershed Management Plan Page 5
Table 1. Badger Creek Lake Watershed Group
Name Affiliation/Title Mike Koch Madison County Soil and Water Conservation District; farmer Frank Martens Madison County Soil and Water Conservation District; farmer Dan Golightly Landowner; farmer James Baur Landowner; farmer James Meyer Landowner Mike McGhee Iowa Department of Natural Resources Gary Sobotka Iowa Department of Natural Resources - Fisheries Andy Asell Iowa Department of Natural Resources – GIS James Martin Iowa Department of Ag and Land Stewardship Rachel Glaza Iowa Department of Natural Resources Wayne Shafer Natural Resource Conservation Service Todd Sutphin Iowa Soybean Association
Badger Creek Lake Watershed Management Plan Page 6
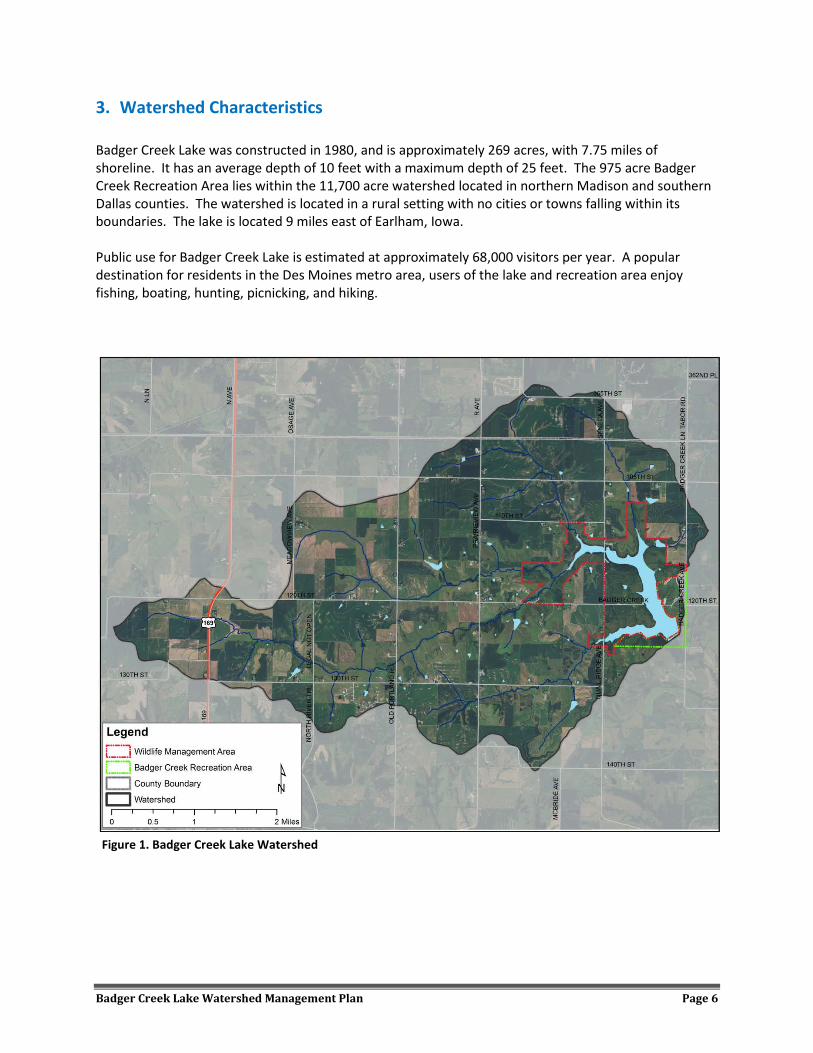
3. Watershed Characteristics Badger Creek Lake was constructed in 1980, and is approximately 269 acres, with 7.75 miles of shoreline. It has an average depth of 10 feet with a maximum depth of 25 feet. The 975 acre Badger Creek Recreation Area lies within the 11,700 acre watershed located in northern Madison and southern Dallas counties. The watershed is located in a rural setting with no cities or towns falling within its boundaries. The lake is located 9 miles east of Earlham, Iowa. Public use for Badger Creek Lake is estimated at approximately 68,000 visitors per year. A popular destination for residents in the Des Moines metro area, users of the lake and recreation area enjoy fishing, boating, hunting, picnicking, and hiking.
Figure 1. Badger Creek Lake Watershed

Badger Creek Lake Watershed Management Plan Page 7
Physical Characteristics The following table lists some of the general characteristics of Badger Creek Lake and its watershed. Physical characteristics are from the Total Maximum Daily Load (TMDL) prepared by the IDNR in 2002. Table 2. Badger Creek Lake summary
IDNR Waterbody ID IA 04-LDM-03080-L 12-Digit Hydrologic Unit Code (HUC 12) 071000080403 12-Digit HUC Name Badger Creek –North River Location Madison County, Section 13, T77N, R27W Latitude 41 deg. 20 min. 30 sec N Longitude 93 deg. 54 min. 51 sec W Designated Uses 1. Primary contact recreation (A1)
2. Aquatic life support (B(LW)) Tributaries Badger Creek Receiving waterbody Badger Creek to North River Lake Surface Area 269 acres Maximum depth 25 feet Mean depth 10 feet Volume 2,616 acre-feet Length of Shoreline 7.75 miles Watershed area 11,700 acres Watershed/Lake area ratio 43:1 The drainage area to Badger Creek Lake is a 11,700 acre watershed, with a lake surface area of 269 acres. The lake has a mean depth of 10 feet and a maximum depth of 25 feet. Badger Creek Lake is fed by Badger Creek. A dam is located at the southern end of the lake and the lake outlet feeds back into Badger Creek. The watershed to lake area ratio is 43:1 which indicates watershed conditions have a potentially large impact on in-lake water quality. Hydrology Badger Creek Lake lies within the Lake Red Rock (HUC-8) and Lower North River (HUC-10) watersheds. Badger Creek is the main contributing source and empties into the north end of Badger Creek Lake. See Table 2 above for additional information regarding Badger Creek Lake and its features.

Badger Creek Lake Watershed Management Plan Page 8
Figure 2. Badger Creek Lake, Bathymetric Map

Badger Creek Lake Watershed Management Plan Page 9
Soils Badger Creek Lake watershed is dominated by the Sharspburg-Lamoni soil association which comprises a majority of the watershed. This association is characterized by gently sloping ridgetops with moderately to strongly sloping side slopes. Soils are moderately well drained to somewhat poorly drained. Erosion is slight to severe. Figure 3 shows the soil map generated from the SSURGO coverage developed by the National Cooperative Soil Survey from the USDA-NRCS. Table 3. Watershed soils.
The Sharpsburg soils series accounts for 50% of the watershed area. This series consists of very deep, moderately well drained soils formed in loess. These soils are on side slopes on dissected till plains and on treads and risers on stream terraces in river valleys. Slope ranges from 0 to 18 percent. The Shelby soil series accounts for 14% of the watershed area and consist of very deep, well drained soils formed in till. These soils are on convex side slopes, crests, and narrow interfluves on dissected till plains. Slope ranges from 1 to 40 percent. The Macksburg soil series accounts for 13% of the watershed area and consist of very deep, somewhat poorly drained soils formed in loess. These soils are on summits and shoulders on interfluves and ridgetops on dissected till plains and on treads and risers on stream terraces in river valleys. Slope ranges from 0 to 9 percent. The Lamoni soil series accounts for 10% of the watershed area and consist of very deep, somewhat poorly drained soils formed in 25 to 50 centimeters of loess or a mixture of loess and pedisediment and the underlying paleosol formed in till. These soils are on side slopes on dissected till plains. Slope ranges from 5 to 18 percent.
Dominant Soils Acres
Percent of Total Area
Runoff potential Drainage Class
Hydro-group Farmland Class Erodible Class
Sharpsburg 5,582 50.4% High Moderately well drained B All areas are
prime farmland Highly erodible
land
Shelby 1,553 14.0% High Well drained C Farmland of
statewide importance
Highly erodible land
Macksburg 1,404 12.7% Low Somewhat poorly drained B All areas are
prime farmland Not highly
erodible land
Lamoni 1,069 9.6% Very high
Somewhat poorly drained C
Farmland of statewide
importance
Highly erodible land
Other 1,471 13.3% ------ ------ ------ ------ ------

Badger Creek Lake Watershed Management Plan Page 10
Figure 3. Badger Creek Lake watershed soil map derived from the National Cooperative Soil Survey, USDA-NRCS.

Badger Creek Lake Watershed Management Plan Page 11
Figure 4. Highly erodible soils in the Badger Creek Lake watershed. National Cooperative Soil Survey, USDA-NRCS.
Figure 4 is a map of highly erodible soils within the watershed. Approximately 50% of the watershed is classified as highly erodible or potentially erodible. Below is the classification by category and percentage of watershed.
- Highly erodible land (HEL): 48.7% - Potentially highly erodible: 1.2% - Not highly erodible land: 47.3% - Other/NA: 2.8%

Badger Creek Lake Watershed Management Plan Page 12
Figure 5. Corn suitability rating in Badger Creek Lake Watershed (SSURGO, USDA-NRCS)
Corn suitability ratings provide a relative ranking of soils mapped in the state based on their potential to be utilized for intensive row crop production. The CSR is an index that can be used to rank one soil’s yield potential against another. Ratings range from 100 for soils that have no physical limitations, occur on minimal slopes, and can be continuously row cropped to as low as 5 for soils with severe limitations for row crops. Figure 5 is a map of the CSR ratings in the Badger Creek Lake watershed.
Badger Creek Lake Watershed Management Plan Page 13
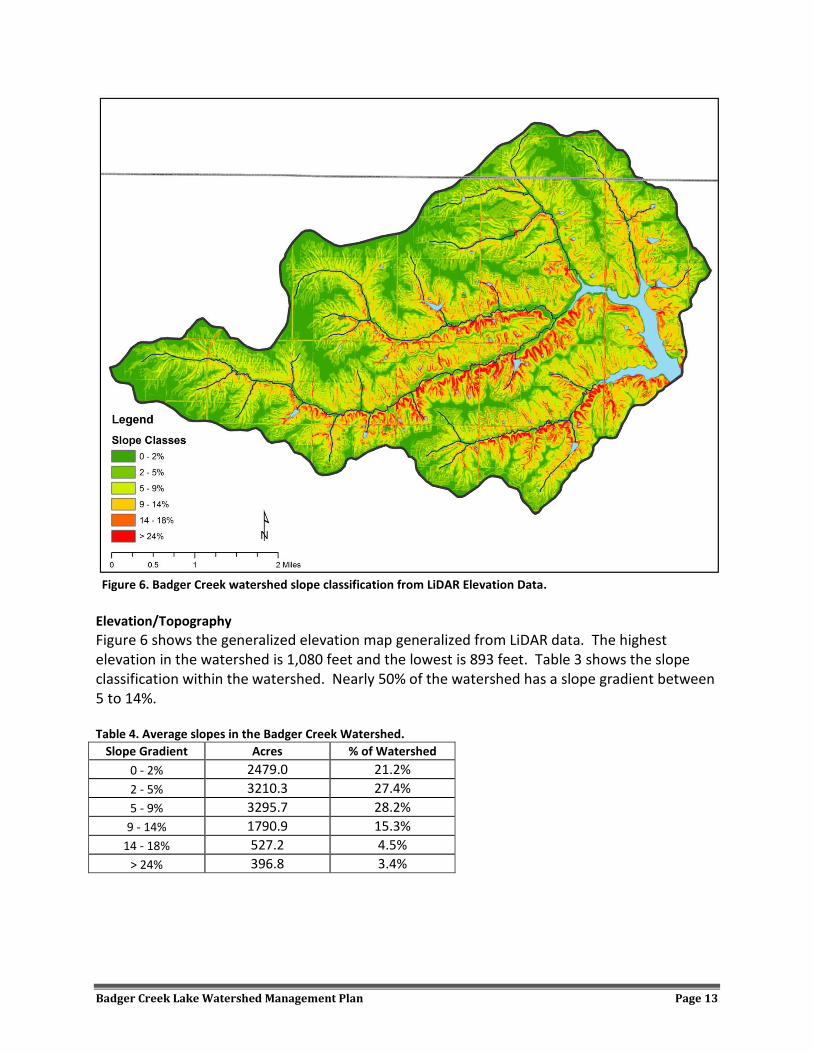
Figure 6. Badger Creek watershed slope classification from LiDAR Elevation Data.
Elevation/Topography Figure 6 shows the generalized elevation map generalized from LiDAR data. The highest elevation in the watershed is 1,080 feet and the lowest is 893 feet. Table 3 shows the slope classification within the watershed. Nearly 50% of the watershed has a slope gradient between 5 to 14%. Table 4. Average slopes in the Badger Creek Watershed.
Slope Gradient Acres % of Watershed 0 - 2% 2479.0 21.2% 2 - 5% 3210.3 27.4% 5 - 9% 3295.7 28.2%
9 - 14% 1790.9 15.3% 14 - 18% 527.2 4.5%
> 24% 396.8 3.4%

Badger Creek Lake Watershed Management Plan Page 14
Climate According to the Midwest Regional Climate Center the average annual maximum temperature for Boone County is 59.31 degrees Fahrenheit, and average minimum temperature is 37.8 degrees Fahrenheit. Average annual precipitation is 34.31 inches, with 8.3 days of rainfall greater than 1 inch and 22.8 days of rainfall greater than ½ inch. Below is a table list annual rainfall for the City of Winterset over the past 20 years. Table 5. Winterset Rainfall Data; 1990 to 2011
YEAR JAN FEB MAR APR MAY JUN JUL AUG SEP OCT NOV DEC ANN 1991 0.93 0.11 3.8 7.39 3.94 3.29 2.14 3.33 1.02 3.46 4.87 1.94 36.22 1992 0.78 1.75 2.17 4.27 1.86 0.64 7.49 1.49 9.29 0.2 5.93 2.14 38.01 1993 0.97 1.1 3.85 3.07 7.81 6.08 9.86 9.14 4.41 1.46 0.86 0.54 49.15 1994 0.81 1.05 0 2.75 2.43 3.11 4.74 2.83 2.96 1.26 1.74 1.15 24.83 1995 0.73 0.55 2.26 5.6 4.39 3.93 5.29 1.65 3.16 0.93 1.69 0.49 30.67 1996 2.66 0.18 0.62 2.51 10.64 7.09 3.97 3.25 3.87 3.06 2.51 0.43 40.79 1997 0.66 1.14 0.92 3.77 4.45 2.37 0.9 1.8 3.3 3.89 1.16 1.36 25.72 1998 0.95 1.85 3.66 1.55 3.55 6.05 5.51 4.26 1.18 3.32 2.62 0.46 34.96 1999 0.5 1.33 1.47 6.15 4.98 5.9 2.5 2.74 2.92 0.35 1.28 0.63 30.75 2000 0.43 1.23 0.76 2.44 1.81 5.79 4.61 1.18 1.76 1.32 2.17 2.22 25.72 2001 1.91 2.4 1.45 3.08 6.13 2.98 1.45 1.71 5.84 1.92 0.75 0.43 30.05 2002 0.32 0.96 1.31 3.46 5.54 1.52 2.58 3.44 1.73 4.46 0.13 0.18 25.63 2003 0.42 1.52 0.79 4.36 4.75 4.45 2.21 1.23 3.41 1.27 5.52 0.96 30.89 2004 1.72 1.45 4.46 1.28 10.61 2.54 5.17 5.04 2.23 0.84 2.27 0.62 38.23 2005 1.38 1.54 1.13 3.31 6.24 3.75 3.35 1.26 1.7 0.78 0.99 1 26.43 2006 0.46 0.08 4.27 4.09 3.54 0.79 3.51 7.27 4.08 1.74 1.96 2.13 33.92 2007 1.05 1.8 2.43 3.92 6.74 1.27 2.1 8.93 4.29 6.35 0.27 2.65 41.8 2008 0.38 1.71 1.61 4.83 4.77 12.78 9.22 1.3 4.48 4.38 2.36 1.52 49.34 2009 0.79 0.45 4.22 4.59 3.88 6.84 2.97 5.38 1.42 6.34 1.1 2.11 40.09 2010 1.1 0.9 2.09 3.38 4.93 10.8 9.22 6.42 6.9 0.76 2.43 0.52 49.45 2011 0.84 0.78 1.37 3.5 8.15 10.78 3 4.18 1.18 1.11 2.49 2.22 39.6 2012 14.03 M M M M M M M M M M M 14.03
MEAN 1.13 1.06 2.11 3.43 4.45 4.82 3.9 4.02 3.52 2.37 1.91 1.05 33.25
# IEM Climodat http://mesonet.agron.iastate.edu/climodat/ Historical Land Use The Government Land Office (GLO) conducted the original public land survey of Iowa during the period 1832 to 1859. Deputy Surveyors and their assistants produced both field notes and township maps that briefly described the land and its natural resources (vegetation, water, soil, landform, and so on) at the time of the survey. These maps and survey notes are one of few data sources about vegetation distribution before much of Iowa changed to a landscape of intensive agriculture. This coverage represents the observed vegetation by the deputy surveyors when laying out the public land surveys in Madison and Dallas Counties. During this time period over 99% of the land area was in prairie, with intermittent marsh land.

Badger Creek Lake Watershed Management Plan Page 15
Figure 7. Historic land use for the Badger Creek Lake watershed
Current Land Use A field level land use survey was conducted in 2011 for the Badger Creek Lake watershed in order to obtain land use and conservation practice data at the field level. The key data collected as part of the survey included current land use, tillage practice, crop residue, and conservation practices. The survey was performed primarily via visual reconnaissance, although local NRCS and other agency personal were consulted to obtain information on certain parts of the watershed. While there is certain level of subjectivity to this type of survey, especially when determining crop rotations and residue levels, this approach is the only way to collect this amount of detail at this time.

Badger Creek Lake Watershed Management Plan Page 16
Figure 8. 2011 Land Use Assessment for Badger Creek Lake Watershed.
Table 6. 2011 Land Use.
2011 Land Cover Area (in Acres) Percent of Total Area Row Crop 6,959.8 61.1% Pasture 2,101.4 18.5% Artificial 649.5 5.7% Shrub/Scrub 773.3 6.8% Timber 243.0 2.1% Water 336.7 3.0% grassland 318.5 2.8% Parkland 0.9 0.0%

Badger Creek Lake Watershed Management Plan Page 17
Figure 9. Tillage practices from 2011 land use survey
Table 7. 2011 Tillage.
2011 Tillage Area (in Arces) Percent of Total Area Conventional Till 4982.3 43.8% Mulch Till 259.1 2.3% No Till 1422.7 12.5% No Till / Mulch Till 268.2 2.4% Not Applicable 4451.1 39.1%

Badger Creek Lake Watershed Management Plan Page 18
Figure 10. Terraced and/or contour farmed tracts from 2011 land use survey
Both contour farming and terracing is prevalent throughout the watersheds. As identified through the 2011 land use survey, approximately 4,231 acres (37%) has both terraces and contour farming, and only 470 acres (4%) is contoured farmed.

Badger Creek Lake Watershed Management Plan Page 19
4. Pollutant(s) and Impairment(s) Iowa’s Water Quality Standards classify all surface waters in Iowa as being protected for general uses. Waters can also be protected for other designated uses, including drinking water, recreation uses like swimming, and supporting fish and other aquatic life. Designated uses are protected by specific water quality criteria and the state’s anti-degradation policy, as described in the Iowa Water Quality Standards. 4.1 Designation The designated uses for Badger Creek Lake watershed are:
• Class A1 • Class B(LW) • Class HH
A1 = Waters in which recreational or other uses may result in prolonged and direct contact with the water, involving considerable risk of ingesting water in quantities sufficient to pose a health hazard. Such activities would include, but not be limited to, swimming, diving, water skiing, and water contact recreational canoeing. B(LW) = Artificial and natural impoundments with hydraulic retention times and other physical and chemical characteristics suitable to maintain a balanced community normally associated with lake-like conditions. HH = Waters in which fish are routinely harvested for human consumption or waters both designated as a drinking water supply and in which fish are routinely harvested for human consumption. *Definitions from Chapter 61 – Iowa Water Quality Standards 4.2 2010 305(b) Assessment for Badger Creek Lake SUMMARY: The Class A1 (primary contact recreation) uses are assessed (monitored) as “not supported” due to poor water transparency and algal blooms that violate the state’s narrative criteria protecting against aesthetically objectionable conditions. Violations of the state's water quality criterion for pH and the presence of nuisance aquatic life (cyanobacteria) also contribute to the impairment at this lake. The Class B(LW) (aquatic life) uses are assessed (monitored) as “partially supported” due to violations of the state's water quality criterion for pH. The results of a fish kill investigation in May 2007 and information from the IDNR Fisheries Bureau also suggest impairment of the aquatic life uses. Fish consumption uses remain assessed (evaluated) “fully supported.” Sources of data for this assessment include (1) results of the statewide survey of Iowa lakes conducted from 2004 through 2007 by Iowa State University (ISU), (2) results of the statewide ambient lake monitoring program conducted from 2005 through 2008 by University Hygienic Laboratory (UHL), (3) information from the IDNR Fisheries Bureau, (4) results of U.S. EPA/IDNR fish tissue monitoring in 1999, and (5) results of a fish kill investigation in May 2007. Note: A TMDL for siltation and nutrients at Badger Creek Lake was prepared by IDNR and approved by EPA in 2003. Because all Section 303(d) impairments identified for the 2010 assessment/listing cycle (algal growth [inlcuding nuisance growth of cyanobacteria] and pH) are addressed by the TMDL, this waterbody remains in IR Category 4a (TMDL approved).

Badger Creek Lake Watershed Management Plan Page 20
EXPLANATION: For the 2010 reporting cycle, the Class A1 (primary contact recreation) uses for Badger Creek Lake are assessed as “not supported” based on results from the ISU statewide survey of lakes and the UHL ambient lake monitoring program. Using the median values from these surveys from 2004 through 2008 (approximately 20 samples), Carlson’s (1977) trophic state indices for Secchi depth, chlorophyll a, and total phosphorus were 70, 75, and 79 respectively for Badger Creek Lake. According to Carlson (1977) the Secchi depth, chlorophyll a, and total phosphorus values all place Badger Creek Lake in the hypereutrophic category. These values suggest very high levels of chlorophyll a and suspended algae in the water, very poor water transparency, and extremely high levels of phosphorus in the water column. The levels of inorganic suspended solids at this lake were high and suggest that high levels of non-algal turbidity may contribute to the poor water clarity at this lake. The median level of inorganic suspended solids in Badger Creek Lake (7.0 mg/L) was the 35th highest median for all the 132 lakes sampled by ISU and UHL. Data from the 2004-2008 ISU and UHL surveys suggest a large population of cyanobacteria exists at Badger Creek Lake, which contributes to the impairment at this lake. These data show that cyanobacteria comprised 99% of the phytoplankton wet mass at this lake. The median cyanobacteria wet mass (63.0 mg/L) was also the 9th highest of the 132 lakes sampled. This median is in the worst 25% of the 132 lakes sampled. The presence of a large population of cyanobacteria at this lake suggests a potential violation of Iowa’s narrative water quality standard protecting against the occurrence of nuisance aquatic life. This assessment is based strictly on the distribution of the lake-specific median cyanobacteria values for the 2004-2008 period. Median levels greater than the 75th percentile of this distribution were arbitrarily considered to represent potential impairment. No other criteria exist, however, upon which to base a more accurate identification of impairments due to cyanobacteria. The assessment category for assessments based on level of cyanobacteria will be considered "evaluated" (indicating an assessment with relatively lower confidence) as opposed to "monitored" (indicating an assessment with relatively higher confidence) to account for this lower level of confidence. The Class B(LW) (aquatic life) uses for Badger Creek Lake are assessed (monitored) as “partially supported” based on information from the IDNR Fisheries Bureau, results of a fish kill investigation, and results from the ISU and UHL lake surveys. Information from the IDNR Fisheries Bureau suggests that algal blooms and water clarity remain problems at this lake that affect the both the quality of the fish population and the likelihood of anglers using the lake. In addition, sediment resuspension, a lack of aquatic vegetation, and shoreline erosion are also problems at this lake. The ISU and UHL lake surveys data from 2004-2008 show no violations of the Class B(LW) criterion for ammonia in 20 samples. The data show 3 violations of the Class B(LW) criterion for dissolved oxygen in 20 samples. Based on IDNR’s methodology these violations are not significantly greater than 10% of the samples and therefore do not suggest impairment of the Class B(LW) uses of Badger Creek Lake. The data also show 4 of 20 samples violated the Class A1,B(LW) criterion for pH (20%). These violations are not significantly greater than 10% of the samples and therefore does not suggest impairment of the Class A, and B(LW) uses of the lake. However, Badger Creek Lake was assessed as “partially supporting” in the 2008 assessment/listing cycle due to significant violations of the pH criteria and therefore remains “partially supported” due to the continued violations. Based on IDNR’s assessment methodology 2 consecutive assessment/listing cycles without significantly greater than 10% of the samples violating the criterion are necessary to propose delisting based on pH violations. These water quality violations, however, likely reflect the excessive primary productivity at Badger Creek Lake and do not reflect the input of pollutants to this lake.

Badger Creek Lake Watershed Management Plan Page 21
A fish kill that occurred in this lake on or before May 17, 2007 also suggests "impairment" of the Class B(LW) uses. The kill was identified as a natural kill related to spawning stress. Monitoring of the lake showed that the pH was high (9.2) and there was a large amount of brown algae in the lake. The total number of fish killed was estimated to be 1000. According to IDNR’s assessment/listing methodology, the occurrence of a single pollutant-caused fish kill, or a fish kill of unknown origin, on a waterbody or waterbody reach during the most recent assessment period (2006-2009) indicates a severe stress to the aquatic community and suggests that the aquatic life uses should be assessed as “impaired.” If a cause of the kill was not identified during the IDNR investigation, or if the kill was attributed to non-pollutant causes (e.g., winterkill), the assessment type will be considered “evaluated.” Such assessments, although suitable for Section 305(b) reporting, lack the degree of confidence to support addition to the state Section 303(d) list of impaired waters (IR Category 5). Waterbodies affected by such fish kills will be placed in IR subcategories 2b or 3b and will be added to the state list of waters in need of further investigation. Fish consumption uses are assessed (evaluated) as “fully supported” based on results of U.S.EPA/IDNR fish contaminant (RAFT) monitoring at Badger Creek Lake in 1999. The composite samples of fillets from channel catfish and black crappie had low levels of contaminants. Because these data are now considered too old (greater than five years) to accurately characterize current water quality conditions, the assessment category is considered “evaluated” (indicating an assessment with relatively lower confidence) as opposed to "monitored" (indicating an assessment with relatively higher confidence). The existence of, or potential for, a fish consumption advisory is the basis for Section 305(b) assessments of the degree to which Iowa’s lakes and rivers support their fish consumption uses. The fish contaminant data generated from the 1999 RAFT sampling conducted in this lake show that the levels of contaminants do not exceed any of the advisory trigger levels, thus suggesting no justification for issuance of a consumption advisory for this waterbody. 4.3 Badger Creek Lake TMDL The Federal Clean Water Act requires the Iowa Department of Natural Resources (IDNR) to develop a Water Quality Improvement Plan, also known as a Total Maximum Daily Load (TMDL) for waters that have been identified on the state’s 303(d) list as impaired by a pollutant (see Attachment A). Badger Creek Lake was added to the Section 303(d) list in 1998 by the Iowa Department of Natural Resources (IDNR) as partially supporting its aquatic life uses due to excessive siltation and organic enrichment impairments (nutrients). The purpose of the TMDL for Badger Creek Lake is to calculate the maximum allowable levels of siltation and nutrients that the lake can receive and still meet water quality standards. The altering of the physical and chemical characteristics caused by excess siltation and nutrients include the following impacts to the beneficial uses: 1) interference with reproduction and growth of fish and other aquatic life; 2) creating a light-limiting environment that interferes with establishment of aquatic vegetation; and, 3) excessive suspension of siltation and nutrient rich water create poor water quality that inhibits proper functioning of aquatic life. The primary impact of sediment at Badger Creek Lake is identified as interference with reproduction and growth of fish and other aquatic life. IDNR Fisheries biologists cited that siltation impacts aquatic life primarily in the upper portions of the lake. Although the entire lake was listed, it is the excessive sediment deposition in the upper arms of the lake that has lead to the lake being assessed as not meeting water quality standards. The upper arms of the lake are shallow and were ideal as an aquatic

Badger Creek Lake Watershed Management Plan Page 22
habitat. Those areas are now covered with fine silt that make successful spawning almost impossible. The deposition of sediment in these arms has severely limited the fishery in the entire lake. Excess nutrients are causing the lake to become hypereutrophic, which has resulted in occasional fishkills. Excess nutrients are causing large algae blooms in the lake. When the algae die off, oxygen in the lake is consumed causing low dissolved oxygen levels and resulting in fish kills. In-Lake Water Monitoring In-lake monitoring has been conducted at one site in Badger Creek Lake since 2000 to present, with an additional sampling period in 1990. IDNR, Iowa State University (ISU), and University Hygienic Lab (UHL) have all assisted with sample collection. To assess water quality in Badger Creek Lake the Carlson Trophic State Indices (TSI) was used as a quantitative index for a water quality. The TSI is a measure of trophic status of a body of water using several measures of water quality, including: turbidity (Secchi depth), chlorophyll-a (algal biomass), and total phosphorus levels. A TSI value above 70 indicates a very productive waterbody with hypereutrophic characteristics. Hypereutrophic lakes often exhibit low clarity, extensive weeds, and algal scum.
Parameter 2011 2010 2009 2007 2006 2005 2004 2003 2002 2001 2000
Lake Depth (m) 5.4 5.9 5.6 - - 6 6.1 6.1 6.5 5.4 6.1 Thermocline Depth (m) N/A N/A N/A N/A N/A N/A N/A N/A N/A N/A N/A Secchi Disk Depth (m) 0.5 0.5 0.7 - - 0.7 0.2 0.7 0.6 1.2 0.5 Dissolved Oxygen (mg/L) 8.3 11.5 6.7 - - 10.6 12.4 9.1 7 13 4.8 Specific Conductivity (μS/cm) 286.7 356.7 283.3 - - 269.5 242.7 284 326 249 286 Turbidity (NTU) 13 8.4 46.4 - - 36.4 90 54.5 31.7 33.4 26.2 Chlorophyll a (μg/L) 70.7 53.8 35.3 - - 159.3 80.2 23 62.3 67.2 34.5 Total Phosphorus as P (μg/L) 140.1 110.8 140.3 - - 262 292 353 290 210 280 SRP as P (μg/L) 20.8 19.2 26.7 - - 278.8 182.6 336 250 - - TKN (mg/L) 1 <0.5 - - - - - - - - - Total Nitrogen as N (mg/L) - - 2 - - 2.03 2.88 2.48 1.5 1.68 1.8 Nitrate + Nitrite as N (mg/L) 2 1 1 - - 0.72 1.22 0.71 0.15 0.21 0.19 pH 8.4 8.6 8.6 - - 9.1 9.2 9 8.5 8.4 7.4 Alkalinity as CaCO3 (mg/L) 126 125 127 - - 121 96 86 131 108 149 Silica as Si (mg/L) - - - - - 5.98 10.57 5.65 5.77 - - Dissolved Organic Carbon (mg/L) <7.6 <6.4 <6.2 - - 6.97 6.64 12 11.2 - - 10 6 28 - - 9 23 8 10 9 5 Volatile Suspended Solids (mg/L) <8 <9 <8 - - 22 28 21 10 9 5 Total Suspended Solids (mg/L) 18 14 35 - - 30 51 28 19 19 11 Carlson Trophic State Index (Secchi)* 70 70 65 - - 66 86 64 67 58 71 Carlson Trophic State Index (Chl a)* 72 70 66 - - 80 74 61 71 72 65 Carlson Trophic State Index (TP)* 75 72 75 - - 84 86 89 86 81 85

Badger Creek Lake Watershed Management Plan Page 23
Pollution Load Reduction and TMDL Targets In 2002, the Environmental Protection Agency (EPA) approved the TMDL for Badger Creek Lake. The TMDL set load allocations for sedimentation and total phosphorus. The TMDL determined that there are no point source discharges to Badger Creek Lake and therefore the entire sediment and total phosphorus load can be attributed to watershed (non-point source) and internal loading. Based on modeling completed for Badger Creek Lake, the TMDL estimated the current sediment delivery at 12,696 tons/year and the current phosphorus load at 25,229 lbs/year based on land use/ land cover in the watershed. Lake modeling was utilized to determine the Phase I loading capacity for siltation and nutrients to meet the TMDL targets. The targeted total sediment loading capacity for Badger Creek Lake is 3,809 tons per year. The nutrient target for Badger Creek Lake will be measured by a Carlson TSI for chlorophyll-a, total phosphorus, and transparency of 70 or below. To achieve the TSI value of 70 the phosphorus loading capacity needs to be reduced to 7,487
lbs/year.
However, based on an updated watershed assessment using additional techniques and data the current estimated sediment delivery to Badger Creek Lake is at 14,658 tons per year, and the current phosphorus delivery is at 19,055
pounds per year. The sediment loading was determined by GIS models using RUSLE equations. Additional sediment load was estimated to be coming from streambanks and gullies within the watershed. Phosphorus load was determined by the Iowa State-Wide Trace Element Soil Sampling Project (Rowden, 2010). This study found that there is an average of 1.3 pounds of total phosphorus in each ton of sediment. This number was used as an enrichment ratio to determine phosphorus loading to the lake.
Therefore, based on these current estimates a minimum of 10,849 tons per year of sediment and a minimum of 11,568
pounds per year of phosphorus shall be reduced to Badger Creek Lake.

Badger Creek Lake Watershed Management Plan Page 24
5. Pollutant Source Assessment A variety of assessments were completed to identify pollutant sources and determine priority areas for implementing best management practices. Over 16 total miles of streams entering Badger Creek Lake were assessed using the Rapid Assessment of Stream Conditions Along Length (RASCAL) tool. The RASCAL involves walking the length of the stream and collecting information onto a hand held GPS unit. Data collected identified particular trouble spots along the streams, including streambank erosion, classic gullies cutting back from the stream into adjacent fields, coverage of riparian buffers, livestock access, etc. In addition, a field level land use survey was conducted in 2011 for the Badger Creek Lake watershed in order to obtain land use and conservation practice data at the field level. The survey was performed primarily via visual reconnaissance, although local NRCS and other agency personal were consulted to obtain information on certain parts of the watershed. While there is certain level of subjectivity to this type of survey, especially when determining crop rotations and residue levels, this approach is the only way to collect this amount of detail at this time. 5.1 Sediment and Phosphorous Several sources of sediment delivered to Badger Creek Lake were identified and quantified during watershed assessments conducted in 2011. This includes classic gully erosion identified during stream assessments, ephemeral erosion from upland areas, sediment delivery from sheet and rill erosion, streambank erosion, and shoreline erosion. From these assessments, an estimated sediment delivery budget was calculated for the Badger Creek Lake watershed. Phosphorus load was determined by the Iowa State-Wide Trace Element Soil Sampling Project (Rowden, 2010). The sediment and phosphorous sources and relative contributions are provided in Table 8 and Figure 11. Table 8. Badger Creek Lake Sediment and Phosphorus Delivery, 2011. Sediment Source Estimate
(tons/year) Sediment Delivery
Rate (SDR) Total Sediment
Delivery (tons/year)
Phosphorous Delivery
(pounds/year) Sheet & Rill 50,766 25% 8,731.0 11,350.3 Classic Gully (knick points, head cuts, and sidewalls)
1,900.4 70% mod./90% severe
1,661.2 2159.5
Ephemeral Gully 1,683.1 70% 1,178.1 1531.5 Streambank Erosion 3,032.9 90% 2,729.6 3548.4 Shoreline Erosion 358.3 100% 358.3 465.4 Total Delivery 14,658.2 19055.1 Figure 11. Sediment loading.
Gully Erosion 11%
Ephemeral Gully Erosion
8% Sheet & Rill Erosion
60%
Streambank Erosion
19%
Shoreline 2% Gully Erosion
Ephemeral Gully Erosion
Sheet & Rill Erosion
Streambank Erosion
Shoreline

Badger Creek Lake Watershed Management Plan Page 25
Sheet and Rill Erosion Estimated sheet and rill erosion for the Badger Creek Lake watershed were created using the NRCS Revised Universal Soil Loss Equation (RUSLE). Local watershed personnel helped define C and P factor information for sediment loss classification. The sediment delivery or amount of sediment from sheet and rill erosion reaching Badger Creek Lake was calculated using NRCS methods. Results of the RUSLE and sediment delivery calculations are provided in Figures 12 and 13. The Iowa State-Wide Trace Element Soil Sampling Project (Rowden, 2010) calculated that there is an average of 1.3 pounds of total phosphorus (TP) in each ton of sediment delivered. Based on this factor resulted in a loading of 11,350 pounds per year of total phosphorus.
Figure 12. Estimated Sheet and Rill Erosion, 2011.

Badger Creek Lake Watershed Management Plan Page 26
Estimated sediment delivery was calculated taking into account conservation practices (sediment control structures and waterways) that have already been implemented.
Figure 13. Estimated Sediment Delivery, 2011.
Classic Gully Erosion Approximately 50 minor classified gullies, and 15 severe classified gullies cutting from watershed streams towards agricultural fields were identified during the RASCAL assessment. Most of the gullies were cutting into row cropped fields and pastures and are high priority soil loss areas for land owners to address. Recently obtained LiDAR data for the watershed was used in conjunction with the stream assessment. The LiDAR data has a resolution of 3 meters, and elevation is accurate to within 6 inches. Areas of concentrated flow were identified and measured to assist with sediment delivery calculations. See Figure 14 below for a map of the gully locations. Using the factor of 1.3 from the Iowa State-Wide Trace Element Soil Sampling Project to convert to pounds of phosphorus delivery, the phosphorus loading from classic gullies in the watershed is 2,159 pounds per year of TP loading.

Badger Creek Lake Watershed Management Plan Page 27
Figure 14. Gully assessment, 2011.
Figure 15. Example of gully erosion within Badger Creek watershed.

Badger Creek Lake Watershed Management Plan Page 28
Ephemeral Gully Erosion An NRCS endorsed formula for calculating ephemeral gully erosion was utilized to estimate the contribution from ephemeral gullies in the watershed. A total of 1,178 tons of sediment from ephemeral gullies is estimated to reach Badger Creek Lake annually. The calculation assumed 1 ton/acre/year of ephemeral gully erosion from un-terraced cropland and no waterways with 5% slopes or greater. Using the factor of 1.3 as described above to convert to pounds of phosphorus delivery, the phosphorus loading from ephemeral gullies in the watershed is 1,531 pounds per year of TP loading. Streambank Erosion From the 2011 RASCAL assessment, an estimated 992 tons/year erodes from the streambanks in the Badger Creek Lake watershed. Of that, 90% or 2,729.6 tons/year is estimated to reach Badger Creek Lake annually. This contribution of sediment is a large portion of all categories assessed within the watershed, and is often the most expensive to correct. Figure 16 shows locations and severity of streambank erosion. Erosion estimates were made by recording the visual estimate of erosion rate class (stable, minor, moderate, or severe), bank length, and bank height. The erosion rate class has a corresponding depth of soil loss in inches per year. This depth is then multiplied by the surface area of the bank (bank height x bank length) to get an overall volume of soil loss. The soil volume is then multiplied by the density of soil (assumed to be 85 lbs/ft3
).
Figure 16. Streambank assessment, 2011

Badger Creek Lake Watershed Management Plan Page 29
Figure 17. Example of streambank erosion within Badger Creek watershed.
Shoreline Erosion No shoreline assessment has been conducted for the Badger Creek Lake watershed. A few sample points were visually assessed in February 2012. Overall, the condition of the shoreline was in fair condition, with the majority of the erosion areas located on the eastern side of the lake. According to the 2002 TMDL, 1.5 miles of shoreline was identified as eroding. Using 2011 NAIP imagery to identify erosion areas via photo interpretation a total length of 5,620 feet was mapped. Average bank height is estimated at 3 feet, and the sediment delivery ratio is 100%.
Figure 18. Examples of shoreline erosion along Badger Creek Lake. For streambank and shoreline, the estimated conversion to pounds of phosphorus delivery using the factor of 1.3 as described above is 4,014 pounds per year of TP loading.

Badger Creek Lake Watershed Management Plan Page 30
6. Goals and Objectives
Goals and objectives and action plan This watershed management plan will be of little value to real water quality improvement unless watershed improvement activities and BMPs are implemented. This will require the active engagement of local stakeholders and the collaboration of state and federal agencies. In addition to the implementation of Best Management Practices (BMPs), continued monitoring is necessary. Monitoring is a crucial element to assess the attainment of water quality standards and designated uses, to determine if water quality is improving, degrading, or remaining unchanged, and to assess the effectiveness of implementation activities and the possible need for additional BMPs. This plan is intended to be used by local agencies, watershed managers, and citizens for decision-making support and planning purposes. The best management practices listed below represent a package of tools that will help achieve water quality goals if appropriately utilized. It is up to land owners, producers, and local conservation professionals to determine exactly how to best implement them. Locally-driven efforts have proven to be the most successful in obtaining real and significant water quality improvements. The last element of the planning process, which is the implementation of the plan, begins once the goals, objectives, and action statements have been identified. Plan implementation continues through adherence to the goals, objectives, and action statements set forth in this plan. However, it should be emphasized that these goals, objectives, and action statements are not “cast in concrete.” While the Watershed Advisory Committee has developed these goals, objectives, and action statements based on the best information available, and the needs/opportunities of the watershed at a point in time, changing needs and desires within the watershed or economy (or Farm Bill) may mean that these goals, objectives, and action statements will need to be re-evaluated. This plan must remain flexible enough to respond to changing needs and conditions, while still providing a strong guiding mechanism for future work.
Badger Creek Lake Watershed Goals and Objectives
Goal 1: Reduce non-point source pollution to at or below TMDL levels in the Badger Creek Lake watershed while maintaining agricultural productivity.
Objective 1: Reduce sediment delivery to Badger Creek Lake by 7,078 tons within 8 years, and an additional 3,805 tons by year 20 for a 10,883 ton per yearObjective 2: Reduce phosphorus delivery to Badger Creek Lake by
or 74% load reduction. 9,202 pounds within 8 years,
and an additional 4,945 pounds by year 20 for a 14,147 pounds per year
or 74% load reduction.
Task 1: Target restoration activities at eroding stream bank locations. Task 2: Target conservation practices on priority upland areas within the watershed. Task 3: Implement conservation practices on publically owned land within the watershed.

Badger Creek Lake Watershed Management Plan Page 31
Goal 2: Educate the public and partners of Badger Creek Lake the importance of lake/watershed improvement activities.
Objective 1: Encourage adoption of conservation practices. Objective 2: Promote and implement Badger Creek Lake Watershed Citizen Awareness Campaign. Objective 3: Provide awareness to watershed stakeholders and visitors of their role in protecting the water quality of Badger Creek Lake through posters, signage, web postings, mailings, and educational meetings.
Task 1: Utilize demonstrations, field days, outreach workshops, and one to one contacts. Task 2: Disseminate the results of activities online, through conventional media outlets, and watershed awareness days. Task 3: Conduct periodic follow-up surveys with landowner/producers; conduct surveys on 5-year watershed plan update cycle.
Goal 3: Monitor and evaluate sediment and phosphorus loading reductions to Badger Creek Lake.
Objective 1: Implement a water monitoring plan to measure water quality trends and to determine if progress is being made on water quality improvements. Objective 2: Analyze yearly water monitoring results to verify and identify ‘hotspots’ regarding local resource concerns. Objective 3: Utilize the Iowa Sediment Delivery Calculator to estimate sediment load reductions resulting from practice implementation and gauge progress towards reaching Goal 1.

Badger Creek Lake Watershed Management Plan Page 32
7. BMP Targets and Load Reduction Best management practices (BMPs) are part of the foundation for achieving water quality goals. BMPs include practices and programs that are designed to improve water quality and other identified resource concerns. BMPs may include changes in land management or land use, physical structures to mitigate against pollutant sources, or changes in human behavior or attitudes about the resources in the watershed and how they are perceived or valued. (From Watershed Management Action Plan – Iowa DNR, 2009). Efforts are made to encourage that BMPs are long-term (e.g. – re-enrollment of CRP acres) but this is often dependent upon land tenure, commodity prices, and other market trends that may potentially compete with conservation efforts. It is important to identify all BMPs needed to achieve the goals of the watershed project. From an initial list of potential practices, the number of practices was narrowed down to those that were the most acceptable to watershed stakeholders. When selecting and implementing BMPs it is important to identify if the practice is feasible in a given location (e.g. – are the site features suitable or does it match stakeholder values). It is also important to determine how effective the practice will be at achieving goals, objectives, and targets. Below are potential riparian and upland practices identified as possible implementation/program strategies within the Badger Creek Lake watershed:
• Nutrient management (rate, timing, placement, and form) • Residue & Tillage management; no-till/strip-till • Grassed waterways • Water and sediment control basins • Grade stabilization structures • Terraces • Pasture/grassland management; Prescribed grazing • Riparian buffers • Cover crops • Bio-reactor • Wetland restoration • Ponds • Fencing • Stream crossings • Streambank/shoreline protection
Load reductions are important to measure the success of watershed improvement efforts and track progress towards reaching TMDL recommendations. The following load reductions have been identified for the Badger Creek Lake watershed. Table 9 highlights specific conservation practices that will be used to meet load reduction goals.
Sediment: The current TMDL load capacity for allowable sediment delivery to Badger Creek Lake is 3,809 tons per year. Based on current watershed assessments, gully erosion, and upland sediment delivery the total estimated sediment delivery to Badger Creek Lake is 14,658 tons per year. This watershed management plan outlines a 10,849 ton reduction (74%) over a 20-year timeframe.

Badger Creek Lake Watershed Management Plan Page 33
Phosphorus: The current TMDL load capacity for allowable phosphorus delivery to Badger Creek Lake is 7,487 pounds per year. Using the Iowa State-Wide Trace Element Soil Sampling Project it is calculated that there is an average of 1.3 pounds of total phosphorus (TP) in each ton of sediment delivered. Calculating by this factor resulted in a loading of 19,055 pounds per year of total phosphorus. This watershed management plan outlines an 11,568
pound reduction (61%) over a 20-year timeframe.

Badger Creek Lake Watershed Management Plan Page 34
Potential riparian and upland practices identified as possible implementation/program strategies within Badger Creek Lake Watershed: Table 9. Summary of Best Management Practices.
Upland Practices Targeted
Areas Erosion
Target Type Treatment
Type
Overall Goal (Acres/
Practices)
Sediment Reduction Efficiency
Phosphorus Reduction Efficiency
Erosion Reduction
(t/y)
SD Reduction
(t/y)
P Reduction
(lbs)
Cover Crops Cropland 1 Sheet & Rill Erosion
Source Control 400 50% 50% 687.00 171.75 223.28
Grassed Waterways Cropland Ephemeral Gullies
Source Control 75 30% - 154.58 108.20 140.66
Bioreactor Cropland Sheet & Rill Erosion Trap 1(#) - - - - -
Grade Stabilization Structures
Cropland/ Park Gully Erosion Trap 9(#) - 459 90% 90% 2,838.00 1,986.60 2,582.58
Water and Sediment Control Basins Cropland Sheet & Rill
Erosion Trap 20(#) - 1,224 ac 90% 90% 7,567.99 1,892.00 2,459.60
Nutrient Management Cropland NA Source
Control 5,500 - - - - -
Terraces Cropland 3 Sheet & Rill Erosion Trap 200,000 (ft) -
2,443 ac 90% 50% 5,082.75 1,270.69 1,651.90
Prescribed Grazing Pasture Sheet & Rill Erosion
Source Control 90 25% 25% 17.55 4.39 5.70
Residue & Tillage Management(No Till/Strip Till)
Cropland 2
Sheet & Rill Erosion
Source Control 4,000 50% 50% 13,740.00 3,435.00 4,465.50
Riparian, In-Stream, Edge of Field Practices Pasture/Grassland Management Pasture Streambank
Erosion Source Control 200 50% 50% 78.00 19.50 25.35
Riparian Buffers Cropland Sheet & Rill Erosion Trap 50 45% 45% 154.58 38.64 50.24
Wetland Restoration All Sources All Sources Trap 2(#) - 5,225 ac 20% 20% 5,291.27 1,322.82 1,719.66
Streambank Protection Streambank
Streambank/ Shoreline Erosion
Source Control 3,800 (ft) 90% 90% 350.00 315.00 409.50
Shoreline Protection Shoreline Shoreline Erosion
Source Control 5,000 (ft) 100% 100% 318.00 318.00 413.40
TOTAL
10,882.59
14,147.36

Badger Creek Lake Watershed Management Plan Page 35
1 Cover crops modeled with tillage management 2 Tillage management modeled with wetland restoration 3 Terraces modeled with wetland restoration 4
Sediment load reductions were calculated using IDNR and NRCS methods for soil loss and sediment delivery. The RUSLE model was used to estimate load reductions resulting from in-field practices, the NRCS sediment delivery method was used to calculate reductions from trapping practices, and the NRCS Direct-Volume method was used to calculate reductions from in-stream and lakeshore practices.
The Iowa State-Wide Trace Element Soil Sampling Project: Design and Implementation. Iowa DNR, June 2010. References:
Erosion and Sediment Delivery. NRCS, March 1998. Assessments of Practices to Reduce Nitrogen and Phosphorus Nonpoint Source Pollution of Iowa’s Surface Waters. USDA-ARS (2004).

Badger Creek Lake Watershed Management Plan Page 36
Figure 19. Ideal BMP placement scenario. Targeted areas were identified based on location within the watershed, proximity to the stream, current land use assessment activities, and discussion with Iowa DNR on public areas. Grade stabilization structures, filter strips, streambank stabilization, and other practices were identified and targeted during field assessment activities.

Badger Creek Lake Watershed Management Plan Page 37
Figure 20. Ideal BMP placement scenario – constructed and unconstructed terraces.
Figure 20 identifies the current location of terraces within the watershed, plus the targeted locations of unconstructed terrace catchment areas.

Badger Creek Lake Watershed Management Plan Page 38
8. Water Quality Monitoring Plan Water monitoring is an important tool to assess progress in any watershed improvement project. This section describes recommendations/needs for future monitoring actions for documenting water quality improvements from watershed plan implementation. Site locations In-Lake: One site will be monitored in-lake; BC1 (IDNR ambient water monitoring site). Figure 21 shows this location. BC1 will be monitored by Iowa State University 3 times per year by the DNR’s ambient lake monitoring program. Additional IOWATER monitoring locations are also included. The IOWATER sites are sampled on an as-scheduled basis.
Figure 21. Monitoring locations

Badger Creek Lake Watershed Management Plan Page 39
Tributary: Eight stream and tributary sites have been identified to potentially be monitored depending on available funding; BC1 through BC9 (see map above). Frequency In-Lake: Monthly (April – October) Tributary: Twice per month (April – October) and grab samples during a maximum of 5 storms events during the sampling season. Parameters In-Lake: Total suspended solids, total fixed suspended solids, total phosphate, orthophosphate, Secchi depth (field), dissolved oxygen (field), temperature (field), pH (field), and turbidity (field). Tributary: Total suspended solids, total , total phosphate, orthophosphate, dissolved oxygen (field), temperature (field), pH (field), and turbidity (field). Lab Analysis Budget (one sampling season using 2011 dollars) In-Lake: Table 10. In-lake monitoring. Parameter Cost per Sample # of Sites # of Samples Total Cost Total Suspended Solids $13 1 7 $91
Total Fixed Suspended Solids $26 1 7 $182
Total Phosphate Orthophosphate $26 1 7 $182
Shipping Estimate $100 Total $555 Table 11. Tributary monitoring. Parameter Cost per Sample # of Sites # of Samples* Total Cost Total Suspended Solids
$13 8 19 $1,976
Total Phosphate Orthophosphate
$26 8 19 $3,952
Shipping Estimate $300 Total $6,228 *Assumes 5 storm events are collected.

Badger Creek Lake Watershed Management Plan Page 40
9. Phased Implementation Schedule, Load Reductions and Milestones Below is a phased approach for implementing the Badger Creek Lake watershed management plan. This implementation schedule is intended to serve as a reference tool to recognize tasks that are scheduled for the upcoming year, and to help focus the necessary resources for the current phase of the project. The implementation schedule should be adaptable and updated on regular basis due to shifting priorities, new opportunities, and expected delays. Table 12. Implementation schedule.
Goal 1
Reduce non-point source pollution to at or below TMDL levels in the Badger Creek
Lake watershed while maintaining agricultural
productivity.
Phase 1 Phase 2 Phase 3 Phases 4 & 5
Years 1-4 Years 5-8 Years 9-12 Years 13-20
Obj. 1&2
Reduce sediment and phosphorus delivery to the lake.
Units (Acres/
Practice)
SD Reduction
(tons)
P Reduction
(lbs)
Units (Acres/
Practice)
SD Reduction
(tons)
P Reduction
(lbs)
Units (Acres/
Practice)
SD Reduction
(tons)
P Reduction
(lbs)
Units (Acres/
Practice)
SD Reduction
(tons)
P Reduction
(lbs)
Cover Crops (340) 100 42.9 55.8 100 42.9 55.8 100 42.9 55.8 100 42.9 55.8
Grassed Waterways (412) 30 43.3 56.3 30 43.3 56.3 15 21.6 28.1 --
Grade Stabilization Structures (410) 6(#) 1,324.4 1,721.72 3(#) 662.2 860.86 -- --
Water and Sediment Control Basins (638) 10(#) 946 1,229.80 5(#) 473 614.9 5(#) 473 614.9 --
Nutrient Management (590) 2,000 0 0 1,500 0 0 1,000 0 0 1,000 0 0
Bioreactor (747) 1(#) 0 0 -- -- --

Badger Creek Lake Watershed Management Plan Page 41
Terraces (600) 70,000
(ft.) 444.7 578.2 50,000 (ft.) 317.7 413.0 40,000
(ft.) 254.1 330.4 40,000 (ft.) 254.1 330.4
Prescribed Grazing (528) 35 1.70 2.21 35 1.70 2.21 10 .5 .63 10 .5 .63
Residue & Tillage Management(No Till/Strip Till) (329)
1,600 1,374 1,786.2 1,200 1,030.5 1,339.7 600 515.3 669.8 600 515.3 669.8
Pasture/Grassland Management 512) 80 7.8 10.1 60 5.9 7.6 40 3.9 5.1 20 2.0 2.5
Riparian Buffers (393) 20 15.5 20.1 10 7.7 10.0 10 7.7 10.0 10 7.7 10.0
Wetland Restoration -- -- 1(#) 1,183.6 1,538.6 1(#) 139.2 181.0
Streambank Protection 1,000 (ft) 82.9 107.8 1,000 (ft) 82.9 107.8 1,000 (ft) 82.9 107.8 800 (ft) 66.3 86.2
Shoreline Protection 1,000 (ft) 63.6 82.7 1,000 (ft) 63.6 82.7 1,500 (ft) 95.4 124.0 1,500 (ft) 95.4 124.0
TOTAL Reduction 4,346.8 5,650.9 2,731.4 3,550.9 2,680.9 3,485.1 1,123.4 1,460.3
Goal 2
Educate the public and partners of Badger Creek Lake the importance of lake/watershed improvement activities.
Phase 1 (Years 1-4)
Phase 2 (Years 5-8)
Phase 3 (Years 9-12)
Phases 4 & 5 (Years 13-20)
Unit (yr) Unit (yr) Unit (yr) Unit (yr)
Obj. 1 Encourage adoption of conservation practices
Continuous; Implement Outreach/ Education plan (yearly)
Continuous; Implement Outreach/ Education plan (yearly)
Continuous; Implement Outreach/ Education plan (yearly)
Continuous; Implement Outreach/ Education plan (yearly)
Obj. 2
Promote& implement Badger Creek Lake Watershed Citizen Awareness Campaign.
Continuous; Implement Outreach/ Education plan (yearly)
Continuous; Implement Outreach/ Education plan (yearly)
Continuous; Implement Outreach/ Education plan (yearly)
Continuous; Implement Outreach/ Education plan (yearly)
Obj. 3
Provide awareness to watershed stakeholders; education & outreach
Continuous; Conduct landowner/ producer follow-up survey with
plan update (every 5 years)
Continuous; Conduct landowner/ producer follow-up survey with
plan update (every 5 years)
Continuous; Conduct landowner/ producer follow-up survey with
plan update (every 5 years)
Continuous; Conduct landowner/ producer follow-up survey with
plan update (every 5 years)

Badger Creek Lake Watershed Management Plan Page 42
Goal 3
Monitor and evaluate sediment and phosphorus loading reductions to Badger Creek Lake.
Phase 1
Phase 2
Phase 3
Phases 4 & 5
Obj. 1
Implement a water monitoring plan to measure water quality trends and to determine if progress is being made on water quality improvements
Continuous Continuous Continuous Continuous

Badger Creek Lake Watershed Management Plan Page 43
Water Quality Milestones The watershed management plan has been written to cover a 20-year timeframe, and is broken down into five phases. The in-lake water quality improvements for each phase are shown in Table 13, and can be used to track progress towards reaching the overall project goals. The water quality milestones are specifically for total phosphorus and related TSI improvements. As phosphorus primarily moves with sediment delivery, it is assumed that phosphorus reduction would be the result of a reduction of sediment also. The anticipated reductions are equally spaced across each phase, however, specific implementation of practices may occur during different phases of the watershed plan timeframe. A higher proportion of identified practices will be targeted for implementation in Phases 1 and 2. Estimated reductions in Phase 1 will overlap with estimated reductions in Phase 2 as identified in Table 13.
Table 13. Milestones - sediment and phosphorus load reductions and resulting in-lake improvements.
Badger Creek Lake P-load Reduction Scenarios
Scenario TP Load
TSI Chl-a TSI Phosphorus TSI Secchi Overall TSI (lb/year)
2011 RUSLE 19055 64.74 78.80 65.85 69.80
Phase 1 Reduction
Phase 2 Reduction
17055 64.60 77.92 65.70 69.41
15055 64.43 76.92 65.52 68.95
13055 64.21 75.75 65.29 68.42
Phase 3 Reduction 11055 63.92 74.37 64.99 67.76
Phase 4 Reduction 9055 63.53 72.67 64.59 66.93
Phase 5 Reduction 7055 62.95 70.48 64.01 65.81
TMDL Target 7353 63.05 70.85 64.11 66.00

Badger Creek Lake Watershed Management Plan Page 44
10. Public Outreach/Education Results from past research indicate the producers’ actual behavior patterns must be brought into the design of both best management practices and implementation strategies for water quality programs. (Dinnes, 2002). To effect changes in behavior there must be strategies in place to direct education and outreach to the target audience. Many obstacles to the adoption of conservation practices may be overcome by providing adequate education, outreach, and awareness of how land management practices influence non-point source losses to surface water resources. Knowledge becomes awareness, which may then motivate changes in behavior. As with any watershed project, an education, communication, and outreach program will need to be designed to teach producers and other stakeholders about the resource issues facing Badger Creek Lake. The outcome of this education and outreach is to bring attention to what impact their land use and management decisions might be, how they can effectively address those impacts, and what opportunities and innovative solutions exist. In December, 2011 the Badger Creek Lake Watershed Citizen Awareness Campaign was completed by Iowa State University-Extension, with assistance provided by the Madison Soil and Water Conservation District, Iowa Department of Natural Resources, and Iowa Learn Farms. The goal of the watershed campaign is to inform residents about the importance of water quality within the watershed and the lake, and provide outreach methods to strengthen the watershed community, and improve the water quality in Badger Creek Lake. Part of the campaign included a survey mailed to all watershed residents. The survey was developed to provide an assessment of the community understanding of the watershed. This assessment will help local watershed groups develop effective outreach and education regarding water quality challenges based on the values of the watershed residents. The following plan will guide public outreach activities in the Badger Creek Lake watershed. See Attachment A for the full copy of the Badger Creek Lake Watershed Citizen Awareness Campaign.
1. Plan Goals
o Reduce non-point source pollution to at or below TMDL levels in the Badger Creek Lake watershed while maintaining agricultural productivity.
o Educate the public and partners of Badger Creek Lake the importance of lake/watershed improvement activities. Monitor and evaluate sediment and phosphorus loading reductions to Badger Creek Lake.
2. Target Audiences Who will be needed in order to make changes to the land and water?
• Landowners (Agricultural) • Tenants (Agricultural) • Rural residents • Managers of publically owned land • Iowa NRCS • Iowa Department of Natural Resources

Badger Creek Lake Watershed Management Plan Page 45
Who will be depended upon to advance this project? • Madison County Soil and Water Conservation District • Madison County Conservation Board • Madison County Board of Supervisors • Iowa Department of Ag and Land Stewardship • Iowa Department of Natural Resources • Iowa NRCS
Who will be needed to communicate plan goals to these people?
• Project partners, community leaders, and stakeholders o SWCD Commissioners o Madison County Supervisors o NRCS, County Conservation, and other agency personnel o Key landowners and agricultural producers o Iowa Department of Ag and Land Stewardship o Iowa Department of Natural Resources o Farm Service Agency (FSA)
• Local agriculture and outdoor groups o Pheasants Forever o Ducks Unlimited o 4-H o FFA o Farm Bureau o Local sportsmen’s clubs
• Newspapers o Winterset Madisonian o Dallas County News and Roundup o Des Moines Register
• Radio o KJJY 92.5 FM o KIOA 93.3 FM o KHKI 97.3 FM o KWMT 540 AM o WHO 1040 AM
3. Target Audience Outreach Strategy
The following section outlines assumptions regarding target audiences developed during public outreach efforts and input received from watershed stakeholders related to the development of this plan. This does not represent extensive research of the target audience however.
Agricultural landowners/operators/other stakeholders Potential Barriers to Participation
• Possible reduction in productive agricultural land • Loss of rental income from placing productive ground into conservation • Cost of installing and maintaining practices • Perception of yield loss when adopting new practices; producer takes on the risk

Badger Creek Lake Watershed Management Plan Page 46
• Reluctant to change current practice implementation • Concern of working with government employees and programs • Those in targeted areas not participating in conservation programs • Increasing commodity prices driving decisions • Absentee land owner contact and education/outreach efforts
• Increase cost share rates for targeted conservation practices; identify additional funding assistance programs to help offset costs.
Potential Solutions, Motivators, Incentives or Benefits to Encourage Participation
• Educate landowners/producers on how best to minimize loss (e.g. – nutrient management strategies, tillage practices) while still maintaining yields.
• Increase one-to-one meetings with landowners/producers to discuss environmental and conservation issues and best management practices to address concerns.
• Utilize baseline line data gathered during the watershed planning process to target areas for appropriate land use and agriculture/conservation practices
• Utilize field days, demonstrations, and public meetings to encourage adoption of practices; enlist the support of “farmer leaders” in the watershed that are utilizing targeted conservation practices.
4. Use Research to Develop Outreach Strategy
With knowledge of potential barriers and motivators, education and outreach efforts can be developed around the target audiences’ accepted means of receiving information and watershed management education. This includes demonstrations, field days, outreach workshops, one to one contacts, outdoor classrooms for school children, adult educational activities, and traditional media outlets.
Potential outreach strategies
• Utilize marketing strategies as identified in the Badger Creek Lake Watershed Citizen Awareness Campaign (December 2011). See Attachment A.
• Develop a Watershed Advisory Committee to assist in plan implementation, outreach, and education efforts.
• Branding elements should be created to support a watershed awareness campaign. Two example logos have been developed.
• Utilize several different marketing media to align with interests of watershed stakeholders. These include:
o Support resources – Develop a brochure summarizing the Badger Creek Lake Watershed project for use with the general public.
o Website - Utilize internet resources to advance watershed plan implementation efforts; utilize internet for education and outreach efforts.
o Fact sheets and direct mailings – material should contain information on the project, challenges, proposed solutions, and progress updates. See Awareness Campaign for suggested topics for quarterly fact sheets.
• Develop watershed signage to promote activities in the watershed. o Watershed boundary signs - utilize signs to introduce the concept of
watersheds and create visibility about the Badger Creek Lake Watershed project.

Badger Creek Lake Watershed Management Plan Page 47
o Yard signs – utilize signs to promote and recognize conservation practices that have been implemented by landowners.
• Utilize producers and other landowners in the watershed that have implemented target practices to encourage adoption of others in the watershed. These might include:
o Area churches and service groups o Community events and field days o Youth outdoor classrooms
• Hold additional public meetings to educate stakeholders on status of watershed impairment and implementation efforts identified in the watershed management plan.
• Identify/develop/seek to secure funding sources to offset the cost of installation practices.
• Identify opportunities to have direct exposure to members of the target audiences and/or one to one conversations with individuals to educate them on the watershed project, targeted areas of concern, cost share options, and other related activities.
• Develop an annual outreach plan/schedule that coordinates with key seasons/dates (e.g. – spring planting season) to ensure messages and activities are received by the correct audience. Outreach plan time frame (as identified in the Awareness Campaign) First Quarter Activities • Create website
• Finalize logo design • General project information brochure • Introduce photography contest • Utility bill/church bulletin fact sheet #1
Spring/Summer Quarter Activities
• Kick-off event for residents (community picnic) • Local IOWATER introductory workshop • Watershed boundary signs • Sequential roadside signs • Utility bill/church bulletin fact sheet #2
Summer Quarter Activities
• Iowa Learning Farms field day • Yard signs • Utility bill/church bulletin fact sheet #3 • 5/10K fun run at the lake
Fall/Winter Quarter Activities
• Yard signs • Utility bill/church bulletin fact sheet #4 • Youth outdoor classroom (Oct) • Closing event for residents

Badger Creek Lake Watershed Management Plan Page 48
5. Evaluation and Measurement of Effectiveness Annually, the Outreach/Education plan should be reviewed and evaluated to determine if specific activities listed above are being accomplished.
• Meeting attendance and participation (e.g. – Advisory committee, public meetings, other)
• Number of landowners/producers involved in project • Attendance at field days, demonstration days, community-based outreach activities,
other. • Periodic surveys with landowners/producers; conduct on 5-year watershed plan update
cycle. • Follow-up with directs mailings; phone calls; one on one interviews. • Copies of news articles published; internet content updated; dates/times of radio and
television spots. • Park and lake usage. • Evaluation of practice implementation; water quality monitoring information. • Surveys completed by participants after community-based outreach activities.
As discussed above, the Badger Creek Lake Watershed Awareness Campaign, included a survey that was mailed in June 2011 to all residents within the watershed. A total of 356 surveys were mailed, with 117 completed and returned. The survey was conducted in collaboration between Iowa State University Extension and the Badger Creek Lake watershed project. The survey included general questions on the respondents knowledge of watershed issues, and issues specific to the Badger Creek Lake watershed. Of the returned surveys, results indicated that watershed residents perceive the agriculture crop production (70%), streambank erosion (48%), and livestock (35%) are some of the major causes to the water quality issues in Badger Creek Lake. The survey also asked respondents questions on what types of marketing media they would utilize and where they get their information from. Results from the survey will be incorporated into the education and outreach efforts for the watershed.

Badger Creek Lake Watershed Management Plan Page 49
11. Resource Needs Below are costs associated with implementation, and based on current estimates and the amount of BMPs identified above. Potential funding sources are listed with each task along with a total cost estimate. This funding matrix predicts a need for funding from multiple sources to reach the identified goals, objectives, and milestones. Table 14. Resource needs.
Component
Possible Funding
Source(s)* Phase 1
Years 1-4 Phase 2
Years 5-8 Phase 3
Years 9-12 Phases 4&5 Years 13-20
Total
Cover Crops (340) EQIP, 319 $8,000 $8,000 $8,000 $8,000 $32,000
Grassed Waterways (412) EQIP, CRP $96,000 $96,000 $48,000 -- $240,000
Grade Stabilization Structures (410)
EQIP, POL, WPF, WSPF $150,000 $75,000 -- -- $225,000
Water and Sediment Control Basins (638)
EQIP, POL, WPF, SPF $35,000 $17,500 $17,500 -- $70,000
Nutrient Management (590) EQIP $44,000 $33,000 $22,000 $22,000 $121,000
Bioreactor (747) EQIP $9,000 -- -- -- $9,000
Terraces (600) EQIP, 319 $375,900 $268,500 $214,800 $214,800 $1,074,000
Prescribed Grazing (528) EQIP, 319 $2,975 $2,975 $850 $850 $7,650
Residue & Tillage Management(No Till/Strip Till) (329)
EQIP, 319 $120,000 $90,000 $45,000 $45,000 $300,000
Pasture/Grassland Management (512) EQIP, 319 $7,840 $5,880 $3,920 $1,960 $19,600
Riparian Buffers (393) EQIP, 319 $8,100 $4,050 $4,050 $4,050 $20,250
Wetland Restoration (657/658)
EQIP, 319, other -- -- $61,360 $14,560 $75,920
Streambank/Shoreline Protection
319, WPF, POL $300,000 $300,000 $375,000 $345,000 $1,320,000
Salary and Benefits 319, WSPF $250,000 $295,000 $345,000 $806,000 $1,696,000 Travel & Training $2,000 $2,000 $2,000 $4,000 $10,000
Education and Outreach 319 $6,000 $6,000 $6,000 $12,000 $30,000
Equipment & Supplies Included Included Included Included
Water Monitoring DNR $27,132 $27,132 $27,132 $54,264 $135,660
Total $1,441,947 $1,231,037 $1,180,612 $1,532,484 $5,386,080

Badger Creek Lake Watershed Management Plan Page 50
Appendices

Badger Creek Lake Watershed Management Plan Page 51
Appendix A --- Glossary of Terms and Acronyms 303(d) list: Refers to section 303(d) of the Federal Clean Water Act, which requires
a listing of all public surface water bodies (creeks, rivers, wetlands, and lakes) that do not support their general and/or designated uses. Also called the state’s “Impaired Waters List.”
305(b) assessment: Refers to section 305(b) of the Federal Clean Water Act, it is a
comprehensive assessment of the state’s public water bodies ability to support their general and designated uses. Those bodies of water which are found to be not supporting or just partially supporting their uses are placed on the 303(d) list.
319: Refers to Section 319 of the Federal Clean Water Act, the Nonpoint
Source Management Program. Under this amendment, States receive grant money from EPA to provide technical & financial assistance, education, & monitoring to implement local nonpoint source water quality projects.
AFO: Animal Feeding Operation. A livestock operation, either open or confined, where animals are kept in small areas (unlike pastures) allowing manure and feed become concentrated.
Base flow: The fraction of discharge (flow) in a river which comes from ground
water. BMIBI: Benthic Macroinvertebrate Index of Biotic Integrity. An index-based
scoring method for assessing the biological health of streams and rivers (scale of 0-100) based on characteristics of bottom-dwelling invertebrates.
BMP: Best Management Practice. A general term for any structural or
upland soil or water conservation practice. For example terraces, grass waterways, sediment retention ponds, reduced tillage systems, etc.
CAFO: Confinement Animal Feeding Operation. An animal feeding operation
in which livestock are confined and totally covered by a roof, and not allowed to discharge manure to a water of the state.
Credible data law: Refers to 455B.193 of the Iowa Administrative Code, which ensures
that water quality data used for all purposes of the Federal Clean Water Act are sufficiently up-to-date and accurate.
Cyanobacteria (blue-green algae):
Members of the phytoplankton community that are not true algae but can photosynthesize. Some species can be toxic to humans and pets.
Designated use(s): Refer to the type of economic, social, or ecologic activities that a
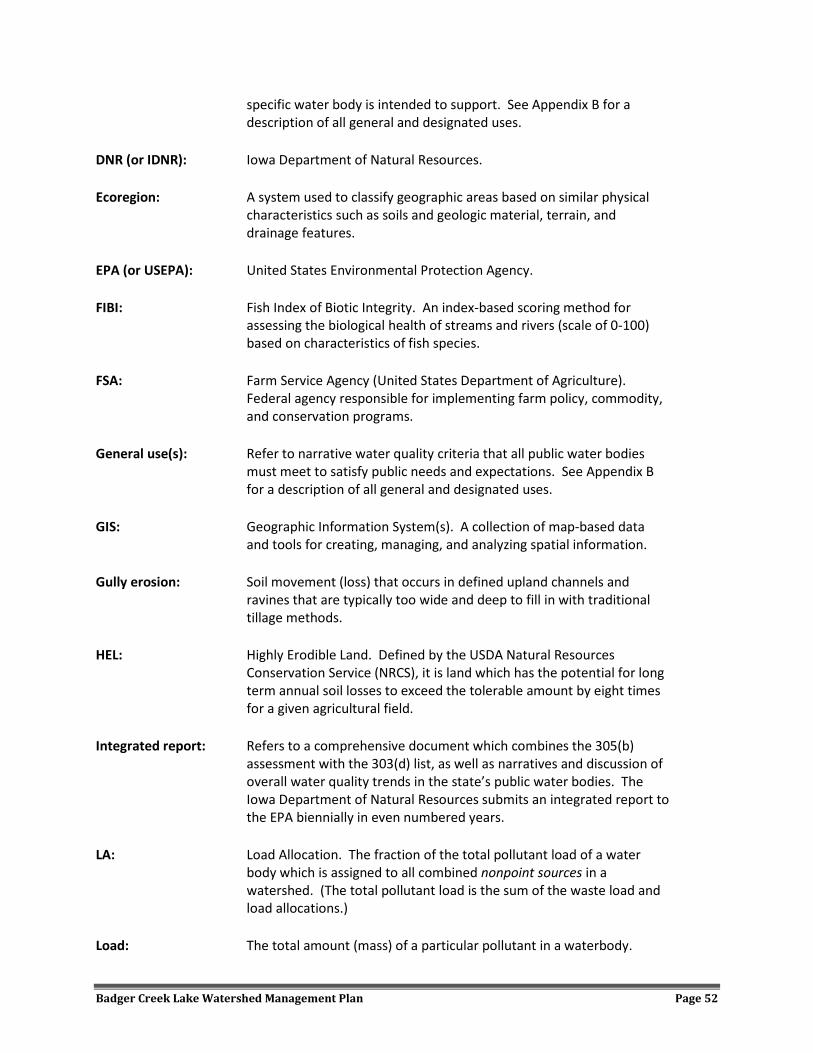
Badger Creek Lake Watershed Management Plan Page 52
specific water body is intended to support. See Appendix B for a description of all general and designated uses.
DNR (or IDNR): Iowa Department of Natural Resources. Ecoregion: A system used to classify geographic areas based on similar physical
characteristics such as soils and geologic material, terrain, and drainage features.
EPA (or USEPA): United States Environmental Protection Agency. FIBI: Fish Index of Biotic Integrity. An index-based scoring method for
assessing the biological health of streams and rivers (scale of 0-100) based on characteristics of fish species.
FSA: Farm Service Agency (United States Department of Agriculture).
Federal agency responsible for implementing farm policy, commodity, and conservation programs.
General use(s): Refer to narrative water quality criteria that all public water bodies
must meet to satisfy public needs and expectations. See Appendix B for a description of all general and designated uses.
GIS: Geographic Information System(s). A collection of map-based data
and tools for creating, managing, and analyzing spatial information. Gully erosion: Soil movement (loss) that occurs in defined upland channels and
ravines that are typically too wide and deep to fill in with traditional tillage methods.
HEL: Highly Erodible Land. Defined by the USDA Natural Resources
Conservation Service (NRCS), it is land which has the potential for long term annual soil losses to exceed the tolerable amount by eight times for a given agricultural field.
Integrated report: Refers to a comprehensive document which combines the 305(b)
assessment with the 303(d) list, as well as narratives and discussion of overall water quality trends in the state’s public water bodies. The Iowa Department of Natural Resources submits an integrated report to the EPA biennially in even numbered years.
LA: Load Allocation. The fraction of the total pollutant load of a water
body which is assigned to all combined nonpoint sources in a watershed. (The total pollutant load is the sum of the waste load and load allocations.)
Load: The total amount (mass) of a particular pollutant in a waterbody.

Badger Creek Lake Watershed Management Plan Page 53
MOS: Margin of Safety. In a total maximum daily load (TMDL) report, it is a
set-aside amount of a pollutant load to allow for any uncertainties in the data or modeling.
MS4 Permit: Municipal Separate Storm Sewer System Permit. An NPDES license
required for some cities and universities which obligates them to ensure adequate water quality and monitoring of runoff from urban storm water and construction sites, as well as public participation and outreach.
Nonpoint source pollution:
A collective term for contaminants which originate from a diffuse source.
NPDES: National Pollution Discharge Elimination System, which allows a facility
(e.g. an industry, or a wastewater treatment plant) to discharge to a water of the United States under regulated conditions.
NRCS: Natural Resources Conservation Service (United States Department of
Agriculture). Federal agency which provides technical assistance for the conservation and enhancement of natural resources.
Periphyton: Algae that are attached to substrates (rocks, sediment, wood, and
other living organisms). Phytoplankton: Collective term for all self-feeding (photosynthetic) organisms which
provide the basis for the aquatic food chain. Includes many types of algae and cyanobacteria.
Point source pollution:
A collective term for contaminants which originate from a specific point, such as an outfall pipe. Point sources are generally regulated by an NPDES permit.
PPB: Parts per Billion. A measure of concentration which is the same as
micrograms per liter (µg/l). PPM: Parts per Million. A measure of concentration which is the same as
milligrams per liter (mg/l). Riparian: Refers to site conditions that occur near water, including specific
physical, chemical, and biological characteristics that differ from upland (dry) sites.
RUSLE: Revised Universal Soil Loss Equation. An empirical model for
estimating long term, average annual soil losses due to sheet and rill erosion.

Badger Creek Lake Watershed Management Plan Page 54
Secchi disk: A device used to measure transparency in water bodies. The greater
the secchi depth (measured in meters), the more transparent the water.
Sediment delivery ratio:
A value, expressed as a percent, which is used to describe the fraction of gross soil erosion which actually reaches a water body of concern.
Seston: All particulate matter (organic and inorganic) in the water column. Sheet & rill erosion Soil loss which occurs diffusely over large, generally flat areas of land. SI: Stressor Identification. A process by which the specific cause(s) of a
biological impairment to a water body can be determined from cause-and-effect relationships.
Storm flow (or stormwater):
The fraction of discharge (flow) in a river which arrived as surface runoff directly caused by a precipitation event. Storm water generally refers to runoff which is routed through some artificial channel or structure, often in urban areas.
STP: Sewage Treatment Plant. General term for a facility that processes
municipal sewage into effluent suitable for release to public waters. SWCD: Soil and Water Conservation District. Agency which provides local
assistance for soil conservation and water quality project implementation, with support from the Iowa Department of Agriculture and Land Stewardship.
TMDL: Total Maximum Daily Load. As required by the Federal Clean Water
Act, a comprehensive analysis and quantification of the maximum amount of a particular pollutant that a water body can tolerate while still meeting its general and designated uses.
TSI (or Carlson’s TSI): Trophic State Index. A standardized scoring system (scale of 0-100)
used to characterize the amount of algal biomass in a lake or wetland. TSS: Total Suspended Solids. The quantitative measure of seston, all
materials, organic and inorganic, which are held in the water column. Turbidity: The degree of cloudiness or murkiness of water caused by suspended
particles. UAA: Use Attainability Analysis. A protocol used to determine which (if any)
designated uses apply to a particular water body. (See Appendix B for a description of all general and designated uses.)

Badger Creek Lake Watershed Management Plan Page 55
UHL: University Hygienic Laboratory (University of Iowa). Provides physical,
biological, and chemical sampling for water quality purposes in support of beach monitoring and impaired water assessments.
USGS: United States Geologic Survey (United States Department of the
Interior). Federal agency responsible for implementation and maintenance of discharge (flow) gauging stations on the nation’s water bodies.
Watershed: The land (measured in units of surface area) which drains water to a
particular body of water or outlet. WLA: Waste Load Allocation. The fraction of waterbody loading capacity
assigned to point sources in a watershed. Alternatively, the allowable pollutant load that an NPDES permitted facility may discharge without exceeding water quality standards.
WQS: Water Quality Standards. Defined in Chapter 61 of Environmental
Protection Commission [567] of the Iowa Administrative Code, they are the specific criteria by which water quality is gauged in Iowa.
WWTP: Waste Water Treatment Plant. General term for a facility which
processes municipal, industrial, or agricultural waste into effluent suitable for release to public waters or land application.
Zooplankton: Collective term for all animal plankton which serve as secondary
producers in the aquatic food chain and the primary food source for larger aquatic organisms.

Badger Creek Lake Watershed Management Plan Page 56
Appendix B – Badger Creek Lake TMDL

Total Maximum Daily Load For Siltation and Nutrients
Badger Creek Lake Madison County, Iowa
December 2002
Iowa Department of Natural Resources TMDL & Water Quality Assessment Section

Table of Contents 1. Introduction 4 2. Description of Waterbody and Watershed 4 3. Applicable Water Quality Standards 5 4. Water Quality Conditions 4.1 Water Quality Studies 5 4.2 Angling 6 5. Desired Target 6 5.1 Nutrients 7 5.2 Siltation 7 5.3 Aquatic Life 8 6. Loading Capacity 8 7. Pollutant Sources 9 8. Pollutant Allocation 8.1 Point Sources 9 8.2 Non-point Sources 9 8.3 Margin of Safety 9 9. Seasonal Variation 9 10. Monitoring 10 11. Implementation 10 12. Public Participation 11 13. References 11 14. Appendix 12
2 of 13

TMDL for Siltation and Nutrients Badger Creek Lake
Madison County, Iowa
Waterbody Name: Badger Creek Lake IDNR Waterbody ID: IA 04-LDM-03080-L Hydrologic Unit Code: HUC12 071000080403 Location: Section 13 T77N R27W Latitude: 41 Deg. 28 Min. 30 Sec N Longitude: 93 Deg. 54 Min. 51 Sec W Use Designation Class: A (primary contact recreation) B(LW) (aquatic life) Watershed: 11,700 acres Lake Area: 269 acres Major River Basin: Des Moines River Basin Tributaries Badger Creek Receiving Water Body: Badger Creek to North River Pollutant: Siltation and Nutrients Pollutant Sources: Agricultural nonpoint source Impaired Use Aquatic Life 1998 303d Priority: Low
3 of 13
1. Introduction The Federal Clean Water Act requires the Iowa Department of Natural Resources (IDNR) to develop a total maximum daily load (TMDL) for waters that have been identified on the state’s 303(d) list as impaired by a pollutant. Badger Creek Lake has been identified as partially supporting its aquatic life uses due to excessive siltation and nutrients. The purpose of these TMDLs for Badger Creek Lake is to calculate the maximum amount of siltation and nutrients that the lake can receive and still meet water quality standards, and then develop an allocation of that amount of siltation and nutrients to the sources in the watershed. Specifically this siltation and nutrient TMDLs for Badger Creek Lake will: • Identify the adverse impact that siltation and nutrients are having on the designated
uses of the lake. • Describe how siltation and nutrient loads in the lake violate the water quality
standards. • Identify target conditions and loads that assure the designated uses will be achieved. • Calculate acceptable siltation and nutrient limits, including a margin of safety, and
allocate the loads to the sources. • Provide implementation guidance for IDNR staff and watershed stakeholders to
achieve designated use goals. The IDNR believes that sufficient evidence and information is available to begin the process of restoring Badger Creek Lake. The Department acknowledges that to fully restore the aquatic life uses at Badger Creek Lake, additional information will likely be necessary. In order to accomplish the goals of these TMDLs, a phased approach will be used. By approaching the restoration process in phases, feedback from future assessments can be incorporated into the plan. Phase I of these TMDLs for Badger Creek Lake will develop target siltation and nutrient limits based on a reduction of the current levels that will be protective of the aquatic life uses. Phase II will evaluate the effect those targets have on the intended results. Included in Phase II will be monitoring for results, reevaluating the extent of the siltation and nutrient impairments, and evaluating if the specific aquatic life impairments originally identified in the TMDL have been remedied. 2. Description of Waterbody and Watershed Badger Creek Lake was constructed in 1980 and is located 9 miles east of Earlham, Iowa. It is a 269-acre lake with a mean depth of 10 feet, a maximum depth of 25 feet, and a storage volume of 2,616 acre-feet. The lake and park provide facilities for boating, fishing, camping, picnicking, and hiking. Park usage is estimated at approximately 68,000 visits per year. The Badger Creek Lake watershed has an area of approximately 11,700 acres and has a watershed-to-lake ratio of 43:1. Land use data was collected in 2000 for Table 1.
4 of 13
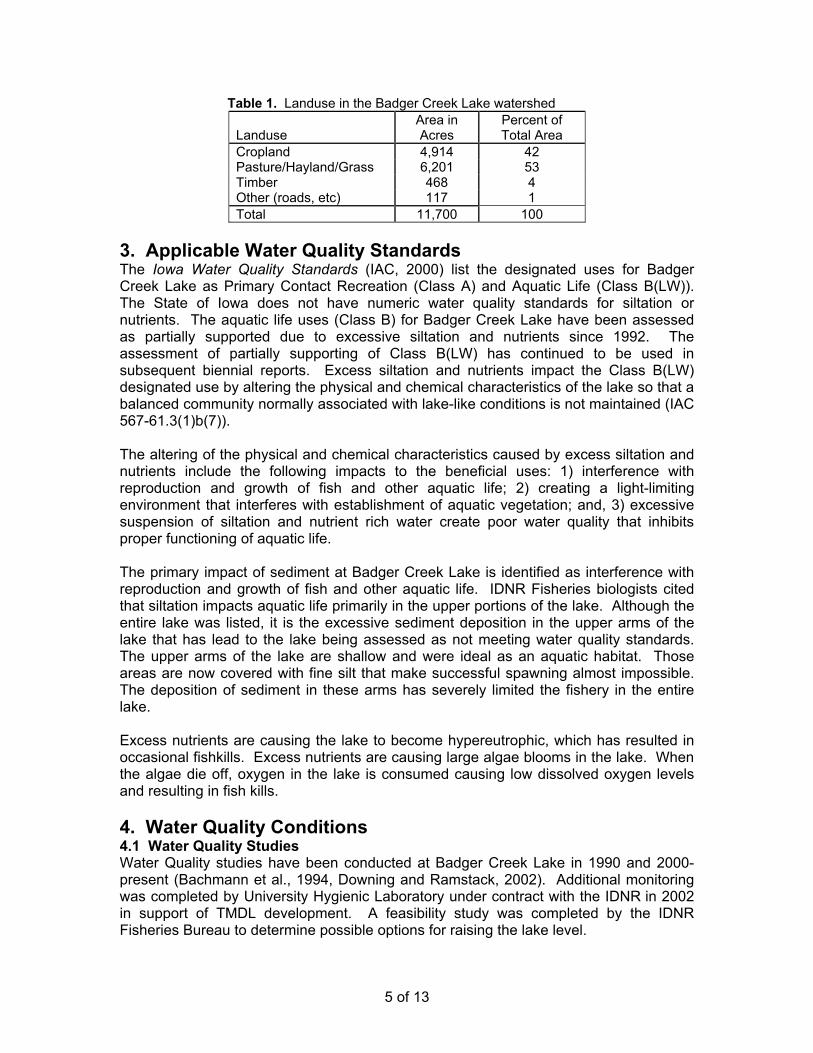
Table 1. Landuse in the Badger Creek Lake watershed Landuse
Area in Acres
Percent of Total Area
Cropland 4,914 42 Pasture/Hayland/Grass 6,201 53 Timber 468 4 Other (roads, etc) 117 1 Total 11,700 100
3. Applicable Water Quality Standards The Iowa Water Quality Standards (IAC, 2000) list the designated uses for Badger Creek Lake as Primary Contact Recreation (Class A) and Aquatic Life (Class B(LW)). The State of Iowa does not have numeric water quality standards for siltation or nutrients. The aquatic life uses (Class B) for Badger Creek Lake have been assessed as partially supported due to excessive siltation and nutrients since 1992. The assessment of partially supporting of Class B(LW) has continued to be used in subsequent biennial reports. Excess siltation and nutrients impact the Class B(LW) designated use by altering the physical and chemical characteristics of the lake so that a balanced community normally associated with lake-like conditions is not maintained (IAC 567-61.3(1)b(7)). The altering of the physical and chemical characteristics caused by excess siltation and nutrients include the following impacts to the beneficial uses: 1) interference with reproduction and growth of fish and other aquatic life; 2) creating a light-limiting environment that interferes with establishment of aquatic vegetation; and, 3) excessive suspension of siltation and nutrient rich water create poor water quality that inhibits proper functioning of aquatic life. The primary impact of sediment at Badger Creek Lake is identified as interference with reproduction and growth of fish and other aquatic life. IDNR Fisheries biologists cited that siltation impacts aquatic life primarily in the upper portions of the lake. Although the entire lake was listed, it is the excessive sediment deposition in the upper arms of the lake that has lead to the lake being assessed as not meeting water quality standards. The upper arms of the lake are shallow and were ideal as an aquatic habitat. Those areas are now covered with fine silt that make successful spawning almost impossible. The deposition of sediment in these arms has severely limited the fishery in the entire lake. Excess nutrients are causing the lake to become hypereutrophic, which has resulted in occasional fishkills. Excess nutrients are causing large algae blooms in the lake. When the algae die off, oxygen in the lake is consumed causing low dissolved oxygen levels and resulting in fish kills. 4. Water Quality Conditions 4.1 Water Quality Studies Water Quality studies have been conducted at Badger Creek Lake in 1990 and 2000-present (Bachmann et al., 1994, Downing and Ramstack, 2002). Additional monitoring was completed by University Hygienic Laboratory under contract with the IDNR in 2002 in support of TMDL development. A feasibility study was completed by the IDNR Fisheries Bureau to determine possible options for raising the lake level.
5 of 13

Samples were collected three times each summer for the lake studies conducted in 1992 (Bachmann et al., 1994). This data is shown in Tables 2 in the Appendix. Badger Creek Lake was sampled again in 2000-01 as part of the Iowa Lakes Survey (Downing and Ramstack, 2002). This survey will sample the lake three times each summer for five years. The data collected in 2000-01 is shown in Tables 3 and 4 (Appendix). Badger Creek Lake was monitored from March 2002 to August 2002 by UHL under contract with the IDNR. This data is summarized in Tables 5-7 in the Appendix. 4.2 Angling (Mike McGhee, IDNR Fisheries Biologist) Badger Creek was initially impounded in 1980. The fishery developed, but had problems. It was dominated by small, slow growing crappie (5-7”) and big numbers of 6 to 8 inch bullhead. The lake was lowered and the fish population renovated (killed) and restocked in the fall of 1984. This time everything worked due to fall stocking of 5 inch largemouth bass instead of 2 inch bass the following spring. The lake continues to be a good fishery providing decent bass, bluegill and crappies. In fact, it is a very popular bass tournament fishing spot. The channel catfish population did not develop until we started stocking larger channel catfish (large mouth bass were preying on the small catfish). This lake shouldn’t have been a good fishing lake the last 15 years, but it is. However, we are on the edge. Highly eutrophic waters and severe summer algae blooms create problems. We have experienced several small summer kills and the frequency and length of the summer algae blooms seem to be on the increase. One saving grace is that the lake is missing a common carp population. Grass carp were stocked into Badger Creek in 1987 in response to extensive aquatic vegetation development, but none have been stocked in over 10 years and no future stockings are planned. Some weedbed growth is returning to the lake, but more is needed. Severe shoreline erosion along 1.5 miles of shoreline is contributing to water quality problems. In regards to the upper end of the lake above the bridge, it was always shallow, except for the creek channel. However continued siltation is making the area less accessible. This has resulted in loss of fishing habitat and fishing area; spawning areas have been diminished but plenty of spots remain. Turbidity has increased in the upper end and fewer people use this lake area. We probably need a combination of silt dikes, dredging, shoreline protection, watershed work and lake expansion to remedy the problem. 5. Desired Target The listing of Badger Creek Lake is based on narrative criteria. Badger Creek Lake was included on the list of Iowa impaired waters based on the best professional judgment of IDNR field staff regarding the water quality. Badger Creek Lake has been assessed as “partially supported” since 1992. The IDNR Fisheries Bureau indicates that siltation and nutrients are impairing the Class B(LW) designated use. There are no numeric criteria for siltation or nutrients applicable to Badger Creek Lake or its sources in Chapter 61 of the Iowa Water Quality Standards (Iowa, 2000). The targets for Badger Creek Lake need to include siltation and nutrient loads as well as a measurement of the aquatic life.
6 of 13

This is a phased TMDL and each phase will incorporate a separate target. Phase I will include a target for siltation and nutrient delivery to the lake. Monitoring the water quality and the fishery of the lake will be included in both Phase I and Phase II. 5.1 Nutrients As discussed in section 3, the State of Iowa does not have numeric water quality criteria for nutrients applicable to Badger Creek Lake. Therefore, an acceptable nutrient target needs to be identified. Trophic State Indices (TSI) are an attempt to provide a single quantitative index for the purpose of classifying and ranking lakes, most often from the standpoint of assessing water quality. The Carlson Index is a measure of the trophic status of a body of water using several measures of water quality including: transparency or turbidity (Secchi disk depth), chlorophyll-a concentrations (algal biomass), and total phosphorous levels (usually the limiting nutrient in algal growth). The Carlson TSI ranges along a scale from 0-100 that is based upon relationships between secchi depth and surface water concentrations of algal chlorophyll, and total phosphorous for a set of North American lakes. A TSI value above 70 indicates a very productive waterbody with hypereutrophic characteristics; low clarity, high chlorophyll and phosphorous concentrations, and noxious surface scums of algae. Without numeric water quality standards to base a target on, the Carlson TSI will be used to determine the Phase I target for nutrients. The Phase I target is to reduce the trophic state of Badger Creek Lake to below hypereutrophic. This would be reflected in a TSI of 70. The current TSI based on chlorophyll-a is 77, for total phosphorous is 78, and based on transparency (secchi) is 60. The nutrient target for Badger Creek Lake will be measured by a Carlson TSI for chlorophyll-a and total phosphorous of 70 or below, and to maintain the TSI for transparency below 70.
TSI values for Badger Creek Lake Year Chl-a Total Phosphorous Transparency 2000* 65 87 71 2001* 74 70 62 2002** 77 78 60
* Iowa Lakes Survey (Downing and Ramstack, 2002). ** IDNR monitoring under contract with UHL
EUTROMOD modeling was completed on Badger Creek Lake and indicate the current phosphorous load to the lake is 25,229 lbs/year. To achieve a total phosphorous TSI of 70, the in-lake total phosphorous concentration needs to be at approximately 100 µg/L. To achieve this in-lake concentration, the phosphorous loading to the lake needs to be reduced to 7,487 pounds/year (70% reduction). This loading represents the allowable amount of phosphorous delivered from internal and external sources. 5.2 Siltation The Phase I sediment delivery target will address the amount of sediment delivered to the lake from the watershed. A direct measure of the sediment load is difficult to make given seasonal variability and actual measurement tools. Acceptable estimates using
7 of 13

established soil loss equations can be made to predict the erosion rates in the watershed, and subsequent delivery to the lake. The EUTROMOD modeling completed for Badger Creek Lake and its watershed predicted a current sediment delivery of 12,696 tons/year based on landuse in the watershed. Since there are no numeric standards for sediment or siltation, an appropriate target for sediment needs to be identified. This is a phased TMDL, which allows for the targets to be revisited and adjusted as new data and information are available. Phosphorous is typically bound with soil and sediment delivery, and therefore the initial or Phase I target for sediment is to reduce sediment loading by the same percent reduction for phosphorous, a 70% reduction. This sets the Phase I siltation target at 3,809 tons/year delivered to the lake. 5.3 Aquatic Life The Phase II aquatic life target for this TMDL will be achieved when the fishery of Badger Creek Lake is determined to be fully supporting the Class B aquatic life uses. This determination will be accomplished through an assessment conducted by the IDNR Fisheries Bureau. This assessment will be in accordance with the Statewide Biological Sampling Plan protocol (Larscheid, 2001). This protocol is currently being used to develop benchmarks for the fishery of Iowa’s lakes. The results from the Badger Creek Lake assessment will be compared with the benchmarks being developed. These assessments will include age, growth, size structure, body condition, relative abundance, and species. Badger Creek Lake will not be considered restored until the Phase II target is achieved. If the aquatic life target is achieved prior to the sediment and nutrient delivery targets, then the level of land practices may be maintained at a level at or above those in place at the time of the assessment. If however, after a reasonable time following the completion of the sediment and nutrient delivery practices the aquatic life has not been restored, then further study and practices may be necessary. 6. Loading Capacity The State of Iowa does not have numeric water quality criteria for siltation or nutrients that apply to Badger Creek Lake. Badger Creek Lake was included on the list of Iowa impaired waters based on the best professional judgment of IDNR field staff regarding the water quality. Excess siltation and nutrients are causing impairment of the Class B(LW) designated uses. The Phase I nutrient target for Badger Creek Lake is to achieve a Carlson TSI for total phosphorous and chlorophyll-a of 70. This initial target will bring the lake below hypereutrophy and result in an initial step towards restoring the impaired designated uses. The Phase I target of a TSI value of 70 results in a loading capacity of 7,487 pounds/year of phosphorous. The Phase I sediment target for Badger Creek Lake is based on a reduction of the current modeled sediment delivery. This target results in a loading capacity of 3,809 tons/year of sediment delivered to the lake. This is an initial step towards improving water quality for the aquatic life by reducing the amount of sediment delivered to the lake.
8 of 13

7. Pollutant Sources Water quality in Badger Creek Lake is influenced only by nonpoint sources. There are no point source discharges in the watershed. There are no point source discharges in the watershed. Nonpoint source pollution is caused by material transported to the lake by runoff from the watershed. Gully, streambank/streambed, sheet and rill, and shoreline erosion can contribute significantly to poor water quality and deterioration of the lake. Shoreline erosion along approximately 1.5 miles of shoreline is contributing significant amounts of sediment to Badger Creek Lake. Internal resuspension of sediment and nutrients can be a significant source nutrients to the water column, and also contribute to the poor water clarity by maintaining sediments in suspension. 8. Pollutant Allocation 8.1 Point Sources There are no point source discharges in the Badger Creek Lake watershed. Therefore, the Wasteload Allocation for siltation and nutrients established under this TMDL is zero. 8.2 Non-Point Sources Production agriculture dominates the watershed of Badger Creek Lake. Sheet and rill erosion from the large watershed contributes both sediment and nutrients to the lake. Shoreline erosion has been identified as a direct source of sediment and nutrients to Badger Creek Lake. In addition, resuspension of sediment and nutrients from the lake bottom is a significant contributor to the poor water quality at Badger Creek Lake. Badger Creek Lake was modeled using EUTROMOD to determine the reduction of nutrient inputs necessary to achieve the desired targets. In order to achieve a total phosphorous concentration of 100 µg/L, a 70% reduction in phosphorous loading is needed from a combination of internal and external sources. The current phosphorous load as determined by EUTROMOD is 25,229 lbs/year. Therefore, a 70% reduction from internal and external sources results in a Load Allocation for total phosphorous of 7,487 lbs/year. Reductions of total phosphorous from internal sources will be achieved by in-lake improvements, including rough fish removal and shoreline stabilization. The Load Allocation for sediment established under this TMDL is 3,809 tons/year. 8.3 Load Allocation and Margin of Safety The margin of safety for this TMDL is implicit. The multiple targets for this TMDL assures that the aquatic life uses will be restored regardless of the accuracy of the Phase I siltation and nutrient delivery targets. Failure to achieve water quality standards will result in review of the TMDL, allocations, and/or sediment management approaches and probable revision. In addition, calculations were made using conservative estimates. 9. Seasonal Variation This TMDL accounts for seasonal variation by recognizing that (1) loading varies substantially by season and between years, and (2) impacts are felt over multi-year timeframes. Sediment and nutrient loading and transport are predictable only over long timeframes. Moreover, in contrast to pollutants that cause short-term beneficial use impacts and are thus sensitive to seasonal variation and critical conditions, the sediment
9 of 13

and nutrient impacts in this watershed occur over much longer time scales. For these reasons, the longer timeframe (tons per year) used in this TMDL is appropriate. 10. Monitoring Monitoring will be completed at Badger Creek Lake as part of the Iowa Lakes Survey. In-lake water monitoring will be completed three times per year for each of the field seasons 2000 – 2004. In addition, the IDNR Fisheries Bureau will conduct an assessment of the fishery of Badger Creek Lake in accordance with the Statewide Biological Sampling Plan protocol (Larscheid, 2001). This assessment will be completed after the lake restoration project is complete. At the completion of this assessment, the data will be evaluated to determine the listing status of Badger Creek Lake. A lake mapping and sediment core study was undertaken by the IDNR and USGS in the fall of 2002. This data will provide a bathymetric map of Badger Creek Lake, estimates of sediment volume and location, and sediment core samples from the lake basin. This information will be used to determine more precisely the current amount and location of sediment in the lake, and also serve as a baseline for measuring TMDL implementation success. While this information is not available for the development of the TMDL, it will be very useful in Phase II of the TMDL. 11. Implementation The Iowa Department of Natural Resources recognizes that an implementation plan is not a required component of a Total Maximum Daily Load. However, the IDNR offers the following implementation strategy to IDNR staff, partners, and watershed stakeholders as a guide to improving water quality at Badger Creek Lake. Although a comprehensive watershed plan is not yet available for Badger Creek Lake, there are some pollutant sources identified that can be reduced and work towards overall water quality improvement at the lake. Shoreline erosion has been identified as a direct source of sediment and nutrients to the lake. Rip-rap or establishment of aquatic macrophytes along the shoreline can reduce or eliminate this source of sediment and nutrients. The establishment of aquatic macrophytes will also help to remove excess nutrients from the lake, and likely increase transparency. Upland conservation measures should continue to be promoted, reducing sediment and nutrient delivery from sheet and rill erosion. Streambank and streambed erosion can be reduced through the installation of riparian corridors, buffer strips, and livestock exclusion. A Feasiblity study was completed for Badger Creek Lake in 2001. This study evaluated raising the height of the dam, which would increase the surface area and the mean depth. Generally deeper lakes in Iowa have better water quality and healthier aquatic communities than shallow lakes. A deeper mean depth would likely result in improved water quality, by allowing the lake to stratify and reducing the amount of nutrients being recycled within the lake. An increase in lake size would also provide more habitat within the lake, resulting in an improved fishery at Badger Creek Lake. This project has a large capital cost, and would result in facilities (boat ramps, roads, camping areas, etc.) being moved and reconstructed. This project would also require the cooperation of local landowners to willingly sell land to the IDNR for completion of the project. As part of Phase II, monitoring will be completed at Badger Creek Lake. This includes the Iowa Lakes Survey and a fishery assessment completed by the IDNR Fisheries
10 of 13

Bureau. At the completion of this assessment, the data will be evaluated to determine the listing status of Badger Creek Lake. 12. Public Participation Public meetings regarding the procedure and timetable for developing the Badger Creek Lake TMDL were held on January 14, 2002, in Des Moines, Iowa; and in Earlham, Iowa. A draft version of the TMDL was available for public notice from November 14 through December 6, 2002. Appropriate comments will be incorporated into the TMDL prior to submittal to EPA for final approval. 13. References Bachmann, R.W., T.A. Hoyman, L.K. Hatch, and B.P. Hutchins. 1994. A Classification of Iowa's Lakes for Restoration. Department of Animal Ecology, Iowa State University, Ames, Iowa. p517. Canfield, D. E. Jr. and R. W. Bachmann. 1981. Prediction of total phosphorus concentrations, chlorophyll-a, and secchi depths in natural and artificial lakes. Can. J. Fish. Aquat. Sci. 38:414-423. CNET Spreadsheet Model as published by North American Lakes Management Society and based on Walker, WW, 1886, " Empirical Methods for Predicting Eutrophication in Impoundments: Report 4, Phase 3: Applications Manual, Techincal Report E-810-0" U.S. Army Wateways Experiment Station, Vicksburg, MS. Downing, J.A., J.M. Ramstack. 2002. Iowa Lakes Survey Summer 2000-01 Data. Department of Animal Ecology, Iowa State University, Ames, Iowa. Fenton, T.E. 1999. Phosphorus in Iowa Soils. Iowa State University Agronomy Dept. (looked at Table 1). Iowa. 2000. Iowa Administrative Code 567, Chapter 61, Iowa Water Quality Standards. Larscheid, Joe. Statewide Biological Sampling Plan, July 2001. NRCS - Iowa. 200. Iowa Technical Note No. 25 Iowa Phosphorus Index. 35 pp. Reckhow, K.H. and Henning, M.H., 1990, "Using Eutromod" North American Lakes Management Society. USDA-NRCS. 1999. Field Office Technical Guide Notice No. IA-378. “Pond”. March 1999. USDA/Natural Resources Conservation Service. 2000. Iowa Field Office Technical Guide- January 2000. “Predicting Rainfall Erosion Losses, The Revised Universal Soil Loss Equation (RUSLE)”, Section I, Erosion Prediction. USDA/Natural Resources Conservation Service. 1998. Iowa Field Office Technical Guide Notice No. IA-198. “Erosion and Sediment Delivery Procedure”, Section I, Erosion Protection.
11 of 13
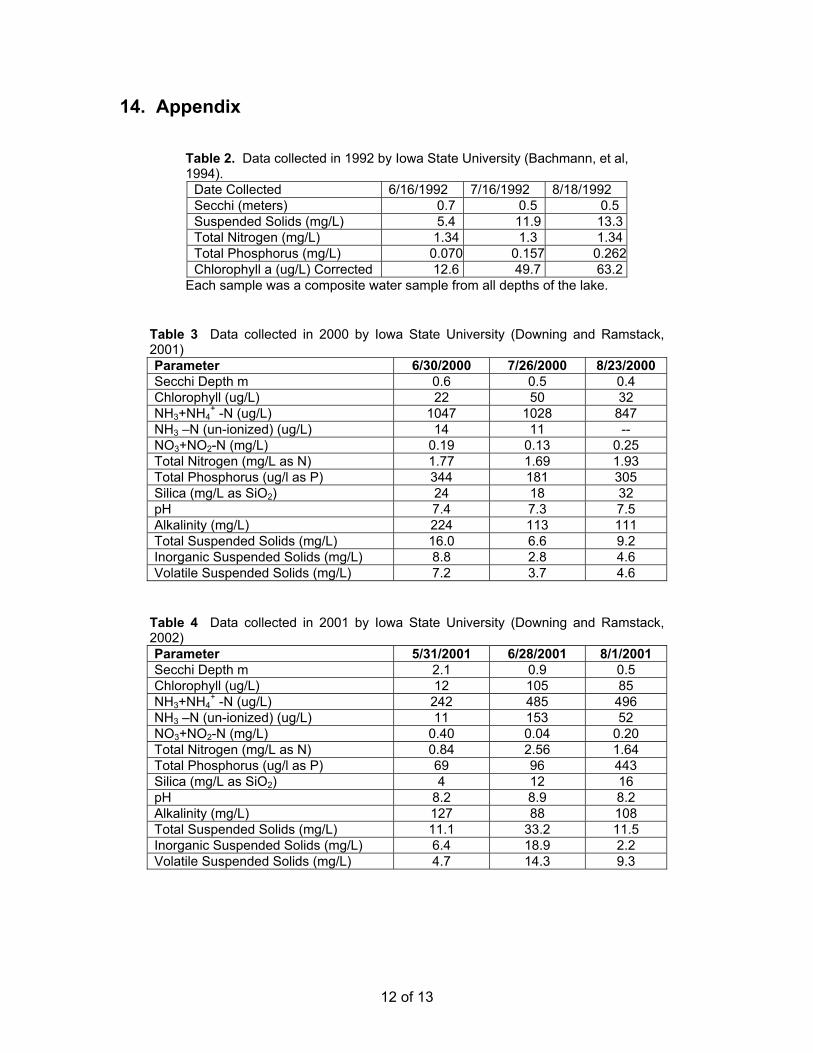
14. Appendix
Table 2. Data collected in 1992 by Iowa State University (Bachmann, et al, 1994).
Date Collected 6/16/1992 7/16/1992 8/18/1992 Secchi (meters) 0.7 0.5 0.5 Suspended Solids (mg/L) 5.4 11.9 13.3 Total Nitrogen (mg/L) 1.34 1.3 1.34 Total Phosphorus (mg/L) 0.070 0.157 0.262Chlorophyll a (ug/L) Corrected 12.6 49.7 63.2
Each sample was a composite water sample from all depths of the lake.
Table 3 Data collected in 2000 by Iowa State University (Downing and Ramstack, 2001) Parameter 6/30/2000 7/26/2000 8/23/2000 Secchi Depth m 0.6 0.5 0.4 Chlorophyll (ug/L) 22 50 32 NH3+NH4
+ -N (ug/L) 1047 1028 847 NH3 –N (un-ionized) (ug/L) 14 11 -- NO3+NO2-N (mg/L) 0.19 0.13 0.25 Total Nitrogen (mg/L as N) 1.77 1.69 1.93 Total Phosphorus (ug/l as P) 344 181 305 Silica (mg/L as SiO2) 24 18 32 pH 7.4 7.3 7.5 Alkalinity (mg/L) 224 113 111 Total Suspended Solids (mg/L) 16.0 6.6 9.2 Inorganic Suspended Solids (mg/L) 8.8 2.8 4.6 Volatile Suspended Solids (mg/L) 7.2 3.7 4.6
Table 4 Data collected in 2001 by Iowa State University (Downing and Ramstack, 2002) Parameter 5/31/2001 6/28/2001 8/1/2001 Secchi Depth m 2.1 0.9 0.5 Chlorophyll (ug/L) 12 105 85 NH3+NH4
+ -N (ug/L) 242 485 496 NH3 –N (un-ionized) (ug/L) 11 153 52 NO3+NO2-N (mg/L) 0.40 0.04 0.20 Total Nitrogen (mg/L as N) 0.84 2.56 1.64 Total Phosphorus (ug/l as P) 69 96 443 Silica (mg/L as SiO2) 4 12 16 pH 8.2 8.9 8.2 Alkalinity (mg/L) 127 88 108 Total Suspended Solids (mg/L) 11.1 33.2 11.5 Inorganic Suspended Solids (mg/L) 6.4 18.9 2.2 Volatile Suspended Solids (mg/L) 4.7 14.3 9.3
12 of 13

13 of 13
Table 5. Surface sample results from Badger Creek Lake, collected by UHL 3/2002 – 8/2002 Parameter Min Max Median St Dev Secchi (m) 0.5 2 1.3 0.45 Ammonia Nitrogen as N (mg/L) 0.05 3.4 0.05 1.21 Chlorophyll a – corrected (ug/L) 5 140 7 56.91 Dissolved Oxygen (mg/L) 4 12 10 2.76 pH 8.3 9.1 8.4 0.34 Nitrate + Nitrite Nitrogen as N (mg/L) 0.1 0.1 0.1 0.0 Total Kjeldahl Nitrogen (mg/L) 0.68 2.6 1 0.77 Ortho Phosphate as P (ug/L) 50 280 50 80 Total Phosphate as P (ug/L) 50 450 80 140 Total Suspended Solids (mg/L) 4 58 9 16.79
Table 6. Mid-water column sample results from Badger Creek Lake, collected by UHL 3/2002 – 8/2002 Parameter Min Max Median St Dev Ammonia Nitrogen as N (mg/L) 0.05 1.5 0.17 0.52 Chlorophyll a – corrected (ug/L) 4 70 7 30.05 Dissolved Oxygen (mg/L) 3.4 11.9 9.5 2.95 pH 8.3 8.8 8.4 0.16 Nitrate + Nitrite Nitrogen as N (mg/L) 0.1 0.1 0.1 0.0 Total Kjeldahl Nitrogen (mg/L) 0.65 2.5 0.99 0.66 Ortho Phosphate as P (ug/L) 50 270 50 80 Total Phosphate as P (ug/L) 50 420 80 140 Total Suspended Solids (mg/L) 5 90 7 29.19
Table 7. Bottom sample results from Badger Creek Lake, collected by UHL 3/2002 – 8/2002 Parameter Min Max Median St Dev Ammonia Nitrogen as N (mg/L) 0.05 1.6 0.11 0.59 Chlorophyll a – corrected (ug/L) 4 27 7 7.99 Dissolved Oxygen (mg/L) 1.8 11.8 8.5 4.34 pH 7.9 8.5 8.3 0.25 Nitrate + Nitrite Nitrogen as N (mg/L) 0.1 0.1 0.1 0.0 Total Kjeldahl Nitrogen (mg/L) 0.73 2.4 1.1 0.64 Ortho Phosphate as P (ug/L) 0.05 0.71 0.05 0.25 Total Phosphate as P (ug/L) 0.05 0.42 0.11 0.15 Total Suspended Solids (mg/L) 4 90 6.5 29.35

Badger Creek Lake Watershed Management Plan Page 57
Appendix C – Badger Creek Lake Awareness Campaign

Prepared by Jacqueline Comito, Carol Brown, Ann Staudt, Aaron Andrews Assisted by Ellen White, Elizabeth Juchems and Sara Sloan
December 9, 2011
Badger Creek Lake Watershed
Citizen Awareness Campaign

1
Funded by:
Madison Soil and Water Conservation District and
Iowa Department of Natural Resources USEPA Section 319
In cooperation with Iowa Learning Farms – Building A Culture of Conservation
Special Thanks to Watershed Coordinator Ben Gleason and Madison County NRCS District Conservationist Wayne Shafer
Iowa State University does not discriminate on the basis of race, color, age, religion, national origin, sexual orientation, gender identity, genetic information, sex, marital status, disability, or status as a U.S. veteran. Inquiries can be directed to the Director of Equal Opportunity and Compliance, 3280 Beardshear Hall, (515) 294-‐7612.
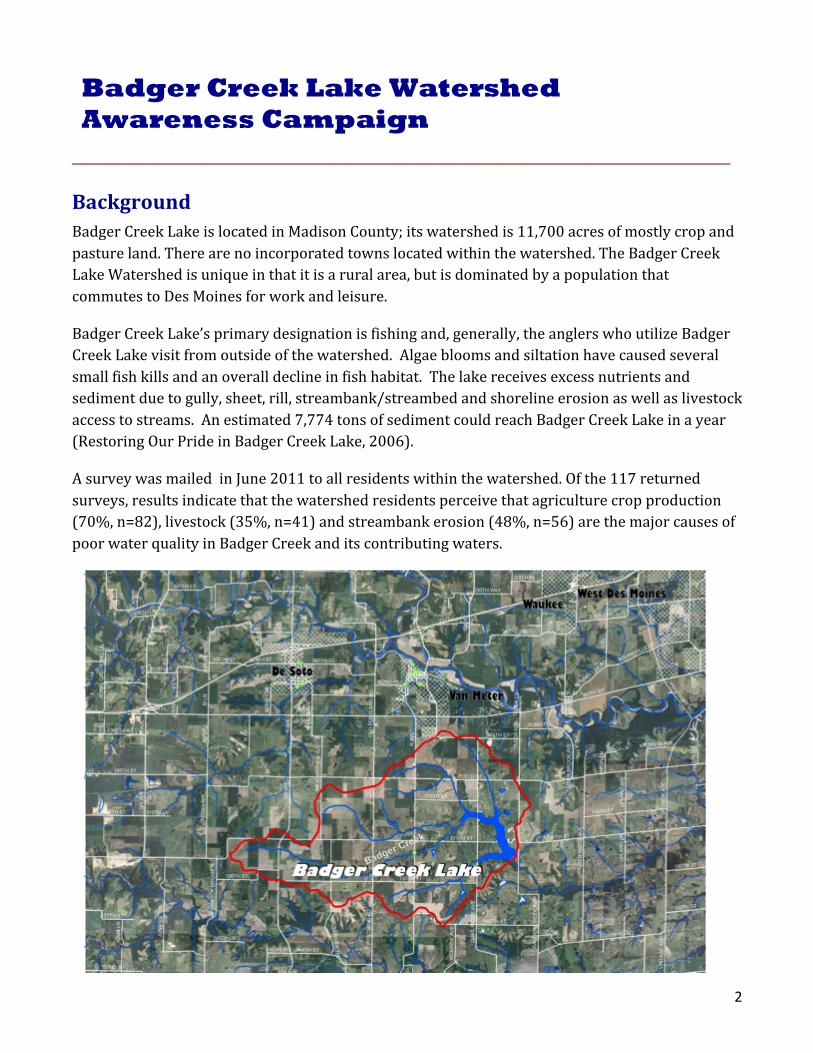
2
_______________________________________________________
Background Badger Creek Lake is located in Madison County; its watershed is 11,700 acres of mostly crop and pasture land. There are no incorporated towns located within the watershed. The Badger Creek Lake Watershed is unique in that it is a rural area, but is dominated by a population that commutes to Des Moines for work and leisure.
Badger Creek Lake’s primary designation is fishing and, generally, the anglers who utilize Badger Creek Lake visit from outside of the watershed. Algae blooms and siltation have caused several small fish kills and an overall decline in fish habitat. The lake receives excess nutrients and sediment due to gully, sheet, rill, streambank/streambed and shoreline erosion as well as livestock access to streams. An estimated 7,774 tons of sediment could reach Badger Creek Lake in a year (Restoring Our Pride in Badger Creek Lake, 2006).
A survey was mailed in June 2011 to all residents within the watershed. Of the 117 returned surveys, results indicate that the watershed residents perceive that agriculture crop production (70%, n=82), livestock (35%, n=41) and streambank erosion (48%, n=56) are the major causes of poor water quality in Badger Creek and its contributing waters.
Badger Creek Lake Watershed Awareness Campaign

3
Goals/Strategies Survey results indicate that watershed residents are generally aware of contributors to the poor water quality within their watershed; therefore, the goal for the Badger Creek Lake Watershed campaign is to inform residents about the importance of water quality within the watershed and the lake and to inspire them to value and care for Badger Creek Lake. These goals will ultimately require changes in habits and practices. The changes made can eventually remove the lake from the Iowa Department of Natural Resources 303(d) list of impaired water bodies.
Because there are no towns within the watershed, the challenge will be for watershed residents to unite and work together to better the area in which they live. A different approach should be taken, suggesting that residents within the watershed are part of a “watershed community” and outreach material will reach community members individually—in their homes and in their cars. Outreach campaign materials have been developed to specifically address these challenges, to promote ownership and pride in the local watershed community. Booneville, Van Meter and De Soto are located within 10 miles to the north of Badger Creek Lake and residents in these communities will be included in campaign outreach as well.
Iowa Learning Farms staff who visited the local area were told by a watershed resident that , “Badger Creek Lake was built to hold dirt.” Historically, the lake was designated for sediment control. Despite increased recreational usage, many citizens maintain the perceived role of the lake is for sediment control and they do not consider the importance of Badger Creek Lake’s water quality. Acknowledging these local attitudes, it is recommended that a water quality message be paired with a message about the importance of soil quality. For farmers, focusing the message on the Badger Creek Lake Watershed may prove most effective, while non-‐farmers may relate more closely with water quality in the lake. These targeted messages will serve as vital components in restoring the water quality in Badger Creek Lake.
The materials suggested in this proposal complement one another in terms of providing education on Badger Creek Lake Watershed’s challenges with the goal of reaching out to multiple audiences. These outreach methods, when kept up to date and used together, will serve as effective tools to teach about conservation issues, strengthen the watershed community, and renew the water quality in Badger Creek Lake.

4
Watershed Leadership Team Creation of a Badger Creek Lake Watershed advisory board is highly recommended to guide the watershed project in striving towards its goals of improving water quality and strengthening the watershed community. In addition to the Badger Creek Lake Watershed coordinator, the Madison Soil and Water Conservation District commissioners bring many strengths to the table: active involvement and a passion for protecting local soil and water quality, an in-‐depth understanding of local attitudes and perceptions, and years of experience. To make this advisory board as well rounded and representative as possible, it is recommended that additional advisory board members include at least one non-‐farmer resident and one female resident. Furthermore, it is strongly recommended to invite the county sanitarian and local or regional economic development personnel to sit on this advisory board. Clean water builds positive economic development, and these individuals would bring a unique perspective to the watershed advisory board. This advisory board will be instrumental in shaping Badger Creek Lake Watershed’s marketing plan and direction moving forward.
Branding Elements Foundational branding elements should be created to support this watershed awareness campaign. To accomplish this, the following elements should be considered:
• Watershed Identification Logo: Two examples are provided but designs should be considered with the input of the watershed coordinator, local SWCD commissioners and others working on the project.
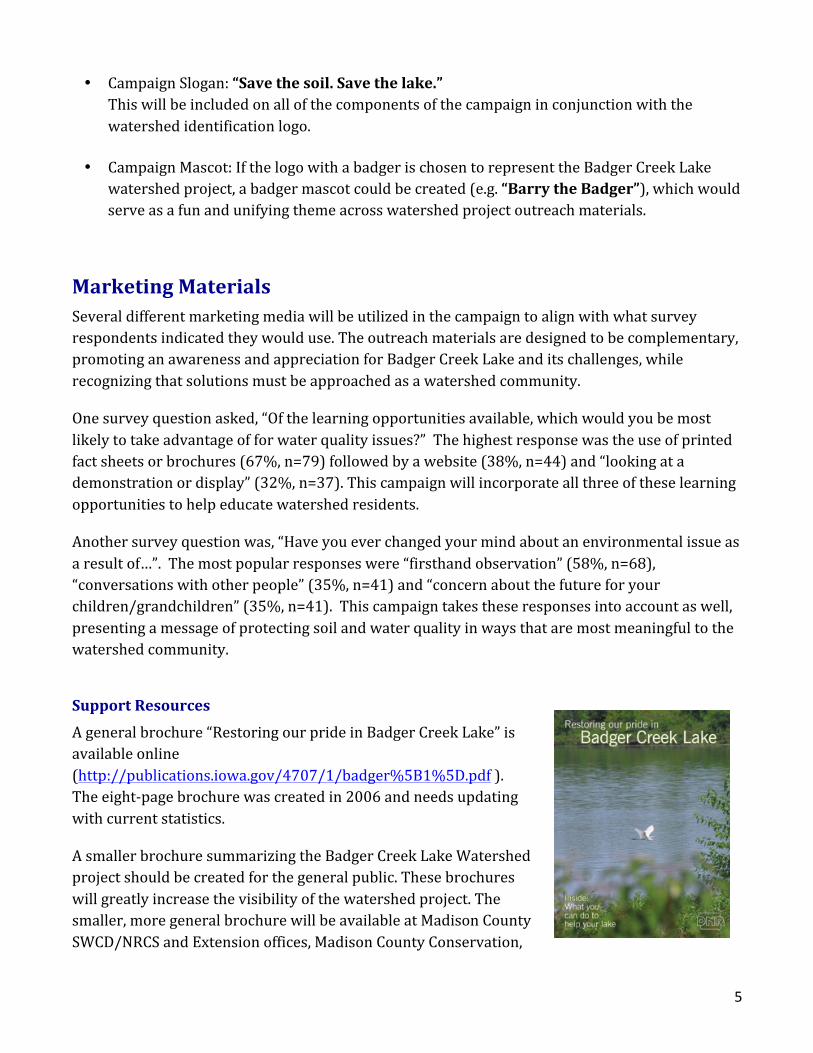
5
• Campaign Slogan: “Save the soil. Save the lake.” This will be included on all of the components of the campaign in conjunction with the watershed identification logo.
• Campaign Mascot: If the logo with a badger is chosen to represent the Badger Creek Lake watershed project, a badger mascot could be created (e.g. “Barry the Badger”), which would serve as a fun and unifying theme across watershed project outreach materials.
Marketing Materials Several different marketing media will be utilized in the campaign to align with what survey respondents indicated they would use. The outreach materials are designed to be complementary, promoting an awareness and appreciation for Badger Creek Lake and its challenges, while recognizing that solutions must be approached as a watershed community.
One survey question asked, “Of the learning opportunities available, which would you be most likely to take advantage of for water quality issues?” The highest response was the use of printed fact sheets or brochures (67%, n=79) followed by a website (38%, n=44) and “looking at a demonstration or display” (32%, n=37). This campaign will incorporate all three of these learning opportunities to help educate watershed residents.
Another survey question was, “Have you ever changed your mind about an environmental issue as a result of…”. The most popular responses were “firsthand observation” (58%, n=68), “conversations with other people” (35%, n=41) and “concern about the future for your children/grandchildren” (35%, n=41). This campaign takes these responses into account as well, presenting a message of protecting soil and water quality in ways that are most meaningful to the watershed community.
Support Resources A general brochure “Restoring our pride in Badger Creek Lake” is available online (http://publications.iowa.gov/4707/1/badger%5B1%5D.pdf ). The eight-‐page brochure was created in 2006 and needs updating with current statistics.
A smaller brochure summarizing the Badger Creek Lake Watershed project should be created for the general public. These brochures will greatly increase the visibility of the watershed project. The smaller, more general brochure will be available at Madison County SWCD/NRCS and Extension offices, Madison County Conservation,

6
and in brochure racks at the Madison County Chamber of Commerce office, local landmarks such as the John Wayne birthplace, and at local retail sites.
Regular press releases will be sent to area newspapers and radio stations, as well as posted on the website, to support and inform the public of the campaign and its events. The local shopper newspaper allows for special inserts by zip code, so this would provide another avenue for targeted outreach in and around Badger Creek Lake Watershed.
Website A website will be created with background information on Badger Creek Lake, its watershed and the progress of the watershed project. The website should include facts about soil quality, water quality, and ideas for what community members can do to improve the environment in the area, as well as additional resources on establishing best management practices.
It will be imperative to continually update the website as more testing is conducted throughout the duration of the project. This will allow community members to be informed about any changes in the water quality in the area so they are aware that the project is evolving.
The website should also include a page with activities for kids with items such as instructions for easy-‐to-‐make water quality experiments and printable activities such as water-‐themed crossword puzzles and pictures to color. As many survey respondents indicated a concern for water quality when thinking about the future of the next generation(s), these activities can be done together with children or grandchildren, promoting multigenerational awareness and interest in water quality issues and Badger Creek Lake Watershed, specifically.
Fact Sheets/Utility Bill Inserts A series of fact sheets will be created and inserted into watershed residents’ utility bills once every three months.
The fact sheet inserts should contain information on the project and progress updates. They should also include information on challenges for the project and proposed solutions. They should direct community members to the project website and offer contact information for experts who can answer questions and offer insight on utilizing best management practices. The inserts should also discuss seasonal trends in water quality, specific to the fluctuations in water detriments and how practices contribute differently during different seasons.
Survey respondents indicated strongly that they would utilize printed fact sheets or brochures to learn about water quality issues. By placing the fact sheet in a utility bill, there is the opportunity to reach a large number of people, increasing the likelihood that it will be read and will create a connection between water bills and water quality. Using photography showing both good and bad

7
examples, the fact sheets will address the factors contributing to Badger Creek Lake’s water quality impairments, as well as opportunities for involvement and local ownership in the project.
Suggested topics for quarterly fact sheets:
Quarter 1: • Opportunities for involvement in the Badger Creek Lake Watershed restoration project
o Attend local field days and other watershed project events o Statewide opportunities, e.g. IOWATER volunteer water monitoring
• Progress made thus far and watershed project goals to be met
Quarter 2: • Public recreational opportunities at Badger Creek Lake
o How the lake is utilized recreationally and why it is a popular fishing spot o How outdoor recreation activities at Badger Creek Lake can generate economic
benefits • Overview of completed project goals • Goals for the future of the Badger Creek Lake Watershed project
Quarter 3: • Nutrient Management
o General information about nutrient transport and its effect on water bodies o Information about the cost of nutrients and the amount of money being lost by
allowing their transport into the lake and other water bodies • Results from any testing within the watershed and Badger Creek Lake • Progress made thus far and watershed project goals to be met
Quarter 4: • Economics of soil
o Soil loss rates in the Badger Creek Lake Watershed o Watershed impacts resulting from soil loss o Proposed solutions on a farm scale and on a watershed scale (grassed waterways,
buffer strips, streambank stabilization, restricting livestock access to streams, etc.)
• Long term goals for the project • Watershed project goals to be met

8
Watershed Signage
Watershed Boundary Signs Signage will be created to mark the geographic boundaries of the watershed. The signs will say, “Now Entering/Exiting Badger Creek Lake Watershed” and will contain the logo, slogan and the website. The signs will provide a different perspective of the area and introduce the concept of watersheds to those who may not have previous knowledge of it. These signs will increase the visibility of, and generate curiosity about, the Badger Creek Lake Watershed project. Road Signs Small signs will be placed along well-‐traveled roads around the watershed and will contain sequential facts about soil quality. The signs will be reminiscent of the old Burma-‐Shave advertising road signs and placed in groups of four or five. The first three or four signs will contain the featured message with the last containing the logo and slogan (and possibly the badger mascot) for the watershed project. Each set of signs will be different, to engage people and generate curiosity about the project. Signs can include information about soil and water quality.
One example: Muddy water
is not so charming
Protect your soil
keep on farming!
Save the soil. Save the lake. Badger Creek Lake Watershed project

9
Yard Signs As knowledge of the watershed project grows, those community members who have made positive changes in their conservation practices should be recognized. Signs will be created for people to put in their yards so that they are acknowledged as good conservationists.
The signs can read:
I installed (conservation practice) to save my soil.
Save the soil. Save the lake.
Find out more at website.com
These signs will be brief so that the message is easily transferred as travelers pass by. They will contain the logo, slogan and website for the project. These signs will motivate people to practice conservation on their land and to be acknowledged for their good work. In addition to their yard sign, they will be recognized on the website, which will include their contact information (with their permission) so that community members can easily ask questions or exchange information with someone who has installed conservation practices on their own land. This will encourage residents to network with one another and strengthen community awareness of the watershed improvement project.
Watershed Resident Involvement
Area Churches and Service Groups Forty-‐one percent of survey respondents indicated that they are very active within their local church. People often use their church for idea exchange and discussion on a variety of topics, religious and nonreligious. Water quality activities could be part of social justice activities on the part of local churches. Watershed project leaders should approach church members who are also farmers/residents in the watershed to see if they would speak to the issue at a church event.
The utility fact sheets will be adapted for inserting into church bulletins in area churches, including: Trinity Lutheran in Van Meter and Van Meter Baptist Church, Van Meter United Methodist Church, De Soto Calvary Baptist and Methodist churches, and Booneville United Methodist Church.
Inviting local pastors to an SWCD or watershed meeting is highly recommended. These individuals are generally well-‐respected community members; getting them “on board” with the watershed project can lead to increased discussion and informed dialogue in their local congregations.

10
Involving church youth groups and community youth organizations, such as Boy Scouts, Girl Scouts, and 4-‐H, in the watershed project helps bring awareness to the issues involving the lake to new, younger audiences. This will also help engage the next generation of Badger Creek Lake water quality caretakers. These groups can plan service projects that help the lake such as trash pick up days, painting picnic tables or restrooms, etc. Furthermore, these service-‐oriented groups can also help with door-‐to-‐door promotion and distribution of print materials within the watershed.
Photography Contest
A “four seasons” amateur photography contest would promote the natural beauty of Badger Creek Lake, highlight conservation efforts towards improved water quality, and encourage visitors to the area year round. Harrison County has successfully sponsored a similar contest, and the watershed project team should consult with them for advice and recommendations in planning this event.
Community Events and Field Day
Survey respondents answered “firsthand observation” and “conversations with other people” as two ways in which they were most likely to change their minds. Acknowledging these responses, the campaign will include several community events offering opportunities for watershed residents to gather together and discuss the challenges faced in Badger Creek Lake Watershed:
• A general awareness “kick off” event for the residents of Badger Creek Lake Watershed, held at the Badger Creek Lake State Recreation Area, will be the first step in creating a network for community members to gather together and discuss their local water quality. This event will be dedicated to the quality of the water and soil in the area with the goal of generating interest and excitement about the project. To generate the largest amount of interest possible, this event should be marketed as a free, family-‐oriented event (e.g. community picnic at Badger Creek Lake) rather than a “watershed meeting.”
• An Iowa Learning Farms field day will be held on a watershed resident’s farm who is demonstrating conservation practices such as no-‐till, strip-‐till, cover crops, wetlands, etc. This field day is a chance for farmers and watershed residents to visit a farm and learn about various conservation practices that reduce erosion and improve water quality. Attendees will have the opportunity to visit with one or more local farmers about their management practices as well as an expert (ISU, NRCS, DNR, etc.).
• A 5K/10K fun run can be held at the lake or within the watershed. The event can start or end at Badger Creek Lake, or be held in its entirety at the lake (if trails allow). T-‐shirts with the watershed logo and project info (website) can be given away to participants. The fun run offers a different usage of the lake area other than fishing and brings a new audience to the lake.
11
• The DNR’s IOWATER program is a statewide initiative that trains citizens to be volunteer water quality monitors around the state. The introductory IOWATER training workshop is an 8-‐hour program that trains local personnel to monitor a variety of physical and chemical parameters of local streams, rivers, and lakes. An IOWATER workshop could be held locally to train both teachers from surrounding schools as well as interested local citizens.
• A “closing” event should be held at the end of the campaign to celebrate the progress made and recognize watershed residents who were key in achieving the campaign goals. This could be a simple ceremony to award certificates of recognition and publicity opportunities, and could be held in conjunction with the annual Madison SWCD Winter Conservation Banquet. All of the events provide opportunities for watershed residents to network, talk one-‐on-‐one and unite as a “watershed community.”
The Iowa Learning Farms Conservation Station should be at the kick-‐off event, the field day or the fun run. The Conservation Station is an effective tool for demonstrating the benefits of conservation land practices on soil and water quality and brings people together to address conservation issues. The rainfall simulator component of the Conservation Station contains an effective visual display that demonstrates the effects of different land management choices (urban and rural) and their impacts on soil loss as it relates to water quality. The Conservation Station also contains a learning lab with various lessons that can be changed depending on the targeted audience and the message of the event. A specific educational module could be created for this event tailored to the issues surrounding the Badger Creek Lake Watershed, particularly addressing the issues of soil productivity, erosion and the connectedness of soil and water quality to the local community.
Youth Outdoor Classroom Iowa Learning Farms will help coordinate and host a youth outdoor classroom day at Badger Creek Lake for 4th and 5th grade students of De Soto Intermediate School (Adel-‐De Soto-‐Minburn Community School District) and Van Meter Elementary School.
The Conservation Station will be a key component of this youth outdoor classroom day. Through fun, engaging hands-‐on activities, students will experience educational lessons on watersheds and the impacts of land management choices on soil and water quality. This event will utilize the educational materials developed for Badger Creek Lake, raising an appreciation for the watershed and local communities, while also raising awareness as to the water quality challenges faced in the watershed.
Ideally, there would be 5-‐6 different learning stations, each with its own presenter or team of presenters. Iowa Learning Farms will work with watershed coordinator Ben Gleason and conservation-‐minded partners to lead learning stations during the day-‐long event. Partners could include: Madison County Conservation Board, Madison County ISU Extension and Outreach personnel, local DNR/NRCS staff, local SWCD commissioners, local Farm Bureau personnel and the

12
Adel-‐De Soto-‐Minburn High School Ecology Club. Students would be divided into groups to experience the many different learning stations. Student groups rotate to each of the learning stations, spending approximately 40 minutes at each stop, participating in activities such as nature hikes/scavenger hunts, fish species identification, birds and furs, geocaching, tree planting and water quality monitoring.
Time Frame First Quarter Activities • Create website
• Finalize logo design • General project information brochure • Introduce photography contest • Utility bill/church bulletin fact sheet #1
Spring/Summer Quarter Activities
• Kick-‐off event for residents (community picnic) • Local IOWATER introductory workshop • Watershed boundary signs • Sequential roadside signs • Utility bill/church bulletin fact sheet #2
Summer Quarter Activities • Iowa Learning Farms field day • Yard signs • Utility bill/church bulletin fact sheet #3 • 5/10K fun run at the lake
Fall/Winter Quarter Activities • Yard signs • Utility bill/church bulletin fact sheet #4 • Youth outdoor classroom (Oct) • Closing event for residents

13
WATER ISSUES IN IOWA Badger Creek Lake Watershed Survey Results
Introduction This document reports the results of a survey conducted for the Community Assessments: Key Components to Successful Community-‐based Watershed Improvement Project. This project is a collaboration between Iowa State University Extension and the Badger Creek Watershed group. Funded by Badger Creek Lake Watershed planning group and Iowa Department of Natural Resources Section 319 funds, the purpose of this project is to develop and test a community assessment tool that can be used by watershed action teams and coordinators to better understand the community understanding of watersheds. Effective community assessments will allow watershed groups to develop goals, outreach and education regarding water quality challenges based on the values of the people living in the watershed. The survey was based on a water issues survey that was administered to the four states in the Heartland Region in 2007. Using a similar survey, local watershed groups are able to compare their findings to the statewide findings. Badger Creek Lake Watershed has 356 residents. The watershed coordinator provided a complete watershed mailing list and we sent surveys to all 356 residents. The survey was conducted using a modified Dillman Tailored Design Method. A four-‐step process was followed consisting of 1) the watershed group announced the survey in their newsletters that goes out to all residents in the watershed; 2) a first mailing of survey and cover letter explaining the purpose of the survey; 3) a reminder postcard sent two weeks later to non-‐respondents; and 4) a second mailing of the survey to remaining non-‐respondents. Of the 356 surveys that were mailed, 7 were undeliverable, and 117 were completed and returned. As a result, the overall response rate was 34 percent. While this rate of response is lower than what was hoped for, the sample size is large enough to facilitate statistical analyses. Response rates are more important when the purpose of the survey is to measure effects or make generalizations to a larger population. However, it is less important if the purpose is to gain insight and direction for outreach and education as in the case in the community assessment survey. This report presents the tabulated results of the surveys. The tables present the questions and response categories as they were presented in the surveys. The number of responses for each question or question item is provided in parentheses.

14
1. What is the best definition of a watershed? (CHECK ONE BOX) (n=112)
All
A structure that stores water 2%
An area of land that drains to a common body of water 85%
A basin to hold extra water to prevent flooding 11%
An underground water supply 2%
Water Issues (CHECK THE BEST ANSWER, UNLESS MULTIPLE ANSWERS ARE INDICATED.)
2. Where do you get your drinking water? (CHECK ALL THAT APPLY)
All
Well (individual well or well that serves fewer than 15 residences) (n=34) 29%
Rural water system (n=94) 80%
River, stream, pond, or lake (individual system) (n=1) 1%
City water system (n=9) 8%
Purchase bottled water (n=7) 6%
Produce own with reverse osmosis (RO) system (n=4) 3%
Don’t know (n=0) 0%
3. Do you feel that your home drinking water is safe to drink? (n=116)
All
Yes 95%
No 5%
4. In your opinion, what is the quality of groundwater (sources of well water) in your area? (n=116)
All Non-‐Farming Farming
Good 41% 37% 46%
Fair 28% 29% 29%
Poor 12% 10% 15%
Don’t know 19% 24% 10%

15
5. In your opinion, what is the quality of surface waters (rivers, streams, lakes) where you live? (n=117)
All Non-‐Farming Farming
Good 23% 20% 29%
Fair 43% 45% 37%
Poor 22% 25% 19%
Don’t know 12% 10% 15%
6. Do you know of or suspect that any of the following conditions are affecting water quality in your area?
All Non-‐Farming Farming
High bacteria counts (n=111)
Know 7% 4% 10%
Suspect 27% 28% 27%
Not a Problem 23% 21% 28%
Don’t know 43% 47% 35%
Fertilizer/nitrates (n=117)
Know 14% 15% 12%
Suspect 47% 51% 39%
Not a Problem 14% 8% 24%
Don’t know 25% 26% 25%
Heavy Metals (e.g., lead, arsenic) (n=110)
Know 0% 0% 0%
Suspect 10% 10% 10%
Not a Problem 28% 21% 44%
Don’t know 62% 69% 46%
Hardness (e.g., calcium, other minerals) (n=112)
Know 33% 31% 34%
Suspect 27% 25% 32%
Not a Problem 12% 12% 12%
Don’t know 28% 32% 22%

16
Pesticides (n=115) All Non-‐Farming Farming
Know 9% 8% 10%
Suspect 38% 44% 29%
Not a Problem 15% 13% 20%
Don’t know 38% 35% 41%
Animal waste (n=115)
Know 11% 10% 12%
Suspect 30% 35% 22%
Not a Problem 27% 20% 42%
Don’t know 32% 35% 24%
Septic Systems (n=112)
Know 3% 4% 0%
Suspect 18% 15% 25%
Not a Problem 41% 35% 53%
Don’t know 38% 46% 22%
Pharmaceuticals (i.e. antibiotics, personal care products) (n=111)
Know 1% 0% 2%
Suspect 14% 16% 10%
Not a Problem 35% 32% 40%
Don’t know 50% 52% 48%
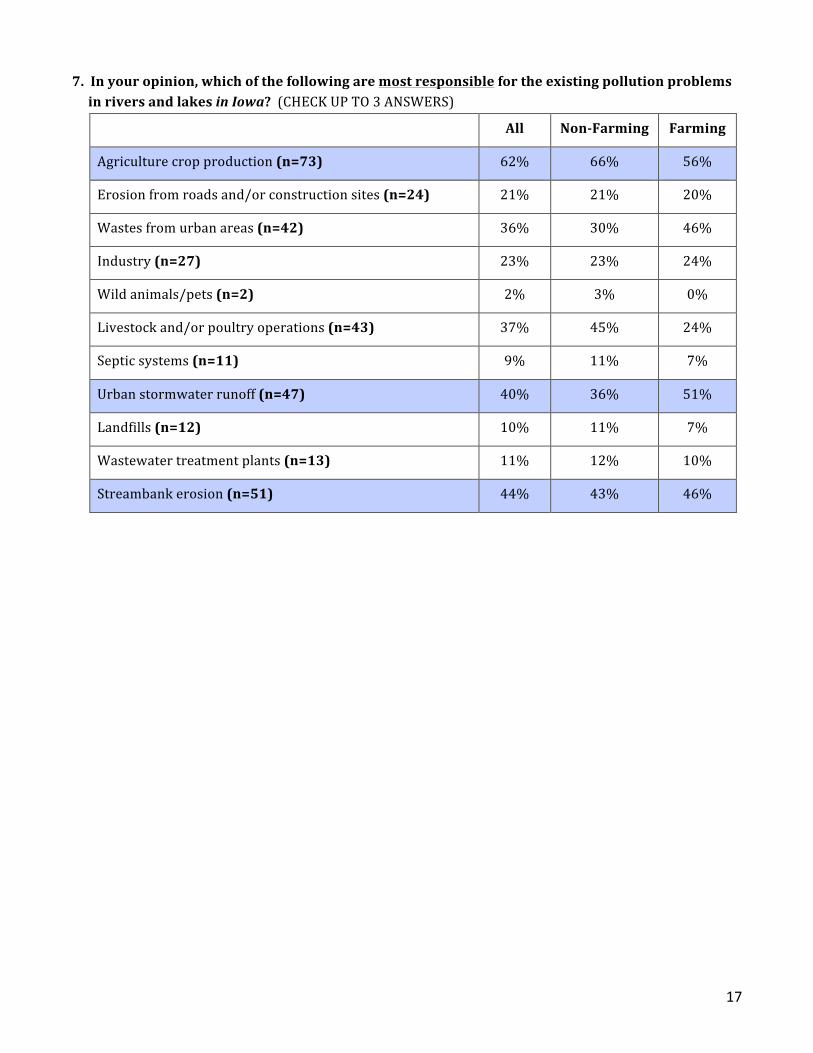
17
7. In your opinion, which of the following are most responsible for the existing pollution problems in rivers and lakes in Iowa? (CHECK UP TO 3 ANSWERS)
All Non-‐Farming Farming
Agriculture crop production (n=73) 62% 66% 56%
Erosion from roads and/or construction sites (n=24) 21% 21% 20%
Wastes from urban areas (n=42) 36% 30% 46%
Industry (n=27) 23% 23% 24%
Wild animals/pets (n=2) 2% 3% 0%
Livestock and/or poultry operations (n=43) 37% 45% 24%
Septic systems (n=11) 9% 11% 7%
Urban stormwater runoff (n=47) 40% 36% 51%
Landfills (n=12) 10% 11% 7%
Wastewater treatment plants (n=13) 11% 12% 10%
Streambank erosion (n=51) 44% 43% 46%

18
8. In your opinion, which of the following are most responsible for the existing pollution problems in rivers and lakes in your watershed? (CHECK UP TO 3 ANSWERS)
All Non-‐Farming Farming
Agriculture crop production (n=82) 70% 74% 61%
Erosion from roads and/or construction sites (n=28) 24% 23% 22%
Wastes from urban areas (n=11) 9% 8% 12%
Industry (n=6) 5% 6% 2%
Wild animals/pets (n=6) 5% 7% 2%
Livestock and/or poultry operations (n=41) 35% 40% 29%
Septic systems (n=19) 16% 18% 15%
Urban stormwater runoff (n=14) 12% 12% 12%
Landfills (n=6) 5% 7% 2%
Wastewater treatment plants (n=7) 6% 8% 2%
Streambank erosion (n=56) 48% 44% 56%
9. Do you know where water goes that falls onto your land or yard? (CHECK ALL THAT APPLY)
All
Storm drain and then straight to the river (n=3) 3%
Directly into a nearby creek (n=71) 61%
Roadside ditch and then stream or river (n=63) 54%
It gets absorbed into the land (n=72) 62%
Don’t know (n=1) 1%

19
Soil Erosion Issues 10. Do you have any soil erosion on your property? (n=113)
All Non-‐farming Farming
None 20% 30% 3%
A little 51% 51% 67%
Moderate 23% 22% 25%
A lot 4% 4% 5%
Don’t know 2% 2% 0%
11. What are some of the ways that you try to prevent or fix soil erosion on your property? (CHECK ALL THAT APPLY)
All
Continuous no-‐till or strip-‐till (n=28) 24%
Leaving vegetation on the ground in garden (n=33) 28%
Following the natural contours of the land (either farmland or in landscaping) (n=46)
39%
Planted windbreaks (n=25) 21%
Grassed waterway or grass strip around garden (n=54) 46%
Placing mulch on all exposed soil on land (n=25) 21%
Use of native plantings to protect streambanks (n=22) 19%
Cover crops (n=17) 15%
We don't do anything (n=11) 9%
Not applicable (n=11) 9%

20
12. Have you or someone in your household done any of the following as part of an individual or community effort to conserve water or preserve water quality in the last five years? (CHECK ALL THAT APPLY)
All
Changed the way your yard is landscaped (n=28) 24%
Reduced your water consumption (i.e. stopped watering lawn) (n=35) 30%
Reduced your use of pesticides, fertilizers or other chemicals (n=32) 27%
Increased residue on row crop acres (n=26) 22%
Addressed erosion on your land (n=43) 78%
Pumped your septic system (n=34) 29%
Tested your drinking water (n=12) 10%
Other_______________________________________________________________

21
Governance 13. In your opinion, does the environment receive the right amount of emphasis from government and elected officials in your community? (CHECK ONE ANSWER) (n=116)
All Non-‐Farming Farming
Not enough emphasis is placed on environmental protection 41% 46% 32%
Environmental protection receives about the right amount of emphasis
29% 28% 32%
Too much emphasis is placed on environmental protection 10% 7% 17%
Don’t know 20% 19% 19%
14. In your opinion, who should be most responsible for protecting water quality in your community? (SELECT ONE) (n=111)
All Non-‐Farming Farming
Environmental Protection Agency (EPA) 2% 3% 0%
Natural Resources Conservation Service (NRCS) 7% 6% 10%
Iowa Department of Agriculture and Land Stewardship (IDALS)
3% 1% 5%
Iowa Department of Natural Resources (IDNR) 11% 14% 5%
Local Soil and Water Conservation District (SWCD) 21% 22% 16%
Your county, city, or town 4% 7% 0%
Individual citizens without land 1% 0% 0%
Landowners 38% 35% 46%
Don't know 13% 12% 18%
Other: All of the above 1% 0% 2.4%
Not EPA 1.7% 2.7% 0%
Not NRCS 1.7% 2.7% 0%
NRCS, IDALS 1% 0% 2.4%
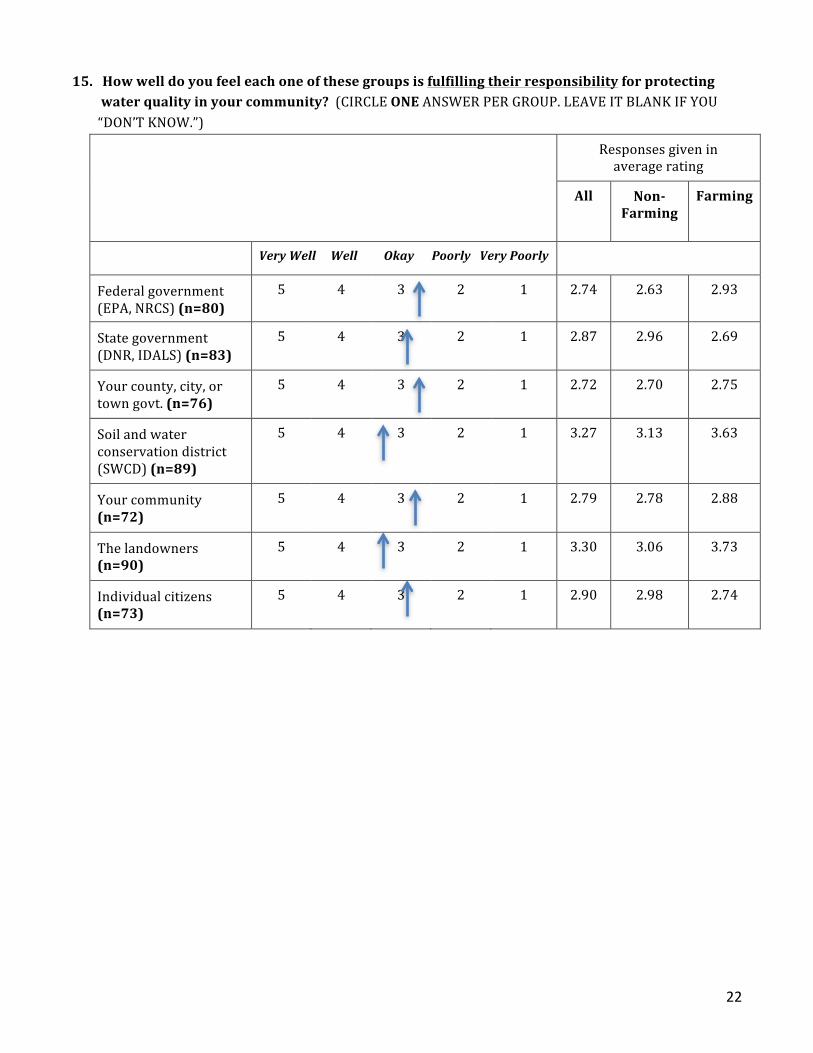
22
15. How well do you feel each one of these groups is fulfilling their responsibility for protecting water quality in your community? (CIRCLE ONE ANSWER PER GROUP. LEAVE IT BLANK IF YOU “DON’T KNOW.”)
Responses given in average rating
All
Non-‐Farming
Farming
Very Well Well Okay Poorly Very Poorly
Federal government (EPA, NRCS) (n=80)
5 4 3 2 1 2.74 2.63 2.93
State government (DNR, IDALS) (n=83)
5 4 3 2 1 2.87 2.96 2.69
Your county, city, or town govt. (n=76)
5 4 3 2 1 2.72 2.70 2.75
Soil and water conservation district (SWCD) (n=89)
5 4 3 2 1 3.27 3.13 3.63
Your community (n=72)
5 4 3 2 1 2.79 2.78 2.88
The landowners (n=90)
5 4 3 2 1 3.30 3.06 3.73
Individual citizens (n=73)
5 4 3 2 1 2.90 2.98 2.74

23
Water Quality Education 16. Have you received water quality information from the following sources? (CHECK ALL THAT APPLY)
All Non-‐Farming Farming
Television (n=37) 32% 29% 37%
Internet (n=29) 25% 23% 29%
Newspapers (n=43) 37% 36% 39%
Radio (n=29) 25% 18% 39%
Extension Service (n=46) 40% 30% 56%
Iowa Learning Farms (n=11) 9% 10% 10%
Universities (n=17) 15% 8% 27%
Schools (elementary and secondary) (n=2) 2% 3% 0%
Agricultural trade/commodity groups (n=20) 17% 11% 29%
Environmental agencies (government) (n=24) 21% 14% 32%
Environmental agencies (citizen groups) (n=12) 10% 14% 5%
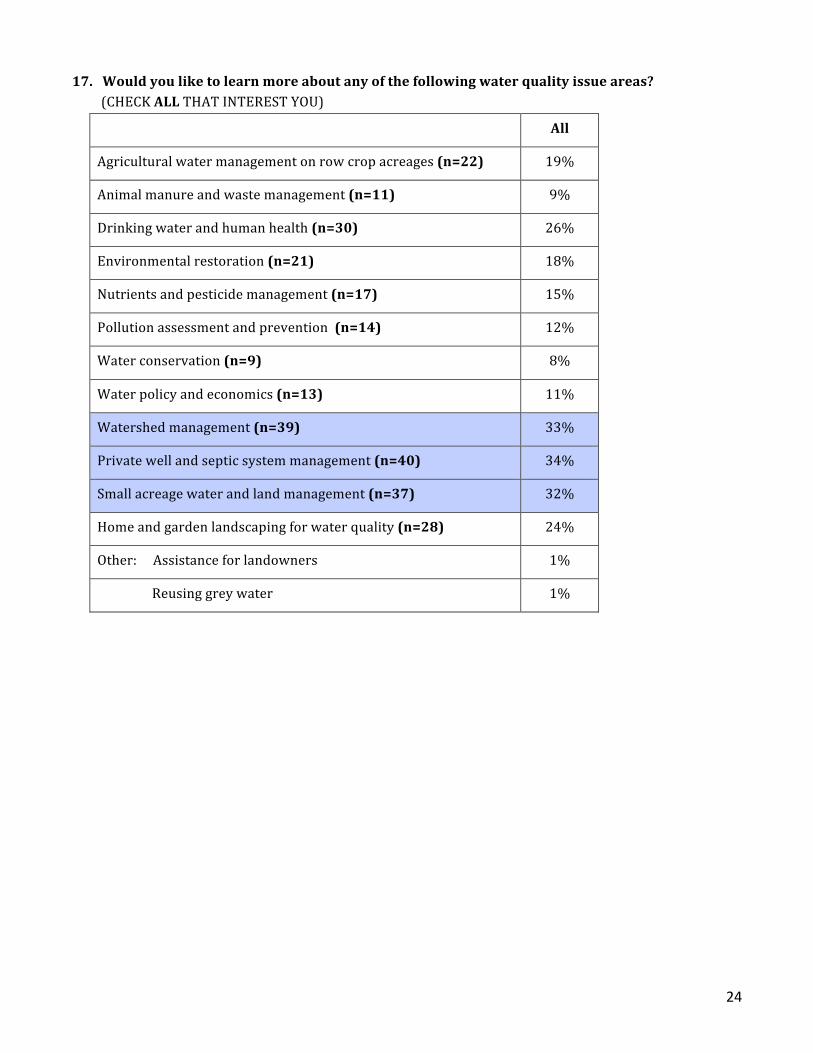
24
17. Would you like to learn more about any of the following water quality issue areas? (CHECK ALL THAT INTEREST YOU)
All
Agricultural water management on row crop acreages (n=22) 19%
Animal manure and waste management (n=11) 9%
Drinking water and human health (n=30) 26%
Environmental restoration (n=21) 18%
Nutrients and pesticide management (n=17) 15%
Pollution assessment and prevention (n=14) 12%
Water conservation (n=9) 8%
Water policy and economics (n=13) 11%
Watershed management (n=39) 33%
Private well and septic system management (n=40) 34%
Small acreage water and land management (n=37) 32%
Home and garden landscaping for water quality (n=28) 24%
Other: Assistance for landowners 1%
Reusing grey water 1%

25
18. Have you ever changed your mind about an environmental issue as a result of: (CHECK ALL THAT APPLY)
All Non-‐Farming Farming
News coverage (TV, newspapers, Internet, etc.) (n=28) 24% 25% 24%
Field days (n=7) 6% 0% 17%
Conversations with other people (n=41) 35% 34% 39%
Attending public meetings or participating in volunteer activities (n=12)
10% 10% 12%
Classes or presentations (n=15) 13% 16% 7%
Speech by an elected representative (n=1) 1% 1% 0%
Firsthand observation (n=68) 58% 56% 63%
Financial considerations (n=13) 11% 10% 15%
Concern about the future for your children/grandchildren (n=41)
35% 36% 34%

26
19. Of the following kinds of learning opportunities available, which would you be most likely to take advantage of for water quality issues? (CHECK UP TO 3 ITEMS)
All Non-‐Farming Farming
Read printed fact sheets, bulletins, or brochures (n=79) 68% 69% 66%
Visit a website for information and tips (n=44) 38% 43% 32%
Look at a demonstration or display (n=37) 32% 23% 49%
Watch a video (n=25) 21% 18% 29%
Volunteer in a one-‐time learning activity (e.g. water monitoring, streamside restoration or education) (n=13)
11% 14% 7%
Take a course for certification or credit (n=10) 9% 12% 2%
Get trained for a regular volunteer position (e.g. as a watershed steward or a water quality monitor) (n=6)
5% 7% 2%
Ask for a home, farming, or workplace water practices assessment (n=16)
14% 14% 12%
Attend a fair or festival (n=20) 17% 22% 7%
20. Are you now participating, or have you participated in any of the following activities in the last five years? (CHECK ALL THAT APPLY)
All
Master Gardener program (n=4) 3%
Volunteer water quality monitoring (n=0) 0%
Lake or river protection groups (n=4) 3%
Town conservation commissions (n=1) 1%
Other water or environmental protection groups (n=10) 9%

27
Please answer the following as they pertain to you 21. Where do you live? (n=114)
All
Inside city limits, not engaged in farming 8%
Outside city limits, not engaged in farming 56%
Inside city limits, currently engaged in farming 3%
Outside city limits, currently engaged in farming 33%
22. Approximately what is the population of your community? (n=62)
Average 6069
23. How long have you lived in in your area? (n=114)
Average 27 years

28
24. To what extent are you currently active in your local community?
All
Frequent local shops and restaurants (n=104)
Never 4%
Sometimes 67%
Always 29%
Attend local sporting events (n=93)
Never 24%
Sometimes 64%
Always 12%
Active member of local church (n=96)
Never 30%
Sometimes 28%
Always 42%
Participate in local social clubs (n=81)
Never 54%
Sometimes 35%
Always 11%
Participate in environmental/garden club (n=74)
Never 86%
Sometimes 11%
Always 3%
Attend school events (n=93)
Never 30%
Sometimes 55%
Always 15%
25. What is your gender? (n=115)
All
Male 72%
Female 28%
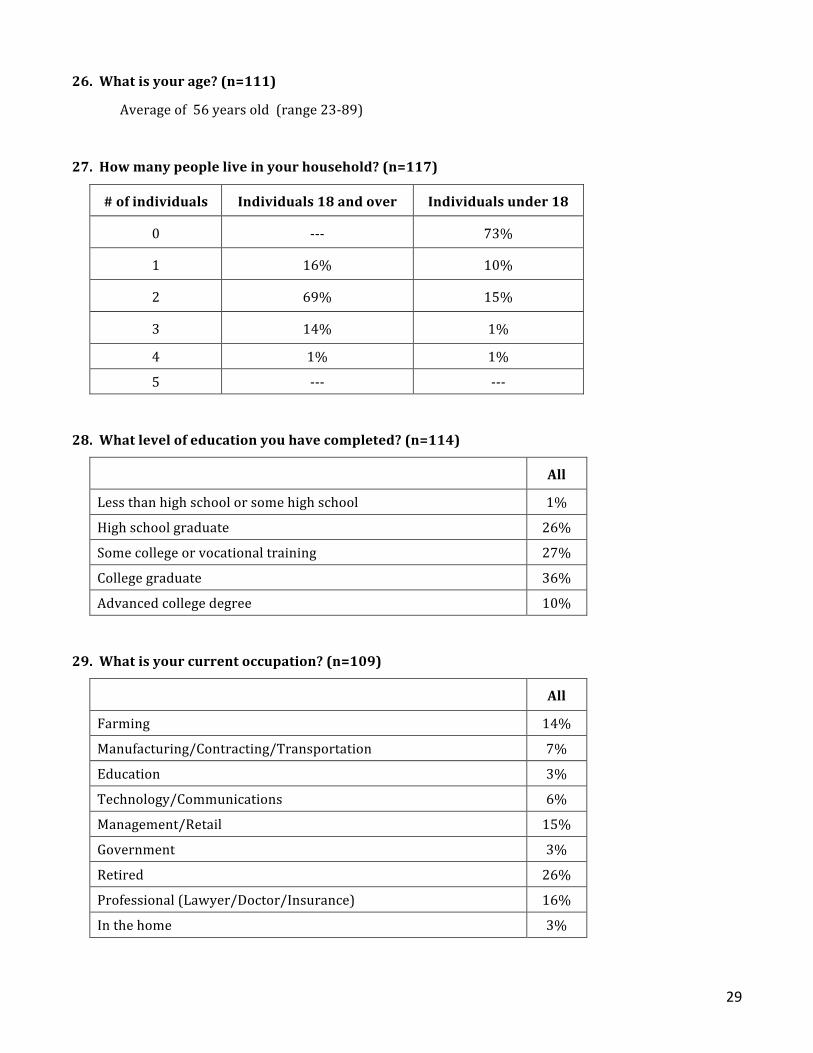
29
26. What is your age? (n=111)
Average of 56 years old (range 23-‐89)
27. How many people live in your household? (n=117)
# of individuals Individuals 18 and over Individuals under 18
0 -‐-‐-‐ 73%
1 16% 10%
2 69% 15%
3 14% 1%
4 1% 1%
5 -‐-‐-‐ -‐-‐-‐
28. What level of education you have completed? (n=114)
All
Less than high school or some high school 1%
High school graduate 26%
Some college or vocational training 27%
College graduate 36%
Advanced college degree 10%
29. What is your current occupation? (n=109)
All
Farming 14%
Manufacturing/Contracting/Transportation 7%
Education 3%
Technology/Communications 6%
Management/Retail 15%
Government 3%
Retired 26%
Professional (Lawyer/Doctor/Insurance) 16%
In the home 3%


![AND LITTLE RIVER WATERSHEDS, IOWA - USGS · AND LITTLE RIVER WATERSHEDS, IOWA ... Threemile Creek watershed • 8 Badger Creek watershed 8 ... £.QjfSa/IPO ML and cQ&Sa„P]E;](https://img.pdfslide.us/doc/110x75/5added367f8b9aa5088d8012/and-little-river-watersheds-iowa-usgs-little-river-watersheds-iowa-threemile.jpg)


![Badger Creek Lake - Iowapublications.iowa.gov/4707/1/badger[1].pdf · · 2012-11-12For years, Badger Creek Lake has been a source of pride for people living and farming nearby](https://img.pdfslide.us/doc/110x75/5b050c4c7f8b9a3c378e85a2/badger-creek-lake-1pdf2012-11-12for-years-badger-creek-lake-has-been-a-source.jpg)