Embed Size (px)
Citation preview
Resmech. Vol. 37. No. 10. pp. lSl3--Lq4l, tgq0. 0lq6,-014qvq0 S3,00 ÷ 0.00
Bacterial transformations of inorganic nitrogen in the oxygen- deficient waters of the Eastern Tropical South Pacific Ocean
F. LIPSCHULTZ,*t S. C. WOFSY,* B. B. WARD,~: L. A . CODISPOTI,§
G . FRIEDRICH§ a n d J . W. ELKINS[[
(Received 20 March 1989; in revised form 28 March 1990; accepted 9 April 1990)
Abstract--Rates of transformations of inorganic nitrogen were measured in the low oxygen, subsurface waters (50--450 m) of the Eastern Tropical South Pacific during February 1985, using 15N tracer techniques. Oxygen concentrations over the entire region were in a range (O 2 < 2.5/aM) that allowed both oxidation and reduction of nitrogen to occur. A wide range of rates was observed for the lowest oxygen levels, indicating that observed oxygen concentration was not a primary factor regulating nitrogen metabolism. High values for subsurface metabolic rates correspond with high levels for surface primary production, both apparently associated with mesoscale features observed in satellite imagery and with mesoscale features of the current field.
Measured rates of nitrate reduction and estimated rates of denitrification were sufficient to respire nearly all of the surface primary production that might be transported into the oxygen- deficient zone. These results imply that the supply of labile organic material, especially from the surface, was more important than oxygen concentration in modulating the rates of nitrogen transformations within the low oxygen water mass of the Eastern Tropical South Pacific.
The pattern of nitrite oxidation and nitrate reduction activities in the oxygen minimum zone supports the hypothesis (ANDEaSON et al., 1982, Deep-Sea Research. 29, 1113-1140) that nitrite, produced from nitrate reduction, can be recycled by oxidation at the interface between low and high oxygen waters. Rates for denitrification, estimated from nitrate reduction rates, were in harmony with prcvious estimates based on electron transport systcm (ETS) measurements and analysis of the nitrate deficit and water residence times.
Assimilation rates of NH~" were substantial, providing evidence for heterotrophic bacterial growth in low oxygen waters. Ambient concentrations of ammonium were maintained at low values primarily by assimilation: ammonium oxidation was an important mechanism at the surface boundary of the low oxygen zone.
I N T R O D U C T I O N
OXYGEN deficient pelagic waters are important sites for loss of fixed nitrogen (denitrifica- tion) from the world's oceans (CODlS~ and PACKARD, 1980; HATrORt, 1983;
*Center for Earth and Planetary Physics, Harvard University, Cambridge, MA 02138, U.S.A. t Present address: Bermuda Biological Station for Research. Ferry Reach, GE01, Bermuda. ~:lnstitutc of Marine Sciences, University of California, Santa Cruz, CA 95064, U.S.A, §Monterey Bay Aquarium Research Institute. Pacific Grove, CA 93950. U.S.A. [[National Oceanic and Atmospheric Administration, Boulder, CO 80303, U.S.A.
1513
1514 F. LII"SCHULrZ et al.
CoDmPo'n and CHRISTENSEN, 1985; CoomPort et al. 1986). Recent estimates of the production and loss rates of fixed nitrogen suggest that the oceanic inventory is declining (HArroRi, 1983; CODmPOT| and CHaISTENSEN, 1985; CHamTENSEN et aL, 1987), with possible implications for global climate (McELaog, 1983). Oxygen-deficient pelagic regimes also may be significant global sources of nitrous oxide (N20) (CoDISPOTI and CHRISTENSEN, 1985) and hence affect the radiative budget of the earth (YuNc et al., 1976) and the chemistry of the stratosphere (CRu'rZEN, 1970).
The factors affecting rates of nitrification (ammonium oxidation and nitrite oxidation) and denitrification must be understood to assess the role of denitrification regimes in oceanic nitrogen cycling (ANDERSON et al., 1982; LIu and KaPtAN, 1984). The extremely low oxygen levels (O: < 2.5/~M) in the Eastern Tropical North Pacific (CoolsPorl and RICHARDS, 1976), the Eastern Tropical South Pacific (WOOSTER et al., 1965; FIADEIRO and STRICKLAND, 1968; CDDmPOT! and PACKARD, 1980), and the Arabian Sea (DEUSER et al., 1978; WAJm et al., 1982; NAQVl, 1987) are associated with profound shifts in the metabolism of the microbial community. As concentrations of oxygen decline, rates of aerobic respiration decrease, and respiration of oxidized nitrogen (nitrate reduction and denitrification) increases, Oxidation of ammonium and nitrite by chemoautotrophic nitrifying bacteria should decline as oxygen values approach zero. Oxidation and re- duction of nitrogen therefore might be expected to occur together under some conditions, since the oxygen content of these waters typically lies in the transition between inhibition and activation for these processes (CARLUCCl and MCNALt, Y, 1969; CoolsPorl and PACK- ARD, 1980).
The potential interaction between nitrification and denitrification within pelagic oxygen-deficient zones has been the focus of conceptttal (CoDISPOT! and CHRISTENSEN, 1985) and numerical (ANDERSON et al. , 1982) modcls of nitrogen cycling. CoDmPOrt and CHRIS'tENSt~N (1985) discusscd the coupling of nitrification and dcnitrification through thc common intermediate, NzO, and potential ramilications for estimated rates of dcnitrilica- tion. ANDERSON et al. (1982) envisioned a cycle in which some fraction of thc nitrite produced by bacterial respiration of nitrate in the core of the deep nitrite maximum could diffuse to the boundaries of the oxygen minimum zone where it was oxidized back to nitrate. Nitrate from aerobic waters also could diffuse into the oxygen minimum zone to complete the cycle. Some of the organic matter in the oxygen minimum zone could therefore be oxidized without loss of fixed nitrogen.
Evaluation of the interaction of nitrification and denitrification under low oxygen conditions in pelagic waters has been inhibited by lack of suitable direct measurements of rates of nitrate respiration in pelagic denitrification regimes. The experimental conditions used in early studies (GoERtNG, 1968; GOER~NG and CLINE, 1970) were unrealistic, especially the very long incubation times employed. There has been relatively little work in the laboratory to define the activity of denitrifiers in the range of low oxygen conditions typical of the Peru region. The shift from oxygen to nitrate respiration in culture (OZRETICH, 1976; DEVOL, 1978) or in experiments with sediments (JORGENSEN etal . , 1984) takes place in the range of 0.25-10uM O 2. Recently, HERNANDEZ and Rowe (1987) reported that nitrate reduction by bacteria in cultures was more sensitive to increased oxygen levels than was nitrite reduction. ROBEaTSON and KUENEN (1984) have taken issue with the idea that very low oxygen concentrations are required for denitrification, presenting evidence that metabolic capability for aerobic denitrification is more wide- spread than previously supposed.
Bacterial transformations of inorganic nitrogen 1515
CAm, UCCl and MCNALLY (1969) suggested tl'lat nitrification can proceed at the oxygen levels characteristic of most pelagic denitrification zones, i.e. that nitrogen would simultaneously be oxidized and reduced. Laboratory studies of ammonium oxidizing bacteria by GOREAU et al. (1980) and H'tNES and K,~OWLES (1984) reported half saturation (Km) values of 5/~M O z. and JORGENSEN et ai. (1984) found nitrification activity in sediment slurries at levels as low as 1-2/~M 0 2. Oxidation of ammonium by nitrifiers therefore might be important in maintaining the low concentrations of ammonium found in these ecosystems (RtcHARDS, 1965) and could contribute to the observed concentration of nitrite. Other work. however, indicates much higher Km values for oxygen than those given above (STENSTROM and PODUSKA, 1980; HELDER and DEVRIES. 1983). The high nitrite concentrations observed in denitrification regimes (CoDtSPOTI and RICHARDS. 1976; WAJIH el al., 1982) have been attributed to a greater sensitivity to low oxygen levels by nitrite oxidizers than by ammonium oxidizers (STENSTROM and PODUSKA, 1980; HELDER and DE VRmS, 1983; HYNES and KNOWLES, 1984).
There have been few field studies of nitrification in suboxic subsurface waters (HASHt- MOlD et al.. 1983; WARD and ZAFIRIOU, 1988; WARD et al. , 1989a). HASHIMOTO et al. (1983) measured nitrification rates in the Cariaco Trench and found that nitrification proceeded to at least 61tM 02. WARD and ZAFIRIOU (1988) recently detected ammonium oxidation throughout the water column of the Eastern North Tropical Pacific, including the depth interval with oxygen concentrations below 101~M 02.
Our objective on the NITROP-85 cruise to the Eastern Tropical South Pacific (ETSP) during February 1985 was to study the interaction of nitrification and denitrification by making direct nlcasurcments of bacterially mediated nitrogen cycling in the oxygen- deficient pelagic watcrs, in conjunction with sensitive analysis of oxygen concentration. Four sites off the coast of Peru were examined using tSN tracers to measure the rates of dissimilatory nitrate reduction, ammonium oxidation, nitrite oxidation, ammonitxm regeneration and assimilation of inorganic nitrogen. Rate nleasuremcnts were conducted along thc ambient oxygen and nitrite gradients to define the role of oxygen concentration and other possible factors in controlling nitrogen metabolism. The vertical distribution of rates of nitrate reduction and nitrite oxidation were measurcd and compared to predic- tions of the recycling model of ANDERSON et al. (1982). Rates for nitrification wcrc examined to see if this process could play a role at low oxygen concentrations in the balance of oxygen, ammonium or nitrate.
METtlODS
General
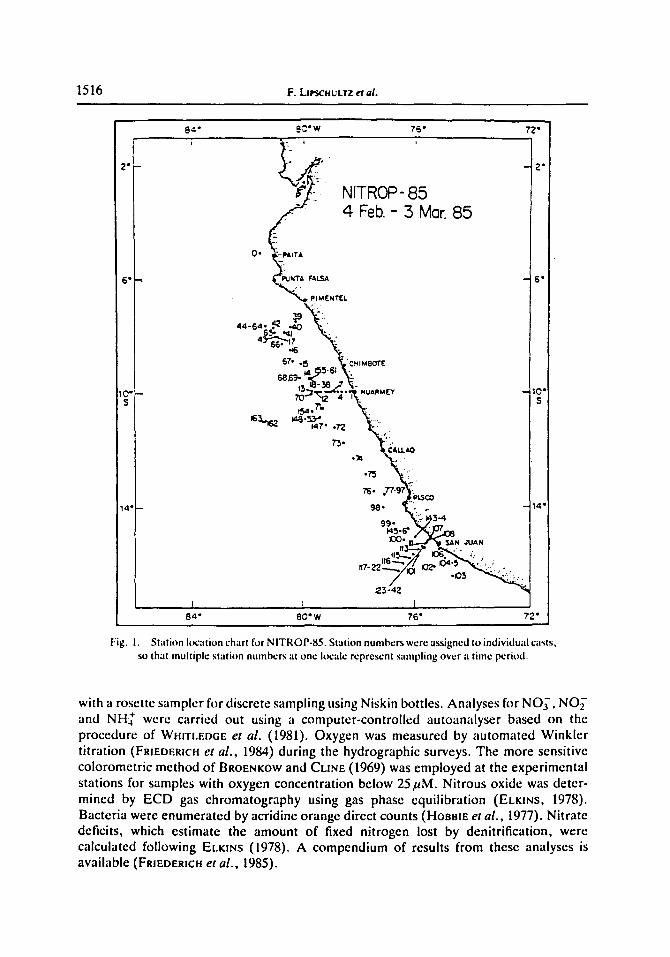
The cruise track (Fig. 1) consisted of a transect parallel to the coast from approximately 7 to 16°S, and two sections normal to the coastline, one at 10°S and another along the "'C'" line of the CUEA.program (RtCHARDS, 1981) at 15°S. The section at 10°S was chosen to sample the historical northern boundary of the oxygen-deficient waters containing the main secondary nitrite maximum (MSNM, CODtSPOTt and PACKARD, 198{I). Intensive sampling and rate measurements were carried out at four locations, 7"40'S (Stas 44--64), 9"31'S (Stas 18-38), 13"32'S (Stas 77 -97) and 15"20'S (Stas 123-142). Each of these sites was occupied for approximately 3 days.
Hydrographic data were collected by a CTD system (Neil Brown Instruments) equipped
1516 F.l.JPscxuLrz et at.
8~ • 9C'W 76" 72" - - I ~ . 6 l
2 ° - 2"
NITROP- 85 4 Feb.- 5 Mar. 85
o .
p %- .4-s4-" .ao~ I
6 7 . . 5 '~ CHrMeOTE
~'~"~--. i'~ ,U~UCV -- IO" I O ' - - 70" z2 4 ,,~.. S S t54,71. =
°72 , . ÷ .
°'~ ~
1 4 ° 9 8 ° . ' ~ , - - 1 4 "
99" b45-6"
~3-42 1 r I
84" 80"w 76" ?2"
Fig. 1. Station location chart for NITROP-85. St;ttion numbers were assigned to individual casts, so that multiple station numbers at one locale represent sampling over ,'t time period.
with a rosette sampler for discrete sampling using Niskin bottles. Analyses for NOy, NO~- and NHJ" were carried out using a computer-controlled autoanalyser based on the procedure of WmTLEOGE et al. (1981). Oxygen was measured by automated Winkler titration (FRmDEREH et al . , 1984) during the hydrographic surveys. The more sensitive colorometric method of BROENKOW and CaNE (1969) was employed at the experimental stations for samples with oxygen concentration below 25#M. Nitrous oxide was deter- mined by ECD gas chromatography using gas phase equilibration (ELKINS, 1978). Bacteria were enumerated by acridine orange direct counts (HoBBm et al . , 1977). Nitrate deficits, which estimate the amount of fixed nitrogen lost by denitrification, were calculated following ELtqr~s (1978). A compendium of results from these analyses is available (FRIEDERICH e t al . , 1985).
Bacterial transformations of inorganic nitrogen 1517
Sampling protocol
Profiles of nutrients and hydrographic parameters were obtained upon arrival at each station. Rate measurements were made on water samples acquired at depths selected to span the range of oxygen and nitrite levels at each site. Nutrient and oxygen levels were determined again immediately upon retrieval of a 30 liter Niskin bottle and prior to initiation of the tracer incubations. During the period required for these analyses (<30 min), three Pyrex jugs (4 liter) were flushed with dinitrogen gas to eliminate potential contamination with atmospheric oxygen. (Pyrex was chosen to eliminate diffusion of oxygen through the container walls.) The jugs were blackened to prevent inhibition of nitrification by light (OLsoN, 1981; WARD et al., 1984; LWSCnULTZ et al., 1985). Addition of 15NH~', t5NO~ or tsNO~ (>99 atom %) was made to separate jugs to achieve a 10% increase in ambient nutrient concentration. If the nutrient concentration was below detection limits (generally the case for N I ~ ) , the concentration of labeled nutrient was fixed at 0.05/aM. Water was then transferred from the Niskin bottle to the bottom of the jugs to minimize disturbance and mixing of the water with the overlying atmosphere of N2. The headspace of the Niskin bottle was filled with N 2 to prevent oxygen contamination. The jugs were capped with silicone stoppers fitted with two teflon tubes that permitted subsampling while controlling the oxygen level in the headspace. When not in use, the tubes were capped. After filling the jug, nitrogen in the headspace was flushed with an appropriate N2:O 2 mixture to poise the oxygen concentration in the sample at the in situ level.
A time series of four subsamples (l liter each) was taken from each label treatment, with time points at approximately 0.5, 4, 8 and 24 h. The subsamples were obtained by slightly pressurizing the hcadspace with the appropriate N2:02 mixture so that water was expelled through the tube reaching the base of the jug. The jugs were incubated at 12-14°C, comparable to in situ temperatures. Four depths were generally sampled each day.
A critical requirement for these incubation experiments was maintenance of the ambient oxygen levels. We verified control of the oxygen content of the incubating samples at the beginning and the end of the incubations by expelling a stream of sample from a 4 liter jug through a narrow tygon tube into a syringe filled from a "T" in the tube. The oxygen in the syringe was then quantified using the assay BROESKOW and CLISE (1969). Diffusion of oxygen through the wall of the tygon tube added a small ( - 1/aM), but quantifiable amount of oxygen to the sample drawn for verification. After correction for this effect, the data indicate that the in situ oxygen levels were maintained during the incubations. The time-course data for l~I transfer also indicated that oxygen contami- nation was minimal for most incubations (see below).
15N determinations
Each of the 1 liter subsamples was filtered through a 42.5 mm diameter, pre-combusted GF/F filter, and the filter frozen. The 1000 ml of filtrate was then partitioned for analysis of concentration and tSN content of NO~, NO~' and NH~'. Samples (100 ml) for lSNl-~ and tsNO~" analyses were frozen for later processing. Samples for nutrient analysis (50 mi for each time point from each tracer addition) were frozen until the end of the incubation and then were analysed in a group using the autoanalyser (FRIEDEPaCH et al., 1985) to maximize analytical precision.
The NO~- in 250 ml subsamples from the filtrate was extracted onboard ship using the

1518 F. Larscnvtrz etal.
azo dye complexation methods detailed in LIrSCHULTZ (1984). The recovered dye was stored in amber bottles at room temperature for isotopic analysis after the cruise. The nitrogen isotopic ratio of nitrate was determined using stored (frozen) water samples, following the procedures of LI~SCHULTZ (1984). Removal of pre-existing nitrite was accomplished by adding sulfamic acid (10/A saturated at 5°C) to each sample and adjusting the pH to 2.0. After a ! h reaction period, the pH was adjusted to 8.0 with a mixture of NaOH and carbonate buffer to permit efficient reduction of the NO~ to NO~ using copperized cadmium. The resulting nitrite (derived from N O ; in the sample) was then extracted by the azo dye procedure. The samples with added ~SNH~ were analysed using the indophenol protocol of DUDEK et al. (1986) with appropriate modifications for smaller sample size. The indophenol and azo dyes from each of these separations were dried and transferred onto 25 mm diameter, pre-combusted GF/C filters.
The filter for each isotopic analysis (particulate nitrogen, NH~, NO3 or NO.;-) was placed in a Vycor combustion tube, sealed under vacuum and the nitrogen converted to dinitrogen gas by Dumas combustion. The tSN/14N ratios were initially measured using a dual slit emission spectrometer that enabled precise analysis of samples containing as little as 10 -7 mol N in each tube (DPSCHULTZ, 1984). This low limit was necessary to analyse the small sample mass available after partitioning the water sample. Subsequently, the dual slit imaging system was replaced by a photodiodc array (OMA Ill, EG&G) permitting a 5- 10 fold improvement in sensitivity to changes in tSN/14N ratios (4-0.002 atom %). Sample tubes containing N 2 derived from NO;" and N O ; were analysed using both systems.
The mass of particulate nitrogen was measured as N z after the isotopic analysis by crushing the combustion tubes in the carrier stream (He) of a gas chromatograph equipped with a thermal conductivity detector and a molecular sieve (5A) column. The system was calibrated by direct injection of N2 (99.999%) or by combustion of known amounts of EDTA in our standard combustion procedure. Both calibration methods gave equivalent results.
Rates for ammonium oxidation, nitrate oxidation, dissimilatory nitrate reduction, Ni-I~" regeneration and assimilation of inorganic nitrogen (NH~, NOf and NO3) were calcu- lated by a least-squares analysis. A set of linear differential equations defining the nitrogen cycle in aerobic waters (LwsCHULrZ et al., 1986) was modified to include the loss of NOf to N 2. In finite difference form, this set of equations constituted a set of functions with adjustable parameters that could be fit to observed time courses of nutrient levels and isotopic content. Each function was weighted by the inverse of the estimated variance for the associated measurement. Rates reported below are based on functions fitted to at least three of the four time points in an incubation. This method of data analysis simultaneously incorporates the concentration and isotope ratio data from all three tracer additions, providing the "'best" internally consistent picture of the nitrogen transformations in each sample.
The set of equations allowed for variation in determinations of the mass of nitrogen, both total and tSN, through a combination of weighting functions and by permitting transformations that were not directly measured such as denitrification. For instance, a denitrification rate would be calculated if the observed decrease in nitrite concentration exceeded the sum of the measured rates by a margin determined by the weighting functions (variance). However, for the entire data set, the total tSN mass for each label varied over the time course by only 2.7% for tsNO; additions, 4.1% for IsNOf additions and 10% for =SNH~" additions. Little, if any, of the initial label of nitrogen was therefore

Bacterial transformations of inorganic nitrogen 1519
unaccounted for in our experiments. In addition, the measured value for the isotopic composition of the labeled species at the initial time point was quite close to the value calculated from the initial concentration and the label (100 4- 11% for NOf, 98 _+ 13% for NO~ and 106 __ 24% for NH~'). The loss of nitrogen to unknown pools that has been reported in studies of the euphotic zone (LAws, 1984; WARD et al., 1989b) was not encountered in the NITROP-85 data set.
The minimum detectable rates of nitrification and of dissimilatory nitrate reduction depend on the nitrite concentration in the sample. Since nitrite concentrations varied over the water column, the detection limit can best be stated as a maximum detectable turnover time for nitrite associated with a particular assay: 5 x 10³ days for ammonium oxidation and 103 days for dissimilatory nitrate reduction and nitrite oxidation. The limits differ due to the generally higher specific activity of the ammonium substrate. For example, if the NOr concentration were 1.0/~M, the minimum detectable rate for nitrite oxidation is 1.0 nM N d - t. The limit for assimilation of inorganic nutrients (using the less accurate dual slit spectrometer) corresponded to a turnover time of approximately 500 days in the particulate pool.
Acetylene block experiments
The acetylene block technique (FF.DEROVA et al., 1973; ELgiNS, 1978) was used to measure dcnitrification rates at eight stations along the transect at 10°S and at Sta. 115 (Fig. 1). Samples were taken from depths that exhibited low oxygen (by the Winkler method) and high concentrations of nitrite. For each depth, six Pyrcx bottles ( 100 ml) were filled by overflowing several volumes of water froth a 5 liter Niskin bottle to prevent oxygen contaminatkm. Acctylcne-saturatcd, oxygen-stripped water (5 ml) from the Niskin bottle was added to each bottle and the bottles were capped and incubated along with the tSN bottles. During the ensuing 24 h, the individual bottles were analysed for increases in N20 (ELKINS, 1978). The precision of these mcasuremcnts was +(I.5 nM N20.
Oxygen sensitivity
Wc tested the sensitivity of the microbial community to potential oxygen perturbations during the incubation procedures by comparing rates in samples from the upper oxycline, initially 2.5/~M 0 2, with rates from incubations either under a nitrogen atmosphere or under an atmosphere 5-fold higher in oxygen than the in situ level (Table 1). The rate of ammonium oxidation was not affected by the presence of additional oxygen, but under the nitrogen atmosphere the rate declined to about half of the in situ rate. Nitrite oxidation
Table 1. Effect o f ahered oxygen concentrations on rates o f nitrogen cycling
nM d -I (S.D.)
Rates of Rates of Rates of Rates of Oxygen ammonium ammonium nitrite nitrate
perturbation oxidation assimilation oxidation reduction
Control (2.51tM Oz) 257 (3) 64 (3) 889 (20) 171 (6) Decreased Oz (N,) 138 (4) 43 (2) 639 (18) 350(8) Increased O2(~20~uM) 255 (6) 56 (2) 812 (17) 43 (7)
1520 F. tarscxvLrZ a at.
rates reacted in a similar fashion. (The rates did not go to zero because the water did not reach equilibrium with the headspace.) These results suggest that nitrification activity during our incubations was relatively insensitive to possible small increases in oxygen.
The rates of dissimilatory nitrate reduction were more sensitive to small oxygen changes. The reduction in oxygen concentration produced a doubling of the in situ rate and the increase in oxygen caused a cessation of nitrate reduction after the first few hours of the incubation. Thus, if oxygen levels were to increase during our incubations due to atmospheric contamination, measured rates of dissimilatory nitrate reduction could potentially underestimate the in situ rates. Label transfer from NOj to NO~ in a few incubations (primarily at our first location, 9°31'S) declined dramatically over the time course in a manner similar to that found in the test where oxygen levels were enhanced. In the results that follow, the rates of nitrate reduction at these stations are therefore based only on the initial interval ( - 3 h) and we recognize that these rates may be lower than in situ values.
Finally, we found that all of the water sampling bottles (especially Go-Fio) had higher oxygen values than samples from the pump system and that the oxygen levels in the bottles also increased with time on deck. Any increase in oxygen would act to increase the measured nitrification rates so that in situ rates of oxygen consumption would have been lower than we estimate. However, as discussed above, experimentally increased oxygen concentrations had little effect on nitrification rates but did decrease rates of nitrate reduction.
RESULTS
Regional nutrient and hydrographic features
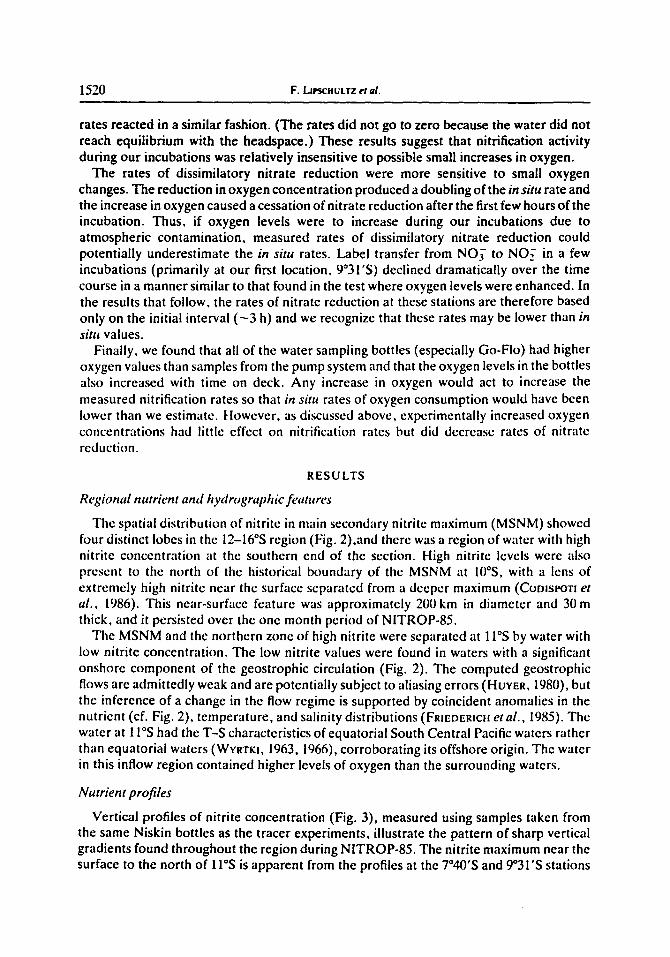
The spatial distribution of nitrite in main secondary nitrite maximum (MSNM) showed four distinct lobes in the 12-16°S region (Fig. 2),and there was a region of water with high nitrite concentration at the southern end of the section. High nitrite levels were also present to the north of the historical boundary of the MSNM at 10°S, with a lens of extremely high nitrite near the surface separated from a deeper maximum (CooISPOTI et al., 1986). This near-surface feature was approximately 200 km in diameter and 30 m thick, and it persisted over the one month period of NITROP-85.
The MSNM and the northern zone of high nitrite were separated at 11°S by water with low nitrite concentration. The low nitrite values were found in waters with a significant onshore component of the geostrophic circulation (Fig. 2). The computed geostrophic flows are admittedly weak and are potentially subject to aliasing errors (How~, 1980), but the inference of a change in the flow regime is supported by coincident anomalies in the nutrient (cf. Fig. 2), temperature, and salinity distributions (F~mDERICa et al., 1985). The water at 11°S had the T-S characteristics of equatorial South Central Pacific waters rather than equatorial waters (WY~T~I, 1963, 1966), corroborating its offshore origin. The water in this inflow region contained higher levels of oxygen than the surrounding waters.
Nutrient profiles
Vertical profiles of nitrite concentration (Fig. 3), measured using samples taken from the same Niskin bottles as the tracer experiments, illustrate the pattern of sharp vertical gradients found throughout the region during NITROP-85. The nitrite maximum near the surface to the north of 11*S is apparent from the profiles at the 7040'S and 9"31'S stations
Bacterial transformations of inorganic nitrogen 1521
( Q ) 7~j~'~ 8e~" ~ I0°01"~ I leOg'~ l~l ' l '~ I]~"~'S 1.11't'~.'.'.'.'.'.'.'.'.~ 15"¢1"~ # ~ ,le67 11'7'0 # 7"d #74 #76 ~ #lOI #103
0 . ' t L , t t , t , t , t • I,.
so ~ ; i 100.
150. "-=.-"
200.
°°2 450. - ' - - -
500. /
550.
50.
~00.
ISO. ~ ~ o . J /
~ 200 . E
v 250. t -
E2. ~00. i i
~ 0 . " 0
400. ' (
4,50. o
500. F
~ 0 . 1 "r 0.00 ~I0 ° 2".0 ~I02 500 ~10 z 7.t~TC z I ~O',,IG -~ I 7.'. ,~C 3
Alongshore Dis::nce (kin) Fig. 2. (a) Contour of nitrite concentrations parallel It) the coastline of Peru. The 4j~M contour is emphasized. Sampling depths are indicated by a mark. (b) Geostrophic currents (cm s -t ) on the alongshore section. The dynamic height calculations were made by G. Friederich and are based on a 545 m reference level. Solid lines represent onshore flow and dashed lines with negative numbers
represent offshore flow. Distance is relative to Sta. 64.
(Fig. 3). Concentrations in both surface and the deep nitrite layers were larger at 9°31 'S than at 7"40'S. Both stations to the south of 1 I°S exhibited an extremely sharp vertical nitrite gradient at the upper boundary of the MSNM.
Oxygen concentrations were quite low, commonly below 2.5/~M Oz (< 1% saturation), with little detectable variation throughout much of the water column. Vertical gradients near the surface were extremely sharp (Fig. 3), as for NO~. The nitrite maxima were completely confined within the bounds of the low oxygen waters. Oxygen levels were similar to those reported for the core of the oxygen-deficient zone in the Eastern Tropical North Pacific (CuNE and RICHARDS, 1972; CODISPOTI and RJCHARDS, 1976).

1522 F. LIPSCHt,'LTZ et al.
Nitrite (I.tM) - . -
0 2 4 6 II 10 0 2 • 6 $ ~0 O" O E " ' - • -
°.°.°..4 ~ 100' 7"40' S 100
'°° '°°I
4o0 40oi /
500 5001
600" 600 i . . . . . 0 5 10 15 20 25 5 TO 15 20 25
g Q . (I) 2 4 6 6 10 0 0 2 • 6 8 ~0
100 100
:300 300
400 4 0 0 i ~ . o
~00 500
" 600 ' ' ' ' S°°o ~ 1o I'~ 20 2s o 5 ~o IS 20 2s
O x y g e n (I.tM) ---
Fig. 3. Depth profiles of nitrite (--O--) and oxygen (----0---) concentration at the four experimen- tal sites. Data are for samples from the same Niskin bottle as the tSN incubation samples. representing a sequence of separate casts. Oxygen concentrations were measured using the
colorimetrie method (BkoENKOW and Cu~E, 1969).
Nitrogen tran.~formations
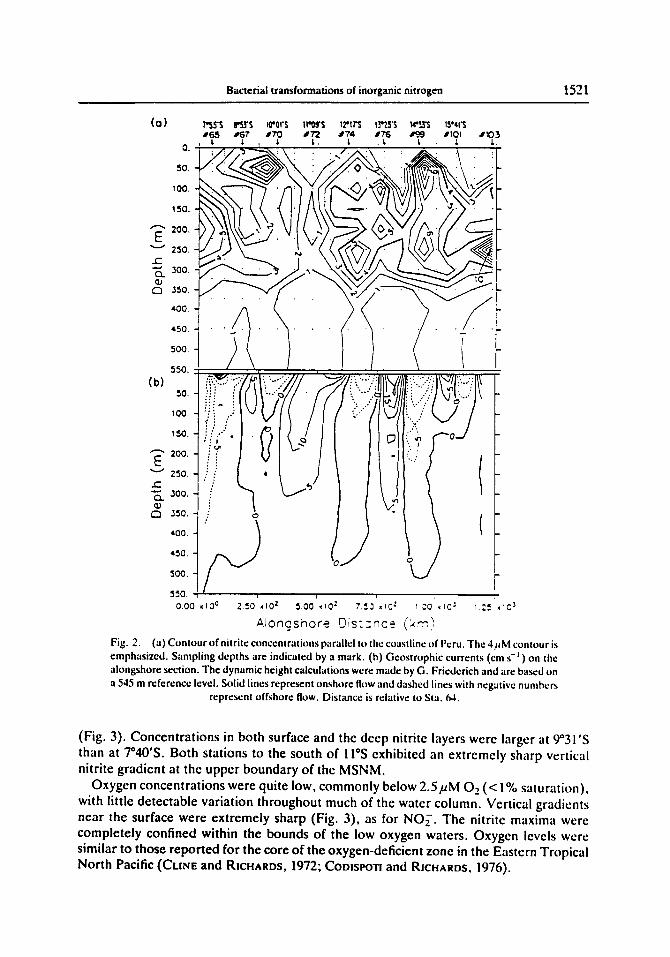
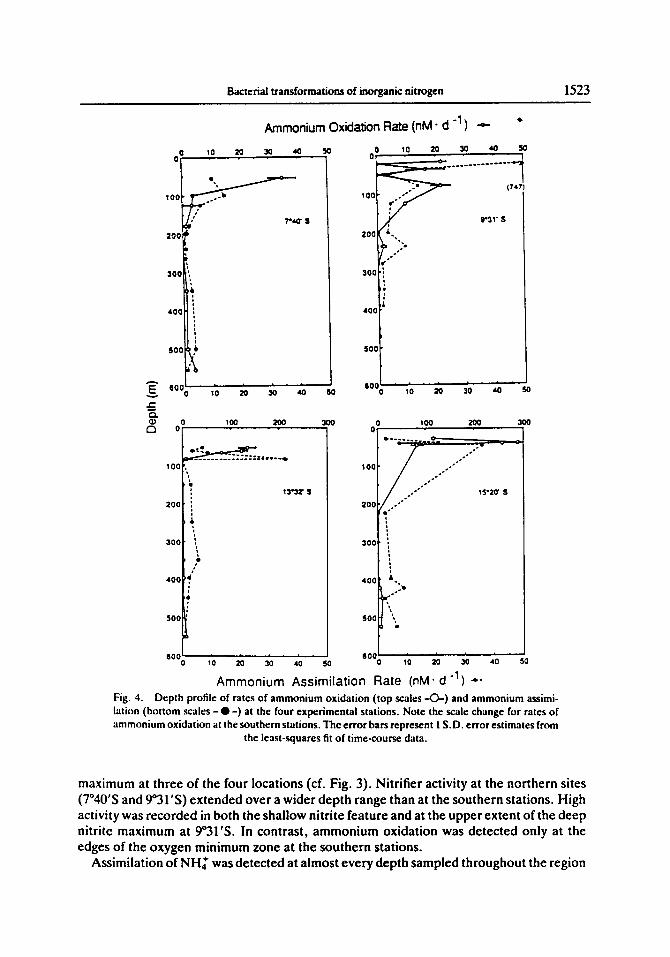
Rates for oxidat ion o f a m m o n i u m (Fig. 4) were highest near the top o f the oxygen m i n i m u m z o n e , decreased dramatical ly in the core and increased slightly at the base. M a x i m u m rates o f a m m o n i u m oxidat ion were located i m m e d i a t e l y a b o v e the d e e p nitrate
Bacterial transformations of inorganic nitrogen 1523
Ammonium Oxidation Rate (nM- d -1 ) .4_ - 10 20 30 40 SO 0 10 20 3O 40 S0 00 T
" 17471 100 100
=oo I 2oo1= >'t'" .-'" :.
300i i 300
4 0 0 1 400
S O 0 ~ SO0
. . . . . . . . . . . . . . 60~, i 6 - "E 6000 ~0 20 30 40 50 10 20 30 40 so v t.- (3. qJ 0 'tO0 200 300 0 100 200 300
o o
~ = a e . o . o °"" I 00 t 0,0 .-'°"
13"32' S 200 200Ii..""
300~ •: 300[ i
400 400 ;~ ~4
500 500
' , 600 e°°o ~o ~ 3o 40 so o ~o 2o 30 ,o 5o A m m o n i u m Ass im i l a t i on Rate (nM" d -1 ) ~,.
Fig. 4. Depth profile of rates of ammonium oxidation (top scales - O - ) and ammonium assimi- lation (bottom scales - • - ) at the four experimental stations. Note the scale change for rates of ammonium oxidation at the southern stations. The error bars represent 1 S.D. error estimates from
the least-squares fit of time-course data.
maximum at three of the four locations (cf. Fig. 3). Nitrifier activity at the northern sites (7°40'S and 9°31'S) extended over a wider depth range than at the southern stations. High activity was recorded in both the shallow nitrite feature and at the upper extent of the deep nitrite maximum at 9°31'S. In contrast, ammonium oxidation was detected only at the edges of the oxygen minimum zone at the southern stations.
Assimilation of NH~" was detected at almost every depth sampled throughout the region
1524 F. [Jrscnut= eta/.
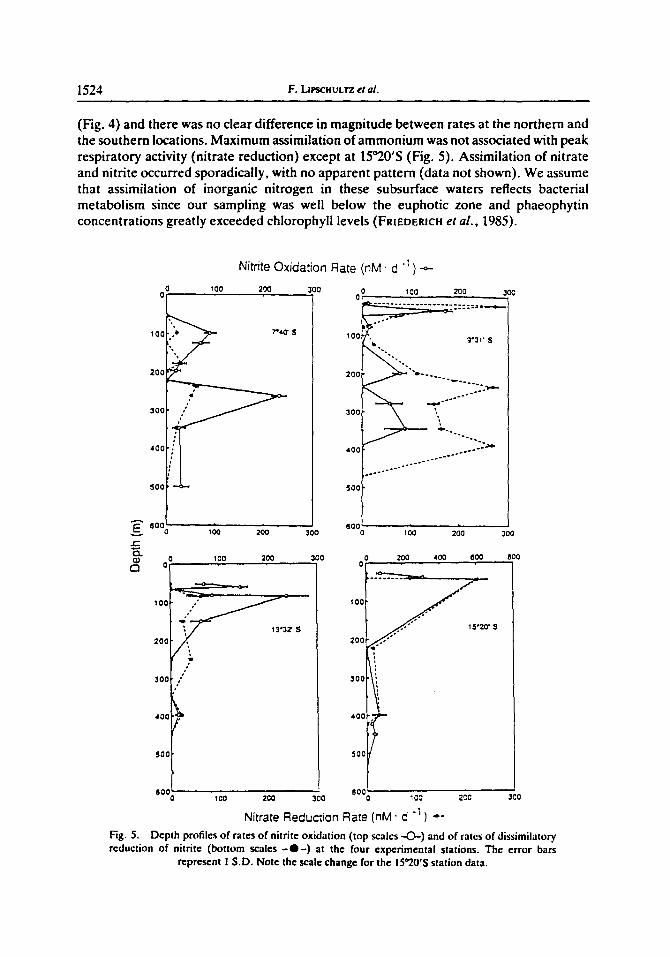
(Fig. 4) and there was no clear difference in magnitude between rates at the northern and the southern locations. Maximum assimilation of ammonium was not associated with peak respiratory activity (nitrate reduction) except at 15°20'S (Fig. 5). Assimilation of nitrate and nitrite occurred sporadically, with no apparent pattern (data not shown). We assume that assimilation of inorganic nitrogen in these subsurface waters reflects bacterial metabolism since our sampling was well below the euphoric zone and phaeophytin concentrations greatly exceeded chlorophyll levels (FRIEDERlCH et al., 1985).
Nitrite Oxidation Rate (nM. d -1 ) - o -
0 ~ O0 200 300 0 I O0 2~0 300
100 7"40' $
2OO -::::::.,-. , . . ~ 4 " o "
30¢ ' i ~ 300 . ~ ',
40¢ 400 ...... -2"~"
°..o..°..°.°-°-'"'"' 50(: 500
F: 6oc ~oo 2oo 30o eoo ~oo 2oo 3oo
0 200 400 600 ,800 00 1oo 20.,.~0 300 O I " ~ . . . .
I",1 /
100~' 300p,
400~p~ 4o01 --
500[ 5001
600 600' 0 ~00 2¢0 300 ~0 2CC 300 Nitrate Reduction Rate (nM. d -I ) + .
Fig. 5. Depth profiles of rates of nitrite oxidation (top scales --O-) and of rates of dissimilatory reduction of nitrite (bottom scales - O - ) at the four experimental stations. The error bars
represent I S.D. Note the scale change for the 15~20'S stalion data.
Bacteri',d transformations of inorganic nitrogen 159,25
Nitrite oxidation rates (Fig. 5) exceeded ammonium oxidation rates (Fig. 4) at all four stations. The maximum rate for nitrite oxidation occurred slightly deeper in the water column than the maximum for ammonium oxidation. The peak rate for nitrite oxidation coincided with the shallow nitrite maximum at the northern locations and with the surface nitrite maximum at the southern stations. In the core of the oxygen minimum zone, rates were still quite high at the two northern stations.
Rates for dissimilatory reduction of nitrate to nitrite (Fig. 5) correlated closely with the concentration of nitrite (Fig. 3). Northern stations showed multiple peaks over the depth range of the oxygen minimum zone. Extremely high rates of reduction of nitrate were found at the shallow nitrite feature at 9°31'S and at the surface extent of the MSNM at 15°20'S [also quite close to the surface (50 m)]. High rates of nitrate reduction and nitrification in the near-surface nitrite feature (19m) were observed again when we returned to the 9°31'S station after a one-month interval. The association between high rates of nitrate reduction and peak concentrations of NO~, the product of this reaction, point toward nitrate reduction as the dominant source of NO~ in many parts of the water column.
Attempts to measure denitrification using the acetylene block technique failed to detect any excess N20 in 26 incubations at 10°S and at 15°S (Sta. 115).
DISCUSSION
The role of oxygen in regulating redox metabolism of nitrogen
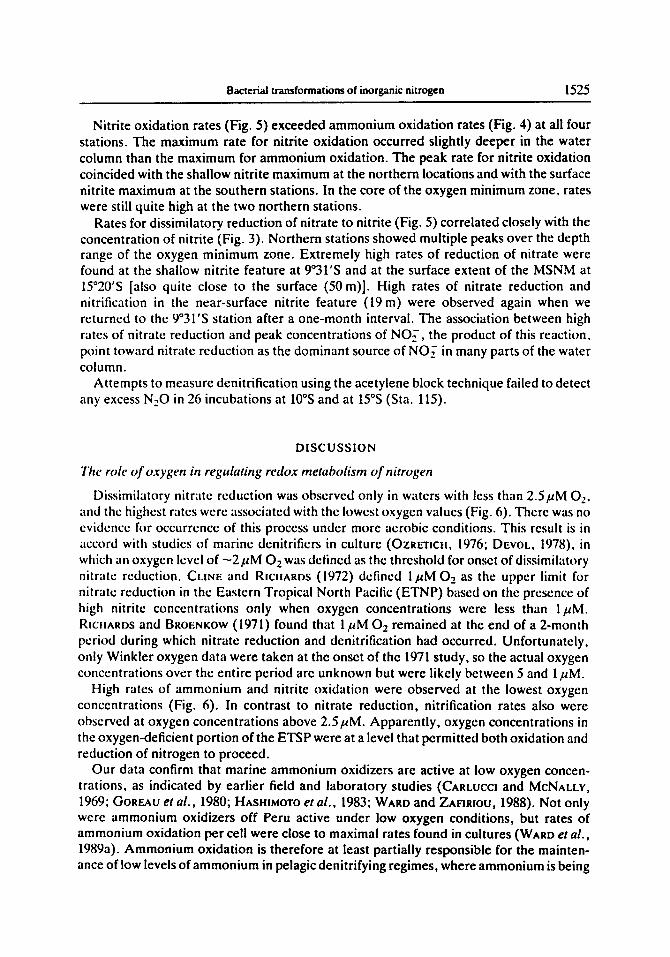
Dissimilatory nitrate reduction was observed only in waters with less than 2.5~uM O,, and the highest rates were associated with the lowest oxygen values (Fig. 6). There was no evidence for occurrence of this process under more aerobic conditions. This result is in accord with studies of marine denitrificrs in culture (OZRETICtl, 1976; DEVOL, 1978), in which an oxygen level of -2/.tM O 2 was defined as the threshold for onset of dissimilatory nitrate reduction. CraNE and RIcltaaOS (1972) defined l/tM 02 as the upper limit for nitrate reduction in the Eastern Tropical North Pacific (ETNP) based on the presence of high nitrite concentrations only when oxygen concentrations were less than 1/~M. RICtIARDS and BaOENKOW (1971) found that I/~M 0 2 remained at the end of a 2-month period during which nitrate reduction and denitrification had occurred. Unfortunately, only Winkler oxygen data were taken at the onset of the 1971 study, so the actual oxygen concentrations over the entire period are unknown but were likely between 5 and I uM.
High rates of ammonium and nitrite oxidation were observed at the lowest oxygen concentrations (Fig. 6). In contrast to nitrate reduction, nitrification rates also were observed at oxygen concentrations above 2.5/~M. Apparently, oxygen concentrations in the oxygen-deficient portion of the ETSP were at a level that permitted both oxidation and reduction of nitrogen to proceed.
Our data confirm that marine ammonium oxidizers are active at low oxygen concen- trations, as indicated by earlier field and laboratory studies (CARLUCCI and MCNALLY, 1969; GOREAU et al., 1980; HASmMOTO et al., 1983; WARD and ZAFIRIOU, 1988). Not only were ammonium oxidizers off Peru active under low oxygen conditions, but rates of ammonium oxidation per cell were close to maximal rates found in cultures (W^aD et al., 1989a). Ammonium oxidation is therefore at least partially responsible for the mainten- ance of low levels of ammonium in pelagic denitrifying regimes, where ammonium is being
1526 F. L a r s c a u t t z er aL
(a) (¢)
30O 3oo
200 ~
C
C °
U
¢ -,= o
.-_ E Z " E .
• ~_q, _ a o , , 0 - - o . . . . . O=
o 5 10 15 20 25 (b) 5 10 15 20 25 (d)
5O 1000 o
"1o ~ " "10
~ 40 ,~ 800 c"
C 3 0 ~ 6 0 0
C 0
i
4 0 0 "~ 20
o
E m ~ i ' *
o a
• , .n . . . . 00 5 10 15 2 0 2 5 0 5 10 15 2 0 2 5
Oxygen (p.M) Oxygen (laM)
Fig. 6. (a) Rates of nitrate reduction at differcnt in silu oxygen concentrations. Oxygen was determined by the BROENKOW and CLINE (1969) method. Symbols refer to station locations: I- I 9"31 'S; 9), 7"40'S; O, 13032'S; A , 15"20'S; x , Stas 144, 146, 150 and 155. (b) Rates of ammonium assimilation at the different in situ oxygen concentrations. (c) Ammonium oxidation rates measured at the different in situ oxygen concentrations. (d) Nilritc oxidation rates measured at the
different in sire oxygen concentrations.
actively produced by the denitrification process (RICHARDS, 1965; CARLUCCI and MCNALLY, 1969).
Nitrite oxidation activity was not sensitive to low oxygen levels (Fig. 6) as suggested previously (STENSTROM and PODUSKA, 1980; HELDER and DEVRtEs, 1983; HYNES and KNOWL~, 1984). Our results agree with the analysis of ANDERSON (1982), who concluded from concentration profile data that nitrite oxidation occurred at 3.0pM 02 (-+ 1.5). Rates of nitrite per cell for nitrite oxidizers also approached and even exceeded optimal rates from laboratory cultures (WARD el al., 1989).
Further evidence that both oxidation and reduction of nitrogen occur under the low oxygen conditions off Peru is the wide variation in N20 concentration in waters with oxygen concentrations below 2.5~M (Fig. 7). Supersaturated values could reflect pro-

Bacterial transformations of inorganic nitrogen 1527
100 I • DelS~t<6~S!
• Oefi=t > 6 ~
80 • •
60
D
20'
0 5 L0 15 20 25
Oxygen (I.tM) Fig. 7. Nitrous oxide concentrations in samples from water with low nitrate deficit (<61tM. i--I) and high nitrate deficit (>6:,M, O) as a function of oxygen concentration (Bt~oEsrow and Ct, tNe.
1969).
duction from either nitrification (GoREAU et al. , 1980; LIPSCFtULTZ et al.. 1981 ; HVNES and KNOWLES, 1984; JORC;ENSEN et al., 1984) or from denitrification (FIRESTONE and TIEDJE. 1979; JOgGENSEN et al., 1984; ANDERSON and LEVnNE, 1986). However, since nitrous oxide is consumcd only by denitrilicrs (PAvNE, 1981), undersaturation in the water column under low oxygen conditions has been assumed to indicate past or prescnt denitrification (Ex,KXSS, 1978). Low N20 values were almost exclusively found in waters with both high nitrate deficits and with 02 < 2.5 l,M (Fig. 7), suggesting that the onset of dcnitrification occurred at about the same oxygen level as nitrate respiration.
The participation of N_,O in both oxidation and reduction pathways may Icad to an underestimation of ammonium oxidation rates through coupling of nitrification and denitrilication, similar to that reported in sediments (JErq~xss and KF, MI', 1984). As oxygen levels decline, nitrifiers produce N20 in increasing proportion relative to NO[ (GOR~:AU et al. , 1980; Lxpscnot:rz et al., 1981; JORGENSErq et al., 1984; ArqDERSON and LEVIrqE, 1986), probably as a result of intracellular NO;- reduction (Pom and FocHr, 1986). Denitrifiers can reduce nitrous oxide (FmEsTOrqE and TIEDJE. 1979; PAVNE, 1981), SO that a pathway (NH~" ---+ N20 ---+ N2) could operate and the tSN protocol used in our study would not have detected it. However, JORGENSEN etal . (1984) found that a maximum of 9 o _5/o of the NHj" oxidized at 1/~M 0 2 resulted in N20---N, so the underestimation is likely to be small. This shunt of the redox cycle cannot therefore explain our failure to detect ammonium oxidation in the core of the MSNM. It is possible that the high ambient levels of NO;- masked the tsNO 2 produced by ammonium oxidizers, and that rates of nitrification in th-c core were similar to the low rates found at adjacent depths ( < ~ 5 nM N d-t).
Factors regulating the ambien t concentrat ions o f nitrite and oxygen
ANDERSON et al. (1982) suggested an important role for the recycling of NO.;" ill denitrification regimes. They proposed that nitrite produced by nitrate reduction would
1528 F. Lll'sci-it,'LtZ a al.
diffuse to the oxycline and there be oxidized back to nitrate by nitrite oxidizers. According to this model, oxidation of NO.;- should occur primarily in a narrow zone at the upper boundary of the nitrite maximum and in a wider, less confined zone at the base of the nitrite maximum. Some of the organic matter entering the oxygen minimum zone could therefore be oxidized by nitrate reduction without loss of fixed nitrogen from the system.
The scenario envisioned by ANDERSON et al. (1982) is consistent with the pattern of nitrite oxidation and nitrate reduction activity observed during NITROP-85 (Fig. 5). Our measured nitrite oxidation rates at the 9°31'S. 13°32'S and 15°20'S locations were indeed very high (150-700 nM N d -t) in narrow zones at the top of the nitrite maximum (Fig. 5). Rates of similar magnitude (400 nM d- i) were calculated for a 4 m thick zone at the top of the oxygen minimum zone in the ETNP by ANDERSON (1982) using a one-dimensional, steady-state model. We observed lower rates at the base of the deep nitrite maximum at 9°31'S and 7°40'S. Peak nitrite oxidation rates appeared to occur where the nitrite concentration gradient was steepest, as predicted by ANDERSON (1982), although there is insufficient depth resolution in the 15N data to be certain. The tracer experiments provide the first direct rate measurements to test the hypothesis of ANDERSON et al. (1982). Observed rates were strikingly similar to predictions of the model, providing support for significant re-oxidation of NO;- in denitrification regimes.
Ammonium oxidation was insignificant as a source of ambient nitrite, except for a narrow depth interval near the surface in the southern region. Ammonium oxidation rates were highly correlated with nitrite oxidation (P > 0.01), and, more importantly, nitrite oxidation rates always exceeded ammonium oxidation rates. Thus, although ammonium oxidation could produce nitrite quite rapidly, the product appears to be efficiently consumed by oxidation.
These results provide a conceptual framework h~r understanding the hlctors that produce the high nitrite levels that characterize this region. Nitrate reduction provides the high levels of NO;- observed in the MSNM. An important fraction of this NOR" is rc-oxidizcd at the oxyclinc (ANDERSON et al. , 1982). Where conditions favor nitrification, primary and secondary nitrification arc closely coupled.
Oxidation of Nl-l~" may be regarded as an important source of NO j" in these waters, but it is not effective in producing the high ambient levels of NO~. Oxygen consumption associated with observed nitrification could deplete the ambient oxygen in the core of the oxygen minimum zone in a month or less. Estimates of the water residence time in the low oxygen zone in the 10--15°S region are on the order of 3-12 months (CootsPox! and CHRIS'rENSEN, 1985). Complete removal of oxygen, however, is rare in the shelf and slope waters in this region (DUGDALE et al., 1977; FRIEDERICH et al , , 1985). Maintenance of the remarkably consistent oxygen levels found throughout the region therefore requires a source of oxygen to balance consumption.
There are several possible exogenous sources of oxygen. The waters at the northern boundary of the denitrification zone, 7°40'S, are likely supplied with oxygen by the poleward-flowing Peru Undercurrent. At 9°31'S and 13°32'S, a balance could be main- tained by mixing with waters associated with the onshore flow at 11°S that have slightly higher oxygen concentrations. A 5 cm s-I onshore flow (Fig. 2) would traverse 200 km in just over a month, less than the estimated time for complete oxygen consumption. At 15°S, interleaving with subantarctic waters has been reported to be an important process of variability in nutrients (FRIEDERICH and CODISPOTi, 1981) and would also act to supply oxygen. These scenarios suggest the potential for small, but potentially important,
Bacterial transformations of inorganic nitrogen 1529
horizontal oxygen gradients to provide oxygen to the denitrifying zone. These gradients could have escaped detection in our hydrographic surveys, as well as others, where Winkler titrations were used to measure oxygen.
Vertical diffusion of oxygen along the steep gradients at the boundaries of the low oxygen waters could be an alternative route to provide the oxygen needed to balance consumption (ANDERSOr~, 1982). In particular, the oxygen demand of the high rates of nitrification at the upper boundary of the MSNM at all four locations could be sustained by this mechanism. Especially at 9°31'S and 15020'S, an oxygen flux of more than 10 -3 mol m-" d - l appears to be required to balance nitrification. Given the observed gradients of 3--4/~MOzm -i , an eddy diffusion coefficient of 0.1cmZs -1 would be sufficient (FRIEDERICH and CoolsPorl, 1987). The rapid turnover of oxygen at these interfaces suggests that the depth of the oxycline could shift dramatically due to change in the supply of substrate, either oxygen or ammonium.
It is also important to point out that the concentrations of oxygen or nitrite and the metabolic rates at any particular depth were probably not in steady state. Sharp gradients of salinity and temperature were present just above the NO;- peak at 15°20'S (FRIEDERICH et al., 1985) indicating advection of a different water mass overlying the MSNM. Over a 24 h interval, the NO;- peak deepened by 10 m and became considerably more diffuse, with a two-fold reduction in peak concentration. Repeated pump casts or closely spaced hydrocast sampling over several days revealed large (2l~M) variations in nitrite concen- trations at any given a, surface (FRIEDERICH and CODISPOT1. 1987). FRIEDERICH and CODtSPOTI (1981) have discussed evidence that the variability in nutrient concentration in the 15°S region arises from mixing of subtropical and subantarctic waters. Short-term transients in metabolic rates (on the order of days) might therefore occur, driven by mixing of waters with various oxygen contents.
Nitrate redaction and denitrification
Measured rates of nitrate reduction in the core of the oxygen minimum zone were similar at all four locations, 25-50 nM N d- t (Fig. 5). Rates near the surface were higher and far more variable, 50---400 nM N d- i. There are few estimates of nitrate reduction in natural systems to compare with our measurements. RICHARDS and BROENKOW (1971) compared NO 2 and NOj" concentrations over a 2-month period in a closed basin at Darwin's Island in the Galapagos. Based on the assumption that both nitrate and nitrite reduction occurred over the entire period, they estimated rates in the water column (from 40 to 120 m) of 192 nM N d- ' for nitrate reduction and 55 nM N d- t for nitrite reduction to N 2, in the range observed in the upper 100 m of the oxygen minimum zone during NITROP-85. The model of ANDERSON et al. (1982), which appears to describe the pattern of redox transformations observed on NITROP-85, predicts steady-state rates of nitrate reduction in the core of the nitrite maximum of 32 nM N d- t, quite similar to the observed rates in deep water. Rates of nitrate reduction reported by WADA and HA'rrORt (1972) for the low oxygen waters of the central Pacific Ocean were considerably less than observed off Peru, about 1 nM N d- i.
Denitrification rates in the pelagic ocean have been estimated by two methods: the nitrate deficit (CoDISPOTi and RICHARDS, 1976) and the electron transport system (ETS) method (CoDtSPOTI and PACKARD, 1980). The nitrate deficit is calculated by comparing the oxidized nitrogen content of the sample with the content along an isopycnal surface at a
1530 F. LIPSCHULTZ el al.
point outside the denitrifying regime. A rate can then be calculated from estimates of the volume of water affected by denitrification and the residence time.
The ETS method measures the ability of the filterable organisms in a water sample to reduce a tetrazolium dye. The measured electron transport rate is converted to a respiration estimate using a factor derived from bacterial cultures in stationary growth phase. Implicit assumptions are that the bacterial consortium in the field sample is also in stationary phase and that their dominant respiratory mechanism is denitrification. The two methods have been found to agree within a factor of about 2 (CODISPO~ and PACKARD, 1980; CODISPOlq et a l . , 1986).
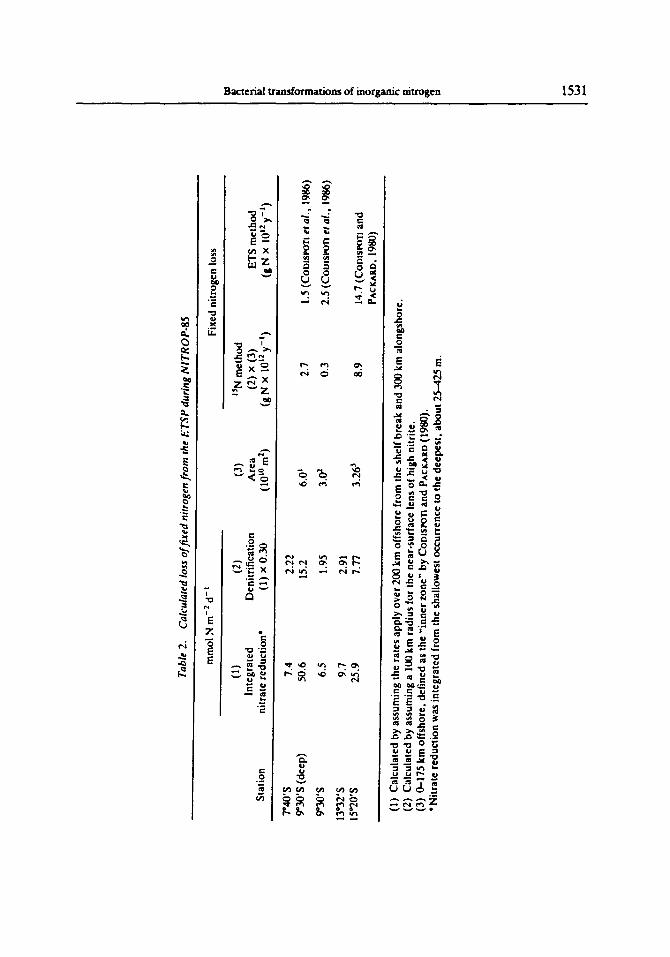
We can use our measured rates of dissimilatory nitrate reduction on NITROP-85 to make an independent estimate of denitrification in the ETSP. If we assume that all of the tsNO3 label that was reduced to NO~ exchanged with the external NOr pool, then the rates we measured represent the total nitrate reduction rate. (If this assumption does not hold, our rates would be a lower limit.) The rate of denitrification was calculated by assuming that it was 30% of the nitrate reduction rate (RICHARDS and BROENKOW, 1971; OZRETtCH, 1976; ANDERSON et a l . , 1982). This value was chosen based on the rates calculated by RtCHARDS and BROENKOW (1971) for Darwin Bay in the Galapagos and the Peru Ill case from ANDERSON et al. (1982) as most representative of the high nitrite conditions during NITROP-85. The average denitrification rate for the oxygen minimum zone at the northern stations (excluding the near-surface nitrite maxima at 9°31'S) was 8.7 mmol N m-2 d- t in a water volume estimated as 6 x I0 t" m 2 (Table 2). Extrapolating over a year, the nitrogen loss from the 7-10°S region is 2.7 x 10 t2 g N y- i. The near-surface feature, although more metabolically active, would have contributed only 0.3 x It}t2 g N y-t . If we extrapolate our results from the 13°32'S and 15°20'S stations to the same areal extent as CoDJsPon and PACKARD (19S(I) used, we arrive at a value of 8.9 x 10 t-~ g N y-.t. As noted above, our estimates may bc somewhat low if any contami- nation by oxygen occurred during the incubations.
Our estimated rates of dcnitrilication for the Peru region are quite similar to those of other investigators evaluated by tile alternative methods (Table 2). Our estimate of fixed nitrogen loss in the offshore zone from 7 to 10°S (3 x 10t2g N y-t) is quite similar to the loss of 4 × 10t2g N y -t calculated by Cootst'ort et ai. (1986) using data for electron transport activity (ETS) (Table 2). For the zone centering on the southern stations, CoDtSeO'rl and PACKARD (1980) estimated a fixed nitrogen loss in 1977 of 14.7 x 10t2gNy -t. CODtSPOTt et al. (1988) estimated from ETS measurements that denitrification in this region during NITROP-85 was the same as the 1977 value, Within the broad assumption required for all of these calculations, there is a surprisingly close agreement.
Attempts to measure denitrification using the acetylene block technique, however, failed to detect any activity at the stations along 10°S or Sta. 115. These water masses both possessed the characteristics of high nitrite and low oxygen concentrations that typically are assumed to define zones of denitrification. The detection limit for increase in N20 concentration with the acetylene block technique was - 1 . 0 n M N d -t , so that the regionally averaged rates of 15 nM N d- t derived from the tSN experiments should have been readily detected. It is possible that the acetylene block assay failed to block N20 reduction (OREMLANO et a l . , 1984) or that the acetylene gas poisoned the samples (HYMEN and A~P, 1987). However, very low denitrification rates at the depths surveyed are consistent with the large variations in measured rates of nitrate reduction. The occurrence
Tabl
e 2.
C
alcu
late
d lo
ss o
f ftx
ed n
itrog
en fl
ora
the
ET
SP d
urin
g N
ITR
OP
-85
mm
ol N
m -a
d -I
F
ixed
nit
roge
n lo
ss
(1)
(2)
(3)
I~N
met
hod
Inte
grat
ed
Den
itri
fica
tion
A
rea
(2)
x (3
) E
TS
met
hod
3.
Sta
tion
ni
trat
e re
duct
ion*
(1
) x
0.30
(1
01°
m 2)
(g
N x
10
12 y
-I)
(g N
x
10 Iz
y-I
)
7040
'S
7.4
2.22
~,
9~
30'S
(dee
p)
50.6
15
.2
6.01
2.
7 1.
5 (C
oDIS
POTI
el a
l., 1
986)
9°30
'S
6.5
1.95
3.
02
0.3
2.5
(CoD
ISPO
TI el
al.,
198
6)
o ~'
13"3
2'S
9.7
2.91
R
15
020'
S 25
.9
7.77
3.
263
8.9
14.7
(C
omsv
oTI
and
5"
PAcx
Alit
D, 1
980)
(1)
Cal
cula
ted
by a
ssum
ing
the
rate
s ap
ply
over
200
km
off
shor
e fr
om t
he s
helf
bre
ak a
nd 3
00 k
m a
long
shor
e.
R'
(2)
Cal
cula
ted
by a
ssum
ing
a 10
0 km
rad
ius
for
the
near
-sur
face
len
s of
hig
h ni
trit
e.
=u'
(3)
0-17
5 km
off
shor
e, d
efin
ed a
s th
e "i
nner
zon
e" b
y C
omsK
rn a
nd P
^cr,
Aan
(19
80).
,,~
* N
itra
te r
educ
tion
was
int
egra
ted
from
the
sha
llow
est o
ccur
renc
e to
the
dee
pest
, ab
out
25--
425
m.
" ~d
C~

1532 F. LtPSCHUt.TZ et at.
of both extremely low (< 1 nM N d- t ) and extremely high denitrification rates within the study region raises questions about the validity of the averaging process implicit in Table 2. The NO~ deficit method for estimating denitrification averages over such spatial and temporal variation, but extrapolation to an areal rate requires an averaging of the water flows over the entire region, thereby introducing major uncertainties. Further investi- gation of the spatial and temporal scales of subsurface metabolism rates is required before global estimates from either method should be accepted as accurate.
Association o f subsurface metabolism with surface productivity
High values of NO~ and elevated rates of NO j reduction were observed at the top of the secondary nitrite maximum at 9*31 'S, 13"32'S and 15°20'S (Figs 4 and 5). Satellite imagery of chlorophyll concentrations in the Peru region taken during NITROP-85 (Fig. 8) shows extremely high levels of chlorophyll ( - 5 mg m -3) directly over the shallow lens of high nitrite water at 8--9.S. Streamers of water with high concentrations of chlorophyll extended several hundred kilometers offshore. The onshore flow of oligotrophic water with low chlorophyll concentration at 11~S is also apparent in both satellite data and subsurface observations. The surface temperature record for the Peruvian coastal region (ZUTA etal., 1983) suggests that the complex circulation observed during NITROP-85 may be common in the offshore waters. Peaks in primary production and chlorophyll a (FrleDerlcH et al., 1985) correspond closely to regions of high nitrate deficit near the surface (Fig. 9) and with high nitrite concentrations in the near-surface waters (Fig. 2). These characteristics are all associated with water being advcctcd from the coastal waters (Fig. 2). There is strong circumstantial evidence then h~r association between the magnitude of subsurface meta- bolic rates and primary production in the overlying waters (Ltu and Kart.an, 1984; MarTIN et al., 1987).
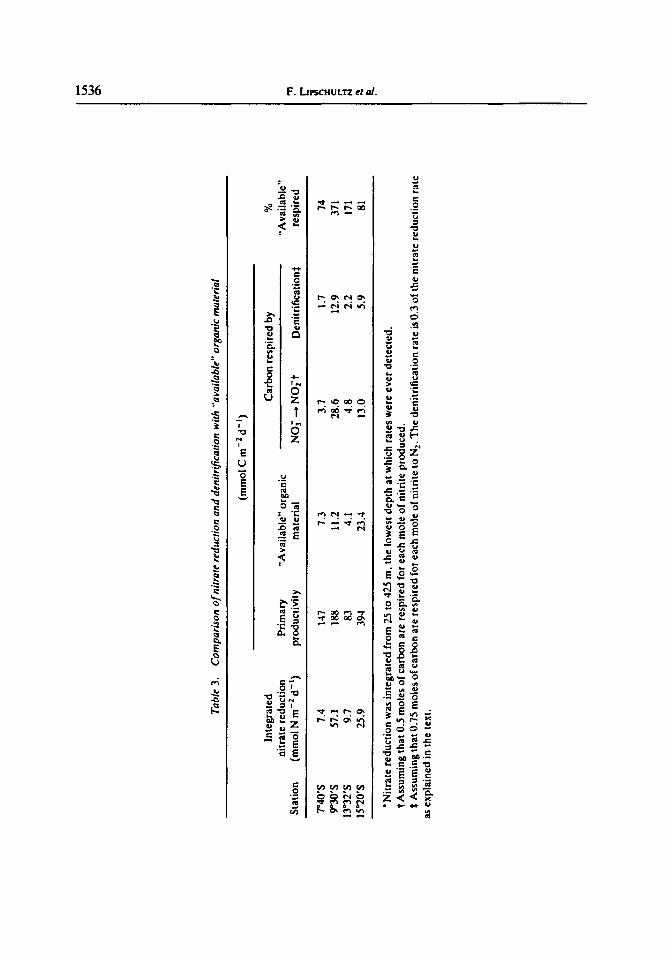
Sedimentation links production of organic carbon in surface waters to metabolism in the depth interval of the oxygen minimum zone. It is possible to estimate the amotmt of carbon that might be available for reduction in the oxygen minimum zone off Peru, for comparison with our estimate of denitrification. MARTIN et al. (1987) and S'rArEStNIC (1981)) found that 10-15% of surhlce production off Peru sank below the mixed layer. The flux of particles (F(z)) at depth (z) was found to be proportional to primary productivity and to diminish below the mixed layer according to the equation (Mar'tiN et al., 1987)
[ z / -o.32 = . ( 1 )
The difference in the amount of rapidly sedimenting material entering the oxygen minimum zone (Ft,,p) and leaving the zone (F(450 m)) provides a first-order estimate of the carbon "available" for respiration (Table 3). Measured rates of nitrate respiration could consume 50-110% of the carbon "available" according to this estimate, except at 9°31'S, where 260% of the carbon appears to have been required. The additional contribution from denitrification raises the total to 74-171% (371% at 9"31'S) (Table 3).
LJo and KAPLA~ (1984) calculated that only 50% of the available carbon in the ETSP was respired. This estimate is probably low since the formula used to calculate "'available" carbon (SUESS, 1980) predicts a far more rapid initial decay of the particle flux with depth than expected for the Peru region, where the loss rate of particulate material with depth is

Ba c te r ia l t r a n s f o r m a t i o n s o f inc, rganic nitr~+gcn 1533
Fig .~ ( '~( 'S m~a~¢ h~r chl ,+~t ,ph+ll u it+ the [k.+lu r~+.+i,,n +,n Itl l :¢l+ru;tr , , I~+~5. d u r m ~ Lh,. +
N I I'11,( )I' ~5 ~.'Xl+~.'tlltit+Jt ~|c;i, , .ttlqd ~in +i l+hyl~l+lankttm [+t~itt,._,llt COltu'.,.'ttlr;+itit)ll ( m ~ In I' ). (("t+ut, t¢'+.', t~l l ) l (+. [ : c l d m a n . N:\~++\ ( + t + d d a r d )


Bacterial transformations of inorganic nitrogen 1535
(o)
'E 5 =-
2
1 " g o 6 . . . . . . . . 0-
0 200 4 0 0 600 800 1000 1200
{ b) P,~'$ 1'55"$ 10"013 I I~J'$ IZ'li'$ ~ 14~1"~ IS'¢r$ ,#65 / 6 7 170 172 t74 ~ 199 #'101 ,#105
O. 1 ~ I I | |1 I I | |
100.
150.
2.50. t- ~ . 300.
0 350.
450. • • • •
500,
550. O,OI 110 ° 2,50 i10 ~' 5,00 1102 7.50 xtO 2 1.00 ~tO 3 1.25 xlO J
A l o n q s h o r e D i s t a n c e ( ' k m )
Fig. 9. (a) Meridional section of chlorophyU concentration and of primary productivity (C m -z d - ' ) at the surface off Peru. Distance is rclative to Sta. 64. (b) Meridional section of the
nitrate deficit ~ M ) off Peru.
about half the rate for fully aerobic waters (MARTIN et a l . , 1987). The reduced rate for breakdown of macroparticles under low oxygen conditions may be due to exclusion of zooplankton from the oxygen minimum zone (JuDKZNS, 1980) or to the necessity for bacterial metabolism to shift from aerobic to anaerobic respiration as the particles cross the oxycline.
Our calculations are clearly sensitive to factors such as choice of the mixed layer depth and to the assumptions of the MARTIN et al. (1987) model, such as the immediate availability for microbial decomposition of large, rapidly sedimenting particles. Nonethe- less, the close correspondence between the estimates of carbon required for respiration and the carbon supply as well as circumstantial evidence from the satellite image suggest that production of organic carbon at the surface can play an important role in regulating rates of loss of fixed nitrogen from the ETSP.
The calculated respiratory demand for carbon at 9"31'S greatly exceeded the estimate of the "available" vertical carbon input, suggesting that an alternative source of carbon also must be important. Rates of nitrate reduction were anomalously large within the core of
i-=*
t.~
Tabl
e 3.
C
ompa
riso
n o/
nitr
ate
redu
ctio
n an
d de
nitr
ifica
tion
with
"av
aila
ble"
org
anic
mat
eria
l
(ret
ool C
m -2
d -a
)
Inte
grat
ed
Car
bo
n r
espi
red
by
%
nitr
ate
redu
ctio
n P
rim
ary
"Ava
ilab
le"
orga
nic
"Ava
ilab
le"
Sta
tion
(m
mol
N m
-2 d
-n)
prod
ucti
vity
m
ater
ial
NO
~" --
* N
Oi'
t D
enit
rifi
cati
ont
resp
ired
.m
L"
~4(
]'S
7.4
147
7.3
3.7
1.7
74
Z
9°30
'S
57.1
18
8 11
.2
28.6
12
.9
371
13°3
2°S
9.7
83
4.1
4.8
2.2
171
15"2
0'S
25.9
39
4 23
.4
13.0
5.
9 81
*Nit
rate
red
ucti
on w
as i
nteg
rate
d fr
om 2
5 to
425
m.
the
low
est d
epth
at
whi
ch r
ates
wer
e ev
er d
etec
ted
. t
Ass
umin
g th
at 0
.5 m
oles
of
carb
on a
re r
espi
red
for
each
mol
e o
f ni
trit
e pr
oduc
ed.
Ass
umin
g th
at 0
.75
mol
es o
f ca
rbon
are
res
pire
d fo
r ea
ch m
ole
of n
itri
te to
N 2 .
Th
e de
nitr
ific
atio
n ra
te is
0.3
of
the
nitr
ate
redu
ctio
n ra
te
as e
xpla
ined
in t
he t
ext.

Bacterial transformations of inorganic nitrogen 1537
the nitrite maximum at this station. The surface peak in nitrate reduction at 9031'S accounts for utilization of 60% of the "available" carbon, similar to the value observed at the top of the NO~ maximum at the other locations. The remaining contribution to the estimated carbon demand comes from the high level of activity below 100 m, suggesting advection of organic material to the 100-300 m depth interval.
A number of authors (PAK et al. , 1980; CODISPOrl and PACKARD, 1980; CODISPOTI and CHmSTENSEN, 1985) have raised the possibility that horizontal transport is also an important source of organic matter to the offshore regime. Highest concentrations of nitrite and maximum nitrate deficits are commonly found on the continental shelf and along the shelf break (CODISPOTI and PACKARD, 1980; FRIEDERICH et al., 1985; CODISPOTI et al. , 1988). Transport of shelf material offshore has been suggested as the source of discrete water masses with high numbers of particles commonly found in the subsurface waters off Peru (PAK et al. , 1980; SeINRAO et al., 1989).
A m m o n i u m metabol i sm in oxygen-def icient waters
Assimilation of ammonium occurred throughout the region (Fig. 4). We attribute this activity to bacteria rather than to phytoplankton because the low oxygen region was well separated from the euphotic zone and was essentially free of chlorophyll (FmEDEmCH et al., 1985). Our observations of assimilation in these subsurface waters provide further evidence that bacteria in natural waters do not satisfy their metabolic requirements for nitrogen solely from organic compounds (HoamGAN et al. , 1984; HAC;SrRoM et al., 1984). WilEELER and KIRCHMAN (1986) found that bacteria effectively compete with phytoplank- ton for NFt~ even in surface waters, accounting for up to 78% of the NH~ assimilated by the particulate fraction. Assimilation rates did not correlate with NH~" concentration (P>0.25) although the poor precision of measurements at low concentrations (Nil~ < 0.3/~M) may have masked any relationship. In addition, assimilation may have been stimulated by tracer amendments due to the low ambient concentration.
Rates of ammonium assimilation (5-10 nM N d- i, Fig. 4) were generally in balance with the Nl-14 + expected from mineralization (nitrate reduction rates of 50--I(X)nM N d -t , Fig. 5) of organic matter with a carbon:nitrogen ratio of 10 (STAREStNIC, 1980, MAR'rtN et al., 1987). Ammonium assimilation exceeded ammonium oxidation over much of the low oxygen zone, indicating that assimilation is the primary mechanism in preventing accumu- lation of NH~" in the core of the low oxygen region. Ammonium oxidation was the dominant sink for NH~ only at the surface boundary of the low oxygen zone. Rates of ammonium assimilation or oxidation were comparable to rates of ammonium reminerali- zation at depths where the rates exceeded the detection limit for remineralization (~100 nM N d-t) .
CONCLUSIONS
Nitrate respiration data from NlTROP-85 represent the first comprehensive measure- ments of nitrogen metabolism in denitrification regimes, and are among the most comprehensive to date in any water body. We have drawn the following conclusions from the data:
(1) The oxygen content of the subsurface waters off Peru was at a level (O2 < 2.5/xM) that permitted both nitrification and dissimilatory nitrate reduction. A wide range of rates
1538 F. Ltt, scrltrt.rz et al.
for ni t rogen redox chemis t ry was observed within the na r row range o f oxygen concen- t rat ions present in the region. Oxygen must be supplied by vertical and /or hor izontal t ranspor t to maintain the consistent oxygen concen t ra t ions observed.
(2) Nitri te appears to be recycled be tween nitrite oxidat ion and nitrate reduct ion within denitrif ication regimes, confi rming the hypothesis o f ANOERSOS et al. (1982). Decompos i - t ion o f organic mat te r in the low oxygen env i ronmen t can therefore occur with loss of less ni t rogen than expected if reduct ion o f N O ~ con t inued directly to N2.
(3) Denitr if ication est imates derived f rom measured rates o f nitrate reduct ion are in h a r m o n y with est imates based on ETS and on nitrate deficit calculations. Denitr if ication activity maximized at the top o f the oxygen min imum zone, with lower rates observed in the core of the zone.
(4) The intensity o f subsurface metabol i sm was strongly associated with pr imary p roduc t ion in surface waters , part icularly for depths <100 m. Evidence for this was: (a) a close co r re spondence o f e levated surface product ivi ty and chlorophyl l concent ra t ions with maxima of subsurface nitrite levels, nitrate deficit, and nitrate reduct ion; (b) the location o f high rates o f ni t rogen cycle processes at the upper bounda ry of the oxygen min imum zone; (c) essentially comple te oxidat ion of organic ca rbon enter ing the system by sedimenta t ion .
(5) Microbial assimilation o f N H ~ was the ma jo r process maintaining the low am- mon ium concent ra t ions found in denitrifieation regimes. Assimilat ion was sufficient to consume N H ~ arising from measured remineral izat ion rates as well as that es t imated from measured rates o f nitrate reduct ion and the nitrate deficit. A t the vertical ex t remes of the oxygen min imum zone, consumpt ion of NI-I~" by a m m o n i u m oxidat ion was also impor tant .
Acknowledgements~All of the participants of the NITROP-85 contributed to this research through their cooperation on thc cruise and in making their data available afterw:,rds. We espcciitlly thank Lee Kerkhof for his companionship and assistance during the collection and laboratory pha~s of this work. Peter Kelly also merits special thanks for conducting nutrient analy~s above and beyond his already heavy commitments. Dick Barber and Jane Kogclshatz graciously provided access to their primary productivity data. The professionalism of the R.V. Wecoma crew greatly aided our efforts. The paper benefited from the careful appraisal of the reviewers. This research was suplm~rted by NSF grants OCE-8316609 and OCE-8616611.
REFERENCES
ANDEKSON I. C. and J. S. LEVI~F. (1986) Relative rates of nitrous oxide and nitrous oxide production by nitrificrs, denitrifiers and nitrate respirers. Applied and Environmental Microbiology° 51,938-945.
ANDEaSOS J. J. (1982) The nitrite-oxygen interface at the top of the oxygen minimum zone in the eastern tropical North Pacific. Deep-Sea Research, 29, 1193-1201.
ANnEaSON J. J., A. Ogu~o, A. S. ROSaINs and F. A. RICH^aDS (1982) A model for nitrite and nitrate distributions in oceanic oxygen minimum zones. Deep-Sea Research, 29, 1113--1140.
BaoENgow W. W. and J. D. CLtNE (1969) Colorimetric determination of dissolved oxygen at low concentrations. Limnology and Oceanography, 14. 450--454.
C^aLucct and MCNALLY (1969) Nitrification by marine bacteria in low concentrations of substrate and oxygen. Limnology and Oceanography, 14, 736--739.
CHals'rEss~:N J. P., J. W. Muaa^v, A. H. D~vot and L. A. ContsPon (1987) Denitrifieation in continental shelf sediments has major impact on the oceanic budget. Global Biogeochemical Cycles, 1, 97-116.
CLtNE J. and F. A. Rich^aDs (1972) Oxygen deficient conditions and nitrate reduction in the eastern tropical North Pacific Ocean. Limnology and Oceanography, 17,885-900.
Conts~Tt L. A. and F. A. Rtca^aDS (1976) An analysis of the horizontal regime of denitrification in the eastern tropical North Pacific. Limnology and Oceanography, 21,379-388.

Bacterial transformations of inorganic nitrogen 1539
CODISPOTI L. A. and T. T. PACt, AID (1980) Denitrification rates in the eastern tropical South Pacific. Journal of Marine Research. 38,453--477.
CODtSeOTI L. A. and J. P. CUeaSTENSe.N (1985) Nitrification, denitrification and nitrous oxide cycling in the Eastern Tropical South Pacific Ocean. Marine Chemistry. 16, 277-300.
CODISPOTI L. A. . G. E. FRIEDEitlCH. T. T. PACKARD, H. E. GLOVER, P. J. KELLY. R. W. SPINRAD, R. T. BARBER. J. W. ELKINS. B. B. WAND. F. LIPSCHUL'rZ and N. LOSTANAU (1986) High nitrite levels off northern Peru. A signal of instability in the marine denitrification rate. Science. 233. 1200-1202.
CODISeOTI L. A.. G. E. FiUEDEXtCH, T. T. PACKARD and R. T. B^XRER (1988) Remotely driven thermocline oscillations and denitrification in the Eastern South Pacific: The potential for high denitrification rates during weak coastal upwelfing. The Science of the Total Environment, 75.301-318.
CRUTZEN P. (1970) Influence of nitrogen oxides on the atmospheric ozone content. Quarterly Journal of the Royal Meteorological Socie~. 96.320-325.
DEUSEX W. G., E. H. Ross and Z. J. MLODZtNSKA (1978) Evidence for and rate of denitrification in the Arabian Sea. Deep-Sea Research. 1,5,431-445.
DEvoL A. H. (1978) Bacterial oxygen uptake kinetics as related to biological processes in oxygen deficient zones of the oceans. Deep-Sea Research. 25, 137-146.
DUDEK N., M. A. BRZEZINSKI and P. A. WHEELER (1986) Recovery of ammonium nitrogen by solvent extraction for the determination of relative ISN abundance in regeneration experiments. Limnology and Oceanogra- phy, 12. 196--206.
DU~DALE R. C.. J. J. GOEmSG. R. T. BAReER, R. L. SMITH and T. T. PACKARD (1977) Denitrification and hydrogen sulfide in the Peru upwelling region during 1976. Deep-Sea Research. 24.6111--608.
ELKINS J. W. (1978) Aquatic sources and sinks for nitrous oxide. Ph.D. dissertation. Harvard University. FEDEROVA R. K.. E. K. MtLEmNA and N. I. ILYUKmN^ (1973) Possibility of using the gas exchange method. Akad.
Nauk. SSR. Invest. Set. Biology. 6.797-806. FIAoEmO M. and J. D. H. SntlCXLANO (1968) Nitrate reduction and the occurrence of a deep nitrite maximum in
the ocean off the west coast of South America. Journal of Marine Research. 26. 197-2111. FreeStONE M. K. and J. M. TZEDIE (1979) Temporal changes in nitrous oxide and dinitrogen from dcnitrification
following onset of anacrobiosis. Applied and Environmental Microbiology. 38,673--679. FmEoEalctJ G. E. and L. A. CoD~sron (1981) The effects of mixing :rod regeneration on the nutrient content of
upwclling waters off Peru. In: Coastal upwelling. F. A. RlCtt^RDs, editor, American Geophysical Union, Washington. DC, pp. 221-227.
l:Ktl~l~t~RI¢.'ll G. E. and L. A. CoDtsvot! (1987) An analysis of continuous vertical nutrient profiles taken during a cold anomaly off Peru. Deep-Sea Research. 34, 1049--It1¢~5.
Ft~t-:Dt:mclt G. E.. P. Sm'RMAN and L. A. Cootsron (1984) A high precision automated Winklcr titration system based on an 11P-85 computer, a simple colorimcter and an inexpensive clcctromechanical buret. Bigclow Laboratory Technical r e ~ r t no. 42, 56 pp.
Ft~tEDt:ktCH G. E., P. J. KELLY, L. A. CODISI'OTI, R. W. SI'INRAD. G. KULLENIIURG, J, W. El.KiSS, J. KOGEt.SJlATZ, T. T. P^CKARD, F. Ll~cttut:rz, H. E. GLOVER, A. E. SMt'nl and B. B. WARt) (1985) Microbial transfi~rmations in the oxygen minimum zone off Peru. NITROP-85 data report. Bigclow Laboratory Technical report No. 59, 325 pp.
GOERINC; J. J. (1968) Denitrification in the oxygen minimum layer of the eastern tropical Pacific Ocean. Deep-Sea Research, 15, 157-164.
GOERINC, J. J. and J. D. CLXNE (1970) A note on denitrification in seawater. Limnology and Oceanography, 15, 306-309.
Goreau T. J. et al. (1980) Production of NO~ and N20 by nitrifying bacteria at reduced concentration of oxygen. Applied and Environmental Microbiology, 40, 526--532.
H^aSTROM A., J. W. AMMtRMAN, S. Hr-NRICHS and F. AZ^M (1984) Bacterioplankton growth in seawater. !I. Organic matter utilization during steady-state growth in seawater cultures. Marine Ecology Progress Series, 18.41--48.
HAStUMOTO L. K., W. A. KArL^N, S. C. WoFsv and M. B. McEtxoY (1983) Transformations of fixed nitrogen and N,O in the Carl^co Trench. Deep-Sea Research, 30,575--590.
HA rroRt A. (1983) Denitrification and dissimilatory nitrate reduction. In: Nitrogen in the marine environment, E. J. CARrEs'rER and D. G. CAeONE, editors, Academic Press, New York, pp. 191-232.
HERDER W. and R. T. P. DEVRI~ (1983) Estuarine nitrite maxima and nitrifying bacteria. Netherlands Journal of Sea Research, 17, 1-18.
1540 F. Lt rscnot rz et at.
HERN~a~DEZ D. and J. J. Rowe 11987) Oxygen regulation of nitrate uptake in denitrifying Pseudomonax aeruginosa. Applied and Environmental Microbiology, 53.745--750.
Hooste J. E.. R. J. DALrr and S. J~l,tm (1977) Use of nucleoporc filters for counting bacteria by fluorescence microscopy. Applied and Environmental Microbiology. 33, 1225--12.28.
HORRZG~ S. G.. A. HACSTnOM. F. AZAM and I. KOIKE 11984) Bacterioplankton growth in seawater may be nitrogen limited. EOS. 65.92.1,
HuYEa A. (1980) The offshore structure and subsurface expression of sea level variations off Peru. 1976.-1977. Journal of Physical Oceanography. 10. 1755--1768.
HYMEN M. R. and D. J. ARt (1987) Quantification and removal of some contaminating gases [tom acetylene used to study gas-utilizing enzymes and microrganisms. Applied and Environmental Microbiology. 53, 298-303.
HYNES R. K. and P. KNOWLES (1984) Production of nitrous oxide by Nitrosomonas europaea, effects of acetylene, pH. and oxygen. Canadian Journal of Microbiology. 30. 1397-1404.
JENKtNS M. C. and W, M. KEMP 11985) The coupling of nitrification and denitrification in two estuarine sediments. Limnology anti Oceanography. 29.609-619.
JORGENSEN K. S.. H. B. JENSEN and J. SORENSEN (1984) Nitrous oxide production from nitrification and denitrification in marine sediment at low oxygen concentrations. Canadian Journal of Microbiology, 30, 1073- ! 078.
JUDKtNS D. C. ([980) Vertical distribution of zooplankton in relation to the oxygen minimum zone off Peru. Deep-Sea Re.~earch. 27. 475-487.
LAws E. A. (1984) Isotope dilution models and the mystery of the vanishing i,~ N. Limnology and Oceanography, 29. 379-385.
LtPSCHULTZ F. (1984) Environmental factors affecting nitrogen cycling. Ph.D. dissertation. Harvard University. LtrSCHULTZ F.. O. ZAFmZOU. S. C. WOFSY. F. W. VALOIS. S. WATSON and M. B. McEt,KoY ([981) Production of
NO and N:O by soil nitrifying bacteria. Nature. 294.641--643. LI~CHUt.TZ F.. S. C. Worse and L. E. Fox (Iq85) The effects of light and nutrients on rates of ammonium
transformation in a eutrophic river. Marine Chemistry. 16, 32t,x--341. LtI'SCHULTZ F.. S. C. WOFSV :rod L. E. Fox 11986) Nitrogen metabolism of the eutrophic Delaware River
ecosystem, Limnoli~gy and Oceanography, 31,7111-716. LIu K. K. and I. R. Kal'lrAN (1984) Denitrification rates and availability of organic matter in marine
environments, l'arth aml Phmetury Science Letters. 68.88-1110. M,xartN J. H.. G. A, KNACI!X, D. M. Ka~tt. and W. W. Bt~OE;NKOW (1987) VI:,RTI:X: cart~m cycling in the
northeast l'acific. Deep-Sea Research. 34. 267-285. Mc'Et,t~ov M. B. (1983) Marine biological controls on atmospheric CO, clim.'lte. Nature, 3112. 328--329. NAovt S. W. A. (19/17) Some aspects of the oxygen-deficient conditions and dcnitrilication in the Arabian Sea.
Journal of Afarine Research. 45, 11149--1072. Ol.sos R. J. (1981) Differential photoinhibititm of marine nitrifying bacteria, a possible mechanism for the
formation of the primary nitrite maximum. Journal of Marine Re.~earch. 39,227-238. O~tr~Mt.AND R. S.. C. UMaI~Kt;ER. C. W. CuLaEt~rs(m and R. L. SMrrll (1984) Denitrification in San Francisco Bay
intertidal sediments. Applied and Environmental Microbiology, 47, 11116-1112. OzkEncH R. J. (1976) An investigation of the transition from aert~bic to nitrate respiration in marine bacteria in
continuous culture. Ph.D. thesis. University of Washington, 135 pp. PAK t1,. L. A. CoDIsPon and J. R. ZASEVELD (19811) On the intermediate particle maxima associated with oxygen
poor water off western South America. Deep-Sea Research, 27. 783-797. PAVNE W. J. (1981) Denitrification. Wiley-lnterscience. New York. 214 pp. Pom M. and D. D. FOCHT (1986) I'~N kinetic analysis of N,, production by Nitrosomonas europaea, an example of
nitrilier denitritication. Applied and Enviromnental Microbiology. 49, 1134-1141. Rtc.AaOS F. A. (1965) Anoxic basins and fjords. In: Chemical oceanography. Vol. 1, J. P. RHyY and G.
SKmaOW, editors, Academic Press. New York, pp. 611-645. RJcnaaos F. A. ( 1981 ) Coastal upwelling. American Geophysical Union, Washington. DC, 529 pp. RJCHARDS F. A. and W. W. BROESKOW 11971) Chemical changes, including nitrate reduction, in Darwin Bay,
Galapagos Archipelago, over a 2-month period. Lmmology and Oceanography. 16,758-765. ROaERTSOS L. A. and J. G. KUESI~s 11984) Aerobic denitrification, a controversy revived. Archiv fur
Microbiology, 139, 351-354. SPINRAD R. W., H. E. GLOVER. B. B. WARD, L. A. CODISPOTI and G, KULLENBURG (1989) Suspended particles
and bacterial maxima in Peruvian coastal waters during a cold water anomaly. Deep-Sea Research. 36.715- 733.
Bacterial transformations of inorganic nitrogen 1541
STAIIESINIC N. (1980) The vertical flux of particulate organic matter in the Peru coastal upwelling as measured with a free-drifting sediment trap. Woods Hole OceanograPhic Institute Technical Report no. 80-4, 3 5 pp.
SrE~STaOM M. K. and R. A. PODU*S~ (1980) The effect of dissolved oxygen concentration on nitrification. Water Research. 14,653-6-19.
SC'ESS E. ( 198111 Particulate organic carbon flux in the oceans-surface productivity and oxygen utilization. Nature. 288. 260-263.
WADA E. and A. HArrORI (19721 Nitrite distribution and nitrate reduction in deep-sea waters. Deep-Sea Research. 19. 123-132.
WaJm S.. A. NAQVl. R. J. NORO,'~HA and C. V. GAr~GHADA~ REDDV (19821 Denitrification in the Arabian Sea. Deep-Sea Research, 29, 459--169.
W,~at~ B. B. and O. ZAFmtOU ( 19881 Nitrification and nitric oxide in the oxygen minimum of the eastern tropical North Pacific. Deep-Sea Research. 35. 1127-1 I42.
WARD B. B.. M. C. TALBOT and M. J. PERaY ( 19841 Contributions of the phytoplankton and nitrifying bacteria to ammonium and nitrite dynamics in coastal waters. Continental Shelf Research. 3.383-398.
WARD B. B.. H. E. GLOVER and F, LWSCHL'LrZ (1989a) Chemoautotrophic activity and nitrification in the oxygen minimum zone off Peru. Deep-Sea Research. M, 1031-1051.
WARD B. B.. K. A. KILrAralcK. E. H. RES~Ea and R. W. EPPLEY (1989b) Biological nitrogen cycling in the nitraclin¢. Limnoh,gy and Oceanography. 34. 493-513.
WHEELER P. A. and D. L. KZRCHMAN ( 19861 Utilization of inorganic and organic nitrogen by bacteria in marine systcms. Limnology and Oceanography. 31. 998--1(IO9.
WHrrLED~E T. E.. S. C. MALLOV. C. J. Patron and C. O. WIRICK ( 1981 ) Automated nutrient analysis in seawater. Brookhaven National Laboratory Report no. 51398. 216 pp.
WoostER W. S.. T. J, CHow and I. BABRErr (1965) Nitrite distribution in Peru coastal waters. JournalofMarine Research. 2,t, 21(I-221.
WvRrgl K. ( 19631 The horizontal and vertical field of motion in the Peru Current. Bulh'tin of Scripps Institute of Oceanography. 8.313--346.
WVRIKI K. (191"+6)Oceanography of the Ea,~tcrn Equatorial Pacific Ocean. Oceanography atul Marine Biology Annual Review. 4.33-68.
YuN~; Y. L.. W. C. WANe; and A. A. |,ACTS ( 19761 Greenhouse effect due to nitrous oxide. Geophysical Research Letters. 3. 619-621.
Zl.'rA S., "I. RIVERA and A. IIt:SrAMENIF (ltl,~3) Hydrologic aspects of the nl;,lin upwclling .'trc:l off Peru. In: ('oaxtal apwelling, it.~ .~edimt'ttt record. Part tl. St'ditneating records of ant'ient coastal upwelling. E. SUESS and J. "['HIEI)I . editor,,, pp.235-257.