Embed Size (px)
Citation preview
BACTERIAL SPECIES SPECTROSCOPIC CHARACTERIZATION BY FTIR, NORMAL
RAMAN AND SURFACE ENHANCED RAMAN SCATTERING
By
Tatiana Luna Pineda
A thesis submitted in partial fulfillment of the requirements for the degree of MASTER OF SCIENCE
In Chemistry
UNIVERSITY OF PUERTO RICO
MAYAGÜEZ CAMPUS 2006
Approved by: ________________________________ Samuel P. Hernández Rivera, Ph.D. President, Graduate Committee
__________________ Date
________________________________ Carlos Rios Velazquez, Ph.D. Member, Graduate Committee
__________________ Date
________________________________ Julio G. Briano Peralta, Ph.D. Member, Graduate Committee
__________________ Date
________________________________ Nairmen Mina Camilde, Ph.D. Member, Graduate Committee
__________________ Date
________________________________ Guillermo Colon Burgos, Ph.D. Representative of Graduate Studies
__________________ Date
________________________________ Francis Patrón, Ph.D. Chairperson of the Chemistry Department
__________________ Date
ii
ABSTRACT
Bioterrorism and its high potential for mass destruction has been subject of increasing
international concern. Only modest microbiological skills are needed to produce and
effectively use biological weapons. Production costs are low and aerosol dispersal
equipment from commercial sources can be adapted for biological weapon dissemination.
These prevailing conditions have motivated the increased interest in the application of
several physicochemical analytical techniques for the rapid detection and identification of
microorganisms. Fourier Transform Infrared (FTIR), Raman spectroscopy and Surface
Enhanced Raman Scattering (SERS) require minimum sample and allow for fast
identification of microorganisms. The use of these techniques for characterization of the
spectroscopic signatures of these agents and their simulants has recently gained
considerable attention because these techniques can be easily adapted for standoff
detection from considerable distances. The techniques also show high sensitivity,
selectivity, and offer near real time detection duty cycles.
This research focuses in laying the grounds for the simultaneous spectroscopic detection
and differentiation of Staphylococcus spp., Pseudomonas spp., Bacillus spp., and
Enterobacteriaceae spp., together with discrimination of their species. In order to
achieve the proponed objective, protocols to handle, cultivate and analyze the bacterial
species have been developed. Spectroscopic similarities and marked differences have
been found for FTIR and Spontaneous or Normal Raman spectra, and SERS spectra using
silver nanoparticles assisted spectroscopy. The use of principal component analysis
(PCA), discriminate factor analysis (DFA) and a hierarchical cluster analysis (HCA) were
used to evaluate the efficiency of identifying potential threat bacterial from their spectra
collected on single bacteria. The first DFA and HCA for the Raman, SERS and FTIR
spectra of the bacteria showed low discrimination between the diverse bacterial species.
However, the results obtained from a second DFA and HCA demonstrate the high
discrimination capability of the techniques. The spectroscopic study could be extended to
examine the spores produced by selected strains since these are more prone to be used as
Biological Warfare Agents (BWA) due to their increased mobility and possibility of
airborne transport.
iii
RESUMEN
El bioterrorismo y su alto potencial de destrucción masiva, ha sido un tema que ha
aumentado la preocupación de la comunidad internacional. Las habilidades
microbiológicas necesarias para producir y utilizar con eficacia las armas biológicas, son
realmente modestas. Los costos de producción son bajos y los equipos comerciales de
dispersión por aerosol se pueden adaptar fácilmente para la difusión de las armas
biológicas. Estas condiciones han desarrollado un creciente interés en el uso de algunas
técnicas fisicoquímicas analíticas para la rápida detección e identificación de
microorganismos. La espectroscopia de Infrarrojo con transformada de Fourier (FTIR), la
espectroscopia Raman y la espectroscopia de dispersión Raman amplificada por
superficie (SERS), requieren una mínima preparación de la muestra para una
identificación rápida de microorganismos. El uso de estas técnicas para la caracterización
de la huella espectroscópica de estos agentes y de sus simulantes ha aumentado
considerablemente, debido al hecho de que estas técnicas se pueden adaptar fácilmente
para la detección de estos a distancias considerables. Además, estas técnicas muestran
alta sensibilidad, selectividad y los tiempos de detección son bastante cortos.
Esta investigación se enfoca en establecer las bases para la detección y diferenciación
espectroscópica de Staphylococcus spp., Pseudomonas spp., Bacillus spp. y
Enterobacteriaceae spp., junto con la identificación de sus especies. Para alcanzar el
objetivo propuesto, se han desarrollado protocolos para el manejo, cultivo y análisis de
las especies bacterianas. Se han encontrado semejanzas y diferencias espectroscópicas
marcadas para los espectros de FTIR, Raman y SERS usando nanopartículas de plata.
Para evaluar la eficacia de las técnicas espectroscópicas en la diferenciación de las
especies bacterianas puras, se utilizó, análisis de componentes principales (PCA), análisis
de factor discriminante (DFA) y por ultimo un análisis jerárquico de agregados (HCA).
El primer DFA y HCA para las tres técnicas espectroscópicas mostró baja discriminación
entre las especies bacterianas. Sin embargo, un segundo análisis realizado para cada
técnica, muestran una alta capacidad de discriminación. El estudio se podría ampliar a las
esporas producidas por algunos de estos microorganismos, puesto que estos son más
propensos a ser utilizados como agentes biológicos, debido su fácil manejo y transporte.

iv
Copyright © by Tatiana Luna‐Pineda
2006

v
To my loves:
God, my parents, my brother, my chocolate candy (J. Camilo) and Morty.
vi
ACKNOWLEDGEMENTS I want to thank for God to accompany itself at all the moments of my life.
I want to start expressing a sincere acknowledgement to my advisor, Dr. Samuel
Hernandez-Rivera because she gave me the opportunity to research under her guidance
and supervision.
I would like to thank Dr. Carlos Rios-Velazquez for allowing me to use the lab facilities
and for the great interest that he has shown in my work.
To my graduate committee: Dr. Nairmen Mina and Dr. Julio Briano, for their
collaboration during this period.
To Kristina Soto, thanks for helping me all the time and the lab partners: Edwin De La
Cruz, Leonardo Pacheco, Gabriel Perez and Indira Jerez by its collaboration in this work.
To my friends: Edwin De La Cruz, Andrea Cabanzo, Myrna Reyes, Liliana Rizo and
Celia Osorio.
Thanks to Morty for his love and unconditional support. Words do not exist to thank for
everything what it gives me.
To my family, Ramiro Luna, Luz Marina Pineda, Javier R. Luna, J. Camilo Luna, Ana
Julia de Luna, Dario Pineda, Graciela Navas, and the Pineda Princess: Laura, Jesica,
Diana and Leydi, for their unconditional love and inspiration.
Collaboration with the Center for Chemical Sensors Development of the University of
Puerto Rico–Mayagüez sponsored by the Department of Defense, University Research
Initiative–Multidisciplinary University Research Initiative (URI–MURI) Program, under
grant number DAAD19-02-1-0257.

vii
Finally, I would like to acknowledge the University of Puerto Rico, Mayagüez Campus
and department of Chemistry for the opportunity to study in Puerto Rico.
TABLE OF CONTENT
ABSTRACT ................................................................................................................................................. II RESUMEN..................................................................................................................................................III ACKNOWLEDGEMENTS...................................................................................................................... VI 1. INTRODUCTION .................................................................................................................................... 1 2. EXPERIMENTAL BACKGROUND ..................................................................................................... 6
2.1 BACTERIAL CELLS .............................................................................................................................. 6 2.1.1 Surface Structures....................................................................................................................... 6
2.1.1.1 Flagella ................................................................................................................................................. 6 2.1.1.2 Pili (Fimbriae)...................................................................................................................................... 7 2.1.1.3 Capsules ............................................................................................................................................... 7
2.1.2 Important Chemical Components of Surface Structures........................................................... 7 2.1.2.1 Cell Wall Peptidoglycans .................................................................................................................... 7 2.1.2.2 Teichoic Acids...................................................................................................................................... 7 2.1.2.3 Lipoteichoic Acids ............................................................................................................................... 8 2.1.2.4 Lipopolysaccharides............................................................................................................................ 8 2.1.2.5 Wall-Less Forms.................................................................................................................................. 8
2.1.3Cytoplasmic Structures ................................................................................................................ 8 2.1.3.1 Plasma Membrane............................................................................................................................... 8 2.1.3.2 Organelles ............................................................................................................................................ 9 2.1.3.3 Endospores........................................................................................................................................... 9
2.1.4 Gram-Positive.............................................................................................................................. 9 2.1.4.1 Bacillus spp. ......................................................................................................................................... 9
2.1.4.1.1 Bacillus subtilis ............................................................................................................................ 9 2.1.4.1.2 Bacillus cereus ........................................................................................................................... 10 2.1.4.1.3 Bacillus thuringiensis ................................................................................................................ 10 Bacillus thuringiensis generally occurs in the soil. Pathogenicity for larvae of Lepidoptera and the production in the cell of a protein parasporal crystal [Bergey’s Manual, 1984]. ....................................... 10
2.1.4.2 Staphylococcus spp. ........................................................................................................................... 10 2.1.4.2.1 Staphylococcus epidermidis ....................................................................................................... 10 2.1.4.2.2 Staphylococcus aureus............................................................................................................... 10
2.1.5 Gram-Negative .......................................................................................................................... 11 2.1.5.1 Enterobacteriaceae spp. ..................................................................................................................... 11
2.1.5.1.1 Escherichia coli.......................................................................................................................... 11 2.1.5.1.2 Salmonella tennessee ................................................................................................................. 11 2.1.5.1.3 Klebsiella pneumoniae ............................................................................................................... 11 2.1.5.1.4 Enterobacter aerogenes ............................................................................................................. 12 2.1.5.1.5 Proteus mirabilis ........................................................................................................................ 12
2.1.5.2 Pseudomonas spp. .............................................................................................................................. 12 2.1.5.2.1 Pseudomonas aeruginosa .......................................................................................................... 12
2.2 BASIC PRINCIPLES OF OPTICAL SPECTROSCOPY ............................................................................ 13 2.3 INFRARED SPECTROSCOPY (IR) ....................................................................................................... 14 2.3.1 FOURIER TRANSFORM INFRARED (FTIR) SPECTROSCOPY.......................................................... 16
2.3.1 Advantages of FTIR spectroscopy ............................................................................................ 18 2.4 RAMAN SPECTROSCOPY.................................................................................................................... 19 2.5 SURFACE ENHANCED RAMAN SPECTROSCOPY (SERS) .................................................................. 21
2.5.1 Introduction to SERS ................................................................................................................ 21 2.5.2 SERS mechanisms and SERS enhancement factors ............................................................... 22
3. PREVIOUS WORK ............................................................................................................................... 28 4. METHODOLOGY................................................................................................................................. 31
ix
4.1 REAGENTS AND CHEMICALS............................................................................................................. 31 4.2 ORGANISMS SELECTION ................................................................................................................... 31 4.3 INSTRUMENTATION ........................................................................................................................... 32 4.4 GROWTH KINETICS OF BACTERIAL ................................................................................................. 33 4.5 SYNTHESIS OF SILVER COLLOIDS..................................................................................................... 34 4.6 SEM IMAGES OF BACTERIAL CELLS................................................................................................ 34 4.7 BACTERIAL SAMPLE PREPARATION ................................................................................................. 34
4.7.1 Raman Sample Preparation...................................................................................................... 35 4.7.2 SERS Sample Preparation ........................................................................................................ 35 4.7.3 FT-IR Sample Preparation ....................................................................................................... 36
4.8 DATA ANALYSIS ................................................................................................................................ 36 5. RESULTS AND DISCUSSION............................................................................................................. 37
5.1 CHARACTERIZATION OF SILVER COLLOIDS .................................................................................... 37 5.1.1 Plasmon Absorption Band for Silver Colloids ......................................................................... 37 5.1.2 Silver Colloid used for adenine detection ................................................................................. 38
5.2 BACTERIA SPECIES DATA ANALYSIS ................................................................................................ 38 5.2.1 Growth curve ............................................................................................................................. 38
5.2.2 SEM IMAGES .................................................................................................................................. 39 5.3 RAMAN AND SERS SPECTRA............................................................................................................. 40 5.3 FTIR SPECTRA .................................................................................................................................. 48 5.4 STATISTICAL DATA ANALYSIS.......................................................................................................... 51
CONCLUSIONS......................................................................................................................................... 64 FUTURE WORKS ..................................................................................................................................... 66 REFERENCES ........................................................................................................................................... 67 APPENDIX A ............................................................................................................................................. 70
List of Figures
Figure 1. Typical energy-level diagram showing the ground state and the first excited
stated. ........................................................................................................................ 14 Figure 2. The electromagnetic spectrum........................................................................... 16 Figure 3. FTIR spectrometer. a) Block scheme of the basic components of an FTIR
spectrometer. b) Working principle of a Michelson interferometer consisting of a light source, beam splitter, fixed mirror, moving mirror, detector and sample (upper panel). A single frequency light source is transformed to the interferogram (lower panel)......................................................................................................................... 17
Figure 4. Simple schematic diagram for understanding the concept of electromagnetic SERS enhancement................................................................................................... 23
Figure 5. SERS-active colloidal. Silver particles in different aggregation stages, demonstrating the fractal nature of these structures together with the appropriate extinction curves [kneipp, K. et al., 2002]. ............................................................... 26
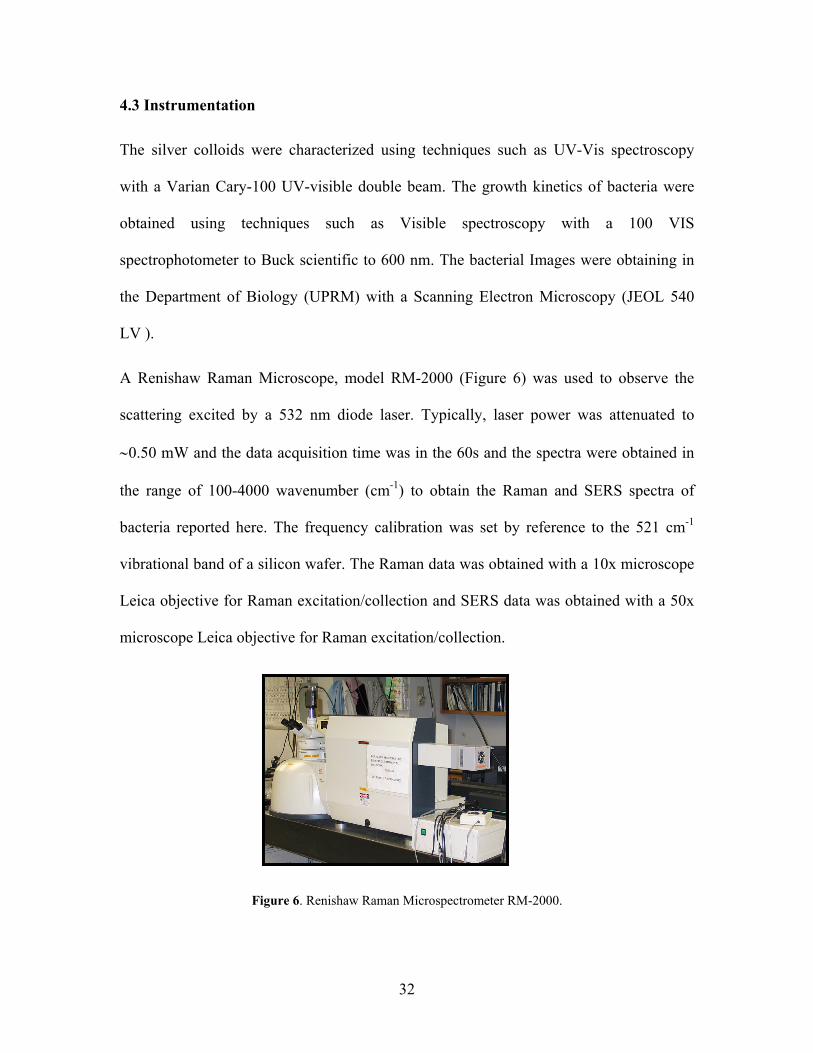
Figure 6. Renishaw Raman Microspectrometer RM-2000. .............................................. 32 Figure 7. FTIR spectrometer, Bruker IFS 66v/S............................................................... 33 Figure 8. UV-VIS spectra of colloidal silver nanoparticles used in this research: ........... 37 Figure 9. Raman Spectra: a) adenine 1x10⁻⁴ M with silver colloid; b) silver colloid; c)
adenine 1x10⁻⁴ M. ..................................................................................................... 38 Figure 10. The growth behavior of bacteria: I. a) B. subtilis, b) B. cereus, c) B.
thuringiensis; II. d) S. epidermidis, e) S. aureus. III. a) E. coli, b) S. tennessee, c) K. pneumoniae, d) E. aerogenes, e) P. mirabilis and IV. P. aeruginosa.................................................................................................................................... 39
Figure 11. SEM images of Bacillus. a)B. subtilis, b)B. cereus and c)B. thuringiensis .... 39 Figure 12. SEM images to Enterobacteriaceae species and Pseudomonas aeruginosa: a)
E. coli, b)S. tennessee, c) K. pneumoniae, d) E. aerogenes, e) P. mirabilis; f) P. aeruginosa................................................................................................................. 40
Figure 13. Bacillus thuringiensis Normal Raman spectrum (30x) (blue) and the SERS spectrum (fuchsia)..................................................................................................... 42
Figure 14. Escherichia coli Raman spectrum (20x) (blue) and the SERS spectrum (fuchsia) .................................................................................................................... 42
Figure 15. Representative Raman spectra of Gram-positive species: a) B. subtilis; b) B. cereus; c) B. thuringiensis; d) Staphylococcus epidermidis; and e) S. aureus........................................................................................................................ 43
Figure 16. Representative Raman spectra of each Gram-negative species: a) E. coli; b) S. Tennessee; c) K. pneumoniae; d) E. aerogenes; e) P. mirabilis; f) P. aeruginosa................................................................................................................. 43
Figure 17. Representative SERS spectra of Gram-positive species: a)B. subtilis; b) B. cereus; c) B. thuringiensis; d) S. epidermidis; and e) S. aureus. ......... 44
Figure 18. Representative SERS spectra of Gram-negative species: a) E. coli; b) S. Tennessee; c) K. pneumoniae; d) E. aerogenes;, e) P. mirabilis; f) P. aeruginosa................................................................................................................. 44
xi
Figure 19. The averaged FTIR spectra of Gram-positive species: a) B. subtilis; b) B. cereus; c) B. thuringiensis; d) Staphylococcus epidermidis; and e) S. aureus........................................................................................................................ 48
Figure 20. Averaged FTIR spectra of Gram-negative species: a) E. coli; b) S. Tennessee; c) K. pneumoniae; d) E. aerogenes; e) P. mirabilis; f) P. aeruginosa. ................... 48
Figure 21. PC-DFA plot of Raman spectra of the all bacterial species analyzed in this research. .................................................................................................................... 53
Figure 22. PC-DFA plot of raman spectra of B. subtilis, B. cereus, S. epidermidis and E. aerogenes .................................................................................................................. 53
Figure 23. Dendrogram resulting from HCA showing the relationship among all 11 bacteria species analyzed by Raman......................................................................... 54
Figure 24. Dendrogram resulting from HCA showing the relationship among four bacteria species analyzed by Raman Spectroscopy. ................................................. 55
Figure 25 PC-DFA plot of SERS spectra of the bacterial species analyzed in this research. .................................................................................................................... 56
Figure 26 PC-DFA plot of SERS spectra of the gram positive species of bacteria used in this research. ............................................................................................................. 57
Figure 27 PC-DFA plot of SERS spectra of the gram positive species of bacteria used in this research. ............................................................................................................. 57
Figure 28. Dendrogram resulting from HCA showing the relationship among all 11 bacteria analyzed by SERS. ...................................................................................... 58
Figure 29. Dendrogram resulting from HCA showing the relationship among gram-positive bacteria species analyzed by SERS............................................................. 59
Figure 30 Dendrogram resulting from HCA showing the relationship among gram-negative bacteria species analyzed by SERS. ........................................................... 60
Figure 31 PC-DFA plot of FTIR spectra of the eleven bacterial species analyzed in this research ..................................................................................................................... 61
Figure 32 PC-DFA plot of FTIR spectra of the then bacterial species analyzed in this research ..................................................................................................................... 61
Figure 33 Dendrogram resulting from HCA showing the relationship among all 11 bacteria analyzed by FTIR. ....................................................................................... 62
Figure 34 Dendrogram resulting from HCA showing the relationship among all 11 bacteria analyzed by FTIR. ....................................................................................... 63
xii
List of Tables
Table 1 Approximate number of bacterial cell analyzed with Raman and SERS, and CFU/µL for each bacterial specie. ............................................................................ 41
Table 2 Raman and SERS bands observed in spectra of gram-positive bacterial cells and tentative assignment.................................................................................................. 46
Table 3 Raman and SERS bands observed in spectra of gram-negative bacteria studied and tentative assignment. .......................................................................................... 47
Table 4 FTIR bands observed in spectra of gram-positive bacterial cells and tentative assignment................................................................................................................. 49
Table 5 FTIR bands observed in spectra of gram-positive bacterial cells and tentative assignment................................................................................................................. 50
Table 6 Bacterial species used in bacterial discrimination studies. .................................. 52
xiii
APPENDIX LIST
Figure A1. Bacillus subtilis Raman spectrum (20x) (blue) and the SERS spectrum
(fuchsia), Factor enhancement is 1.0x10⁴. ................................................................ 70 Figure A2 Bacillus cereus Raman spectrum (20x) (blue) and the SERS spectrum
(fuchsia), Factor enhancement is 3.0x10⁴. ................................................................ 70 Figure A3Staphylococcus aureus Raman spectrum (40x) (blue) and the SERS spectrum
(fuchsia), Factor enhancement is 3.0x10⁴. ................................................................ 71 Figure A 4Staphylococcus epidermidis Raman spectrum (30x) (blue) and the SERS
spectrum (fuchsia), Factor enhancement is 1.5x10⁴. ................................................ 71 Figure A 5Salmonella tennessee Raman spectrum (10x) (blue) and the SERS spectrum
(fuchsia), Factor enhancement is 1.5x10⁴. ................................................................ 72 Figure A 6 Klebsiella pneumoniae Raman spectrum (10x) (blue) and the SERS spectrum
(fuchsia), Factor enhancement is 1.5x10⁴. ................................................................ 72 Figure A 7Pseudomonas aeruginosa Raman spectrum (20x) (blue) and the SERS
spectrum (fuchsia), Factor enhancement is 1.5x10⁴. ................................................ 73 Figure A 8 Enterobacter aerogenes Raman spectrum (20x) (blue) and the SERS spectrum
(fuchsia), Factor enhancement is 2.0x10⁴. ................................................................ 73 Figure A 9Proteus mirabilis Raman spectrum (10x) (blue) and the SERS spectrum
(fuchsia), Factor enhancement is 1.0x10⁴. ................................................................ 74
1. INTRODUCTION
Analytical technologies are currently in demand for Homeland Security and National
Defense applications. Domestic preparedness requires a wide array of detection
capabilities for a range of potential attack scenarios. For example, a single location could
be attacked by placing an explosive package, carrying an explosive on a person, releasing
chemical/bacterial dispersion into the water supply, or an armed gunman. The threat then
is expanded by considering the different types of explosives, chemical warfare (CW)
agents, biological warfare agents (BWA) and toxins that need to be identified quickly and
accurately. Today no single analytical technique is able to address all of the above
possibilities; the future might bring a series of sensors that can be used to detect a series
of hazardous materials in a rapid, multimode, reliable manner. As for the present time, a
variety of analytical technologies is available to collectively detect and identify potential
threats to the public in single mode operation.
Biological contamination is not only a medical problem. It also represents a hazardous
threat for various food-related industries and plays a large role in pharmaceutical and
biotechnology clean-room production environment. In these fields, a fast identification of
pathogenic and no pathogenic microorganisms is necessary, because the time required for
the identification of pathogens is an important determinant of infection-related mortality
rates of hospitalized patients. Rapid identification techniques significantly reduce
mortality and costs associated with infectious diseases. Identification and characterization
of bacteria starts by inspecting the colony morphology when the cells have been cultured
2
on solid media, followed by microscopic analysis of gram-stained preparations [Rosch, P.
et al., 2005].
Bacteria can be divided into groups based on their cell shape, arrangements and cell wall
characteristics. Based on these morphological characteristics, a series of tests can be
performed to examine the biochemical, physiological, and nutritional properties of an
organism, leading to its identification. Generally, the tests are combined in a series of
solid and/or liquid media, which are inoculated with bacteria and interpreted after a
certain incubation period. A large number of different tests are often needed for a
definitive identification of the bacteria. These tests require turnaround times from 24 h to
up to 5 days between receipt of material and positive identification results by the clinician
[Maquelin, K. et al., 2002]. Thus, empirical treatment with broad-spectrum antibiotics is
often started while awaiting further identification of the bacteria. It has been reported
that, as a result of this, 10-30% of patients suffering form bloodstream infections in
intensive care units (ICUs) do not initially receive the correct antibacterial therapy.
Mortality rates in this group have been reported to be 30-60% higher than in the group
that promptly receives appropriate therapy [Ibrahim, E. et al., 2000]. Apart form the risk
that the empirical treatment may not be effective at all, this practice may lead to adverse
toxic side effects and it is known to aggravate problems with resistance to antibacterial
agents [Maquelin, K. et al., 2003].
An alternative approach to the analysis of microorganisms is the application of
vibrational spectroscopic techniques: infrared (IR) absorption, Normal Raman (NR)
Scattering and Surface Enhanced Raman Scattering (SERS)], which have a long tradition
3
since the vibrational spectrum displays fingerprinting information of the chemical
composition of each bacterium. While an IR spectroscopic investigation of bacterial cells
requires a few hundred cells from controlled cultivation conditions for an analysis and
drying steps, this is not necessary when applying Raman spectroscopy. In particular,
when only a small sample amount is required when SERS spectroscopy is used [Rosch,
P. et al., 2005].
In recent years, much effort has been invested in the development of new techniques for
the identification of microorganisms, which include molecular methods, such as mass
spectrometry, electrospray ionization and matrix-assisted laser desorption ionization,
Fourier Transform Infrared (FTIR) and Raman spectroscopy. Among these methods,
vibrational spectroscopy (FTIR and Raman) is a reagentless/solvenless procedure in
which there is no need to add chemical dyes or labels for identification. The
characteristics of the absorbed or scattered light depend on the molecules found within
the sample and the environment in which the molecules found. Another advantage of
vibrational spectroscopy is that it is a rapid, specific, and a noninvasive analytical
method, which provides a promising, means for the identification of a single bacterium.
When compared to FTIR, which is for measuring the IR absorption of the sample, Raman
spectroscopy measures the inelastically scattered light following excitation. The
advantages of Raman spectroscopy are suitability for aqueous samples analysis, the
intense IR absorption of water is avoided and spectral bands are sharper and narrower and
more distinguishable.
4
Vibrational spectra of bacterial cells consist of signal contributions of all components in
the cells and therefore reflect their overall molecular composition. Nauman et al. (2000),
using FTIR spectroscopy, showed that such spectra could serve to identify a wide range
of microorganisms. More recently, Raman spectroscopy has been shown to have similar
capabilities [Maquelin, K. et al., 2003]. The high discrimination power of vibrational
spectroscopy is illustrated by the accurate differentiation of closely related bacterial
species such as E. faecium, E. hirae, E. faecalis, E. gallinarum [Krisker, K. et al., 2003].
Various publications have confirmed the applicability of these methods to discriminate
between bacteria at the species level and even at the strain level [Curk, M. et al., 1994].
Simplicity of sample preparation and speed of analysis are important advantages when
vibrational methods are compared to classical microbial identifications tools [Pupples,
G., 1999].
Biological molecules such as nucleic acids, proteins, lipids, and carbohydrates all
generate specific Raman spectra, which provide biochemical information regarding the
molecular composition, structure, and interactions in cells. The molecular composition
and structure are different among different bacterial species. Therefore, from the whole-
cells spectra, single microorganisms could be identified and discriminated.
Thus, the aim of the present research was to combine FTIR, Normal Raman and SERS
spectroscopies with multivariate analysis for the reliable discrimination of bacteria.
Eleven bacterial species were used to demonstrate the capability of spectroscopy
techniques in the identification and discrimination of bacterial cells between various
species.

5
This research started the discrimination of bacterial species at stationary phase with
multivariate analysis technique of Principle Component Analysis (PCA). Then the
spectroscopic discrimination of bacterial species were accomplished using other
techniques such as: Discriminate Factor Analysis (DFA) and hierarchical cluster analysis
(HCA).
6
2. EXPERIMENTAL BACKGROUND
2.1 Bacterial Cells
All bacteria, both pathogenic and saprophytic, are unicellular organisms that reproduce
by binary fission. Most bacteria are capable of independent metabolic existence and
growth, but species of Chlamydia and Rickettsia are intracellular organisms. Bacterial
cells are extremely small and are most conveniently measured in microns (0.1-6 µ). They
range in size from large cells such as Bacillus anthracis (1.0 to 1.3 µm x 3 to 10 µm) to
very small cells such as Pasteurella tularensis (0.2 x 0.2 to 0.7 µm). Mycoplasmas
(atypical pneumonia group) are even smaller, measuring 0.1 to 0.2 µm in diameter.
Bacteria therefore have a high surface-to-volume ratio: about 100,000 [Beveridge, 1983;
Ghuysen, 1994].
Prokaryotes have a nucleoid (nuclear body) rather than an enveloped nucleus and lack
membrane-bound cytoplasmic organelles. The plasma membrane in prokaryotes performs
many of the functions carried out by membranous organelles in eukaryotes.
Multiplication is by binary fission.
2.1.1 Surface Structures
2.1.1.1 Flagella
The flagella of motile bacteria differ in structure from eukaryotic flagella. A basal body
anchored in the plasma membrane and cell wall gives rise to a cylindrical protein
filament. The flagellum moves by whirling about its long axis. The number and
arrangement of flagella on the cell are diagnostically useful.
7
2.1.1.2 Pili (Fimbriae)
Pili are slender, hair like, proteinaceous appendages on the surface of many (particularly
Gram-negative) bacteria. They are important in adhesion to host surfaces.
2.1.1.3 Capsules
Some bacteria form a thick viscous polysaccharide gel outer capsule of high molecular
weight; others have more amorphous slime layers. Capsules confer resistance to
phagocytosis.
2.1.2 Important Chemical Components of Surface Structures
2.1.2.1 Cell Wall Peptidoglycans
Both gram-positive and gram-negative bacteria possess cell wall peptidoglycans, which
confer the characteristic cell shape and provide the cell with mechanical protection.
Peptidoglycans are unique to prokaryotic organisms and consist of a glycan backbone of
muramic acid and glucosamine (both N-acetylated), and peptide chains highly cross-
linked with bridges in gram-positive bacteria (e.g., Staphylococcus aureus) or partially
cross-linked in gram-negative bacteria. The cross-linking transpeptidase enzymes are
some of the targets forβ-lactam antibiotics.
2.1.2.2 Teichoic Acids
Teichoic acids are polyol phosphate polymers bearing a strong negative charge. They are
covalently linked to the peptidoglycan in some gram-positive bacteria. They are strongly
antigenic, but are generally absent in Gram-negative bacteria.
8
2.1.2.3 Lipoteichoic Acids
Lipoteichoic acids as membrane teichoic acids are polymers of amphiphitic
glycophosphates with the lipophilic glycolipid and anchored in the cytoplasmic
membrane. They are antigenic, cytotoxic and adhesins (e.g., Streptococcus pyogenes).
2.1.2.4 Lipopolysaccharides
One of the major components of the outer membrane of Gram-negative bacteria is
lipopolysaccharide (endotoxin), a complex molecule consisting of a lipid A anchor, a
polysaccharide core, and chains of carbohydrates. Sugars in the polysaccharide chains
confer serologic specificity.
2.1.2.5 Wall-Less Forms
Two groups of bacteria devoid of cell wall peptidoglycans are the Mycoplasma species,
which possess a surface membrane structure, and the L-forms that arise from either
Gram-positive or Gram-negative bacterial cells that have lost their ability to produce the
peptidoglycan structures.
2.1.3Cytoplasmic Structures
2.1.3.1 Plasma Membrane
The bacterial plasma membrane is composed primarily of proteins and phospholipids
(about 3:1). It performs many functions, including transport, biosynthesis, and energy
transduction.
9
2.1.3.2 Organelles
The bacterial cytoplasm is densely packed with 70S ribosomes. Other granules represent
metabolic reserves (e.g., poly-b-hydroxybutyrate, polysaccharide, polymetaphosphate,
and metachromatic granules).
2.1.3.3 Endospores
Bacillus and Clostridium species can produce endospores: heat-resistant, dehydrated
resting cells that are formed intracellularly and contain a genome and all essential
metabolic machinery. The endospore is encased in a complex protective spore coat.
2.1.4 Gram-Positive
2.1.4.1 Bacillus spp.
Bacillus spp have straight rods shapes, measuring 0.5-2.5 µm in diameter by 1.2-10.0 µm
in length. They produce endospores (very resistant to many adverse conditions),
sporulation not repressed by exposure to air, flagella peritrichous, aerobic or facultative
anaerobic, chemoorganotrophs [Bergey’s Manual, 1984]. They exhibit an array of
physiologic abilities that allow them to live a wide range of habitats, including many
extreme habitats such as desert sands, hot springs and Arctic soils [Perreten et al., 2005].
2.1.4.1.1 Bacillus subtilis
Bacillus subtilis are round or irregular, surface dull; become opaque, aerobic, growth
active at pH 5.5-8.5; endospores are widespread. They can ve generally can be found in
the soil [Bergey’s Manual, 1984]. B. subtilis is not considered a human pathogen [CDC,
2006].
10
2.1.4.1.2 Bacillus cereus
The rods tend to occur in chains. Colonies have a dull or frosted glass appearance, and
motile, extracellular products include hemolysin, soluble toxin lethal for mice and
enzymes lytic for bacterial cells; spores are widespread [Bergey’s Manual, 1984].
Multiplication has been observed chiefly in foods and may lead food poisoning [FDA,
2006]. B. cereus is the responsible for minority of the food borne illness [CDC, 2006].
2.1.4.1.3 Bacillus thuringiensis
Bacillus thuringiensis generally occurs in the soil. Pathogenicity for larvae of
Lepidoptera and the production in the cell of a protein parasporal crystal [Bergey’s
Manual, 1984].
2.1.4.2 Staphylococcus spp.
Staphylococcus spp. have cells spherical of diameter: 0.5-1.5 µm, occurring in single,
pair or tetrads, nonmotile, facultative anaerobes, cell wall contain peptidoglycan and
teichoic acid, chemoorganotrophs: metabolism respiratory and fermentative [Bergey’s
Manual, 1984].
2.1.4.2.1 Staphylococcus epidermidis
They form spheres, 0.5-1.5 µm in diameter, slow growing and small colonies, cells occur
dominantly in pairs and tetrads, colonies are smooth to mucous, raised, glistening,
circular, entire and translucent to nearly opaque, chemoorganotrophic [Bergey’s Manual,
1984].
2.1.4.2.2 Staphylococcus aureus
Spheres, 0.5-1.0 µm in diameter, cells occur single and in pairs, colonies are smooth,
raised, glistening, circular, entire and translucent, chemoorganotrophic metabolism
11
respiratory and fermentative. [Bergey’s Manual, 1984]. S. aureus cause minor skins
infections, Toxic Shock Syndrome (TSS) [CDC, 2006].
2.1.5 Gram-Negative
2.1.5.1 Enterobacteriaceae spp.
Straight rods, measurements 0.3-1.5 µm in diameter by 0.6-3.0 µm in length, motile by
peritrichous flagella, pathogenicity, chemoorganotrophic: respiratory and fermentative
metabolism, facultative anaerobic, parasitic on mammals and birds, plant [Bergey’s
Manual, 1984].
2.1.5.1.1 Escherichia coli
Cell diameter and length 1.1-1.5µm x 2.0-6.0µm, have polysaccharide capsules or
microcapsules (LPS), motile by peritrichous flagella or non-motile, colonies are smooth,
low convex, moist, gray, with a shiny surface and entire edge, chemoorganotrophic
respiratory and fermentative metabolism. Occur in the lower part of the intestine of warm
blooded animal [Bergey’s Manual, 1984]. Insolated from extraintestinal sites it can be
look upon as primarily opportunistic pathogen. Can be cause gastroenteritis [CDC, 2006].
2.1.5.1.2 Salmonella tennessee
Cell diameter and length 0.7-1.5 x 2.0-5.0µm, usually motile with a peritrichous flagella,
[Bergey’s Manual, 1984]. Occur in the lower part of the intestine of warm blooded
animal, can be cause gastroenteritis [CDC, 2006].
2.1.5.1.3 Klebsiella pneumoniae
Cell diameter and length 0.3-1.0µm x 0.6-6.0µm, capsulated, no-motile,
chemoorganotrophic: metabolism respiratory and fermentative [ATCC, 2006]. K.

12
pneumoniae is normally found in the intestine tract of the man and animals, but in low
numbers. Pathogenicity: can be cause pneumonia, septicemia, infection in wouds or burns
and infections in the urinary tract [CDC, 2006].
2.1.5.1.4 Enterobacter aerogenes
Cell diameter and length 6-1.0µm x 1.2-3.0µm, motile by peritrichous flagella, most
strains of E. aerogenes are resistant to ampicillin and cephalosporins and sensitive to
carbenicillin. Occur in water, sewage, soil, dairy products and the feces of man and
animals [Bergey’s Manual, 1984].
2.1.5.1.5 Proteus mirabilis
Cell diameter and length: 0.4-0.8 µm x 1.0-3.0 µm [Bergey’s Manual, 1984]. Pathogenic:
can be cause urinary tract infections; also secondary invaders, causing septic lesions at
other sides of the body, occur in the intestine of humans and animals, also occur in
manure, soil and polluted water some strains are hemolytic on blood agar, resistant to
penicillin’s and cephalosporins [CDC, 2006].
2.1.5.2 Pseudomonas spp.
Straight or slightly curve rods, measurement 0.5-1.0µm in diameter by 1.5-5.0 µm in
length, motile by polar flagella, strictly aerobic, chemoorganotrophs: metabolism is
respiratory, never fermentative.
2.1.5.2.1 Pseudomonas aeruginosa
Forms two main colony types (solid media): a) large, smooth, with flag edges and
elevated center. b) Small, rough and convex. The bacteria can be insolated from the soil,
and water, particularly from enrichment cultures for denitrifying bacteria. Pigments that
the bacteria can be produce are: pyoverdin, pyocyanin and dark pigments [Bergey’s
13
Manual, 1984]. In clinical cases can be insolated from would, burn and urinary tract
infections. It is the causative agent of “blue pus”, origin of the synonym pyocyaneus.
Occasionally pathogenic for plant [CDC, 2006].
2.2 Basic Principles of Optical Spectroscopy
Spectroscopy is defined as the study of interaction of electromagnetic radiation with
matter, excluding chemical effects. When an electromagnetic wave encounters a
molecule, it can be either scattered (i.e., its direction of propagation changes) or absorbed
(i.e., its energy is transferred to the molecule). If the electromagnetic radiation of the light
is absorbed, the molecule is said to be excited. An excited molecule can posses any one
of a set of discrete amounts of energy described by the laws of quantum mechanics.
These amounts are called the energy levels of the molecule. The major energy levels are
determined by the possible spatial distributions of the electrons and are called electronic
energy levels, on these are superimposed vibrational levels which indicate the various
modes of vibration of the molecule. All these energy levels are described by an energy-
level diagram (Figure 1). A possible electronic transition between the ground state and
the fourth vibrational level of the first excited is indicated bye long arrow. A vibrational
transition within the ground state is indicated by the short arrow. The lowest electronic
level is called the ground state and all others are excited states [Freifelder, D., 1982].

14
Figure 1. Typical energy-level diagram showing the ground state and the first excited stated.
Etotal = Etransition+Eelectronic+Erotation+Evibration+Eelectron spin orientation+Enuclear spin orientation (Equation 1)
Energy can reside in molecules in a number of forms, of which the most important ones,
are translational, electronic, vibrational, and rotational energy. Infrared spectroscopy is
based on molecular vibrations and monitors the transition between vibrational energy
level [Wilson et al., 1995]. Light is a electromagnetic wave. The energy of the wave is:
E=h.c/λ=h.ν (Equation 2)
In which h is Planck’s constant, c is the velocity of light, λ is the wavelength and ν is the
frequency [Freifelder, D., 1982].
2.3 Infrared Spectroscopy (IR)
The IR region of the spectrum extends from the visible region until it overlaps the
microwave, or very short radar, range at wavelengths of some millimeters (10-1-10-4 cm-1)
(see Figure 2). The basic characteristic of this region is that is the number of waves per
centimeter “wavenumber”, that is the number of waves per centimeter, is used to
First excited state
Vibrational levels
Ground stateEN
ERG
Y
Distance between electrons and nucleus or between atoms in a molecule.
First excited state
Vibrational levels
Ground stateEN
ERG
Y
First excited state
Vibrational levels
Ground stateEN
ERG
Y
Distance between electrons and nucleus or between atoms in a molecule.
15
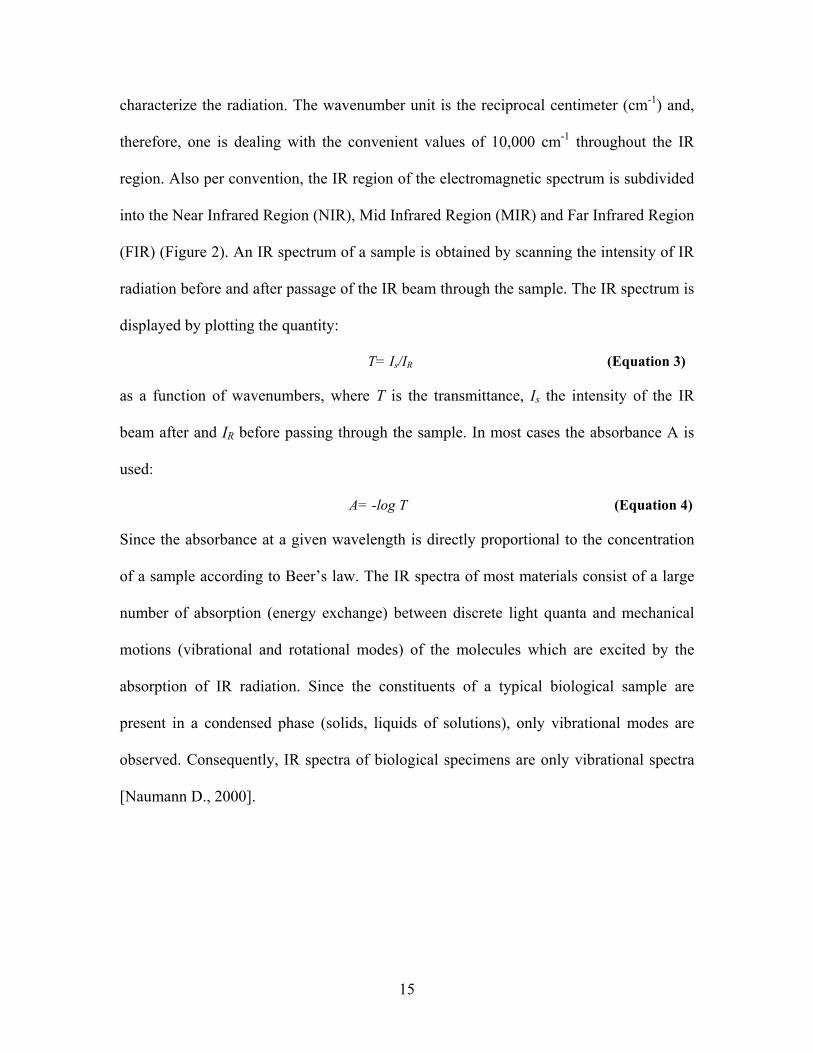
characterize the radiation. The wavenumber unit is the reciprocal centimeter (cm-1) and,
therefore, one is dealing with the convenient values of 10,000 cm-1 throughout the IR
region. Also per convention, the IR region of the electromagnetic spectrum is subdivided
into the Near Infrared Region (NIR), Mid Infrared Region (MIR) and Far Infrared Region
(FIR) (Figure 2). An IR spectrum of a sample is obtained by scanning the intensity of IR
radiation before and after passage of the IR beam through the sample. The IR spectrum is
displayed by plotting the quantity:
T= Is/IR (Equation 3)
as a function of wavenumbers, where T is the transmittance, Is the intensity of the IR
beam after and IR before passing through the sample. In most cases the absorbance A is
used:
A= -log T (Equation 4)
Since the absorbance at a given wavelength is directly proportional to the concentration
of a sample according to Beer’s law. The IR spectra of most materials consist of a large
number of absorption (energy exchange) between discrete light quanta and mechanical
motions (vibrational and rotational modes) of the molecules which are excited by the
absorption of IR radiation. Since the constituents of a typical biological sample are
present in a condensed phase (solids, liquids of solutions), only vibrational modes are
observed. Consequently, IR spectra of biological specimens are only vibrational spectra
[Naumann D., 2000].
16
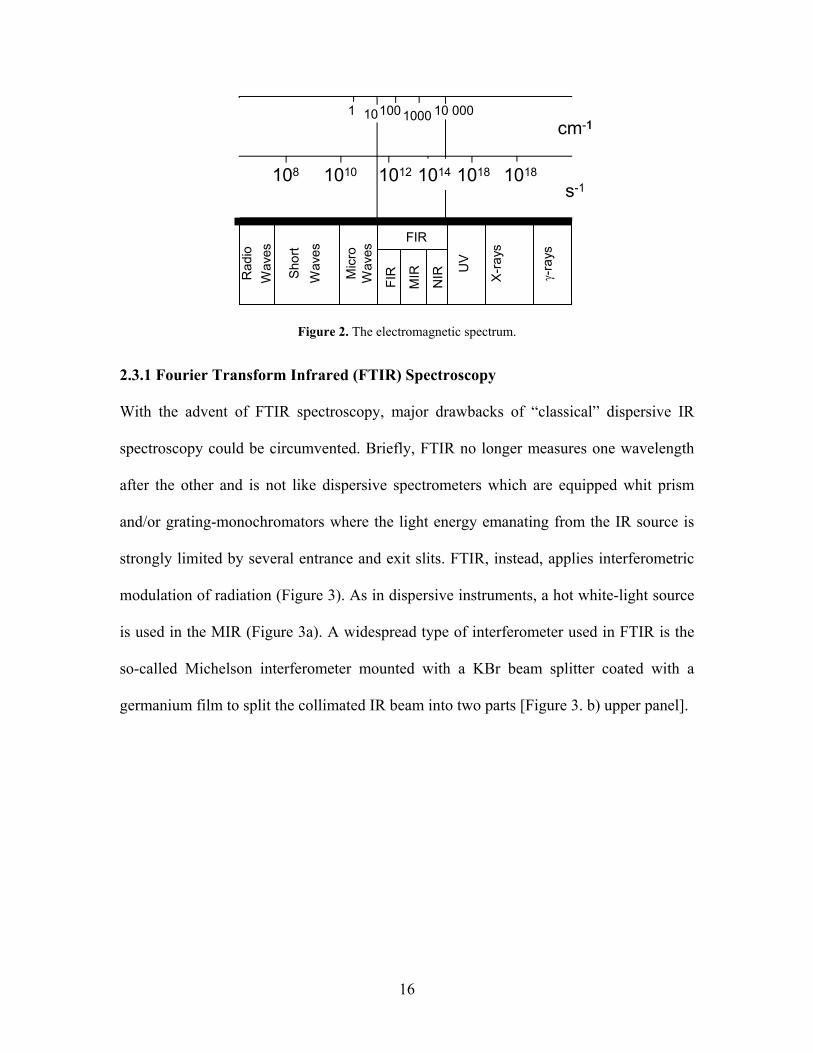
Figure 2. The electromagnetic spectrum.
2.3.1 Fourier Transform Infrared (FTIR) Spectroscopy
With the advent of FTIR spectroscopy, major drawbacks of “classical” dispersive IR
spectroscopy could be circumvented. Briefly, FTIR no longer measures one wavelength
after the other and is not like dispersive spectrometers which are equipped whit prism
and/or grating-monochromators where the light energy emanating from the IR source is
strongly limited by several entrance and exit slits. FTIR, instead, applies interferometric
modulation of radiation (Figure 3). As in dispersive instruments, a hot white-light source
is used in the MIR (Figure 3a). A widespread type of interferometer used in FTIR is the
so-called Michelson interferometer mounted with a KBr beam splitter coated with a
germanium film to split the collimated IR beam into two parts [Figure 3. b) upper panel].
108 1014 1018 101810121010
1 10100 1000 10 000cm-1
s-1
X-r
ays
FIR
FIRM
icro
Wav
es
Rad
ioW
aves
Shor
tW
aves
NIR
MIR γ-
rays
UV
108 1014 1018 101810121010
1 10100 1000 10 000cm-1
s-1
X-r
ays
FIR
FIRM
icro
Wav
es
Rad
ioW
aves
Shor
tW
aves
NIR
MIR γ-
rays
UV
X-r
ays
FIR
FIRM
icro
Wav
es
Rad
ioW
aves
Shor
tW
aves
NIR
MIR γ-
rays
UV
17
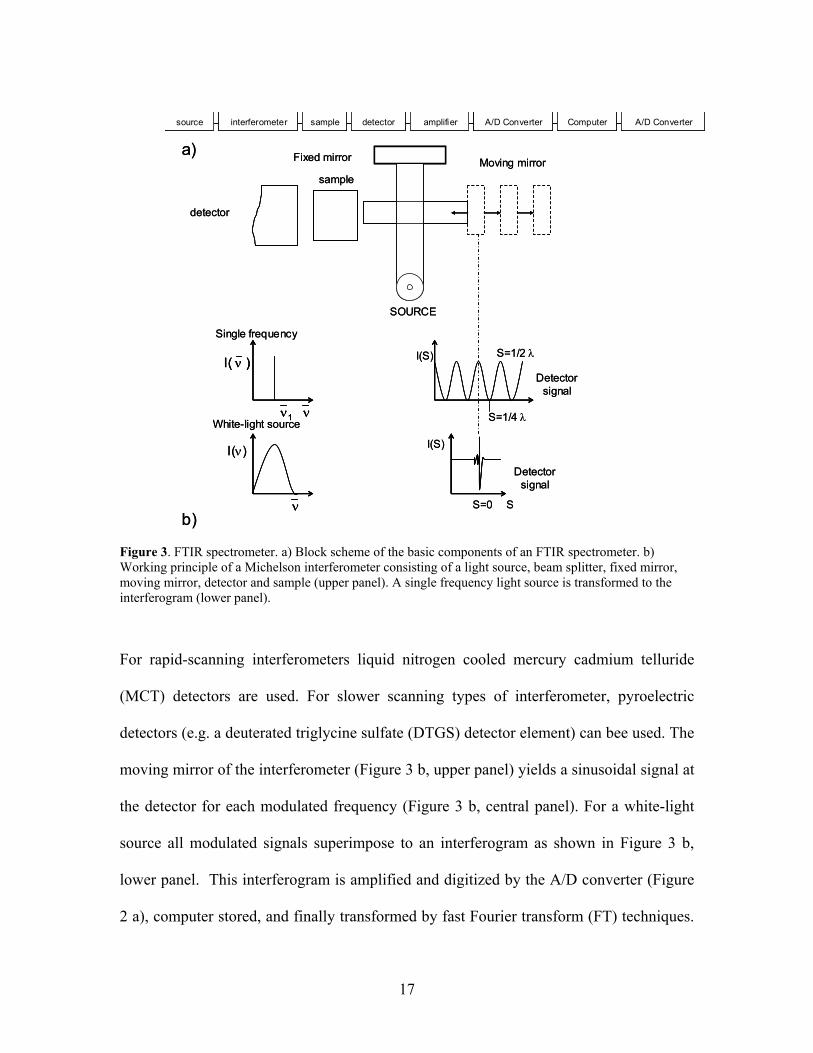
Figure 3. FTIR spectrometer. a) Block scheme of the basic components of an FTIR spectrometer. b) Working principle of a Michelson interferometer consisting of a light source, beam splitter, fixed mirror, moving mirror, detector and sample (upper panel). A single frequency light source is transformed to the interferogram (lower panel).
For rapid-scanning interferometers liquid nitrogen cooled mercury cadmium telluride
(MCT) detectors are used. For slower scanning types of interferometer, pyroelectric
detectors (e.g. a deuterated triglycine sulfate (DTGS) detector element) can bee used. The
moving mirror of the interferometer (Figure 3 b, upper panel) yields a sinusoidal signal at
the detector for each modulated frequency (Figure 3 b, central panel). For a white-light
source all modulated signals superimpose to an interferogram as shown in Figure 3 b,
lower panel. This interferogram is amplified and digitized by the A/D converter (Figure
2 a), computer stored, and finally transformed by fast Fourier transform (FT) techniques.
source interferometer sample amplifier A/D Converterdetector Computer A/D Converter
a)
SOURCE
detector
sample
Fixed mirror Moving mirror
I(S)
I(S)
I(ν)
I( ν )
ν1 ν
ν
S=1/4 λ
Detector signal
Detector signal
S=0 S
S=1/2 λ
b)
Single frequency
White-light source
source interferometer sample amplifier A/D Converterdetector Computer A/D Convertersource interferometer sample amplifier A/D Converterdetector Computer A/D Converter
a)
SOURCE
detector
sample
Fixed mirror Moving mirror
I(S)
I(S)
I(ν)
I( ν )I( ν )
ν1ν1 νν
νν
S=1/4 λ
Detector signal
Detector signal
S=0 S
S=1/2 λ
b)
Single frequency
White-light source
18
Thus, the auxiliary computer in case of FTIR is a virtual necessity. The interferometer
can be thought of as a means of encoding the initial frequencies into a special form,
which the detector can observe. The most important feature of the interferogram is that
every individual data point of this signal contains information over the entire IR region.
In essence, the detector is always observing all frequencies for the final representation of
an IR spectrum. This, along with some other features of the interferometer, leads to
several distinct advantages [Naumann, D., 2000].
2.3.1 Advantages of FTIR spectroscopy
FTIR spectroscopy produces conventional spectrum and it has several important
advantages.
a) The most important advantage of FTIR spectroscopy for biological studies is that
spectra of almost any biological material can be obtained in a wide variety of
environments.
b) The amount of sample is relatively small.
c) FTIR method is a rapid and sensitive technique with sampling techniques that are
easy to use.
d) Since a computer is already used to obtain the Fourier transform, it is easy to
perform many scans to improve the signal-to-noise ratio (noise adds up as the
square root of the number scans, whereas signal adds linearly).
e) The instrumentation is inexpressive compared to the cost of X-ray diffraction,
NMR, ESR, and CD spectroscopic equipment and the operation of the equipment
19
is simple. Interpretation of the spectra is not particularly difficult and can be
learned easily.
f) Digital subtraction (that is, point-by-point substation of the separate spectra by a
computer) can also be used to produce good difference spectra. This method has
great advantages in obtaining infrared spectra in aqueous solutions.
g) The FTIR has advantage in terms of spectral regions which originate from
molecular vibrations and different molecular moieties. For example “head group”
and “hydrocarbon tails” have spectral regions for membranes.
h) There is no light scattering or fluorescent effects. [Mantsch, H. H. et al., 1996]
2.4 Raman Spectroscopy
Raman spectroscopy is quite different from absorption spectroscopy in that it studies light
scattered by a sample rather than light absorbed or emitted. Suppose a photon collides
with a molecule in state a. If the energy of the photon is absorbed, the molecule makes a
transition to the higher level. No matter what the energy of the photon is, the photon-
molecule collision may scatter the photon, meaning that the photon’s direction of motion
is changed. Although most the scattered photons undergo no change in frequency and
energy (Rayleigh scattering), a small of the scattered photons exchange energy with the
molecule during the collision. The resulting increase or decrease in energy of the
scattered photons is the Raman Effect, first observed by C. V. Raman in 1928.
Let ν0 and νscat be the incident photon and the Raman-scattered photon, respectively, and
let Ea and Eb be the energies of the molecule before and after is scatters the photon.
Conservation of energy gives:
20
hν0 + Ea = hvscat Eb or ∆E≡ Eb – Ea = h(ν0 - νscat) ≡ h∆ν (Equation 5)
The energy difference ∆E is the difference between two stationary-state energies of the
molecule, so measurement of the Raman shifts :
∆ν ≡ν0 -νscat (Equation 6)
gives molecular energy-level differences. In Raman spectroscopy, one exposes the sample
(gas, liquid, or solid) to monochromatic radiation of any convenient frequency ν0. Unlike
absorption spectroscopy, ν0 need have no relation to the difference between energy levels
of the sample molecules. Usually ν0 lies in the visible or near-UV region. The Raman-
effect lines are extremely weak (only about 0.001 percent of the incident radiation is
scattered, and only about 1 percent of the scattered radiation is Raman scattered).
Therefore, the very intense light of a laser beam is used as the exciting radiation.
Scattered light at right angles to the laser beam is focused on the entrance slit of a
spectrometer, which disperses the radiation using a diffraction grating and records light
intensity versus frequency, giving the Raman spectrum. Overtone and combination bands
are usually too weak to be observed in Raman spectroscopy, so Raman spectra are
simpler than IR spectra.
As in IR spectra, vibrational Raman spectra of gases show rotational structure, but
rotational structure is absent in Raman spectra of liquids and solids. It is difficult (but no
impossible) to obtain IR spectra below 100 cm-1, but easy to obtain Raman spectra for the
Raman shift νw∆ in the range 10 to 100 cm-1, so Raman spectroscopy is the preferred
technique in this wavenumber range. For νw∆ between 0 and 10 cm-1, the Raman-shifted
lines are hidden by the strong Rayleigh-scattered peak at 0νw∆ .
21
An important advantage of vibrational Raman spectroscopy over IR spectroscopy arises
form the fact that liquid water shows only weak vibrational Raman scattering in the
Raman shift range 300-3000 cm-1 but has strong, broad IR absorptions in this range.
2.5 Surface Enhanced Raman Spectroscopy (SERS) 2.5.1 Introduction to SERS Surface Enhanced Raman Spectroscopy (SERS) is a Raman Spectroscopic (RS)
technique that provides greatly enhanced Raman signal from Raman-active analyte
molecules that have been adsorbed onto certain specially prepared metal surfaces.
Increases in the intensity of Raman signal have been regularly observed on the order of
104-106, and can be as high as 108 and 1014 for some systems [Kneipp et al., 1999;
Moskovits, 1985]. The importance of SERS is that it is both surface selective and highly
sensitive where as RS is neither. RS is ineffective for surface studies because the photons
of the incident laser light simply propagate through the bulk and the signal from the bulk
overwhelms any Raman signal from the analytes at the surface. SERS selectivity of
surface signal results from the presence of surface enhancement mechanisms only at the
surface. Thus, the surface signal overwhelms the bulk signal, making bulk subtraction
unnecessary. There are two primary mechanisms of enhancement described in the
literature: an electromagnetic and a chemical enhancement. The electromagnetic effect is
dominant, the chemical effect contributing enhancement only approximately an order or
two of magnitude [Kambhampati et al., 1998].
The electromagnetic enhancement is dependent on the presence of the metal surface’s
roughness features, while the chemical enhancement involves changes to the adsorbate
electronic states due to chemisorptions of the analyte. The structural and molecular
22
identification power of RS can be used for numerous interfacial systems, including
electrochemical, modeled and actual biological systems, catalytic, in-situ and ambient
analyses and other adsorbate-surface interactions. SERS is observed primarily for
analytes adsorbed onto coinage (Au, Ag, Cu) or alkali (Li, Na, K) metal surfaces, with
the excitation wavelength near or in the visible region. Theoretically, any metal would be
capable of exhibiting surface enhancement, but the coinage and alkali metals satisfy
calculable requirements and provide the strongest enhancement. Metals such as Pd or Pt
exhibit enhancements of about 102-103 for excitation in the near ultraviolet [Garrell,
1989; Moskovits, 1985].
The importance of SERS is that the surface selectivity and sensitivity extends RS utility
to a wide variety of interfacial systems previously inaccessible to RS because RS was not
surface sensitive. These include in-situ and ambient analysis of electrochemical, catalytic,
biological, and organic systems. Zou, et al. (1998) discuss the alternative surface
techniques (Sum Frequency Generation, Infrared Reflection Absorption Spectroscopy,
and Electron Energy Loss Spectroscopy) whose limitations include a need for ultra high
vacuum (UHV) conditions, low wavenumber range, low sensitivity, and bulk phase
interference. SERS can be conducted under ambient conditions, has a broader
wavenumber range, is quite sensitive and is surface selective [Campion et al., 1998].
2.5.2 SERS mechanisms and SERS enhancement factors
Figure 4 shows a simplified schematic diagram for understanding the concept of
electromagnetic SERS enhancement. The metallic ‘nanostructure’ is a small sphere with
the complex dielectric constant ε(ν) in a surrounding medium with a dielectric constant
ε0. The diameter of the sphere (2r) is small compared with the wavelength of light
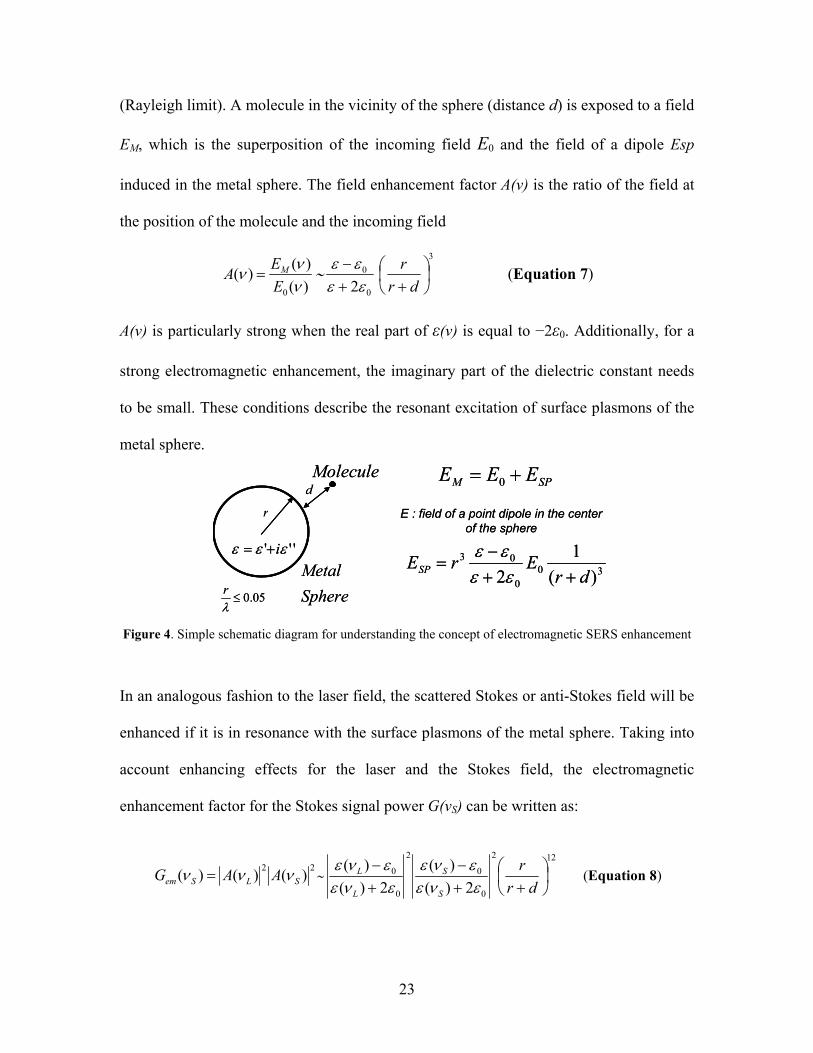
23
(Rayleigh limit). A molecule in the vicinity of the sphere (distance d) is exposed to a field
EM, which is the superposition of the incoming field E0 and the field of a dipole Esp
induced in the metal sphere. The field enhancement factor A(ν) is the ratio of the field at
the position of the molecule and the incoming field
)()()(
0 ννν
EEA M= ∼
0
0
2εεεε
+− 3
⎟⎠⎞
⎜⎝⎛
+ drr (Equation 7)
A(ν) is particularly strong when the real part of ε(ν) is equal to −2ε0. Additionally, for a
strong electromagnetic enhancement, the imaginary part of the dielectric constant needs
to be small. These conditions describe the resonant excitation of surface plasmons of the
metal sphere.
Figure 4. Simple schematic diagram for understanding the concept of electromagnetic SERS enhancement
In an analogous fashion to the laser field, the scattered Stokes or anti-Stokes field will be
enhanced if it is in resonance with the surface plasmons of the metal sphere. Taking into
account enhancing effects for the laser and the Stokes field, the electromagnetic
enhancement factor for the Stokes signal power G(νS) can be written as:
22 )()()( SLSem AAG ννν = ∼122
0
0
2
0
0
2)()(
2)()(
⎟⎠⎞
⎜⎝⎛
++−
+−
drr
S
S
L
L
ενεενε
ενεενε
(Equation 8)
E : field of a point dipole in the center of the sphere
300
03
)(1
2 drErESP ++
−=
εεεε
SPM EEE += 0
''' εεε i+=
05.0≤λr
d
r
Molecule
SphereMetal
E : field of a point dipole in the center of the sphere
300
03
)(1
2 drErESP ++
−=
εεεε
SPM EEE += 0
''' εεε i+=
05.0≤λr
d
r
Molecule
SphereMetal
24
This equation is based on a very simple model already describes important properties and
peculiarities of the electromagnetic SERS enhancement. It shows that the enhancement
scales as the fourth power of the local field of the metallic nanostructure and that it is
particularly strong when excitation and scattered fields are in resonance with the surface
plasmons. This is the case for low-frequency Raman modes and explains that the
scattering powers of different Raman bands in a spectrum fall off with increasing
vibrational energy. Electromagnetic SERS enhancement does not require direct contact
between molecule and metal but it strongly decreases with growing distance described by
the decay of the field of a dipole over the distance [1/d]3 to the fourth power, resulting in
[1/d]12. Maximum values for electromagnetic enhancement for isolated single colloidal
silver and gold spheroids are on the order of 106–107. Theory predicts stronger
enhancement of electromagnetic fields for sharp features and large curvature regions,
which may exist on silver and gold nanostructures. For example, it was shown that the
electromagnetic SERS enhancement factor can be increased up to nearly 1011 when the
sphere degenerates and becomes ‘sharper’ at one edge. Also, closely spaced interacting
particles can provide extra field enhancement. Electromagnetic enhancement factors up
to 1011 have been estimated for the midpoint between two silver or gold spherical
particles separated by a gap of 1 nm near the gap sites between two particles in
proximity. In many experiments, SERS-active substrates consist of a collection of silver
or gold nanoparticles exhibiting fractal properties, such as colloidal clusters formed by
aggregation of colloidal particles or metal island films [Moskovits, 1978; Xu H. X. et al.,
2000].
25
Figure 5 shows SERS-active colloidal silver particles in different aggregation stages. A
comparison between the electron microscope view and the light microscope view shows
strong similarities and demonstrates the fractal nature of these structures. In such
colloidal cluster structures, the individual dipole oscillators of the small isolated particles
couple, thereby generating normal modes of plasmon excitation that embrace the cluster
and cover a wide frequency region from the visible to the near infrared (NIR). The
broadening of the plasmon resonance when colloidal clusters are formed is demonstrated
in figure 5, which shows the relatively narrow absorption spectrum of isolated silver
colloidal particles centered at about 420 nm together with the broad extinction curve for
silver colloidal clusters ranging from about 400 to 1000 nm. The excitation is not
distributed uniformly over the entire cluster but tends to be spatially localized in so-called
‘hot’ areas. Therefore, the surface of a fractal colloidal cluster structure shows a very
inhomogeneous field distribution. Figure 5 illustrates the inhomogeneous field
distribution on a silver cluster. This theoretical result was confirmed by near field
measurements. The size of the ‘hot areas’ can be as small as a few nanometres. Their
locations depend strongly on the geometry of the fractal object and on the excitation
wavelength and polarization of the optical fields. Particularly strong field enhancement
for colloidal silver and gold clusters should exist in the NIR wavelength range. The
strongly confined ‘hot spots’ provide the opportunity to select single nano-objects
spectroscopically within a larger population or to probe selectively parts of large
molecules. When optical excitation is localized in such small ‘hot spots’, extremely large
electromagnetic SERS enhancement (proportional to field enhancement to the fourth
power!) up to 1012 was theoretically predicted for these areas[kneipp, K. et al., 2002].
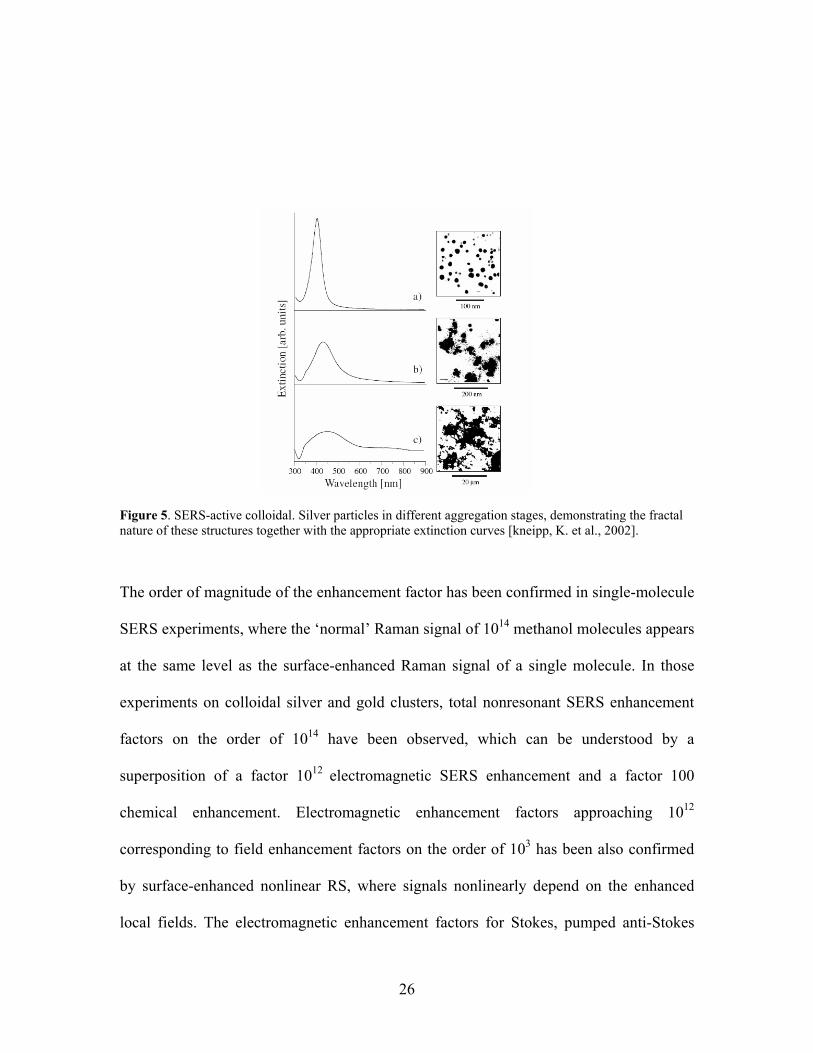
26
Figure 5. SERS-active colloidal. Silver particles in different aggregation stages, demonstrating the fractal nature of these structures together with the appropriate extinction curves [kneipp, K. et al., 2002].
The order of magnitude of the enhancement factor has been confirmed in single-molecule
SERS experiments, where the ‘normal’ Raman signal of 1014 methanol molecules appears
at the same level as the surface-enhanced Raman signal of a single molecule. In those
experiments on colloidal silver and gold clusters, total nonresonant SERS enhancement
factors on the order of 1014 have been observed, which can be understood by a
superposition of a factor 1012 electromagnetic SERS enhancement and a factor 100
chemical enhancement. Electromagnetic enhancement factors approaching 1012
corresponding to field enhancement factors on the order of 103 has been also confirmed
by surface-enhanced nonlinear RS, where signals nonlinearly depend on the enhanced
local fields. The electromagnetic enhancement factors for Stokes, pumped anti-Stokes
27
and hyper-RS experiments scale as theoretically predicted from the appropriate nonlinear
process [Kneipp, K. et al., 1999,2000].
All the experimental findings described above give compelling evidence for an
electromagnetic field enhancement. If SERS were just an electromagnetic field
enhancement effect, a strong SERS signal should exist for each molecule in the close
enough vicinity of a silver or gold nanostructure. On the other hand, experimental
observations such as dependence of the effect on the chemical nature of the molecule and
a strong molecular selectivity provide clear indications for the existence of an (additional)
‘chemical’ SERS enhancement. For example, methanol does not show any SERS
enhancement. Other experimental observations which hint at mechanism(s) other than
electromagnetic field enhancement include SERS enhancement measured from molecules
on metal surfaces, which are ‘flat’ on the nanometer scale, as well as the dependence of
the enhancement factor on the electrode potential. Moreover, best electromagnetic SERS
enhancement factors leave a gap of about two orders of magnitude to the best
experimentally observed nonresonant SERS enhancement factors on the order of 1014,
which suggests the existence of additional enhancement mechanism(s) accounting for the
missing factors [Kneipp, K. et al., 1998].
28
3. PREVIOUS WORK
The use of infrared spectroscopy as a means of differentiating and identifying bacteria
was extensively reported as early as in the 1950s and 1960s [Nauman et al., 1991]. A
critical review on this subject published in 1959 summarized that, although bacteria
definitely eshibit IR-spectra that are unique for individual strains, the identification of
bacteria via IR-techniques could not be regarded as a useful scheme as it is an impractical
procedure. The revival of IR-spectroscopy as a means for characterizing microbial
samples was initiated after the development of modern interferometric IR-spectroscopy,
the availability of low-cost mini-computers and powerful new algorithms for multivariate
statistical analysis and pattern recognition methodologies [Maquelin et al., 2002].
Compared to IR spectroscopy, Raman spectroscopy was neglected in the field of
biological sciences. This has changed historically, ever since IR techniques were
improved. In the 1950s and early 1960s, Raman spectroscopy gave similar information as
IR spectroscopy but at higher cost, lower speed, much lower sensitivity and demanding
relatively complicated instrumentation. Coinciding with the laser developments in the
late 1960s and early 1970s, Raman spectroscopy was increasingly applied in biological
studies. It was not until the late 1980s, however, that publications appeared in the
literature reporting on the possibilities of Raman spectroscopy and SERS for
identification purposes in microbiology.
IR, Raman and SERS are complementary techniques. Different selection rules apply for
IR absorption and Raman scattering by a molecule. Together, the three techniques
provide a complete and highly specific vibrational spectroscopic fingerprint of cells
[Nauman, et al., 1991]. In the last decade, these techniques have reached a level of
29
sensitivity that enables spectra to be obtained of even one single living cell [Puppels et
al., 1991; Shucster et al., 2000].
SERS applications in the biochemical and biomedical field up to the middle of the 1990s
are summarized in several review papers [Nabiev, et al., 1993]. The reviews discuss
SERS experiments performed on amino acids and peptides, on purine and pyrimidine
bases, but also on ‘large’ molecules such as proteins, DNA and RNA. SERS was also
applied to the study of many ‘intrinsically coloured’ biomolecules such as chlorophylls
and other pigments, as well as from larger molecules containing chromophores such as
the heme-containing proteins. Other, more medical, applications include SERS detection
of stimulating drugs and selective analysis of antitumour drug interaction with DNA
[Nabiev, et al., 1991, 1995]. SERS is not only of interest as a method for ultrasensitive
detection and structural characterization of ‘biomolecules’; the technique has been also
applied to study biophysically interesting processes. For example, SERS can be used to
monitor transport through membranes. The results show that SERS can discriminate
between the movement of different molecules across a membrane and to observe
different interfacial arrival times and concentration growth rates in the receiving
(colloidal silver) solution [Wood, E. et al., 1997]. SERS also represents an interesting
approach for studying charge transfer processes, for instance in cytochrome-c, which has
been extensively investigated on bare and coated silver electrodes [Picorel, R. et al.,
1998]. In particular, the selectivity of Surface Enhanced Resonance Raman Spectroscopy
SERRS allows the determination of the interfacial potential-dependent equilibria and
reactions by probing the vibrational spectra of the group of the adsorbed cytochrome-c
exclusively. Recently, time-resolved SERRS was used to study the kinetics of the

30
heterogeneous electron transfer between cyt-c and a SAM-coated silver electrode, in
particular the electric field dependence of the interfacial charge transfer [Murgida, D. H.
et al., 2001].
31
4. METHODOLOGY
4.1 Reagents and Chemicals
The following reagents and materials were used in this investigation: adenine (C5H5N5,
99%), Sigma-Aldrich; silver nitrate (AgNO3 99.99%), Strem Chemicals. Tri-sodium
citrate hydrate (Na3C6H5O7.2H2O), nitric acid (HNO3, 70%), sulfuric acid (H2SO4, 98%),
sodium chloride (NaCl, USP/FCC granular), glycerol (99.5%), LB broth Lennox
(Dehydrate, Tryptone 10g, yeast extract 5g, sodium chloride 5g per liter of solution) were
purchased from Fisher Scientific International.
4.2 Organisms Selection
The following bacterial strains were obtained from the sources indicated and used in this
research: a. Bacillus subtilis (ATCC number 6633), b. Bacillus cereus (ATCC number
14579), c. Staphylococcus aureus (ATCC number 6538), d. Escherichia coli (ATCC
number 8789), e. Staphylococcus epidermidis (ATCC number 2228), f. Salmonella
tennessee(ATCC number 93311), g. Klebsiella pneumoniae (ATCC number 3882), h.
Pseudomonas aeruginosa (ATCC number 9721) were provided by Dr. Carlos Rios
Velazquez and Magaly Zapata (Department of Biology, University of Puerto Rico-
Mayagüez Campus); i. Bacillus thuringiensis (ATCC number 35646); j. Enterobacter
aerogenes (ATCC number 13048) and k)Proteus mirabilis (ATCC number 25933) were
obtained from Fisher Scientifics. Pure cultures were stored at -800C in microvials
containing 20% glycerol (cryoprotectant) until use.
32
4.3 Instrumentation
The silver colloids were characterized using techniques such as UV-Vis spectroscopy
with a Varian Cary-100 UV-visible double beam. The growth kinetics of bacteria were
obtained using techniques such as Visible spectroscopy with a 100 VIS
spectrophotometer to Buck scientific to 600 nm. The bacterial Images were obtaining in
the Department of Biology (UPRM) with a Scanning Electron Microscopy (JEOL 540
LV ).
A Renishaw Raman Microscope, model RM-2000 (Figure 6) was used to observe the
scattering excited by a 532 nm diode laser. Typically, laser power was attenuated to
∼0.50 mW and the data acquisition time was in the 60s and the spectra were obtained in
the range of 100-4000 wavenumber (cm-1) to obtain the Raman and SERS spectra of
bacteria reported here. The frequency calibration was set by reference to the 521 cm-1
vibrational band of a silicon wafer. The Raman data was obtained with a 10x microscope
Leica objective for Raman excitation/collection and SERS data was obtained with a 50x
microscope Leica objective for Raman excitation/collection.
Figure 6. Renishaw Raman Microspectrometer RM-2000.
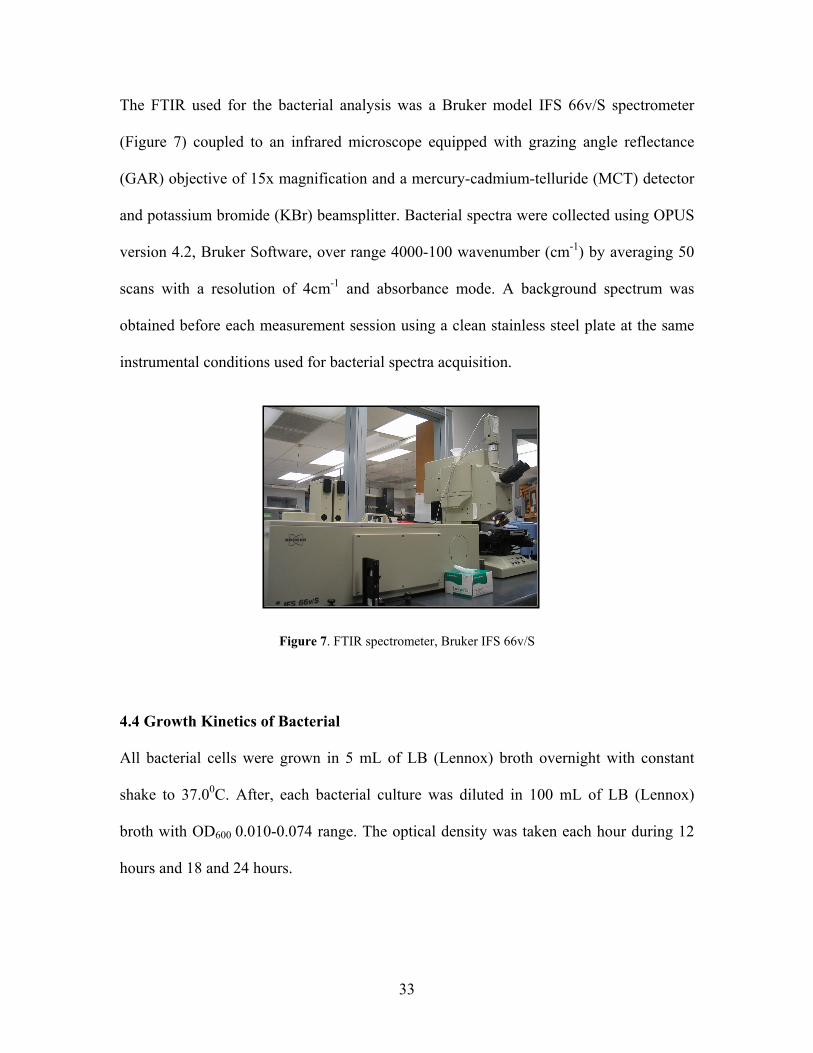
33
The FTIR used for the bacterial analysis was a Bruker model IFS 66v/S spectrometer
(Figure 7) coupled to an infrared microscope equipped with grazing angle reflectance
(GAR) objective of 15x magnification and a mercury-cadmium-telluride (MCT) detector
and potassium bromide (KBr) beamsplitter. Bacterial spectra were collected using OPUS
version 4.2, Bruker Software, over range 4000-100 wavenumber (cm-1) by averaging 50
scans with a resolution of 4cm-1 and absorbance mode. A background spectrum was
obtained before each measurement session using a clean stainless steel plate at the same
instrumental conditions used for bacterial spectra acquisition.
Figure 7. FTIR spectrometer, Bruker IFS 66v/S
4.4 Growth Kinetics of Bacterial
All bacterial cells were grown in 5 mL of LB (Lennox) broth overnight with constant
shake to 37.00C. After, each bacterial culture was diluted in 100 mL of LB (Lennox)
broth with OD600 0.010-0.074 range. The optical density was taken each hour during 12
hours and 18 and 24 hours.
34
4.5 Synthesis of Silver Colloids
One hundred milliliters (100 mL) of triple distilled water were placed in a 250 mL round
bottom flask. The water was stirred vigorously, then heated up to approximately 90˚C
and 0.024 g of AgNO3 was added. The solution was heated to almost boiling, and then a
solution of sodium citrate (0.027g sodium citrate in 2.5 mL of triple distilled water) was
added. The solution was then held at boiling for 45 minutes with a flow of nitrogen gas
at 1 psi. After this time, the heat is removed and the solution is allowed to cool, stirring is
still continued at this point and nitrogen is then passed through the solution once more for
15 minutes (Balaguera, M., 2006). The quality of colloids routinely assessed by
collecting a UV-Vis spectrum fronts it and a solution of adenine (1x10⁻⁴M) was analyzed
by SERS with a mix of 50 µL of silver colloids, 10 uL of adenine and 5 uL of NaCl.
Then 10 µL of the mixtures were placed at one side of a microscope glass slide cover for
analysis.
4.6 SEM Images of Bacterial Cells
The protocol for the bacterial cells preparation for SEM was provided by Dr. Carlos Rios
Velazquez from the Department of Biology at UPRM. The SEM images were taken in at
the Microscopy Center from the Department of Biology at UPRM.
4.7 Bacterial Sample Preparation
Bacterial cells were grown in 5 mL of LB (Lennox) broth for approximately 15 hours,
centrifuged for 20 minutes at 6000 rpm. Subsequently for removing the broth from the
obtained pellets were bacteria washed four times with 5 mL of NaCl 0.80% w/v.
35
Standard biosafety level 2 lab procedures were employed for handling the strains studied
here even though they are nonvirulent. Spore-forming bacteria were destroyed by
exposure to 95% ethanol for ~20 minutes and UV. Non spore-forming bacteria and
contaminated glassware were autoclaved prior to disposal.
4.7.1 Raman Sample Preparation
A small amount of the bacterial cells was placed on the cover glass slides of 0.02 mm
wide using a loop. The Raman spectra were obtained with ∼10 mW of incident 532 nm
excitation power, 100% laser power, 3 scan and 20 s of acquisition time.
4.7.2 SERS Sample Preparation
The pellets were re-suspended in 50 µL of NaCl 0.80% w/v. An aliquot of 10 µL of
bacterial cells suspension and 50 µL of silver colloid were mixed in a micro tube. Ten µL
of suspension of bacterial cells was deposited on the cover glass slides and then placed on
a gold coated microscope slide. The SERS spectra were obtained with ∼0.5 mW at 532
nm with 3 scans and 20 s of acquisition time. Spectra were acquired from 200 to 4000
wavenumber. Visual inspection of these spectra showed that the most information-rich
area was between 400 and 1800 cm-1, and this region was used for data analysis.
Calibration was periodically checked by recording the position of know Raman lines of
silicon (521 cm-1). All data were obtained using the Renishaw, Inc. WIRE 2.0™ software.
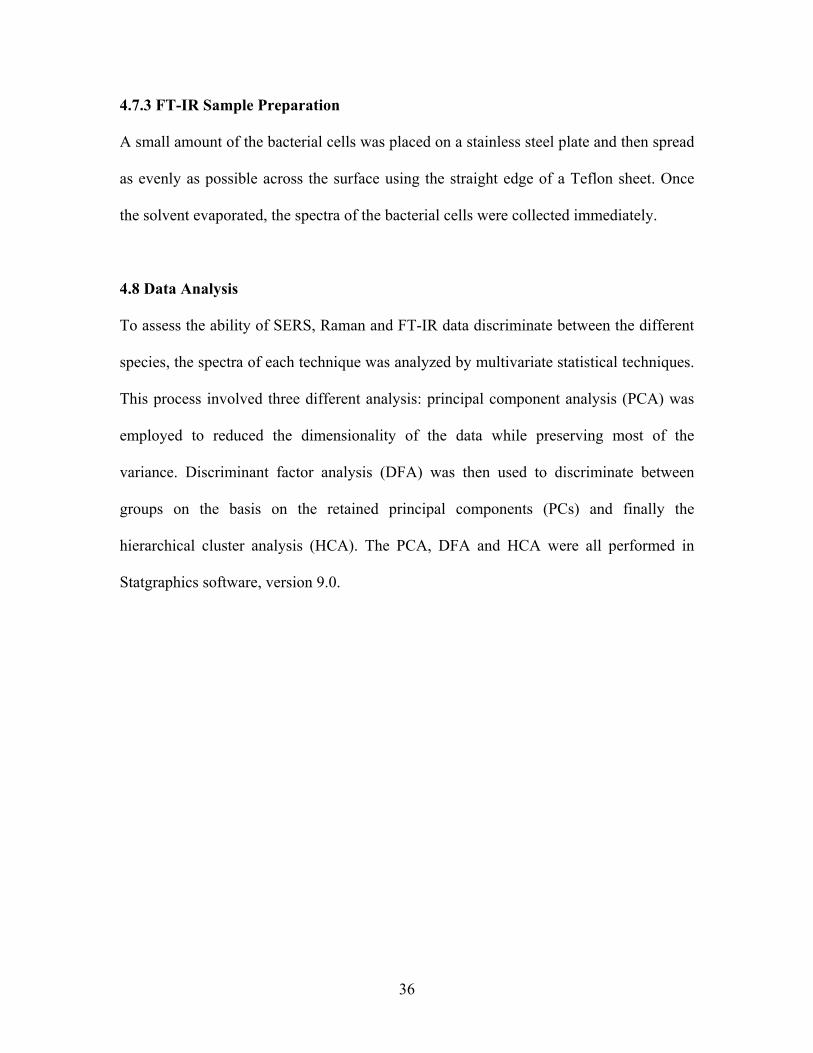
36
4.7.3 FT-IR Sample Preparation
A small amount of the bacterial cells was placed on a stainless steel plate and then spread
as evenly as possible across the surface using the straight edge of a Teflon sheet. Once
the solvent evaporated, the spectra of the bacterial cells were collected immediately.
4.8 Data Analysis
To assess the ability of SERS, Raman and FT-IR data discriminate between the different
species, the spectra of each technique was analyzed by multivariate statistical techniques.
This process involved three different analysis: principal component analysis (PCA) was
employed to reduced the dimensionality of the data while preserving most of the
variance. Discriminant factor analysis (DFA) was then used to discriminate between
groups on the basis on the retained principal components (PCs) and finally the
hierarchical cluster analysis (HCA). The PCA, DFA and HCA were all performed in
Statgraphics software, version 9.0.
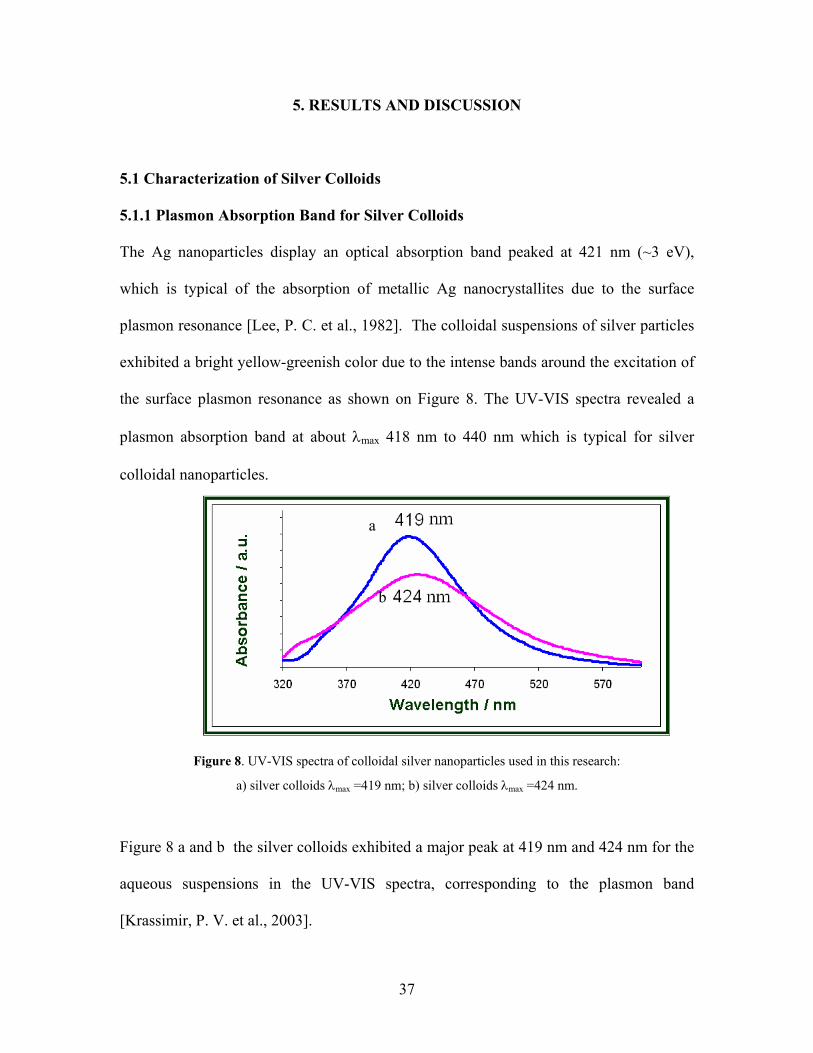
37
5. RESULTS AND DISCUSSION
5.1 Characterization of Silver Colloids
5.1.1 Plasmon Absorption Band for Silver Colloids
The Ag nanoparticles display an optical absorption band peaked at 421 nm (~3 eV),
which is typical of the absorption of metallic Ag nanocrystallites due to the surface
plasmon resonance [Lee, P. C. et al., 1982]. The colloidal suspensions of silver particles
exhibited a bright yellow-greenish color due to the intense bands around the excitation of
the surface plasmon resonance as shown on Figure 8. The UV-VIS spectra revealed a
plasmon absorption band at about λmax 418 nm to 440 nm which is typical for silver
colloidal nanoparticles.
Figure 8. UV-VIS spectra of colloidal silver nanoparticles used in this research:
a) silver colloids λmax =419 nm; b) silver colloids λmax =424 nm.
Figure 8 a and b the silver colloids exhibited a major peak at 419 nm and 424 nm for the
aqueous suspensions in the UV-VIS spectra, corresponding to the plasmon band
[Krassimir, P. V. et al., 2003].
a
b
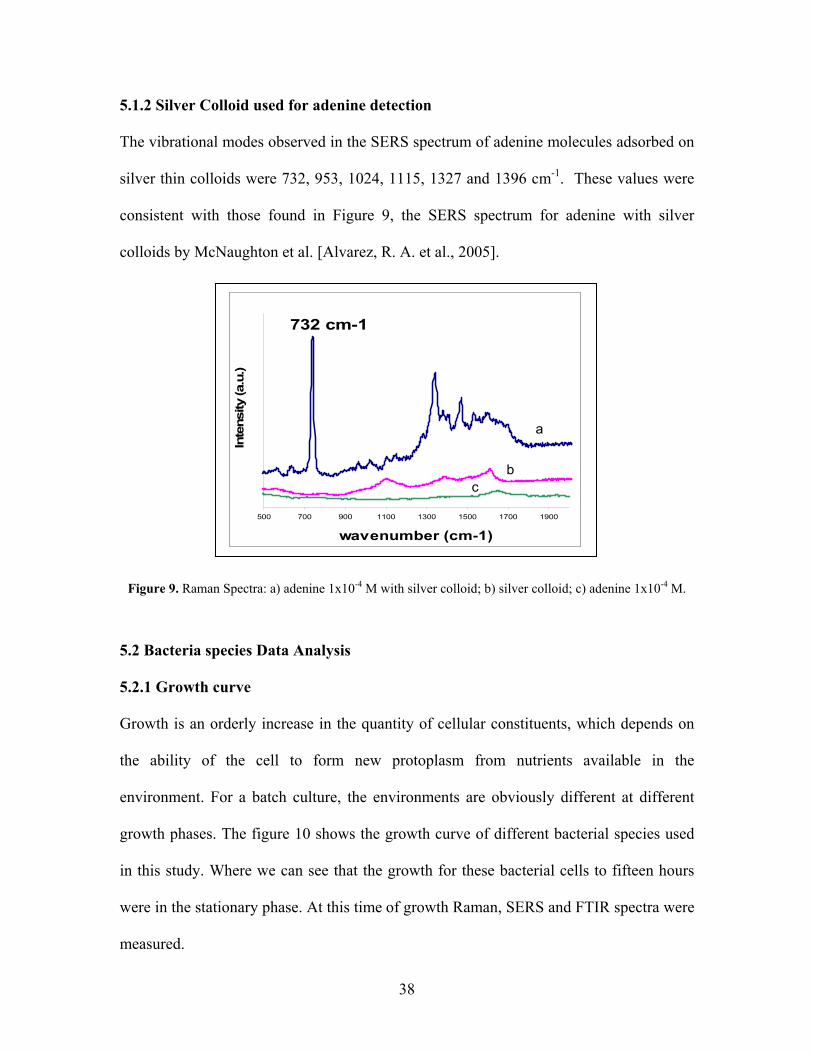
38
5.1.2 Silver Colloid used for adenine detection
The vibrational modes observed in the SERS spectrum of adenine molecules adsorbed on
silver thin colloids were 732, 953, 1024, 1115, 1327 and 1396 cm-1. These values were
consistent with those found in Figure 9, the SERS spectrum for adenine with silver
colloids by McNaughton et al. [Alvarez, R. A. et al., 2005].
Figure 9. Raman Spectra: a) adenine 1x10⁻⁴ M with silver colloid; b) silver colloid; c) adenine 1x10⁻⁴ M.
5.2 Bacteria species Data Analysis
5.2.1 Growth curve
Growth is an orderly increase in the quantity of cellular constituents, which depends on
the ability of the cell to form new protoplasm from nutrients available in the
environment. For a batch culture, the environments are obviously different at different
growth phases. The figure 10 shows the growth curve of different bacterial species used
in this study. Where we can see that the growth for these bacterial cells to fifteen hours
were in the stationary phase. At this time of growth Raman, SERS and FTIR spectra were
measured.
500 700 900 1100 1300 1500 1700 1900
wavenumber (cm-1)
Inte
nsity
(a.u
.)
732 cm-1
a
bc
500 700 900 1100 1300 1500 1700 1900
wavenumber (cm-1)
Inte
nsity
(a.u
.)
732 cm-1
a
bc
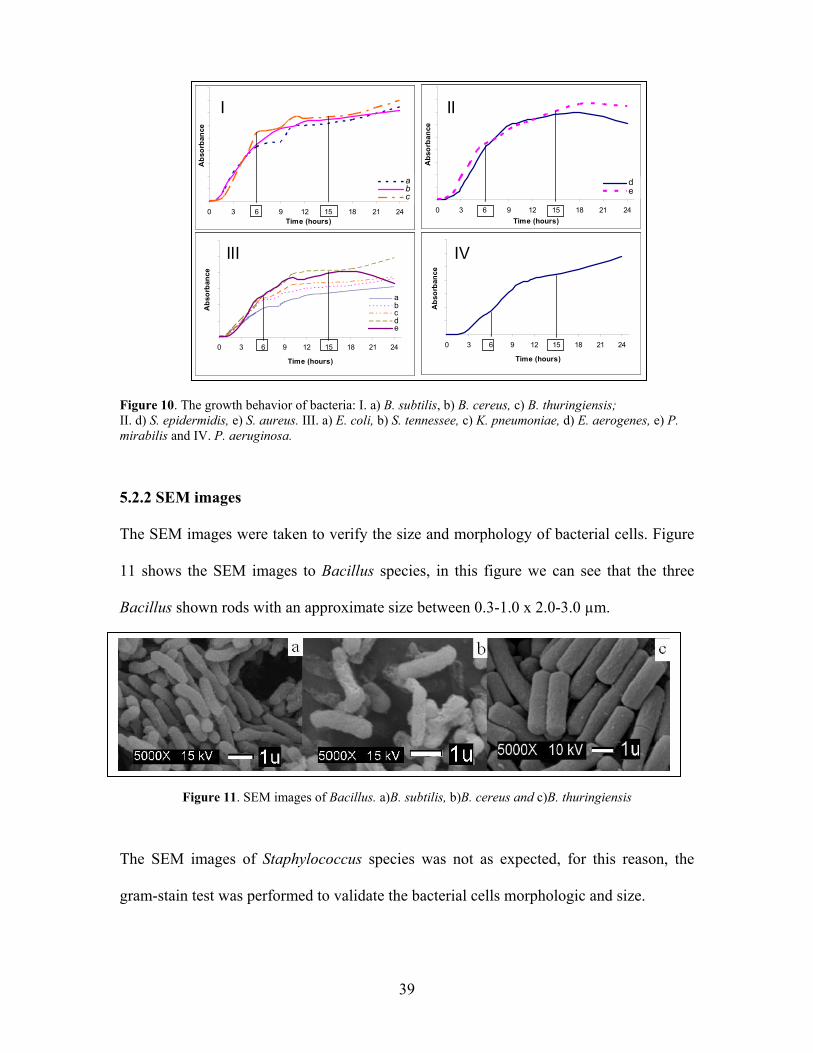
39
Figure 10. The growth behavior of bacteria: I. a) B. subtilis, b) B. cereus, c) B. thuringiensis; II. d) S. epidermidis, e) S. aureus. III. a) E. coli, b) S. tennessee, c) K. pneumoniae, d) E. aerogenes, e) P. mirabilis and IV. P. aeruginosa.
5.2.2 SEM images
The SEM images were taken to verify the size and morphology of bacterial cells. Figure
11 shows the SEM images to Bacillus species, in this figure we can see that the three
Bacillus shown rods with an approximate size between 0.3-1.0 x 2.0-3.0 µm.
Figure 11. SEM images of Bacillus. a)B. subtilis, b)B. cereus and c)B. thuringiensis
The SEM images of Staphylococcus species was not as expected, for this reason, the
gram-stain test was performed to validate the bacterial cells morphologic and size.
0 3 6 9 12 15 18 21 24Time (hours)
Abs
orba
nce
abc
0 3 6 9 12 15 18 21 24Time (hours)
Abs
orba
nce
de
0 3 6 9 12 15 18 21 24
Time (hours)
Abs
orba
nce
abcde
0 3 6 9 12 15 18 21 24
Time (hours)
Abs
orba
nce
I
III IV
II
0 3 6 9 12 15 18 21 24Time (hours)
Abs
orba
nce
abc
0 3 6 9 12 15 18 21 24Time (hours)
Abs
orba
nce
de
0 3 6 9 12 15 18 21 24
Time (hours)
Abs
orba
nce
abcde
0 3 6 9 12 15 18 21 24
Time (hours)
Abs
orba
nce
0 3 6 9 12 15 18 21 24Time (hours)
Abs
orba
nce
abc
0 3 6 9 12 15 18 21 24Time (hours)
Abs
orba
nce
de
0 3 6 9 12 15 18 21 24
Time (hours)
Abs
orba
nce
abcde
0 3 6 9 12 15 18 21 24
Time (hours)
Abs
orba
nce
0 3 6 9 12 15 18 21 24Time (hours)
Abs
orba
nce
abc
0 3 6 9 12 15 18 21 24Time (hours)
Abs
orba
nce
de
0 3 6 9 12 15 18 21 24
Time (hours)
Abs
orba
nce
abcde
0 3 6 9 12 15 18 21 24
Time (hours)
Abs
orba
nce
I
III IV
II
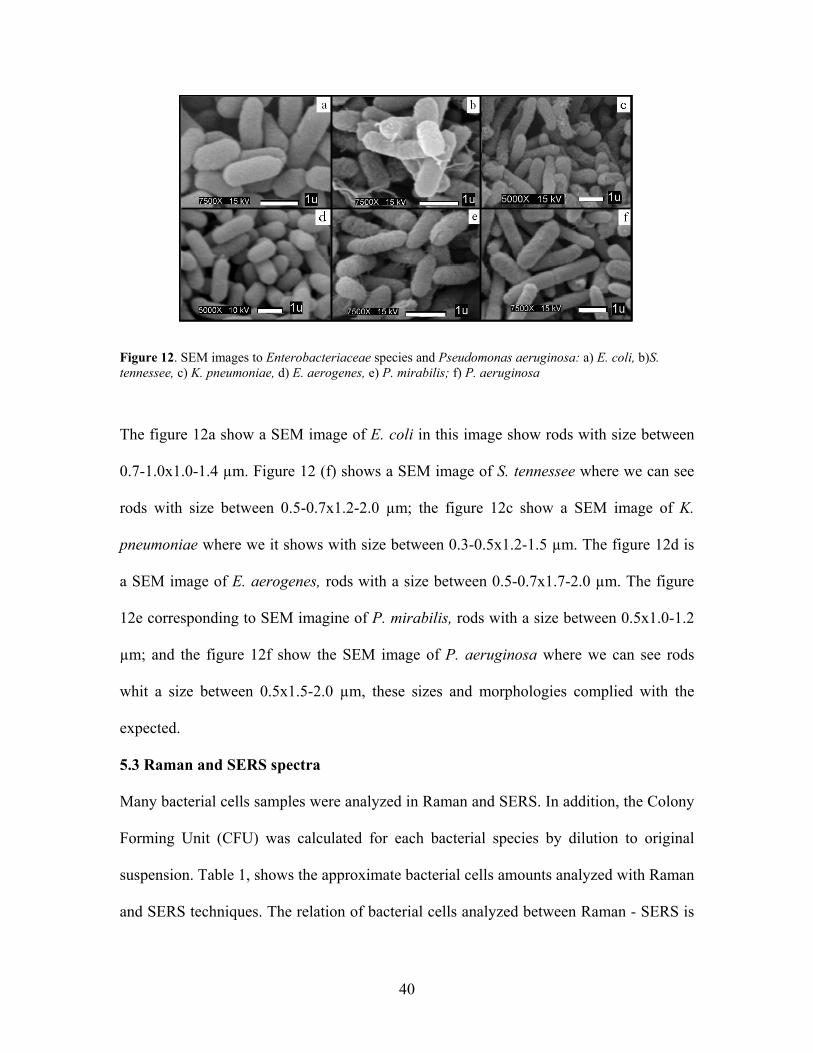
40
Figure 12. SEM images to Enterobacteriaceae species and Pseudomonas aeruginosa: a) E. coli, b)S. tennessee, c) K. pneumoniae, d) E. aerogenes, e) P. mirabilis; f) P. aeruginosa
The figure 12a show a SEM image of E. coli in this image show rods with size between
0.7-1.0x1.0-1.4 µm. Figure 12 (f) shows a SEM image of S. tennessee where we can see
rods with size between 0.5-0.7x1.2-2.0 µm; the figure 12c show a SEM image of K.
pneumoniae where we it shows with size between 0.3-0.5x1.2-1.5 µm. The figure 12d is
a SEM image of E. aerogenes, rods with a size between 0.5-0.7x1.7-2.0 µm. The figure
12e corresponding to SEM imagine of P. mirabilis, rods with a size between 0.5x1.0-1.2
µm; and the figure 12f show the SEM image of P. aeruginosa where we can see rods
whit a size between 0.5x1.5-2.0 µm, these sizes and morphologies complied with the
expected.
5.3 Raman and SERS spectra
Many bacterial cells samples were analyzed in Raman and SERS. In addition, the Colony
Forming Unit (CFU) was calculated for each bacterial species by dilution to original
suspension. Table 1, shows the approximate bacterial cells amounts analyzed with Raman
and SERS techniques. The relation of bacterial cells analyzed between Raman - SERS is
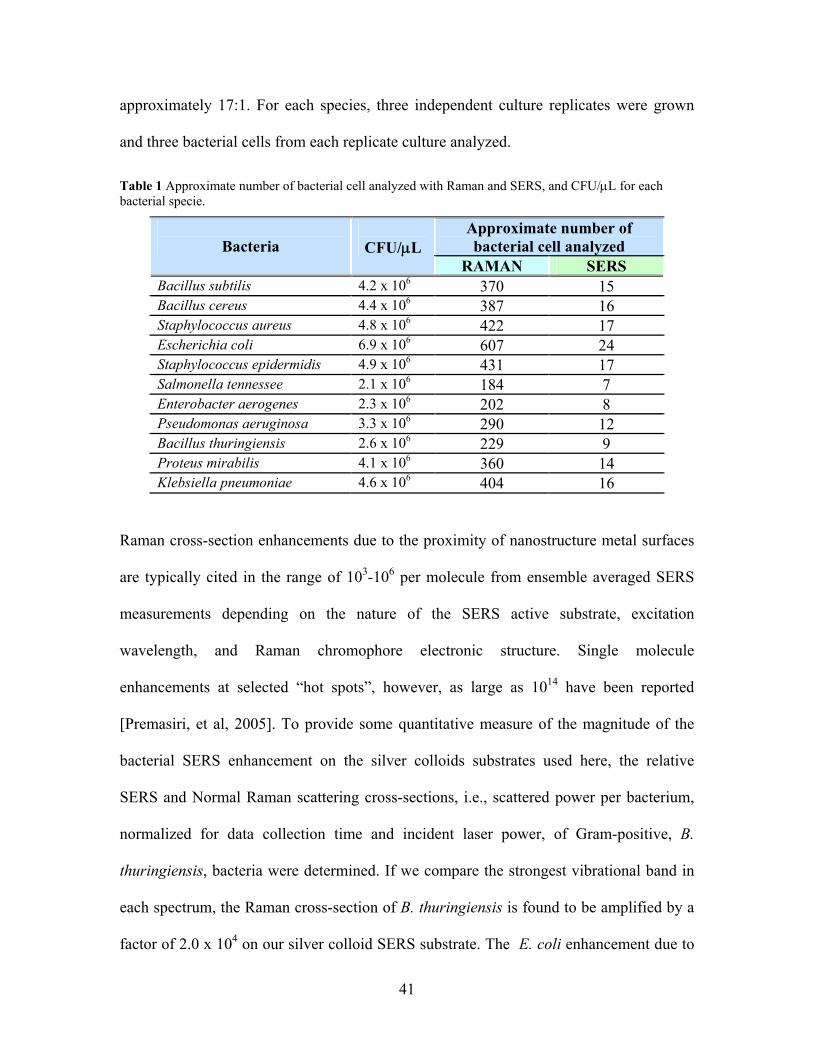
41
approximately 17:1. For each species, three independent culture replicates were grown
and three bacterial cells from each replicate culture analyzed.
Table 1 Approximate number of bacterial cell analyzed with Raman and SERS, and CFU/µL for each bacterial specie.
Approximate number of bacterial cell analyzed
Bacteria
CFU/µL
RAMAN SERS Bacillus subtilis 4.2 x 10⁶ 370 15 Bacillus cereus 4.4 x 10⁶ 387 16 Staphylococcus aureus 4.8 x 10⁶ 422 17 Escherichia coli 6.9 x 10⁶ 607 24 Staphylococcus epidermidis 4.9 x 10⁶ 431 17 Salmonella tennessee 2.1 x 10⁶ 184 7 Enterobacter aerogenes 2.3 x 10⁶ 202 8 Pseudomonas aeruginosa 3.3 x 10⁶ 290 12 Bacillus thuringiensis 2.6 x 10⁶ 229 9 Proteus mirabilis 4.1 x 10⁶ 360 14 Klebsiella pneumoniae 4.6 x 10⁶ 404 16
Raman cross-section enhancements due to the proximity of nanostructure metal surfaces
are typically cited in the range of 103-106 per molecule from ensemble averaged SERS
measurements depending on the nature of the SERS active substrate, excitation
wavelength, and Raman chromophore electronic structure. Single molecule
enhancements at selected “hot spots”, however, as large as 1014 have been reported
[Premasiri, et al, 2005]. To provide some quantitative measure of the magnitude of the
bacterial SERS enhancement on the silver colloids substrates used here, the relative
SERS and Normal Raman scattering cross-sections, i.e., scattered power per bacterium,
normalized for data collection time and incident laser power, of Gram-positive, B.
thuringiensis, bacteria were determined. If we compare the strongest vibrational band in
each spectrum, the Raman cross-section of B. thuringiensis is found to be amplified by a
factor of 2.0 x 10⁴ on our silver colloid SERS substrate. The E. coli enhancement due to
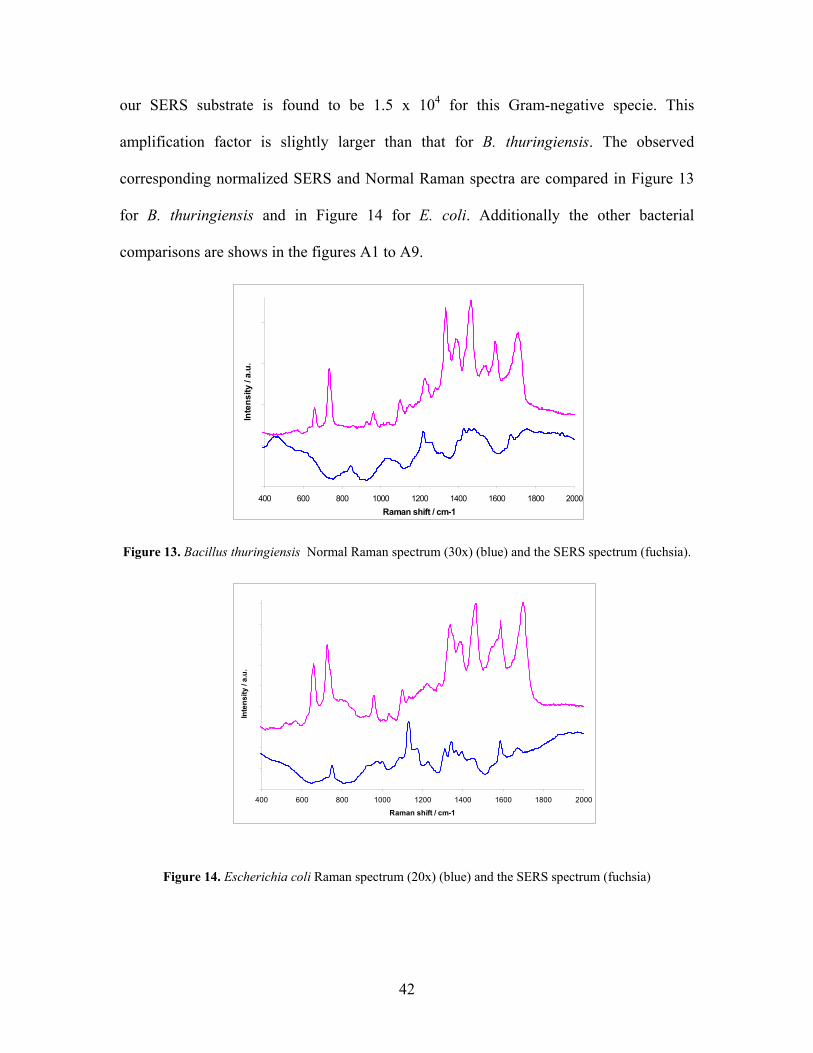
42
our SERS substrate is found to be 1.5 x 10⁴ for this Gram-negative specie. This
amplification factor is slightly larger than that for B. thuringiensis. The observed
corresponding normalized SERS and Normal Raman spectra are compared in Figure 13
for B. thuringiensis and in Figure 14 for E. coli. Additionally the other bacterial
comparisons are shows in the figures A1 to A9.
Figure 13. Bacillus thuringiensis Normal Raman spectrum (30x) (blue) and the SERS spectrum (fuchsia).
Figure 14. Escherichia coli Raman spectrum (20x) (blue) and the SERS spectrum (fuchsia)
400 600 800 1000 1200 1400 1600 1800 2000Raman shift / cm-1
Inte
nsity
/ a.
u.
400 600 800 1000 1200 1400 1600 1800 2000
Raman shift / cm-1
Inte
nsity
/ a.
u.
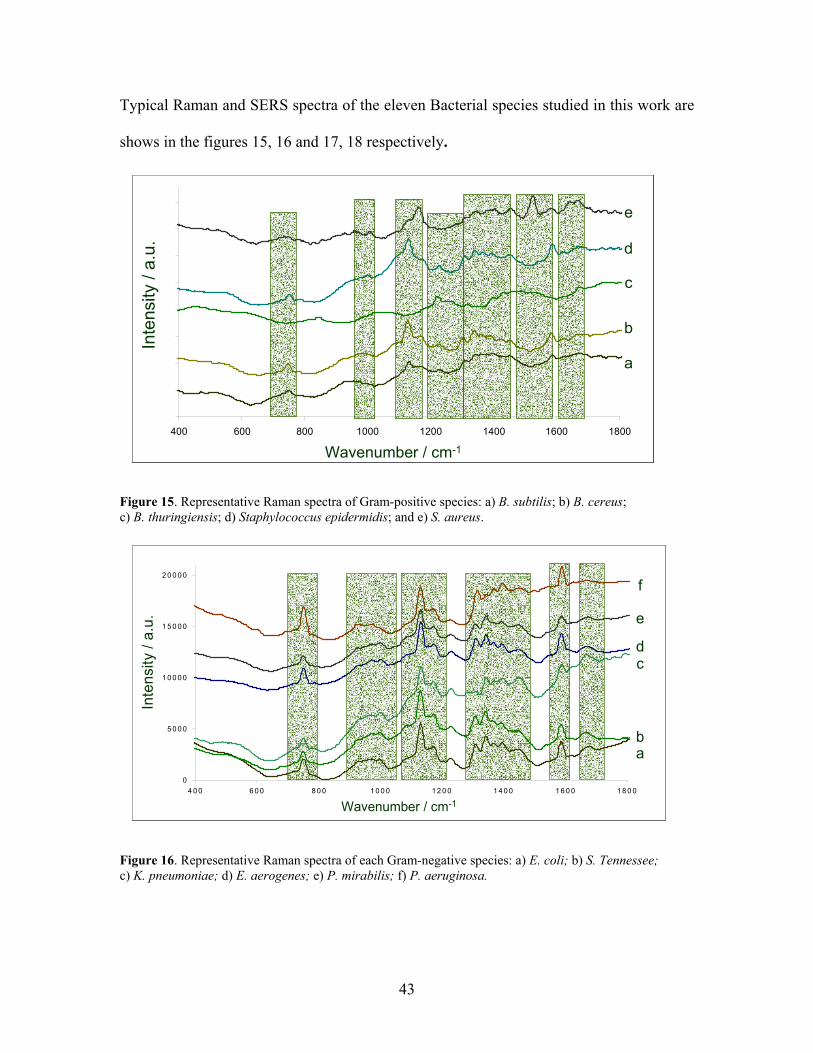
43
Typical Raman and SERS spectra of the eleven Bacterial species studied in this work are
shows in the figures 15, 16 and 17, 18 respectively.
Figure 15. Representative Raman spectra of Gram-positive species: a) B. subtilis; b) B. cereus; c) B. thuringiensis; d) Staphylococcus epidermidis; and e) S. aureus.
Figure 16. Representative Raman spectra of each Gram-negative species: a) E. coli; b) S. Tennessee; c) K. pneumoniae; d) E. aerogenes; e) P. mirabilis; f) P. aeruginosa.
400 600 800 1000 1200 1400 1600 1800
Wavenumber (cm-1)
Inte
nsity
(a.u
.)
a
b
c
d
e
Inte
nsity
/ a.
u.
Wavenumber / cm-1
400 600 800 1000 1200 1400 1600 1800
Wavenumber (cm-1)
Inte
nsity
(a.u
.)
a
b
c
d
e
400 600 800 1000 1200 1400 1600 1800
Wavenumber (cm-1)
Inte
nsity
(a.u
.)
a
b
c
d
e
400 600 800 1000 1200 1400 1600 1800
Wavenumber (cm-1)
Inte
nsity
(a.u
.)
a
b
c
d
e
400 600 800 1000 1200 1400 1600 1800
Wavenumber (cm-1)
Inte
nsity
(a.u
.)
a
b
c
d
e
400 600 800 1000 1200 1400 1600 1800
Wavenumber (cm-1)
Inte
nsity
(a.u
.)
a
b
c
d
e
Inte
nsity
/ a.
u.
Wavenumber / cm-1
0
5 0 0 0
1 0 0 0 0
1 5 0 0 0
2 0 0 0 0
4 0 0 6 0 0 8 0 0 1 0 0 0 1 2 0 0 1 4 0 0 1 6 0 0 1 8 0 0
W av enum ber (cm -1 )
Inte
nsity
(a.u
.)
ab
cd
e
f
Wavenumber / cm-1
Inte
nsity
/ a.
u.
0
5 0 0 0
1 0 0 0 0
1 5 0 0 0
2 0 0 0 0
4 0 0 6 0 0 8 0 0 1 0 0 0 1 2 0 0 1 4 0 0 1 6 0 0 1 8 0 0
W av enum ber (cm -1 )
Inte
nsity
(a.u
.)
ab
cd
e
f
0
5 0 0 0
1 0 0 0 0
1 5 0 0 0
2 0 0 0 0
4 0 0 6 0 0 8 0 0 1 0 0 0 1 2 0 0 1 4 0 0 1 6 0 0 1 8 0 0
W av enum ber (cm -1 )
Inte
nsity
(a.u
.)
ab
cd
e
f
0
5 0 0 0
1 0 0 0 0
1 5 0 0 0
2 0 0 0 0
4 0 0 6 0 0 8 0 0 1 0 0 0 1 2 0 0 1 4 0 0 1 6 0 0 1 8 0 0
W av enum ber (cm -1 )
Inte
nsity
(a.u
.)
ab
cd
e
f
Wavenumber / cm-1
Inte
nsity
/ a.
u.
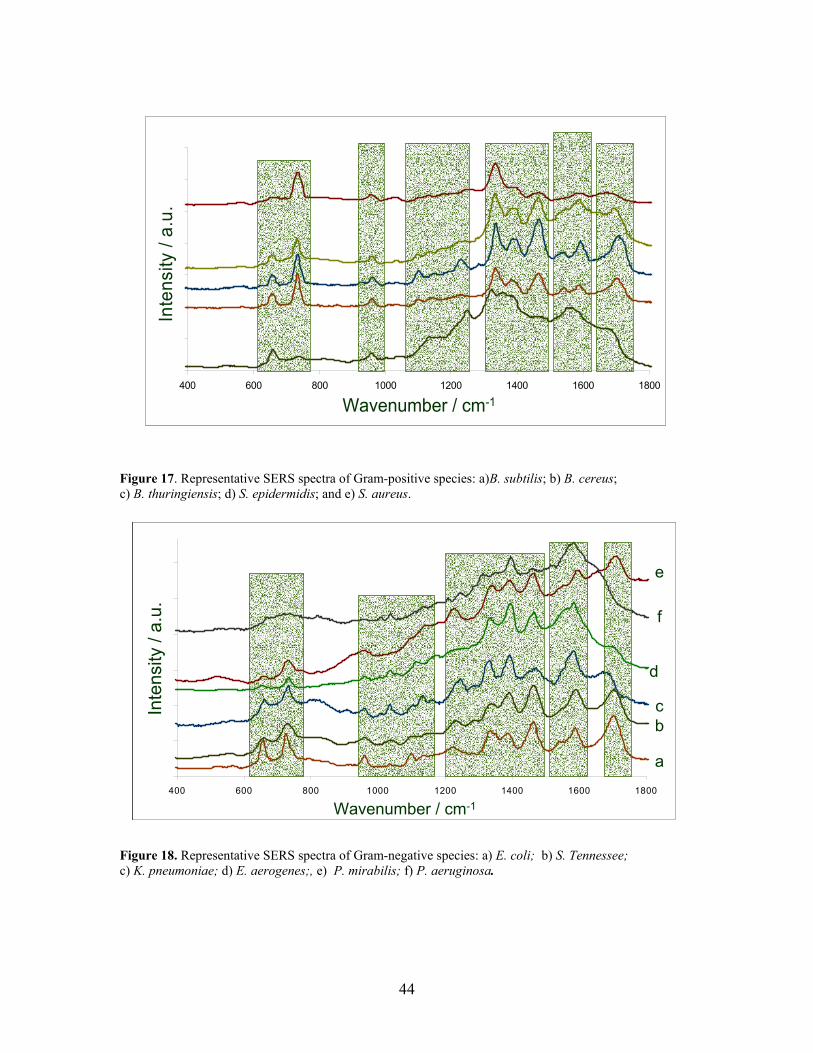
44
Figure 17. Representative SERS spectra of Gram-positive species: a)B. subtilis; b) B. cereus; c) B. thuringiensis; d) S. epidermidis; and e) S. aureus.
Figure 18. Representative SERS spectra of Gram-negative species: a) E. coli; b) S. Tennessee; c) K. pneumoniae; d) E. aerogenes;, e) P. mirabilis; f) P. aeruginosa.
400 600 800 1000 1200 1400 1600 1800
Wavenumber (cm-1)
Inte
nsity
(a.u
.)
Wavenumber / cm-1
Inte
nsity
/ a.
u.
400 600 800 1000 1200 1400 1600 1800
Wavenumber (cm-1)
Inte
nsity
(a.u
.)
Wavenumber / cm-1
Inte
nsity
/ a.
u.
400 600 800 1000 1200 1400 1600 1800
Wavenumber (cm-1)
Inte
nsity
(a.u
.)
a
bc
d
e
f
Inte
nsity
/ a.
u.
Wavenumber / cm-1400 600 800 1000 1200 1400 1600 1800
Wavenumber (cm-1)
Inte
nsity
(a.u
.)
a
bc
d
e
f
400 600 800 1000 1200 1400 1600 1800
Wavenumber (cm-1)
Inte
nsity
(a.u
.)
a
bc
d
e
f
400 600 800 1000 1200 1400 1600 1800
Wavenumber (cm-1)
Inte
nsity
(a.u
.)
a
bc
d
e
f
400 600 800 1000 1200 1400 1600 1800
Wavenumber (cm-1)
Inte
nsity
(a.u
.)
a
bc
d
e
f
Inte
nsity
/ a.
u.
Wavenumber / cm-1
45
Simple visual inspection of the spectra (and definitely, of all spectra acquired) shows that
they are qualitatively very similar. Nonetheless, on closer inspection, subtle quantitative
differences can be observed. Several interesting bands appear in the spectra. Some
tentative assignments are listed in detail in Tables 2 and 3. The bands match features
reported in the literature for samples of larger amounts of bacterial biomass or its
molecular components [Schuter, K. et al., 2005; Maquelin, K. et al., 2002]. Most bands
correspond to functional groups in the main constituents of a microbial cell, protein,
carbohydrates, lipids and nucleic acids. Some are more specific for smaller molecular
compounds, like the very characteristic sharp band of phenylalanine at ∼964-1010 cm-1 ,
which is present in all protein-containing samples. It is obvious that such simple visual
inspection of these spectra will not allow one to discover the relationship between the
bacteria based on their Raman and SERS “fingerprints”, and alternative strategies need to
be adopted. Therefore, multivariate statistical methods have to be used, and these
included PCA, DFA and HCA.
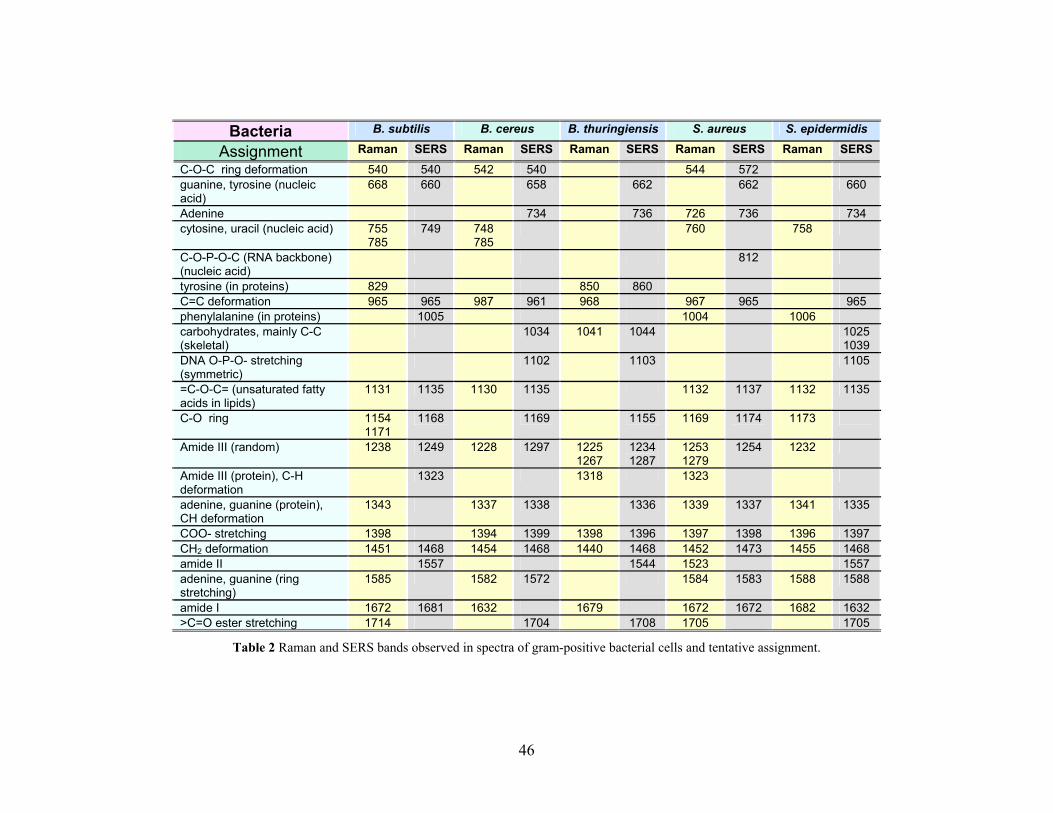
46
Bacteria B. subtilis B. cereus B. thuringiensis S. aureus S. epidermidis
Assignment Raman SERS Raman SERS Raman SERS Raman SERS Raman SERS C-O-C ring deformation 540 540 542 540 544 572 guanine, tyrosine (nucleic acid)
668 660 658 662 662 660
Adenine 734 736 726 736 734 cytosine, uracil (nucleic acid) 755
785 749 748
785 760 758
C-O-P-O-C (RNA backbone) (nucleic acid)
812
tyrosine (in proteins) 829 850 860 C=C deformation 965 965 987 961 968 967 965 965 phenylalanine (in proteins) 1005 1004 1006 carbohydrates, mainly C-C (skeletal)
1034 1041 1044 1025 1039
DNA O-P-O- stretching (symmetric)
1102 1103 1105
=C-O-C= (unsaturated fatty acids in lipids)
1131 1135 1130 1135 1132 1137 1132 1135
C-O ring 1154 1171
1168 1169 1155 1169 1174 1173
Amide III (random) 1238 1249 1228 1297 1225 1267
1234 1287
1253 1279
1254 1232
Amide III (protein), C-H deformation
1323 1318 1323
adenine, guanine (protein), CH deformation
1343 1337 1338 1336 1339 1337 1341 1335
COO- stretching 1398 1394 1399 1398 1396 1397 1398 1396 1397 CH2 deformation 1451 1468 1454 1468 1440 1468 1452 1473 1455 1468 amide II 1557 1544 1523 1557 adenine, guanine (ring stretching)
1585 1582 1572 1584 1583 1588 1588
amide I 1672 1681 1632 1679 1672 1672 1682 1632 >C=O ester stretching 1714 1704 1708 1705 1705
Table 2 Raman and SERS bands observed in spectra of gram-positive bacterial cells and tentative assignment.
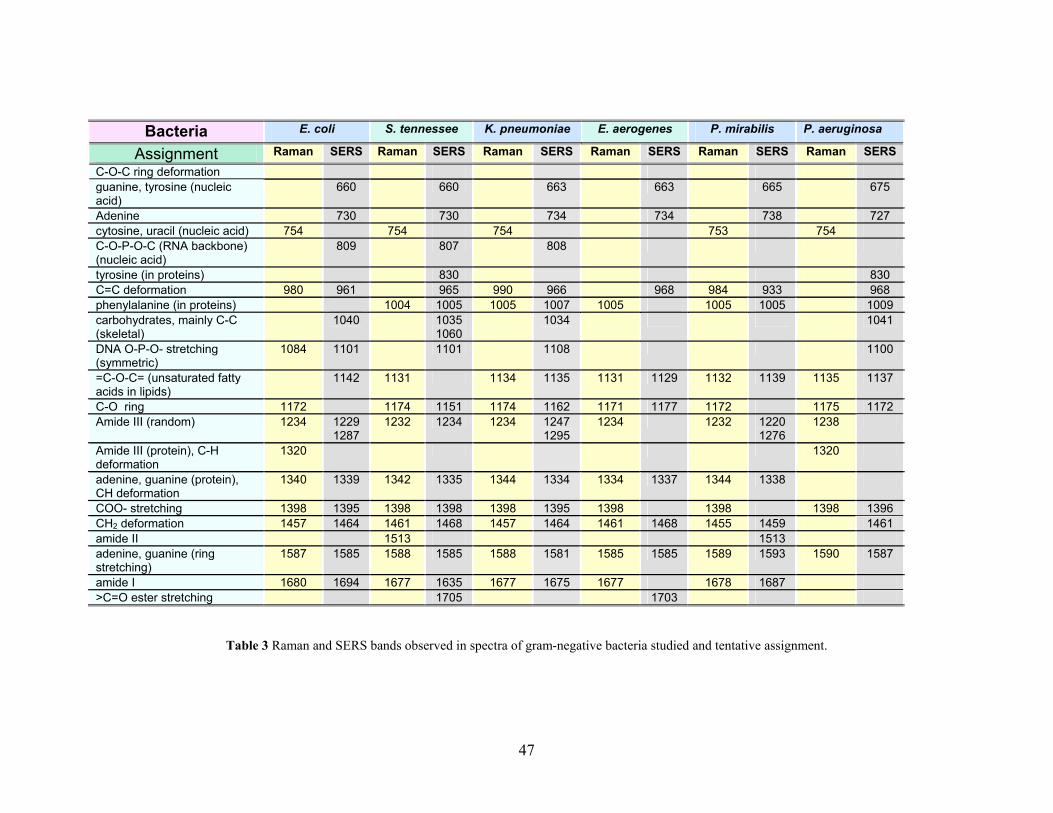
47
Bacteria E. coli S. tennessee K. pneumoniae E. aerogenes P. mirabilis P. aeruginosa
Assignment Raman SERS Raman SERS Raman SERS Raman SERS Raman SERS Raman SERS C-O-C ring deformation guanine, tyrosine (nucleic acid)
660 660 663 663 665 675
Adenine 730 730 734 734 738 727 cytosine, uracil (nucleic acid) 754 754 754 753 754 C-O-P-O-C (RNA backbone) (nucleic acid)
809 807 808
tyrosine (in proteins) 830 830 C=C deformation 980 961 965 990 966 968 984 933 968 phenylalanine (in proteins) 1004 1005 1005 1007 1005 1005 1005 1009 carbohydrates, mainly C-C (skeletal)
1040 1035 1060
1034 1041
DNA O-P-O- stretching (symmetric)
1084 1101 1101 1108 1100
=C-O-C= (unsaturated fatty acids in lipids)
1142 1131 1134 1135 1131 1129 1132 1139 1135 1137
C-O ring 1172 1174 1151 1174 1162 1171 1177 1172 1175 1172 Amide III (random) 1234 1229
1287 1232 1234 1234 1247
1295 1234 1232 1220
1276 1238
Amide III (protein), C-H deformation
1320
1320
adenine, guanine (protein), CH deformation
1340 1339 1342 1335 1344 1334 1334 1337 1344 1338
COO- stretching 1398 1395 1398 1398 1398 1395 1398 1398 1398 1396 CH2 deformation 1457 1464 1461 1468 1457 1464 1461 1468 1455 1459 1461 amide II 1513 1513 adenine, guanine (ring stretching)
1587 1585 1588 1585 1588 1581 1585 1585 1589 1593 1590 1587
amide I 1680 1694 1677 1635 1677 1675 1677 1678 1687 >C=O ester stretching 1705 1703
Table 3 Raman and SERS bands observed in spectra of gram-negative bacteria studied and tentative assignment.
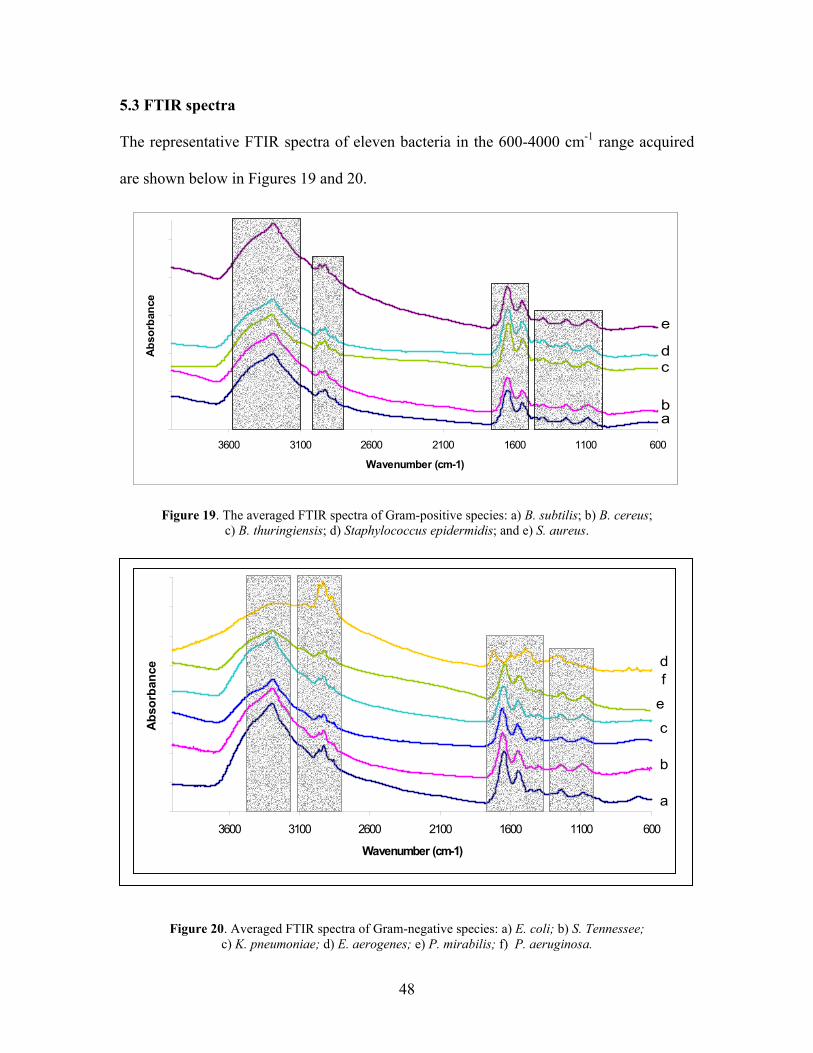
48
5.3 FTIR spectra
The representative FTIR spectra of eleven bacteria in the 600-4000 cm-1 range acquired
are shown below in Figures 19 and 20.
Figure 19. The averaged FTIR spectra of Gram-positive species: a) B. subtilis; b) B. cereus; c) B. thuringiensis; d) Staphylococcus epidermidis; and e) S. aureus.
Figure 20. Averaged FTIR spectra of Gram-negative species: a) E. coli; b) S. Tennessee; c) K. pneumoniae; d) E. aerogenes; e) P. mirabilis; f) P. aeruginosa.
600110016002100260031003600
Wavenumber (cm-1)
Abso
rban
ce
ab
cd
e
600110016002100260031003600
Wavenumber (cm-1)
Abso
rban
ce
ab
cd
e
600110016002100260031003600
Wavenumber (cm-1)
Abs
orba
nce
a
b
c
d
e
f
600110016002100260031003600
Wavenumber (cm-1)
Abs
orba
nce
a
b
c
d
e
f
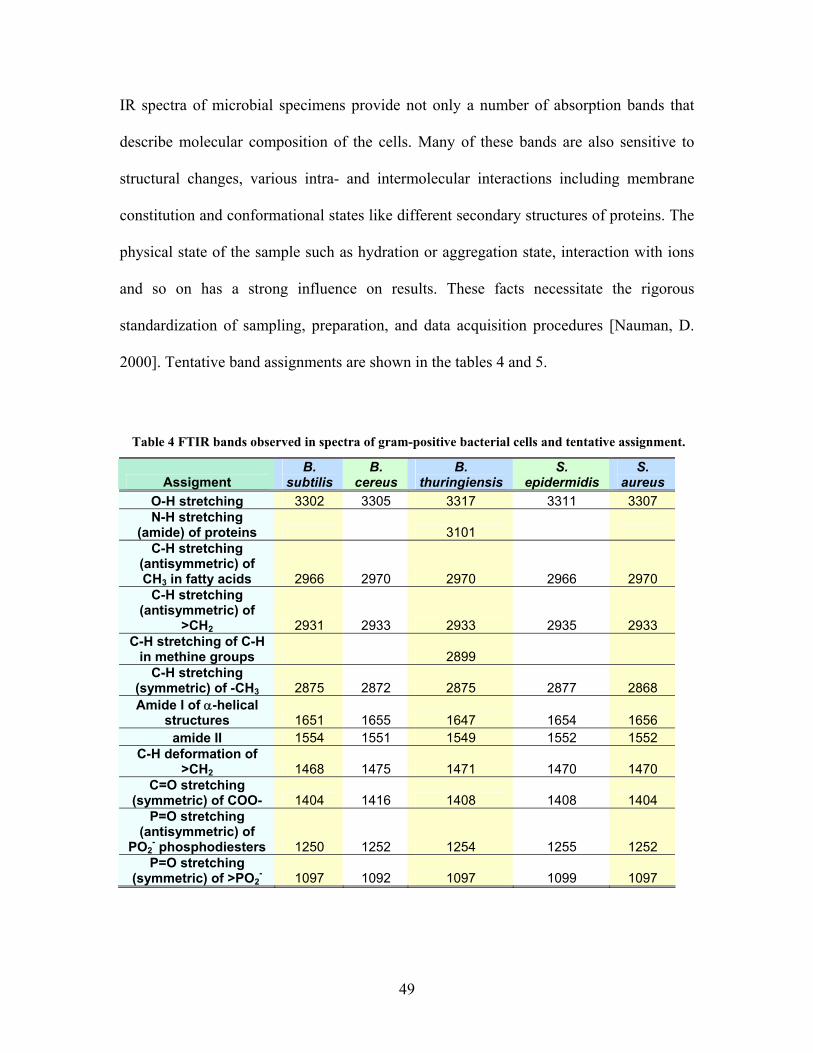
49
IR spectra of microbial specimens provide not only a number of absorption bands that
describe molecular composition of the cells. Many of these bands are also sensitive to
structural changes, various intra- and intermolecular interactions including membrane
constitution and conformational states like different secondary structures of proteins. The
physical state of the sample such as hydration or aggregation state, interaction with ions
and so on has a strong influence on results. These facts necessitate the rigorous
standardization of sampling, preparation, and data acquisition procedures [Nauman, D.
2000]. Tentative band assignments are shown in the tables 4 and 5.
Table 4 FTIR bands observed in spectra of gram-positive bacterial cells and tentative assignment.
Assigment B.
subtilis B.
cereus B.
thuringiensis S.
epidermidis S.
aureus O-H stretching 3302 3305 3317 3311 3307 N-H stretching
(amide) of proteins 3101 C-H stretching
(antisymmetric) of CH3 in fatty acids 2966 2970 2970 2966 2970
C-H stretching (antisymmetric) of
>CH2 2931 2933 2933 2935 2933 C-H stretching of C-H
in methine groups 2899 C-H stretching
(symmetric) of -CH3 2875 2872 2875 2877 2868 Amide I of α-helical
structures 1651 1655 1647 1654 1656 amide II 1554 1551 1549 1552 1552
C-H deformation of >CH2 1468 1475 1471 1470 1470
C=O stretching (symmetric) of COO- 1404 1416 1408 1408 1404
P=O stretching (antisymmetric) of
PO2- phosphodiesters 1250 1252 1254 1255 1252 P=O stretching
(symmetric) of >PO2- 1097 1092 1097 1099 1097
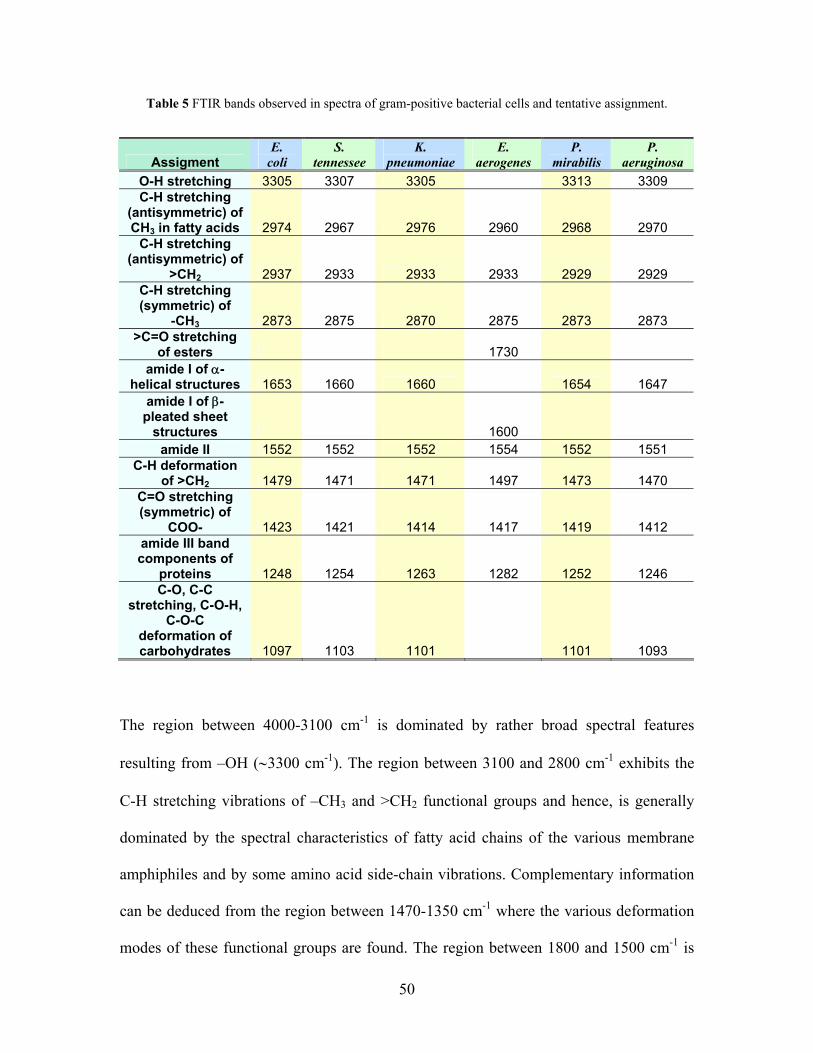
50
Table 5 FTIR bands observed in spectra of gram-positive bacterial cells and tentative assignment.
Assigment E.
coli S.
tennessee K.
pneumoniae E.
aerogenes P.
mirabilis P.
aeruginosa O-H stretching 3305 3307 3305 3313 3309 C-H stretching
(antisymmetric) of CH3 in fatty acids 2974 2967 2976 2960 2968 2970
C-H stretching (antisymmetric) of
>CH2 2937 2933 2933 2933 2929 2929 C-H stretching (symmetric) of
-CH3 2873 2875 2870 2875 2873 2873 >C=O stretching
of esters 1730 amide I of α-
helical structures 1653 1660 1660 1654 1647 amide I of β-
pleated sheet structures 1600
amide II 1552 1552 1552 1554 1552 1551 C-H deformation
of >CH2 1479 1471 1471 1497 1473 1470 C=O stretching (symmetric) of
COO- 1423 1421 1414 1417 1419 1412 amide III band components of
proteins 1248 1254 1263 1282 1252 1246 C-O, C-C
stretching, C-O-H, C-O-C
deformation of carbohydrates 1097 1103 1101 1101 1093
The region between 4000-3100 cm-1 is dominated by rather broad spectral features
resulting from –OH (∼3300 cm-1). The region between 3100 and 2800 cm-1 exhibits the
C-H stretching vibrations of –CH3 and >CH2 functional groups and hence, is generally
dominated by the spectral characteristics of fatty acid chains of the various membrane
amphiphiles and by some amino acid side-chain vibrations. Complementary information
can be deduced from the region between 1470-1350 cm-1 where the various deformation
modes of these functional groups are found. The region between 1800 and 1500 cm-1 is
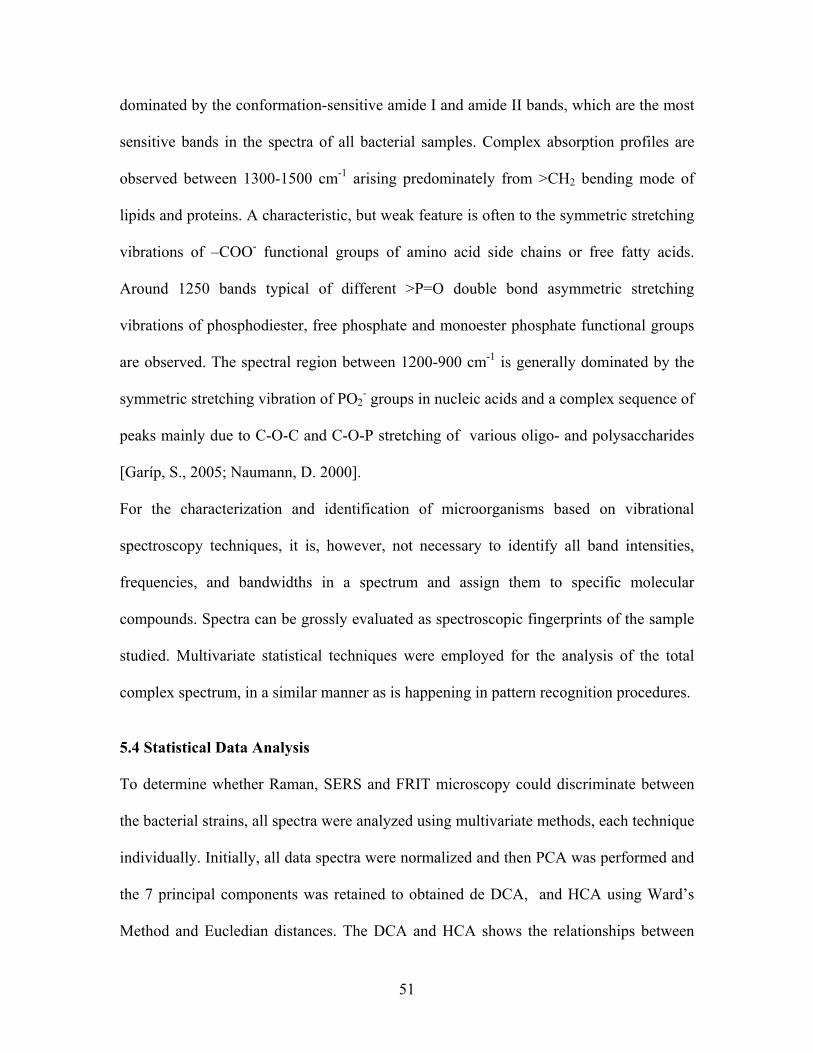
51
dominated by the conformation-sensitive amide I and amide II bands, which are the most
sensitive bands in the spectra of all bacterial samples. Complex absorption profiles are
observed between 1300-1500 cm-1 arising predominately from >CH2 bending mode of
lipids and proteins. A characteristic, but weak feature is often to the symmetric stretching
vibrations of –COO- functional groups of amino acid side chains or free fatty acids.
Around 1250 bands typical of different >P=O double bond asymmetric stretching
vibrations of phosphodiester, free phosphate and monoester phosphate functional groups
are observed. The spectral region between 1200-900 cm-1 is generally dominated by the
symmetric stretching vibration of PO2- groups in nucleic acids and a complex sequence of
peaks mainly due to C-O-C and C-O-P stretching of various oligo- and polysaccharides
[Garíp, S., 2005; Naumann, D. 2000].
For the characterization and identification of microorganisms based on vibrational
spectroscopy techniques, it is, however, not necessary to identify all band intensities,
frequencies, and bandwidths in a spectrum and assign them to specific molecular
compounds. Spectra can be grossly evaluated as spectroscopic fingerprints of the sample
studied. Multivariate statistical techniques were employed for the analysis of the total
complex spectrum, in a similar manner as is happening in pattern recognition procedures.
5.4 Statistical Data Analysis
To determine whether Raman, SERS and FRIT microscopy could discriminate between
the bacterial strains, all spectra were analyzed using multivariate methods, each technique
individually. Initially, all data spectra were normalized and then PCA was performed and
the 7 principal components was retained to obtained de DCA, and HCA using Ward’s
Method and Eucledian distances. The DCA and HCA shows the relationships between
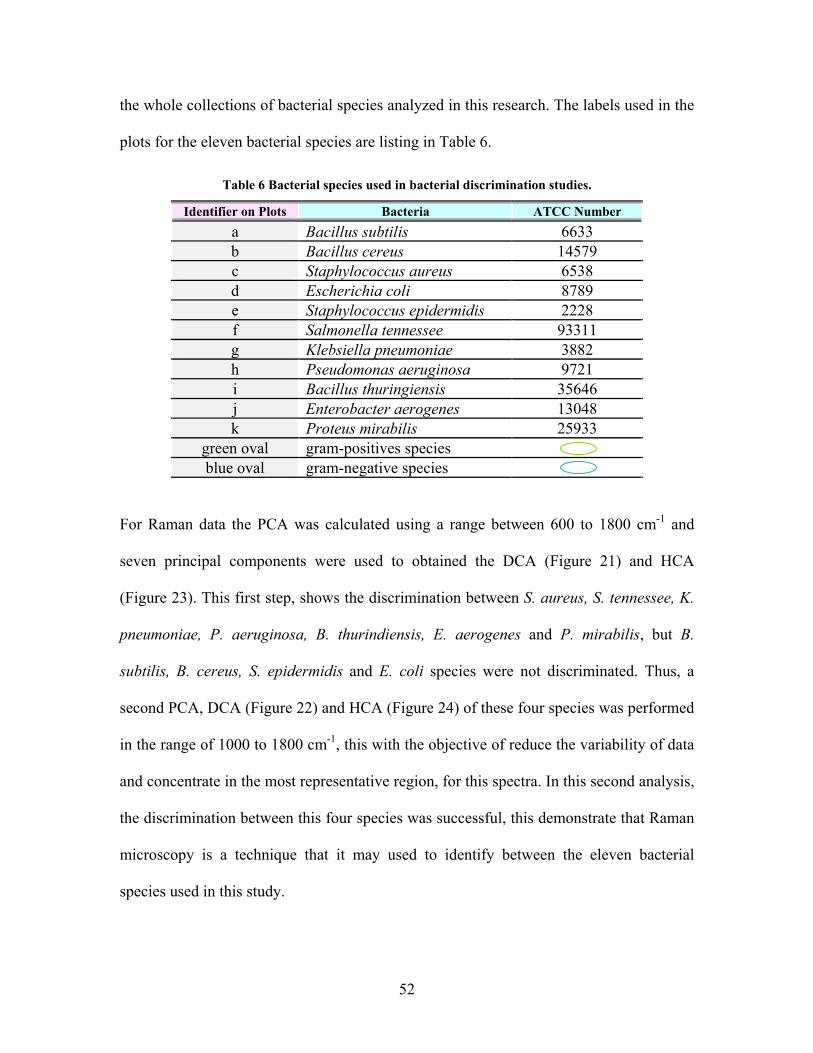
52
the whole collections of bacterial species analyzed in this research. The labels used in the
plots for the eleven bacterial species are listing in Table 6.
Table 6 Bacterial species used in bacterial discrimination studies.
Identifier on Plots Bacteria ATCC Number a Bacillus subtilis 6633 b Bacillus cereus 14579 c Staphylococcus aureus 6538 d Escherichia coli 8789 e Staphylococcus epidermidis 2228 f Salmonella tennessee 93311 g Klebsiella pneumoniae 3882 h Pseudomonas aeruginosa 9721 i Bacillus thuringiensis 35646 j Enterobacter aerogenes 13048 k Proteus mirabilis 25933
green oval gram-positives species blue oval gram-negative species
For Raman data the PCA was calculated using a range between 600 to 1800 cm-1 and
seven principal components were used to obtained the DCA (Figure 21) and HCA
(Figure 23). This first step, shows the discrimination between S. aureus, S. tennessee, K.
pneumoniae, P. aeruginosa, B. thurindiensis, E. aerogenes and P. mirabilis, but B.
subtilis, B. cereus, S. epidermidis and E. coli species were not discriminated. Thus, a
second PCA, DCA (Figure 22) and HCA (Figure 24) of these four species was performed
in the range of 1000 to 1800 cm-1, this with the objective of reduce the variability of data
and concentrate in the most representative region, for this spectra. In this second analysis,
the discrimination between this four species was successful, this demonstrate that Raman
microscopy is a technique that it may used to identify between the eleven bacterial
species used in this study.
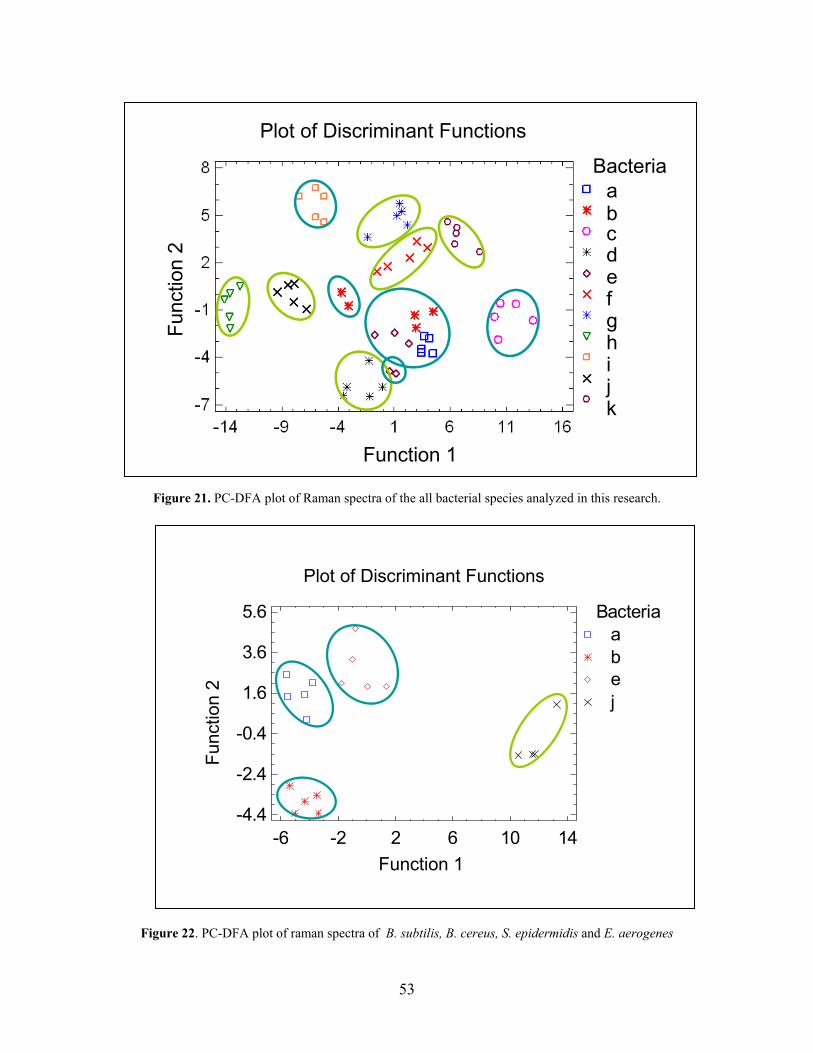
53
Figure 21. PC-DFA plot of Raman spectra of the all bacterial species analyzed in this research.
Figure 22. PC-DFA plot of raman spectra of B. subtilis, B. cereus, S. epidermidis and E. aerogenes
Plot of Discriminant Functions
Function 1
Func
tion
2
Bacteriaa b e j
-6 -2 2 6 10 14-4.4
-2.4
-0.4
1.6
3.6
5.6
Function 1Function 1
Func
tion
2
Plot of Discriminant FunctionsPlot of Discriminant Functions
Function 1
Func
tion
2
Bacteriaa b e j
-6 -2 2 6 10 14-4.4
-2.4
-0.4
1.6
3.6
5.6
Plot of Discriminant Functions
Function 1
Func
tion
2
Bacteriaa b e j
-6 -2 2 6 10 14-4.4
-2.4
-0.4
1.6
3.6
5.6
Function 1Function 1
Func
tion
2
Plot of Discriminant Functions
Function 1
Func
tion
2
Plot of Discriminant Functions
Bacteriaabcdefghijk
Function 1
Func
tion
2
Plot of Discriminant Functions
Bacteriaabcdefghijk
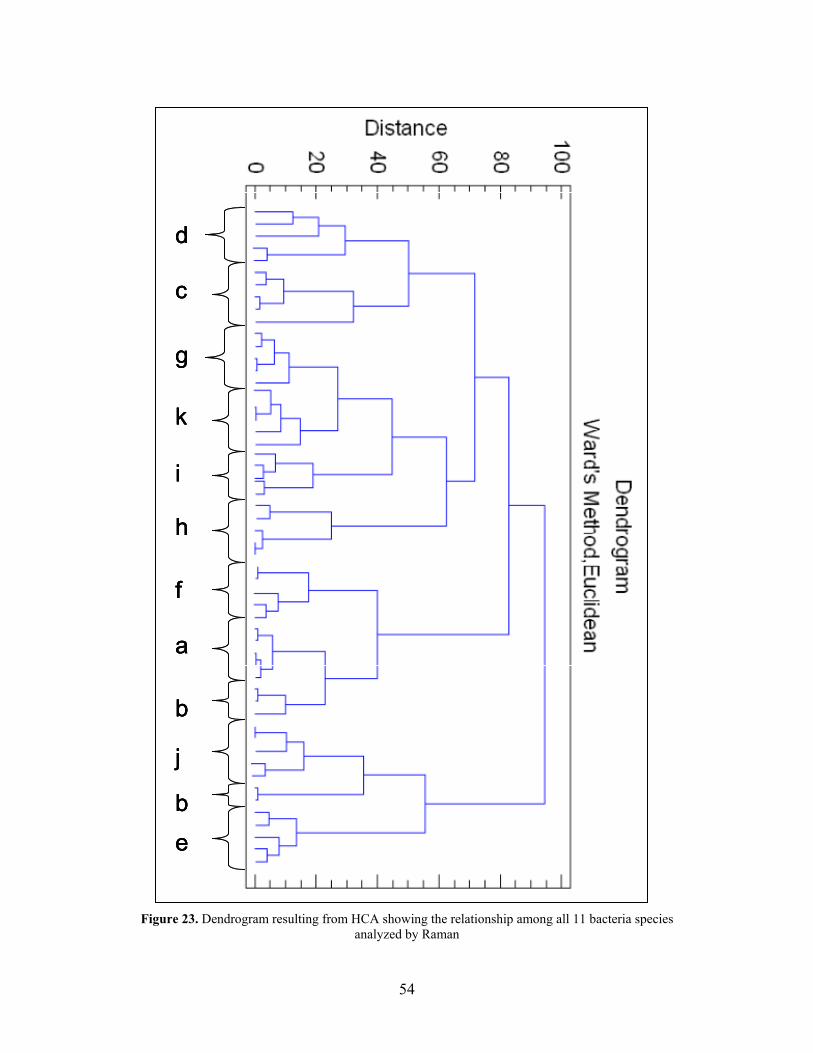
54
Figure 23. Dendrogram resulting from HCA showing the relationship among all 11 bacteria species analyzed by Raman
c
g
k
i
h
f
a
b
j
e
d
b
c
g
k
i
h
f
a
b
j
e
d
b
c
g
k
i
h
f
a
b
j
e
d
b
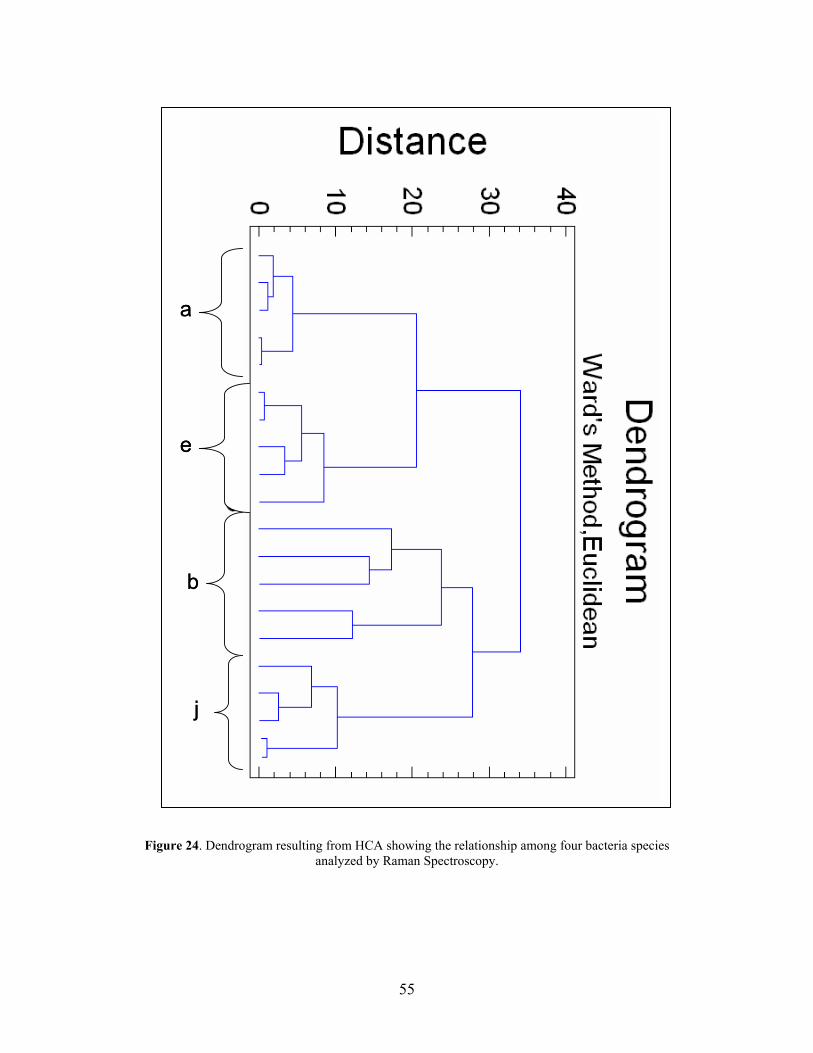
55
Figure 24. Dendrogram resulting from HCA showing the relationship among four bacteria species analyzed by Raman Spectroscopy.
a
e
b
j
a
e
b
j
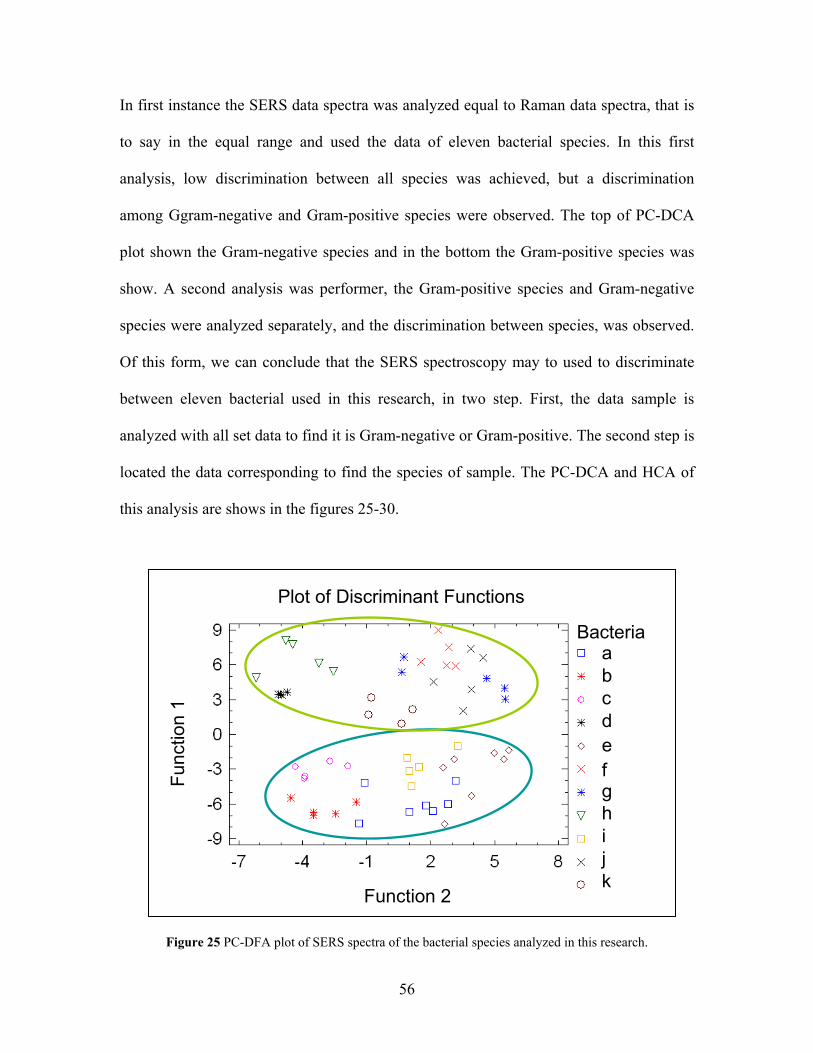
56
In first instance the SERS data spectra was analyzed equal to Raman data spectra, that is
to say in the equal range and used the data of eleven bacterial species. In this first
analysis, low discrimination between all species was achieved, but a discrimination
among Ggram-negative and Gram-positive species were observed. The top of PC-DCA
plot shown the Gram-negative species and in the bottom the Gram-positive species was
show. A second analysis was performer, the Gram-positive species and Gram-negative
species were analyzed separately, and the discrimination between species, was observed.
Of this form, we can conclude that the SERS spectroscopy may to used to discriminate
between eleven bacterial used in this research, in two step. First, the data sample is
analyzed with all set data to find it is Gram-negative or Gram-positive. The second step is
located the data corresponding to find the species of sample. The PC-DCA and HCA of
this analysis are shows in the figures 25-30.
Figure 25 PC-DFA plot of SERS spectra of the bacterial species analyzed in this research.
Plot of Discriminant Functions
Func
tion
1
Function 2
Bacteriaabcdefghijk
Plot of Discriminant Functions
Func
tion
1
Function 2
Bacteriaabcdefghijk
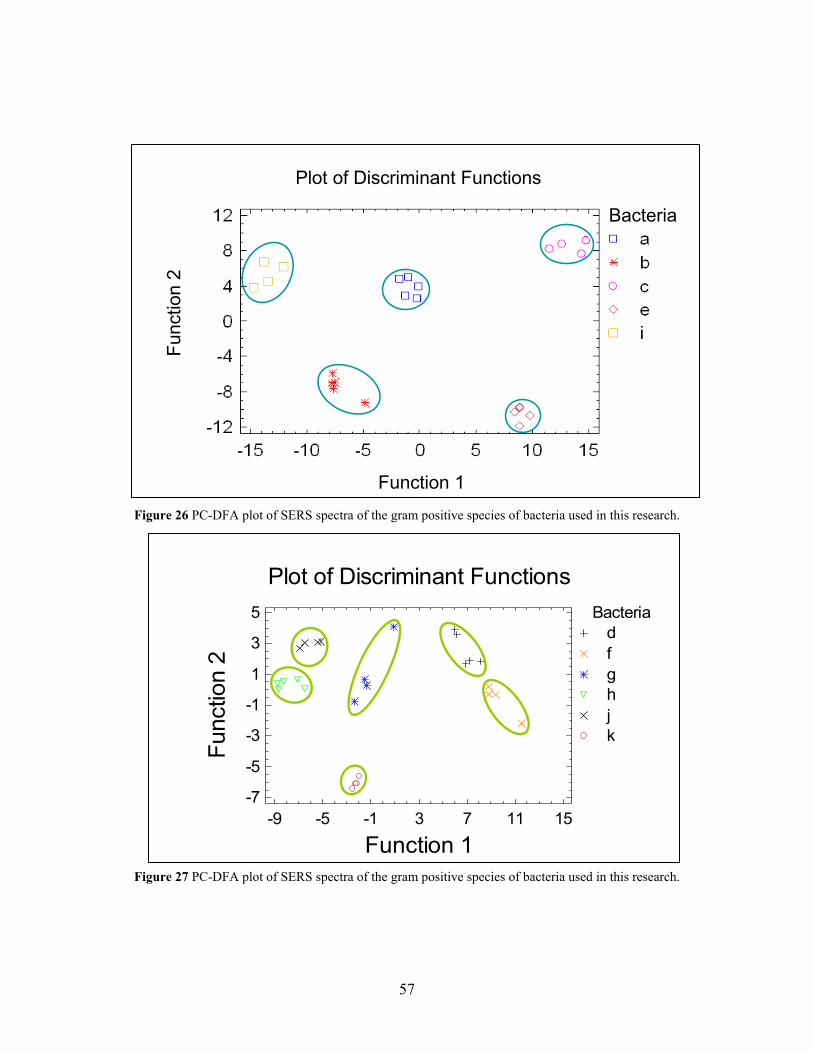
57
Figure 26 PC-DFA plot of SERS spectra of the gram positive species of bacteria used in this research.
Figure 27 PC-DFA plot of SERS spectra of the gram positive species of bacteria used in this research.
Plot of Discriminant Functions
Function 1
Func
tion
2
Bacteriad f g h j k
-9 -5 -1 3 7 11 15-7
-5
-3
-1
1
3
5
Plot of Discriminant Functions
Function 1
Func
tion
2
Bacteriad f g h j k
-9 -5 -1 3 7 11 15-7
-5
-3
-1
1
3
5
Plot of Discriminant FunctionsFu
nctio
n 2
Function 1
Bacteria
Plot of Discriminant FunctionsFu
nctio
n 2
Function 1
Plot of Discriminant FunctionsFu
nctio
n 2
Function 1
Bacteria
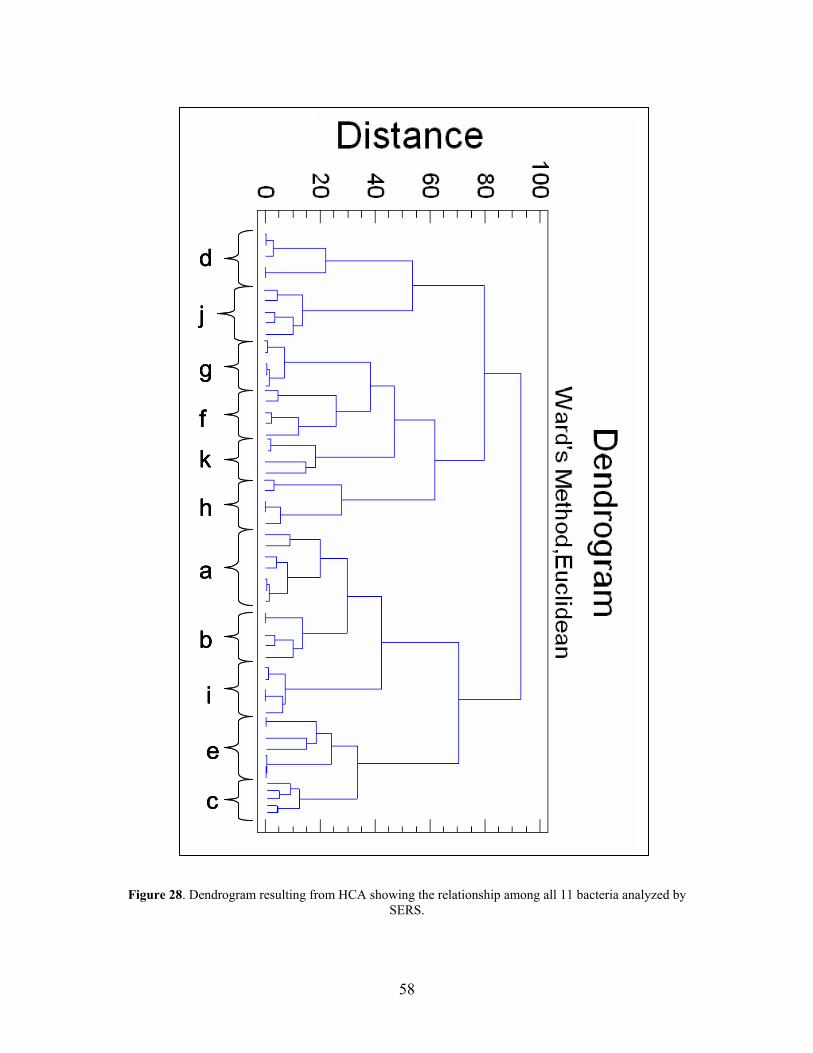
58
Figure 28. Dendrogram resulting from HCA showing the relationship among all 11 bacteria analyzed by SERS.
d
j
g
f
k
h
a
b
i
c
e
d
j
g
f
k
h
a
b
i
c
e
d
j
g
f
k
h
a
b
i
c
e
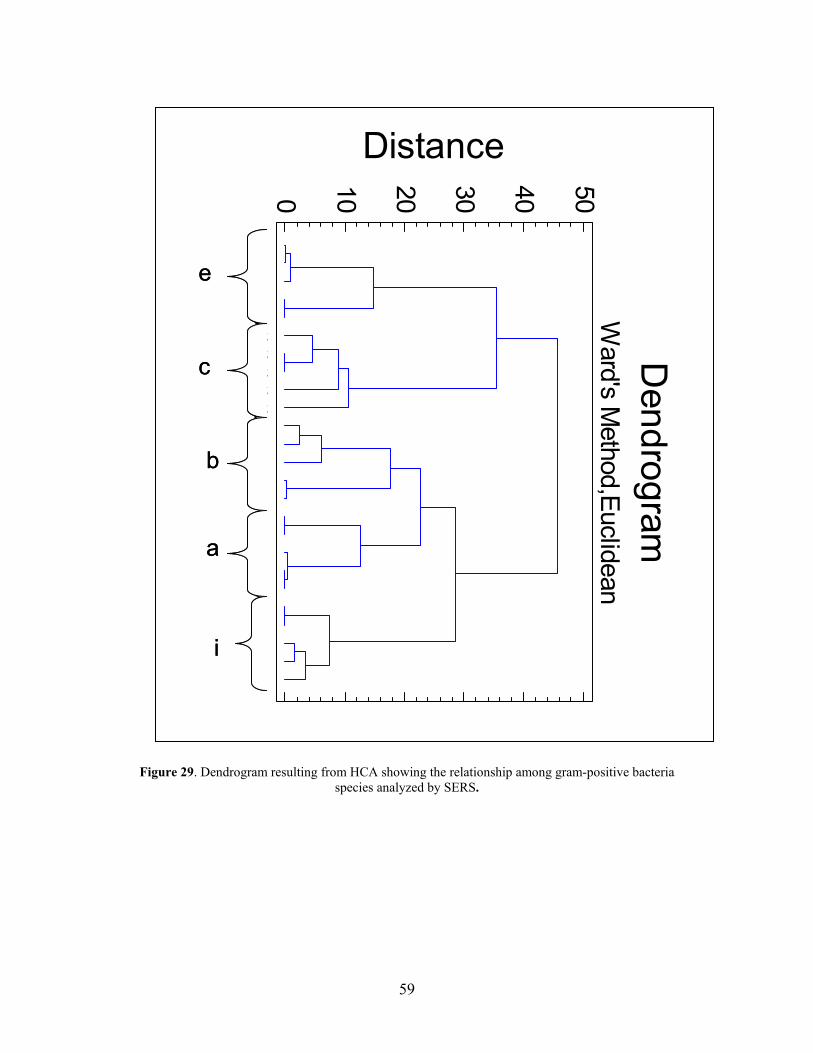
59
Figure 29. Dendrogram resulting from HCA showing the relationship among gram-positive bacteria species analyzed by SERS.
Dendrogram
Ward's M
ethod,Euclidean
Distance
0 10 20 30 40 50eeee
bbbb
b
c
cc
cc
aaaiiiii
a
a
e
c
i
a
e
b
Dendrogram
Ward's M
ethod,Euclidean
Distance
0 10 20 30 40 50eeee
bbbb
b
c
cc
cc
aaaiiiii
a
a
e
c
i
a
e
b
c
i
a
e
b
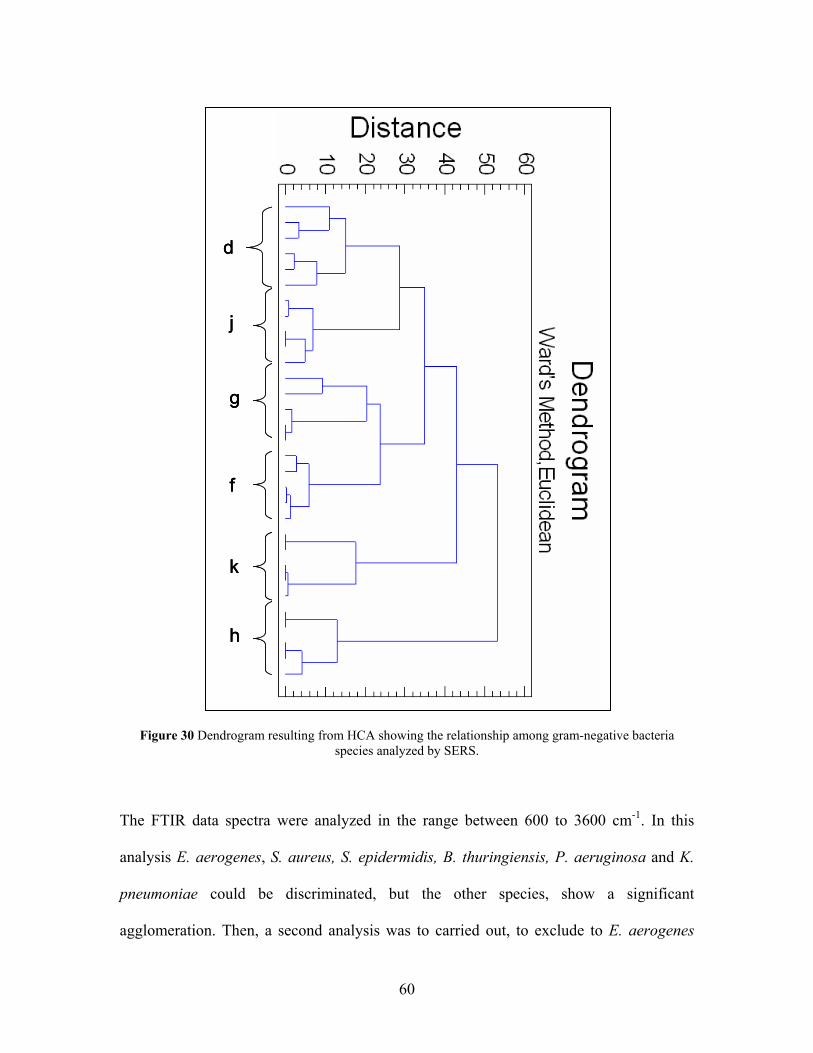
60
Figure 30 Dendrogram resulting from HCA showing the relationship among gram-negative bacteria species analyzed by SERS.
The FTIR data spectra were analyzed in the range between 600 to 3600 cm-1. In this
analysis E. aerogenes, S. aureus, S. epidermidis, B. thuringiensis, P. aeruginosa and K.
pneumoniae could be discriminated, but the other species, show a significant
agglomeration. Then, a second analysis was to carried out, to exclude to E. aerogenes
g
k
h
f
d
j
g
k
h
f
d
j
g
k
h
f
d
j
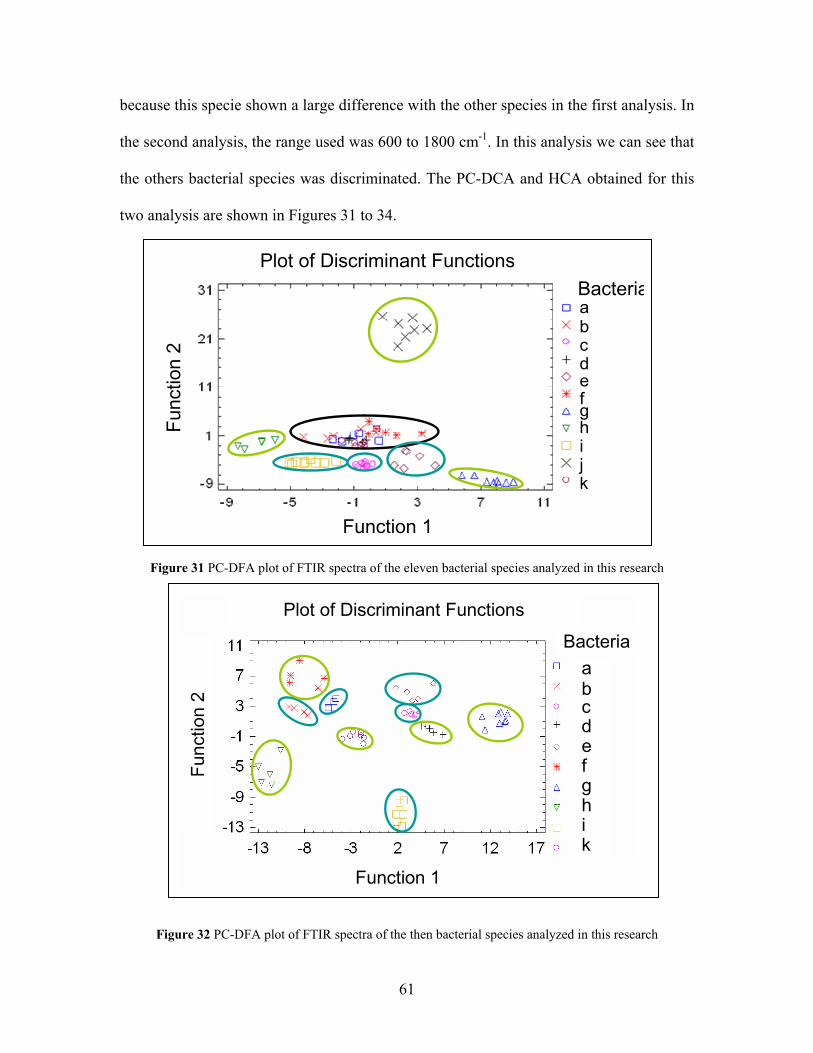
61
because this specie shown a large difference with the other species in the first analysis. In
the second analysis, the range used was 600 to 1800 cm-1. In this analysis we can see that
the others bacterial species was discriminated. The PC-DCA and HCA obtained for this
two analysis are shown in Figures 31 to 34.
Figure 31 PC-DFA plot of FTIR spectra of the eleven bacterial species analyzed in this research
Figure 32 PC-DFA plot of FTIR spectra of the then bacterial species analyzed in this research
Plot of Discriminant Functions
Func
tion
2
Function 1
Bacteriaabcdefghijk
Plot of Discriminant Functions
Func
tion
2
Function 1
Bacteriaabcdefghijk
Plot of Discriminant Functions
Func
tion
2
Function 1
Bacteriaabcdefghik
Plot of Discriminant Functions
Func
tion
2
Function 1
Bacteriaabcdefghik
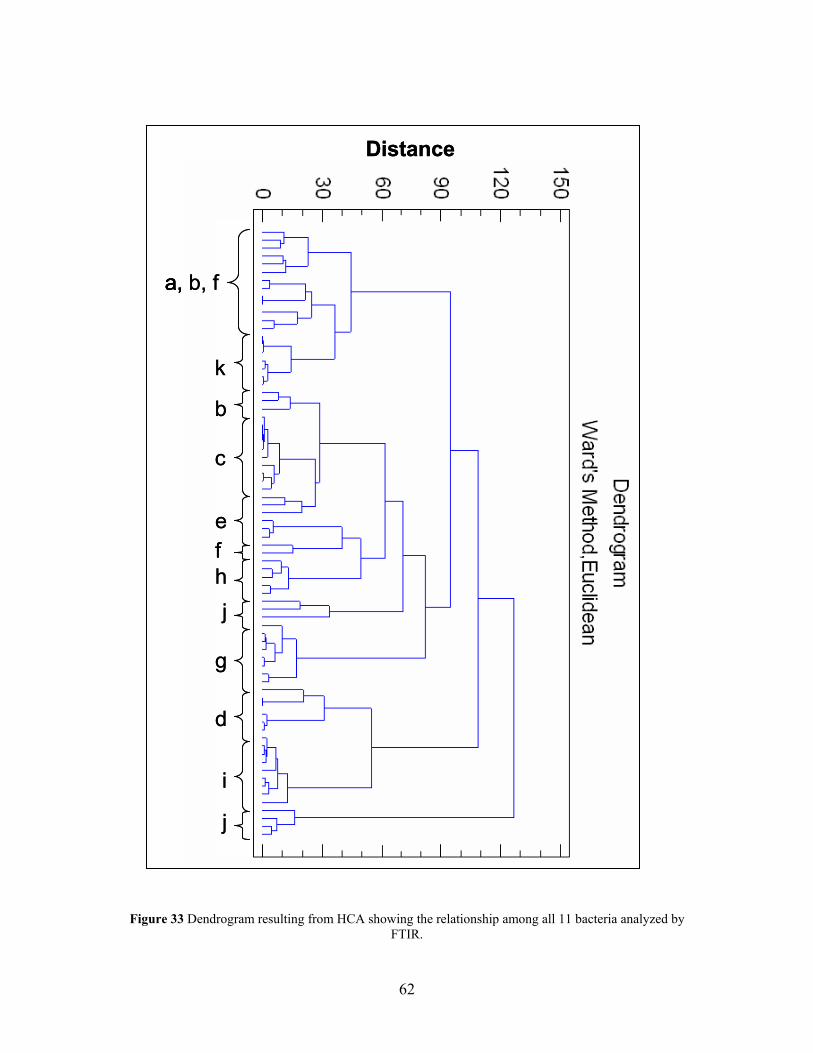
62
Figure 33 Dendrogram resulting from HCA showing the relationship among all 11 bacteria analyzed by FTIR.
j
i
d
g
jhfe
c
b
k
a, b, f
Distance
j
i
d
g
jhfe
c
b
k
a, b, f
j
i
d
g
jhfe
c
b
k
a, b, f
j
i
d
g
jhfe
c
b
k
a, b, f
Distance
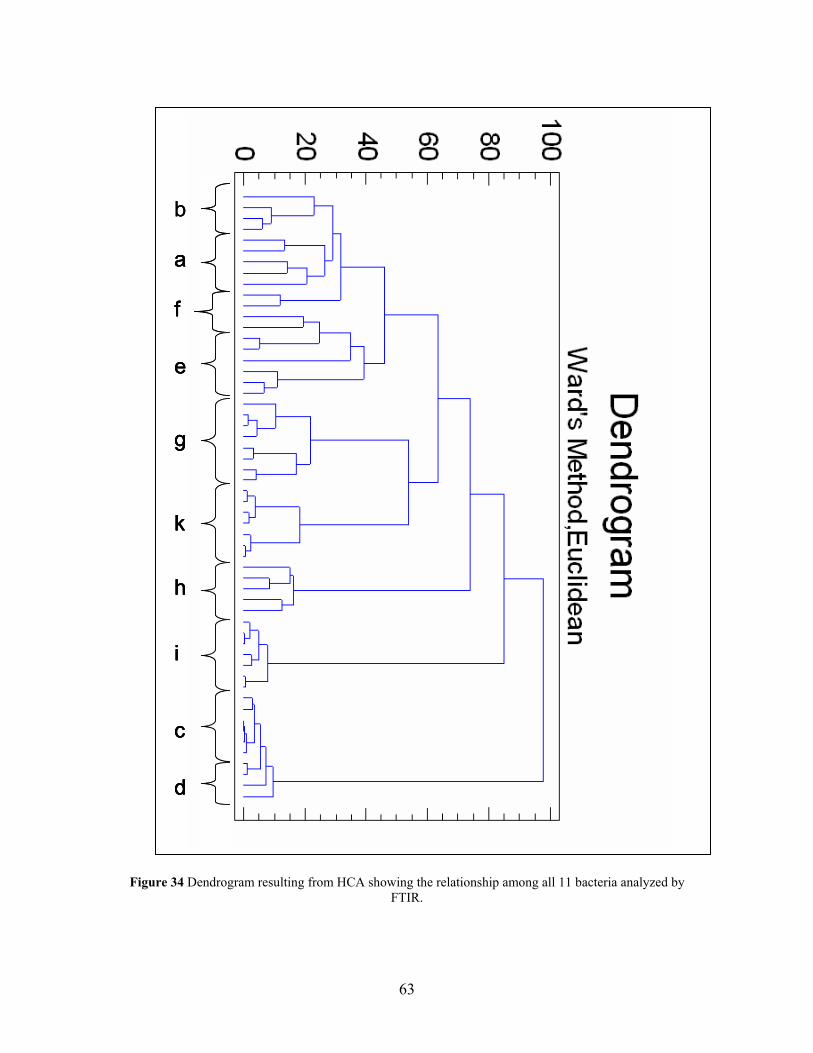
63
Figure 34 Dendrogram resulting from HCA showing the relationship among all 11 bacteria analyzed by FTIR.
a
f
e
g
k
h
i
c
d
b
a
f
e
g
k
h
i
c
d
a
f
e
g
k
h
i
c
d
a
f
e
g
k
h
i
c
d
b
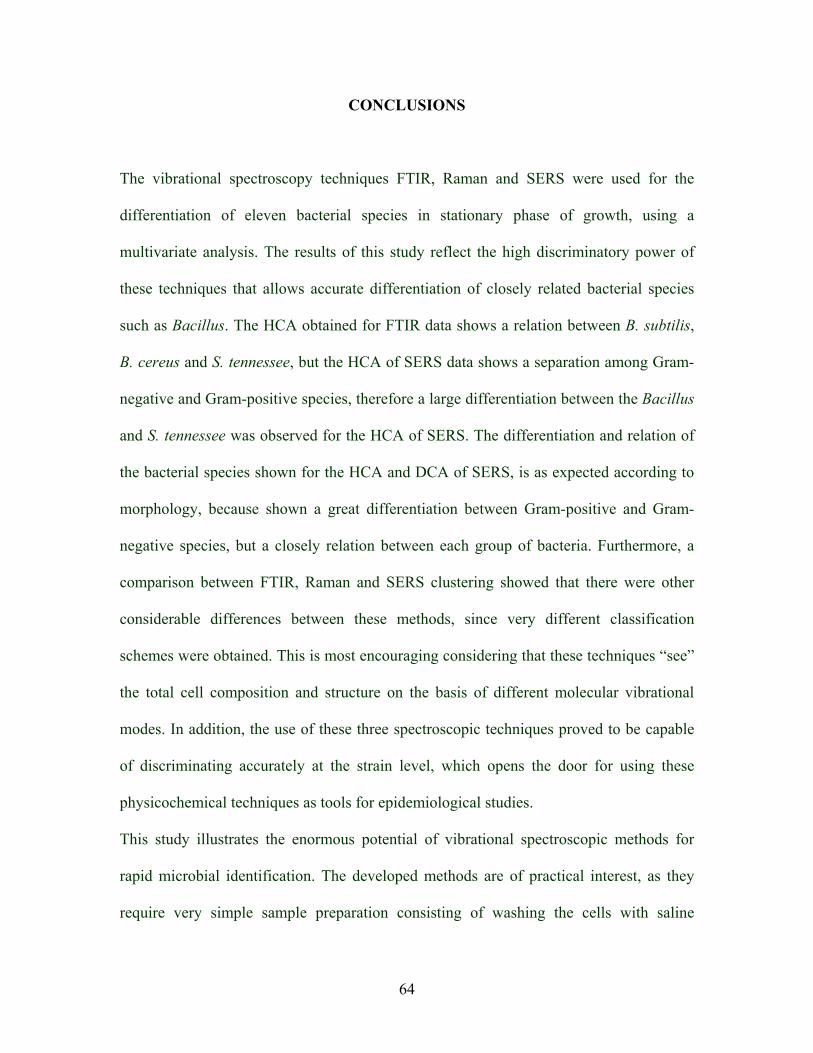
64
CONCLUSIONS
The vibrational spectroscopy techniques FTIR, Raman and SERS were used for the
differentiation of eleven bacterial species in stationary phase of growth, using a
multivariate analysis. The results of this study reflect the high discriminatory power of
these techniques that allows accurate differentiation of closely related bacterial species
such as Bacillus. The HCA obtained for FTIR data shows a relation between B. subtilis,
B. cereus and S. tennessee, but the HCA of SERS data shows a separation among Gram-
negative and Gram-positive species, therefore a large differentiation between the Bacillus
and S. tennessee was observed for the HCA of SERS. The differentiation and relation of
the bacterial species shown for the HCA and DCA of SERS, is as expected according to
morphology, because shown a great differentiation between Gram-positive and Gram-
negative species, but a closely relation between each group of bacteria. Furthermore, a
comparison between FTIR, Raman and SERS clustering showed that there were other
considerable differences between these methods, since very different classification
schemes were obtained. This is most encouraging considering that these techniques “see”
the total cell composition and structure on the basis of different molecular vibrational
modes. In addition, the use of these three spectroscopic techniques proved to be capable
of discriminating accurately at the strain level, which opens the door for using these
physicochemical techniques as tools for epidemiological studies.
This study illustrates the enormous potential of vibrational spectroscopic methods for
rapid microbial identification. The developed methods are of practical interest, as they
require very simple sample preparation consisting of washing the cells with saline
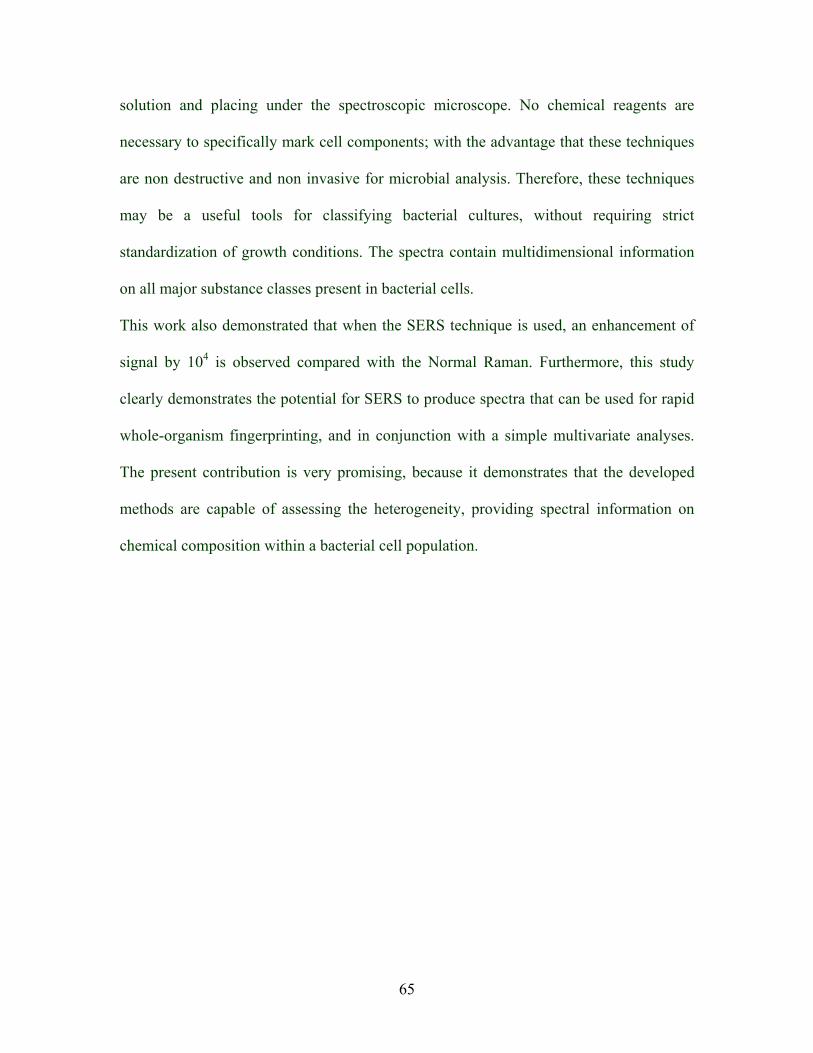
65
solution and placing under the spectroscopic microscope. No chemical reagents are
necessary to specifically mark cell components; with the advantage that these techniques
are non destructive and non invasive for microbial analysis. Therefore, these techniques
may be a useful tools for classifying bacterial cultures, without requiring strict
standardization of growth conditions. The spectra contain multidimensional information
on all major substance classes present in bacterial cells.
This work also demonstrated that when the SERS technique is used, an enhancement of
signal by 104 is observed compared with the Normal Raman. Furthermore, this study
clearly demonstrates the potential for SERS to produce spectra that can be used for rapid
whole-organism fingerprinting, and in conjunction with a simple multivariate analyses.
The present contribution is very promising, because it demonstrates that the developed
methods are capable of assessing the heterogeneity, providing spectral information on
chemical composition within a bacterial cell population.

66
Future Works
The spectroscopic study may be extended to examine the spores produced by selected
strains since these are more prone to be used as Biological Warfare Agents (BWA) due to
their increased mobility and possibility of airborne transport.
Furthermore, is important to extend this study to other bacterial species and to develop a
research focused in finding the differences between each phase of growth. Finally, study
the bacterial species without a washing the cells. Also, it is necessary to develop a
quantitative analysis of the components of each bacteria specie using the FTIR technique.

67
REFERENCES
• Alvarez, R.A., Arceo, E., Goulet, P. J., Garrido, J. G., Aroca, R. J. of Phys. Chem. B 109, 3787-3792, 2005.
• ATCC page http://www.atcc.com/Home.cfm. October 2006. • Bergey, D. H. Bergye’s Manual of Systematic Bacteriology, Lippincot Williams
& Wilkins, Baltimore, Vol. 1 and 2, 1984. • Beveridge, T. J., Davies, J. A. J. Bacteriol., 156:846, 1983.
• Brennam, P. J., Nikaido, H. Anu. Rev. Biochem. 64, 29-63, 1995. • Campion, A. and Kambhampati, P. Chem. Soc. Rev. 27, 241-250, 1998. • CDC page http://www.cdc.gov/. October 2006. • Curk, M., Peladan, F., Hubert, J. Mricrobiol. Lett. 123, 241-248, 1994. • Devarajan, S.; Nanostructured assemblies based on metal colloids and monolayer:
Preparation, characterization and studies towards novel applications; Thesis, Doctor of Philosophy, Department of Inorganic and Physical Chemistry, Indian Institute of Science Bangalore, India, 2005.
• FDA page http://www.cfsan.fda.gov/~mow/chap12.html. October 2006. • Fox, A.; Morgan, S. L., Larson, L., Odham, G. Anal.l Microb. Meth.. Plenum,
New York, 1990. • Freifelder, D. Applications to biochemistry and molecular biology: In Physical
Biochemistry, Freeman W. H. and Company, New York, 1982. • Garrell, R.L. Anal. Chem. 61, 401A- 411A, 1989.
• Ghuysen J-M, Hakenbeck, R. Bacterial cell wall. Elsevier, 1994. • Ibrahim, E. H., Sherman, G., Ward, S., Fraser, V. J., Kollef, H. The influence of
inadequate antimicrobial treatment of bloodstream infections on patient outcomes in the ICU setting. Chest 118: 146-155.
• Kambhampati, P., Child, C.M., Foster, M.C. and Campion, A. J. Chem. Phys.
108, 5013-5026, 1998.

68
• Kneipp K, Kneipp H, Itzkan I, Dasari R and Feld M S Chem. Phys. 247, 155, 1999.
• Kneipp K, Kneipp H, Itzkan I, Dasari R R and FeldMS Scanning and force
microscopies for biomedical applications II Proc. SPIE, 3922, 49, 2000. • Kneipp K, Kneipp H, Kartha V B, Manoharan R, Deinum G, Itzkan I, Dasari R R
and Feld M S Phys.Rev. E 57, R6281, 1998. • Kneipp, K., Kneipp, H., Itzkan, I., Dasar, R.R. and Feld, M.S. Chem. Rev. 99,
2957-2975, 1999. • • Kneipp, K.; Kneipp, H.; Itzkan, I.; Dasari, R. and Feld, M. J. of Phys.: Condens.
Matter 14, R597-R624, 2002. • Krassimir, P.V., Zeger, G.E., Van Blaaderen, A., Langmuir 19, l384-1389, 2003. • Krisker, K., Maquelin, K., Pina, P., Ngo, T., Pupples, M. J. Clin. Microbiol. 39,
1763-1770, 2003. • Lecomte, S., Wackerbart, H., Soulimane, T., Buse, G. and Hildebrandt, P. J. Am.
Chem. Soc. 120, 7381-7382, 1998.
• Lee, P.C., Meisel, D., J. Phys. Chem. 86, 3391-3395, 1982.
• Levine, I. N. Physical Chemsitry, four editon, McGraw-Hill, United State of
America, 713-716, 1995. • Manctsch, H. H. and Chapman, D. Infrared spectroscopy of biomolecules. Wiles-
Liss, New York, 1996. • Manctsch, H. H. and Chapman, D. Spectroscopy of biological systems. Clark, R.
and Hester. R. E., Willey&Sons, New York, 1986. • Maquelin, K., Krischner, C., Choo-Smith, L. Ngo-Thi, N., Vreeswijk, M.,
Puppels, G. J. Clin. Microbiol. 41-1, 324-329, 2002. • Moskovits M J. Chem. Phys. 69, 1459, 1978. • Moskovits, M. Rev. Mod. Phys. 57, 783, 1985. • Murgida D. H. and Hildebrandt P. J. Am. Chem. Soc. 123, 4062, 2001. • Nabiev I. R., Morjani H. and Manfait M. Eur. Biophys. J. 19, 311, 1991.

69
• Nabiev I. R., Sokolov K. V. and Manfait M. Biomolecular Spectroscopy Chichester, Wiley, 1993.
• Nabiev I., Baranov A., Chourpa I., Beljebbar A., Sockalingum G. D. and Manfait
M. J. Phys. Chem. 99, 1608, 1995.
• Naumann, D. Infrared Spectroscopy in Microbiology: In Encyplopedia of Analytical Chemistry, R.A. Meyers, 102-131, 2000.
• Perreteven, V., Vorlet-Faurer, L., Slickers, P., Ehricht, R., Kuhnert, P., Frey, J. J.
Clin. Microbiol., 96(1), 110-6, 2005. • Picorel R., Chumanov G., Torrado E., Cotton T. M. and Seibert M. J. Phys.
Chem. B 102, 2609, 1998. • Premasiri, W. R., D. T. Moir, M. S. Klempner, N. Krieger, G. Jones II, Ziegler, L.
D. J. Phys. Chem. B. 109, 312-320, 2005.
• Pupples, G.. In Fluorescent and luminescent probes for biological activity, 2nd ed., Mason, W. T., Academic Press: London, 377-406, 1990.
• Rogers, H. J., H. R. Perkins, J. B. Ward, Microbial Cell Walls and Membranes,
Chapman and Hall, London, 1980.
• Rogers, H. J., H. R. Perkins, J. B. Ward, Microbial Cell Walls and Membranes, Chapman and Hall, London, 1980.
• Wilson, S. A. Young, O., Coolbear, T. Meat Sci., 32, 92-103, 1992.
• Wood, E., Sutton C., Beezer A. E., Creighton J. A., Davis A F and Mitchell J C
Int. J. Pharmaceutics 154, 115, 1997.
• Xu H. X., Aizpurua J., Kall M. and Apell P. Phys. Rev. E 62, 4318, 2000.
• Zou, S.; Williams, C. T., Chen, E., Weaver, M., J. Phys. Chem. B. 102, 9039-9094, 1998.
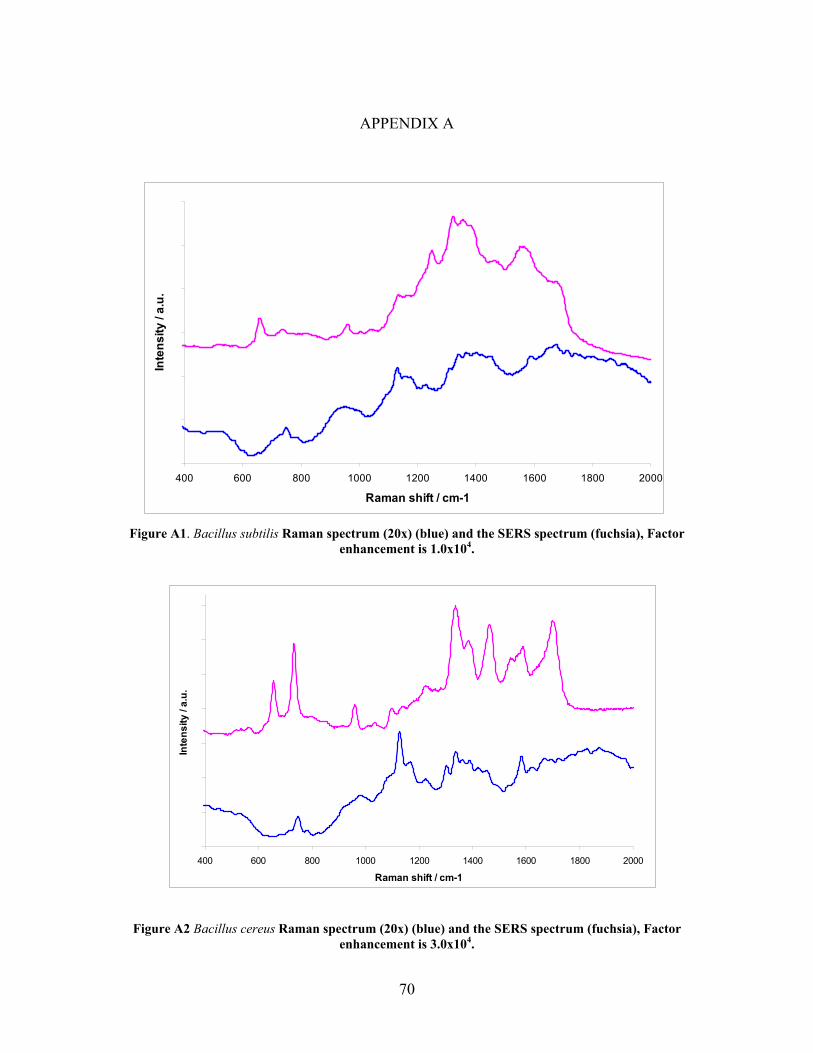
70
APPENDIX A
Figure A1. Bacillus subtilis Raman spectrum (20x) (blue) and the SERS spectrum (fuchsia), Factor enhancement is 1.0x10⁴.
Figure A2 Bacillus cereus Raman spectrum (20x) (blue) and the SERS spectrum (fuchsia), Factor enhancement is 3.0x10⁴.
400 600 800 1000 1200 1400 1600 1800 2000
Raman shift / cm-1
Inte
nsity
/ a.
u.
400 600 800 1000 1200 1400 1600 1800 2000
Raman shift / cm-1
Inte
nsity
/ a.
u.
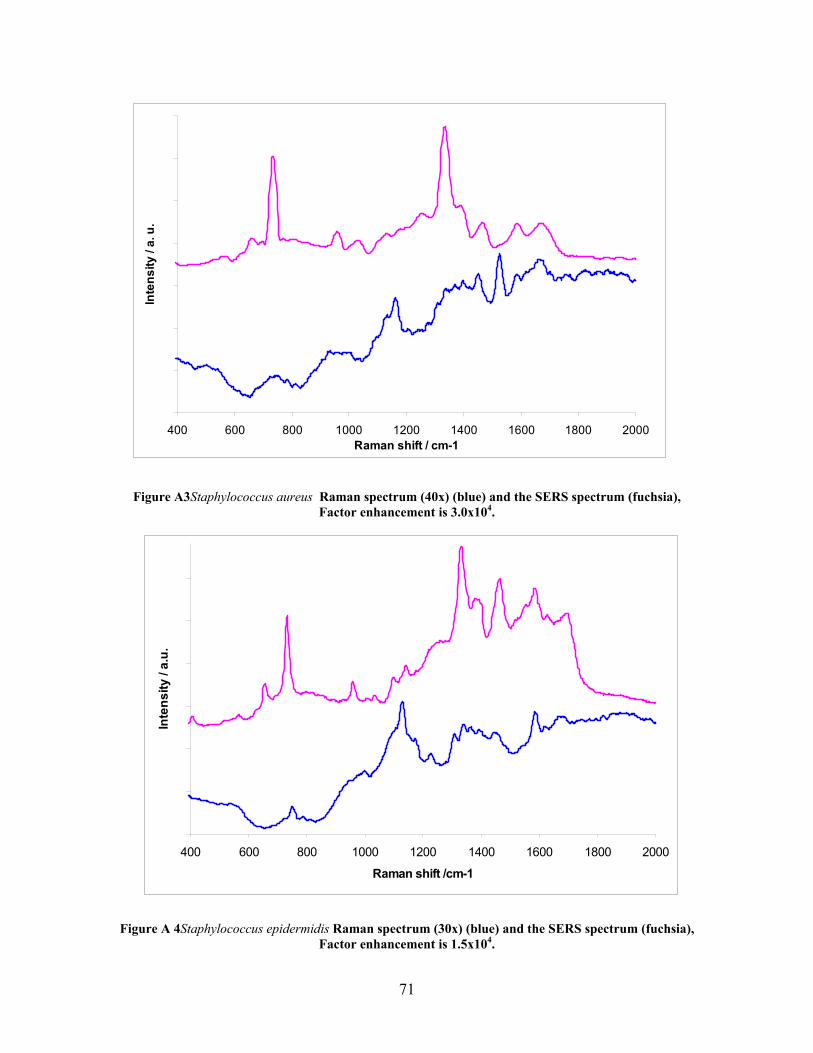
71
Figure A3Staphylococcus aureus Raman spectrum (40x) (blue) and the SERS spectrum (fuchsia), Factor enhancement is 3.0x10⁴.
Figure A 4Staphylococcus epidermidis Raman spectrum (30x) (blue) and the SERS spectrum (fuchsia), Factor enhancement is 1.5x10⁴.
400 600 800 1000 1200 1400 1600 1800 2000Raman shift / cm-1
Inte
nsity
/ a.
u.
400 600 800 1000 1200 1400 1600 1800 2000
Raman shift /cm-1
Inte
nsity
/ a.
u.
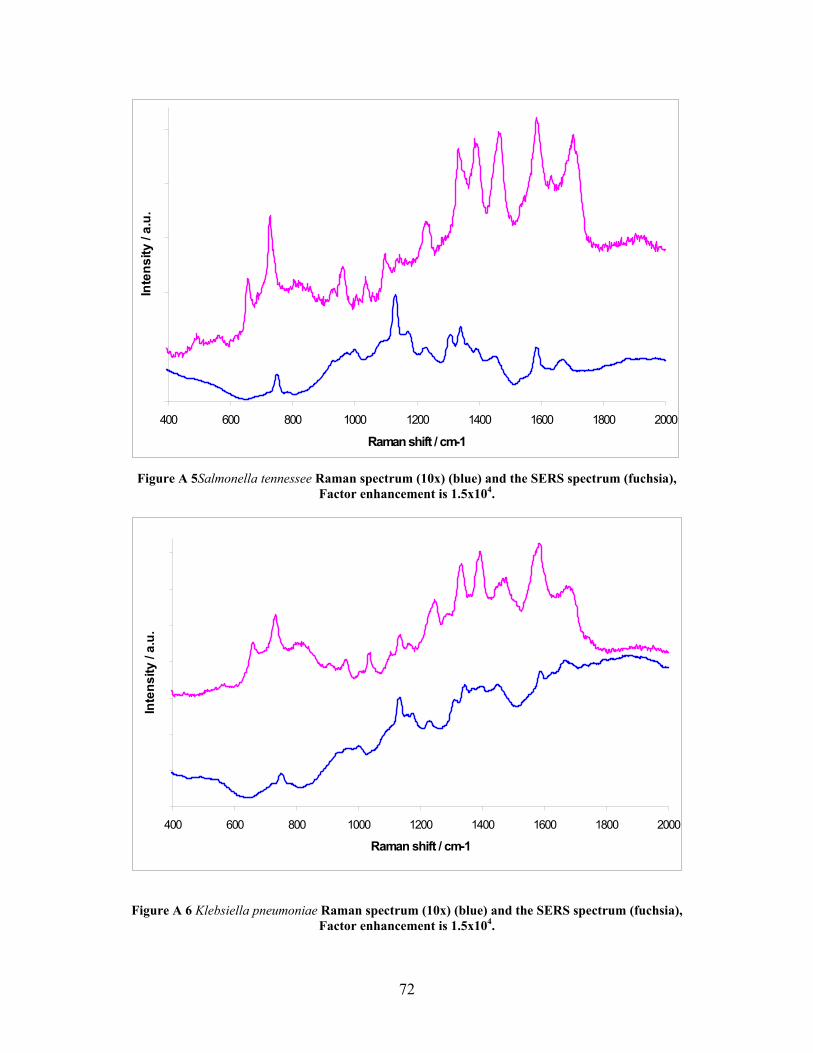
72
Figure A 5Salmonella tennessee Raman spectrum (10x) (blue) and the SERS spectrum (fuchsia), Factor enhancement is 1.5x10⁴.
Figure A 6 Klebsiella pneumoniae Raman spectrum (10x) (blue) and the SERS spectrum (fuchsia), Factor enhancement is 1.5x10⁴.
400 600 800 1000 1200 1400 1600 1800 2000
Raman shift / cm-1
Inte
nsity
/ a.
u.
400 600 800 1000 1200 1400 1600 1800 2000
Raman shift / cm-1
Inte
nsity
/ a.
u.
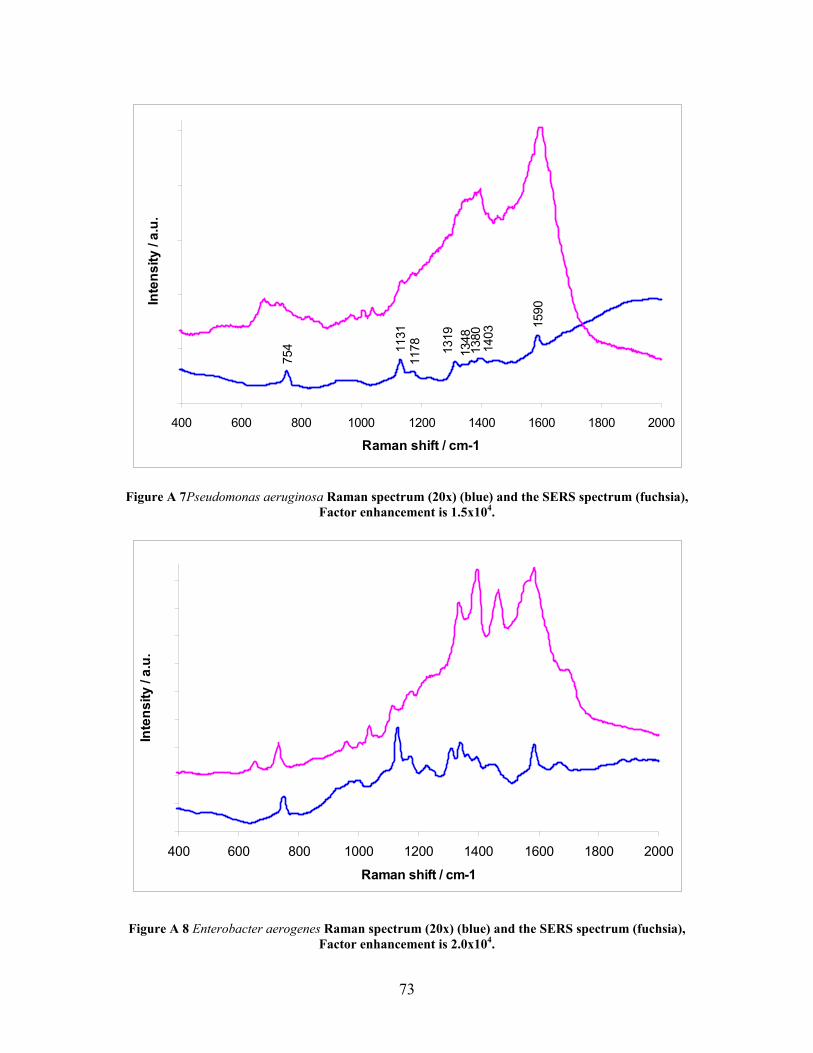
73
Figure A 7Pseudomonas aeruginosa Raman spectrum (20x) (blue) and the SERS spectrum (fuchsia), Factor enhancement is 1.5x10⁴.
Figure A 8 Enterobacter aerogenes Raman spectrum (20x) (blue) and the SERS spectrum (fuchsia), Factor enhancement is 2.0x10⁴.
754 11
3111
78 1319
1348
1380
1403
1590
400 600 800 1000 1200 1400 1600 1800 2000
Raman shift / cm-1
Inte
nsity
/ a.
u.
400 600 800 1000 1200 1400 1600 1800 2000
Raman shift / cm-1
Inte
nsity
/ a.
u.
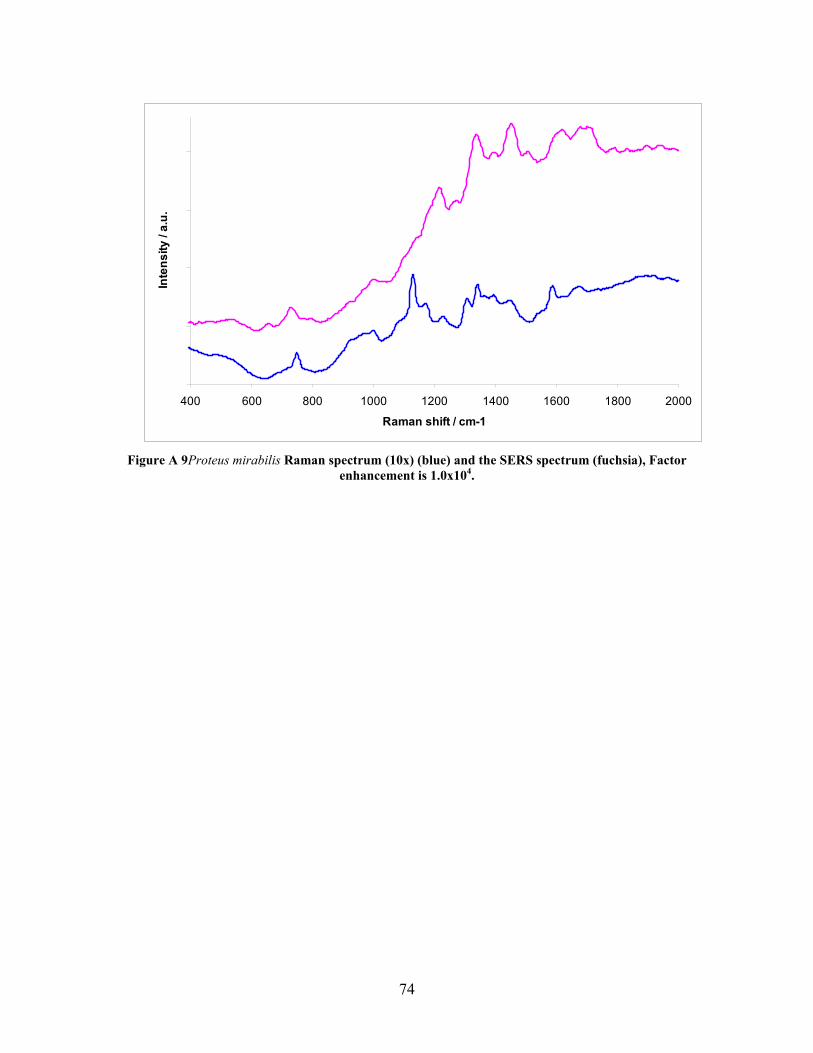
74
Figure A 9Proteus mirabilis Raman spectrum (10x) (blue) and the SERS spectrum (fuchsia), Factor enhancement is 1.0x10⁴.
400 600 800 1000 1200 1400 1600 1800 2000
Raman shift / cm-1
Inte
nsity
/ a.
u.


![Flow-Induced Symmetry Breaking in Growing Bacterial Biofilmsdunkel/Papers/2019PeEtAl_PRL.pdf · bacterial biofilm growth across model systems and species [14,15]. Imposed fluid shear](https://img.pdfslide.us/doc/110x75/5f739aa2d76bfc24e33fd243/flow-induced-symmetry-breaking-in-growing-bacterial-biofilms-dunkelpapers2019peetalprlpdf.jpg)