Embed Size (px)
Citation preview

Page 1 of 81
FINAL REPORT
Study Title
Bacterial Reverse Mutation Assay
Test Article
1-bromopropane
Author
Valentine O. Wagner, III, M.S.
Study Completion Date
27 October 2015
Testing Facility
BioReliance 9630 Medical Center Drive
Rockville, MD 20850
BioReliance Study Number
AD58PU.503001.BTL
Sponsor
Albemarle Corporation 451 Florida Street
Baton Rouge, LA 70801

BioReliance Study No. AD58PU.503001.BTL 3
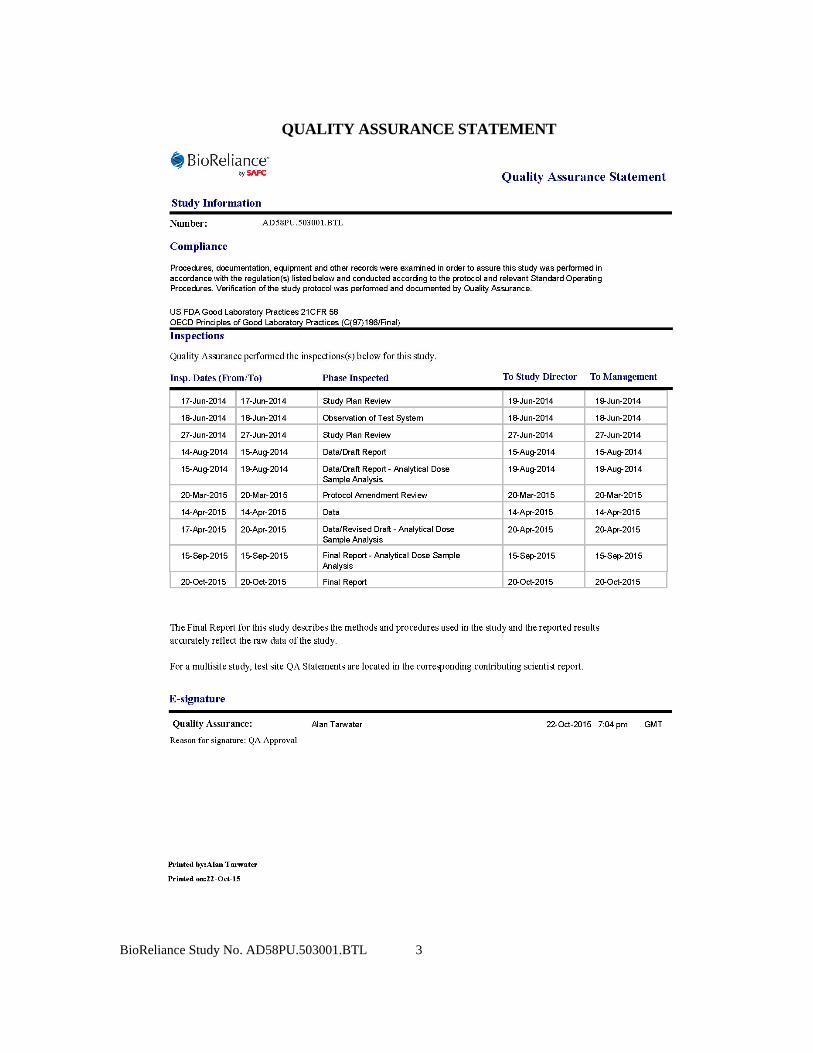
QUALITY ASSURANCE STATEMENT

BioReliance Study No. AD58PU.503001.BTL 4
STUDY INFORMATION
Sponsor: Albemarle Corporation 451 Florida Street Baton Rouge, LA 70801-1765
Sponsor’s Authorized Representative: Carr J. Smith, Ph.D., DABT
Testing Facility: BioReliance 9630 Medical Center Drive Rockville, MD 20850
Test Article I.D.: 1-bromopropane
Synonym: N-Propyl Bromide
Test Article Lot No.: 100000139331
Test Article CAS No.: 106-94-5
Test Article Molecular Weight: 123 g/mol
BioReliance Study No.: AD58PU.503001.BTL
Test Article Description: Clear colorless liquid
Storage Conditions: Room temperature, protected from light
Test Article Receipt Date: 20 August 2013
Study Initiation Date: 11 June 2014
Experimental Starting Date (first day of data collection): 18 June 2014
Experimental Start Date (first day test article administered to test system): 18 June 2014
Experimental Completion Date: 19 February 2015
Laboratory Supervisor: Jan Sahm, B.S.
Report Writer: Melissa R. VanDyke, B.S.
Study Director: Valentine O. Wagner, III, M.S.
Testing Facility Management: Timothy E. Lawlor, M.A. Director, Study Management Genetic Toxicology

BioReliance Study No. AD58PU.503001.BTL 5
Contributing Scientist (Dose Formulation Analysis): Philip Atkins, MChem
Analytical Laboratory (Dose Formulation Analysis):
BioReliance 9610 Medical Center Drive Rockville, MD 20850
BioReliance Study No. AD58PU.503001.BTL 6
TABLE OF CONTENTS Page
STATEMENT OF COMPLIANCE ...........................................................................................2
QUALITY ASSURANCE STATEMENT ................................................................................3
STUDY INFORMATION .........................................................................................................4
TABLE OF CONTENTS ...........................................................................................................6
SUMMARY ...............................................................................................................................7
PURPOSE ..................................................................................................................................8
CHARACTERIZATION OF TEST AND CONTROL ARTICLES .........................................8
MATERIALS AND METHODS .............................................................................................11
RESULTS AND DISCUSSION ..............................................................................................17
CONCLUSION ........................................................................................................................19
REFERENCES ........................................................................................................................19
DATA TABLES ......................................................................................................................21
APPENDIX I: Historical Control Data ..................................................................................34
APPENDIX II: Study Protocol and Amendments .................................................................36
APPENDIX III: Certificate of Analysis .................................................................................54
APPENDIX IV: Dosing Formulation Analysis and Stability ................................................56
APPENDIX V: Common Technical Document Tables ..........................................................77
BioReliance Study No. AD58PU.503001.BTL 7
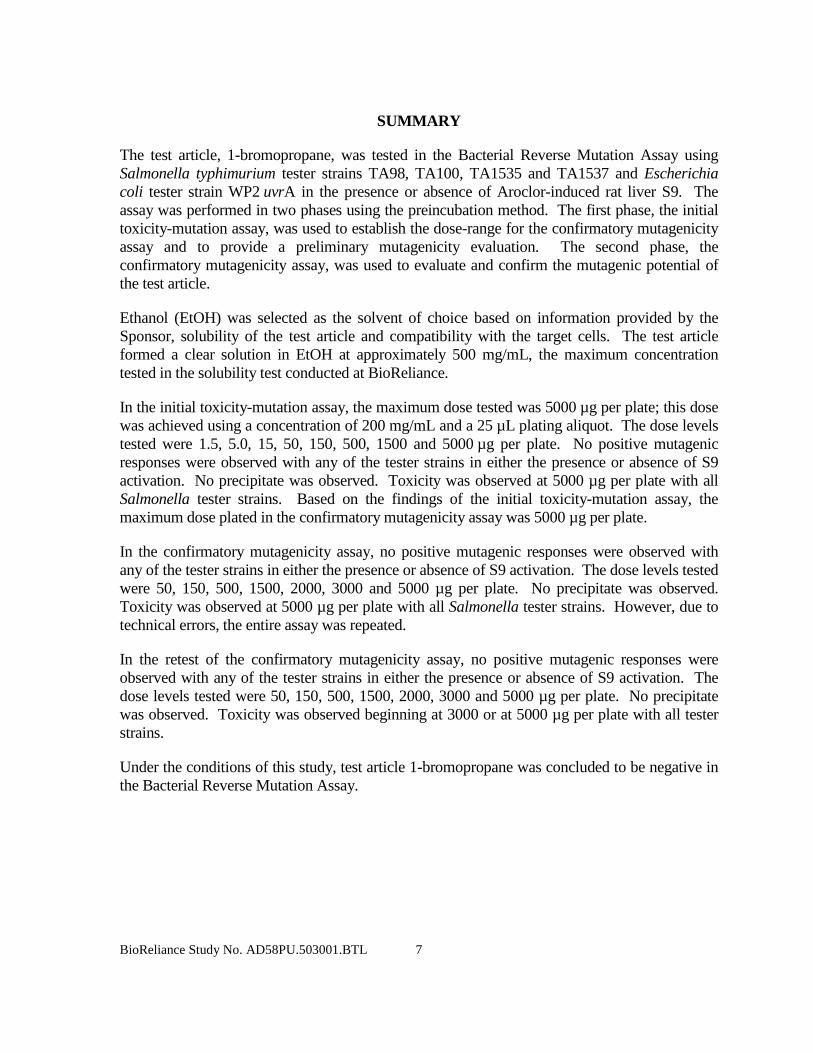
SUMMARY
The test article, 1-bromopropane, was tested in the Bacterial Reverse Mutation Assay using Salmonella typhimurium tester strains TA98, TA100, TA1535 and TA1537 and Escherichia coli tester strain WP2 uvrA in the presence or absence of Aroclor-induced rat liver S9. The assay was performed in two phases using the preincubation method. The first phase, the initial toxicity-mutation assay, was used to establish the dose-range for the confirmatory mutagenicity assay and to provide a preliminary mutagenicity evaluation. The second phase, the confirmatory mutagenicity assay, was used to evaluate and confirm the mutagenic potential of the test article.
Ethanol (EtOH) was selected as the solvent of choice based on information provided by the Sponsor, solubility of the test article and compatibility with the target cells. The test article formed a clear solution in EtOH at approximately 500 mg/mL, the maximum concentration tested in the solubility test conducted at BioReliance.
In the initial toxicity-mutation assay, the maximum dose tested was 5000 µg per plate; this dose was achieved using a concentration of 200 mg/mL and a 25 µL plating aliquot. The dose levels tested were 1.5, 5.0, 15, 50, 150, 500, 1500 and 5000 µg per plate. No positive mutagenic responses were observed with any of the tester strains in either the presence or absence of S9 activation. No precipitate was observed. Toxicity was observed at 5000 µg per plate with all Salmonella tester strains. Based on the findings of the initial toxicity-mutation assay, the maximum dose plated in the confirmatory mutagenicity assay was 5000 µg per plate.
In the confirmatory mutagenicity assay, no positive mutagenic responses were observed with any of the tester strains in either the presence or absence of S9 activation. The dose levels tested were 50, 150, 500, 1500, 2000, 3000 and 5000 µg per plate. No precipitate was observed. Toxicity was observed at 5000 µg per plate with all Salmonella tester strains. However, due to technical errors, the entire assay was repeated.
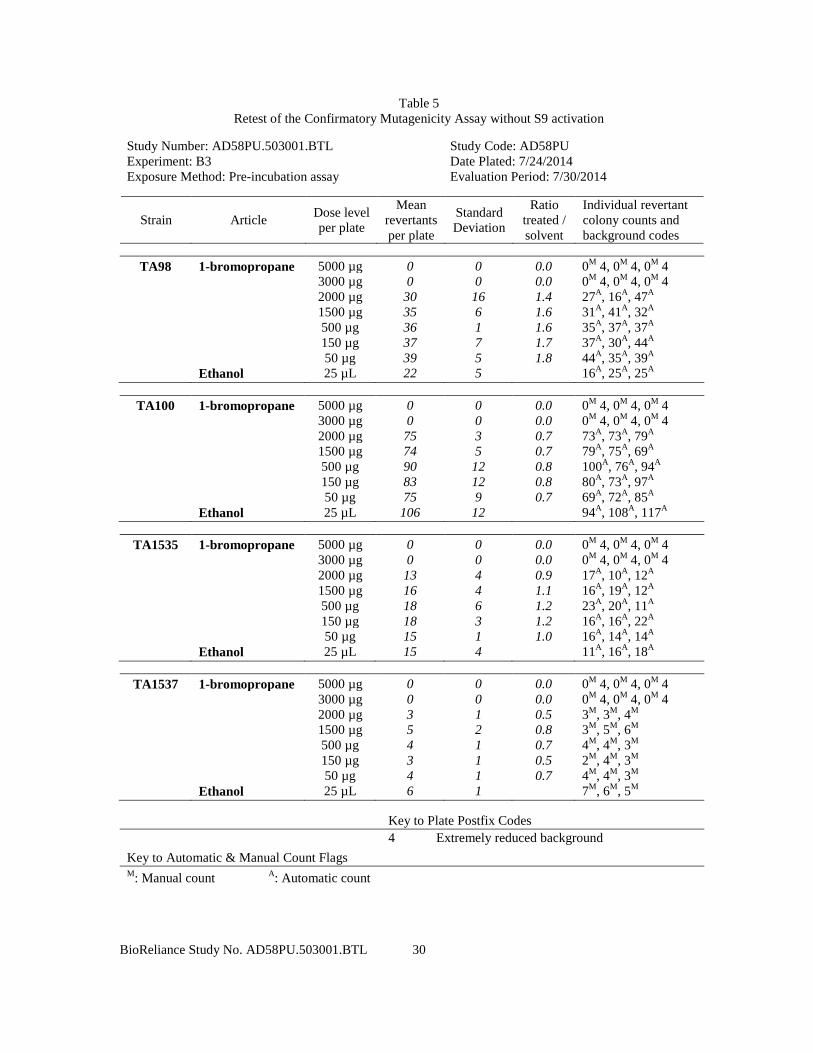
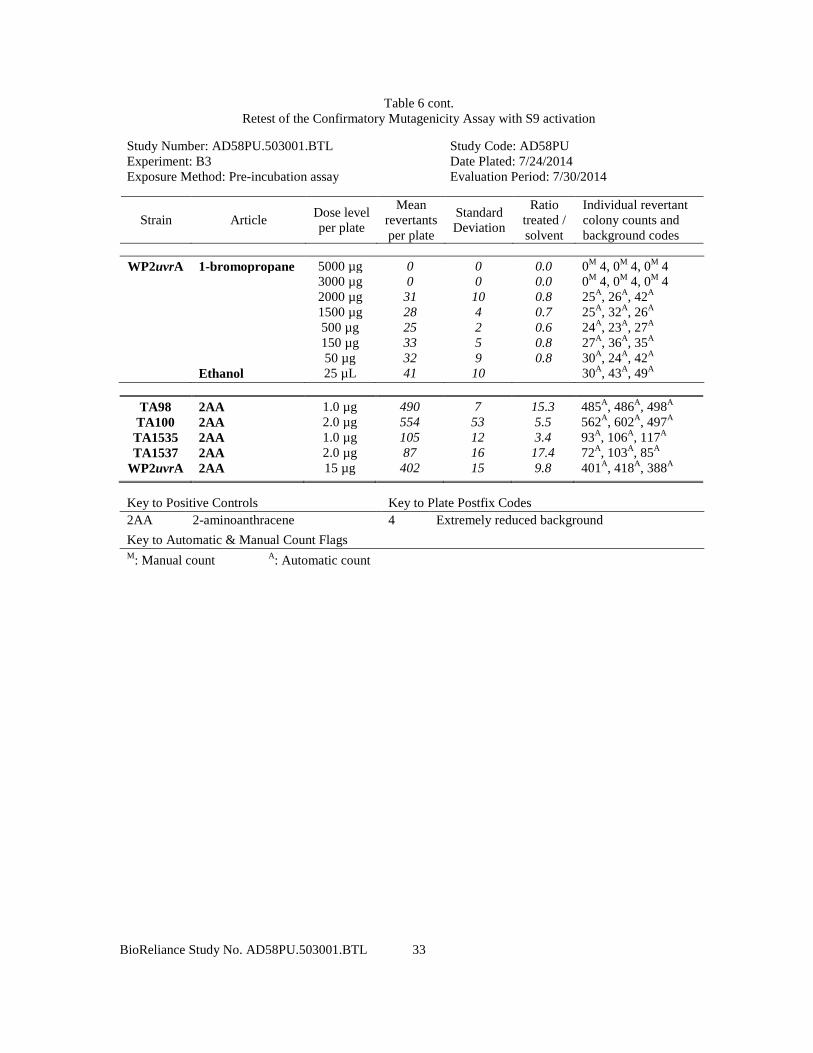
In the retest of the confirmatory mutagenicity assay, no positive mutagenic responses were observed with any of the tester strains in either the presence or absence of S9 activation. The dose levels tested were 50, 150, 500, 1500, 2000, 3000 and 5000 µg per plate. No precipitate was observed. Toxicity was observed beginning at 3000 or at 5000 µg per plate with all tester strains.
Under the conditions of this study, test article 1-bromopropane was concluded to be negative in the Bacterial Reverse Mutation Assay.

BioReliance Study No. AD58PU.503001.BTL 8
PURPOSE
The purpose of this study was to evaluate the mutagenic potential of the test article by measuring its ability to induce reverse mutations at selected loci of several strains of Salmonella typhimurium and at the tryptophan locus of Escherichia coli strain WP2 uvrA in the presence and absence of Aroclor-induced rat liver S9. A copy of the Historical Negative and Positive Control Values is included in Appendix I. Copies of the study protocol and amendment are included in Appendix II.
This study was conducted in compliance with the testing guidelines of the OECD (1997)
CHARACTERIZATION OF TEST AND CONTROL ARTICLES
The test article, 1-bromopropane, was received by BioReliance on 20 August 2013 and was assigned the code number AD58PU. Upon receipt, the test article was stored at room temperature, protected from light.
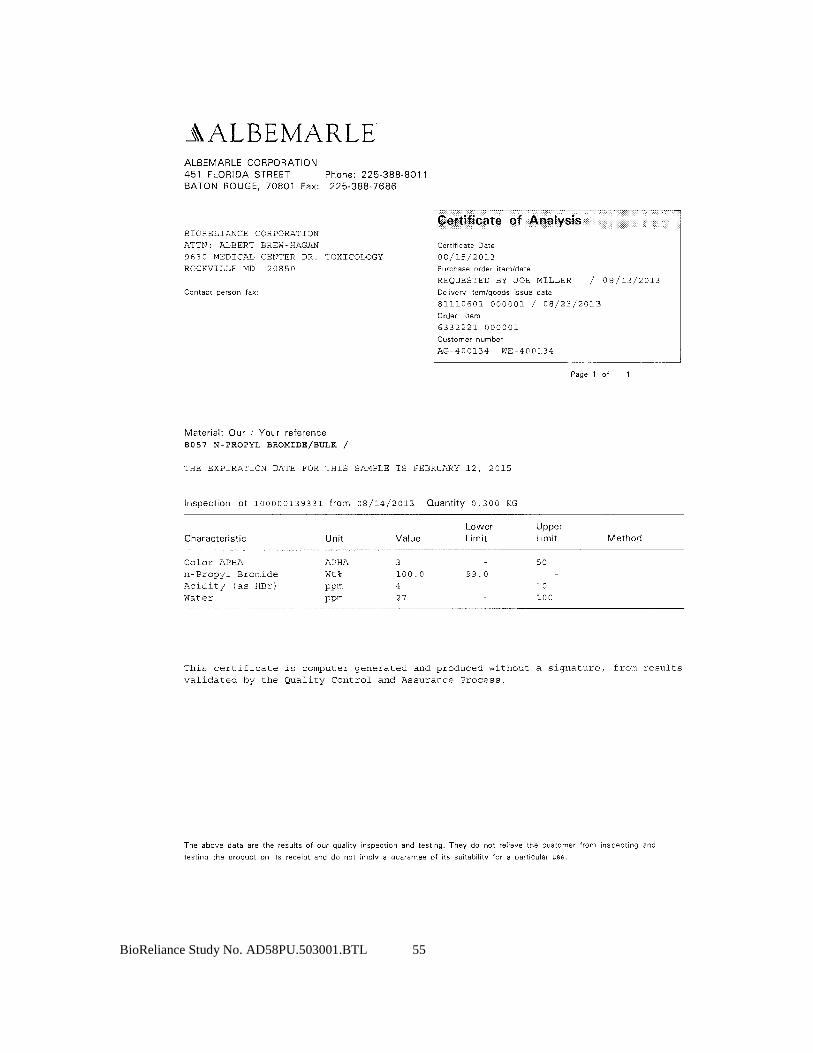
The Sponsor has determined the identity, strength, purity and composition or other characteristics to define the test article and the stability of the test article. A copy of the Certificate of Analysis is included in Appendix III. Based on the expiration date provided in the Certificate of Analysis, the test article was considered stable through 12 February 2015.
The vehicle used to deliver 1-bromopropane to the test system was EtOH (CAS No. 64-17-5, Lot Nos. SHBD7521V and SHBF2299V, Purity: 99.98%, Exp. Dates: October 2016 and April 2017, respectively), obtained from Sigma-Aldrich. Test article dilutions were prepared immediately before use and delivered to the test system at room temperature under yellow light. Test article dilutions were prepared in screw-capped tubes with minimal headspace in the retest of the confirmatory mutagenicity assay (see Deviations).
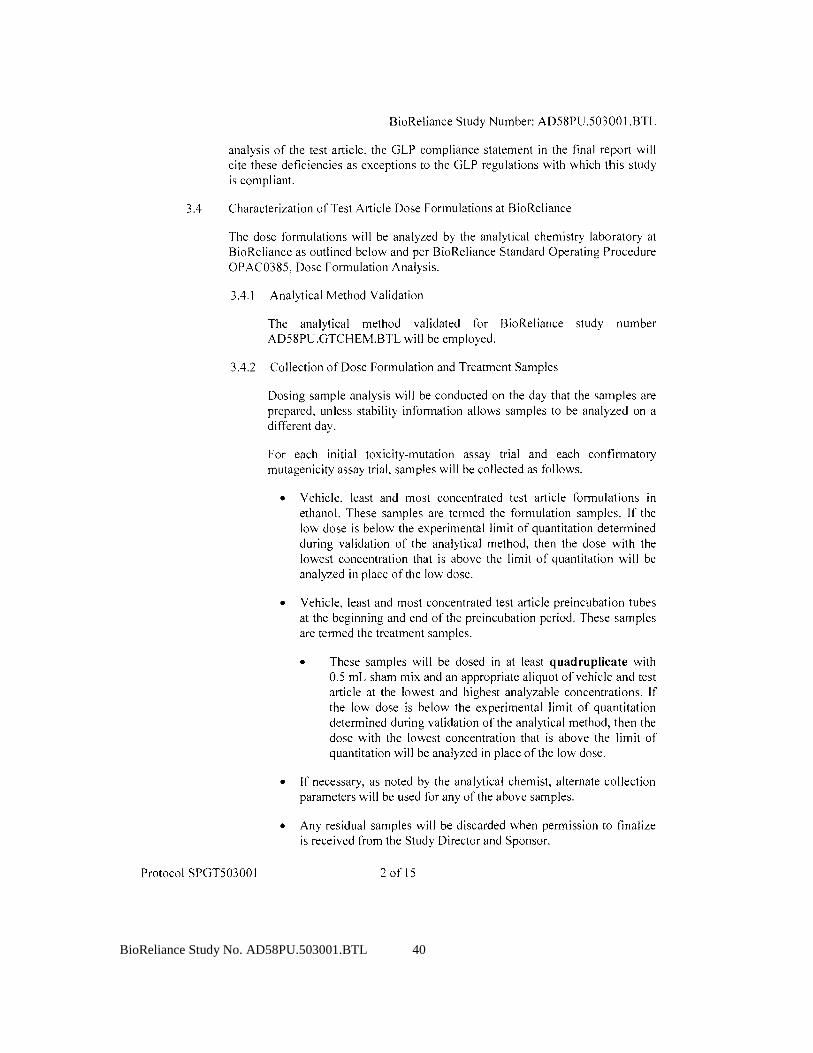
Dosing formulation samples were collected from each assay as follows:
• 2 x 3.5 mL from the high dose level and the vehicle and 2 x 17.0 mL from the low dose level in the initial toxicity-mutation assay
• 2 x 3.0 mL from the high dose level and the vehicle and 2 x 6.0 mL from the low dose level in the confirmatory mutagenicity assays
Additionally, treatment samples were collected from the vehicle, least and most concentrated test article preincubation tubes at the beginning and end of the preincubation period in each assay as follows:
• 4 x 0.525 mL from the high dose, low dose and vehicle preincubation tubes
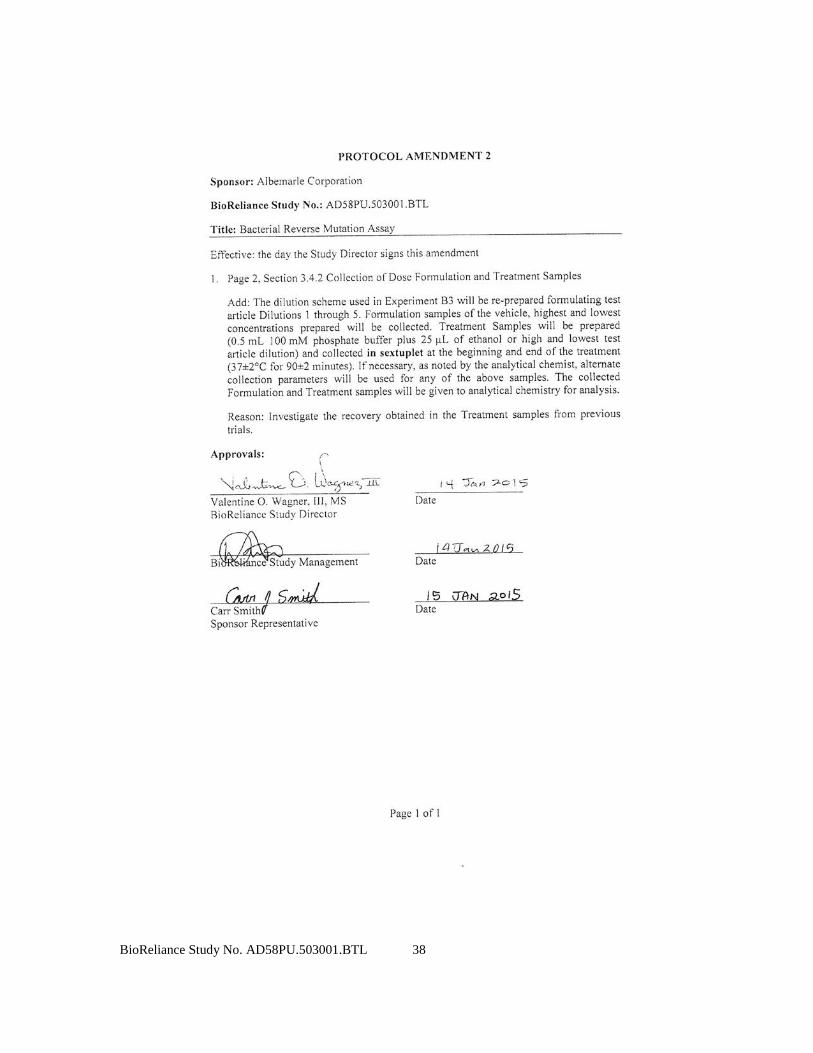
The dilution scheme used in Experiment B3 was re-prepared formulating test article Dilutions 1 through 5. Formulation samples of the vehicle, highest and lowest concentrations prepared were

BioReliance Study No. AD58PU.503001.BTL 9
collected. Treatment Samples were prepared (0.5 mL 100 mM phosphate buffer plus 25 µL of ethanol or high and lowest test article dilution) and collected in sextuplet at the beginning and end of the treatment (37±2°C for 90±2 minutes).
Dosing formulation samples were collected from B4 and B5 assays as follows:
• 2 x 3.0 mL from the high dose level, low dose and the vehicle
Additionally, treatment samples were collected from the vehicle, least and most concentrated test article preincubation tubes at the beginning and end of the preincubation period in B4 and B5 assays as follows:
• 6 x 0.525 mL from the high dose, low dose and vehicle preincubation tubes
All samples were submitted to the analytical chemistry laboratory at BioReliance for analysis. Unused samples were discarded upon acceptance of the analytical results by the Study Director. A copy of the final analytical report is included in Appendix IV.
The negative and positive control articles have been characterized as per the Certificates of Analysis on file with the testing facility. The stability of the negative and positive control articles and their mixtures was demonstrated by acceptable results that met the criteria for a valid test.
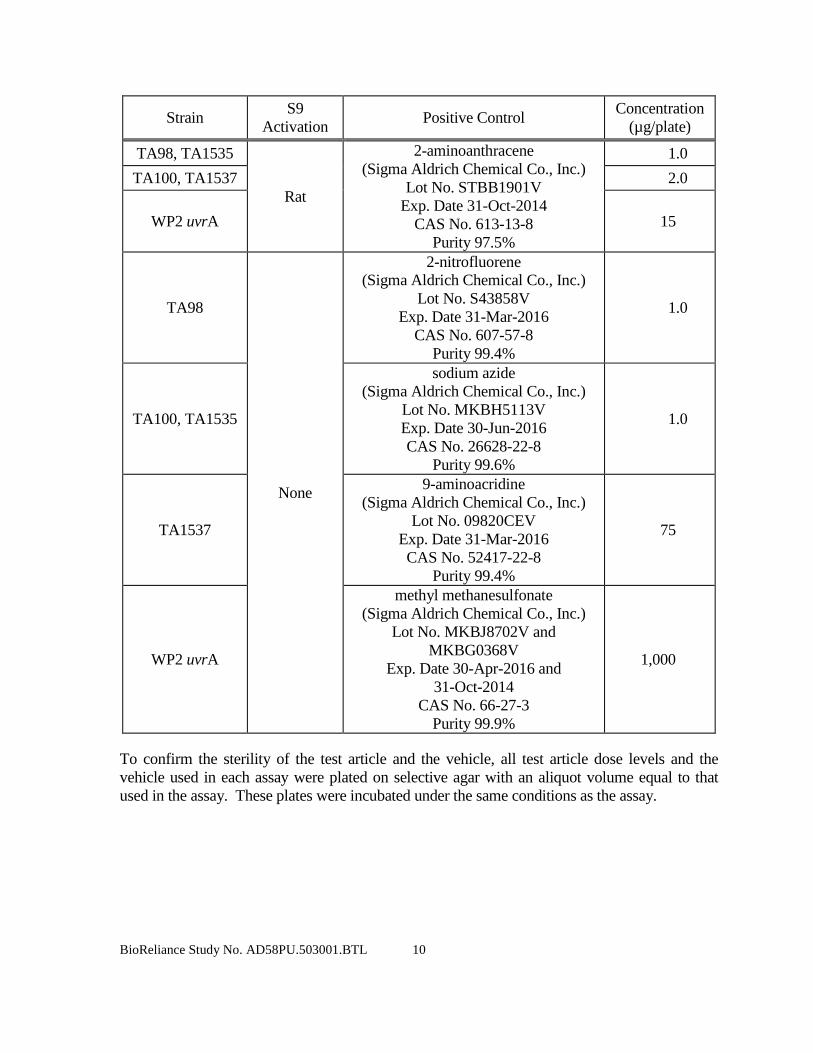
Positive controls plated concurrently with each assay are listed in the following table. All positive controls were diluted in dimethyl sulfoxide (DMSO) except for sodium azide, which was diluted in sterile water for injection-quality, cell culture grade water (hereafter referred to as sterile water). All subdivided solutions of positive control were stored at -10 to -30°C.
BioReliance Study No. AD58PU.503001.BTL 10
Strain S9 Activation Positive Control Concentration
(µg/plate)
TA98, TA1535
Rat
2-aminoanthracene (Sigma Aldrich Chemical Co., Inc.)
Lot No. STBB1901V Exp. Date 31-Oct-2014
CAS No. 613-13-8 Purity 97.5%
1.0 TA100, TA1537 2.0
WP2 uvrA 15
TA98
None
2-nitrofluorene (Sigma Aldrich Chemical Co., Inc.)
Lot No. S43858V Exp. Date 31-Mar-2016
CAS No. 607-57-8 Purity 99.4%
1.0
TA100, TA1535
sodium azide (Sigma Aldrich Chemical Co., Inc.)
Lot No. MKBH5113V Exp. Date 30-Jun-2016 CAS No. 26628-22-8
Purity 99.6%
1.0
TA1537
9-aminoacridine (Sigma Aldrich Chemical Co., Inc.)
Lot No. 09820CEV Exp. Date 31-Mar-2016 CAS No. 52417-22-8
Purity 99.4%
75
WP2 uvrA
methyl methanesulfonate (Sigma Aldrich Chemical Co., Inc.)
Lot No. MKBJ8702V and MKBG0368V
Exp. Date 30-Apr-2016 and 31-Oct-2014
CAS No. 66-27-3 Purity 99.9%
1,000
To confirm the sterility of the test article and the vehicle, all test article dose levels and the vehicle used in each assay were plated on selective agar with an aliquot volume equal to that used in the assay. These plates were incubated under the same conditions as the assay.

BioReliance Study No. AD58PU.503001.BTL 11
MATERIALS AND METHODS
Test System
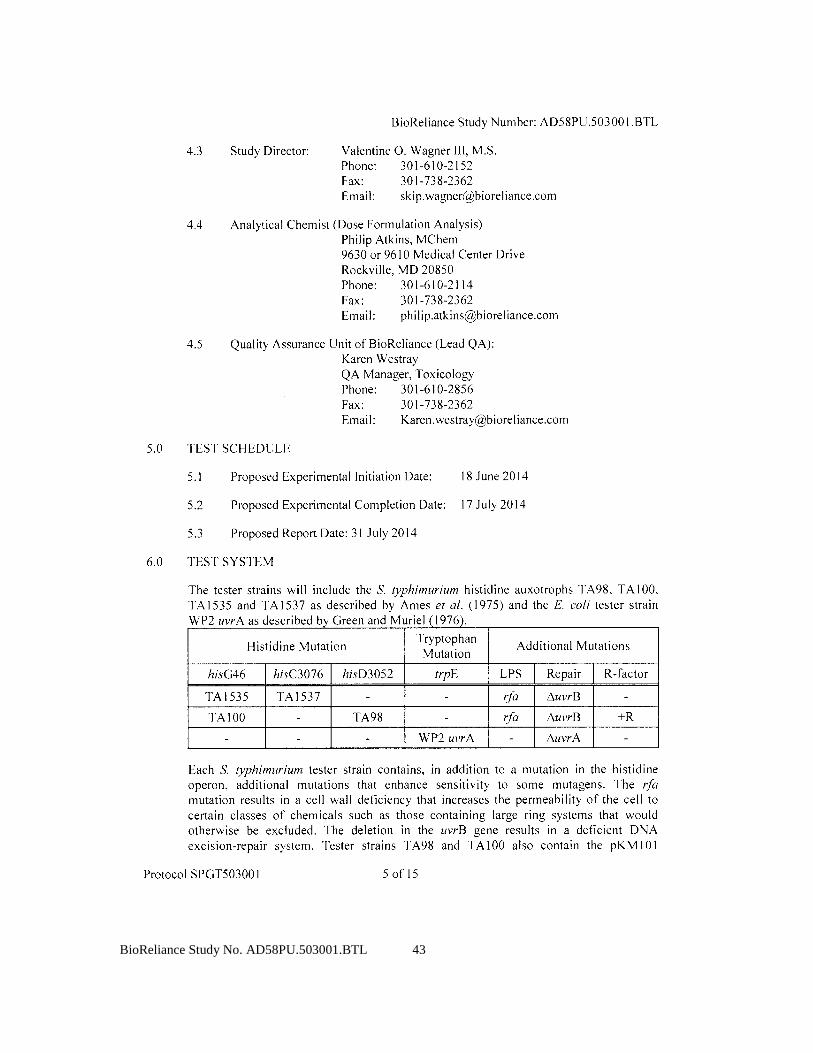
The tester strains used were the Salmonella typhimurium histidine auxotrophs TA98, TA100, TA1535 and TA1537 as described by Ames et al. (1975) and Escherichia coli WP2 uvrA as described by Green and Muriel (1976). Salmonella tester strains were from Dr. Bruce Ames’ Master cultures, E. coli tester strains were from the National Collection of Industrial and Marine Bacteria, Aberdeen, Scotland.
Tester strains TA98 and TA1537 are reverted from histidine dependence (auxotrophy) to histidine independence (prototrophy) by frameshift mutagens. Tester strain TA1535 is reverted by mutagens that cause basepair substitutions. Tester strain TA100 is reverted by mutagens that cause both frameshift and basepair substitution mutations. Specificity of the reversion mechanism in E. coli is sensitive to base-pair substitution mutations, rather than frameshift mutations (Green and Muriel, 1976).
Overnight cultures were prepared by inoculating from the appropriate frozen permanent stock into a vessel, containing 30 to 50 mL of culture medium. To assure that cultures were harvested in late log phase, the length of incubation was controlled and monitored. Following inoculation, each flask was placed in a shaker/incubator programmed to begin shaking at 125 to 175 rpm and incubating at 37±2°C for approximately 12 hours before the anticipated time of harvest. Each culture was monitored spectrophotometrically for turbidity and was harvested at a percent transmittance yielding a titer of greater than or equal to 0.3x10⁹ cells per milliliter. The actual titers were determined by viable count assays on nutrient agar plates.
Metabolic Activation System
Aroclor 1254-induced rat liver S9 was used as the metabolic activation system. The S9 was prepared from male Sprague-Dawley rats that were injected intraperitoneally with Aroclor™ 1254 (200 mg/mL in corn oil) at a dose of 500 mg/kg, five days before sacrifice. The S9 (Lot Nos. 3267 and 3283, Exp. Dates: 29 April 2016 and 28 May 2016, respectively) was purchased commercially from Moltox (Boone, NC). Upon arrival at BioReliance, the S9 was stored at -60°C or colder until used. Each bulk preparation of S9 was assayed for its ability to metabolize benzo(a)pyrene and 2-aminoanthracene to forms mutagenic to Salmonella typhimurium TA100.
The S9 mix was prepared on the day of use as indicated below:
Component Final Concentration β-nicotinamide-adenine dinucleotide phosphate 4 mM Glucose-6-phosphate 5 mM Potassium chloride 33 mM Magnesium chloride 8 mM Phosphate Buffer (pH 7.4) 100 mM S9 homogenate 10% (v/v)
BioReliance Study No. AD58PU.503001.BTL 12
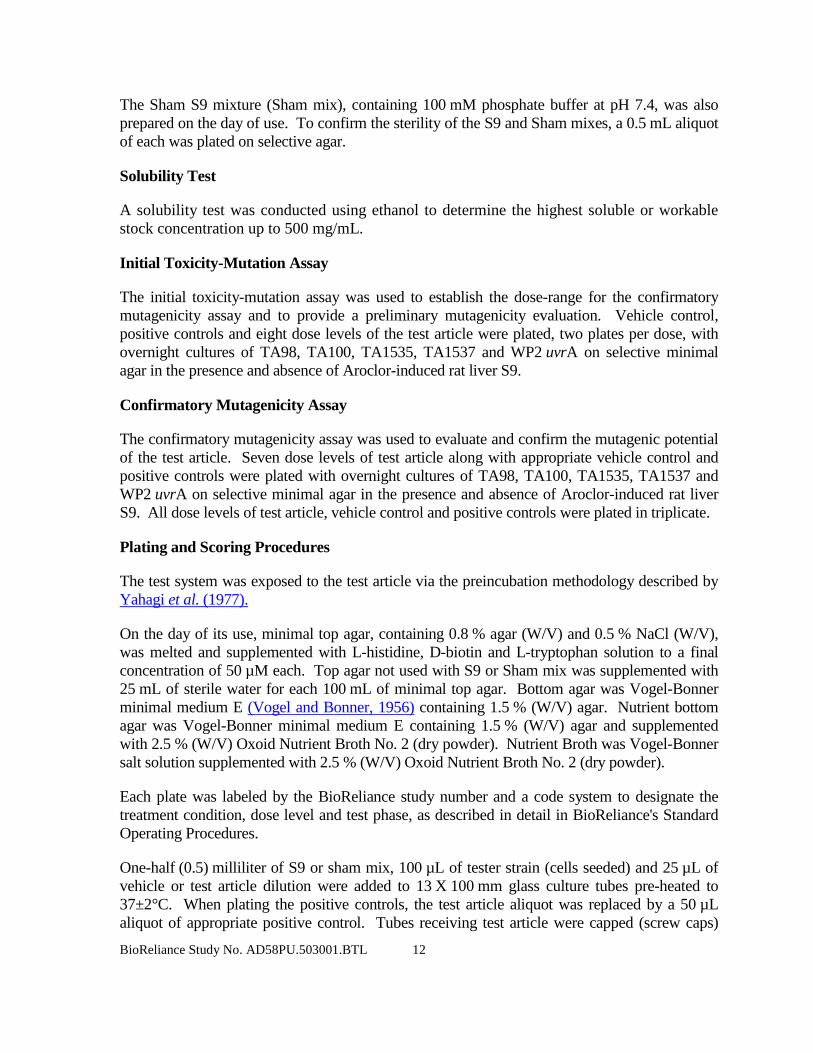
The Sham S9 mixture (Sham mix), containing 100 mM phosphate buffer at pH 7.4, was also prepared on the day of use. To confirm the sterility of the S9 and Sham mixes, a 0.5 mL aliquot of each was plated on selective agar.
Solubility Test
A solubility test was conducted using ethanol to determine the highest soluble or workable stock concentration up to 500 mg/mL.
Initial Toxicity-Mutation Assay
The initial toxicity-mutation assay was used to establish the dose-range for the confirmatory mutagenicity assay and to provide a preliminary mutagenicity evaluation. Vehicle control, positive controls and eight dose levels of the test article were plated, two plates per dose, with overnight cultures of TA98, TA100, TA1535, TA1537 and WP2 uvrA on selective minimal agar in the presence and absence of Aroclor-induced rat liver S9.
Confirmatory Mutagenicity Assay
The confirmatory mutagenicity assay was used to evaluate and confirm the mutagenic potential of the test article. Seven dose levels of test article along with appropriate vehicle control and positive controls were plated with overnight cultures of TA98, TA100, TA1535, TA1537 and WP2 uvrA on selective minimal agar in the presence and absence of Aroclor-induced rat liver S9. All dose levels of test article, vehicle control and positive controls were plated in triplicate.
Plating and Scoring Procedures
The test system was exposed to the test article via the preincubation methodology described by Yahagi et al. (1977).
On the day of its use, minimal top agar, containing 0.8 % agar (W/V) and 0.5 % NaCl (W/V), was melted and supplemented with L-histidine, D-biotin and L-tryptophan solution to a final concentration of 50 µM each. Top agar not used with S9 or Sham mix was supplemented with 25 mL of sterile water for each 100 mL of minimal top agar. Bottom agar was Vogel-Bonner minimal medium E (Vogel and Bonner, 1956) containing 1.5 % (W/V) agar. Nutrient bottom agar was Vogel-Bonner minimal medium E containing 1.5 % (W/V) agar and supplemented with 2.5 % (W/V) Oxoid Nutrient Broth No. 2 (dry powder). Nutrient Broth was Vogel-Bonner salt solution supplemented with 2.5 % (W/V) Oxoid Nutrient Broth No. 2 (dry powder).
Each plate was labeled by the BioReliance study number and a code system to designate the treatment condition, dose level and test phase, as described in detail in BioReliance's Standard Operating Procedures.
One-half (0.5) milliliter of S9 or sham mix, 100 µL of tester strain (cells seeded) and 25 µL of vehicle or test article dilution were added to 13 X 100 mm glass culture tubes pre-heated to 37±2°C. When plating the positive controls, the test article aliquot was replaced by a 50 µL aliquot of appropriate positive control. Tubes receiving test article were capped (screw caps)
BioReliance Study No. AD58PU.503001.BTL 13
during the preincubation period. After vortexing, these mixtures were incubated with shaking for 90±2 minutes at 37±2°C. Following the preincubation, 2.0 mL of selective top agar was added to each tube and the mixture was vortexed and overlaid onto the surface of 25 mL of minimal bottom agar. After the overlay had solidified, the plates receiving test article were inverted and placed in an appropriate number of 9- or 10-liter desiccators by dose level and incubated for 48 to 72 hours at 37±2°C. Plates receiving an aliquot of the vehicle or positive control articles were inverted after the overlay had solidified and also incubated for 48 to 72 hours at 37±2°C. Plates that were not counted immediately following the incubation period were stored at 2-8°C until colony counting could be conducted.
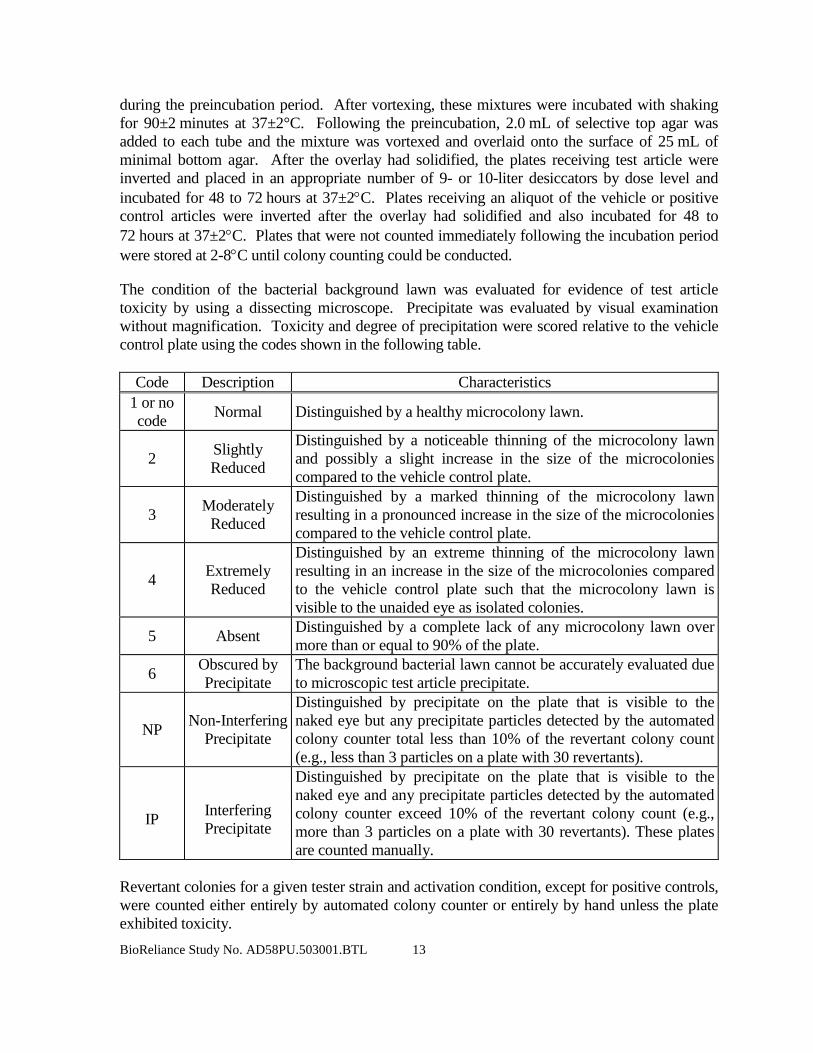
The condition of the bacterial background lawn was evaluated for evidence of test article toxicity by using a dissecting microscope. Precipitate was evaluated by visual examination without magnification. Toxicity and degree of precipitation were scored relative to the vehicle control plate using the codes shown in the following table.
Code Description Characteristics
1 or no code Normal Distinguished by a healthy microcolony lawn.
2 Slightly Reduced
Distinguished by a noticeable thinning of the microcolony lawn and possibly a slight increase in the size of the microcolonies compared to the vehicle control plate.
3 Moderately Reduced
Distinguished by a marked thinning of the microcolony lawn resulting in a pronounced increase in the size of the microcolonies compared to the vehicle control plate.
4 Extremely Reduced
Distinguished by an extreme thinning of the microcolony lawn resulting in an increase in the size of the microcolonies compared to the vehicle control plate such that the microcolony lawn is visible to the unaided eye as isolated colonies.
5 Absent Distinguished by a complete lack of any microcolony lawn over more than or equal to 90% of the plate.
6 Obscured by Precipitate
The background bacterial lawn cannot be accurately evaluated due to microscopic test article precipitate.
NP Non-Interfering Precipitate
Distinguished by precipitate on the plate that is visible to the naked eye but any precipitate particles detected by the automated colony counter total less than 10% of the revertant colony count (e.g., less than 3 particles on a plate with 30 revertants).
IP Interfering Precipitate
Distinguished by precipitate on the plate that is visible to the naked eye and any precipitate particles detected by the automated colony counter exceed 10% of the revertant colony count (e.g., more than 3 particles on a plate with 30 revertants). These plates are counted manually.
Revertant colonies for a given tester strain and activation condition, except for positive controls, were counted either entirely by automated colony counter or entirely by hand unless the plate exhibited toxicity.

BioReliance Study No. AD58PU.503001.BTL 14
Evaluation of Results
For each replicate plating, the mean and standard deviation of the number of revertants per plate were calculated and are reported.
For the test article to be evaluated positive, it must cause a dose-related increase in the mean revertants per plate of at least one tester strain over a minimum of two increasing concentrations of test article.
Data sets for tester strains TA1535 and TA1537 were judged positive if the increase in mean revertants at the peak of the dose response was greater than or equal to 3.0-times the mean vehicle control value. Data sets for tester strains TA98, TA100 and WP2 uvrA were judged positive if the increase in mean revertants at the peak of the dose response was greater than or equal to 2.0-times the mean vehicle control value.
An equivocal response is a biologically relevant increase in a revertant count that partially meets the criteria for evaluation as positive. This could be a dose-responsive increase that does not achieve the respective threshold cited above or a non-dose responsive increase that is equal to or greater than the respective threshold cited. A response was evaluated as negative, if it was neither positive nor equivocal.
Criteria for a Valid Test
The following criteria must be met for each assay to be considered valid. All Salmonella tester strain cultures must demonstrate the presence of the deep rough mutation (rfa) and the deletion in the uvrB gene. Cultures of tester strains TA98 and TA100 must demonstrate the presence of the pKM101 plasmid R-factor. All WP2 uvrA cultures must demonstrate the deletion in the uvrA gene. All cultures must demonstrate the characteristic mean number of spontaneous revertants in the vehicle controls as follows (inclusive): TA98, 10 - 50; TA100, 80 - 240; TA1535, 5 - 45; TA1537, 3 - 21; WP2 uvrA, 10 - 60. To ensure that appropriate numbers of bacteria are plated, tester strain culture titers must be greater than or equal to 0.3x10⁹ cells/mL. The mean of each positive control must exhibit at least a 3.0-fold increase in the number of revertants over the mean value of the respective vehicle control. A minimum of three non-toxic dose levels is required to evaluate assay data. A dose level is considered toxic if one or both of the following criteria are met: (1) A >50 % reduction in the mean number of revertants per plate as compared to the mean vehicle control value. This reduction must be accompanied by an abrupt dose-dependent drop in the revertant count. (2) At least a moderate reduction in the background lawn (background code 3, 4 or 5).
Automated Data Collection Systems
The primary computer or electronic systems used for the collection of data or analysis included but were not limited to the following:
BioReliance Study No. AD58PU.503001.BTL 15
Sorcerer Colony Counter and Ames Study Manager (Perceptive Instruments), LIMS System (BioReliance), Excel 2007 (Microsoft Corporation), BRIQS (BioReliance) and Kaye Lab Watch Monitoring System (Kaye GE).
Archives
All raw data, the protocol, pertinent study email correspondence and all reports for procedures performed at BioReliance will be maintained in the archives at BioReliance, Rockville, MD for at least five years. At that time, the Sponsor will be contacted for a decision as to the final disposition of the materials. All study materials will first be copied and the copy will be retained by the BioReliance archives in accordance with the applicable SOPs. The raw data, reports and other documents generated at locations other than BioReliance will be archived by the test site.
Deviations
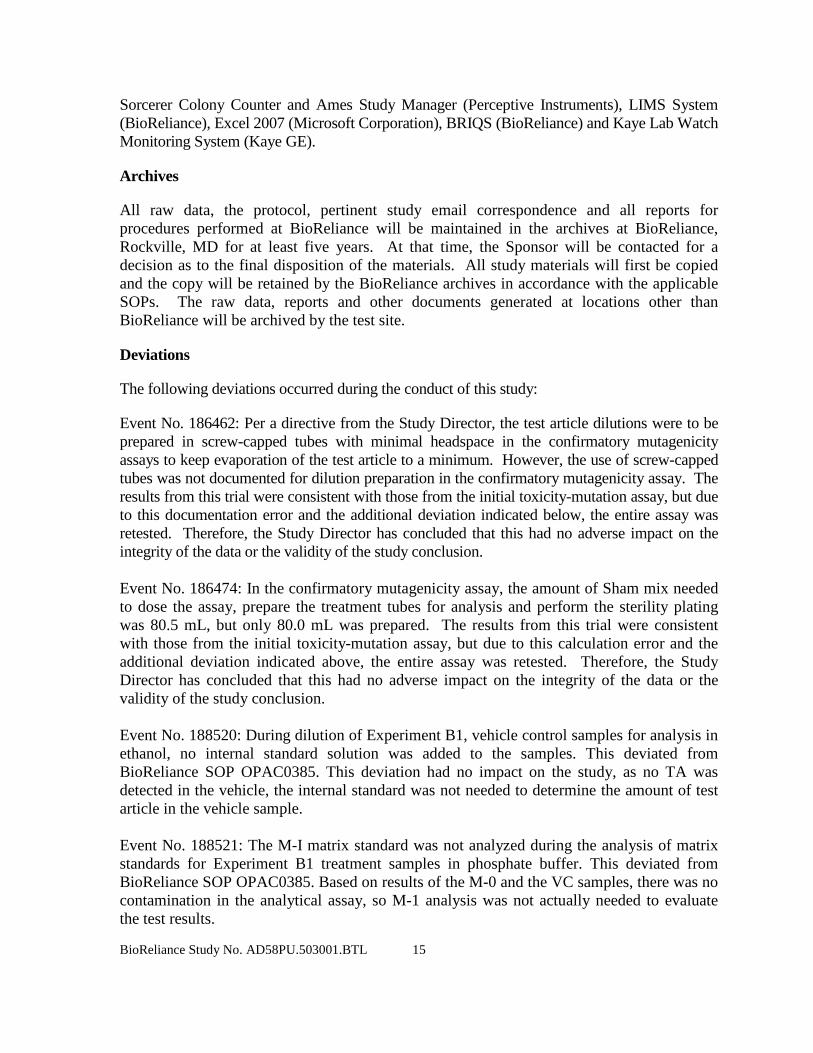
The following deviations occurred during the conduct of this study:
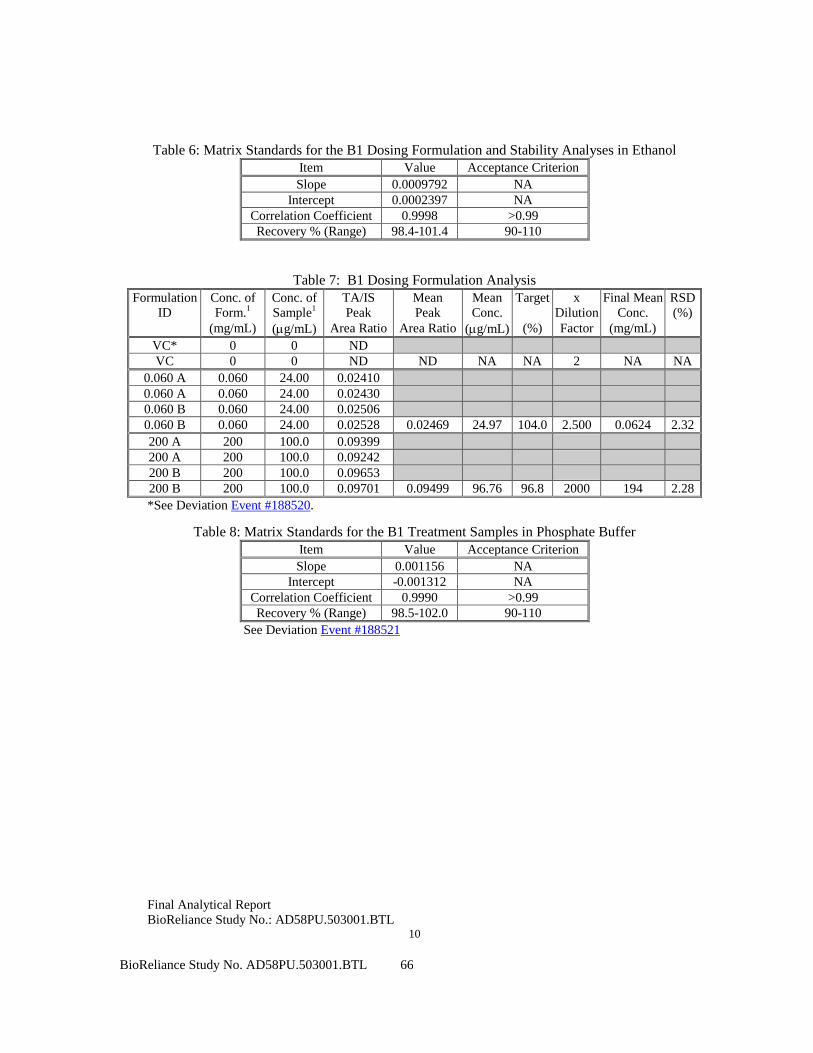
Event No. 186462: Per a directive from the Study Director, the test article dilutions were to be prepared in screw-capped tubes with minimal headspace in the confirmatory mutagenicity assays to keep evaporation of the test article to a minimum. However, the use of screw-capped tubes was not documented for dilution preparation in the confirmatory mutagenicity assay. The results from this trial were consistent with those from the initial toxicity-mutation assay, but due to this documentation error and the additional deviation indicated below, the entire assay was retested. Therefore, the Study Director has concluded that this had no adverse impact on the integrity of the data or the validity of the study conclusion. Event No. 186474: In the confirmatory mutagenicity assay, the amount of Sham mix needed to dose the assay, prepare the treatment tubes for analysis and perform the sterility plating was 80.5 mL, but only 80.0 mL was prepared. The results from this trial were consistent with those from the initial toxicity-mutation assay, but due to this calculation error and the additional deviation indicated above, the entire assay was retested. Therefore, the Study Director has concluded that this had no adverse impact on the integrity of the data or the validity of the study conclusion. Event No. 188520: During dilution of Experiment B1, vehicle control samples for analysis in ethanol, no internal standard solution was added to the samples. This deviated from BioReliance SOP OPAC0385. This deviation had no impact on the study, as no TA was detected in the vehicle, the internal standard was not needed to determine the amount of test article in the vehicle sample. Event No. 188521: The M-I matrix standard was not analyzed during the analysis of matrix standards for Experiment B1 treatment samples in phosphate buffer. This deviated from BioReliance SOP OPAC0385. Based on results of the M-0 and the VC samples, there was no contamination in the analytical assay, so M-1 analysis was not actually needed to evaluate the test results.
BioReliance Study No. AD58PU.503001.BTL 16
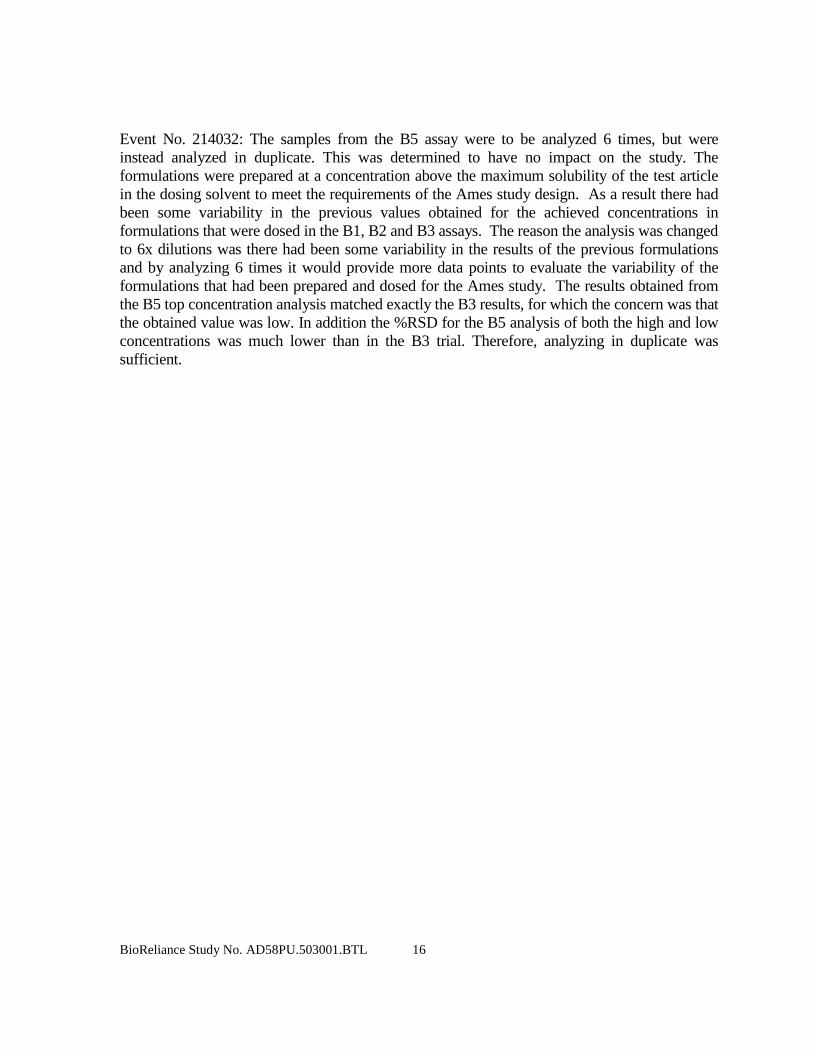
Event No. 214032: The samples from the B5 assay were to be analyzed 6 times, but were instead analyzed in duplicate. This was determined to have no impact on the study. The formulations were prepared at a concentration above the maximum solubility of the test article in the dosing solvent to meet the requirements of the Ames study design. As a result there had been some variability in the previous values obtained for the achieved concentrations in formulations that were dosed in the B1, B2 and B3 assays. The reason the analysis was changed to 6x dilutions was there had been some variability in the results of the previous formulations and by analyzing 6 times it would provide more data points to evaluate the variability of the formulations that had been prepared and dosed for the Ames study. The results obtained from the B5 top concentration analysis matched exactly the B3 results, for which the concern was that the obtained value was low. In addition the %RSD for the B5 analysis of both the high and low concentrations was much lower than in the B3 trial. Therefore, analyzing in duplicate was sufficient.

BioReliance Study No. AD58PU.503001.BTL 17
RESULTS AND DISCUSSION
Solubility Test
EtOH was selected as the solvent of choice based on information provided by the Sponsor, solubility of the test article and compatibility with the target cells. The test article formed a clear solution in EtOH at approximately 500 mg/mL, the maximum concentration tested in the solubility test conducted at BioReliance.
Sterility Results
No contaminant colonies were observed on the sterility plates for the vehicle control, the test article dilutions or the S9 and Sham mixes.
Tester Strain Titer Results
Experiment Tester Strain
TA98 TA100 TA1535 TA1537 WP2 uvrA Titer Value (x 109 cells per mL)
B1 2.4 2.1 2.7 2.5 5.7 B2 2.9 1.4 4.1 4.3 5.4 B3 2.0 1.3 1.4 2.1 3.0
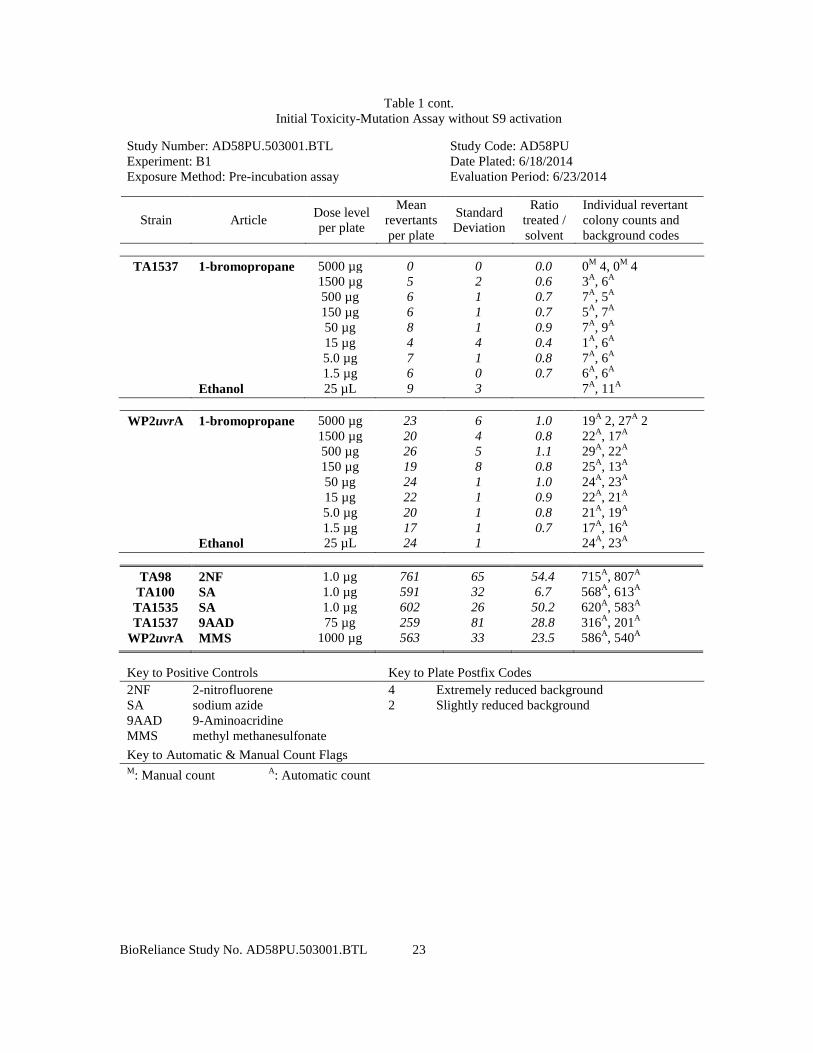
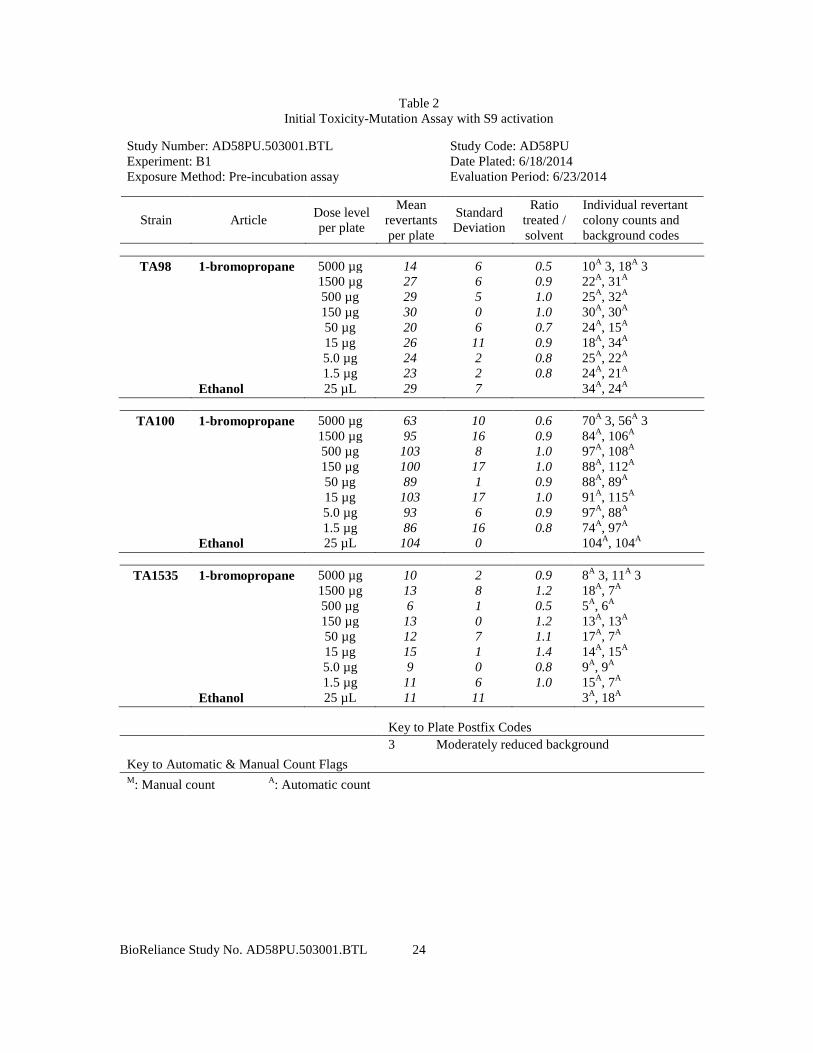
Initial Toxicity-Mutation Assay
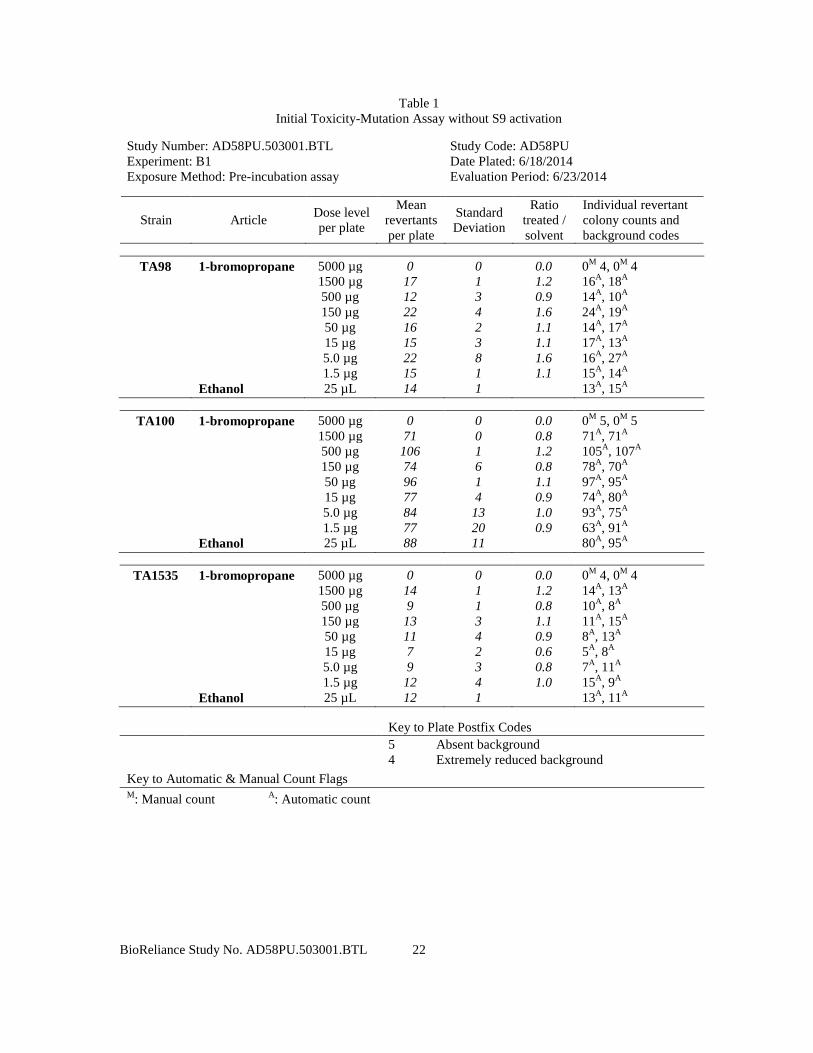
The results of the initial-toxicity mutation assay are presented in Tables 1 and 2. These data were generated in Experiment B1.
In Experiment B1 (Initial Toxicity-Mutation Assay), the maximum dose tested was 5000 µg per plate; this dose was achieved using a concentration of 200 mg/mL and a 25 µL plating aliquot. The dose levels tested were 1.5, 5.0, 15, 50, 150, 500, 1500 and 5000 µg per plate. No positive mutagenic responses were observed with any of the tester strains in either the presence or absence of S9 activation. No precipitate was observed. Toxicity was observed at 5000 µg per plate with all Salmonella tester strains. Based on the findings of the initial toxicity-mutation assay, the maximum dose plated in the confirmatory mutagenicity assay was 5000 µg per plate.
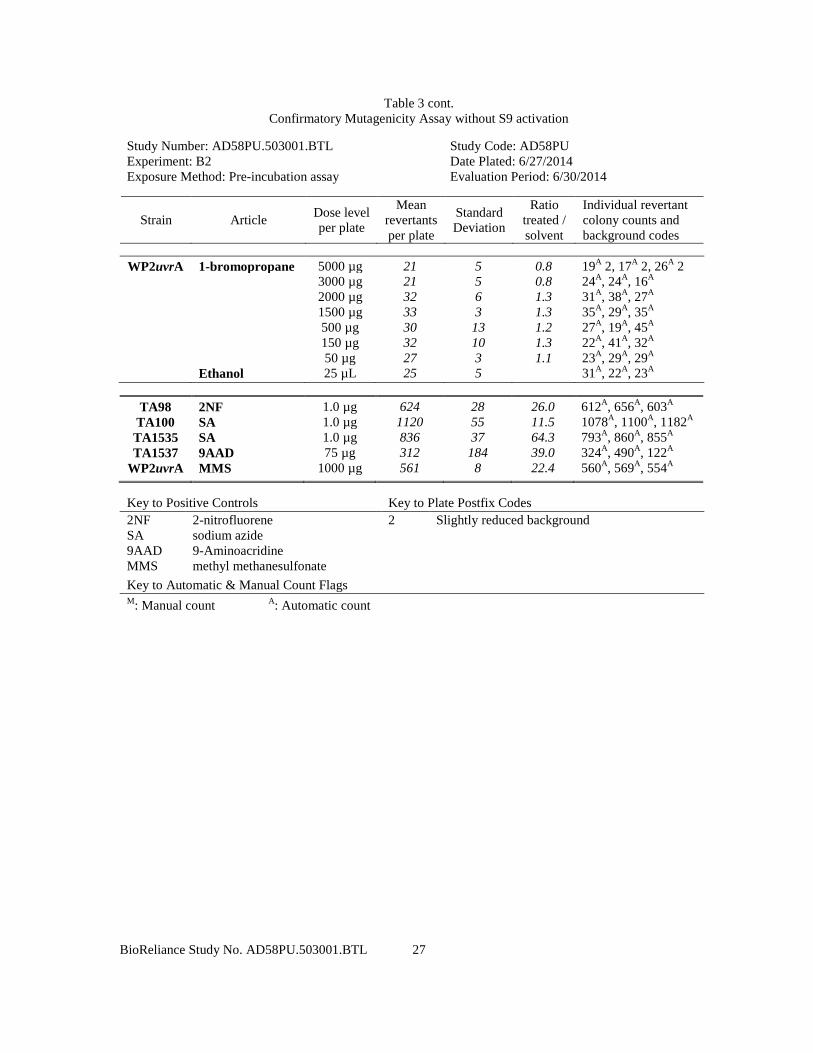
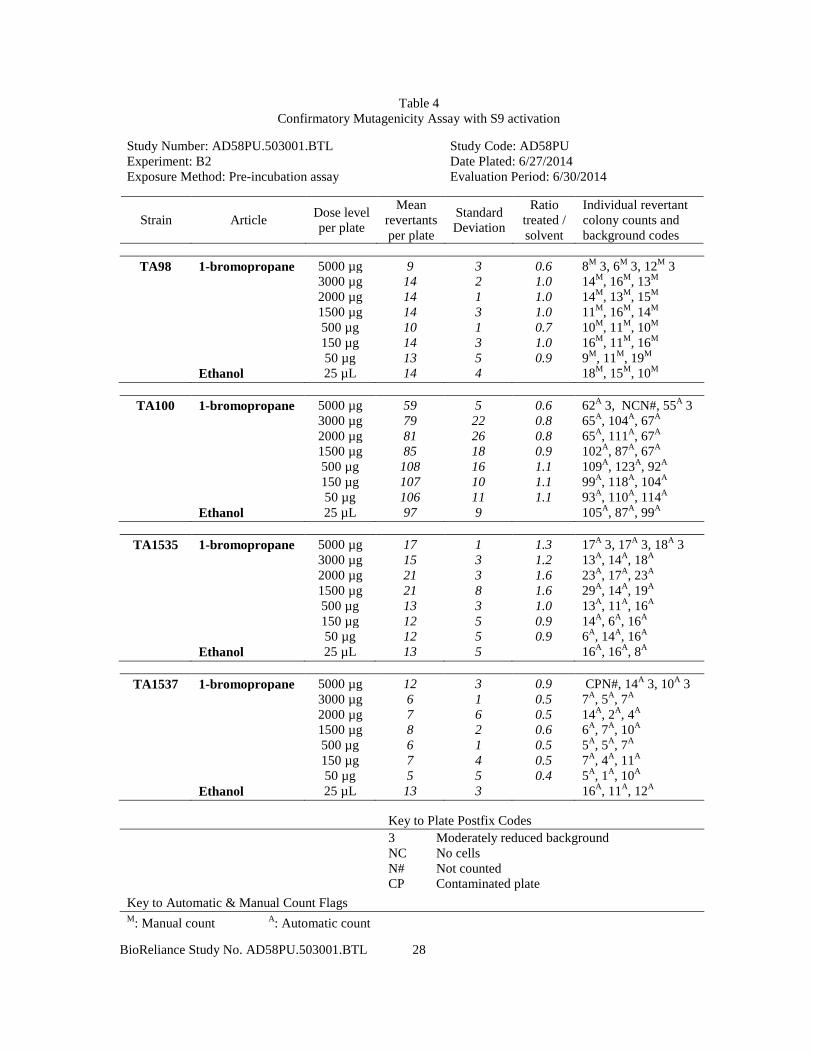
Confirmatory Mutagenicity Assay
The results of the confirmatory mutagenicity assay are presented in Tables 3 through 6. These data were generated in Experiments B2 and B3.
In Experiment B2 (Confirmatory Mutagenicity Assay), no positive mutagenic responses were observed with any of the tester strains in either the presence or absence of S9 activation. The

BioReliance Study No. AD58PU.503001.BTL 18
dose levels tested were 50, 150, 500, 1500, 2000, 3000 and 5000 µg per plate. No precipitate was observed. Toxicity was observed at 5000 µg per plate with all Salmonella tester strains. However, the entire assay was repeated due to technical errors (see Deviations).
In Experiment B3 (Retest of the Confirmatory Mutagenicity Assay), no positive mutagenic responses were observed with any of the tester strains in either the presence or absence of S9 activation. The dose levels tested were 50, 150, 500, 1500, 2000, 3000 and 5000 µg per plate. No precipitate was observed. Toxicity was observed beginning at 3000 or at 5000 µg per plate with all tester strains.
A copy of the Common Technical Document Tables is included in Appendix V.
Dosing Formulation Analysis
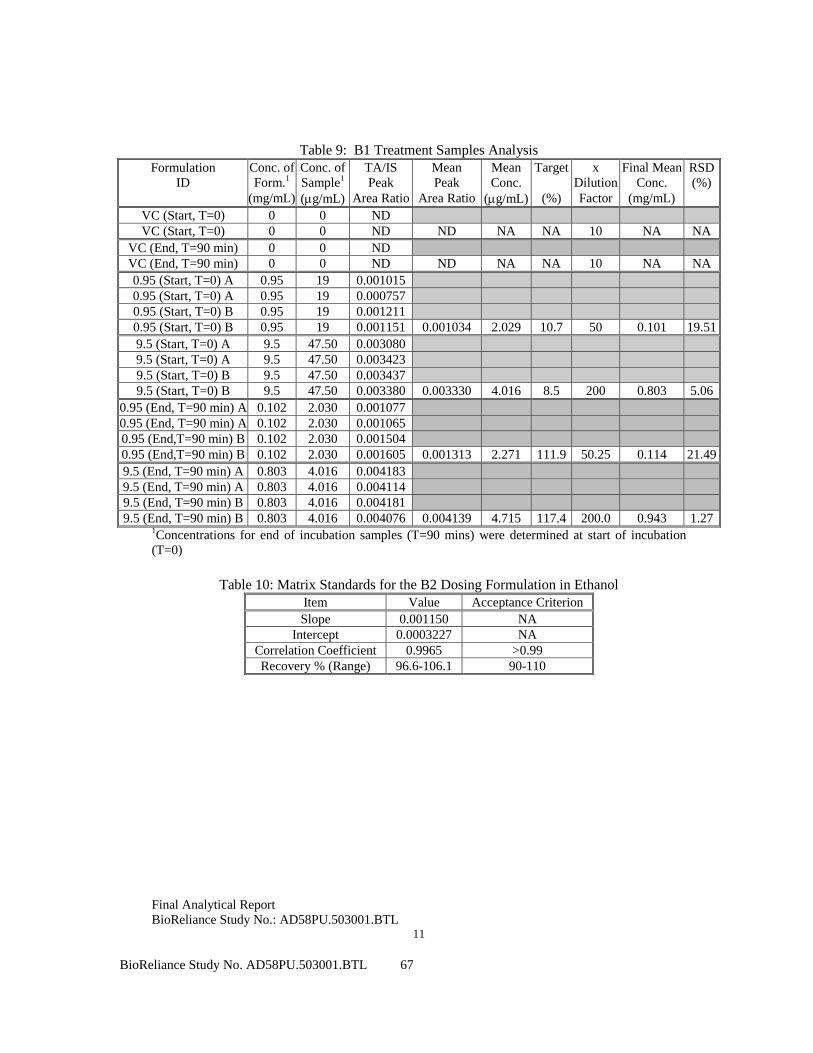
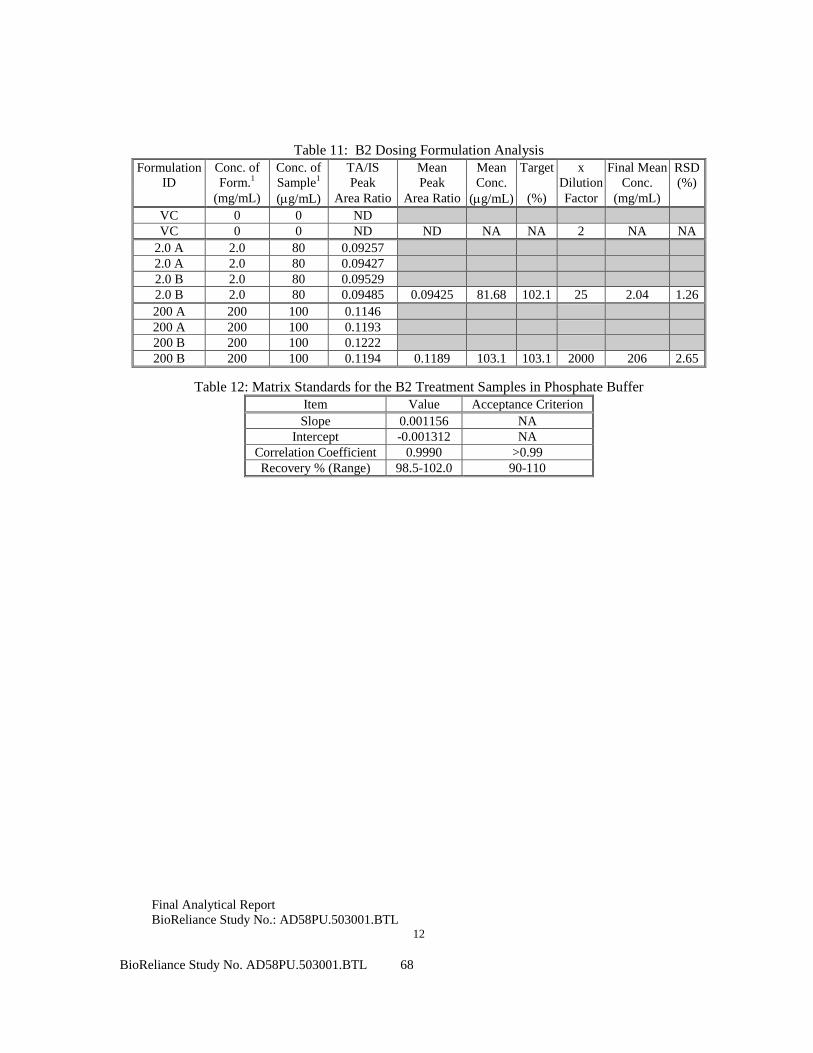
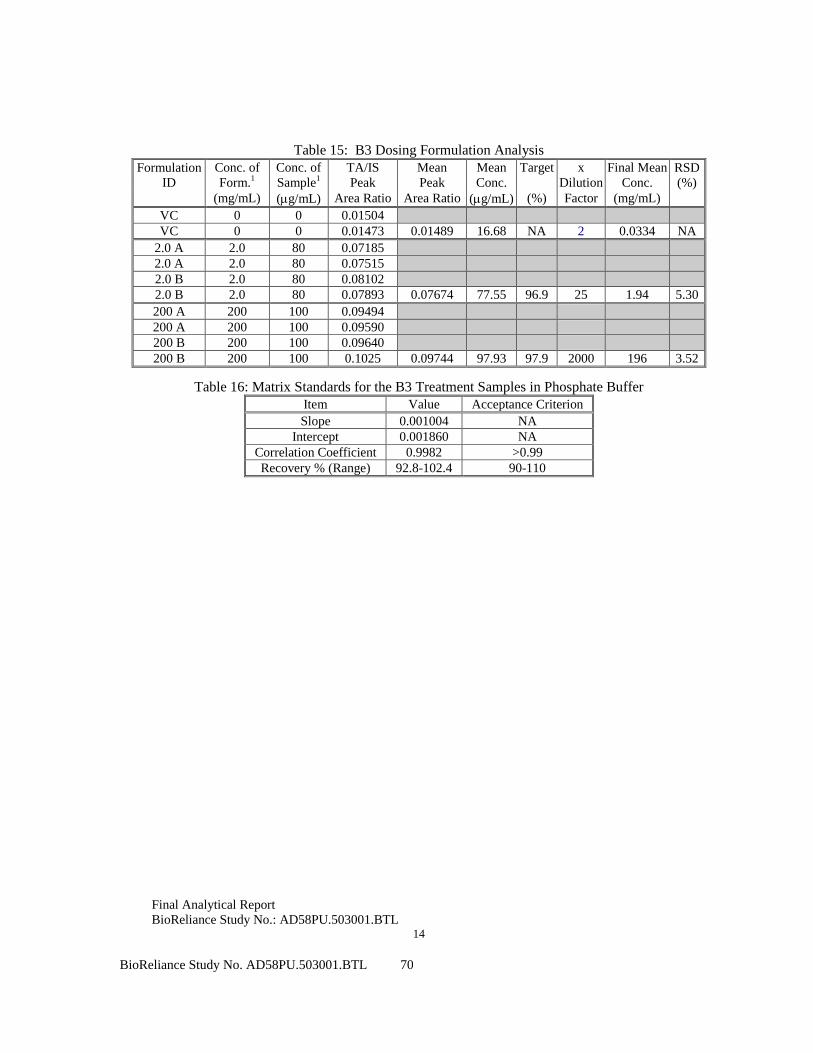
Dosing formulation and treatment samples were delivered to the analytical chemistry laboratory at BioReliance for analysis. A copy of the report is included in Appendix IV. Concentration analysis of B1 assay indicated that the actual mean concentrations of the analyzed low dose (0.060 mg/mL) and high dose (200 mg/mL) formulations were 104.0 and 96.8% of their respective target concentrations with < 5.0% relative standard deviation (RSD). These results indicate that the formulations were accurately prepared, and the test guideline recommended limit dose was achieved. No test article was detected in the vehicle control sample. Concentration analysis of B2 assay indicated that the actual mean concentrations of the analyzed low dose (2.0 mg/mL) and high dose (200 mg/mL) formulations were 102.1 and 103.1% of their respective target concentrations with < 5.0% relative standard deviation (RSD). These results indicate that the formulations were accurately prepared, and the test guideline recommended limit dose was achieved. No test article was detected in the vehicle control sample. Concentration analysis of B3 assay indicated that the actual mean concentrations of the analyzed low dose (2.0 mg/mL) and high dose (200 mg/mL) formulations were 96.9 and 97.9% of their respective target concentrations. The high dose was within < 5.0% relative standard deviation (RSD). The low dose did not meet the < 5.0% relative standard deviation (RSD). Although the actual precision of the low dose formulation was lower than the protocol-specified acceptance criterion, the actual concentration of the low dose formulation was within the acceptable range (all replicates). Therefore, the Study Director has concluded that the analytical results for the dosing formulations and the observed difference from the acceptable limits of RSD did not adversely impact the integrity of the data or the validity of the study conclusion. These results indicate that the formulations were accurately prepared, and the test guideline recommended limit dose was achieved. A small peak of test article was detected in the vehicle control sample. Concentration analysis of B4 assay was not reported due to analytical issues reported during the conduct of the study.

BioReliance Study No. AD58PU.503001.BTL 19
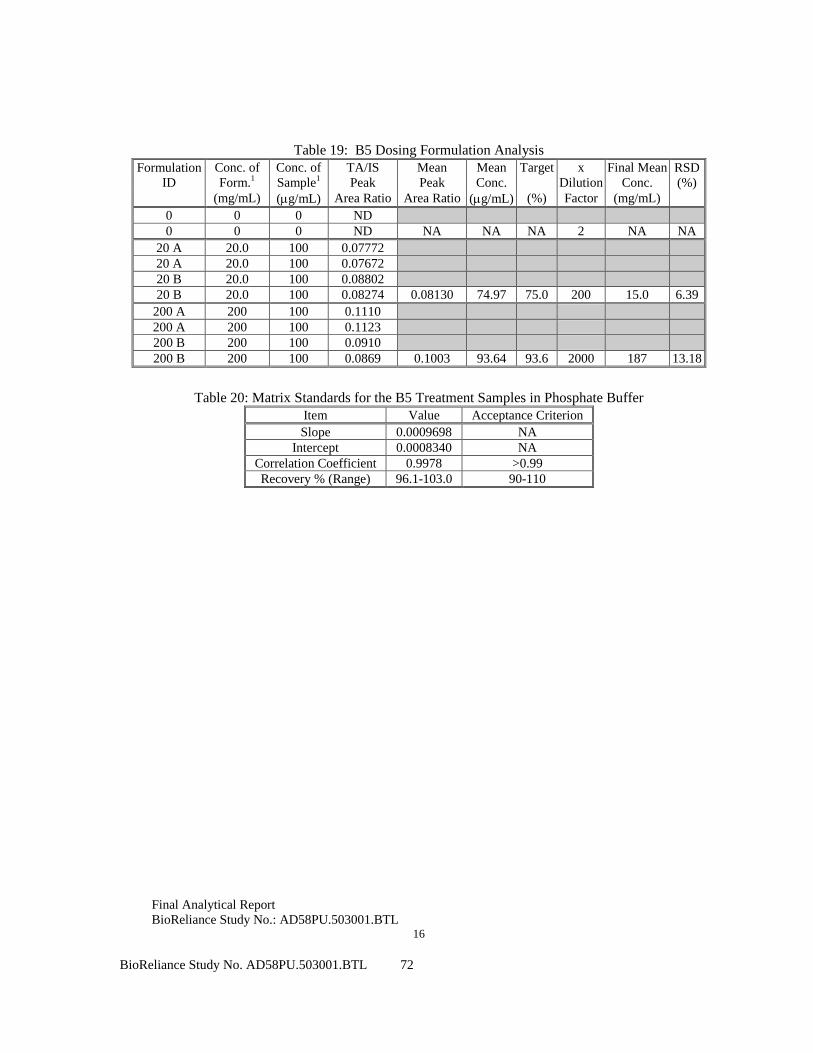
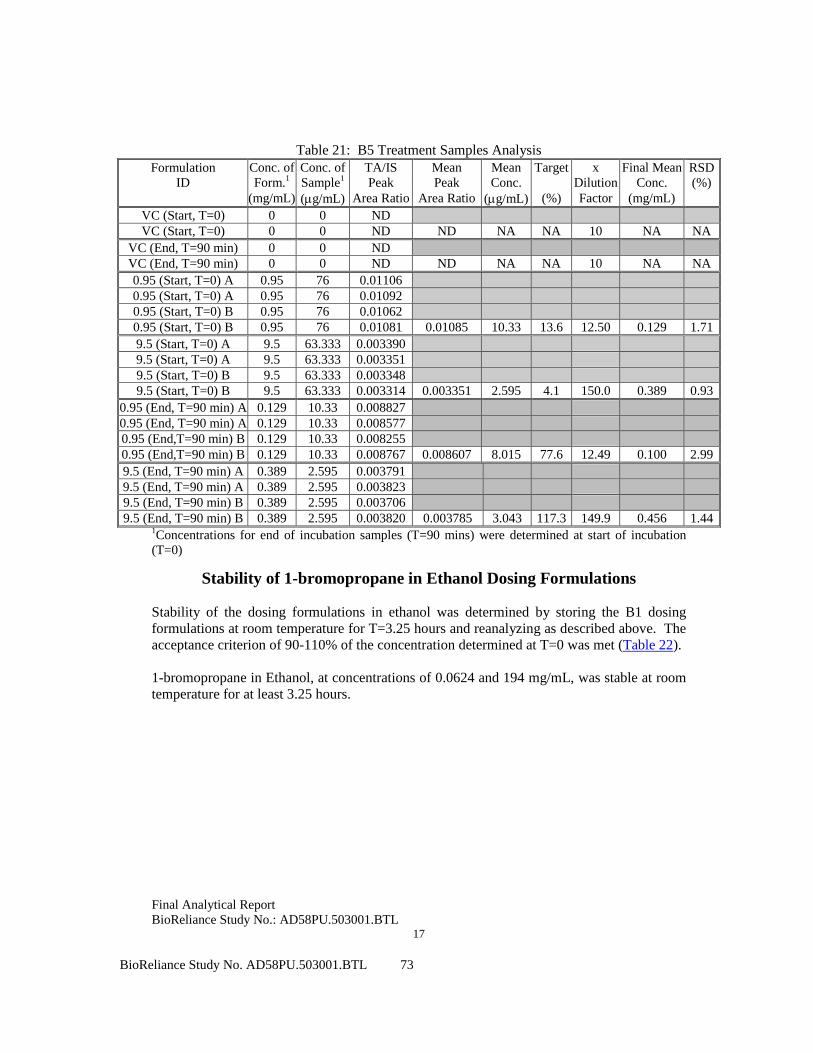
Concentration analysis of B5 assay indicated that the actual mean concentrations of the analyzed low dose (20.0 mg/mL) and high dose (200 mg/mL) formulations were 75.0 and 93.6% of their respective target concentrations with both doses not meeting the < 5.0% relative standard deviation (RSD) criterion. Although the actual concentration of the low dose formulation was lower than the protocol-specified acceptance criteria for a solution (90.0 to 110.0% of target concentration) and the actual precision of both dose formulations was lower than the protocol-specified acceptance criterion, the critical top dose formulation met the acceptance criteria indicating that the test guideline recommended limit dose was achieved in these mock dosing samples. Therefore, the Study Director has concluded that the difference in nominal concentration at the low dose had no adverse impact on the study results or validity of the study conclusion. No test article was detected in the vehicle control sample. The treatment samples in 100 mM Phosphate Buffer, pH 7.4 for Experiments B1, B2, B3, and B5 were collected and analyzed and the results are presented in Appendix IV. Stability analysis indicated that the 1-bromopropane in Ethanol, at concentrations of 0.0624 and 194 mg/mL, was stable for at least 3.25 hours at room temperature. Stability analysis also indicated that the 1-bromopropane in 100 mM phosphate buffer (PH 7.4), at concentration of 0.07408 mg/mL, was stable for at least 30 minutes at 37±2°C.
CONCLUSION
All criteria for a valid study were met as described in the protocol. The results of the Bacterial Reverse Mutation Assay indicate that, under the conditions of this study, 1-bromopropane did not cause a positive mutagenic response with any of the tester strains in either the presence or absence of Aroclor-induced rat liver S9. Therefore, the test article was concluded to be negative in this assay.
REFERENCES
Ames, B.N., J. McCann and E. Yamasaki (1975) Methods for Detecting Carcinogens and Mutagens with the Salmonella/Mammalian Microsome Mutagenicity Test, Mutation Research, 31:347-364.
Green, M.H.L. and W.J. Muriel (1976) Mutagen testing using trp+ reversion in Escherichia coli, Mutation Research 38:3-32.
Maron, D.M. and B.N. Ames (1983) Revised Methods for the Salmonella Mutagenicity Test, Mutation Research, 113:173-215.
OECD Guideline 471 (Genetic Toxicology: Bacterial Reverse Mutation Test), Ninth Addendum to the OECD Guidelines for the Testing of Chemicals, adopted July 21, 1997.

BioReliance Study No. AD58PU.503001.BTL 20
Vogel, H.J. and D.M. Bonner (1956) Acetylornithinase of E. coli: Partial Purification and Some Properties, J. Biol. Chem., 218:97-106.
Yahagi, T., Nagao, M., Seino, Y., Matsushima, T., Sugimura, T. and Okada, M. (1977) Mutagenicities of N-nitrosamines on Salmonella, Mutation Research, 48:121-130.

BioReliance Study No. AD58PU.503001.BTL 21
DATA TABLES
BioReliance Study No. AD58PU.503001.BTL 22
Table 1 Initial Toxicity-Mutation Assay without S9 activation
Study Number: AD58PU.503001.BTL Study Code: AD58PU Experiment: B1 Date Plated: 6/18/2014 Exposure Method: Pre-incubation assay Evaluation Period: 6/23/2014
Strain Article Dose level per plate
Mean revertants per plate
Standard Deviation
Ratio treated / solvent
Individual revertant colony counts and background codes
TA98 1-bromopropane 5000 µg 0 0 0.0 0M 4, 0M 4 1500 µg 17 1 1.2 16A, 18A
500 µg 12 3 0.9 14A, 10A
150 µg 22 4 1.6 24A, 19A
50 µg 16 2 1.1 14A, 17A
15 µg 15 3 1.1 17A, 13A
5.0 µg 22 8 1.6 16A, 27A
1.5 µg 15 1 1.1 15A, 14A
Ethanol 25 µL 14 1 13A, 15A
TA100 1-bromopropane 5000 µg 0 0 0.0 0M 5, 0M 5 1500 µg 71 0 0.8 71A, 71A
500 µg 106 1 1.2 105A, 107A
150 µg 74 6 0.8 78A, 70A
50 µg 96 1 1.1 97A, 95A
15 µg 77 4 0.9 74A, 80A
5.0 µg 84 13 1.0 93A, 75A
1.5 µg 77 20 0.9 63A, 91A
Ethanol 25 µL 88 11 80A, 95A
TA1535 1-bromopropane 5000 µg 0 0 0.0 0M 4, 0M 4 1500 µg 14 1 1.2 14A, 13A
500 µg 9 1 0.8 10A, 8A
150 µg 13 3 1.1 11A, 15A
50 µg 11 4 0.9 8A, 13A
15 µg 7 2 0.6 5A, 8A
5.0 µg 9 3 0.8 7A, 11A
1.5 µg 12 4 1.0 15A, 9A
Ethanol 25 µL 12 1 13A, 11A
Key to Plate Postfix Codes
5 4
Absent background Extremely reduced background
Key to Automatic & Manual Count Flags M: Manual count A: Automatic count
BioReliance Study No. AD58PU.503001.BTL 23
Table 1 cont. Initial Toxicity-Mutation Assay without S9 activation
Study Number: AD58PU.503001.BTL Study Code: AD58PU Experiment: B1 Date Plated: 6/18/2014 Exposure Method: Pre-incubation assay Evaluation Period: 6/23/2014
Strain Article Dose level per plate
Mean revertants per plate
Standard Deviation
Ratio treated / solvent
Individual revertant colony counts and background codes
TA1537 1-bromopropane 5000 µg 0 0 0.0 0M 4, 0M 4 1500 µg 5 2 0.6 3A, 6A
500 µg 6 1 0.7 7A, 5A
150 µg 6 1 0.7 5A, 7A
50 µg 8 1 0.9 7A, 9A
15 µg 4 4 0.4 1A, 6A
5.0 µg 7 1 0.8 7A, 6A
1.5 µg 6 0 0.7 6A, 6A
Ethanol 25 µL 9 3 7A, 11A
WP2uvrA 1-bromopropane 5000 µg 23 6 1.0 19A 2, 27A 2 1500 µg 20 4 0.8 22A, 17A
500 µg 26 5 1.1 29A, 22A
150 µg 19 8 0.8 25A, 13A
50 µg 24 1 1.0 24A, 23A
15 µg 22 1 0.9 22A, 21A
5.0 µg 20 1 0.8 21A, 19A
1.5 µg 17 1 0.7 17A, 16A
Ethanol 25 µL 24 1 24A, 23A
TA98 2NF 1.0 µg 761 65 54.4 715A, 807A
TA100 SA 1.0 µg 591 32 6.7 568A, 613A
TA1535 SA 1.0 µg 602 26 50.2 620A, 583A
TA1537 9AAD 75 µg 259 81 28.8 316A, 201A
WP2uvrA MMS 1000 µg 563 33 23.5 586A, 540A
Key to Positive Controls Key to Plate Postfix Codes
2NF SA 9AAD MMS
2-nitrofluorene sodium azide 9-Aminoacridine methyl methanesulfonate
4 2
Extremely reduced background Slightly reduced background
Key to Automatic & Manual Count Flags M: Manual count A: Automatic count
BioReliance Study No. AD58PU.503001.BTL 24
Table 2 Initial Toxicity-Mutation Assay with S9 activation
Study Number: AD58PU.503001.BTL Study Code: AD58PU Experiment: B1 Date Plated: 6/18/2014 Exposure Method: Pre-incubation assay Evaluation Period: 6/23/2014
Strain Article Dose level per plate
Mean revertants per plate
Standard Deviation
Ratio treated / solvent
Individual revertant colony counts and background codes
TA98 1-bromopropane 5000 µg 14 6 0.5 10A 3, 18A 3 1500 µg 27 6 0.9 22A, 31A
500 µg 29 5 1.0 25A, 32A
150 µg 30 0 1.0 30A, 30A
50 µg 20 6 0.7 24A, 15A
15 µg 26 11 0.9 18A, 34A
5.0 µg 24 2 0.8 25A, 22A
1.5 µg 23 2 0.8 24A, 21A
Ethanol 25 µL 29 7 34A, 24A
TA100 1-bromopropane 5000 µg 63 10 0.6 70A 3, 56A 3 1500 µg 95 16 0.9 84A, 106A
500 µg 103 8 1.0 97A, 108A
150 µg 100 17 1.0 88A, 112A
50 µg 89 1 0.9 88A, 89A
15 µg 103 17 1.0 91A, 115A
5.0 µg 93 6 0.9 97A, 88A
1.5 µg 86 16 0.8 74A, 97A
Ethanol 25 µL 104 0 104A, 104A
TA1535 1-bromopropane 5000 µg 10 2 0.9 8A 3, 11A 3 1500 µg 13 8 1.2 18A, 7A
500 µg 6 1 0.5 5A, 6A
150 µg 13 0 1.2 13A, 13A
50 µg 12 7 1.1 17A, 7A
15 µg 15 1 1.4 14A, 15A
5.0 µg 9 0 0.8 9A, 9A
1.5 µg 11 6 1.0 15A, 7A
Ethanol 25 µL 11 11 3A, 18A
Key to Plate Postfix Codes
3 Moderately reduced background Key to Automatic & Manual Count Flags M: Manual count A: Automatic count

BioReliance Study No. AD58PU.503001.BTL 25
Table 2 cont. Initial Toxicity-Mutation Assay with S9 activation
Study Number: AD58PU.503001.BTL Study Code: AD58PU Experiment: B1 Date Plated: 6/18/2014 Exposure Method: Pre-incubation assay Evaluation Period: 6/23/2014
Strain Article Dose level per plate
Mean revertants per plate
Standard Deviation
Ratio treated / solvent
Individual revertant colony counts and background codes
TA1537 1-bromopropane 5000 µg 8 4 0.7 10A 3, 5A 3 1500 µg 12 1 1.0 11A, 13A
500 µg 9 3 0.8 11A, 7A
150 µg 9 1 0.8 9A, 8A
50 µg 15 1 1.3 15A, 14A
15 µg 11 1 0.9 10A, 11A
5.0 µg 8 1 0.7 8A, 7A
1.5 µg 10 1 0.8 10A, 9A
Ethanol 25 µL 12 4 9A, 15A
WP2uvrA 1-bromopropane 5000 µg 36 3 1.3 38A, 34A
1500 µg 32 2 1.2 30A, 33A
500 µg 34 13 1.3 43A, 25A
150 µg 29 2 1.1 27A, 30A
50 µg 28 1 1.0 29A, 27A
15 µg 30 1 1.1 29A, 31A
5.0 µg 23 1 0.9 22A, 24A
1.5 µg 26 6 1.0 30A, 22A
Ethanol 25 µL 27 3 29A, 25A
TA98 2AA 1.0 µg 435 5 15.0 431A, 438A
TA100 2AA 2.0 µg 504 60 4.8 546A, 461A
TA1535 2AA 1.0 µg 52 1 4.7 52A, 51A
TA1537 2AA 2.0 µg 47 1 3.9 47A, 46A
WP2uvrA 2AA 15 µg 310 2 11.5 311A, 308A
Key to Positive Controls Key to Plate Postfix Codes
2AA 2-aminoanthracene 3 Moderately reduced background Key to Automatic & Manual Count Flags M: Manual count A: Automatic count

BioReliance Study No. AD58PU.503001.BTL 26
Table 3 Confirmatory Mutagenicity Assay without S9 activation
Study Number: AD58PU.503001.BTL Study Code: AD58PU Experiment: B2 Date Plated: 6/27/2014 Exposure Method: Pre-incubation assay Evaluation Period: 6/30/2014
Strain Article Dose level per plate
Mean revertants per plate
Standard Deviation
Ratio treated / solvent
Individual revertant colony counts and background codes
TA98 1-bromopropane 5000 µg 0 0 0.0 0M 4, 0M 4, 0M 4 3000 µg 19 7 0.8 25M, 20M, 12M
2000 µg 24 10 1.0 31M, 29M, 13M
1500 µg 27 1 1.1 26M, 26M, 28M
500 µg 23 7 1.0 31M, 20M, 17M
150 µg 19 3 0.8 16M, 22M, 19M
50 µg 21 3 0.9 18M, 24M, 20M
Ethanol 25 µL 24 3 22M, 27M, 24M
TA100 1-bromopropane 5000 µg 0 0 0.0 0M 4, 0M 4, 0M 4 3000 µg 67 17 0.7 86A, 54A, 60A
2000 µg 65 20 0.7 78A, 42A, 76A
1500 µg 72 22 0.7 47A, 81A, 88A
500 µg 80 16 0.8 65A, 78A, 96A
150 µg 91 8 0.9 93A, 82A, 97A
50 µg 90 8 0.9 91A, 98A, 82A
Ethanol 25 µL 97 12 96A, 109A, 85A
TA1535 1-bromopropane 5000 µg 0 0 0.0 0M 4, 0M 4, 0M 4 3000 µg 10 4 0.8 6A, 10A, 14A
2000 µg 8 4 0.6 13A, 6A, 6A
1500 µg 13 1 1.0 12A, 13A, 13A
500 µg 17 1 1.3 16A, 18A, 17A
150 µg 10 2 0.8 12A, 10A, 8A
50 µg 11 3 0.8 10A, 8A, 14A
Ethanol 25 µL 13 2 14A, 11A, 14A
TA1537 1-bromopropane 5000 µg 0 0 0.0 0M 4, 0M 4, 0M 4 3000 µg 7 3 0.9 5A, 5A, 11A
2000 µg 8 1 1.0 8A, 7A, 8A
1500 µg 6 6 0.8 13A, 2A, 2A
500 µg 8 4 1.0 5A, 7A, 12A
150 µg 11 3 1.4 13A, 13A, 7A
50 µg 11 3 1.4 11A, 14A, 8A
Ethanol 25 µL 8 3 6A, 8A, 11A
Key to Plate Postfix Codes
4 Extremely reduced background Key to Automatic & Manual Count Flags M: Manual count A: Automatic count
BioReliance Study No. AD58PU.503001.BTL 27
Table 3 cont. Confirmatory Mutagenicity Assay without S9 activation
Study Number: AD58PU.503001.BTL Study Code: AD58PU Experiment: B2 Date Plated: 6/27/2014 Exposure Method: Pre-incubation assay Evaluation Period: 6/30/2014
Strain Article Dose level per plate
Mean revertants per plate
Standard Deviation
Ratio treated / solvent
Individual revertant colony counts and background codes
WP2uvrA 1-bromopropane 5000 µg 21 5 0.8 19A 2, 17A 2, 26A 2 3000 µg 21 5 0.8 24A, 24A, 16A
2000 µg 32 6 1.3 31A, 38A, 27A
1500 µg 33 3 1.3 35A, 29A, 35A
500 µg 30 13 1.2 27A, 19A, 45A
150 µg 32 10 1.3 22A, 41A, 32A
50 µg 27 3 1.1 23A, 29A, 29A
Ethanol 25 µL 25 5 31A, 22A, 23A
TA98 2NF 1.0 µg 624 28 26.0 612A, 656A, 603A
TA100 SA 1.0 µg 1120 55 11.5 1078A, 1100A, 1182A
TA1535 SA 1.0 µg 836 37 64.3 793A, 860A, 855A
TA1537 9AAD 75 µg 312 184 39.0 324A, 490A, 122A
WP2uvrA MMS 1000 µg 561 8 22.4 560A, 569A, 554A
Key to Positive Controls Key to Plate Postfix Codes
2NF SA 9AAD MMS
2-nitrofluorene sodium azide 9-Aminoacridine methyl methanesulfonate
2 Slightly reduced background
Key to Automatic & Manual Count Flags M: Manual count A: Automatic count
BioReliance Study No. AD58PU.503001.BTL 28
Table 4 Confirmatory Mutagenicity Assay with S9 activation
Study Number: AD58PU.503001.BTL Study Code: AD58PU Experiment: B2 Date Plated: 6/27/2014 Exposure Method: Pre-incubation assay Evaluation Period: 6/30/2014
Strain Article Dose level per plate
Mean revertants per plate
Standard Deviation
Ratio treated / solvent
Individual revertant colony counts and background codes
TA98 1-bromopropane 5000 µg 9 3 0.6 8M 3, 6M 3, 12M 3 3000 µg 14 2 1.0 14M, 16M, 13M
2000 µg 14 1 1.0 14M, 13M, 15M
1500 µg 14 3 1.0 11M, 16M, 14M
500 µg 10 1 0.7 10M, 11M, 10M
150 µg 14 3 1.0 16M, 11M, 16M
50 µg 13 5 0.9 9M, 11M, 19M
Ethanol 25 µL 14 4 18M, 15M, 10M
TA100 1-bromopropane 5000 µg 59 5 0.6 62A 3, NCN#, 55A 3 3000 µg 79 22 0.8 65A, 104A, 67A
2000 µg 81 26 0.8 65A, 111A, 67A
1500 µg 85 18 0.9 102A, 87A, 67A
500 µg 108 16 1.1 109A, 123A, 92A
150 µg 107 10 1.1 99A, 118A, 104A
50 µg 106 11 1.1 93A, 110A, 114A
Ethanol 25 µL 97 9 105A, 87A, 99A
TA1535 1-bromopropane 5000 µg 17 1 1.3 17A 3, 17A 3, 18A 3 3000 µg 15 3 1.2 13A, 14A, 18A
2000 µg 21 3 1.6 23A, 17A, 23A
1500 µg 21 8 1.6 29A, 14A, 19A
500 µg 13 3 1.0 13A, 11A, 16A
150 µg 12 5 0.9 14A, 6A, 16A
50 µg 12 5 0.9 6A, 14A, 16A
Ethanol 25 µL 13 5 16A, 16A, 8A
TA1537 1-bromopropane 5000 µg 12 3 0.9 CPN#, 14A 3, 10A 3 3000 µg 6 1 0.5 7A, 5A, 7A
2000 µg 7 6 0.5 14A, 2A, 4A
1500 µg 8 2 0.6 6A, 7A, 10A
500 µg 6 1 0.5 5A, 5A, 7A
150 µg 7 4 0.5 7A, 4A, 11A
50 µg 5 5 0.4 5A, 1A, 10A
Ethanol 25 µL 13 3 16A, 11A, 12A
Key to Plate Postfix Codes
3 NC N# CP
Moderately reduced background No cells Not counted Contaminated plate
Key to Automatic & Manual Count Flags M: Manual count A: Automatic count

BioReliance Study No. AD58PU.503001.BTL 29
Table 4 cont. Confirmatory Mutagenicity Assay with S9 activation
Study Number: AD58PU.503001.BTL Study Code: AD58PU Experiment: B2 Date Plated: 6/27/2014 Exposure Method: Pre-incubation assay Evaluation Period: 6/30/2014
Strain Article Dose level per plate
Mean revertants per plate
Standard Deviation
Ratio treated / solvent
Individual revertant colony counts and background codes
WP2uvrA 1-bromopropane 5000 µg 31 2 1.0 33A, 30A, 29A
3000 µg 40 12 1.3 26A, 47A, 48A
2000 µg 39 11 1.3 44A, 27A, 47A
1500 µg 34 6 1.1 32A, 41A, 30A
500 µg 36 1 1.2 35A, 37A, 37A
150 µg 32 8 1.0 37A, 36A, 22A
50 µg 34 8 1.1 42A, 27A, 32A
Ethanol 25 µL 31 14 44A, 31A, 17A
TA98 2AA 1.0 µg 519 49 37.1 571A, 511A, 474A
TA100 2AA 2.0 µg 328 35 3.4 367A, 320A, 298A
TA1535 2AA 1.0 µg 63 3 4.8 65A, 59A, 65A
TA1537 2AA 2.0 µg 40 7 3.1 36A, 48A, 35A
WP2uvrA 2AA 15 µg 334 83 10.8 424A, 317A, 260A
Key to Positive Controls
2AA 2-aminoanthracene Key to Automatic & Manual Count Flags M: Manual count A: Automatic count
BioReliance Study No. AD58PU.503001.BTL 30
Table 5 Retest of the Confirmatory Mutagenicity Assay without S9 activation
Study Number: AD58PU.503001.BTL Study Code: AD58PU Experiment: B3 Date Plated: 7/24/2014 Exposure Method: Pre-incubation assay Evaluation Period: 7/30/2014
Strain Article Dose level per plate
Mean revertants per plate
Standard Deviation
Ratio treated / solvent
Individual revertant colony counts and background codes
TA98 1-bromopropane 5000 µg 0 0 0.0 0M 4, 0M 4, 0M 4 3000 µg 0 0 0.0 0M 4, 0M 4, 0M 4 2000 µg 30 16 1.4 27A, 16A, 47A
1500 µg 35 6 1.6 31A, 41A, 32A
500 µg 36 1 1.6 35A, 37A, 37A
150 µg 37 7 1.7 37A, 30A, 44A
50 µg 39 5 1.8 44A, 35A, 39A
Ethanol 25 µL 22 5 16A, 25A, 25A
TA100 1-bromopropane 5000 µg 0 0 0.0 0M 4, 0M 4, 0M 4 3000 µg 0 0 0.0 0M 4, 0M 4, 0M 4 2000 µg 75 3 0.7 73A, 73A, 79A
1500 µg 74 5 0.7 79A, 75A, 69A
500 µg 90 12 0.8 100A, 76A, 94A
150 µg 83 12 0.8 80A, 73A, 97A
50 µg 75 9 0.7 69A, 72A, 85A
Ethanol 25 µL 106 12 94A, 108A, 117A
TA1535 1-bromopropane 5000 µg 0 0 0.0 0M 4, 0M 4, 0M 4 3000 µg 0 0 0.0 0M 4, 0M 4, 0M 4 2000 µg 13 4 0.9 17A, 10A, 12A
1500 µg 16 4 1.1 16A, 19A, 12A
500 µg 18 6 1.2 23A, 20A, 11A
150 µg 18 3 1.2 16A, 16A, 22A
50 µg 15 1 1.0 16A, 14A, 14A
Ethanol 25 µL 15 4 11A, 16A, 18A
TA1537 1-bromopropane 5000 µg 0 0 0.0 0M 4, 0M 4, 0M 4 3000 µg 0 0 0.0 0M 4, 0M 4, 0M 4 2000 µg 3 1 0.5 3M, 3M, 4M
1500 µg 5 2 0.8 3M, 5M, 6M
500 µg 4 1 0.7 4M, 4M, 3M
150 µg 3 1 0.5 2M, 4M, 3M
50 µg 4 1 0.7 4M, 4M, 3M
Ethanol 25 µL 6 1 7M, 6M, 5M
Key to Plate Postfix Codes
4 Extremely reduced background Key to Automatic & Manual Count Flags M: Manual count A: Automatic count

BioReliance Study No. AD58PU.503001.BTL 31
Table 5 cont. Retest of the Confirmatory Mutagenicity Assay without S9 activation
Study Number: AD58PU.503001.BTL Study Code: AD58PU Experiment: B3 Date Plated: 7/24/2014 Exposure Method: Pre-incubation assay Evaluation Period: 7/30/2014
Strain Article Dose level per plate
Mean revertants per plate
Standard Deviation
Ratio treated / solvent
Individual revertant colony counts and background codes
WP2uvrA 1-bromopropane 5000 µg 0 0 0.0 0M 4, 0M 4, 0M 4 3000 µg 33 13 1.0 48A, 24A, 26A
2000 µg 29 7 0.9 27A, 24A, 37A
1500 µg 24 2 0.8 24A, 26A, 22A
500 µg 32 6 1.0 25A, 37A, 35A
150 µg 27 6 0.8 29A, 20A, 32A
50 µg 26 5 0.8 22A, CPN#, 29A
Ethanol 25 µL 32 2 35A, 31A, 31A
TA98 2NF 1.0 µg 768 62 34.9 698A, 816A, 791A
TA100 SA 1.0 µg 1057 60 10.0 989A, 1099A, 1084A
TA1535 SA 1.0 µg 463 5 30.9 462A, 468A, 459A
TA1537 9AAD 75 µg 115 2 19.2 114A, 117A, 114A
WP2uvrA MMS 1000 µg 614 58 19.2 548A, 650A, 645A
Key to Positive Controls Key to Plate Postfix Codes
2NF SA 9AAD MMS
2-nitrofluorene sodium azide 9-Aminoacridine methyl methanesulfonate
4 CP N#
Extremely reduced background Contaminated plate Not counted
Key to Automatic & Manual Count Flags M: Manual count A: Automatic count

BioReliance Study No. AD58PU.503001.BTL 32
Table 6 Retest of the Confirmatory Mutagenicity Assay with S9 activation
Study Number: AD58PU.503001.BTL Study Code: AD58PU Experiment: B3 Date Plated: 7/24/2014 Exposure Method: Pre-incubation assay Evaluation Period: 7/30/2014
Strain Article Dose level per plate
Mean revertants per plate
Standard Deviation
Ratio treated / solvent
Individual revertant colony counts and background codes
TA98 1-bromopropane 5000 µg 0 0 0.0 0M 4, 0M 4, 0M 4 3000 µg 0 0 0.0 0M 4, 0M 4, 0M 4 2000 µg 23 8 0.7 19M, 32M, 17M
1500 µg 25 3 0.8 29M, 23M, 24M
500 µg 25 4 0.8 28M, 21M, 27M
150 µg 24 3 0.8 21M, 27M, 25M
50 µg 25 5 0.8 22M, 22M, 31M
Ethanol 25 µL 32 6 31M, 39M, 27M
TA100 1-bromopropane 5000 µg 0 0 0.0 0M 4, 0M 4, 0M 4 3000 µg 0 0 0.0 0M 4, 0M 4, 0M 4 2000 µg 68 6 0.7 62A, 74A, 67A
1500 µg 78 14 0.8 66A, 94A, 75A
500 µg 88 11 0.9 87A, 99A, 78A
150 µg 88 13 0.9 103A, 80A, 80A
50 µg 106 27 1.1 125A, 87A, CPN# Ethanol 25 µL 100 32 81A, 82A, 137A
TA1535 1-bromopropane 5000 µg 0 0 0.0 0M 4, 0M 4, 0M 4 3000 µg 0 0 0.0 0M 4, 0M 4, 0M 4 2000 µg 20 3 0.6 20A, 23A, 17A
1500 µg 20 6 0.6 13A, 24A, 24A
500 µg 24 2 0.8 22A, 25A, 26A
150 µg 32 3 1.0 31A, 35A, 29A
50 µg 26 3 0.8 23A, 29A, 27A
Ethanol 25 µL 31 7 23A, 36A, 33A
TA1537 1-bromopropane 5000 µg 0 0 0.0 0M 4, 0M 4, 0M 4 3000 µg 0 0 0.0 0M 4, 0M 4, 0M 4 2000 µg 7 2 1.4 5M, 8M, 7M
1500 µg 5 2 1.0 5M, 6M, 3M
500 µg 4 2 0.8 6M, 3M, 4M
150 µg 4 1 0.8 4M, 5M, 3M
50 µg 4 1 0.8 4M, 5M, 4M
Ethanol 25 µL 5 1 4M, 6M, 5M
Key to Plate Postfix Codes
4 CP N#
Extremely reduced background Contaminated plate Not counted
Key to Automatic & Manual Count Flags M: Manual count A: Automatic count
BioReliance Study No. AD58PU.503001.BTL 33
Table 6 cont. Retest of the Confirmatory Mutagenicity Assay with S9 activation
Study Number: AD58PU.503001.BTL Study Code: AD58PU Experiment: B3 Date Plated: 7/24/2014 Exposure Method: Pre-incubation assay Evaluation Period: 7/30/2014
Strain Article Dose level per plate
Mean revertants per plate
Standard Deviation
Ratio treated / solvent
Individual revertant colony counts and background codes
WP2uvrA 1-bromopropane 5000 µg 0 0 0.0 0M 4, 0M 4, 0M 4 3000 µg 0 0 0.0 0M 4, 0M 4, 0M 4 2000 µg 31 10 0.8 25A, 26A, 42A
1500 µg 28 4 0.7 25A, 32A, 26A
500 µg 25 2 0.6 24A, 23A, 27A
150 µg 33 5 0.8 27A, 36A, 35A
50 µg 32 9 0.8 30A, 24A, 42A
Ethanol 25 µL 41 10 30A, 43A, 49A
TA98 2AA 1.0 µg 490 7 15.3 485A, 486A, 498A
TA100 2AA 2.0 µg 554 53 5.5 562A, 602A, 497A
TA1535 2AA 1.0 µg 105 12 3.4 93A, 106A, 117A
TA1537 2AA 2.0 µg 87 16 17.4 72A, 103A, 85A
WP2uvrA 2AA 15 µg 402 15 9.8 401A, 418A, 388A
Key to Positive Controls Key to Plate Postfix Codes
2AA 2-aminoanthracene 4 Extremely reduced background Key to Automatic & Manual Count Flags M: Manual count A: Automatic count

BioReliance Study No. AD58PU.503001.BTL 34
APPENDIX I: Historical Control Data

BioReliance Study No. AD58PU.503001.BTL 35
Historical Negative and Positive Control Values 2011 – 2013
revertants per plate
Strain Control Activation
None Rat Liver Mean SD Min Max Mean SD Min Max
TA98 Neg 18 8 3 64 24 8 4 60
Pos 271 214 34 2274 423 190 47 1711
TA100 Neg 98 18 50 251 110 23 55 247
Pos 608 143 211 1393 730 260 247 2421
TA1535 Neg 11 4 1 43 12 4 1 35
Pos 501 164 20 1593 103 92 20 1472
TA1537 Neg 7 4 0 28 8 4 0 28
Pos 422 386 17 3711 59 56 10 850
WP2 uvrA Neg 27 10 5 84 30 10 7 80
Pos 380 160 42 1796 245 98 21 969
SD=standard deviation; Min=minimum value; Max=maximum value; Neg=negative control (including but not limited to deionized water, dimethyl sulfoxide, ethanol and acetone); Pos=positive control

BioReliance Study No. AD58PU.503001.BTL 36
APPENDIX II: Study Protocol and Amendments

BioReliance Study No. AD58PU.503001.BTL 37
BioReliance Study No. AD58PU.503001.BTL 38

BioReliance Study No. AD58PU.503001.BTL 39
BioReliance Study No. AD58PU.503001.BTL 40
BioReliance Study No. AD58PU.503001.BTL 41
BioReliance Study No. AD58PU.503001.BTL 42
BioReliance Study No. AD58PU.503001.BTL 43
BioReliance Study No. AD58PU.503001.BTL 44
BioReliance Study No. AD58PU.503001.BTL 45

BioReliance Study No. AD58PU.503001.BTL 46
BioReliance Study No. AD58PU.503001.BTL 47
BioReliance Study No. AD58PU.503001.BTL 48

BioReliance Study No. AD58PU.503001.BTL 49

BioReliance Study No. AD58PU.503001.BTL 50

BioReliance Study No. AD58PU.503001.BTL 51
BioReliance Study No. AD58PU.503001.BTL 52
BioReliance Study No. AD58PU.503001.BTL 53
BioReliance Study No. AD58PU.503001.BTL 54
APPENDIX III: Certificate of Analysis
BioReliance Study No. AD58PU.503001.BTL 55
BioReliance Study No. AD58PU.503001.BTL 56
APPENDIX IV: Dosing Formulation Analysis and Stability
Page 1 of 20
Bacterial Reverse Mutation Assay
Determination of 1-bromopropane in Ethanol Dosing Formulations and 1-bromopropane in 100 mM Phosphate Buffer (pH 7.4) Treatment Samples
FINAL ANALYTICAL REPORT
Test Article
1-bromopropane
Author
Philip Atkins, MChem
Final Analytical Report Date
23 September 2015
Analytical Laboratory
BioReliance Corporation 9610 Medical Center Drive
Rockville, MD 20850
BioReliance Study Number
AD58PU.503001.BTL
Sponsor
Albemarle Corporation 451 Florida Street
Baton Rouge, LA 70801
BioReliance Study No. AD58PU.503001.BTL 57
Final Analytical Report BioReliance Study No.: AD58PU.503001.BTL
2
Table of Contents Table of Contents ...............................................................................................................2
Compliance Statement .......................................................................................................3
Analytical Conditions ........................................................................................................4
Dosing Formulation and Treatment Samples Analysis ..................................................7
Stability of 1-bromopropane in Ethanol Dosing Formulations ...................................17
Conclusion ........................................................................................................................18
Deviations..........................................................................................................................18
Abbreviations and Calculations......................................................................................20
BioReliance Study No. AD58PU.503001.BTL 58
BioReliance Study No. AD58PU.503001.BTL 59
Final Analytical Report BioReliance Study No.: AD58PU.503001.BTL
4
Analytical Conditions The analysis of the test article formulation samples, 1-bromopropane in ethanol, and the treatment samples,1-bromopropane in 100 mM phosphate buffer (pH 7.4), for study AD58PU.503001.BTL was performed by Gas chromatography (GC) using a method validated under BioReliance Study Number AD58PU.GGTCHEM.BTL. The formulations were also analyzed in accordance with BioReliance SOP OPAC0385 “Dose Formulation Analysis” and OPAC0388 “Dose Formulation Stability Determination”. The analytical conditions used in this study are summarized in Table 1 and Table 2. The matrix standards were prepared per Table 3 and Table 4.
BioReliance Study No. AD58PU.503001.BTL 60

Final Analytical Report BioReliance Study No.: AD58PU.503001.BTL
5
Table 1: Analytical Conditions in Ethanol Instrument: Agilent 6890N Gas Chromatograph
Detector: Flame Ionization (FID) Software: Agilent C/S ChemStore Rev. B.03.03 and ChemStation
Revision B.02.01-SR2 software with data security add-on Diluent: Ethanol Vehicle: Ethanol
(SS) Stock Solution: 200 µg/mL Test Article in Diluent (IS) Internal Standard: p-Cymene: Ethanol (25:75, v/v) TA Correction Factor : 0.73855
TA Density: 1.354 g/mL1
Inlet Temperature: 200°C Inlet Pressure: 3 psi
Split Ratio: 1:1 Split Flow: 3.9 mL/min
Total Inlet Flow: 10.5 mL/min Inlet Gas: Helium Column: Restek RTX-624, 30m x 530 µm, 3μm film thickness
Column Flow Mode: Constant Flow Flow rate: 3.9 mL/min
Detector Temperature: 275° C Hydrogen Flow: 35 mL/min
Air Flow: 300 mL/min Detector Flow Mode: Constant Flow
Makeup Flow: 10 mL/min Makeup Gas: Helium
Syringe Needle Washes (A & B): Isopropanol (IPA) Injection Volume: 1 µL
Pre-Injection Solvent A Washes: 2 Post-Injection Solvent A Washes: 2 Pre-Injection Solvent B Washes: 2
Post-Injection Solvent B Washes: 2 Injections/Sample: 2
Run Time: 21.5 minutes Test Article Retention Time: ~6.97 minutes
Calibration Curve: y = Ax + B (not weighted) Oven Temperature Profile: Gradient (see below)
Rate (°C/min) Final Temperature (°C) Hold Time (min) 0 45 4
10 200 2 1TA measured by volume and corrected for density.
BioReliance Study No. AD58PU.503001.BTL 61

Final Analytical Report BioReliance Study No.: AD58PU.503001.BTL
6
Table 2: Analytical Conditions for Phosphate Buffer Instrument: Agilent 6890N Gas Chromatograph
Detector: Flame Ionization (FID) Software: Agilent C/S ChemStore Rev. B.03.03 and ChemStation
Revision B.02.01-SR2 software with data security add-on Diluent: Ethanol Vehicle: 100 mM Phosphate Buffer, pH 7.4
(SS) Stock Solution: 150 µg/mL Test Article in Diluent (IS) Internal Standard: p-Cymene: Ethanol (25:75, v/v) TA Correction Factor : 0.73855
TA Density: 1.354 g/mL1 Inlet Temperature: 185°C
Inlet Pressure: 3.5 psi Split Ratio: 1:1 Split Flow: 4.6 mL/min
Total Inlet Flow: 11.9 mL/min Inlet Gas: Helium Column: Restek RTX-624 30m x 530 µm, 3μm film thickness
Column Flow Mode: Constant Flow Flow rate: 4.6 mL/min
Detector Temperature: 275° C Hydrogen Flow: 35 mL/min
Air Flow: 300 mL/min Detector Flow Mode: Constant Flow
Makeup Flow: 10 mL/min Makeup Gas: Helium
Syringe Needle Washes (A & B): Isopropanol (IPA) Injection Volume: 1 µL
Pre-Injection Solvent A Washes: 2 Post-Injection Solvent A Washes: 2 Pre-Injection Solvent B Washes: 2
Post-Injection Solvent B Washes: 2 Injections/Sample: 2
Run Time: 27.5 minutes Test Article Retention Time: ~6.36 minutes
Calibration Curve: y = Ax + B (not weighted) Oven Temperature Profile: Gradient (see below)
Rate (°C/min) Final Temperature (°C) Hold Time (min) 0 45 4 5 140 2
40 200 1 1TA measured by volume and corrected for density.
BioReliance Study No. AD58PU.503001.BTL 62

Final Analytical Report BioReliance Study No.: AD58PU.503001.BTL
7
Table 3: Preparation of the Matrix Standard Solutions in Ethanol
Standard ID
IS (mL)
SS (mL)
Final Volume with Diluent
(mL)
Final TA Concentration
(µg/mL) M-0 0 0 10 0 M-I 1 0 10 0 M-1 1 1 10 20 M-2 1 2 10 40 M-3 1 3 10 60 M-4 1 4 10 80 M-5 1 5 10 100 M-6 1 6 10 120
Table 4: Preparation of the Matrix Standard Solutions in Phosphate Buffer
Standard ID
IS (mL)
SS (mL)
Vehicle (mL)
Final Volume with Diluent
(mL)
Final TA Concentration
(µg/mL) M-0 0 0 1 10 0 M-I 1 0 1 10 0 M-1 1 1 1 10 15 M-2 1 2 1 10 30 M-3 1 3 1 10 45 M-4 1 4 1 10 60 M-5 1 5 1 10 75 M-6 1 5.5 1 10 82.5
Dosing Formulation and Treatment Samples Analysis Dosing formulations of 1-bromopropane in ethanol and treatment samples of 1-bromopropane in 100 mM Phosphate Buffer, pH 7.4 were collected and analyzed by GC on the days of preparation to assess accuracy of the preparation (per Table 5). A sample of vehicle dosing solution from each experiment was also analyzed to verify that it did not contain test article. The dosing formulations and treatment samples were diluted to bring the test article concentration to a suitable level within the calibration range and with the same final composition as the matrix standards. Additional sham mix was added as necessary to all sham mix samples so the samples contained 10% sham mix by volume when analyzed. The concentration of 1-bromopropane was calculated by reference to the matrix standard solutions prepared (per Table 3 and Table 4) and analyzed concurrently with the dosing formulations and treatment samples. All matrix standard curves met the acceptance criteria (Table 6, Table 8, Table 10, Table 12, Table 14, Table 16, Table 18 and Table 20).
BioReliance Study No. AD58PU.503001.BTL 63

Final Analytical Report BioReliance Study No.: AD58PU.503001.BTL
8
For Experiment B5 analysis in ethanol performed on 13 February 2015, due to system suitability not meeting all the acceptance criteria, the analysis was restarted on 18-February 2015 using samples diluted on 13 February 2015. Based on the rerun, the high dose formulation met the acceptable range, but did not meet ≤5.00% RSD. The low dose formulation was found to be below the acceptable range and also did not meet ≤5.00% RSD. All dosing formulations analyzed met the acceptance criteria of 85.0-115.0% of target concentration and ≤5.00% RSD, except for Experiment B3 ethanol low dose sample did not meet the ≤5.00% RSD. And also for Experiment B5 ethanol samples, the high dose formulation met the acceptable range, but did not meet ≤5.00% RSD and the low dose formulation was found to be below the acceptable range and also did not meet ≤5.00% RSD. No test article was detected in the vehicle control (VC) samples, except in the vehicle control sample for the Experiment B3 in which a small peak of the test article was detected (Table 7, Table 11 , Table 15 and Table 19).
The treatment samples in 100 mM Phosphate Buffer, pH 7.4 for Experiments B1, B2, B3 and B5 were analyzed and results are shown in Table 9, Table 13, Table 17 and Table 21. No acceptance criteria were applied for the analysis of the treatment samples.
BioReliance Study No. AD58PU.503001.BTL 64

Final Analytical Report BioReliance Study No.: AD58PU.503001.BTL
9
Table 5: Summary of the Dosing Formulations
Experiment No./Phase Date of Preparation Date of Analysis
(Start/End) Concentration
(mg/mL)
Homogeneity Testing
(Y) Yes or (N) No
B1 18-Jun-2014 18-Jun-2014/ 19-Jun-2014
0 N 0.060 N 200 N
B1 (Start of Pre-Incubation) 18-Jun-2014 18-Jun-2014/
21-Jun-2014
0 N 0.95 N 9.5 N
B1 (End of Pre-Incubation) 18-Jun-2014 18-Jun-2014/
21-Jun-2014
0 N 0.95 N 9.5 N
B2 27-Jun-2014 27-Jun-2014/ 28-Jun-2014
0 N 2.0 N 200 N
B2 (Start of Pre-Incubation) 27-Jun-2014 27-Jun-2014/
29-Jun-2014
0 N 0.95 N 9.5 N
B2 (End of Pre-Incubation) 27-Jun-2014 27-Jun-2014/
29-Jun-2014
0 N 0.95 N 9.5 N
B3 24-Jul-2014 24-Jul-2014/ 26-Jul-2014
0 N 2.0 N 200 N
B3 (Start of Pre-Incubation) 24-Jul-2014 24-Jul-2014/
01-Aug-2014
0 N 0.95 N 9.5 N
B3 (End of Pre-Incubation) 24-Jul-2014 24-Jul-2014/
01-Aug-2014
0 N 0.95 N 9.5 N
B5 13-Feb-2015 13-Feb-2015/ 20-Feb-2015
0 N 20 N 200 N
B5 (Start of Pre-Incubation) 13-Feb-2015 13-Feb-2015/
19-Feb-2015
0 N 0.95 N 9.5 N
B5 (End of Pre-Incubation) 13-Feb-2015 13-Feb-2015/
19-Feb-2015
0 N 0.95 N 9.5 N
BioReliance Study No. AD58PU.503001.BTL 65
Final Analytical Report BioReliance Study No.: AD58PU.503001.BTL
10
Table 6: Matrix Standards for the B1 Dosing Formulation and Stability Analyses in Ethanol Item Value Acceptance Criterion Slope 0.0009792 NA
Intercept 0.0002397 NA Correlation Coefficient 0.9998 >0.99 Recovery % (Range) 98.4-101.4 90-110
Table 7: B1 Dosing Formulation Analysis Formulation Conc. of Conc. of TA/IS Mean Mean Target x Final Mean RSD
ID Form.1 Sample1 Peak Peak Conc. Dilution Conc. (%) (mg/mL) (µg/mL) Area Ratio Area Ratio (µg/mL) (%) Factor (mg/mL)
VC* 0 0 ND VC 0 0 ND ND NA NA 2 NA NA
0.060 A 0.060 24.00 0.02410 0.060 A 0.060 24.00 0.02430 0.060 B 0.060 24.00 0.02506 0.060 B 0.060 24.00 0.02528 0.02469 24.97 104.0 2.500 0.0624 2.32 200 A 200 100.0 0.09399 200 A 200 100.0 0.09242 200 B 200 100.0 0.09653 200 B 200 100.0 0.09701 0.09499 96.76 96.8 2000 194 2.28 *See Deviation Event #188520.
Table 8: Matrix Standards for the B1 Treatment Samples in Phosphate Buffer Item Value Acceptance Criterion Slope 0.001156 NA
Intercept -0.001312 NA Correlation Coefficient 0.9990 >0.99 Recovery % (Range) 98.5-102.0 90-110
See Deviation Event #188521
BioReliance Study No. AD58PU.503001.BTL 66
Final Analytical Report BioReliance Study No.: AD58PU.503001.BTL
11
Table 9: B1 Treatment Samples Analysis Formulation Conc. of Conc. of TA/IS Mean Mean Target x Final Mean RSD
ID Form.1 Sample1 Peak Peak Conc. Dilution Conc. (%) (mg/mL) (µg/mL) Area Ratio Area Ratio (µg/mL) (%) Factor (mg/mL)
VC (Start, T=0) 0 0 ND VC (Start, T=0) 0 0 ND ND NA NA 10 NA NA
VC (End, T=90 min) 0 0 ND VC (End, T=90 min) 0 0 ND ND NA NA 10 NA NA 0.95 (Start, T=0) A 0.95 19 0.001015 0.95 (Start, T=0) A 0.95 19 0.000757 0.95 (Start, T=0) B 0.95 19 0.001211 0.95 (Start, T=0) B 0.95 19 0.001151 0.001034 2.029 10.7 50 0.101 19.51 9.5 (Start, T=0) A 9.5 47.50 0.003080 9.5 (Start, T=0) A 9.5 47.50 0.003423 9.5 (Start, T=0) B 9.5 47.50 0.003437 9.5 (Start, T=0) B 9.5 47.50 0.003380 0.003330 4.016 8.5 200 0.803 5.06
0.95 (End, T=90 min) A 0.102 2.030 0.001077 0.95 (End, T=90 min) A 0.102 2.030 0.001065 0.95 (End,T=90 min) B 0.102 2.030 0.001504 0.95 (End,T=90 min) B 0.102 2.030 0.001605 0.001313 2.271 111.9 50.25 0.114 21.49 9.5 (End, T=90 min) A 0.803 4.016 0.004183 9.5 (End, T=90 min) A 0.803 4.016 0.004114 9.5 (End, T=90 min) B 0.803 4.016 0.004181 9.5 (End, T=90 min) B 0.803 4.016 0.004076 0.004139 4.715 117.4 200.0 0.943 1.27
1Concentrations for end of incubation samples (T=90 mins) were determined at start of incubation (T=0)
Table 10: Matrix Standards for the B2 Dosing Formulation in Ethanol
Item Value Acceptance Criterion Slope 0.001150 NA
Intercept 0.0003227 NA Correlation Coefficient 0.9965 >0.99 Recovery % (Range) 96.6-106.1 90-110
BioReliance Study No. AD58PU.503001.BTL 67
Final Analytical Report BioReliance Study No.: AD58PU.503001.BTL
12
Table 11: B2 Dosing Formulation Analysis Formulation Conc. of Conc. of TA/IS Mean Mean Target x Final Mean RSD
ID Form.1 Sample1 Peak Peak Conc. Dilution Conc. (%) (mg/mL) (µg/mL) Area Ratio Area Ratio (µg/mL) (%) Factor (mg/mL)
VC 0 0 ND VC 0 0 ND ND NA NA 2 NA NA
2.0 A 2.0 80 0.09257 2.0 A 2.0 80 0.09427 2.0 B 2.0 80 0.09529 2.0 B 2.0 80 0.09485 0.09425 81.68 102.1 25 2.04 1.26 200 A 200 100 0.1146 200 A 200 100 0.1193 200 B 200 100 0.1222 200 B 200 100 0.1194 0.1189 103.1 103.1 2000 206 2.65
Table 12: Matrix Standards for the B2 Treatment Samples in Phosphate Buffer Item Value Acceptance Criterion Slope 0.001156 NA
Intercept -0.001312 NA Correlation Coefficient 0.9990 >0.99 Recovery % (Range) 98.5-102.0 90-110
BioReliance Study No. AD58PU.503001.BTL 68

Final Analytical Report BioReliance Study No.: AD58PU.503001.BTL
13
Table 13: B2 Treatment Samples Analysis Formulation Conc. of Conc. of TA/IS Mean Mean Target x Final Mean RSD
ID Form.1 Sample1 Peak Peak Conc. Dilution Conc. (%) (mg/mL) (µg/mL) Area Ratio Area Ratio (µg/mL) (%) Factor (mg/mL)
VC (Start, T=0) 0 0 ND VC (Start, T=0) 0 0 ND ND NA NA 10 NA NA
VC (End, T=90 min) 0 0 ND VC (End, T=90 min) 0 0 ND ND NA NA 10 NA NA 0.95 (Start, T=0) A 0.95 76 0.02983 0.95 (Start, T=0) A 0.95 76 0.03361 0.95 (Start, T=0) B 0.95 76 0.03606 0.95 (Start, T=0) B 0.95 76 0.03335 0.03321 28.27 37.2 12.50 0.353 7.72 9.5 (Start, T=0) A 9.5 63.33 0.007796 9.5 (Start, T=0) A 9.5 63.33 0.007442 9.5 (Start, T=0) B 9.5 63.33 0.007178 9.5 (Start, T=0) B 9.5 63.33 0.007383 0.007450 5.847 9.2 150.0 0.877 3.45
0.95 (End, T=90 min) A 0.353 28.27 0.002891 0.95 (End, T=90 min) A 0.353 28.27 0.002845 0.95 (End,T=90 min) B 0.353 28.27 0.002989 0.95 (End,T=90 min) B 0.353 28.27 0.003143 0.002967 1.945 6.9 12.49 0.0243 4.44 9.5 (End, T=90 min) A 0.877 5.847 0.002340 9.5 (End, T=90 min) A 0.877 5.847 0.001998 9.5 (End, T=90 min) B 0.877 5.847 0.002219 9.5 (End, T=90 min) B 0.877 5.847 0.002508 0.002266 1.335 22.8 150.0 0.200 9.47
1Concentrations for end of incubation samples (T=90 mins) were determined at start of incubation (T=0)
Table 14: Matrix Standards for the B3 Dosing Formulation in Ethanol
Item Value Acceptance Criterion Slope 0.001016 NA
Intercept -0.002052 NA Correlation Coefficient 0.9931 >0.99 Recovery % (Range) 95.2-107.8 90-110
BioReliance Study No. AD58PU.503001.BTL 69
Final Analytical Report BioReliance Study No.: AD58PU.503001.BTL
14
Table 15: B3 Dosing Formulation Analysis Formulation Conc. of Conc. of TA/IS Mean Mean Target x Final Mean RSD
ID Form.1 Sample1 Peak Peak Conc. Dilution Conc. (%) (mg/mL) (µg/mL) Area Ratio Area Ratio (µg/mL) (%) Factor (mg/mL)
VC 0 0 0.01504 VC 0 0 0.01473 0.01489 16.68 NA 2 0.0334 NA
2.0 A 2.0 80 0.07185 2.0 A 2.0 80 0.07515 2.0 B 2.0 80 0.08102 2.0 B 2.0 80 0.07893 0.07674 77.55 96.9 25 1.94 5.30 200 A 200 100 0.09494 200 A 200 100 0.09590 200 B 200 100 0.09640 200 B 200 100 0.1025 0.09744 97.93 97.9 2000 196 3.52
Table 16: Matrix Standards for the B3 Treatment Samples in Phosphate Buffer Item Value Acceptance Criterion Slope 0.001004 NA
Intercept 0.001860 NA Correlation Coefficient 0.9982 >0.99 Recovery % (Range) 92.8-102.4 90-110
BioReliance Study No. AD58PU.503001.BTL 70

Final Analytical Report BioReliance Study No.: AD58PU.503001.BTL
15
Table 17: B3 Treatment Samples Analysis Formulation Conc. of Conc. of TA/IS Mean Mean Target x Final Mean RSD
ID Form.1 Sample1 Peak Peak Conc. Dilution Conc. (%) (mg/mL) (µg/mL) Area Ratio Area Ratio (µg/mL) (%) Factor (mg/mL)
VC (Start, T=0) 0 0 ND VC (Start, T=0) 0 0 ND ND NA NA 10 NA NA
VC (End, T=90 min) 0 0 ND VC (End, T=90 min) 0 0 ND ND NA NA 10 NA NA 0.95 (Start, T=0) A 0.95 76 0.007635 0.95 (Start, T=0) A 0.95 76 0.007650 0.95 (Start, T=0) B 0.95 76 0.007605 0.95 (Start, T=0) B 0.95 76 0.007368 0.007565 5.682 7.5 12.50 0.0710 1.75 9.5 (Start, T=0) A 9.5 63.333 0.004557 9.5 (Start, T=0) A 9.5 63.333 0.004415 9.5 (Start, T=0) B 9.5 63.333 0.004496 9.5 (Start, T=0) B 9.5 63.333 0.004390 0.004465 2.595 4.1 150.0 0.389 1.71
0.95 (End, T=90 min) A 0.0710 5.682 0.005515 0.95 (End, T=90 min) A 0.0710 5.682 0.005470 0.95 (End,T=90 min) B 0.0710 5.682 0.005129 0.95 (End,T=90 min) B 0.0710 5.682 0.005260 0.005344 3.470 61.1 12.50 0.0434 3.39 9.5 (End, T=90 min) A 0.389 2.595 0.003438 9.5 (End, T=90 min) A 0.389 2.595 0.003730 9.5 (End, T=90 min) B 0.389 2.595 0.003858 9.5 (End, T=90 min) B 0.389 2.595 0.003693 0.003680 1.813 69.9 149.9 0.272 4.78
1Concentrations for end of incubation samples (T=90 mins) were determined at start of incubation (T=0)
Table 18: Matrix Standards for the B5 Dosing Formulation in Ethanol Item Value Acceptance Criterion Slope 0.001018 NA
Intercept 0.004977 NA Correlation Coefficient 0.9954 >0.99 Recovery % (Range) 95.2-104.1 90-110
BioReliance Study No. AD58PU.503001.BTL 71
Final Analytical Report BioReliance Study No.: AD58PU.503001.BTL
16
Table 19: B5 Dosing Formulation Analysis Formulation Conc. of Conc. of TA/IS Mean Mean Target x Final Mean RSD
ID Form.1 Sample1 Peak Peak Conc. Dilution Conc. (%) (mg/mL) (µg/mL) Area Ratio Area Ratio (µg/mL) (%) Factor (mg/mL) 0 0 0 ND 0 0 0 ND NA NA NA 2 NA NA
20 A 20.0 100 0.07772 20 A 20.0 100 0.07672 20 B 20.0 100 0.08802 20 B 20.0 100 0.08274 0.08130 74.97 75.0 200 15.0 6.39
200 A 200 100 0.1110 200 A 200 100 0.1123 200 B 200 100 0.0910 200 B 200 100 0.0869 0.1003 93.64 93.6 2000 187 13.18
Table 20: Matrix Standards for the B5 Treatment Samples in Phosphate Buffer Item Value Acceptance Criterion Slope 0.0009698 NA
Intercept 0.0008340 NA Correlation Coefficient 0.9978 >0.99 Recovery % (Range) 96.1-103.0 90-110
BioReliance Study No. AD58PU.503001.BTL 72
Final Analytical Report BioReliance Study No.: AD58PU.503001.BTL
17
Table 21: B5 Treatment Samples Analysis Formulation Conc. of Conc. of TA/IS Mean Mean Target x Final Mean RSD
ID Form.1 Sample1 Peak Peak Conc. Dilution Conc. (%) (mg/mL) (µg/mL) Area Ratio Area Ratio (µg/mL) (%) Factor (mg/mL)
VC (Start, T=0) 0 0 ND VC (Start, T=0) 0 0 ND ND NA NA 10 NA NA
VC (End, T=90 min) 0 0 ND VC (End, T=90 min) 0 0 ND ND NA NA 10 NA NA 0.95 (Start, T=0) A 0.95 76 0.01106 0.95 (Start, T=0) A 0.95 76 0.01092 0.95 (Start, T=0) B 0.95 76 0.01062 0.95 (Start, T=0) B 0.95 76 0.01081 0.01085 10.33 13.6 12.50 0.129 1.71 9.5 (Start, T=0) A 9.5 63.333 0.003390 9.5 (Start, T=0) A 9.5 63.333 0.003351 9.5 (Start, T=0) B 9.5 63.333 0.003348 9.5 (Start, T=0) B 9.5 63.333 0.003314 0.003351 2.595 4.1 150.0 0.389 0.93
0.95 (End, T=90 min) A 0.129 10.33 0.008827 0.95 (End, T=90 min) A 0.129 10.33 0.008577 0.95 (End,T=90 min) B 0.129 10.33 0.008255 0.95 (End,T=90 min) B 0.129 10.33 0.008767 0.008607 8.015 77.6 12.49 0.100 2.99 9.5 (End, T=90 min) A 0.389 2.595 0.003791 9.5 (End, T=90 min) A 0.389 2.595 0.003823 9.5 (End, T=90 min) B 0.389 2.595 0.003706 9.5 (End, T=90 min) B 0.389 2.595 0.003820 0.003785 3.043 117.3 149.9 0.456 1.44
1Concentrations for end of incubation samples (T=90 mins) were determined at start of incubation (T=0)
Stability of 1-bromopropane in Ethanol Dosing Formulations
Stability of the dosing formulations in ethanol was determined by storing the B1 dosing formulations at room temperature for T=3.25 hours and reanalyzing as described above. The acceptance criterion of 90-110% of the concentration determined at T=0 was met (Table 22). 1-bromopropane in Ethanol, at concentrations of 0.0624 and 194 mg/mL, was stable at room temperature for at least 3.25 hours.
BioReliance Study No. AD58PU.503001.BTL 73

Final Analytical Report BioReliance Study No.: AD58PU.503001.BTL
18
Table 22: Stability T=3.25 Hours Analysis Formulation Conc. of Conc. of TA Mean Mean Target x Final Mean RSD
ID Form.1 Sample1 Peak Peak Conc. Dilution Conc. (%) (mg/mL) (µg/mL) Area Area (µg/mL) (%) Factor (mg/mL)
0.060 A 0.0624 24.97 0.02327 0.060 A 0.0624 24.97 0.02450 0.060 B 0.0624 24.97 0.02279 0.060 B 0.0624 24.97 0.02404 0.02365 23.91 95.8 2.499 0.0598 3.24 200 A 194 96.76 0.10000 200 A 194 96.76 0.09735 200 B 194 96.76 0.09807 200 B 194 96.76 0.09703 0.09811 99.95 103.3 2005 200 1.36
1Concentration determined at T=0 (Table 7)
Stability of 1-bromopropane in 100 mM Phosphate Buffer (pH 7.4)
Stability of the test article in 100 mM phosphate buffer (PH 7.4) was determined as part of BioReliance Study AD58PU.GCGTCHEM.BTL The stability of 1-bromopropane in 100 mM phosphate buffer (PH 7.4), at concentrations of 7.408, 2.778, 0.7408, 0.2778 and 0.07408 mg/mL, when stored at 37±2°C for either T=30, T=60, T=90 or T=120 minutes were attempted but could not be established, except for 0.07408 mg/mL at T=30 minutes storage which met the acceptance criterion of 90-110% of target (initial concentration at T=0).
Conclusion For the analysis of the dosing formulations, the submitted formulations were found to be accurately prepared except for Experiment B3 ethanol low dose sample did not meet the ≤5.00% RSD. And also for Experiment B5 ethanol samples, the high dose formulation met the acceptable range, but did not meet ≤5.00% RSD and the low dose formulation was found to be below the acceptable range and also did not meet ≤5.00% RSD. The vehicle control samples were free of test article, except for the Experiment B3 vehicle control sample in which a small peak of the test article was detected. The treatment samples in 100 mM Phosphate Buffer, pH 7.4 for Experiments B1, B2, B3, and B5 were collected and analyzed. Additionally, 1-bromopropane in Ethanol, at concentrations of 0.0624 and 194 mg/mL, was stable at room temperature for at least 3.25 hours.
Deviations Three deviations occurred during the conduct of this portion of the study.
BioReliance Study No. AD58PU.503001.BTL 74

Final Analytical Report BioReliance Study No.: AD58PU.503001.BTL
19
Event# 188520: During dilution of Experiment B1 vehicle control samples for analysis in ethanol, no internal standard solution was added to the samples. This deviated from BioReliance SOP OPAC0385. This deviation had no impact on the study, as no TA was detected in the vehicle, the internal standard was not needed to determine the amount of test article in the vehicle sample. Event# 188521: The M-I matrix standard was not analyzed during the analysis of matrix standards for Experiment B1 treatment samples in phosphate buffer. This deviated from BioReliance SOP OPAC0385. Based on results of the M-0 and the VC samples, there was no contamination in the analytical assay, so M-1 analysis was not actually needed to evaluate the test results. Event# 214032: The samples from the B5 assay were to be analyzed 6 times, but were instead analyzed in duplicate. This was determined to have no impact on the study. The formulations were prepared at a concentration above the maximum solubility of the test article in the dosing solvent to meet the requirements of the Ames study design. As a result there had been some variability in the previous values obtained for the achieved concentrations in formulations that were dosed in the B1, B2 and B3 assays. The reason the analysis was changed to 6x dilutions was there had been some variability in the results of the previous formulations and by analyzing 6 times it would provide more data points to evaluate the variability of the formulations that had been prepared and dosed for the Ames study. The results obtained from the B5 top concentration analysis matched exactly the B3 results, for which the concern was that the obtained value was low. In addition the %RSD for the B5 analysis of both the high and low concentrations was much lower than in the B3 trial. Therefore, analyzing in duplicate was sufficient.
BioReliance Study No. AD58PU.503001.BTL 75

Final Analytical Report BioReliance Study No.: AD58PU.503001.BTL
20
Abbreviations and Calculations Calc. = Calculated Conc. = Concentration Form = Formulation HPLC = High Performance Liquid Chromatography M = Matrix NA = Not Applicable ND =Not Detected RSD = Relative Standard Deviation T = Time TA = Test Article UV = Ultra-Violet VC = Vehicle Control The following formulas were used for the calculations: 1. Mean Concentration (µg/ mL) = (Mean Peak Area - Intercept) / Slope
Intercept and slope calculated using linear regression analysis
2. Final Mean Conc. (mg/mL) = (Mean Conc. (µg/ mL) x Dilution Factor) / 1000
3. % of Target, % Recovery = Mean Concentration x 100 Concentration of Sample 4. % RSD = Standard Deviation of the TA Peak Area x 100
Mean Peak Area
BioReliance Study No. AD58PU.503001.BTL 76
BioReliance Study No. AD58PU.503001.BTL 77
APPENDIX V: Common Technical Document Tables

2.6.7.8 Genotoxicity: In Vitro Study No: AD58PU.503001.BTL Test Article: 1-bromopropane
BioReliance Study No. AD58PU.503001.BTL 78
Test for Induction of: Reverse mutation in bacterial cells No. of Independent Assays: 3 Study No.: AD58PU.503001.BTL Species/Strain: S. typhimurium, E. coli No. of Replicate Cultures: 2 (#1) and 3 (#2 and 3) Location in CTD: Metabolizing System: Aroclor-induced rat liver S9 No. of Cells Analyzed/Culture: 1.3 to 5.7 x 10⁸
cells/plate GLP Compliance: Yes
Vehicle for Test Article: EtOH Vehicle for Positive Controls: DMSO, except sterile water for sodium azide Treatment: Preincubation (90±2 minutes at 37±2ºC) Dates of Treatment: 18 June 2014 (#1), 27 June 2014 (#2) and 24 July 2014 (#3) Cytotoxic Effects: Toxicity was observed at 5000 µg per plate with all Salmonella tester strains in the initial and confirmatory assays (#1 and 2) and beginning at 3000 or at 5000 µg per plate with all tester strains in the retest of the confirmatory assay (#3). Genotoxic Effects: None
Metabolic Activation
Test Article
Dose Level (µg/plate)
Initial Toxicity-Mutation Assay (#1) Revertant Colony Counts (Mean ±SD)
TA98 TA100 TA1535 TA1537 WP2uvrA
Without Activation
Ethanol 25 µL/plate 14 ± 1 88 ± 11 12 ± 1 9 ± 3 24 ± 1 1-bromopropane 1.5 15 ± 1 77 ± 20 12 ± 4 6 ± 0 17 ± 1
5.0 22 ± 8 84 ± 13 9 ± 3 7 ± 1 20 ± 1 15 15 ± 3 77 ± 4 7 ± 2 4 ± 4 22 ± 1 50 16 ± 2 96 ± 1 11 ± 4 8 ± 1 24 ± 1 150 22 ± 4 74 ± 6 13 ± 3 6 ± 1 19 ± 8 500 12 ± 3 106 ± 1 9 ± 1 6 ± 1 26 ± 5 1500 17 ± 1 71 ± 0 14 ± 1 5 ± 2 20 ± 4 5000 0 ± 0 0 ± 0 0 ± 0 0 ± 0 23 ± 6
2NF 1.0 761 ± 65 SA 1.0 591 ± 32 602 ± 26
9AAD 75 259 ± 81 MMS 1000 563 ± 33
Key to Positive Controls
SA 9AAD 2NF MMS
sodium azide 9-Aminoacridine 2-nitrofluorene methyl methanesulfonate

2.6.7.8 Genotoxicity: In Vitro Study No: AD58PU.503001.BTL Test Article: 1-bromopropane
BioReliance Study No. AD58PU.503001.BTL 79
Metabolic Activation
Test Article
Dose Level (µg/plate)
Initial Toxicity-Mutation Assay (#1) Revertant Colony Counts (Mean ±SD)
TA98 TA100 TA1535 TA1537 WP2uvrA
With Activation
Ethanol 25 µL/plate 29 ± 7 104 ± 0 11 ± 11 12 ± 4 27 ± 3 1-bromopropane 1.5 23 ± 2 86 ± 16 11 ± 6 10 ± 1 26 ± 6
5.0 24 ± 2 93 ± 6 9 ± 0 8 ± 1 23 ± 1 15 26 ± 11 103 ± 17 15 ± 1 11 ± 1 30 ± 1 50 20 ± 6 89 ± 1 12 ± 7 15 ± 1 28 ± 1 150 30 ± 0 100 ± 17 13 ± 0 9 ± 1 29 ± 2 500 29 ± 5 103 ± 8 6 ± 1 9 ± 3 34 ± 13 1500 27 ± 6 95 ± 16 13 ± 8 12 ± 1 32 ± 2 5000 14 ± 6 63 ± 10 10 ± 2 8 ± 4 36 ± 3
2AA 1.0 435 ± 5 52 ± 1 2AA 2.0 504 ± 60 47 ± 1 2AA 15 310 ± 2
Key to Positive Controls
2AA 2-aminoanthracene

2.6.7.8 Genotoxicity: In Vitro Study No: AD58PU.503001.BTL Test Article: 1-bromopropane
BioReliance Study No. AD58PU.503001.BTL 80
Metabolic Activation
Test Article
Dose Level (µg/plate)
Confirmatory Mutagenicity Assay (#2) Revertant Colony Counts (Mean ±SD)
TA98 TA100 TA1535 TA1537 WP2uvrA
Without Activation
Ethanol 25 µL/plate 24 ± 3 97 ± 12 13 ± 2 8 ± 3 25 ± 5 1-bromopropane 50 21 ± 3 90 ± 8 11 ± 3 11 ± 3 27 ± 3
150 19 ± 3 91 ± 8 10 ± 2 11 ± 3 32 ± 10 500 23 ± 7 80 ± 16 17 ± 1 8 ± 4 30 ± 13 1500 27 ± 1 72 ± 22 13 ± 1 6 ± 6 33 ± 3 2000 24 ± 10 65 ± 20 8 ± 4 8 ± 1 32 ± 6 3000 19 ± 7 67 ± 17 10 ± 4 7 ± 3 21 ± 5 5000 0 ± 0 0 ± 0 0 ± 0 0 ± 0 21 ± 5
2NF 1.0 624 ± 28 SA 1.0 1120 ± 55 836 ± 37
9AAD 75 312 ± 184 MMS 1000 561 ± 8
With
Activation Ethanol 25 µL/plate 14 ± 4 97 ± 9 13 ± 5 13 ± 3 31 ± 14
1-bromopropane 50 13 ± 5 106 ± 11 12 ± 5 5 ± 5 34 ± 8 150 14 ± 3 107 ± 10 12 ± 5 7 ± 4 32 ± 8 500 10 ± 1 108 ± 16 13 ± 3 6 ± 1 36 ± 1 1500 14 ± 3 85 ± 18 21 ± 8 8 ± 2 34 ± 6 2000 14 ± 1 81 ± 26 21 ± 3 7 ± 6 39 ± 11 3000 14 ± 2 79 ± 22 15 ± 3 6 ± 1 40 ± 12 5000 9 ± 3 59 ± 5 a 17 ± 1 12 ± 3 a 31 ± 2
2AA 1.0 519 ± 49 63 ± 3 2AA 2.0 328 ± 35 40 ± 7 2AA 15 334 ± 83
Key to Positive Controls
SA 2AA 9AAD 2NF MMS
sodium azide 2-aminoanthracene 9-Aminoacridine 2-nitrofluorene methyl methanesulfonate
a One replicate plate was lost due to the absence of bacterial cells (TA100) or due to contamination (TA1537). Therefore, standard deviation was calculated where n=2.
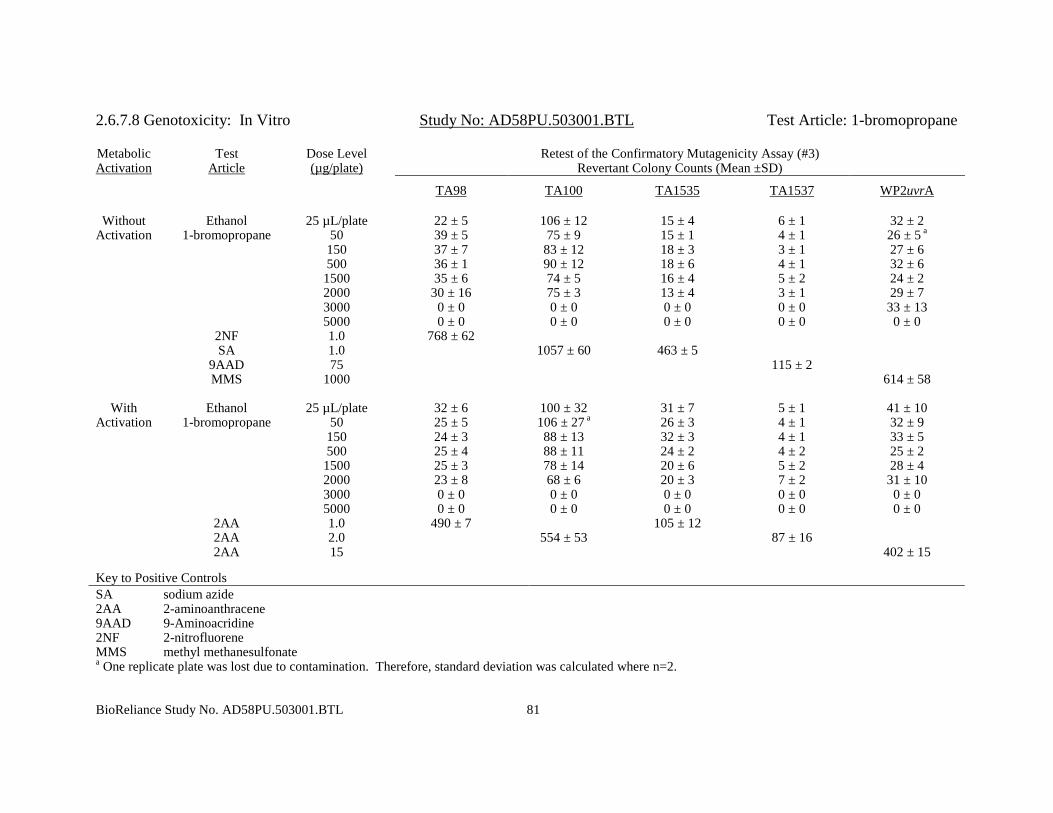
2.6.7.8 Genotoxicity: In Vitro Study No: AD58PU.503001.BTL Test Article: 1-bromopropane
BioReliance Study No. AD58PU.503001.BTL 81
Metabolic Activation
Test Article
Dose Level (µg/plate)
Retest of the Confirmatory Mutagenicity Assay (#3) Revertant Colony Counts (Mean ±SD)
TA98 TA100 TA1535 TA1537 WP2uvrA
Without Activation
Ethanol 25 µL/plate 22 ± 5 106 ± 12 15 ± 4 6 ± 1 32 ± 2 1-bromopropane 50 39 ± 5 75 ± 9 15 ± 1 4 ± 1 26 ± 5 a
150 37 ± 7 83 ± 12 18 ± 3 3 ± 1 27 ± 6 500 36 ± 1 90 ± 12 18 ± 6 4 ± 1 32 ± 6 1500 35 ± 6 74 ± 5 16 ± 4 5 ± 2 24 ± 2 2000 30 ± 16 75 ± 3 13 ± 4 3 ± 1 29 ± 7 3000 0 ± 0 0 ± 0 0 ± 0 0 ± 0 33 ± 13 5000 0 ± 0 0 ± 0 0 ± 0 0 ± 0 0 ± 0
2NF 1.0 768 ± 62 SA 1.0 1057 ± 60 463 ± 5
9AAD 75 115 ± 2 MMS 1000 614 ± 58
With
Activation Ethanol 25 µL/plate 32 ± 6 100 ± 32 31 ± 7 5 ± 1 41 ± 10
1-bromopropane 50 25 ± 5 106 ± 27 a 26 ± 3 4 ± 1 32 ± 9 150 24 ± 3 88 ± 13 32 ± 3 4 ± 1 33 ± 5 500 25 ± 4 88 ± 11 24 ± 2 4 ± 2 25 ± 2 1500 25 ± 3 78 ± 14 20 ± 6 5 ± 2 28 ± 4 2000 23 ± 8 68 ± 6 20 ± 3 7 ± 2 31 ± 10 3000 0 ± 0 0 ± 0 0 ± 0 0 ± 0 0 ± 0
5000 0 ± 0 0 ± 0 0 ± 0 0 ± 0 0 ± 0
2AA 1.0 490 ± 7 105 ± 12 2AA 2.0 554 ± 53 87 ± 16 2AA 15 402 ± 15
Key to Positive Controls
SA 2AA 9AAD 2NF MMS
sodium azide 2-aminoanthracene 9-Aminoacridine 2-nitrofluorene methyl methanesulfonate
a One replicate plate was lost due to contamination. Therefore, standard deviation was calculated where n=2.


![A novel de novo KIF21A mutation in a patient with congenital ...using real-time allelic discrimination assay (TaqMan SNP Genoptyping Assay; Life Technologies) [16]. RESULTS Clinical](https://img.pdfslide.us/doc/110x75/609cd4cd0612d22aec2e9c10/a-novel-de-novo-kif21a-mutation-in-a-patient-with-congenital-using-real-time.jpg)