Embed Size (px)
Citation preview
Chapter 10
© 2012 Silva and Echeverrigaray, licensee InTech. This is an open access chapter distributed under the terms of the Creative Commons Attribution License (http://creativecommons.org/licenses/by/3.0), which permits unrestricted use, distribution, and reproduction in any medium, provided the original work is properly cited.
Bacterial Promoter Features Description and Their Application on E. coli in silico Prediction and Recognition Approaches
Scheila de Avila e Silva and Sergio Echeverrigaray
Additional information is available at the end of the chapter
http://dx.doi.org/10.5772/48149
1. Introduction
The determination of when and how genes are “turned on and off” is a challenge in pos-genomic era. Differences between two species are closer to gene expression and regulation than to gene structures (Howard & Benson, 2002). The first and key step in gene expression is promoter recognition by RNA polymerase enzyme (RNAP). The promoter sequences can be defined as cis-acting elements located upstream of the transcription start site (TSS) of open reading frames (ORF). To make an analogy, genes represent the “computer memory” and promoters represent the “computer program” which acts on that memory. The study about promoters can assist in providing new models about the constitution of the computer program and how it operates (Howard & Benson, 2002).
The proper regulation of transcription is crucial for a single-cell prokaryote since its environment can change dramatically and instantly (Huffmann & Brennan, 2002). In face of this, the detailing of the principals and the organization of transcriptional process is helpful for understanding the complexity of biological systems involved, for instance, cellular responses to environmental changes or in the molecular bases of many diseases caused by microbes (Janga & Collado-Vides, 2007).
While several sequenced genomes have their protein-coding gene repertoire well described, the accurate identification and delineation of cis-regulatory elements remain elusive (Fauteux et al., 2008). At this moment, the challenges are to analyze the available sequences and to locate TSS, promoters and other regulatory sequences (Askary et al., 2009). The purpose of this review is to provide a brief survey of promoter sequences characteristics and the advances of computer algorithms for their analysis and prediction. This chapter is organized in two main sections. The established knowledge about biological features of the
Bioinformatics 242
promoters will be described in the first section, focusing in their genetic role and sequence content constitution. This is an important topic for understanding the intrinsic difficulties in the in silico promoter prediction approaches. The second section is devoted to give a reasonably concise background of the most used methodologies for E. coli promoter prediction and recognition, presenting their applications, as well as their limitations.
2. The bacterial promoter sequences
A common feature of the transcriptional regulators is their ability to recognize specific DNA patterns in order to modulate gene expression (Jacques et al., 2006). The upstream regulatory region of the bacterial coding regions contains the promoter, that is, the DNA sequence which determines specific recognition by RNAP (Barrios et al., 1999). The following section presents a concerned description about the promoter sequences and their role as gene expression regulators.
2.1. Promoter sequences and gene expression specificity
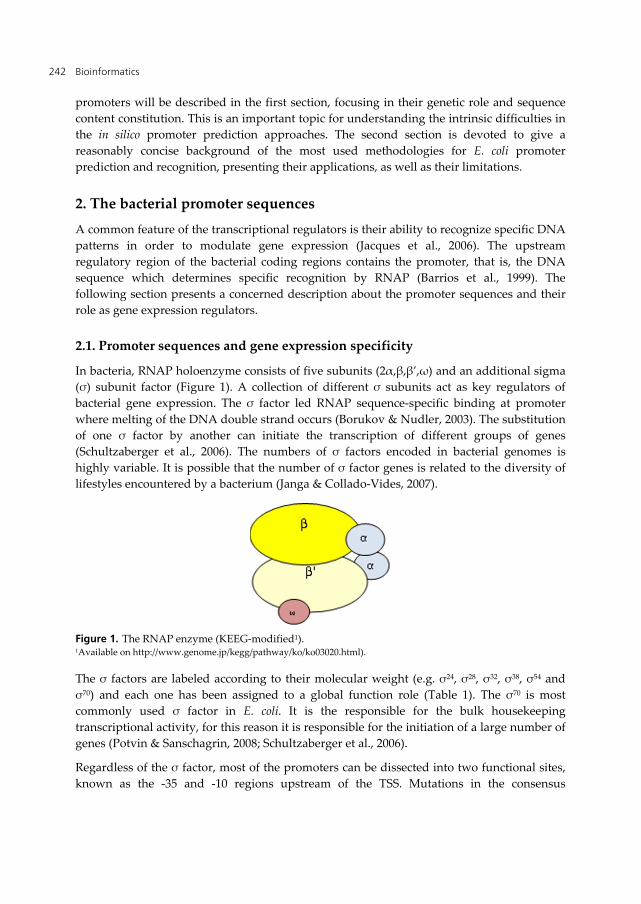
In bacteria, RNAP holoenzyme consists of five subunits (2α,β,β’,ω) and an additional sigma (σ) subunit factor (Figure 1). A collection of different σ subunits act as key regulators of bacterial gene expression. The σ factor led RNAP sequence-specific binding at promoter where melting of the DNA double strand occurs (Borukov & Nudler, 2003). The substitution of one σ factor by another can initiate the transcription of different groups of genes (Schultzaberger et al., 2006). The numbers of σ factors encoded in bacterial genomes is highly variable. It is possible that the number of σ factor genes is related to the diversity of lifestyles encountered by a bacterium (Janga & Collado-Vides, 2007).
Figure 1. The RNAP enzyme (KEEG-modified1). 1Available on http://www.genome.jp/kegg/pathway/ko/ko03020.html).
The σ factors are labeled according to their molecular weight (e.g. σ24, σ28, σ32, σ38, σ54 and σ70) and each one has been assigned to a global function role (Table 1). The σ70 is most commonly used σ factor in E. coli. It is the responsible for the bulk housekeeping transcriptional activity, for this reason it is responsible for the initiation of a large number of genes (Potvin & Sanschagrin, 2008; Schultzaberger et al., 2006).
Regardless of the σ factor, most of the promoters can be dissected into two functional sites, known as the -35 and -10 regions upstream of the TSS. Mutations in the consensus
Bacterial Promoter Features Description and Their Application on E. coli in silico Prediction and Recognition Approaches 243
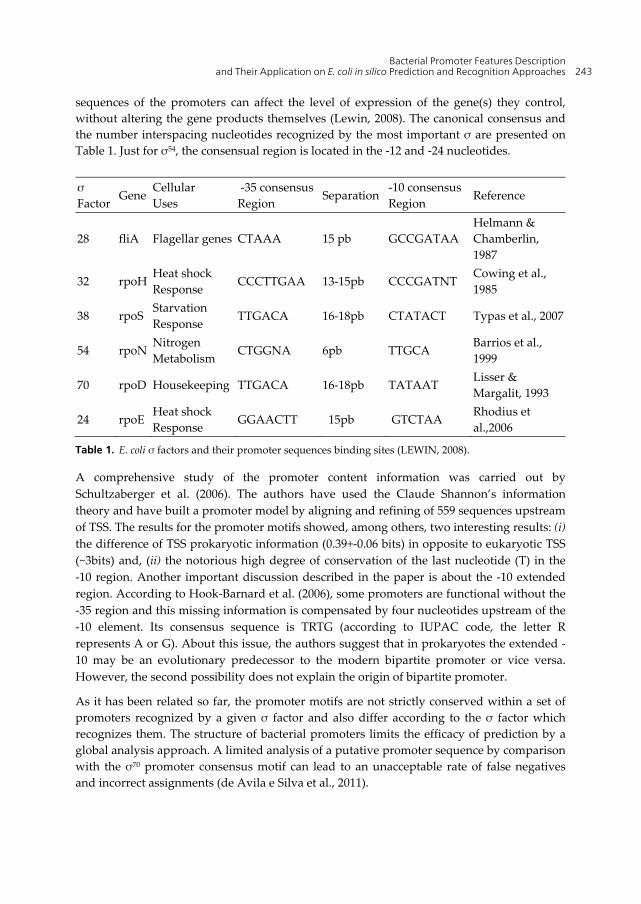
sequences of the promoters can affect the level of expression of the gene(s) they control, without altering the gene products themselves (Lewin, 2008). The canonical consensus and the number interspacing nucleotides recognized by the most important σ are presented on Table 1. Just for σ54, the consensual region is located in the -12 and -24 nucleotides.
σ Factor
Gene Cellular Uses
-35 consensusRegion Separation
-10 consensus Region
Reference
28 fliA Flagellar genes CTAAA 15 pb GCCGATAA Helmann & Chamberlin, 1987
32 rpoH Heat shock Response
CCCTTGAA 13-15pb CCCGATNT Cowing et al., 1985
38 rpoS Starvation Response
TTGACA 16-18pb CTATACT Typas et al., 2007
54 rpoN Nitrogen Metabolism
CTGGNA 6pb TTGCA Barrios et al., 1999
70 rpoD Housekeeping TTGACA 16-18pb TATAAT Lisser & Margalit, 1993
24 rpoE Heat shock Response
GGAACTT 15pb GTCTAA Rhodius et al.,2006
Table 1. E. coli σ factors and their promoter sequences binding sites (LEWIN, 2008).
A comprehensive study of the promoter content information was carried out by Schultzaberger et al. (2006). The authors have used the Claude Shannon’s information theory and have built a promoter model by aligning and refining of 559 sequences upstream of TSS. The results for the promoter motifs showed, among others, two interesting results: (i) the difference of TSS prokaryotic information (0.39+-0.06 bits) in opposite to eukaryotic TSS (~3bits) and, (ii) the notorious high degree of conservation of the last nucleotide (T) in the -10 region. Another important discussion described in the paper is about the -10 extended region. According to Hook-Barnard et al. (2006), some promoters are functional without the -35 region and this missing information is compensated by four nucleotides upstream of the -10 element. Its consensus sequence is TRTG (according to IUPAC code, the letter R represents A or G). About this issue, the authors suggest that in prokaryotes the extended -10 may be an evolutionary predecessor to the modern bipartite promoter or vice versa. However, the second possibility does not explain the origin of bipartite promoter.
As it has been related so far, the promoter motifs are not strictly conserved within a set of promoters recognized by a given σ factor and also differ according to the σ factor which recognizes them. The structure of bacterial promoters limits the efficacy of prediction by a global analysis approach. A limited analysis of a putative promoter sequence by comparison with the σ70 promoter consensus motif can lead to an unacceptable rate of false negatives and incorrect assignments (de Avila e Silva et al., 2011).
Bioinformatics 244
2.2. Structural properties of promoter sequences
The motifs obtained from promoter sequences compilation are indicative of the existence of a nucleotide signal in them. Nonetheless, it also been demonstrated that primary DNA sequence is not the only source of information in the genome for the transcription regulatory process (Olivares-Zavaleta et al., 2006). According to many authors (e.g, Kanhere & Bansal, 2005a; Klaiman et al., 2009; Wang & Benham, 2006), not only regulatory sequences contain specific sequence elements that serve as target for interacting proteins, but also present different properties, such as: suitable geometrical arrangement of DNA (curvature), propensity to adopt a deformed conformation facilitating the protein binding (flexibility) and physical properties (e.g., stacking energy, stability, stress-induced duplex destabilization). Several studies have reported that eukaryotic and prokaryotic σ70-dependent promoter sequences have lower stability, higher curvature and lesser flexibility than coding sequences (Gabrielian & Bolshoy, 1999; Kanhere & Bansal, 2005a).
DNA stability is a sequence-dependent property based on the sum of the interactions between the dinucleotides of a given sequence. It is possible to calculate the DNA duplex stability and to predict the melting behavior if the contribution of each nearest-neighbor interaction is known (SantaLucia & Hicks, 2004). A eukaryotic and prokaryotic promoter stability analysis was carried out by Kanhere & Bansal (2005a). The authors reported that promoters from three bacteria which have different genome composition (A+T composition: E. coli 0.49, B. subtilis 0.56 and C. glutamicum 0.46) show low stability peak around the -10 region. It is also reported that the average stability of upstream region is lower than the average stability of downstream region.
Intrinsic DNA curvature and bendability were shown to be important as physical basis in many biological processes, in particular in those which have interaction of DNA with DNA-binding site proteins, such as transcription initiation and termination, DNA origins of replication and nucleosome positioning (Gabrielian & Bolshoy, 1999; Jáuregui et al., 2003; Nickerson & Achberger, 1995; Thiyagarajan et al., 2006). Specifically, bending is related with twists and short bends of approximately 3 base-pairs, while curvature refers to loops and arcs involving around 9 base-pairs (Holloway et al., 2007). DNA curvature in prokaryotes is usually present upstream of the promoter but sometimes within the promoter sequence (Jáuregui et al., 2003; Kozobay-Avraham et al., 2006). The distribution of curved DNA in promoter regions is evolutionarily preserved, since orthologous groups of genes with highly curved upstream regions were identified (Kozobay-Avraham et al., 2006). As related by Pandey & Krishnamachari (2006), sequences derived from non-coding regions had similar overall base composition but different curvature values from promoter regions, indicating that the differences in curvature values are not just the consequence of base composition but also the organization of bases in sequences.
Another DNA feature that can distinguish promoter sequences is stress-induced DNA duplex destabilization (SIDD). According to Wang & Benham (2006), SIDD is not directly related to primary sequence alone, nor equivalent to stability of DNA double helix. In this complex process, the differences between the energy cost of strand separation for the
Bacterial Promoter Features Description and Their Application on E. coli in silico Prediction and Recognition Approaches 245
specific base pairs involved and the energy benefit from fractional relaxation of the superhelical stress provides the energies that govern SIDD. Promoters are strongly associated with regions of low SIDD energy. Certain non-coding regions containing promoters or terminators are unstable, while transcripted regions remain stably duplexed under the stress imposed by negative superhelicity. The change of the level of superhelicity on a promoter region can shows a variety of effects on the expression of the genes it encodes (Wang & Benham, 2006).
As related so far, the promoters present organizational properties which, in different scales, may play a significant role in the transcription process. Recent studies have reported promising results using DNA structural or biophysical properties as predictors of promoter regions, either alone or associated with the sequence composition. A concerned description of these approaches and their results will be presented in the next section.
3. In silico promoter prediction
In silico promoters prediction and recognition is an active research topic in molecular biology and a challenge in bioinformatics. The correct classification of a given DNA sequence as promoter or non promoter improves genome annotation and allows generating hypotheses in the context of the bacterial transcription initiation process and gene function (de Avila e Silva et al., 2011; Jacques et al., 2006).
Experimental methods applied to the identification of promoters by molecular methods can be laborious, time-consuming and expensive. Consequently, it is important to develop algorithms that can rapidly and accurately evaluate the presence of promoters (Jacques et al., 2006; Li & Lin, 2006). A variety of in silico techniques have been used to identify TSS and to characterize σ factor-DNA interactions. Despite the wide range of research carried out in promoter prediction, these techniques are still not fully developed, particularly for genome scale applications. Currently, many programs for promoters and TSS prediction are available. However, their results are not completely satisfactory due to their rate of false positive predictions (Askary et al., 2008; Li & Lin, 2006). An overview about how to evaluate a classification performance of a given approach and the results of some published papers especially devoted to improve promoter prediction will be described in the following sections.
3.1. Performance measures for the evaluation of promoter classification programs
A classification model (or classifier) is a mapping from instances of predicted classes (Fawcett, 2006). The promoter prediction problem is a kind of binary classification, as the input sequence can be classified in only one class of two non-overlapping classes (Sokolova & Lapalme, 2009). The result of a classifier during testing is based on the counting of the correct and incorrect classifications from each class (Bradley, 1997). In this way, the four possible outcomes of a classification model evaluate this correctness (Bradley, 1997; Fawcett, 2006; Sokolova & Lapalme, 2009):
Bioinformatics 246
i. TP: promoter sequences classified as promoter (true positive); ii. TN: non-promoter sequences recognized as non-promoters (true negative); iii. FP: non-promoter sequences classified as promoter (false positive); iv. FN: promoters classified as non-promoter sequences (false negative).
This information is then normally displayed in a two-by-two confusion matrix (Table 2). A confusion matrix is a form of contingency table showing the differences between the true and predicted classes for a set of labeled examples (Bradley, 1997).
Data Class Classified as promoter Classified non-promoter
Promoter True positive (TP) False negative (FN) Non-promoter False positive (FP) True negative (TN)
Table 2. Confusion matrix for classification results
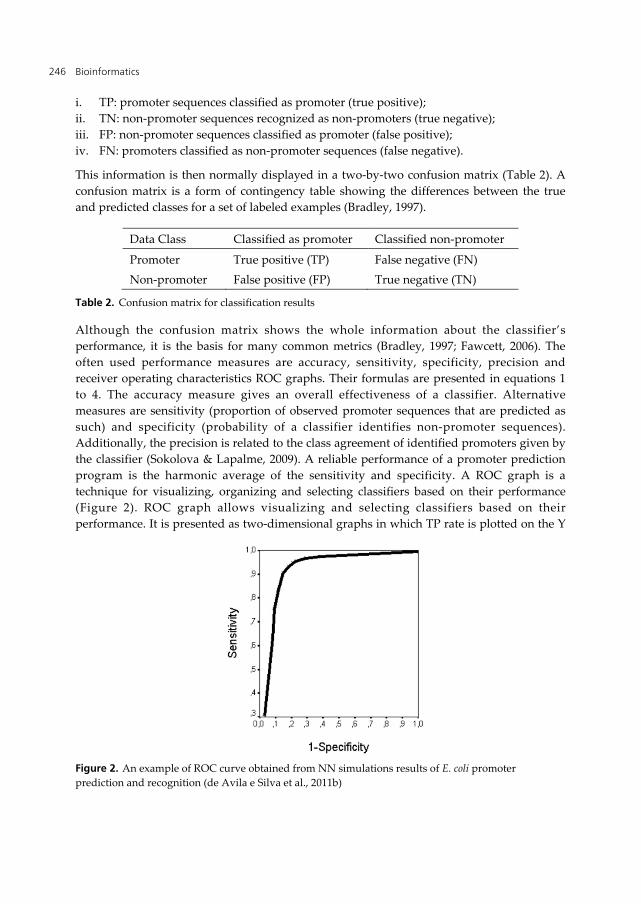
Although the confusion matrix shows the whole information about the classifier’s performance, it is the basis for many common metrics (Bradley, 1997; Fawcett, 2006). The often used performance measures are accuracy, sensitivity, specificity, precision and receiver operating characteristics ROC graphs. Their formulas are presented in equations 1 to 4. The accuracy measure gives an overall effectiveness of a classifier. Alternative measures are sensitivity (proportion of observed promoter sequences that are predicted as such) and specificity (probability of a classifier identifies non-promoter sequences). Additionally, the precision is related to the class agreement of identified promoters given by the classifier (Sokolova & Lapalme, 2009). A reliable performance of a promoter prediction program is the harmonic average of the sensitivity and specificity. A ROC graph is a technique for visualizing, organizing and selecting classifiers based on their performance (Figure 2). ROC graph allows visualizing and selecting classifiers based on their performance. It is presented as two-dimensional graphs in which TP rate is plotted on the Y
Figure 2. An example of ROC curve obtained from NN simulations results of E. coli promoter prediction and recognition (de Avila e Silva et al., 2011b)
Bacterial Promoter Features Description and Their Application on E. coli in silico Prediction and Recognition Approaches 247
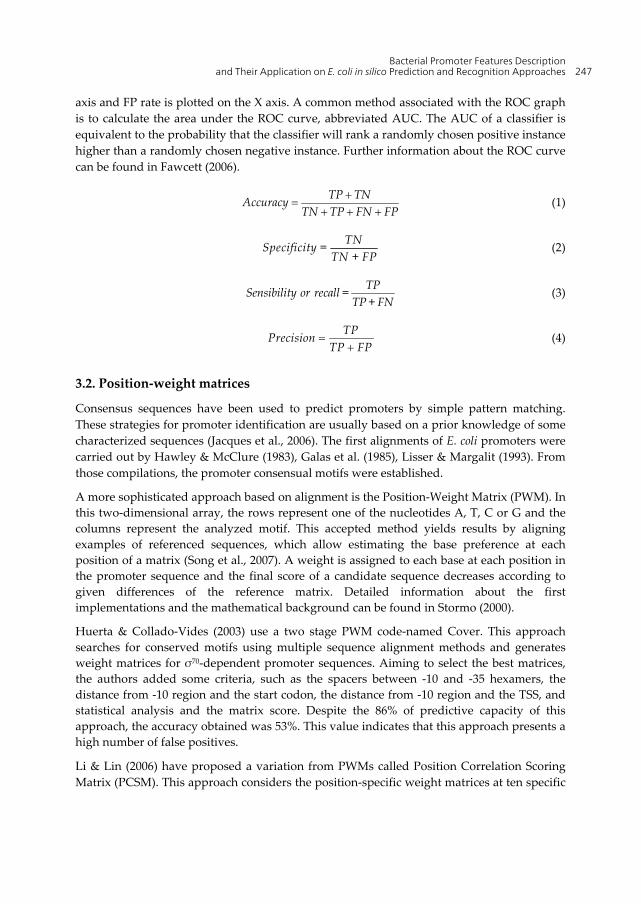
axis and FP rate is plotted on the X axis. A common method associated with the ROC graph is to calculate the area under the ROC curve, abbreviated AUC. The AUC of a classifier is equivalent to the probability that the classifier will rank a randomly chosen positive instance higher than a randomly chosen negative instance. Further information about the ROC curve can be found in Fawcett (2006).
TP TNAccuracy
TN TP FN FP
(1)
TNSpecificity =
TN + FP (2)
TPSensibility or recall =
TP+FN (3)
TPPrecision
TP FP
(4)
3.2. Position-weight matrices
Consensus sequences have been used to predict promoters by simple pattern matching. These strategies for promoter identification are usually based on a prior knowledge of some characterized sequences (Jacques et al., 2006). The first alignments of E. coli promoters were carried out by Hawley & McClure (1983), Galas et al. (1985), Lisser & Margalit (1993). From those compilations, the promoter consensual motifs were established.
A more sophisticated approach based on alignment is the Position-Weight Matrix (PWM). In this two-dimensional array, the rows represent one of the nucleotides A, T, C or G and the columns represent the analyzed motif. This accepted method yields results by aligning examples of referenced sequences, which allow estimating the base preference at each position of a matrix (Song et al., 2007). A weight is assigned to each base at each position in the promoter sequence and the final score of a candidate sequence decreases according to given differences of the reference matrix. Detailed information about the first implementations and the mathematical background can be found in Stormo (2000).
Huerta & Collado-Vides (2003) use a two stage PWM code-named Cover. This approach searches for conserved motifs using multiple sequence alignment methods and generates weight matrices for σ70-dependent promoter sequences. Aiming to select the best matrices, the authors added some criteria, such as the spacers between -10 and -35 hexamers, the distance from -10 region and the start codon, the distance from -10 region and the TSS, and statistical analysis and the matrix score. Despite the 86% of predictive capacity of this approach, the accuracy obtained was 53%. This value indicates that this approach presents a high number of false positives.
Li & Lin (2006) have proposed a variation from PWMs called Position Correlation Scoring Matrix (PCSM). This approach considers the position-specific weight matrices at ten specific
Bioinformatics 248
positions for the promoter. A PCSM for promoter and another for non-promoter training sequences sets have been computed. For classifying a new test sequence, the resulted scores from promoter and negative PCSM were used. Based on those scores, the sequence was identified as promoter only if the score was higher for positive PCSM. The results achieved in this paper present sensitivity of 91% and specificity of 81%. In order to predict promoters in the whole genome, the PCSM was applied and all the 683 experimentally identified σ70-dependent promoter sequences were successfully predicted. Besides that, 1567 predictions were considered as probable promoters.
To predict σ28 promoter-dependent sequences of ten gamma-proteobacteria species, Song et al. (2007) carried out an alternative approach based on PWM named as Position Specific Score Matrix (PSSM). The species chosen were E. coli, Bacillus subtilis, Campylobacter jejuni, Helicobacter pylori, Streptomyces coelicolor, Corynebacterium glutamicum, Vibrio cholera, Shewanella oneidensis, Xanthomonas oryzae and Xanthomonas campestris. This approach involved two steps: (i) a simple pattern-matching with the short E. coli σ28 promoter consensus sequence (TAAAG-N14-GCCGATAA) for predicting σ28 promoters upstream of mobility and chemotaxis genes in test species; (ii) these predicted promoters were used to generate a preliminary PSSM for each species. The total length of DNA analyzed for each bacteria was between 4 x 10⁵ bp and 7 x 10⁵ bp. The cut-off values chosen were set to control the false positive rate at 1 every 5 x 10⁵ bp of sequence analyzed using random DNA sequence of 5 x 10⁷ pb. Although the performance measures were not present by the authors, this paper is devoted to predict other promoter sequences than those recognized by σ70 and it shows interesting results about the σ28 consensual promoter sequences.
PWM models are commonly used because they are a simple predictive approach. Moreover, they are a convenient way to account for the fact that some positions are more conserved, than others (Stormo, 2000). However, in a large number of sequences the consensus can be insufficiently conserved, that is, they present insertions, deletions, variable spacing between elements or they are difficult to define. In such cases, this approach yield many false predictions (Kalate et al., 2003). Another limitation is the assumption that the occurrence of a given nucleotide at a position is independent of the occurrence of nucleotides at other positions (Stormo, 2000). Additionally, the use of this approach is highly influenced by the cut-off value chosen, since low cut-off values encourage a high false positive rate, while high cut-off values encourage a high false-negative rate (Song et al., 2007).
3.3. Machine Learning
Machine Learning (ML) concerns the development of computer algorithms which allow the machine to learn from examples. The classification (or pattern recognition) is an important application of ML techniques in bioinformatics due to their capability of capturing hidden knowledge from data. This is possible to achieve even if the underlying relationships are unknown or hard to describe. Additionally, they can recognize complex patterns in an automatic way or distinguish exemplars based on these patterns (Cen et al., 2010; Sivarao et al., 2010).
Bacterial Promoter Features Description and Their Application on E. coli in silico Prediction and Recognition Approaches 249
ML approaches usually split the data set into training and test groups. They learn from examples (training data), and the set of examples, which were not exposed to the classifier in the training process, are used to test the classification model. Among all ML techniques, Support Vector Machines (SVM) and Artificial Neural Network (ANN) applications have produced promising results in the promoter prediction problem. For this reason, the purpose of this section is to provide an explanation about the basic ideas of these two ML approaches.
3.3.1. Support vector machines
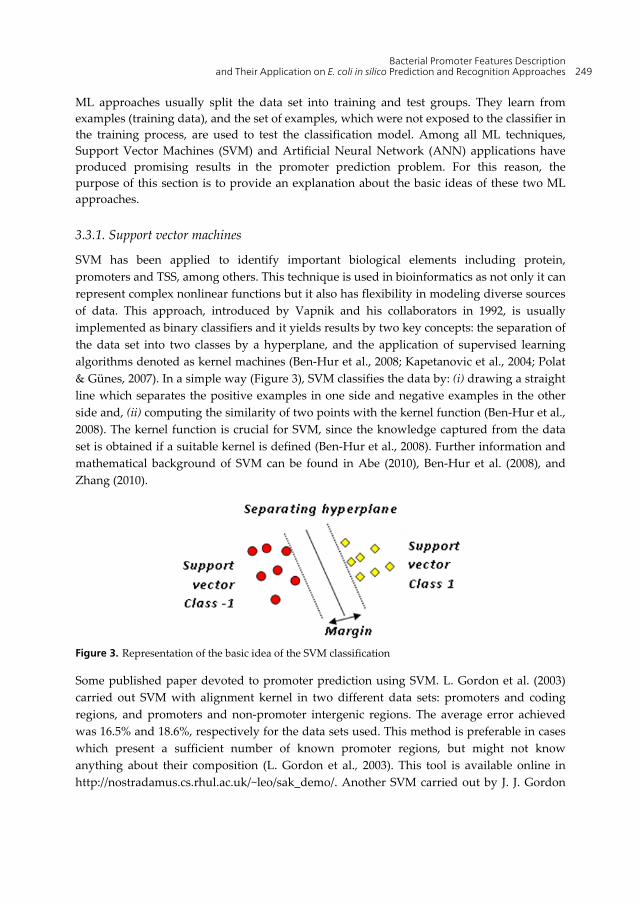
SVM has been applied to identify important biological elements including protein, promoters and TSS, among others. This technique is used in bioinformatics as not only it can represent complex nonlinear functions but it also has flexibility in modeling diverse sources of data. This approach, introduced by Vapnik and his collaborators in 1992, is usually implemented as binary classifiers and it yields results by two key concepts: the separation of the data set into two classes by a hyperplane, and the application of supervised learning algorithms denoted as kernel machines (Ben-Hur et al., 2008; Kapetanovic et al., 2004; Polat & Günes, 2007). In a simple way (Figure 3), SVM classifies the data by: (i) drawing a straight line which separates the positive examples in one side and negative examples in the other side and, (ii) computing the similarity of two points with the kernel function (Ben-Hur et al., 2008). The kernel function is crucial for SVM, since the knowledge captured from the data set is obtained if a suitable kernel is defined (Ben-Hur et al., 2008). Further information and mathematical background of SVM can be found in Abe (2010), Ben-Hur et al. (2008), and Zhang (2010).
Figure 3. Representation of the basic idea of the SVM classification
Some published paper devoted to promoter prediction using SVM. L. Gordon et al. (2003) carried out SVM with alignment kernel in two different data sets: promoters and coding regions, and promoters and non-promoter intergenic regions. The average error achieved was 16.5% and 18.6%, respectively for the data sets used. This method is preferable in cases which present a sufficient number of known promoter regions, but might not know anything about their composition (L. Gordon et al., 2003). This tool is available online in http://nostradamus.cs.rhul.ac.uk/~leo/sak_demo/. Another SVM carried out by J. J. Gordon
Bioinformatics 250
et al. (2006) made a joint prediction of E. coli TSS and promoter region. Their approach was based on an ensemble SVM with a variant of string kernel. This classifier combines a PWM and a model based on the distribution of distances from TSS to gene start. They have achieved results close to those previously described in the literature (average error rate of 11.6%). The authors report that their results open up the application of SVM on the prediction and recognition of special categories of regulatory motifs. Moreover, the authors also claim that this model can be broad to other bacterial species which present similar consensus sequences and TSS location.
By using a combination of feature selection and least square support vector machine (LSSVM), Polat and Günes (2007) have proposed an approach named FS_LSSVM based in two steps. In the first step, the feature selection process was carried out aiming to reduce the dimensionality of E. coli promoter sequences with the use of C4.5 decision tree rules. As a result, the data set, which originally presented 57 attributes, was reduced to 4 attributes. After this process, the second step made the prediction of promoter sequences with the application of the LSSVM algorithm. The success rate (capability of recognizing promoter sequences) of this approach was of 100%. In face of this result, the authors claim that FS_LSSVM has the highest success rate and can be helpful in the promoter prediction and recognition issue. Nonetheless, this approach was carried out in a small data set (53 promoters and 53 non-promoters sequences) which does not represent the available entire set of E. coli σ70-dependent promoter sequences (600 sequences experimental identified, approximately). In a small data set, the lack of conservation that characterizes bacterial promoter sequences cannot be detected, explaining the high efficiency reported.
The SVM algorithms present many advantages in their use when compared with other methods. First of all, SVM produces a unique solution since it is basically a linear problem. Second, SVM is able to deal with very large amounts of dissimilar information. Third, the discriminant function is characterized by only a comparatively small subset of the entire training data set, thus making the computations noticeably faster (Kapetanovic et al., 2004). On the other hand, a problem of SVM is its slow training, as it is trained by solving a quadratic programming problem with the number of variables equal to the number of training data (Abe, 2010).
3.3.2. Artificial Neural Networks
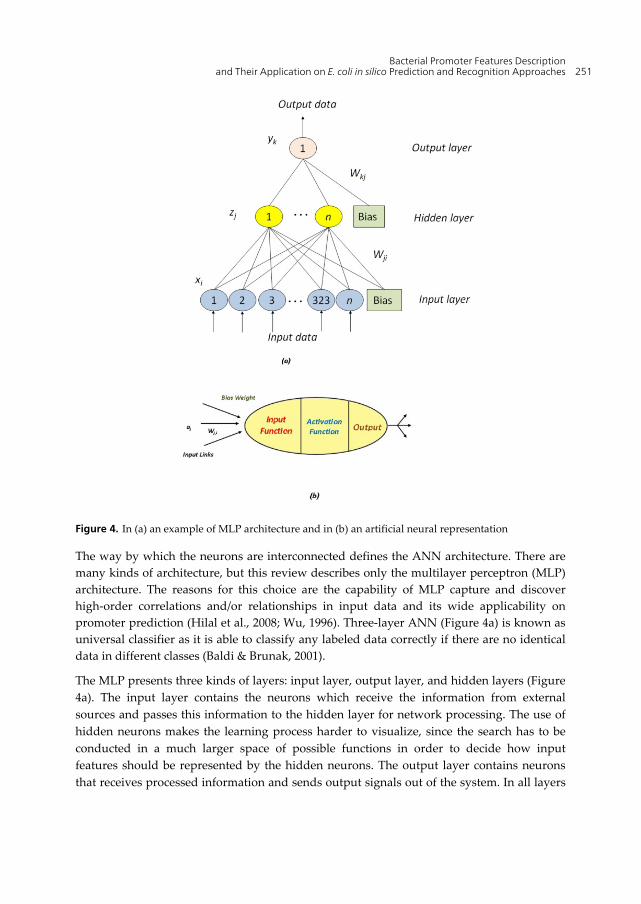
The artificial neural networks (ANN) are powerful computational tools inspired (they are not a faithful models of biological neural or cognitive phenomena) on the structure and behavior of biological neurons (Hilal et al., 2008; Wu, 1996). As in the human brain, the basic unit of ANN is called artificial neuron (Figure 4b), and it can be considered as a processing unit which performs a weighted sum of inputs (Hilal et al., 2008). In a simplest form, ANN can be viewed as a graphical model consisting of networks with interconnected units. The connection from a unit j to unit i usually has a weight denoted by Wij. The weights represent information being used by the net to solve a problem (Wu, 1996).
Bacterial Promoter Features Description and Their Application on E. coli in silico Prediction and Recognition Approaches 251
Figure 4. In (a) an example of MLP architecture and in (b) an artificial neural representation
The way by which the neurons are interconnected defines the ANN architecture. There are many kinds of architecture, but this review describes only the multilayer perceptron (MLP) architecture. The reasons for this choice are the capability of MLP capture and discover high-order correlations and/or relationships in input data and its wide applicability on promoter prediction (Hilal et al., 2008; Wu, 1996). Three-layer ANN (Figure 4a) is known as universal classifier as it is able to classify any labeled data correctly if there are no identical data in different classes (Baldi & Brunak, 2001).
The MLP presents three kinds of layers: input layer, output layer, and hidden layers (Figure 4a). The input layer contains the neurons which receive the information from external sources and passes this information to the hidden layer for network processing. The use of hidden neurons makes the learning process harder to visualize, since the search has to be conducted in a much larger space of possible functions in order to decide how input features should be represented by the hidden neurons. The output layer contains neurons that receives processed information and sends output signals out of the system. In all layers
Bioinformatics 252
there is a bias input which provides a threshold for the activation of neurons (Hilal et al., 2008). The neurons in a given layer are fully connected by weights with the neurons on the adjacent layer. Each layer is comprised of a determined number of neurons. The number of input neurons corresponds to the number of input variables into the ANN, and the number of output neurons is the same as the number of desired output variables. The number of neurons in the hidden layer(s) depends on the application of the network (Hilal et al., 2008).
MLPs have been applied successfully to solve many problems by training them in a supervised way with a highly popular algorithm known as back-propagation (Wu, 1996). This algorithm is the most widely used to adjust the connection weights. During the training of multilayer neural networks classifiers, the weights are usually corrected so that the sum of squares error between the network outputs and the desired output are minimized (Abe, 2010).
The first NN promoter prediction, as presented by Demeler and Zhou (1991), had simple architecture and the results showed high accuracy and false positive rate. More complex architectures were applied by Mahadevan and Ghosh (1994), who used a combination of two ANN to identify E. coli promoters of all spacing classes (15 to 21 bases). The first ANN was used to predict the consensus motifs, while the second was designed to predict the entire sequence containing varying spacer lengths. Since the second NN used the information of the entire sequence, there were possible dependencies between the bases in various positions. This procedure presents as result a poor prediction (recall). To predict and find relevant signals related to TSS, Pedersen and Engelbrecht (1995) devised two ANN with different windows on the input data. An interesting result obtained from the sequence content information analysis suggests that important regions for promoter recognition include more positions on the DNA than usually assumed (-10 and -35 region). In spite of the high false positive rate, the interesting idea of both papers was to measure the relative information and the dependencies between bases in various positions. A comprehensive summary of the first ANNs application on promoter prediction can be obtained from Wu (1997).
Neural Networks Promoter Prediction (NNPP) is - up to now - one of the few online available tools (http://www.fruitfly.org/seq_tools/promoter.html). NNPP was originally developed to predict core promoter regions in Drosophila melanogaster (Reese, 2001). However, this tool was also trained to predict E. coli promoter sequences. NNPP is based on a neural network where the prediction for each promoter sequence element is combined in time-delay neural networks for a complete promoter site prediction (Reese, 2001). An improved version of NNPP was obtained by addition of the distance between the TSS and TLS (Burden et al., 2005). Despite the improved sensitivity (86%), the NNPP approach gives a large number of false positives (precision 54%).
DNA promoter information, other than nucleotide composition, was used as ANN input data by several authors. Rani et al. (2007) propose a global feature extraction scheme which extracts an average signal from the entire promoter sequence of 80 bp length. The resulting signal was composed by a combination of promoter dinucleotides. After this procedure,
Bacterial Promoter Features Description and Their Application on E. coli in silico Prediction and Recognition Approaches 253
MLP training was carried out with the promoter signal as positive examples and four different negative data sets: (i) genes, (ii) genes and non-promoter intergenic sequences, (iii) 60% AT reach random sequences and (iv) 50% AT reach random sequences. The specificity values for each data set were 79%, 88%, 98% and 99%, respectively. For the sensitivity, the results achieved were 80%, 63%, 93% and 95%. After the ANN results simulations, the authors spliced the promoter data in two linearly separable groups: a major data set and a minor data set. The first group was composed by sequences which were correctly classified by ANN, and the misclassified sequences were grouped in the minor data set. Although it was possible to separate the sequences in two groups, both set of promoter sequences showed a similar signal in the dinucleotide space. The authors claim that the feature extraction and classification methods are generic enough to be applied to the more complex problem of eukaryotic promoter recognition. Although highly efficient, this approach is limited to the AT-rich sigma sequences like σ70, as showed by the promoter sequence description obtained from de Avila e Silva et al. (2011).
By using an ANN architecture fed by difference in DNA stability values between upstream and downstream regions in vicinity of known TSS, Askary et al. (2009) presented an approach named N4 devoted to E. coli TSS prediction. In this paper, the ANN input sequence slides a 414-nucleotides window with sliding size of one nucleotide. Each window was applied in the form of 413 nearest neighbors (or dinucleotides). The results obtained show sensitivity and precision of 94%. The initial state of this ANN was the Kanhere and Bansal’s algorithm (described in the section 3.4) which was improved by the training process. In fact, the authors transpose the idea of the Kanhere and Bansal’s algorithm into the ANN architecture. An interesting result presented in this paper, was the analysis of how the promoter information was used by N4 to learn. They show that N4 learn from the -10 and -35 motifs, and the +160 position. A single alteration at the +160 position makes N4 to recognize a non-promoter sequence as promoter. This position is downstream of TLS which indicates that this approach probably uses the position of ORF for the accurate prediction of TSS.
Rani and Bapi (2007) used n-gram as feature for a neural network classifier for promoter prediction in Escherichia coli and Drosophila melanogaster. An n-gram is defined as a selection of n contiguous characters from a given character stream. The authors show that the number of n-grams which presents the best results for E. coli was n=3 against a negative examples set consisting of gene and non-promoter intergenic segments. The performance measures presented were: sensitivity of 67.75%, specificity of 86.10% and precision of 80.0%. According to the authors, these results reinforces the idea that 3-grams usage a pattern which can distinguishing a promoter of other sequences, since higher order n-grams features was not powerful enough to discriminate promoter and non-promoter. In addition to this result, the authors apply challenge the 3-grams on promoter identification in the whole genome. The identification of 19 NCBI annotated promoters was 100% positive and encouraging them to propose this methodology as a potential promoter annotation tool.
An ANN-based approach was used by de Avila e Silva et al. (2011) for promoter prediction according to the σ factor which recognizes the sequence. This bioinformatics tool, denoted
Bioinformatics 254
as BacPP, was developed by weighting rules extracted from ANNs trained with promoter sequences known to respond to a specific σ factor. The information obtained from the rules was weighted to optimize promoter prediction and classification of the sequences according to σ factor which recognize them. The accuracy results for E. coli were 86.9%, 92.8%, 91.5%, 89.3%, 97.0% and 83.6% for σ24, σ28, σ32, σ38, σ54 and σ70 dependent promoter sequences, respectively. As related by the authors, the sensitivity and specificity results showed similar values, indicating that this tool present a reduction of false positive rate. In contrast to tools previously reported in the literature, BacPP is not only able to identify bacterial promoters in background genome sequence, but it is also designed to provide pragmatic classification according to σ factor. By separating the promoter sequences according their σ factor which recognize them, the authors have demonstrated that the current boundaries of prediction and classification of promoters can be dissolved. Moreover, when applied to a set of promoters from diverse enterobacteria, the accuracy of BacPP was 76%, indicating that this tool can be reliably extended beyond the E. coli model.
In spite of the ANN capability capture imprecise and incomplete patterns, such as individual promoter motifs including mismatches (Cotik et al., 2005), this ML approach can present some intrinsic difficulties. Many decisions related to the choice of ANN structure and parameters are often completely subjective. The final ANN solution may be influenced by a number of factors (e.g., starting weights, number of cases, number of training cycles, etc.). Besides, the overtraining needs to be avoided, since it results in ANN which memorizes the data, instead of to do a generalization of them (Kapetanovic et al., 2004).
3.4. Other approaches
The symbolic representation of DNA nucleotides given by the letters A,T,G,C lead to many studies which aiming at understanding its structure through distributions, complexities, redundancy and statistical regularities (Krishnamachari et al., 2004). All this kind of information have a theoretical potential to be a distinguish feature of promoter sequences. Some papers are devoted to applied this features either alone or in combination with other approaches for improve promoter prediction results.
Kanhere and Bansal (2005b) developed their own promoter recognition approach based on differences of DNA stability between promoter and coding regions. That tool was improved by Rangannan e Bansal (2007) and achieves sensitivity of 98% and a just precision of 55%. The authors claim that this stability-based approach can be used to annotate entire genome sequences for promoter regions. According to the authors, the low precision can be reduced if it was combined with other sequence based methods. Additionally, they argue that this method can be used to investigate characteristic properties of specific subclasses of promoters, as well as other functional elements which no exhibit obvious consensus sequences.
Jacques et al. (2006) describe a novel approach based on matrices representing the genomic distribution of hexanucleotides pairs. The principal strategy was based on the observation that the promoters are over-represented in intergenic regions relative to the whole genome.
Bacterial Promoter Features Description and Their Application on E. coli in silico Prediction and Recognition Approaches 255
This approach was carried out for ten prokaryotic genomes and the analysis of characterized promoter sequences generates a sensibility of the matrices generated. These results present different sensibility values according to the analyzed bacteria. The lowest value was 29.4% for C. glutamicum and the highest value was 90.9% for Bradyrhizobium japonicum. For the other genomes (E. coli, B. subtilis, S. coelicolor, H. pylori, C. jejuni, Staphylococcus aureus, Mycobacterium tuberculosis and Mycoplasma pneumonia), the sensibility achieved was around 45%. According to the authors, these results suggest that transcription factor DNA binding sites from various bacterial species have a genomic distribution significantly different from that of non-regulatory sequences. Besides the lower sensitivity values for some species, this paper presents the potential of genomic distribution as indicator of DNA motif function. This algorithm took advantage of a yet unexploited concept, can be used in a wide variety of organisms, required almost no previous knowledge of promoter sequences to be effective and can be combined with other methodologies. Additionally, the authors claim that this approach can be designed to predict precise promoter sequences using any annotated prokaryotic genome.
The SIDD values were used by Wang and Benham (2006) for demonstrating that this information can be useful when applied to promoter prediction. They define a promoter as extending from positions -80 to +20 with respect to the TSS and they define strong SIDD as any value below 6 kcal/mole. SIDD values correctly predicted 74.6% of the real promoters with a false positive rate of 18%. When the SIDD values were combined with -10 motifs scores in a linear classification function, they predict promoter regions with better than 90% accuracy. The authors attribute their success to the fact that about 80% of documented promoters contain a strong SIDD site. The authors also observed a bimodal distribution of SIDD properties, which can reflect the complexity of transcriptional regulation, suggesting that SIDD may be needed to initiate transcription from some promoters, but not others.
4. Conclusions
A brief survey of currently E. coli promoter information and their recognition and prediction approaches was presented. In order to improve the in silico promoter prediction, an appreciation of the biological mechanistic of promoter sequences is necessary. In this way, the comprehensive analyses of bacterial promoter sequences revealed the fact that the sequence dependent properties are important and can be exploited in developing in silico tool for promoter prediction.
The currently available approaches described in this paper make efforts to reduce the number of false predictions. Recent bioinformatics applications are increasingly appreciating the DNA structural features and incorporating this kind of information for detecting promoter tools. Some works shows the advantage of the use of the feature selection or extraction process as an important part of pattern recognition, since this procedure can decrease the computation cost and increase the performance of the classification (Polat and Günes, 2009). One of the goals of promoter recognition is to locate promoter regions in the genome sequence. Predicting promoters on a genome-wide scale is
Bioinformatics 256
problematic due to the higher number of false positive predictions caused by the large amount of DNA analyzed. It is important for consideration the fact that a given classification method is not universally better than other, since each method has a class of target functions for which it is best suited (Bradley, 1997).
Author details
Scheila de Avila e Silva and Sergio Echeverrigaray University of Caxias do Sul, Brazil
Acknowledgement
The authors would like to express their gratitude to the University of Caxias do Sul by the financial support applied in the research project.
5. References
Abe, S. (2010). Support vector machines for pattern classification, Springer, ISBN 978-184-9960-97-7, London.
Askary, A.; Masoudi-Nejad, A.; Sharafi, R.; Mizbani, A.; Parizi, S. N.; Purmasjedi, M. (2009). N4: A precise and highly sensitive promoter predictor using neural network fed by nearest neighbors. Genes & Genetic Systems, Vol.84, No.6, pp. 425-430.
Baldi, P.; Brunak, S. (2001). Bioinformatics: the machine learning approach, (2. Ed), ISBN 0-262-02506-X, MIT Press, Cambridge.
Barrios, H.; Valderrama, B.; Morett, E. (1999). Compilation and analysis of σ54-dependent promoter sequences. Nucleic Acids Research, Vol.27, No.22, pp. 4305–4313.
Ben-Hur, A.; Ong, C. S.; Sonnenburg, S. Schölkopf, B., Rätsch, G. (2008). Support Vector Machines and Kernels for Computational Biology. PLOS Computational Biology, Vol. 4, No. 10, e1000173.
Borukov, S.; Nudler, E. (2003). RNA polymerase holoenzyme: structure, function and biological implications. Current Opinion in Microbiology, Vol.6, No.2, (April, 2003), pp. 93–100.
Boser, B. E., Guyon, I., and Vapnik, V. (1992). A training algorithm for optimal margin classifiers. In Computational Learing Theory, pages 144–152.
Bradley, A. P. (1997). The use of area under the ROC curve in the evaluation of Machine Learning algorithms. Pattern Recognition, Vol.30, No.7, pp. 1145–1159.
Burden, S.; Lin, Y.-X.; Zhang, R. (2005). Improving promoter prediction for the NNPP2.2 algorithm: a case study using Escherichia coli DNA sequences. Bioinformatics, Vol.21, No.5, pp. 601-607.
Cen, L.; Dong, M.; Yu, H. L. Z.L.;Chan, P. (2010). Machine learning methods in the application of speech emotion recognition, In: Application of Machine Learning, Y. Zhang (Ed.), pp.1-20, InTech, ISBN 978-953-307-035-3, India.
Bacterial Promoter Features Description and Their Application on E. coli in silico Prediction and Recognition Approaches 257
Cotik, V.; Zaliz, R. R.; Zwir, I. (2005). A hybrid promoter analysis methodology for prokaryotic genomes. Fuzzy Sets and Systems, Vol.152, No.1, (May, 2005), pp.83-102.
Cowing, D.W.; Bardwell, J.C.A.; Craig, E.A.; Woolford, C.; Hendrix, R.W.; Gross, C. (1985) Consensus sequence for Escherichia coli heat-shock gene promoters. Proc. Natl. Acad. Sci, Vol.80, pp. 2679–2683.
de Avila e Silva, S.; Echeverrigaray, S.; Gerhardt, G. J. L. (2011a). BacPP: Bacterial promoter prediction—A tool for accurate sigma-factor specific assignment in enterobacteria. Journal of Theoretical Biology, Vol.287, pp. 92-99.
de Avila e Silva, S.; Gerhardt, G. J. L.; Echeverrigaray, S. (2011b). Rules extraction from neural networks applied to the prediction and recognition of prokaryotic promoters. Genetics and Molecular Biology, Vol.34, No.2, pp. 353-360.
Demeler, B.; Zhou, G. (1991). Neural network optimization for E. coli promoter prediction. Nucleic Acids Research, Vol.19, No.,pp.1593-1599.
Fauteux, F.; Blanchette, M.; Strömvik, M. V. (2008). Seeder: discriminative seeding DNA motif discovery. Bioinformatics, Vol. 24, No. 20, pp 2303–2307.
Fawcett, T. (2006). An introduction to ROC analysis. Pattern Recognition Letters, Vol.27, pp. 861–874.
Gabrielian, A.; Bolshoy, A. (1999). Sequence complexity and DNA curvature. Computers and Chemistry, Vol.23, pp. 263–274.
Galas, D. J.; Eggert, M.; Waterman, M. S. (1985). Rigorous pattern-recognition methods for DNA sequences: Analysis of promoter sequences from Escherichia coli. Journal of Molecular Biology, Vol.186, No.1, (November, 1985), pp. 117–128.
Gordon, J. J.; Towsey, M. W.; Hogan, J. M.; Mathews, S. A.; Timms, P. (2006). Improved prediction of bacterial transcription start sites. Bioinformatics, Vol. 22, No.2, pp. 142-148.
Gordon, L.; Chervonenkis, A.; Gammerman, A. J.; Shahmuradov, I. A.; Solovyev, V. V. (2003). Sequence alignment for recognition of promoter regions. Bioinformatics, Vol.19, No.15, pp. 1964-1971.
Hawley, D. K.; McClure, W. R. (1983). Compilation and analysis of Escherichia coli promoter DNA sequences. Nucleic Acids Research, Vol.11, No.8, (April, 1983), pp. 2237–2255.
Helmann, J.D.; Chamberlin, M.J. (1987). DNA sequence analysis suggests that expression of flagellar and chemotaxis genes in Escherichia coli and Salmonella typhimurium is controlled by an alternative sigma factor. Proc. Natl. Acad. Sci. USA, Vol. 84, pp. 6422–6424.
Hilal, N.; Ogunbiyi, O. O.; Al-Abri, M. (2008). Neural network modeling for separation of bentonite in tubular ceramic membranes. Desalination, Vol. 228, pp. 175-182.
Hook-Barnard, I., Johnson, X.B., Hinton, D.M. Escherichia coli RNA polymerase enzyme of σ70- dependent promoter requiring a -35 DNA element and an extended -10 TGn motif, Journal of Bacteriology 188 (2006) 8352-8359.
Holloway, D.T.; Kon, M.; DeLisi, C. (2007). Machine learning for regulatory analysis and transcription factor target prediction in yeast. Systems and Synthetic Biology, Vol. 1, No. 1, pp. 25–47.
Bioinformatics 258
Howard, D.; Benson, K. (2002). Evolutionary computation method for pattern recognition of cis-acting sites. BioSystems, Vol.72, pp.19-27.
Huerta, A.M.; Collado-Vides, J. (2003) Sigma70 promoters in Escherichia coli: specific transcription in dense regions of overlapping promoter-like signals, Journal of Molecular Biology, Vol.333, pp. 261–278
Huffmann, J. L.; Brennan, R. G. (2002). Prokaryotic transcription regulators: more than just the helix-turn-helix motif. Current Opinion in Structural Biology, Vol.12, pp.98-106.
Jacques, P-E.; Rodrigue, S.; Gaudreau, L.; Goulet, J.; Brzezinski, R. (2006). Detection of prokaryotic promoters from the genomic distribution of hexanucleotides pairs. BMC Bioinformatics, Vol. 7:423.
Janga, S.C.; Collado-Vides, J. (2007). Structure and evolution of gene regulatory networks in microbial genomes. Research Microbiology Vol.158, pp. 787–794.
Jáuregui, R.; Abreu-Goodger, C.; Moreno-Hagelsieb, G., Collado-Vides, J.; Merino, E. (2003) Conservation of DNA curvature signals in regulatory regions of prokaryotic genes. Nucleic Acids Research, Vol. 31, No. 23, pp. 6770-6777.
Kalate, R. N., Tambe, S. S., Kulkarni, B. D., Artificial neural networks for prediction of mycobaterial promoter sequences, Computational Biology and Chemistry 27 (2003) 555-564.
Kanhere, A., Bansal, M. (2005a). Structural properties of promoters: similarities and differences between prokaryotes and eukaryotes. Nucleic Acids Research, Vol. 33, pp. 3165-3175.
Kanhere, A., Bansal, M. (2005b). A novel method for prokaryotic promoter prediction based on DNA stability. BMC Bioinformatics, Vol.6, pp. 1471-2105.
Kapetanovic, M., Rosenfeld, S., Izmirlian, G. (2004). Overview of commonly used bioinformatics methods and their applications. Ann N Y Acad Sci 1020 10–21.
Klaiman, N. T.; Hosid, S.; Bolshoy, A.; (2009). Conservation of DNA curvature signals in regulatory regions of prokaryotic genes. Computational Biology and Chemistry, Vol. 33, pp. 275-282.
Kozobay-Avraham, L.; Hosid, S.; Volkovich, Z.; Bolshoy, A. (2006). Involvement of DNA curvature in intergenic regions. Nucleic Acids Research, Vol.34, No.8, pp. 2316-2327.
Krishnamachari, A.; Mondal, M.V.; Karmeshu (2004). Study of DNA binding sites using the Renyi parametric entropy measure. Journal of Theoretical Biology, Vol. 227, pp. 429–436
Lewin, B., 2008. Genes IX. Jones & Bartlett Publishers, ISBN 13:978-0-7637-4063-4, Sudbury. Li, Q-Z., Lin H. (2006). The recognition and prediction of σ70 promoters in Escherichia coli K-
12. Journal of Theoretical Biology, Vol.242, pp. 135–141. Lisser, S.; Margalit, H. (1993). Compilation of E. coli mRNA promoter sequences, Nucleic
Acids Research, Vol.21, No.7, pp. 1507–1516. Mahadevan, I.; Ghosh, I. (1994). Analysis of E. coli promoter structures using neural
networks. Nucleic Acids Research, Vol.22, pp. 2158-2165. Nickerson, C.A.;Achberger, E.C. (1995). Role of curved DNA in binding of Escherichia coli
RNA polymerase to promoters. Journal of Bacteriology, Vol.157, pp.5756-5761.
Bacterial Promoter Features Description and Their Application on E. coli in silico Prediction and Recognition Approaches 259
Olivares-Zavaleta, N.; Jáuregui, R.; Merino, E. (2006). Genome analysis of Escherichi coli promoters evidences that DNA static curvature plays a more important role in gene transcription than has previously been antecipated. Genomics, Vol. 87, pp. 329-337.
Pandey, S. P.; Krishnamachari, A. (2006). Computational analysis of plant RNA Pol-II promoters. Biosystems, Vol.83, pp. 38-50.
Pedersen, A. G. & Engelbrecht, J. Investigations of Escherichia coli promoter sequences with artificial neural networks: new signals discovered upstream of the transcriptional startpoint, Proc Int Conf Intell Syst Mol Biol 3 (1995) 292-299
Polat, K.; Günes, S. (2007). A novel approach to estimation of E. coli promoter gene sequences: Combining feature selection and least square support vector machine (FS_LSSVN). Applied Mathematics and Computation, Vol. 190, pp. 1574-1582.
Potvin, E.; Sanschagrin, F.; Levesque, R. C. (2008). Sigma factors in Pseudomonas aeruginosa, Federation of European Microbiological Societies, Vol.32, pp. 38–55.
Rangannan, V.; Bansal, M. (2007).Identification and annotation of promoter regions in microbial genome sequences on the basis of DNA stability. Journal of Biosciences, Vol.32, No.5, pp. 851-862.
Rani, T.S.; Bhavani, S.D.; Bapi, R.S. (2007) Analysis of E. coli promoter recognition problem in dinucleotide feature space. Bioinformatics, Vol.23, No.5, pp. 582-588.
Reese, M.G. (2001) Application of a time-delay neural network to promoter annotation in the Drosophila melanogaster genome. Computers and Chemistry, Vol.26, pp. 51-56.
Rhodius, V. A., W. C. Suh, G. Nonaka, J. West, and C. A. Gross. (2006). Conserved and variable functions of the σE stress response in related genomes. PLoS Biol. 4:0043-0059.
Santalucia, J. Jr.; Hicks, D. (2004). The thermodynamics of DNA Structural Motifs. Annual Review of Biophysics and Biomolecular Structure, Vol. 33, pp. 415-440.
Shultzaberger, R.K.; Chen, Z.; Lewis, K.A.; Schneider, T.D.; (2007). Anatomy of Escherichia coli σ70 promoters. Nucleic Acids Research, Vol.35, No.3, pp. 771–788.
Sivarao, P. B.; El-Tayeb, N. S. M.; Vengkatesh, V.C. (2010). Neural network multilayer perceptron modelling for surface quality prediction in laser machining, In: Application of Machine Learning, Y. Zhang (Ed.), pp.1-20, InTech, ISBN 978-953-307-035-3, India
Sokolova, M.; Lapalme, G. (2009). A systematic analysis of performance measures for classification tasks. Information Processing and Management, Vol.427, pp. 427-437.
Song, W.; Maiste, P.J.; Naiman, D.Q.; Ward, M.J. (2007). Sigma 28 promoter prediction in members of the Gammaproteobacteria. Federation of European Microbiological Societies, Vol.271, pp. 222-229.
Stormo, G.D. (2000). DNA binding sites: Representation and discovery. Bioinformatics, Vol.16, No.1, pp. 16-23.
Thiyagarajan, S.; Rajan, S.; Gautham, N. (2006). Effect of DNA structural flexibility on promoter strength - molecular dynamics studies of E. coli promoter sequences. Biochemical and Biophysical Research Communications, Vol.341, pp. 557–566.
Bioinformatics 260
Typas, A.; Becker, G; Hengge, R. (2007). The molecular basis of selective promoter activation by the σS subunit of RNA polymerase. Molecular Microbiology, Vol.63, No.5, pp. 1296–1306
Wang, H.; Benham, C. J. (2006). Promoter prediction and annotation of microbial genomes based on DNA sequences and structural responses to superhelical stress. BMC Bioinformatics, Vol. 7:248.
WU, Cathy H. (1996). Artificial neural networks for molecular sequence analysis. Computers & Chemistry, Vol. 21, No. 4, pp. 237-256.
Zhang, Y. (2010). New Advances in Machine Learning, InTech, ISBN 978-953-307-034-6, India.