Embed Size (px)
Citation preview

AQUATIC MICROBIAL ECOLOGYAquat Microb Ecol
Vol. 33: 217–224, 2003 Published November 7
INTRODUCTION
To assess bacterial community dynamics in aquaticenvironments, most studies of global bacterial diversityhave focused on planktonic communities (Murray etal. 1996, Øvreås et al. 1997, Casamayor et al. 2000,Schauer et al. 2000). In running waters, other typicalmicrobial assemblages are biofilms colonising pebblesin so-called gravel bed rivers (Biggs 1995).
Such river epilithic biofilms are complex microbialcommunities composed of algae, bacteria and othermicro-organisms (Lock 1993). Algae account for morethan 30% of total biomass (Peterson 1996) and were
shown to control either biomass (Sobczak 1996) ordiversity (Jackson et al. 2001) of bacteria by providingorganic nutrients and physical habitats.
For benthic algal communities, it was observed thata source of trophic effluents causes a modification ofcommunity structure, without affecting richness anddiversity or even biomass as measured by chlorophyll a(chl a) levels (Stelzer & Lamberti 2001, Griffith et al.2002). On the other hand, Montuelle et al. (1996) havereported changes in Nitrobacter serotypes associatedwith wastewater treatment plant discharge, suggest-ing that such external factors may also affect epilithicbacterial communities. Community patterns of natural
© Inter-Research 2003 · www.int-res.com*Corresponding author. Email: [email protected]
Bacterial diversity of epilithic biofilm assemblagesof an anthropised river section, assessed by DGGE
analysis of a 16S rDNA fragment
Emilie Lyautey1, Samuel Teissier1, Jean-Yves Charcosset2, Jean-Luc Rols1, Frédéric Garabétian1,*
1Laboratoire d’Ecologie des Hydrosystèmes, UMR 5177 CNRS–Université Paul Sabatier, 118 route de Narbonne, 31062 Toulouse cedex 04, France
2Laboratoire ‘Dynamique de la Biodiversité’, UMR 5172 CNRS–Université Paul Sabatier, 29 rue J. Marvig, 31055 Toulouse cedex 04, France
ABSTRACT: PCR-DGGE analysis of a 16S rDNA fragment was used to determine spatial patterns ofepilithic bacteria diversity over a 100 km river section. Epilithic biofilms were collected on naturalsubstrata in a river reach (mid-slope of the river Garonne) where changes in epilithic bacterialactivities and densities were expected due to the presence of a major urban centre (Toulouse city).Nitrogen and phosphorus forms increased 2- to 10-fold downstream of this urban centre. Close valuesof biomass (18 to 27 g m–2 in 2000 and 10 to 16 g m–2 in 2001), bacterial densities (3 to 11 × 1012 cellsm–2 for total bacteria) and activities (3.6 mg N m–2 h–1 for nitrification and 0.3 to 1.1 mg N m–2 h–1 fordenitrification) were recorded at the different sampling sites. Conversely, in regard to communitycomposition, up- and downstream samples were discriminated between according to their bandingpatterns: >60% similarity within clusters versus <45% similarity between clusters as calculated withthe Jaccard similarity index. Up- and downstream samples shared 50 of the 74 detected bands, themaximum number of bands being 45 for 1 sample. Derived from relative intensities, Simpson (ca.0.034) and Shannon (ca. 5.06) diversity indices indicated diversified communities. For all of the testedsamples, specific richness and diversity indices exhibited relatively homogeneous values, suggestingthat there may be a similar level of diversity in biofilms from contrasting sources.
KEY WORDS: Biofilms · Bacterial diversity · DGGE fingerprinting · River Garonne
Resale or republication not permitted without written consent of the publisher
Aquat Microb Ecol 33: 217–224, 2003
epilithic bacteria may thus result both from autogenicsuccession and from external factors affecting predom-inantly spatial variation.
Only 3 studies on epilithic bacterial diversity infreshwater systems have been carried out: (1) Brüm-mer et al. (2000) have detailed the main phylogeneticgroups of epilithic communities in 2 rivers of differenttrophic levels using fluorescence in situ hybridisation(FISH); (2) Jackson et al. (2001) have focused on themechanisms of succession during colonisation usingthe PCR-DGGE; and (3) Araya et al. (2003) havedetailed the bacterial composition of epilithic commu-nities using both methods. Applied to the study of bac-terial diversity, PCR-DGGE is a cultivation-indepen-dent technique based on the study of a 16S rDNAfragment (Muyzer et al. 1993), which provides rapidassessment along with relevant comparison of diver-sity patterns.
In the present work, we used the latter fingerprintingmethod to study spatial patterns of epilithic bacterialcommunities over a 100 km river section. Concerningbacterial diversity, a realistic view of the actual diver-sity was expected from sampling natural substrata(pebbles) as artificial substrata are known to affectalgal diversity (Cattaneo & Amireault 1992). In regardto spatial patterns at the river reach scale, we intendedto analyse the similarity of bacterial assemblages in asystem including identified sources of spatial changesin communities (Teissier et al. 2002).
MATERIALS AND METHODS
Study sites. Sites are located on the mid-slope of theriver Garonne (mean flow: 600 m3 s–1), which corre-sponds to a 6th-order shallow river. During low-waterperiods, current velocities on the river bottom (<1 ms–1) and mean depths (<1 m) enable the developmentof an important epilithic biomass. Six sites werestudied up- and downstream of Toulouse city, whosedistances from the main wastewater treatment plant(550 000 equivalent inhabitants) are respectively:Aouach (U1): –36 km; Pinsaguel (U2): –12 km; Fen-ouillet (D1): 6 km; Gagnac (D2): 12 km; Bourret (D3):37 km; and Verdun (D4): 55 km. U1 and U2 are theupstream reference sites, D1 is located at the completemixing point of the river waters with Toulouse mainwastewater treatment plant discharge and D2 islocated at the suburbs boundaries. Note that the yearsof sampling are indicated in subscript, e.g. D200 indi-cates a sample collected at the second site down-stream, Gagnac, in 2000.
Water chemistry. Water samples were collected atthe different sites in order to assess nitrogen and phos-phorus concentrations. Nitrogen forms were measured
according to Rodier (1996) and phosphorus forms werequantified according to Motomizu et al. (1983).
Sampling procedures. Sampling was performed inSeptember 2000 and 2001. For each sampling date, allsites were sampled, except in 2000, where no samplewas taken from U1. Nine pebbles (mean diameter:12 cm) from 3 distinct depths of a transect of the riffle(30, 50 and 70 cm) were sampled and kept in sterilebags at 4°C. Within 6 h following the sampling proce-dure, biofilm was removed from the upper surface witha toothbrush (treated with NaOH 1 N to remove alltrace of DNA) and suspended in filtered water(0.2 µm). The scrubbed surface of the pebbles wastraced on tracing paper and its area (m2) calculatedfrom the mass of the tracings. Except for biomass andactivities, all measurements are performed using amixed suspension from the 9 pebbles biofilms.
Measurement of biomass. For each depth, a 50 mlaliquot of biofilm suspension (about 5 g dry mass) wascentrifuged (2300 × g, 20 min, SIGMA-202). Dry masswas determined by weighing the dry pellet (80°C,overnight). This pellet was then combusted (500°C,overnight) for the determination of the ash-free drymass (AFDM).
Nitrification and denitrification rates. The activitymeasurements were performed in situ in benthicchambers for 2001 samples from U1, D2 and D3according to Teissier & Torre (2002).
Numeration of nitrifying bacteria. Microvolumemost probable number (MPN) numerations of NH4
+-oxidising bacteria for each site were performed ac-cording to Teissier et al. (2002) using the mediumrecommended by Schmidt & Belser (1994).
Faecal coliforms. Appropriate dilutions of homogen-ised biofilm suspension were inoculated on TTC-tergi-tol 7 medium (Biokar Diagnostics) and incubatedbetween 18 and 24 h at 44°C. Typical colonies (yellowor orange colonies surrounded by a yellow halo) werecounted as characteristics of coliforms and expressedas colony-forming units (CFU).
Bacterial densities. In 2000, the total bacterial densi-ties were measured according to Porter & Feig (1980)using DAPI staining. In 2001, bacteria were countedafter staining with a LIVE/DEAD BacLight bacterialviability kit (Molecular Probes) according to Boulos etal. (1999). Counting was carried out on a Leitz Dialux22 microscope (1250× magnification) fitted for epi-fluorescence: HBO (Halogen Photo Optic, Osram)100 W mercury light source, with an excitation filter for270 to 380 and 450 to 490 nm, and a barrier filter of 410to 580 nm and a 515 nm cut-off filter for DAPI andLIVE/DEAD BacLight, respectively.
A linear relationship (y = 1.045x) was found betweenLIVE/DEAD BacLight and DAPI staining (R2 = 0.997;n = 16).
218
Lyautey et al.: Bacterial assemblages in epilithic biofilms
DNA extraction and purification. DNA extractionwas carried out according to Dumestre et al. (2001).Briefly, 10 ml of the biofilm suspension were cen-trifuged (1500 × g, 45 min, 4°C, Jouan K-63F) and thesupernatant was discarded. Then 1 ml of lysis buffer(40 mM EDTA, 50 mM Tris-HCl pH 8.3, 0.75 Msucrose) was added to the pellet for storage at –70°C.Biofilm material was incubated with lysozyme (1 mgl–1) for 45 min at 37°C and then with Proteinase K(0.2 mg l–1) and SDS (1%) for 1 h at 55°C. DNAwas extracted with phenol:chloroform:isoamyl-alcohol(25:24:1) and chloroform:isoamyl-alcohol (24:1). Theaqueous phase was concentrated using a microconcen-trator (Amicon, Centricon 100, 100 000 Da cut-off) toremove humic acids. After extraction, DNA concentra-tion was determined by fluorimetry using the DNAQuantitation Kit Fluorescence Assay (Sigma, DNA-QF).
PCR. The variable regions V3 to V5 were amplifiedusing the following primers (Genset): 341F (5’-CCTACG GGA GGC AGC AG-3’) with a 40 bp GCsequence clamped to its 5’ end (5’-CGC CCG CCGCGC CCC GCG CCC GTC CCG CCG CCC CCGCCC G-3’) and 907R (5’-CCG TCA ATT CMT TTGAGT TT-3’). This set of primers was designed to bespecific for most bacteria (Muyzer et al. 1997). Thereaction mixture (50 µl) contained 50 ng microbialDNA, 200 µM of each deoxynucleoside triphosphate,0.48 µM of each of the primers, 2.5 mM MgCl2, 75 mMTris-HCl (pH 8.0), 3 mg ml–1 BSA and 2.5 U DNA poly-merase (Goldstar). The PCR was performed with a T3thermocycler (Biometra) using a programme describedelsewhere (Schauer et al. 2000). PCR products werequantified by agarose gel electrophoresis using Mole-cular Mass Ruler (BioRad).
DGGE. Vertical DGGE was performed using a D-Code Universal Mutation Detection System (BioRad)as described by Muyzer et al. (1997). The gel containeda gradient of denaturant ranging from 35 to 70%(100% denaturant is 7 M urea and 40% deionised for-mamide). DGGE was run at 100 V for 18 h at 60°C.After electrophoresis, the gel was stained with 2×SYBR Green I (Sigma) and visualised by UV transillu-mination. The gel image was captured using a CCDcamera and Biocapt software (Vilber Lourmat). Imageanalysis was done using Bio-1D++ software (VilberLourmat), which allows fragment detection and quan-tification. For each sample, a densitometric profile wasgenerated to determine the relative contribution ofeach band to the total signal in the sample lane.
Similitude and dendrogram construction. Amplifiedbands were scored as present or absent. A triangularmatrix was constructed from the Jaccard similarityindex J = [c/(a + b – c)] × 100, where a is the number ofbands of Sample A, b the number of bands of Sample
B and c the number of bands that are in common toSamples A and B (Jaccard 1908). A dendrogram wasconstructed using the unweighted pair-group methodof arithmetic averages (UPGMA) (Michener & Sokal1957).
Diversity indexes. The values of relative intensity ofeach band were used to calculate the Shannon (H') andSimpson (D) diversity indices:
where n is the number of bands in the sample and pithe relative intensity of the i th band (Simpson 1949,Shannon & Weaver 1963).
RESULTS
Water chemistry and quality
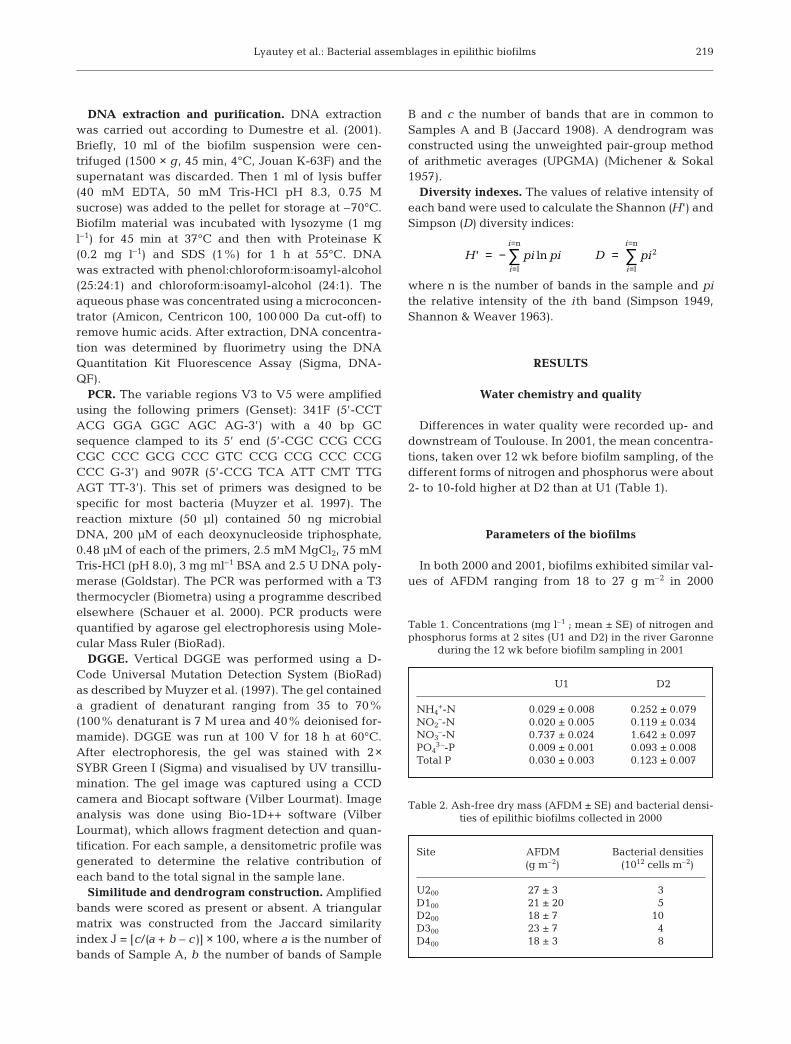
Differences in water quality were recorded up- anddownstream of Toulouse. In 2001, the mean concentra-tions, taken over 12 wk before biofilm sampling, of thedifferent forms of nitrogen and phosphorus were about2- to 10-fold higher at D2 than at U1 (Table 1).
Parameters of the biofilms
In both 2000 and 2001, biofilms exhibited similar val-ues of AFDM ranging from 18 to 27 g m–2 in 2000
D pi
i
i
==
=
∑ 2
l
n
H pi pi
i
i
' = −=
=
∑ lnl
n
219
U1 D2
NH4+-N 0.029 ± 0.008 0.252 ± 0.079
NO2–-N 0.020 ± 0.005 0.119 ± 0.034
NO3–-N 0.737 ± 0.024 1.642 ± 0.097
PO43–-P 0.009 ± 0.001 0.093 ± 0.008
Total P 0.030 ± 0.003 0.123 ± 0.007
Table 1. Concentrations (mg l–1 ; mean ± SE) of nitrogen andphosphorus forms at 2 sites (U1 and D2) in the river Garonne
during the 12 wk before biofilm sampling in 2001
Site AFDM Bacterial densities(g m–2) (1012 cells m–2)
U200 27 ± 3 3D100 21 ± 20 5D200 18 ± 7 10D300 23 ± 7 4D400 18 ± 3 8
Table 2. Ash-free dry mass (AFDM ± SE) and bacterial densi-ties of epilithic biofilms collected in 2000

Aquat Microb Ecol 33: 217–224, 2003
(Table 2) and from 10 to 16 g m–2 in 2001 (Table 3).Bacterial densities were similar, ranging from 3 to 11 ×1012 cells m–2 for both years.
In 2001 (Table 3), high MPN counts of NH4+-oxidising
bacteria were found (>8 × 10⁹ MPN m–2), and faecalcoliforms densities remained rather stable (between 1and 9 × 10⁶ CFU m–2) along the longitudinal transect.
The values measured for the nitrification rates inlight and dark conditions (about 3.6 mg N m–2 h–1)were similar for all of the samples. Denitrification ratesin dark conditions ranged from 0.3 to 1.1 mg N m–2 h–1
(Table 3).
DGGE analysis
Reproducibility
Reproducibility between the different phases of theprocess was assessed (extraction, amplification andDGGE) and gave respectively similitude values of 97,97 and 90%. Reproducibility of the sampling phasewas assessed by comparing 3 replicates of sampling for3 samples. For the 3 tested samples, similar patternswere obtained for the sampling replicates (Fig. 1). Thepercentage of similitude for these replicates, calcu-lated from the binary matrix using the distance of Jac-card, ranged from 84 to 92%.
Application of DGGE on natural samples
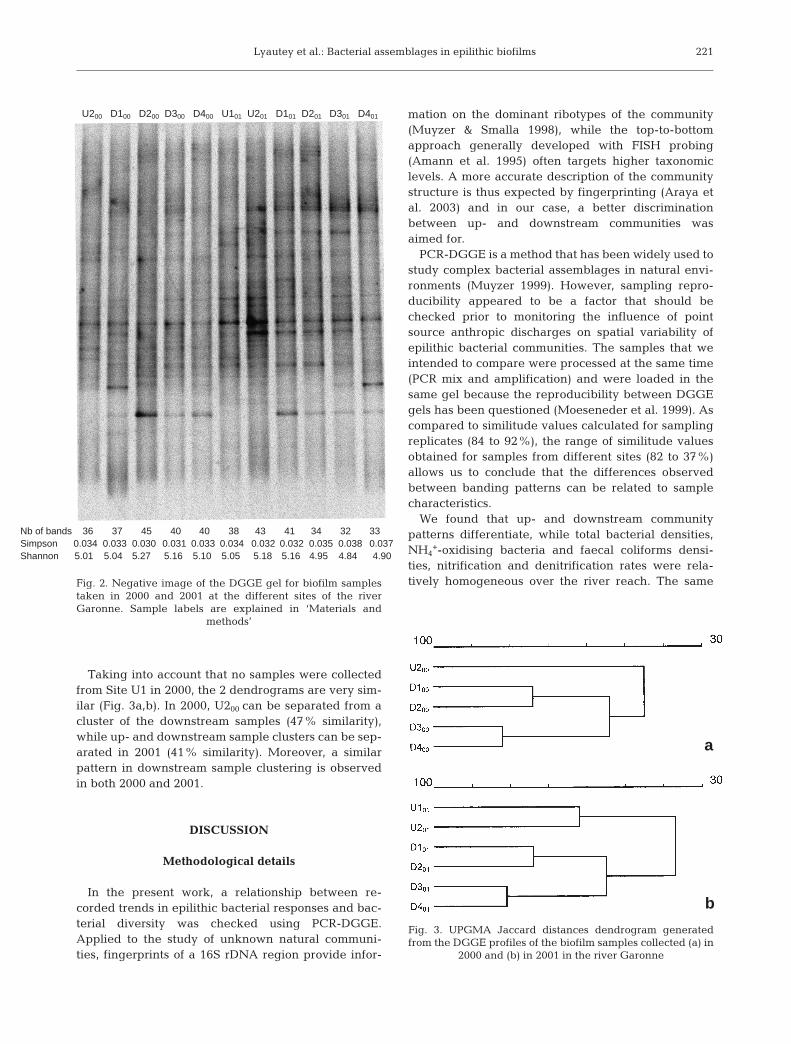
Seventy-four different bands were detected for the 11samples collected in 2000 and 2001 (Fig. 2), and thenumber of bands per samples varied from 34 to 45 ineach year. For the samples taken in 2000, 61 bands weredetected; 19 of them were present in all of the 5 samples,and 9 in only 1 sample, thus being specific of these sam-ples. In 2001, 62 different bands were detected; 17 werepresent in the 6 samples, and 9 in only 1 sample.
In all cases (419), the bands exhibited relative intensi-ties lower than 10%; 28 bands had intensities lowerthan 1% and most bands (255/419) showed intensitiesranging from 1 to 3%. However, for each sample, 21 to28 bands (corresponding to 63% of the detected bands)accounted for about 80% of the total intensity of a lane.
The relative intensities of the bands were used tocalculate diversity indices (Fig. 2). Similar values werefound between up- and downstream samples; themean values are about 0.034 and 5.06 for the Simpsonand Shannon indices respectively.
The range of similitude values was very similarbetween years 2000 and 2001 (45 to 82 and 37 to 81%respectively).
220
Site AFDM Bacterial NH4+-oxidising Faecal Nitrification Denitrification
(g m–2) densities bacteria coliforms rates rates(1012 cells m–2) (109 MPN m–2) (106 CFU m–2) (mg N m–2h–1) (mg N m–2 h–1)
U101 16 ± 2 5 418 2 3.6 0.3U201 15 ± 4 11 184 9 na naD101 12 ± 3 4 145 6 na naD201 10 ± 2 4 58 8 3.9 1.1D301 13 ± 10 3 6 1 3.1 0.4D401 10 ± 3 3 8 6 na na
Table 3. Ash-free dry mass (AFDM ± SE), bacterial densities, NH4+-oxidising and faecal coliforms recorded on epilithic biofilms
collected in 2001. The recorded values of nitrification (mean of light and dark values) and denitrification activities are given for the samples U101, D201 and D301. na: not available
Fig. 1. Negative image of the DGGE gel obtained for the trip-licates (a, b and c) of sampling. The 3 samples (1, 2 and 3)
were collected at Site D2 in July 2000
1.a 1.b 1.c 2.a 2.b 2.c 3.a 3.b 3.c
Lyautey et al.: Bacterial assemblages in epilithic biofilms
Taking into account that no samples were collectedfrom Site U1 in 2000, the 2 dendrograms are very sim-ilar (Fig. 3a,b). In 2000, U200 can be separated from acluster of the downstream samples (47% similarity),while up- and downstream sample clusters can be sep-arated in 2001 (41% similarity). Moreover, a similarpattern in downstream sample clustering is observedin both 2000 and 2001.
DISCUSSION
Methodological details
In the present work, a relationship between re-corded trends in epilithic bacterial responses and bac-terial diversity was checked using PCR-DGGE.Applied to the study of unknown natural communi-ties, fingerprints of a 16S rDNA region provide infor-
mation on the dominant ribotypes of the community(Muyzer & Smalla 1998), while the top-to-bottomapproach generally developed with FISH probing(Amann et al. 1995) often targets higher taxonomiclevels. A more accurate description of the communitystructure is thus expected by fingerprinting (Araya etal. 2003) and in our case, a better discriminationbetween up- and downstream communities wasaimed for.
PCR-DGGE is a method that has been widely used tostudy complex bacterial assemblages in natural envi-ronments (Muyzer 1999). However, sampling repro-ducibility appeared to be a factor that should bechecked prior to monitoring the influence of pointsource anthropic discharges on spatial variability ofepilithic bacterial communities. The samples that weintended to compare were processed at the same time(PCR mix and amplification) and were loaded in thesame gel because the reproducibility between DGGEgels has been questioned (Moeseneder et al. 1999). Ascompared to similitude values calculated for samplingreplicates (84 to 92%), the range of similitude valuesobtained for samples from different sites (82 to 37%)allows us to conclude that the differences observedbetween banding patterns can be related to samplecharacteristics.
We found that up- and downstream communitypatterns differentiate, while total bacterial densities,NH4
+-oxidising bacteria and faecal coliforms densi-ties, nitrification and denitrification rates were rela-tively homogeneous over the river reach. The same
221
Fig. 2. Negative image of the DGGE gel for biofilm samplestaken in 2000 and 2001 at the different sites of the riverGaronne. Sample labels are explained in ‘Materials and
methods’
U200 D100 D200 D300 D400 U101 U201 D101 D201 D301 D401
Nb of bands 36 37 45 40 40 38 43 41 34 32 33Simpson 0.034 0.033 0.030 0.031 0.033 0.034 0.032 0.032 0.035 0.038 0.037Shannon 5.01 5.04 5.27 5.16 5.10 5.05 5.18 5.16 4.95 4.84 4.90
Fig. 3. UPGMA Jaccard distances dendrogram generatedfrom the DGGE profiles of the biofilm samples collected (a) in
2000 and (b) in 2001 in the river Garonne
a
b
Aquat Microb Ecol 33: 217–224, 2003
kind of results has been found with benthic algalcommunities where water nutrient concentrations didnot modify quantitative community descriptors, butaffected the algal community structure instead(Stelzer & Lamberti 2001, Griffith et al. 2002). Thus,it can be suspected that changes detected in theDGGE fingerprinting would be caused by changes inthe algal community since the PCR primers used areknown to amplify plastidial DNA (Schauer et al.2000). However, when analysing bacterial diversityof epilithic biofilms by the cloning technique, O’Sullivan et al. (2002) did not detect the presence ofany sequences belonging to plastidial DNA usingprimers that proved to amplify plastidial 16S rDNA(Marchesi et al. 1998). The DGGE patterns obtainedshould thus be considered to reflect the bacterialcommunity.
Global diversity analysis
As an estimate of bacterial richness, a higher numberof bands or operational taxonomic units (OTUs) wasfound (38 bands on average per sample) compared tothose reported for similar assemblages using the samefingerprinting method: 7 to 24 OTUs were found forepilithic biofilms grown in mesocosms (Jackson et al.2001) and about 20 OTUs for epilithic biofilm grown onartificial substrata in a river (Araya et al. 2003). How-ever, the highest richness recorded in this study maycome from the origin of samples, i.e. pebbles in a nat-ural system, suggesting that the actual epilithic bacte-rial diversity may be distorted by using artificial sub-strata as stated for algae by Cattaneo & Amireault(1992).
The use of band relative intensity to calculate diver-sity indices is controversial, but Nübel et al. (1999) pro-vided some evidence that comparable diversity indiceswere found between values derived from PCR-DGGEand morphotypes. In the studied set, calculated diver-sity indices (Shannon and Simpson) compared withvalues reported for diversified and balanced bacterialcommunities (Nübel et al. 1999, Schauer et al. 2000).Moreover, comparable values calculated for up- anddownstream sites highlight bacterial communities’ability to remain diversified even in the presence ofanthropic disturbances.
Influence of anthropic discharges
In the present study, epilithic biomass descriptorsshow equivalent values over the studied reach conflict-ing with previous findings (Teissier et al. 2002) whereenhanced epilithic biomass was recorded downstream
of a great centre. Obviously, these differences maydepend on whether sampling occurs closely after ahigh-flow period (Teissier et al. 2002) or after a longperiod of low and stable flow (this study). During theaccrual phase that follows the flood, enhanced epilithicbiomass may occur downstream of anthropic dis-charges due to the stimulation of the accrual rate bytrophic inputs (Biggs 1996). Conversely, after a longlow-flow period, biomass may have reached stability(stationary phase) over the whole river section.Epilithic biomass is known to control bacterial densi-ties (Sobczak 1996), activities (Teissier et al. 2002) anddiversity (Jackson et al. 2001). Therefore, biomassstability over the studied section might explain why nodifferences were found between up- and downstreambacterial densities (total and NH4
+-oxidising bacteria),nitrification and denitrification rates.
If epilithic biomass roughly describes biofilm matu-ration stage (Lock 1993), then the accordancebetween homogeneous biomass and the importantnumber of ubiquitous taxa (50 taxa among 74) agreeswith the diversity model proposed by Jackson et al.(2001).
Ubiquity of bacterial populations has already beenmentioned in the literature for microbial assemblages(Gillan et al. 1998, Brümmer et al. 2000, Schauer et al.2000) and is supposed to be responsible for the mainte-nance of stability in systems (Lindström 1998). Forinstance, in our case, the maintenance of activity ratessuch as nitrification and denitrification may be due tothis stability. This may be emphasised in biofilmassemblages that represents an individualised commu-nity partly preserved from conditions prevailing in theoverlying water (Costerton 2000).
On the other hand, for both years, indicating thesame trends from one year to the next, 1⁄3 (24⁄74) of thedetected taxa discriminates between (<45% similarity)up- and downstream biofilms. As known for most ani-mal and vegetal communities, bands discriminatingbetween up- and downstream communities maybehave as bio-indicative taxa of changes in water qual-ity up- and downstream of the urban centre. This sug-gests that epilithic bacterial communities are not com-pletely governed by interactions between organismsand resources within the assemblage, but also react toenvironmental fluctuations.
Acknowledgements. This work was partly supported by GISECOBAG (Groupement d’Intérêt Scientifique—Ecologie etEconomie du Bassin Adour Garonne) and by a PhD fellowshipfrom the French Ministère de la Recherche et de la Technolo-gie to E.L. We are grateful to Dr. J.-F. Dumestre for valuablediscussions about molecular techniques and to C. Mur andD. Dalger for the water quality analysis. We thank the 3anonymous referees whose comments allowed us to improvethe manuscript.
222
Lyautey et al.: Bacterial assemblages in epilithic biofilms
LITERATURE CITED
Amann I, Ludwig W, Schleifer KH (1995) In situ identificationof micro-organisms by whole cell hybridization withrRNA-targeted nucleic acid probes. In: Akkermans ADL,van Elsas JD, de Bruijn FJ (eds) Molecular microbial ecol-ogy manual. Kluwer Academic, Dordrecht, p 1–15
Araya R, Tani K, Takagi T, Yamaguchi N, Nasu M (2003) Bac-terial activity and community composition in stream waterand biofilm from an urban river determined by fluorescentin situ hybridization and DGGE analysis. FEMS MicrobiolEcol 43:111–119
Biggs BJF (1995) The contribution of flood disturbance, catch-ment geology and land use to the habitat template of peri-phyton in stream ecosystems. Freshw Biol 33:419–438
Biggs BJF (1996) Patterns in periphyton of streams. In:Stevenson RJ, Bothwell ML, Lowe RL (eds) Algal ecol-ogy—freshwater benthic ecosystems. Academic Press,San Diego, CA, p 31–56
Boulos L, Prévost M, Barbeau B, Coallier J, Desjardins R(1999) LIVE/DEAD BacLight: application of a new rapidstaining method for direct enumeration of viable andtotal bacteria in drinking water. J Microbiol Methods 37:77–86
Brümmer IHM, Fehr W, Wagner-Döbler I (2000) Biofilm com-munity structure in polluted rivers: abundance of domi-nant phylogenetic groups over a complete annual cycle.Appl Environ Microbiol 66:3078–3082
Casamayor E, Schafer H, Baneras L, Pedros-Alio P, Muyzer G(2000) Identification and spatio-temporal differencesbetween microbial assemblages from two neighboringsulfurous lakes: comparison by microscopy and denatur-ing gradient gel electrophoresis. Appl Environ Microbiol66:499–508
Cattaneo A, Amireault MC (1992) How artificial are artificialsubstrata for periphyton? J North Am Benthol Soc 11:244–256
Colwell RR, Grimes DJ (2000) Nonculturable microorganismsin the environment. ASM Press, Washington, DC
Costerton WJ (2000) Phenotypic plasticity in bacterialbiofilms as it affects issues of viability and culturability. In:Colwell RR, Grimes DJ (eds) Non culturable microorgan-isms in the environment. ASM Press, Washington, DC,p 131–145
Dumestre JF, Casamayor E, Massana R, Pedros-Alio C (2001)Changes in bacterial and archaeal assemblages in anequatorial river induced by the water eutrophication ofPetit Saut dam reservoir (French Guiana). Aquat MicrobEcol 26:209–221
Gillan DC, Speksnijder AGCL, Zwart G, De Ridder CD (1998)Genetic diversity of the biofilm covering Montacuta fer-ruginosa (Mollusca, Bivalvia) as evaluated by denaturinggel gradient electrophoresis analysis and cloning of PCR-amplified gene fragment coding for 16S rRNA. Appl Envi-ron Microbiol 64:3464–3472
Griffith MB, Hill BH, Herlihy AT, Kaufman PR (2002) Multi-variate analysis of periphyton assemblages in relation toenvironmental gradients in Colorado Rocky Mountainstreams. J Phycol 38:83–95
Jaccard P (1908) Nouvelles recherches sur la distribution flo-rale. Bull Soc Vaudoise Sci Nat 44:223–270
Jackson CR, Churchill PF, Roden EE (2001) Successionalchanges in bacterial assemblage structure during epilithicbiofilm development. Ecology 82:555–566
Lindström ES (1998) Bacterioplankton community composi-tion in a boreal forest lake. FEMS Microbiol Ecol 27:163–174
Lock MA (1993) Attached microbial communities in rivers.In: Ford TE (ed) Aquatic microbiology—an ecologicalapproach. Blackwell Scientific Publications, Oxford,p 113–138
Marchesi JR, Sato T, Weightman AJ, Martin TA, Fry JC, HiomSJ, Wade WG (1998) Design and evaluation of useful bac-terium-specific PCR primers that amplify genes coding for16S rRNA. Appl Environ Microbiol 64:795–799
Michener CD, Sokal RR (1957) A quantitative approach to aproblem in classification. Evolution 11:130–162
Moeseneder MM, Arrieta JM, Muyzer G, Winter C, HerndlGJ (1999) Optimization of terminal-restriction fragmentlength polymorphism analysis for complex marine bacteri-oplankton communities and comparison with denaturinggradient gel electrophoresis. Appl Environ Microbiol 65:3518–3525
Montuelle B, Volat B, Torio-Fernandez MM, Navarro E (1996)Changes in Nitrobacter serotypes biodiversity in a river:impact of a wastewater treatment plant discharge. WaterRes 30:1057–1064
Motomizu S, Wakimoto T, Toei K (1983) Spectrophotometricdetermination of phosphate in river waters with mobdy-late and malachite green. Analyst 108:361–367
Murray AE, Hollibaugh JT, Orrego C (1996) Phylogeneticcompositions of bacterioplankton from two Californiaestuaries compared by denaturing gradient gel elec-trophoresis of 16S rDNA fragments. Appl Environ Micro-biol 62:2676–2680
Muyzer G (1999) DGGE/TGGE a method for identifyinggenes from natural ecosystems. Curr Opin Microbiol 2:317–322
Muyzer G, Smalla K (1998) Application of denaturing gradi-ent gel electrophoresis (DGGE) and temperature gradientgel electrophoresis (TGGE) in microbial ecology. AntonieLeeuwenhoek 73:127–141
Muyzer G, De Waal EC, Uitterlinden AG (1993) Profiling ofcomplex microbial populations by denaturing gradient gelelectrophoresis analysis of PCR-amplified genes codingfor 16S rRNA. Appl Environ Microbiol 59:695–700
Muyzer G, Brinkhoff T, Nuber U, Santegoeds C, Schafer H,Wawer C (1997) Denaturing gradient gel electrophoresis(DGGE) in microbial ecology. In: Akkermans ADL, vanElsas JD, de Bruijn FJ (eds) Molecular microbial ecologymanual. Kluwer Academic, Dordrecht, p 1–27
Nübel U, Garcia-Pichel F, Kuhl M, Muyzer G (1999) Quantify-ing microbial diversity: morphotypes, 16S rRNA genes,and carotenoids of oxygenic phototrophs in microbialmats. Appl Environ Microbiol 65:422–430
O’Sullivan LA, Weightman AJ, Fry JC (2002) New degenerateCytophaga-Flexibacter-Bacteroides specific 16S riboso-mal DNA-targeted oligonucleotide probes reveal highbacterial diversity in river Taff epilithon. Appl EnvironMicrobiol 68:201–210
Øvreås L, Forney L, Daae FL, Torsvik V (1997) Distribution ofbacterioplankton in meromictic lake Saelenvannet asdetermined by denaturing gradient gel electrophoresis ofPCR-amplified gene fragments coding for 16S rRNA. ApplEnviron Microbiol 63:3367–3373
Peterson CG (1996) Response of benthic algal communities tonatural physical disturbance. In: Stevenson RJ, BothwellML, Lowe RL (eds) Algal ecology—freshwater benthicecosystems. Academic Press, San Diego, CA, p 57–72
Porter KG, Feig YS (1980) The use of DAPI for identifying andcounting aquatic microflora. Limnol Oceanogr 25:943–948
Rodier J (1996) L’analyse de l’eau—eaux naturelles, eauxrésiduaires, eau de mer. Dunod, Paris
Schauer M, Massana R, Pedros-Alio C (2000) Spatial differ-
223

Aquat Microb Ecol 33: 217–224, 2003
ences in bacterioplankton composition along the Catalancoast (NW Mediterranean) assessed by molecular finger-printing. FEMS Microbiol Ecol 33:51–59
Schmidt EL, Belser LW (1994) Autotrophic nitrifying bacteria.In: Bigham JM (ed) Methods of soil analysis, Vol 5. Part 2.Microbiological and biochemical properties. SSSA BookSeries, Madison, p 159–177
Shannon C, Weaver W (1963) The mathematical theory ofcommunication, Vol 3. Urbana University of Illinois Press,Chicago
Simpson EH (1949) Measurement of diversity. Nature 163:688Sobczak WV (1996) Epilithic bacterial responses to variations
in algal biomass and labile dissolved organic carbon
during biofilm colonization. J North Am Benthol Soc 15:143–154
Stelzer RS, Lamberti GA (2001) Effects of N:P ratio and totalnutrient concentration on stream periphyton communitystructure, biomass and elemental composition. LimnolOceanogr 46:356–367
Teissier S, Torre M (2002) Simultaneous assessment of nitrifi-cation and denitrification on freshwater epilithic biofilmsby acetylene block method. Water Res 36:3803–3811
Teissier S, Garabétian F, Torre M, Dalger D, Labroue L (2002)Impact of an urban centre on the nitrogen cycle processesof epilithic biofilms during a summer low water period.River Res Appl 18:21–30
224
Editorial responsibility: Karel 2imek,>eské Budéjovice, Czech Republic
Submitted: September 10, 2002; Accepted: September 2, 2003Proofs received from author(s): October 30, 2003