Embed Size (px)
DESCRIPTION
Citation preview
Backtracking Intrusions
SAMUEL T. KING and PETER M. CHENUniversity of Michigan
Analyzing intrusions today is an arduous, largely manual task because system administratorslack the information and tools needed to understand easily the sequence of steps that occurred inan attack. The goal of BackTracker is to identify automatically potential sequences of steps thatoccurred in an intrusion. Starting with a single detection point (e.g., a suspicious file), BackTrackeridentifies files and processes that could have affected that detection point and displays chainsof events in a dependency graph. We use BackTracker to analyze several real attacks againstcomputers that we set up as honeypots. In each case, BackTracker is able to highlight effectivelythe entry point used to gain access to the system and the sequence of steps from that entry pointto the point at which we noticed the intrusion. The logging required to support BackTracker added9% overhead in running time and generated 1.2 GB per day of log data for an operating-systemintensive workload.
Categories and Subject Descriptors: D.4.6 [Operating Systems]: Security and Protection—Infor-mation flow controls: invasive software (e.g., viruses, worms, Trojan horses); K.6.4 [Management ofComputing and Information Systems]: System Management-management audit; K.6.5 [Man-agement of Computing and Information Systems]: Security and Protection—Invasive soft-ware (e.g., viruses, worms, Trojan horses); unauthorized access (e.g., hacking, phreaking)
General Terms: Management, Security
Additional Key Words and Phrases: Computer forensics, intrusion analysis, information flow
1. INTRODUCTION
The frequency of computer intrusions has been increasing rapidly for severalyears [CERT 2002a]. It seems likely that, for the foreseeable future, even themost diligent system administrators will continue to cope routinely with com-puter breakins. After discovering an intrusion, a diligent system administratorshould do several things to recover from the intrusion. First, the administrator
This research was supported in part by National Science Foundation grants CCR-0098229 andCCR-0219085, ARDA grant NBCHC030104, and Intel Corporation. Samuel King was supported bya National Defense Science and Engineering Graduate Fellowship. Any opinions, findings, conclu-sions or recommendations expressed in this material are those of the authors and do not necessarilyreflect the views of the National Science Foundation.Authors’ address: Computer Science and Engineering Division, Department of Electrical Engi-neering and Computer Science University of Michigan, Ann Arbor, MI 48109; email: {kingst,pmchen}@umich.edu.Permission to make digital or hard copies of part or all of this work for personal or classroom use isgranted without fee provided that copies are not made or distributed for profit or direct commercialadvantage and that copies show this notice on the first page or initial screen of a display alongwith the full citation. Copyrights for components of this work owned by others than ACM must behonored. Abstracting with credit is permitted. To copy otherwise, to republish, to post on servers,to redistribute to lists, or to use any component of this work in other works requires prior specificpermission and/or a fee. Permissions may be requested from Publications Dept., ACM, Inc., 1515Broadway, New York, NY 10036 USA, fax: +1 (212) 869-0481, or [email protected]© 2005 ACM 0734-2071/05/0200-0051 $5.00
ACM Transactions on Computer Systems, Vol. 23, No. 1, February 2005, Pages 51–76.

52 • S. T. King and P. M. Chen
should understand how the intruder gained access to the system. Second, theadministrator should identify the damage inflicted on the system (e.g., modi-fied files, leaked secrets, installed backdoors). Third, the administrator shouldfix the vulnerability that allowed the intrusion and try to undo the damagewrought by the intruder. This article addresses the methods and tools an ad-ministrator uses to understand how an intruder gained access to the system.
Before an administrator can start to understand an intrusion, she mustfirst detect that an intrusion has occurred [CERT 2001]. There are numer-ous ways to detect a compromise. A tool such as TripWire [Kim and Spafford1994] can detect a modified system file; a network or host firewall can no-tice a process conducting a port scan or launching a denial-of-service attack;a sandboxing tool can notice a program making disallowed or unusual pat-terns of system calls [Goldberg et al. 1996; Forrest et al. 1996] or executingforeign code [Kiriansky et al. 2002]. We use the term detection point to referto the state on the local computer system that alerts the administrator to theintrusion. For example, a detection point could be a deleted, modified, or addi-tional file, or it could be a process that is behaving in an unusual or suspiciousmanner.
Once an administrator is aware that a computer is compromised, the nextstep is to investigate how the compromise took place [CERT 2000]. Adminis-trators typically use two main sources of information to find clues about anintrusion: system/network logs and disk state [Farmer and Venema 2000]. Anadministrator might find log entries that show unexpected output from vulnera-ble applications, deleted or forgotten attack toolkits on disk, or file modificationdates which hint at the sequence of events during the intrusion. Many tools existthat make this job easier. For example, Snort can log network traffic; Etherealcan present application-level views of that network traffic; and The Coroner’sToolkit can recover deleted files [Farmer 2001] or summarize the times at whichfiles were last modified, accessed, or created [Farmer 2000] (similar tools areGuidance Software’s EnCase, Access Data’s Forensic Toolkit, Internal RevenueServices’ ILook, and ASR Data’s SMART).
Unfortunately, current sources of information suffer from one or more limi-tations. Host logs typically show only partial, application-specific informationabout what happened, such as HTTP connections or login attempts, and theyoften show little about what occurred on the system after the initial compro-mise. Network logs may contain encrypted data, and the administrator may notbe able to recover the decryption key. The attacker may also use an obfuscatedcustom command set to communicate with a backdoor, and the administratormay not be able to recover the backdoor program to help understand the com-mands. Disk images may contain useful information about the final state, butthey do not provide a complete history of what transpired during the attack. Ageneral limitation of most tools and sources of information is that they inter-mingle the actions of the intruder (or the state caused by those actions) withthe actions/state of legitimate users. Even in cases where the logs and diskstate contain enough information to understand an attack, identifying the se-quence of events from the initial compromise to the point of detection point isstill largely a manual process.
ACM Transactions on Computer Systems, Vol. 23, No. 1, February 2005.
Backtracking Intrusions • 53
This article describes a tool called BackTracker that attempts to address theshortcomings in current tools and sources of information and thereby help anadministrator more easily understand what took place during an attack. Work-ing backward from a detection point, BackTracker identifies chains of eventsthat could have led to the modification that was detected. An administrator canthen focus her detective work on those chains of events, leading to a quickerand easier identification of the vulnerability. In order to identify these chainsof events, BackTracker logs the system calls that induce most directly depen-dencies between operating system objects (e.g., creating a process, reading andwriting files). BackTracker’s goal is to provide helpful information for mostattacks; it does not provide complete information for every possible attack.
We have implemented BackTracker for Linux in two components: an on-linecomponent that logs events and an off-line component that graphs events re-lated to the attack. BackTracker currently tracks many (but not all) relevantoperating-system (OS) events. We found that these events can be logged andanalyzed with moderate time and space overhead and that the output gener-ated by BackTracker was helpful in understanding several real attacks againstcomputers we set up as honeypots.
2. DESIGN OF BACKTRACKER
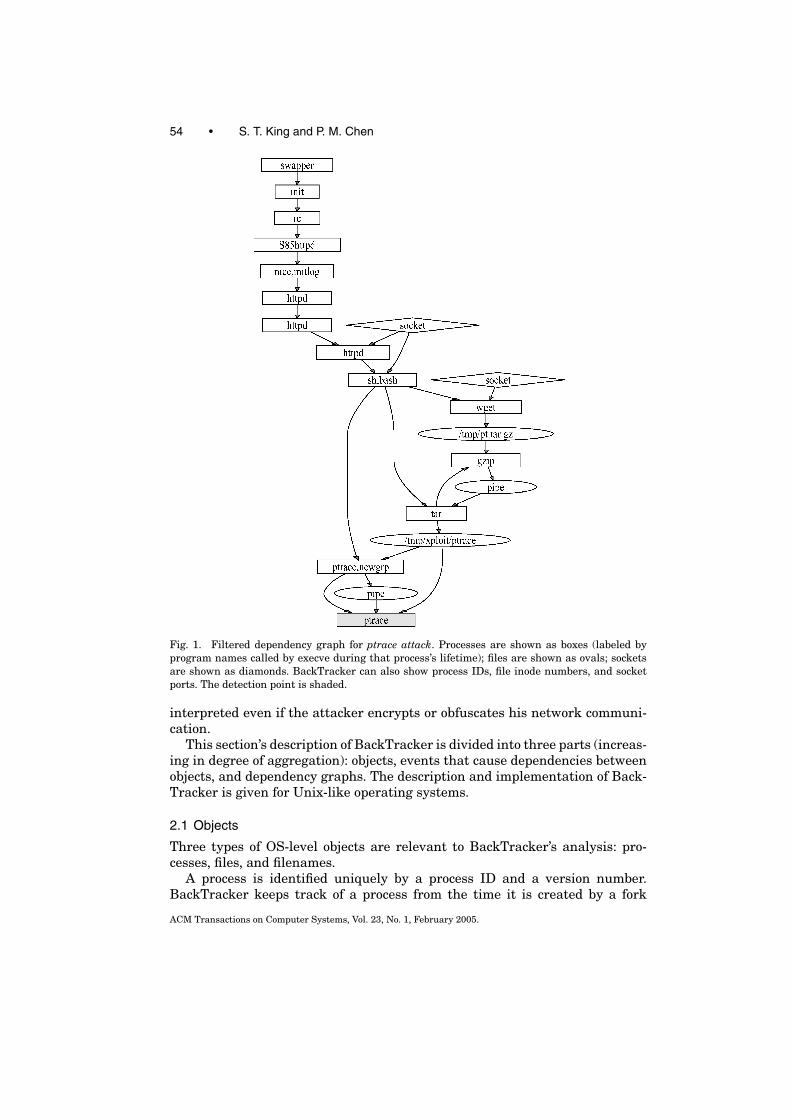
BackTracker’s goal is to reconstruct a time-line of events that occur in an attack.Figure 1 illustrates this with BackTracker’s results for an intrusion on ourhoneypot machine that occurred on March 12, 2003. The graph shows thatthe attacker caused the Apache Web server (httpd) to create a command shell(bash), downloaded and unpacked an executable (/tmp/xploit/ptrace), then ranthe executable using a different group identity (we believe the executable wasseeking to exploit a race condition in the Linux ptrace code to gain root access).We detected the intrusion by seeing the ptrace process in the process listing.
There are many levels at which events and objects can be observed.Application-level logs such as Apache’s log of HTTP requests are semanticallyrich. However, they provide no information about the attacker’s own programs,and they can be disabled by an attacker who gains privileged access. Network-level logs provide more information for remote attacks, but they can be rendereduseless by encryption or obfuscation. Logging low-level events such as machineinstructions can provide complete information about the computer’s execution[Dunlap et al. 2002], but these can be difficult for administrators to understandquickly.
BackTracker works by observing OS-level objects (e.g., files, filenames, pro-cesses) and events (e.g., system calls). This level is a compromise between theapplication level (semantically rich but easily disabled) and the machine level(difficult to disable but semantically poor). Unlike application-level logging,OS-level logging cannot separate objects within an application (e.g., user-levelthreads), but rather considers the application as a whole. While OS-level se-mantics can be disrupted by attacking the kernel, gaining kernel-mode controlcan be made considerably more difficult than gaining privileged user-modecontrol [Huagang 2000]. Unlike network-level logging, OS-level events can be
ACM Transactions on Computer Systems, Vol. 23, No. 1, February 2005.
54 • S. T. King and P. M. Chen
Fig. 1. Filtered dependency graph for ptrace attack. Processes are shown as boxes (labeled byprogram names called by execve during that process’s lifetime); files are shown as ovals; socketsare shown as diamonds. BackTracker can also show process IDs, file inode numbers, and socketports. The detection point is shaded.
interpreted even if the attacker encrypts or obfuscates his network communi-cation.
This section’s description of BackTracker is divided into three parts (increas-ing in degree of aggregation): objects, events that cause dependencies betweenobjects, and dependency graphs. The description and implementation of Back-Tracker is given for Unix-like operating systems.
2.1 Objects
Three types of OS-level objects are relevant to BackTracker’s analysis: pro-cesses, files, and filenames.
A process is identified uniquely by a process ID and a version number.BackTracker keeps track of a process from the time it is created by a fork
ACM Transactions on Computer Systems, Vol. 23, No. 1, February 2005.
Backtracking Intrusions • 55
or clone system call to the point where it exits. The one process that is not cre-ated by fork or clone is the first process (swapper); BackTracker starts keepingtrack of swapper when it makes its first system call.
A file object includes any data or metadata that is specific to that file, such asits contents, owner, or modification time. A file is identified uniquely by a device,an inode number, and a version number. Because files are identified by inodenumber rather than by name, BackTracker tracks a file across rename opera-tions and through symbolic links. BackTracker treats pipes and named pipesas normal files. Objects associated with System V IPC (messages, shared mem-ory, semaphores) can also be treated as files, though the current BackTrackerimplementation does not yet handle these.
A filename object refers to the directory data that maps a name to a fileobject. A filename object is identified uniquely by a canonical name, which is anabsolute pathname with all ./ and ../ links resolved. Note the difference betweenfile and filename objects. In Unix, a single file can appear in multiple placesin the filesystem directory structure, so writing a file via one name will affectthe data returned when reading the file via the different name. File objects areaffected by system calls such as write, whereas filename objects are affected bysystem calls such as rename, create, and unlink.
It is possible to keep track of objects at a different granularity than processes,files, and filenames. One could keep track of finer-grained objects, such as fileblocks, or coarser-grained objects, such as all files within a directory. Keepingtrack of objects on a finer granularity reduces false dependencies (similar tofalse sharing in distributed shared memory systems), but is harder and mayinduce higher overhead.
2.2 Potential Dependency-Causing Events
BackTracker logs events at runtime that induce dependency relationships be-tween objects, that is, events in which one object affects the state of anotherobject. These events are the links that allow BackTracker to deduce timelinesof events leading to a detection point. A dependency relationship is specified bythree parts: a source object, a sink object, and a time interval. For example, thereading of a file by a process causes that process (the sink object) to depend onthat file (the source object). We denote a dependency from a source object to asink object as source⇒sink.
We use time intervals to reduce false dependencies. For example, a processthat reads a file at time 10 does not depend on writes to the file that occurafter time 10. Time is measured in terms of an increasing event counter. Unlessotherwise stated, the interval for an event starts when the system call is invokedand ends when the system call returns. A few types of events (such as sharedmemory accesses) are aggregated into a single event over a longer intervalbecause it is difficult to identify the times of individual events.
There are numerous events which cause objects to affect each other. Thissection describes potential events that BackTracker could track. Section 2.3describes how BackTracker uses dependency-causing events. Section 2.4 thendescribes why some events are more important to track than others and
ACM Transactions on Computer Systems, Vol. 23, No. 1, February 2005.
56 • S. T. King and P. M. Chen
identifies the subset of these dependencies logged by the current BackTrackerprototype. We classify dependency-causing events based on the source andsink objects for the dependency they induce: process/process, process/file, andprocess/filename.
2.2.1 Process/Process Dependencies. The first category of events are thosefor which one process directly affects the execution of another process. One pro-cess can affect another directly by creating it, sharing memory with it, or sig-naling it. For example, an intruder may login to the system through sshd, thenfork a shell process, then fork a process that performs a denial-of-service at-tack. Processes can also affect each other indirectly (e.g., by writing and readingfiles), and we describe these types of dependencies in the next two sections.
If a process creates another process, there is a parent⇒child dependencybecause the parent initiated the existence of the child and because the child’saddress space is initialized with data from the parent’s address space.
Besides the traditional fork system call, Linux supports the clone systemcall, which creates a child process that shares the parent’s address space (theseare essentially kernel threads). Children that are created via clone have an ad-ditional bidirectional parent⇔child dependency with their parent due to theirshared address space. In addition, clone creates a bidirectional dependency be-tween the child and other processes that are currently sharing the parent’saddress space. Because it is difficult to track individual loads and stores toshared memory locations, we group all loads and stores to shared memory intoa single event that causes the two processes to depend on each other over alonger time interval. We do this grouping by assuming conservatively that thetime interval of the shared-memory dependency lasts from the time the childis created to the time either process exits or replaces its address space throughthe execve system call.
2.2.2 Process/File Dependencies. The second category of events are thosefor which a process affects or is affected by data or attributes associated witha file. For example, an intruder can edit the password file (process⇒file de-pendency), then log in using the new password file (file⇒process dependency).Receiving data from a network socket can also be treated as reading a file, al-though the sending and receiving computers would need to cooperate to linkthe receive event with the corresponding send event.
System calls like write and writev cause a process⇒file dependency. Systemcalls like read, readv, and execve cause a file⇒process dependency.
Files can also be mapped into a process’s address space through mmap, thenaccessed via load/store instructions. As with shared memory between processes,we aggregate mapped-file accesses into a single event, lasting from the time thefile is mmap’ed to the time the process exits. This conservative time intervalallows BackTracker to not track individual memory operations or the unmap-ping or remapping of files. The direction of the dependency for mapped filesdepends on the access permissions used when opening the file: mapping a fileread-only causes a file⇒process dependency; mapping a file write-only causesa process⇒file dependency; mapping a file read/write causes a bidirectional
ACM Transactions on Computer Systems, Vol. 23, No. 1, February 2005.
Backtracking Intrusions • 57
process⇔file dependency. When a process is created, it inherits a dependencywith each file mapped into its parent’s address space.
A process can also affect or be affected by a file’s attributes, such as the file’sowner, permissions, and modification time. System calls that modify a file’sattributes (e.g., chown, chmod, utime) cause a process⇒file dependency. Systemcalls that read file attributes (e.g., fstat) cause a file⇒process dependency. Infact, any system call that specifies a file (e.g., open, chdir, unlink, execve) causesa file⇒process dependency if the filename specified in the call exists, becausethe return value of that system call depends on the file’s owner and permissions.
2.2.3 Process/Filename Dependencies. The third category of events arethose that cause a process to affect or be affected by a filename object. Forexample, an intruder can delete a configuration file and cause an applicationto use an insecure default configuration. Or an intruder can swap the namesof current and backup password files to cause the system to use out-of-datepasswords.
Any system call that includes a filename argument (e.g., open, creat, link,unlink, mkdir, rename, rmdir, stat, chmod) causes a filename⇒process depen-dency, because the return value of the system call depends on the existenceof that filename in the file system directory tree. In addition, the process isaffected by all parent directories of the filename (e.g., opening the file /a/b/cdepends on the existence of /a and /a/b). A system call that reads a directorycauses a filename⇒process dependency for all filenames in that directory.
System calls that modify a filename argument cause a process⇒filenamedependency if they succeed. Examples are creat, link, unlink, rename, mkdir,rmdir, and mount.
2.3 Dependency Graphs
By logging objects and dependency-causing events during runtime, Back-Tracker saves enough information to build a graph that depicts the depen-dency relationships between all objects seen over that execution. Rather thanpresenting the complete dependency graph, however, we would like to makeunderstanding an attack as easy as possible by presenting only the relevantportion of the graph. This section describes how to select the objects and eventsin the graph that relate to the attack.
We assume that the administrator has noticed the compromised system andcan identify at least one detection point, such as a modified, extra, or deletedfile, or a suspicious or missing process. Starting from that detection point, ourgoal is to build a dependency graph of all objects and events that causally affectthe state of the detection point [Lamport 1978]. The part of the BackTrackersystem that builds this dependency graph is called GraphGen. GraphGen isrun offline, that is, after the attack.
To construct the dependency graph, GraphGen reads the log of events,starting from the last event and reading toward the beginning of the log(Figure 2). For each event, GraphGen evaluates whether that event can affectany object that is currently in the dependency graph. Each object in theevolving graph has a time threshold associated with it, which is the maximum
ACM Transactions on Computer Systems, Vol. 23, No. 1, February 2005.
58 • S. T. King and P. M. Chen
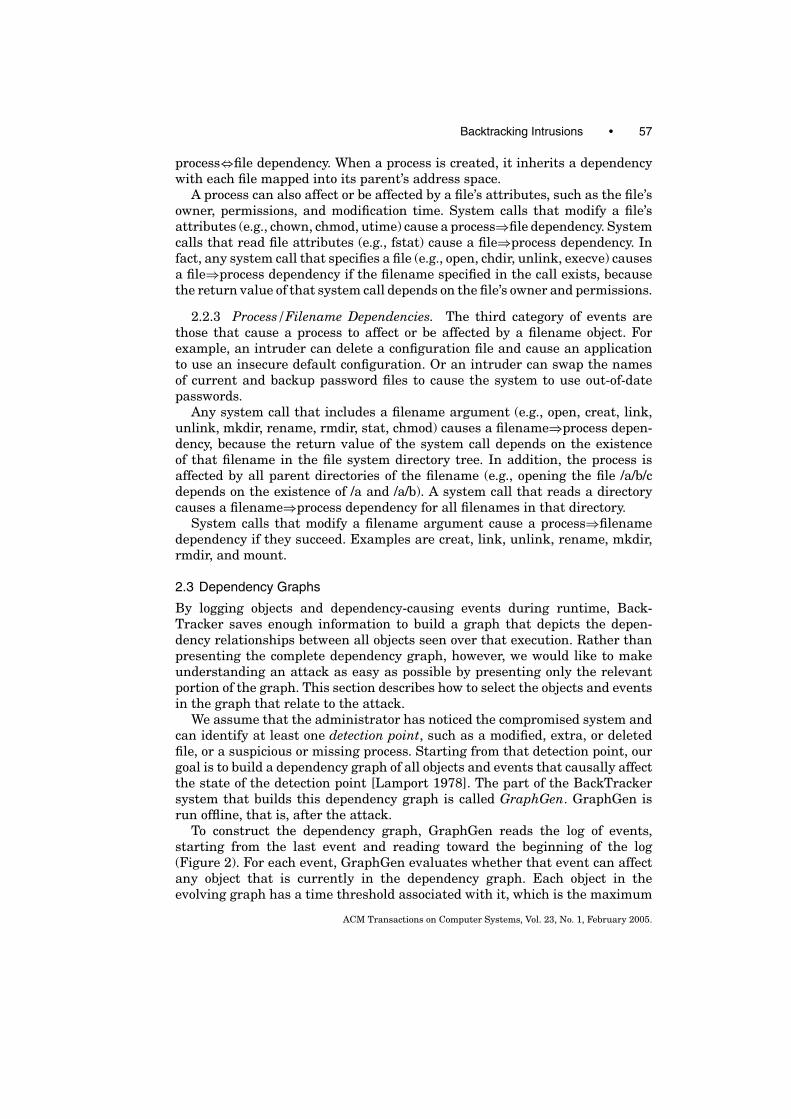
Fig. 2. Constructing a dependency graph. This code shows the basic algorithm used to constructa dependency graph from a log of dependency-causing events with discrete times.
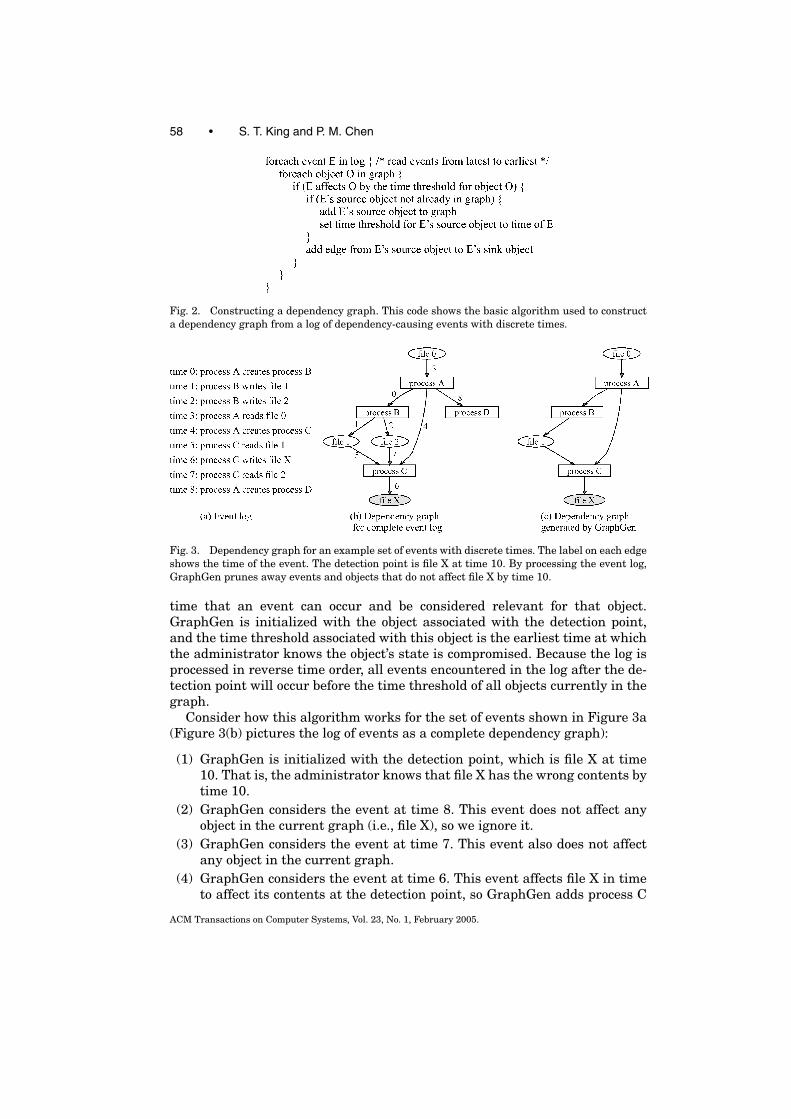
Fig. 3. Dependency graph for an example set of events with discrete times. The label on each edgeshows the time of the event. The detection point is file X at time 10. By processing the event log,GraphGen prunes away events and objects that do not affect file X by time 10.
time that an event can occur and be considered relevant for that object.GraphGen is initialized with the object associated with the detection point,and the time threshold associated with this object is the earliest time at whichthe administrator knows the object’s state is compromised. Because the log isprocessed in reverse time order, all events encountered in the log after the de-tection point will occur before the time threshold of all objects currently in thegraph.
Consider how this algorithm works for the set of events shown in Figure 3a(Figure 3(b) pictures the log of events as a complete dependency graph):
(1) GraphGen is initialized with the detection point, which is file X at time10. That is, the administrator knows that file X has the wrong contents bytime 10.
(2) GraphGen considers the event at time 8. This event does not affect anyobject in the current graph (i.e., file X), so we ignore it.
(3) GraphGen considers the event at time 7. This event also does not affectany object in the current graph.
(4) GraphGen considers the event at time 6. This event affects file X in timeto affect its contents at the detection point, so GraphGen adds process C
ACM Transactions on Computer Systems, Vol. 23, No. 1, February 2005.
Backtracking Intrusions • 59
to the dependency graph with an edge from process C to file X. GraphGensets process C’s time threshold to be 6, because only events that occurbefore time 6 can affect C in time to affect the detection point.
(5) GraphGen considers the event at time 5. This event affects an object inthe dependency graph (process C) in time, so GraphGen adds file 1 to thegraph with an edge to process C (at time 5).
(6) GraphGen considers the event at time 4. This event affects an object inthe dependency graph (process C) in time, so GraphGen adds process A tothe dependency graph with an edge to process C (at time 4).
(7) GraphGen considers the event at time 3. This event affects process A intime, so we add file 0 to the graph with an edge to process A (at time 3).
(8) GraphGen considers the event at time 2. This event does not affect anyobject in the current graph.
(9) GraphGen considers the event at time 1. This event affects file 1 in time,so we add process B to the graph with an edge to file 1 (at time 1).
(10) GraphGen considers the event at time 0. This event affects process B intime, so we add an edge from process A to process B (process A is alreadyin the graph).
The resulting dependency graph (Figure 3(c)) is a subset of the graph inFigure 3(b). We believe this type of graph to be a useful picture of the eventsthat lead to the detection point, especially if it can reduce dramatically thenumber of objects and events an administrator must examine to understandan attack.
The full algorithm is a bit more complicated because it must handle eventsthat span an interval of time, rather than events with discrete times. Con-sider a scenario where the dependency graph currently has an object O withtime threshold t. If an event P⇒O occurs during time interval [x-y], then weshould add P to the dependency graph iff x < t, that is, this event started toaffect O by O’s time threshold. If P is added to the dependency graph, the timethreshold associated with P would be minimum(t, y), because the event wouldhave no relevant effect on O after time t, and the event itself stopped aftertime y.
Events with intervals are added to the log in order of the later time in theirinterval. This order guarantees that GraphGen sees the event and can add thesource object for that event as soon as possible (so that the added source objectcan in turn be affected by events processed subsequently by GraphGen).
For example, consider how GraphGen would handle an event process B⇒file1 in Figure 3(b) with a time interval of 1–7. GraphGen would encounter thisevent at a log time 7 because events are ordered by the later time in theirinterval. At this time, file 1 is not yet in the dependency graph. GraphGen re-members this event and continually reevaluates whether it affects new objectsas they are added to the dependency graph. When file 1 is added to the graph(log time 5), GraphGen sees that the event process B⇒file 1 affects file 1 andadds process B to the graph. The time threshold for process B would be time 5(the lesser of time 5 and time 7).
ACM Transactions on Computer Systems, Vol. 23, No. 1, February 2005.

60 • S. T. King and P. M. Chen
GraphGen maintains several data structures to accelerate its processing ofevents. Its main data structure is a hash table of all objects currently in thedependency graph, called GraphObjects. GraphGen uses GraphObjects to de-termine quickly if the event under consideration affects an object that is alreadyin the graph. GraphGen also remembers those events with time intervals thatinclude the current time being processed in the log. GraphGen stores theseevents in an ObjectsIntervals hash table, hashed on the sink object for thatevent. When GraphGen adds an object to GraphObjects, it checks if any eventsin the ObjectsIntervals hash table affect the new object before the time thresh-old for the new object. Finally, GraphGen maintains a priority queue of eventswith intervals that include the current time (prioritized by the starting timeof the event). The priority queue allows GraphGen to find and discard eventsquickly whose intervals no longer include the current time.
2.4 Dependencies Tracked By Current Prototype
Section 2.2 lists numerous ways in which one object can potentially affect an-other. It is important to note, however, that affecting an object is not the sameas controlling an object. Dependency-causing events vary widely in terms ofhow much the source object can control the sink object. Our current implemen-tation of BackTracker focuses on tracking the events we consider easiest for anattacker to use to accomplish a task; we call these events high-control events.
Some examples of high-control events are changing the contents of a file orcreating a child process. It is relatively easy for an intruder to perform a taskby using high-control events. For example, an intruder can install a backdooreasily by modifying an executable file, then creating a process that executes it.
Some examples of low-control events are changing a file’s access time or cre-ating a filename in a directory. Although these events can affect the execution ofother processes, they tend to generate a high degree of noise in the dependencygraph. For example, if BackTracker tracks the dependency caused by readinga directory, then a process that lists the files in /tmp would depend on all pro-cesses that have ever created, renamed, or deleted filenames in /tmp. Timingchannels [Lampson 1973] are an example of an extremely low-control event;for example, an attacker may be able to trigger a race condition by executing aCPU-intensive program.
Fortunately, BackTracker is able to provide useful analysis without trackinglow-control events, even if low-control events are used in the attack. This isbecause it is difficult for an intruder to perform a task solely by using low-control events. Consider an intruder who wants to use low-control events toaccomplish an arbitrary task; for example, he may try to cause a program toinstall a backdoor when it sees a new filename appear in /tmp.
Using an existing program to carry out this task is difficult because existingprograms do not generally perform arbitrary tasks when they see incidentalchanges such as a new filename in /tmp. If an attacker can cause an existingprogram to perform an arbitrary task by making such an incidental change,it generally means that the program has a bug (e.g., buffer overflow or racecondition). Even if BackTracker does not track this event, it will still be able to
ACM Transactions on Computer Systems, Vol. 23, No. 1, February 2005.
Backtracking Intrusions • 61
highlight the buggy existing program by tracking the chain of events from thedetection point back to that program.
Using a new, custom program to carry out an arbitrary task is easy. However,it will not evade BackTracker’s analysis because the events of writing and ex-ecuting such a custom program are high-control events and BackTracker willlink the backdoor to the intruder’s earlier actions through those high-controlevents. To illustrate this, consider in Figure 3(b) if the event “file 1⇒processC” was a low-control event, and process C was created by process B (ratherthan by process A as shown). Even if BackTracker did not track the event “file1⇒process C,” it would still link process B to the detection point via the event“process B⇒process C.”
BackTracker currently logs and analyzes the following high-control events:process creation through fork or clone; load and store to shared memory; readand write of files and pipes; receiving data from a socket; execve of files; load andstore to mmap’ed files; and opening a file. We have implemented partially thelogging and tracking of file attributes and filename create, delete, and rename(these events are not reflected in Section 5’s results). We plan to implementlogging and tracking for System V IPC (messages, shared memory, semaphores)and signals.
3. IMPLEMENTATION STRUCTURE FOR LOGGING EVENTS AND OBJECTS
While the computer is executing, BackTracker must log information about ob-jects and dependency-causing events to enable the dependency-graph analysisdescribed in Section 2. The part of BackTracker that logs this information iscalled EventLogger. After the intrusion, an administrator can run GraphGenoffline on a log (or concatenation of logs spanning several reboots) generated byEventLogger. GraphGen produces a graph in a format suitable for input to thedot program (part of AT&T’s Graph Visualization Project), which generates thehuman-readable graphs used in this article.
There are several ways to implement EventLogger, and the results of Back-Tracker’s analysis are independent of where EventLogger is implemented.
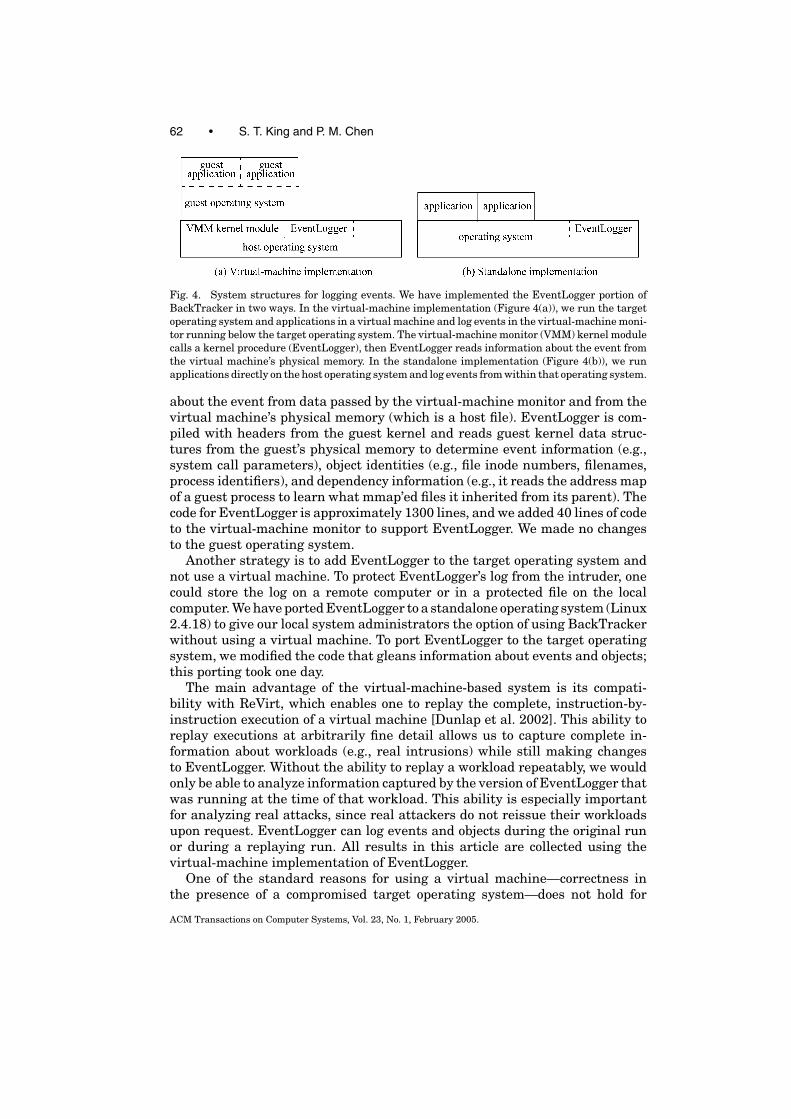
The strategy for our main BackTracker prototype is to run the target op-erating system (Linux 2.4.18) and applications inside a virtual machine andto have the virtual-machine monitor call a kernel procedure (EventLogger) atappropriate times (Figure 4). The operating system running inside the virtualmachine is called the guest operating system to distinguish it from the oper-ating system that the virtual machine is running on, which is called the hostoperating system. Guest processes run on the guest operating system inside thevirtual machines; host processes run on the host operating system. The entirevirtual machine is encapsulated in a host process. The log written by EventLog-ger is stored as a host file (compressed with gzip). The virtual-machine monitorprevents intruders in the guest from interfering with EventLogger or its log file.
EventLogger gleans information about events and objects inside the targetsystem by examining the state of the virtual machine. The virtual-machinemonitor notifies EventLogger whenever a guest application invokes or returnsfrom a system call or when a guest application process exits. EventLogger learns
ACM Transactions on Computer Systems, Vol. 23, No. 1, February 2005.
62 • S. T. King and P. M. Chen
Fig. 4. System structures for logging events. We have implemented the EventLogger portion ofBackTracker in two ways. In the virtual-machine implementation (Figure 4(a)), we run the targetoperating system and applications in a virtual machine and log events in the virtual-machine moni-tor running below the target operating system. The virtual-machine monitor (VMM) kernel modulecalls a kernel procedure (EventLogger), then EventLogger reads information about the event fromthe virtual machine’s physical memory. In the standalone implementation (Figure 4(b)), we runapplications directly on the host operating system and log events from within that operating system.
about the event from data passed by the virtual-machine monitor and from thevirtual machine’s physical memory (which is a host file). EventLogger is com-piled with headers from the guest kernel and reads guest kernel data struc-tures from the guest’s physical memory to determine event information (e.g.,system call parameters), object identities (e.g., file inode numbers, filenames,process identifiers), and dependency information (e.g., it reads the address mapof a guest process to learn what mmap’ed files it inherited from its parent). Thecode for EventLogger is approximately 1300 lines, and we added 40 lines of codeto the virtual-machine monitor to support EventLogger. We made no changesto the guest operating system.
Another strategy is to add EventLogger to the target operating system andnot use a virtual machine. To protect EventLogger’s log from the intruder, onecould store the log on a remote computer or in a protected file on the localcomputer. We have ported EventLogger to a standalone operating system (Linux2.4.18) to give our local system administrators the option of using BackTrackerwithout using a virtual machine. To port EventLogger to the target operatingsystem, we modified the code that gleans information about events and objects;this porting took one day.
The main advantage of the virtual-machine-based system is its compati-bility with ReVirt, which enables one to replay the complete, instruction-by-instruction execution of a virtual machine [Dunlap et al. 2002]. This ability toreplay executions at arbitrarily fine detail allows us to capture complete in-formation about workloads (e.g., real intrusions) while still making changesto EventLogger. Without the ability to replay a workload repeatably, we wouldonly be able to analyze information captured by the version of EventLogger thatwas running at the time of that workload. This ability is especially importantfor analyzing real attacks, since real attackers do not reissue their workloadsupon request. EventLogger can log events and objects during the original runor during a replaying run. All results in this article are collected using thevirtual-machine implementation of EventLogger.
One of the standard reasons for using a virtual machine—correctness inthe presence of a compromised target operating system—does not hold for
ACM Transactions on Computer Systems, Vol. 23, No. 1, February 2005.
Backtracking Intrusions • 63
BackTracker. If an attacker gains control of the guest operating system, shecan carry out arbitrary tasks inside the guest without being tracked by Back-Tracker (in contrast, ReVirt works even if the attacker gains control of the guestoperating system).
We use a version of the UMLinux virtual machine [Buchacker and Sieh 2001]that uses a host kernel (based on Linux 2.4.18) that is optimized to support vir-tual machines [King et al. 2003]. The virtualization overhead of the optimizedUMLinux is comparable to that of VMWare Workstation 3.1. CPU-intensiveapplications experience almost no overhead, and kernel-intensive applicationssuch as SPECweb99 and compiling the Linux kernel experience 14–35% over-head [King et al. 2003].
4. PRIORITIZING PARTS OF A DEPENDENCY GRAPH
Dependency graphs for a busy system may be too large to scrutinize each objectand event. Fortunately, not all objects and events warrant the same amountof scrutiny when a system administrator analyzes an intrusion. This sectiondescribes several ways to prioritize or filter a dependency graph in order tohighlight those parts that are mostly likely to be helpful in understanding anintrusion. Of course, there is a tradeoff inherent to any filtering. Even objectsor events that are unlikely to be important in understanding an intrusion maynevertheless be relevant, and filtering these out may accidentally hide impor-tant sequences of events.
One way to prioritize important parts of a graph is to ignore certain ob-jects. For example, the login program reads and writes the file /var/run/utmp.These events cause a new login session to depend on all prior login sessions.Another example is the file /etc/mtab. This file is written by mount and umountand is read by bash at startup, causing all events to depend on mount andumount. A final example is that the bash shell commonly writes to a file named.bash history when it exits. Shell invocations start by reading .bash history, soall actions by all shells depend on all prior executions of bash. While these aretrue dependencies, it is easier to start analyzing the intrusion without theseobjects cluttering the graph, then to add these objects if needed.
A second way to prioritize important parts of a graph is to filter out certaintypes of events. For example, one could filter out some low-control events.
These first two types of filtering (objects and events) may filter out a vital linkin the intrusion and thereby disconnect the detection point from the source ofthe intrusion. Hence they should be used only for cases where they reduce noisedrastically with only a small risk of filtering out vital links. The remainder ofthe filtering rules do not run the risk of breaking a vital link in the middle ofan attack sequence.
A third way to simplify the graph is to hide files that have been read butnot written in the time period being analyzed (read-only files). For example, inFigure 3(c), file 0 is read by process A but is not written during the period beinganalyzed. These files are often default configuration or header files. Not showingthese files in the graph does not generally hinder one’s ability to understand anattack because the attacker did not modify these files in the time period being
ACM Transactions on Computer Systems, Vol. 23, No. 1, February 2005.
64 • S. T. King and P. M. Chen
considered and because the processes that read the files are still included inthe dependency graph. If the initial analysis does not reveal enough about theattack, an administrator may need to extend the analysis further back in thelog to include events that modified files which were previously considered read-only. Filtering out read-only files cannot break a link in any attack sequencecontained in the log being analyzed, because there are no events in that logthat affect these files.
A fourth way to prioritize important parts of a graph is to filter out helperprocesses that take input from one process, perform a simple function on thatinput, then return data to the main process. For example, the system-wide bashstartup script (/etc/bashrc) causes bash to invoke the id program to learn thename and group of the user, and the system startup scripts on Linux invoke theprogram consoletype to learn the type of the console that is being used. Theseusage patterns are recognized easily in a graph: they form a cycle in the graph(usually connected by a pipe) and take input only from the parent process andfrom read-only files. As with the prior filtering rule, this rule cannot disconnecta detection point from an intrusion source that precedes the cycle, because thesecycles take input only from the main process, and the main process is left inthe dependency graph.
A fifth way to prioritize important parts of a graph is to choose severaldetection points, then take the intersection of the dependency graphs formedfrom those dependency points. The intersection of the graphs is likely to high-light the earlier portion of an attack (which affect all detection points), and theseportions are important to understanding how the attacker initially gained con-trol in the system.
We implement these filtering rules as options in GraphGen. GraphGen in-cludes a set of default rules which work well for all attacks we have experienced.A user can add to a configuration file regular expressions that specify additionalobjects and events to filter. We considered filtering the graph after GraphGenproduced it, but this would leave in objects that should have been pruned (suchas an object that was connected only via an object that was filtered out).
Other graph visualization techniques can help an administrator understandlarge dependency graphs. For example, a postprocessing tool can aggregaterelated objects in the graph, such as all files in a directory, or show how thegraph grows as the run progresses.
We expect an administrator to run GraphGen several times with differentfiltering rules and log periods. She might first analyze a short log that she hopesincludes the entire attack. She might also filter out many objects and events totry to highlight the most important parts of an intrusion without much noisefrom irrelevant events. If this initial analysis does not reveal enough about theattack, she can extend the analysis period further back in the log and use fewerfiltering rules.
5. EVALUATION
This section evaluates how well BackTracker works on three real attacks andone simulated attack (Table I).
ACM Transactions on Computer Systems, Vol. 23, No. 1, February 2005.
Backtracking Intrusions • 65
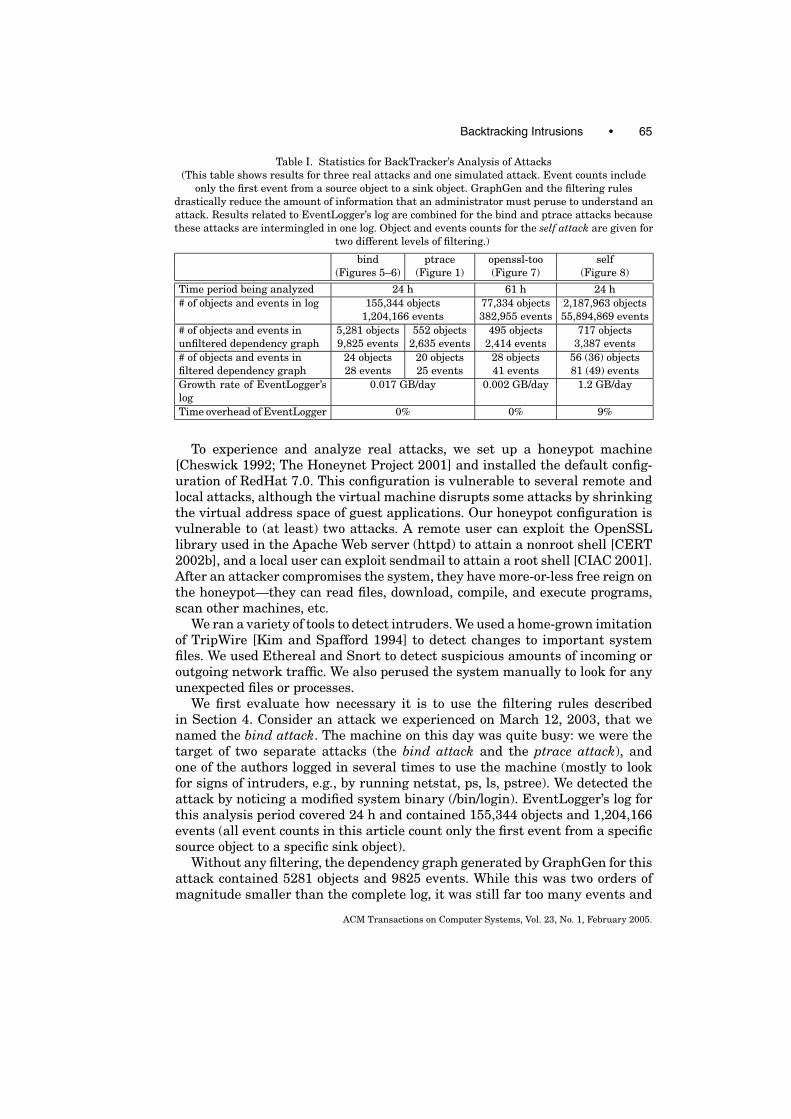
Table I. Statistics for BackTracker’s Analysis of Attacks(This table shows results for three real attacks and one simulated attack. Event counts include
only the first event from a source object to a sink object. GraphGen and the filtering rulesdrastically reduce the amount of information that an administrator must peruse to understand anattack. Results related to EventLogger’s log are combined for the bind and ptrace attacks becausethese attacks are intermingled in one log. Object and events counts for the self attack are given for
two different levels of filtering.)
bind ptrace openssl-too self(Figures 5–6) (Figure 1) (Figure 7) (Figure 8)
Time period being analyzed 24 h 61 h 24 h# of objects and events in log 155,344 objects 77,334 objects 2,187,963 objects
1,204,166 events 382,955 events 55,894,869 events# of objects and events in 5,281 objects 552 objects 495 objects 717 objectsunfiltered dependency graph 9,825 events 2,635 events 2,414 events 3,387 events# of objects and events in 24 objects 20 objects 28 objects 56 (36) objectsfiltered dependency graph 28 events 25 events 41 events 81 (49) eventsGrowth rate of EventLogger’slog
0.017 GB/day 0.002 GB/day 1.2 GB/day
Time overhead of EventLogger 0% 0% 9%
To experience and analyze real attacks, we set up a honeypot machine[Cheswick 1992; The Honeynet Project 2001] and installed the default config-uration of RedHat 7.0. This configuration is vulnerable to several remote andlocal attacks, although the virtual machine disrupts some attacks by shrinkingthe virtual address space of guest applications. Our honeypot configuration isvulnerable to (at least) two attacks. A remote user can exploit the OpenSSLlibrary used in the Apache Web server (httpd) to attain a nonroot shell [CERT2002b], and a local user can exploit sendmail to attain a root shell [CIAC 2001].After an attacker compromises the system, they have more-or-less free reign onthe honeypot—they can read files, download, compile, and execute programs,scan other machines, etc.
We ran a variety of tools to detect intruders. We used a home-grown imitationof TripWire [Kim and Spafford 1994] to detect changes to important systemfiles. We used Ethereal and Snort to detect suspicious amounts of incoming oroutgoing network traffic. We also perused the system manually to look for anyunexpected files or processes.
We first evaluate how necessary it is to use the filtering rules describedin Section 4. Consider an attack we experienced on March 12, 2003, that wenamed the bind attack. The machine on this day was quite busy: we were thetarget of two separate attacks (the bind attack and the ptrace attack), andone of the authors logged in several times to use the machine (mostly to lookfor signs of intruders, e.g., by running netstat, ps, ls, pstree). We detected theattack by noticing a modified system binary (/bin/login). EventLogger’s log forthis analysis period covered 24 h and contained 155,344 objects and 1,204,166events (all event counts in this article count only the first event from a specificsource object to a specific sink object).
Without any filtering, the dependency graph generated by GraphGen for thisattack contained 5281 objects and 9825 events. While this was two orders ofmagnitude smaller than the complete log, it was still far too many events and
ACM Transactions on Computer Systems, Vol. 23, No. 1, February 2005.

66 • S. T. King and P. M. Chen
objects for an administrator to analyze easily. We therefore considered whatfiltering rules we could use to reduce the amount of information presented tothe administrator, while minimizing the risk of hiding important steps in theattack.
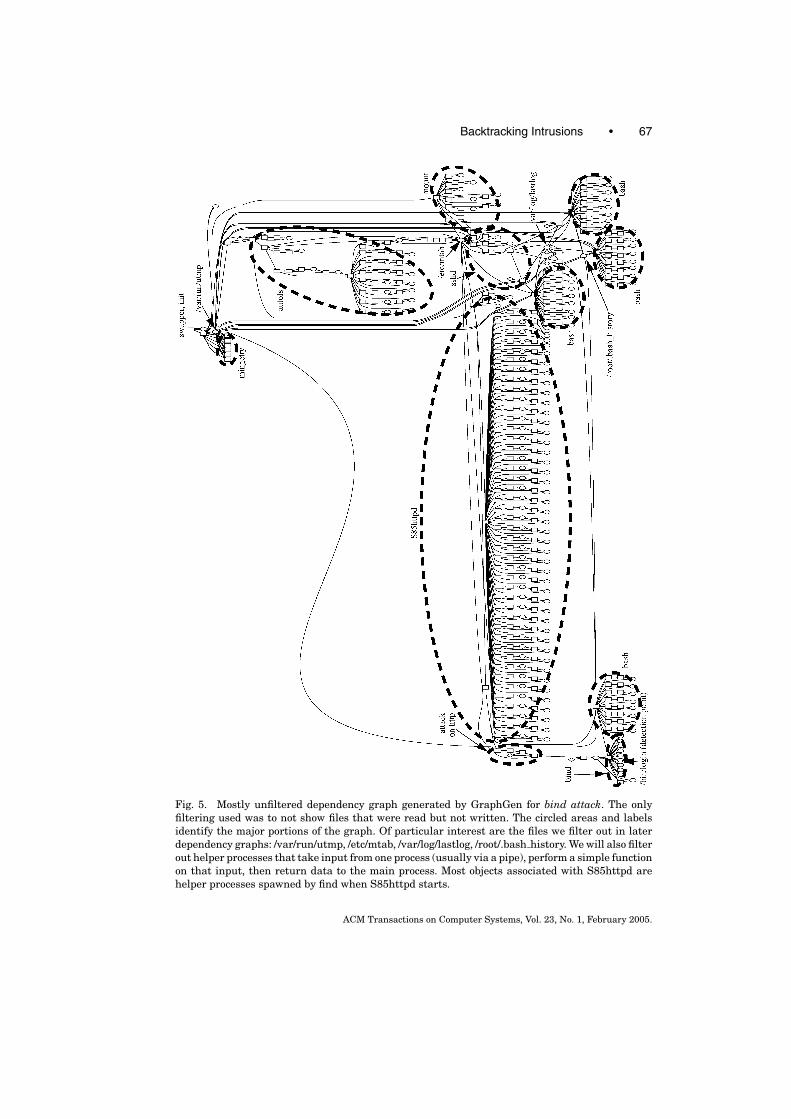
Figure 5 shows the dependency graph generated by GraphGen for this attackafter filtering out files that were read but not written. The resulting graphcontained 575 objects and 1014 events. Important parts of the graph are circledor labeled to point out the filtering rules we discuss next.
Significant noise came from several root login sessions by one of the authorsduring the attack. The author’s actions are linked to the attacker’s actionsthrough /root/.bash history,/var/log/lastlog, and /var/run/utmp. /etc/mtab alsogenerates a lot of noise, as it is written after most system startup scripts andread by each bash shell. Finally, a lot of noise was generated by helper processesthat take input only from their parent process, perform a simple function on thatinput, then return data to the parent (usually through a pipe). Most processesassociated with S85httpd on the graph are helper processes spawned by findwhen S85httpd starts.
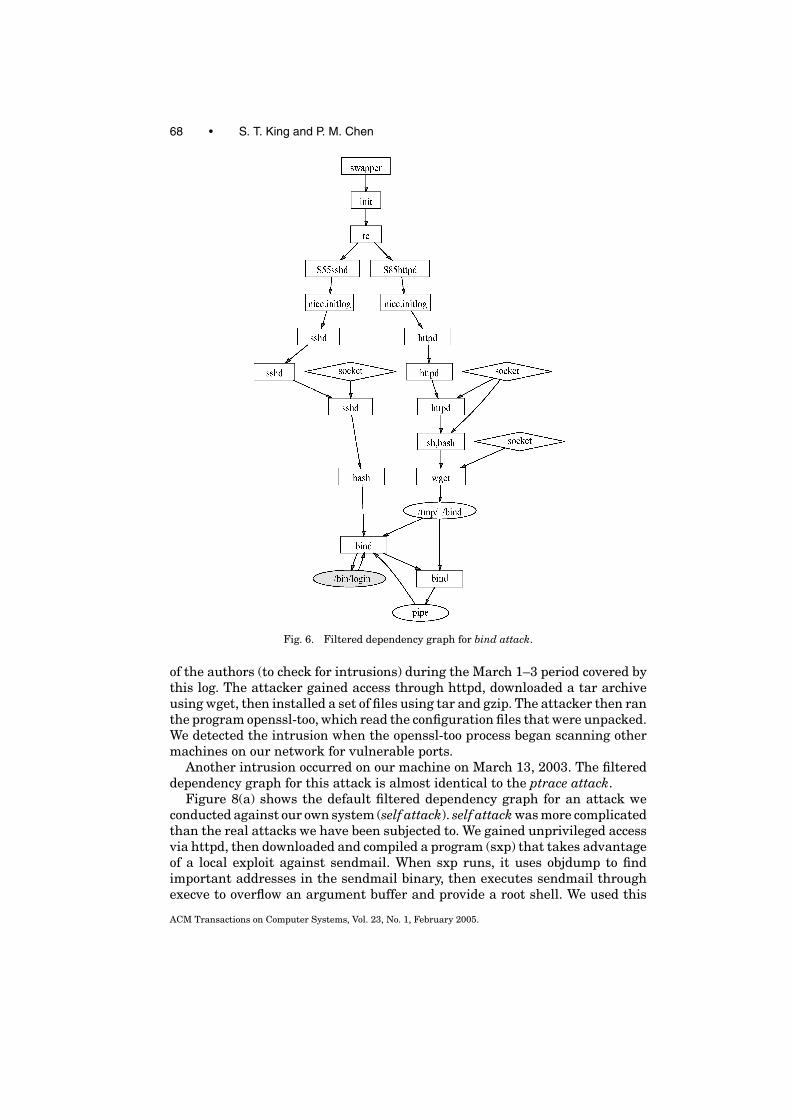
Figure 6 shows the dependency graph for the bind attack after GraphGenapplied the following filtering rules: ignore files that were read but not writ-ten; ignore files /root/.bash history, /var/run/lastlog, /var/run/utmp, /etc/mtab;ignore helper processes that take input only from their parent process and re-turn a result through a pipe. We used these same filtering rules to generatedependency graphs for all attacks.
These filtering rules reduced the size of the graph to 24 objects and 28 events,and made the bind attack fairly easy to analyze. The attacker gained accessthrough httpd, downloaded a rootkit using wget, then wrote the rootkit to thefile “/tmp/ /bind.” Sometime later, one of the authors logged in to the machinenoticed the suspicious file and decided to execute it out of curiosity (don’t trythis at home!). The resulting process installed a number of modified systembinaries, including /bin/login. This graph shows that BackTracker can trackacross several login sessions. If the attacker had installed /bin/login withoutbeing noticed, then logged in later, we would have been able to backtrack froma detection point in her second session to the first session by her use of themodified /bin/login.
Figure 1 shows the filtered dependency graph for a second attack that oc-curred in the same March 12, 2003, log, which we named the ptrace attack. Theintruder gained access through httpd, downloaded a tar archive using wget,then unpacked the archive via tar and gzip. The intruder then executed theptrace program using a different group identity. We later detected the intru-sion by seeing the ptrace process in the process listing. We believe the ptraceprocess was seeking to exploit a race condition in the Linux ptrace code togain root access. Figures 1 and 6 demonstrate BackTracker’s ability to sepa-rate two intermingled attacks from a single log. Changing detection points from/bin/login to ptrace is sufficient to generate distinct dependency graphs for eachattack.
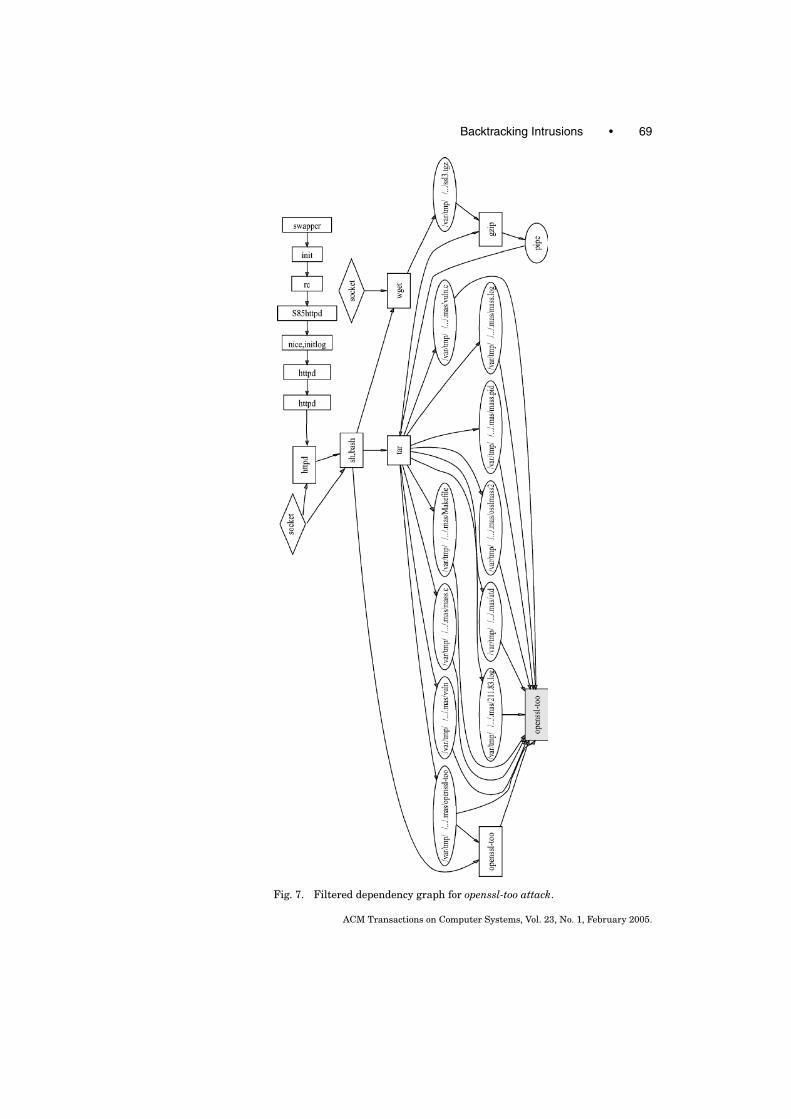
Figure 7 shows the filtered dependency graph for an attack on March 2, 2003,which we named the openssl-too attack. The machine was used lightly by one
ACM Transactions on Computer Systems, Vol. 23, No. 1, February 2005.
Backtracking Intrusions • 67
Fig. 5. Mostly unfiltered dependency graph generated by GraphGen for bind attack. The onlyfiltering used was to not show files that were read but not written. The circled areas and labelsidentify the major portions of the graph. Of particular interest are the files we filter out in laterdependency graphs: /var/run/utmp, /etc/mtab, /var/log/lastlog, /root/.bash history. We will also filterout helper processes that take input from one process (usually via a pipe), perform a simple functionon that input, then return data to the main process. Most objects associated with S85httpd arehelper processes spawned by find when S85httpd starts.
ACM Transactions on Computer Systems, Vol. 23, No. 1, February 2005.
68 • S. T. King and P. M. Chen
Fig. 6. Filtered dependency graph for bind attack.
of the authors (to check for intrusions) during the March 1–3 period covered bythis log. The attacker gained access through httpd, downloaded a tar archiveusing wget, then installed a set of files using tar and gzip. The attacker then ranthe program openssl-too, which read the configuration files that were unpacked.We detected the intrusion when the openssl-too process began scanning othermachines on our network for vulnerable ports.
Another intrusion occurred on our machine on March 13, 2003. The filtereddependency graph for this attack is almost identical to the ptrace attack.
Figure 8(a) shows the default filtered dependency graph for an attack weconducted against our own system (self attack). self attack was more complicatedthan the real attacks we have been subjected to. We gained unprivileged accessvia httpd, then downloaded and compiled a program (sxp) that takes advantageof a local exploit against sendmail. When sxp runs, it uses objdump to findimportant addresses in the sendmail binary, then executes sendmail throughexecve to overflow an argument buffer and provide a root shell. We used this
ACM Transactions on Computer Systems, Vol. 23, No. 1, February 2005.
Backtracking Intrusions • 69
Fig. 7. Filtered dependency graph for openssl-too attack.
ACM Transactions on Computer Systems, Vol. 23, No. 1, February 2005.
70 • S. T. King and P. M. Chen
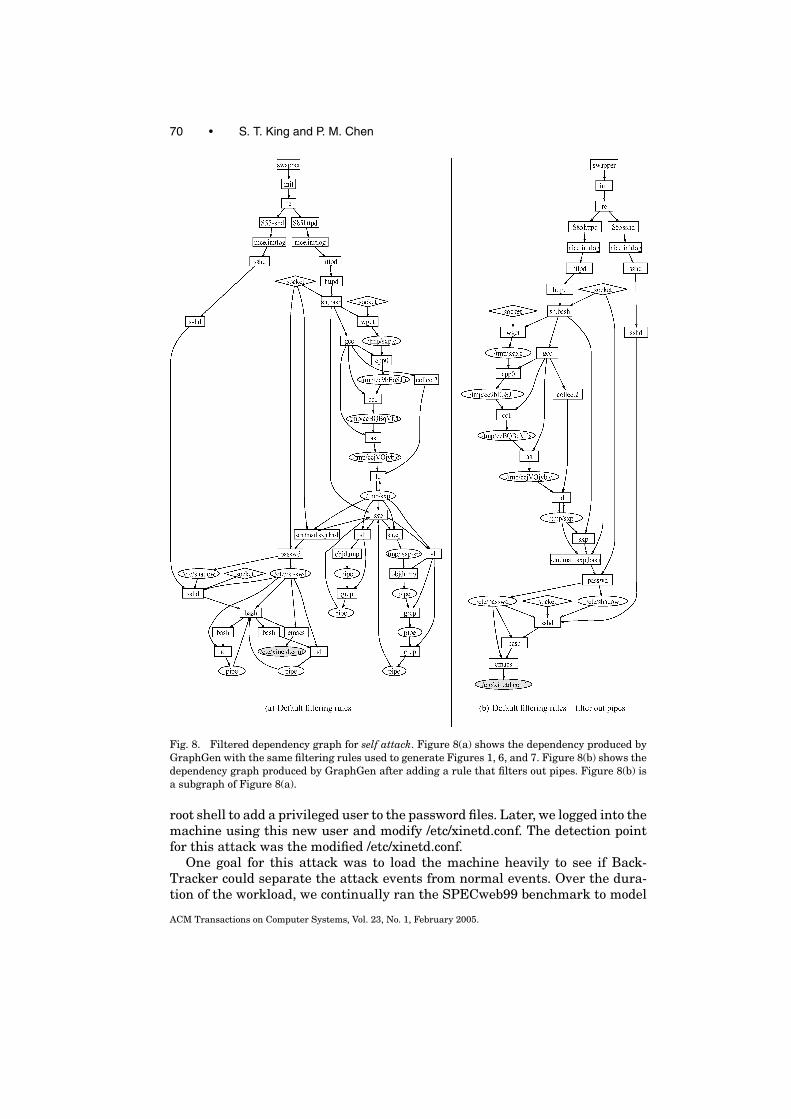
Fig. 8. Filtered dependency graph for self attack. Figure 8(a) shows the dependency produced byGraphGen with the same filtering rules used to generate Figures 1, 6, and 7. Figure 8(b) shows thedependency graph produced by GraphGen after adding a rule that filters out pipes. Figure 8(b) isa subgraph of Figure 8(a).
root shell to add a privileged user to the password files. Later, we logged into themachine using this new user and modify /etc/xinetd.conf. The detection pointfor this attack was the modified /etc/xinetd.conf.
One goal for this attack was to load the machine heavily to see if Back-Tracker could separate the attack events from normal events. Over the dura-tion of the workload, we continually ran the SPECweb99 benchmark to model
ACM Transactions on Computer Systems, Vol. 23, No. 1, February 2005.

Backtracking Intrusions • 71
the workload of a Web server. To further stress the machine, we downloaded,unpacked, and continually compiled the Linux kernel. We also logged in sev-eral times as root and read /etc/xinetd.conf. The dependency graph shows thatBackTracker separated this legitimate activity from the attack.
We anticipate that administrators will run GraphGen multiple times withdifferent filtering rules to analyze an attack. An administrator can filter out newobjects and events easily by editing the configuration file from which GraphGenreads its filter rules. Figure 8(b) shows the dependency graph generated withan additional rule that filters out all pipes. While this rule may filter out someportions of the attack, it will not usually disconnect the detection point from thefrom an intrusion source, because pipes are inherited from a process’s ances-tor, and BackTracker will track back to the ancestor through process creationevents. In Figure 8, filtering out pipes eliminates objdump, which is related tothe attack but not critical to understanding the attack.
Next we measured the space and time overhead of EventLogger (Table I). Itis nontrivial to compare running times with and without EventLogger, becausereal attackers do not reissue their workloads upon request. Instead we usedReVirt to replay the run with and without EventLogger and measure the dif-ference in time. The replay system executes busy parts of the run at the samespeed as the original run (within a few percent). The replay system eliminatesidle periods, however, so the percentage overhead is given as a fraction of thewall-clock time of the original run (which was run without EventLogger).
For the real attacks, the system was idle for long periods of time. The averagetime and space overhead for EventLogger was very low for these runs becauseEventLogger only incurs overhead when applications are actively using thesystem.
The results for self attack represent what the time and space overheads wouldbe like for a system that is extremely busy. In particular, serving Web pagesand compiling the Linux kernel each invoke a huge number of relevant systemcalls. For this run, EventLogger slowed the system by 9%, and its compressedlog grew at a rate of 1.2 GB/day. While this is a substantial amount of data, amodern hard disk is large enough to store this volume of log traffic for severalmonths.
GraphGen is run after the attack (offline), so its performance is not as criticalas that of EventLogger. On a 2.8-GHz Pentium 4 with 1 GB of memory, theversion of GraphGen described in Section 2.3 took less than 20 s to process thelogs for each of the real attacks and 3 h for the self attack. Most of this time wasspent scanning through irrelevant events in the log. We implemented a versionof GraphGen that stores event records in a MySQL database, which allowedGraphGen to query for events that affect specific objects and thereby skip overevents that do not affect objects in the graph [Goel et al. 2003]. This techniquereduced the time needed for GraphGen to process the self attack to 26 s.
6. ATTACKS AGAINST BACKTRACKER
In the prior section, we showed that BackTracker helped analyze several realattacks. In this section, we consider what an intruder can do to hide his actions
ACM Transactions on Computer Systems, Vol. 23, No. 1, February 2005.
72 • S. T. King and P. M. Chen
from BackTracker. An intruder may attack the layers upon which BackTrackeris built, use events that BackTracker does not monitor, or hide his actions withinlarge dependency graphs.
An intruder can try to foil BackTracker by attacking the layers upon whichBackTracker’s analysis or logging depend. One such layer is the guest oper-ating system. BackTracker’s analysis is accurate only if the events and datait sees have their conventional meaning. If an intruder can change the guestkernel (e.g., to cause a random system call to create processes or change files),then he can accomplish arbitrary tasks inside the guest machine without be-ing tracked by BackTracker. Many operating systems provide interfaces thatmake it easy to compromise the kernel or to work around its abstractions. Load-able kernel modules and direct access to kernel memory (/dev/kmem) make ittrivial to change the kernel. Direct access to physical memory (/dev/mem) andI/O devices make it easy to control applications and files without using thehigher-level abstractions that BackTracker tracks. Our guest operating systemdisables these interfaces [Huagang 2000]. The guest operating system may alsocontain bugs that allow an intruder to compromise it without using standardinterfaces [Ashcraft and Engler 2002]. Researchers are investigating ways touse virtual machines to make it more difficult for intruders to compromise theguest operating system, for example, by protecting the guest kernel’s code andsensitive data structures [Garfinkel and Rosenblum 2003].
Another layer upon which the current implementation of BackTracker de-pends is the virtual-machine monitor and host operating system. Attackingthese layers is considerably more difficult than attacking the guest kernel,since the virtual-machine monitor makes the trusted computing base for thehost operating system much smaller than the guest kernel.
If an intruder cannot compromise a layer below BackTracker, he can stillseek to stop BackTracker from analyzing the complete chain of events from thedetection point to the source of the attack. The intruder can break the chainof events tracked if he can carry out one step in his sequence using only low-control events that BackTracker does not yet track. Section 2.4 explains whythis is relatively difficult.
An intruder can also use a hidden channel to break the chain of events thatBackTracker tracks. For example, an intruder can use the initial part of hisattack to steal a password, send it to himself over the network, then log inlater via that password. BackTracker can track from a detection point duringthe second login session up to the point where the intruder logged in, but itcannot link the use of the password automatically to the initial theft of thepassword. BackTracker depends on knowing and tracking the sequence of statechanges on the system, and the intruder’s memory of the stolen password is notsubject to this tracking. However, BackTracker will track the attack back to thebeginning of the second login session, and this will alert the administrator to astolen password. If the administrator can identify a detection point in the firstpart of the attack, he can track from there to the source of the intrusion.
An intruder can also try to hide his actions by hiding them in a hugedependency graph. This is futile if the events in the dependency graph arethe intruder’s actions because the initial break-in phase of the attack is not
ACM Transactions on Computer Systems, Vol. 23, No. 1, February 2005.
Backtracking Intrusions • 73
obfuscated by a huge graph after the initial phase. In addition, an intruderwho executes a large number of events is more likely to be caught.
An intruder can also hide his actions by intermingling them with innocentevents. GraphGen includes only those events that potentially affect the detec-tion point, so an intruder would have to make it look as though innocent eventshave affected the detection point. For example, an intruder can implicate aninnocent process by reading a file the innocent process has written. In the worstcase, the attacker would read all recently written files before changing the de-tection point and thereby implicate all processes that wrote those files. As usual,security is a race between attackers and defenders. GraphGen could addressthis attack by filtering out file reads if they are too numerous and following thechain of events up from the process that read the files. The attacker could thenimplicate innocent processes in more subtle ways, etc.
Finally, an attacker can make the analysis of an intrusion more difficult bycarrying out the desired sequence of steps over a long period of time. The longerthe period of attack, the more log records that EventLogger and GraphGen haveto store and analyze. In conclusion, there are several ways that an intruder canseek to hide his actions from BackTracker. Our goal is to analyze a substantialfraction of current attacks and to make it more difficult to launch attacks thatcannot be tracked.
7. RELATED WORK
BackTracker tracks the flow of information [Denning 1976] across operatingsystem objects and events. The most closely related work is the RepairableFile Service [Zhu and Chiueh 2003], which also tracks the flow of informationthrough processes and files by logging similar events. The Repairable File Ser-vice assumes an administrator has already identified the process that startedthe intrusion; it then uses the log to identify files that potentially have beencontaminated by that process. In contrast, BackTracker begins with a process,file, or filename that has been affected by the intrusion, then uses the log totrack back to the source of the intrusion. The two techniques are complemen-tary: one could use backtracking to identify the source of the intrusion, thenuse the Repairable File Service’s forward tracking to identify the files that po-tentially have been contaminated by the intrusion. However, we believe thatan intruder can hide her actions much more easily from the forward trackingphase, for example, by simply touching all files in the system. Even withoutdeliberately trying to hide, we believe an intruder’s changes to system files willquickly cause all files and processes to be labeled as potentially contaminated.For example, if an intruder changes the password file, all users who subse-quently log into the system will read this file, and all files they modify will belabeled as potentially contaminated.
In addition to the direction of tracking, BackTracker differs from the Re-pairable File Service in the following ways: (1) BackTracker tracks additionaldependency-causing events (e.g., shared memory, mmap’ed files, pipes, andnamed pipes; (2) BackTracker labels and analyzes time intervals for events,which are needed to handle aggregated events such as loads/store to mmap’ed
ACM Transactions on Computer Systems, Vol. 23, No. 1, February 2005.
74 • S. T. King and P. M. Chen
files; and (3) BackTracker uses filter rules to highlight the most importantdependencies. Perhaps most importantly, we use BackTracker to analyze realintrusions and evaluate the quality of the dependency graphs it produces forthose attacks. The evaluation for the Repairable File Service has so far focusedon time and space overhead—to our knowledge, the spread of contaminationhas been evaluated only in terms of number of processes, files, and blocks con-taminated and has been performed only on a single benchmark (SPEC SDET)with a randomly chosen initial process.
Work by Ammann et al. [2002] has tracked the flow of contaminated trans-actions through a database and rolls data back if it has been affected directly orindirectly by contaminated transactions. The Perl programming language alsotracks the flow of tainted information across perl program statements [Wallet al. 2000]. Like the Repairable File Service, both these tools track the for-ward flow of contaminated information rather than backtracking from a detec-tion point to the source of the intrusion.
Program slicing is a programming language technique that identifies thestatements in a program that potentially affect the values at a point of interest[Tip 1995]. Dynamic slicers compute the slice based on a specific set of inputs.BackTracker could be viewed as a dynamic program slicer on a self-modifyingprogram, where variables are operating system objects, and program state-ments are dependency-causing operating system events.
Several other projects assist administrators in understanding intrusions.CERT’s Incident Detection, Analysis, and Response Project (IDAR) seeks todevelop a structured knowledge base of expert knowledge about attacks andto look through the post-intrusion system for signs that match an entry in theexisting knowledge base [Christie 2002]. Similarly, SRI’s DERBI project looksthrough system logs and file system state after the intrusion for clues aboutthe intrusion [Tyson 2001]. These tools automate common investigations afteran attack, such as looking for suspicious filenames, comparing file access timeswith login session times, and looking for suspicious entries in the passwordfiles. However, like investigations that are carried out manually, these tools arelimited by the information logged by current systems. Without detailed eventlogs, they are unable to describe the sequence of an attack from the initialcompromise to the detection point.
8. CONCLUSIONS AND FUTURE WORK
We have described a tool called BackTracker that helps system administratorsanalyze intrusions on their system. Starting from a detection point, such as asuspicious file or process, BackTracker identifies the events and objects thatcould have affected that detection point. The dependency graphs generated byBackTracker help an administrator find and focus on a few important objectsand events to understand the intrusion. BackTracker can use several types ofrules to filter out parts of the dependency graph that are unlikely to be relatedto the intrusion.
We used BackTracker to analyze several real attacks against computers weset up as honeypots. In each case, BackTracker was able to highlight effectively
ACM Transactions on Computer Systems, Vol. 23, No. 1, February 2005.
Backtracking Intrusions • 75
the entry point used to gain access to the system and the sequence of steps fromthe entry point to the point at which we noticed the intrusion.
In the future, we plan to track more dependency-causing events, such asSystem V IPC, signals, and dependencies caused by file attributes. We havealso implemented a tool to track dependencies forward. The combination ofthis tool and BackTracker will allow us to start from a single detection point,backtrack to allow an administrator to identify the source of the intrusion, thenforward track to identify other objects that have been affected by the intrusion.Significant research will be needed to filter out false dependencies when track-ing forward because, unlike for backward tracking, an intruder can easily causean explosion of the dependency graph to include all files and processes.
ACKNOWLEDGMENTS
The ideas in this article were refined during discussions with George Dunlap,Murtaza Basrai, and Brian Noble. Our SOSP shepherd Frans Kaashoek andthe anonymous reviewers provided valuable feedback that helped improve thequality of this article.
REFERENCES
AMMANN, P., JAJODIA, S., AND LIU, P. 2002. Recovery from malicious transactions. IEEE Trans.Knowl. Data Eng. 14, 5 (Sept.), 1167–1185.
ASHCRAFT, K. AND ENGLER, D. 2002. Using programmer-written compiler extensions to catch se-curity holes. In Proceedings of the 2002 IEEE Symposium on Security and Privacy. 131–147.
BUCHACKER, K. AND SIEH, V. 2001. Framework for testing the fault-tolerance of systems includingOS and network aspects. In Proceedings of the 2001 IEEE Symposium on High Assurance SystemEngineering (HASE). 95–105.
CERT. 2000. Steps for recovering from a UNIX or NT system compromise. Tech. rep. CERTCoordination Center. Available online at http://www.cert.org/tech_tips/win-UNIX-system_
compromise.html.
CERT. 2001. Detecting signs of intrusion. Tech. rep. CMU/SEI-SIM-009. CERT CoordinationCenter. Available online at http://www.cert.org/security-improvement/modules/m09.html.
CERT. 2002a. CERT/CC overview incident and vulnerability trends. Tech. rep. CERT Coordi-nation Center. Available online at http://www.cert.org/present/cert-overview-trends/.
CERT. 2002b. Multiple vulnerabilities In OpenSSL. Tech. rep. CERT Advisory CA-2002-23.CERT Coordination Center. Available online at http://www.cert.org/advisories/CA-2002-23.html.
CHESWICK, B. 1992. An evening with Berferd in which a cracker is lured, endured, and studied.In Proceedings of the Winter 1992 USENIX Technical Conference. 163–174.
CHRISTIE, A. M. 2002. The Incident Detection, Analysis, and Response (IDAR) Project. Tech. rep.CERT Coordination Center. Available online at http://www.cert.org/idar.
CIAC. 2001. L-133: Sendmail debugger arbitrary code execution vulnerability. Tech. rep. Com-puter Incident Advisory Capability. Available online at http://www.ciac.org/ciac/bulletins/l-133.shtml.
DENNING, D. E. 1976. A lattice model of secure information flow. Commun. ACM 19, 5 (May),236–243.
DUNLAP, G. W., KING, S. T., CINAR, S., BASRAI, M., AND CHEN, P. M. 2002. ReVirt: Enabling intrusionanalysis through virtual-machine logging and replay. In Proceedings of the 2002 Symposium onOperating Systems Design and Implementation. 211–224.
FARMER, D. 2000. What are MACtimes? Dr. Dobb’s J. 25, 10 (Oct.), 68, 70–74.FARMER, D. 2001. Bring out your dead. Dr. Dobb’s J. 26, 1 (Jan.), 104–105, 107–108.FARMER, D. AND VENEMA, W. 2000. Forensic computer analysis: an introduction. Dr. Dobb’s J. 25,
9 (Sept.), 70, 72–75.
ACM Transactions on Computer Systems, Vol. 23, No. 1, February 2005.
76 • S. T. King and P. M. Chen
FORREST, S., HOFMEYR, S. A., SOMAYAJI, A., AND LONGSTAFF, T. A. 1996. A sense of self for Unixprocesses. In Proceedings of 1996 IEEE Symposium on Computer Security and Privacy. 120–128.
GARFINKEL, T. AND ROSENBLUM, M. 2003. A virtual machine introspection based architecture forintrusion detection. In Proceedings of the 2003 Network and Distributed System Security Sym-posium (NDSS).
GOEL, A., SHEA, M., AHUJA, S., AND CHANG FENG, W. 2003. Forensix: A robust, high-performancereconstruction system. In Proceedings of the 2003 Symposium on Operating Systems Principles(poster session).
GOLDBERG, I., WAGNER, D., THOMAS, R., AND BREWER, E. A. 1996. A secure environment for untrustedhelper applications. In Proceedings of the 1996 USENIX Security Symposium. 1–13.
HUAGANG, X. 2000. Build a secure system with LIDS. Available online at http://www.lids.org/document/build_lids-0.2.html.
KIM, G. H. AND SPAFFORD, E. H. 1994. The design and implementation of Tripwire: A file systemintegrity checker. In Proceedings of 1994 ACM Conference on Computer and CommunicationsSecurity (CCS). 18–29.
KING, S. T., DUNLAP, G. W., AND CHEN, P. M. 2003. Operating system support for virtual machines.In Proceedings of the 2003 USENIX Technical Conference. 71–84.
KIRIANSKY, V., BRUENING, D., AND AMARASINGHE, S. 2002. Secure execution via program shepherding.In Proceedings of the 2002 USENIX Security Symposium.
LAMPORT, L. 1978. Time, clocks, and the ordering of events in a distributed system. Commun.ACM 21, 7 (July), 558–565.
LAMPSON, B. W. 1973. A note on the confinement problem. Commun. ACM 16, 10 (Oct.), 613–615.THE HONEYNET PROJECT. 2001. Know Your Enemy: Revealing the Security Tools, Tactics, and Mo-
tives of the Blackhat Community. Addison Wesley, Reading, MA.TIP, F. 1995. A survey of program slicing techniques. J. Programm. Lang. 3, 3.TYSON, W. M. 2001. DERBI: Diagnosis, explanation and recovery from computer break-ins. Tech.
rep. DARPA Project F30602-96-C-0295 Final Report. SRI International, Menlo Task, CA. Artifi-cial Intelligence Center. Available online at http://www.dougmoran.com/dmoran/publications.html.
WALL, L., CHRISTIANSEN, T., AND ORWANT, J. 2000. Programming Perl, 3rd ed. O’Reilly & Associates,Sebastopol; CA.
ZHU, N. AND CHIUEH, T. 2003. Design, implementation, and evaluation of repairable file service. InProceedings of the 2003 International Conference on Dependable Systems and Networks (DSN).217–226.
Received October 2003; revised July 2004; accepted May 2004
ACM Transactions on Computer Systems, Vol. 23, No. 1, February 2005.