Embed Size (px)
Citation preview

Background to Southern and Eastern Scalefish andShark Fishery

2
Table of ContentsBACKGROUND TO SOUTHERN AND EASTERN SCALEFISH AND SHARKFISHERY......................................................................................................................1
TABLE OF CONTENTS ............................................................................................2
LIST OF TABLES .......................................................................................................3
LIST OF FIGURES .....................................................................................................3
1. THE CURRENT FISHERY MANAGEMENT ................................................41.1. THE SESSF MANAGEMENT TOOLBOX.............................................................41.2. HISTORY OF EACH SECTOR ..............................................................................6
SETF ...............................................................................................................................................6GABTF............................................................................................................................................6GHATF............................................................................................................................................6Shark hooks.....................................................................................................................................7Gillnets............................................................................................................................................7Fish traps ........................................................................................................................................7Inside 3nm.......................................................................................................................................7Scalefish hook .................................................................................................................................7Automatic longlines ........................................................................................................................7
2. TRENDS IN KEY FISHERY CHARACTERISTICS .....................................82.1. THE SESSF FISHING FLEET .............................................................................8
Boats ...............................................................................................................................................8Electronics ....................................................................................................................................10Fishing gear..................................................................................................................................10
2.2. THE LANDED CATCH......................................................................................112.3. THE DISCARDS ..............................................................................................172.4. PROTECTED, ENDANGERED AND THREATENED SPECIES INTERACTIONS .......172.5. EFFORT IN THE FISHERY ................................................................................282.6. QUOTA TRADING...........................................................................................342.7. QUOTA MOVEMENT – GHATF SECTOR ........................................................342.8. CROSS SECTOR LEASING................................................................................372.9. PORT OF LANDING ........................................................................................392.10. MANAGEMENT COSTS...............................................................................40
3. LIST OF ACRONYMS .....................................................................................43
4. REFERENCES...................................................................................................44

3
List of TablesTABLE 1 KEY MANAGEMENT EVENTS IN THE SESSF 1986 - 2005TABLE 1: KEY MANAGEMENT EVENTS
IN THE SESSF 1986 - 2005..............................................................................................................4TABLE 2 TARGET, QUOTA AND MAJOR BYPRODUCT SPECIES TAKEN IN THE SESSF (AFMA 2002) ........11TABLE 3 HISTORY OF ITQ IMPLEMENTATION IN THE FISHERY ................................................................34
List of FiguresFIGURE 1 NUMBER OF BOATS FISHED IN THE SESSF 1986 - 2003.............................................................8FIGURE 2 TOTAL CATCHES BY SECTOR 1986 - 2002................................................................................14FIGURE 3 CATCHES OF MAIN SPECIES BY SECTOR 1986 - 2002................................................................15FIGURE 4 CATCHES OF NON-MAIN SPECIES 1986 - 2002..........................................................................16FIGURE 16. SETF FLEET MOBILITY: AVERAGE DISTANCE BETWEEN THE SHOT AND THE PORT OF
LANDING........................................................................................................................................28FIGURE 17 SETF FLEET MOBILITY BY PORT............................................................................................29FIGURE 18 EXAMPLE OF FLEET MOBILITY FROM EDEN............................................................................29FIGURE 19 SESSF CATCH AN EFFORT BY SECTOR ..................................................................................30FIGURE 20 BLUE EYE TREVALLA QUOTA UNITS OWNED BY STATE - 1998 & 2003 ................................35FIGURE 21 GUMMY SHARK QUOTA UNITS OWNED BY REGION FOR 2001 & 2003 FOR GHATF...............35FIGURE 22 SCHOOL SHARK QUOTA UNITS OWNED BY REGION FOR 2001 & 2003 FOR GHATF...............36FIGURE 23 1992 SETF QUOTA OWNED...................................................................................................36FIGURE 24 2001 SETF QUOTA OWNED...................................................................................................37FIGURE 25 CROSS SECTOR LEASING FROM SETF TO GHATF 2001 AND 2003........................................38FIGURE 26 CROSS SECTOR LEASING FROM GHATF TO SETF 2001 AND 2003........................................38FIGURE 27 SETF 2003 LANDINGS BY PORT ............................................................................................39FIGURE 28 GHATF 2003 LANDINGS BY PORT ........................................................................................39FIGURE 29 GABTF 2003 LANDINGS BY PORT ........................................................................................40FIGURE 30 ACTUAL MANAGEMENT COSTS - SETF .................................................................................40FIGURE 31 ACTUAL MANAGEMENT COSTS GHATF ................................................................................41FIGURE 32 ACTUAL MANAGEMENT COSTS GABTF ................................................................................41FIGURE 33 GVP FOR SECTOR OF THE SESSF 1998-2003 ........................................................................42

4
1. The current fishery managementHistorically, the Southern and Eastern Scalefish and Shark Fishery (SESSF) has beenmanaged as four separate fisheries, the South East Trawl Fishery (SETF), the South EastNon-trawl Fishery (SENTF), the Southern Shark Fishery (SSF) and the Great AustralianBight Trawl Fishery (GABTF). In 2002, the SENTF and the SSF were merged to formthe Gillnet, Hook & Trap Fishery (GHATF).
The SESSF covers the area of waters from around 80nm off the coast near Fraser IslandQueensland to Cape Leeuwin, Western Australia. The area of this fishery covers nearlyhalf of the waters within the Australian Fishing Zone (AFZ) of mainland Australia andTasmania. The SESSF has complex jurisdictional arrangements, because of differentOffshore Constitutional Settlements (OCS) with all Australian States. (AFMA 2002)
AFMA has brought all these fisheries together through the development of the Southernand Eastern Scalefish and Shark Management Plan 2003 to best pursue the futuredirection for this fishery.
Under this new structure the fishery will be divided into a number of different sectors.These are the South East Trawl Sector, Great Australian Bight Trawl Sector, ScalefishHook Sector, Shark Hook Sector and Gillnet Sector.
1.1. The SESSF management toolboxThe SESSF is managed using a mixture of input and output controls. There is a limit onthe number of boats that operate in each sector as well as limits on mesh size and theamount of fishing gear that can be used. Individual Transferable Quota (ITQs) wereintroduced into the SETF in 1992 for 16 scalefish species. In the SENTF, ITQs wereintroduced for 3 key species in 1998, with the remaining SETF scalefish species in 2002.ITQs for school and gummy shark were introduced to SSF, SETF and GABTF in 2001,ITQs for elephant fish family and saw shark were introduced in 2002 to the SETF, SSFand GABTF. ITQs for all the shark species were introduced in the SENTF in 2003.
There are a small number of closures in the area of the SESSF. These relate tocomplementary arrangements with the States as a result of OCS agreements (ie MuratsBay netting closure), conservation areas around Norfolk Island, shark closures ie Head ofthe Bight and 3nm off Victoria and the Cascade Plateau
Table 1 Key management events in the SESSF 1986 - 2005Table 1: Keymanagement events in the SESSF 1986 - 20051986 Introduction of a ‘boats unitisation’ system.Late 1980s Development of orange roughy fishery1987-88 Freeze on unit transfer between trawl and Danish seine fleets.1988 First total allowable catch limit introduced, for eastern gemfish.1989 Total allowable catch limits introduced for orange roughy off eastern
Tasmania.1990 Total allowable catch limits introduced for orange roughy off southern
Tasmania1992 Total allowable catch limits and ITQs introduced throughout the SETF
for a further 14 species or species groups.1993 10% Carryover of quota species credits or debits; a zero TAC introduced

5
for eastern gemfish.1993 The Great Australian Bight Trawl Fishery became the first fishery to be
managed under the Fisheries Management Act 1991 when aManagement Plan was introduced in July 1993. The Plan grantedstatutory fishing rights to 10 vessels fulfilling performance criteriaduring the preceding three-year development phase of the fishery.
1994 20% carryover for all quota species, surrender of quota for operatorswho exceeded 20% carryover (except for eastern gemfish), fulltransferability of quota, Vessel Monitoring System (VMS) madecompulsory for the orange roughy fleet and introduction of two-hourprior reporting for all operators.
1997 The Federal government provided up to $6.9 million in adjustmentfunding that bought out 27 permits and 17 operators received ‘targetedfinancial assistance’ in the form of a payment for the loss of asset valueof fishing entitlements in the change to the ITQ system.
1998 ITQs for blue eye trevalla, ling and blue warehou were introduced forthe SENTF.
2000 Federal government funded $400,000 assistance package for SENTFblue eye trevalla quota holders. The government bought SENTF blueeye trevalla quota by tender and reallocated to the remaining operatorsas a share of that quota in proportion to their 1998/99 average catch ofthis species.
2000 Federal government provided funding of $2.3 million to the SSFindustry development program that bought out 40 SSF permits tofacilitate the move to ITQs.
2001 Introduction of ITQs for school and gummy shark for SSF, SETF andGABTF.
Introduction of ITQs for the remaining 13 SETF scalefish quota speciesfor SENTF operators.
OCS arrangements with the States of Victoria, South Australia andTasmania in relation to school and gummy shark come into effect.
2002 Introduction of ITQs major SSF byproduct species – elephant fish andsaw shark This also applied to SETF and GABTF for sawshark, howeverthe GABTF were on a 50kg trip limit.Cascade Plateau closed to SENTF operators.
2003 The SENTF and SSF were merged into the GHATF. All trip limits forscalefish and shark quota species were removed and ITQs applied to allsectors. However, a 100kg trip limit (also covered by quota) on sharkquota species applies to scalefish hook operators.
2003 On 23 September 2003, Minister Ian MacDonald signed and acceptedthe Southern and Eastern Scalefish and Shark Fishery Management Plan2003.
2004 As a result of litigation, a reallocation of school and gummy shark quotais undertaken for the former SSF operators.
2005 Boat and scalefish quota statutory fishing rights come into effect underthe SESSF Management Plan.

6
1.2. History of each sector
SETFThe SETF is one of Australia’s oldest fisheries and can be traced back to 1915 (Klaer2001). Fishing takes place using otter trawls, mid water trawls and Danish Seine methodsin areas of the continental shelf, continental slope and some deepwater pinnacles. (AFMA2002).
Whilst this is a multi-species fishery, the key commercial species are blue grenadier,flathead, spotted warehou, orange roughy and ling. Twenty commercial species aremanaged by total allowable catches, allocated as individually transferable quotas. Thefishery has many by-product and bycatch species, however, the majority of these arelanded in very small amounts. (AFMA 2002)
GABTFDemersal trawling in the GABTF began in 1912. There was intermittent commercialtrawling in this area up until 1986, but most ventures were short-lived, generally beinghindered by inadequate vessels, poor cold storage facilities and the distance of the fishinggrounds from eastern markets. (Tilzey and Wise 1999).
The fishery began to develop in the late 80’s with the discovery of orange roughy. Fishingtakes place using demersal and mid-water trawling. In July 1993, the GABTF became thefirst fishery to be managed under the Fisheries Management Act 1991, The managementplan granted statutory fishing rights to 10 vessels fulfilling performance criteria duringthe preceding three-year developmental phase of the fishery (Tilzey and Wise 1999).
Most of the fishing activity comprises targeting deepwater flathead and Bight redfish onthe continental shelf, or orange roughy on deepwater pinnacles. There are severalbyproduct species and a range of bycatch species. The fishery is mostly managed by inputcontrols (only 10 vessels are allowed to operate in the fishery). Output controls are inplace for four shark species. (AFMA 2002) Small catches of the SETF scalefish quotaspecies are also taken as byproduct and bycatch.
GHATFThe GHATF was created in 2003 by merging the previously separately managed SouthEast non-trawl and Southern Shark Fisheries into a single fishery. This approach wastriggered by the determination of the SESS Plan (AFMA 2003).
The SENTF can be traced back to the early 1900s. Vessels operating in the fishery usedemersal longlines, droplines, gillnets or traps to target scalefish species such as blue eyetrevalla and pink ling.
The SSF can be traced back to 1927. Operators use gillnets and demersal longlines totarget gummy shark and small amounts of school shark. Elephant fish and saw shark are amajor byproduct of this fishery.
Today, operators in the GHATF use a variety of fishing methods including demersalgillnets, droplines, demersal longlines and traps. It must be noted however that GHATFoperators are only permitted to fish using the gear/methods specified on their fishingpermit. Under the SESS Plan the GHATF has been split into a number of sectors:

7
Shark hooksShark hook operators use demersal longlines to target shark. There are no limitsapplicable to the number of hooks that can be attached to each of these lines for operatorsfishing outside 3nm.
GillnetsGillnets are typically used in the GHATF to target gummy shark. They are excluded fromwaters below 41o South and deeper than 200 metres. Gillnet operators in the GHATF arepermitted to use up to 4,200m (outside 3nm) regardless of any limits that have applied inthe past. All mesh sizes must be greater than or equal to 15 centimetres and less than orequal to 16.5 centimetres.
Fish trapsFive operators in the Fishery are permitted to use fish traps, however these fishingconcessions were granted on the basis that the operators had historical access to thismethod. AFMA is not issuing any further fish trap entitlements in the GHATF.
Inside 3nmAn operator fishing inside 3nm may use a variety of types and combinations of gear(gillnet or hooks). These gear types are specified on the fishing permit and are based onthe gear specified on operators’ previous State fishing concession. This is a result ofvarious OCS agreements between the Commonwealth and the States.
Scalefish hookThere are four demersal scalefish hook methods (demersal longline, dropline, trotline andhandline) permitted in the GHATF. These methods are used primarily to target speciessuch as blue eye trevalla, ling and blue warehou. No limits apply to the number of hooksthat can be attached to each of these lines for operators fishing outside 3nm. Scalefishhook operators are limited to a 100kg of shark quota species per trip. This trip limit mustalso be covered by quota.
Automatic longlinesAuto longlining is a similar process to demersal longlining except that some of thefunctions are automated, allowing operators to set and haul a greater number of hooks bya single vessel. AFMA has approved the Mustad and the Best Fishing Gear (BFG)automatic longline systems for use in the GHATF, subject to specific conditions, whichapply to each system.
AFMA has authorised 15 scalefish hook fishing permits to use automatic longlining gear.The AFMA Board has placed a moratorium on issuing any further auto longlining fishingpermits until the end of December 2004, when all scalefish hook operators can apply touse this method.

8
2. Trends in key fishery characteristics
Commonwealth scientific logbooks have been compulsory in the south east trawl sectorsince 1985 and in the non-trawl and shark sectors since 1997. Prior to 1997, shark andnon-trawl operators completed State logbooks. This data has been collated and is used inassessments. Landings are also recorded through the quota monitoring system by catchdisposal records (CDRs). The collection of age-length data for scalefish was conductedby State agencies and often sporadic or duplicated prior to 1991. The Central AgingFacility (CAF) was established in 1991 to conduct age estimation for these fisheries(AFMA 2002).
The Integrated Scientific Monitoring Program (ISMP) was implemented in 1997 toreplace the Scientific Monitoring Program in the SETF. It provides statistically rigorousport-based and at sea monitoring in the south-east trawl, hook sectors of the GHATF andGAB trawl sectors of this fishery. ISMP provides important information on discards, non-commercial species and non-quota commercial species, which was previously notcollected (AFMA 2002).
2.1. The SESSF fishing fleet
Boats
The SESSF fleet is made up of a diverse range of boats using a variety of fishing gear.
Number of boats fished
0
20
40
60
80
100
120
140
160
180
19861987
19881989
19901991
19921993
19941995
19961997
19981999
20002001
20022003
Year
Num
ber SETF
GHATFGABTF
Figure 1 Number of boats fished in the SESSF 1986 - 2003

9
Figure 1 details the number of boats that have fished in each sector since formalCommonwealth logbook programs have been introduced. More than one boat may fish onthe same permit in one year and in this analysis it would be counted as two boatsoperating. In the GHATF, the number of boats fishing increased in 2001 as a result of theadditional permits AFMA issued as a result of the school and gummy shark OCSAgreements. This is where previously State licensed shark operators were required tohold a Commonwealth permit to take school and gummy shark.
The SETF fleet can be broken down into four sub-fleets.
• the NSW Coast fleet, characterised by “wet” boats that catch a variety of speciesfor the local markets; these boats are mostly made of wood and have an averagelength of 18.8m.
• the Western Bass Strait fleet, which mostly targets orange roughy, blue grenadierand any other nigh priced market species; these boats are all made of steel andhave an average length of 22.7m.
• the Southern NSW (Eden), East Victoria, East Tasmania fleet consisting ofmedium size boats averaging 19.2m in length; these boats are mostly ex-orangeroughy boats that now target a variety of species.
• The Dedicated Deepwater fleet comprising of boats, which mainly target deep-water species such as orange roughy and blue grenadier; these boats are made ofsteel and have an average length of 31.6m.
• Danish Seine fleet based out of Lakes Entrance, mostly made of wood or steelaveraging 16 metres in length. They generally target flathead and school whiting.
Source: (Sachse and O’Brien 1995)
The SETF fleet is an old fleet, with an estimated 40% of vessels over thirty years oldand just over 80%, 20 years or older. Most of the vessels over thirty years old arewooden: with few exceptions, vessels under 30 years of age are usually constructed ofsteel (FERM 2004). With data on the age of the GHATF and GABTF fleet is scarce,similar assumptions can also apply.
The GABTF fleet is all made of steel and average 31 metres in length. They aretypically targeting Bight redfish and Deepwater flathead in waters deeper than 200mwith targeted orange roughy fishing on the various pinnacles in the far east and westof the fishery.
The GHAT fleet comprises the scalefish hook sector that is mostly boats made of steelaveraging 17 metres. This fleet is primarily based in Tasmania. The shark hook sectoris a smaller fleet averaging 15 metres with most active operators based in Tasmaniaand South Australia. The gillnet sector is primarily based in Victoria and SouthAustralia, although during a fishing trip these boats will fish waters adjacent toTasmania. These boats are made from steel or wood and average 15 metres in length.

10
Electronics
The wheelhouse of a typical SESSF boat has an array of electronic equipmentincluding depth sounders, Global Positioning Systems (GPS), sonar’s and variouscommunications equipment. Since the mid to late 80’s the application of fishingtechnology was lead by the orange roughy fleet which needed the expensiveelectronic equipment to target orange roughy. Following satellite navigation, therewere GPS/plotters for accurate position fixing. Net-monitors, echo-sounders on theheadline of the net, enabled the net to be flown down rough slopes. In the early 90’sthe fleet adopted net link software that provided a graphical presentation of where thenet was in relation to bottom topography. This allowed fishers to access rougher areasto trawling without the loss of fishing gear. Today, the deepwater fleet has differentialGPS and 3D plotters that are interfaced with the GPS and sounders. The inshore trawlfleet and the dropline/gillnet fleet lagged behind in adopting this electronictechnology, however as the cost of this equipment became more affordable it wasadopted. Some of the larger GHATF fleet are now using 3D plotters that areinterfaced with the GPS and sounders. (Phil Sandmann, pers. comm).
Fishing gear
Fishing gear used by operators in the SESSF has evolved over time with thedevelopment of new target species. The change from Danish seine to the traditionallydesigned bottom hugging demersal nets began this process for the trawlers. The socalled “traditional net”, “scratch net” or “spag net” was originally the cod end of aDanish seine adapted for faster towing (Prince, Baelde, Wright 1997).
Since the advent of the quota system, fishers have developed a high flying, light cut-away nets with rubber foot lines with higher towing speeds in order to optimise mixedspecies catch rather than catches of any particular species. (Prince, Baelde, Wright1997). There has been a long term trend for the otter trawl fleet to move towardsusing larger bottom gear over a larger proportion of the shelf and slope substrate.Initially the inshore and upper slope fleet principally used bare chain for their footlinewhich restricted the range of bottom types they could trawl. While the orange roughyfleet has always found it necessary to employ large (300-500mm) bobbin gear toallow their nets to roll over rough sea-mount slopes. As inshore and slope vesselshave competed more intensely in recent years, and an increasing number of formerorange roughy fleet have turned to fishing the shelf and slope the size of the bobbingear being used in these areas has increased together with access to formerlyuntrawled ground.
Scalefish hook operators use to use droplining as their main method to target blue eyetrevalla, however many operators have been granted automatic longline permits andnow target ling and blue eye trevalla. This has allowed these operators to setapproximately 2000 hooks when droplining to up to 15,000 hooks when using theautomatic longline system.

11
Demersal longlines were the original method used to catch shark but were replaced bydemersal gillnets during the second half of the 1960’s and early 70’s. Monofilamentgillnets were introduced into the fishery at Lakes Entrance, Victoria during 1964(Walker 1999). Gillnets used to target shark are normally up to 20 meshes deep,however, in the late 80’s and early 90’s gillnets up to 60-80 mesh deep have beendeveloped for deeper deployment targeting scalefish like blue eye trevalla, ling andblue warehou.
2.2. The landed catch
Fishers in the SESSF target numerous species of fish, shark and one species of prawn. Anumber of fish and shark species are taken as byproduct species and some species aretargeted by several sectors in this fishery. The major target and byproduct species areunder quota in SETF and GHATF. (AFMA 2002)
The SETF takes around 390 species of finfish and invertebrates. However, only 85targeted or byproduct species constitute 99% of the landed catch weight. Four speciesconstitute more than 75 percent of the landed trawl tonnage and one species, bluegrenadier, constituted 36 percent of the landed weight in 2001. (Smith and Wayte 2002).
The major target species of the shark and non-trawl sectors are taken as either target orbyproduct species in the trawl sector. The GAB trawl sector targets three species,deepwater flathead, bight redfish and orange roughy which make up 65% of the totalcatch. (AFMA 2002).
Table 2 Target, quota and major byproduct species taken in the SESSF (AFMA2002)
Species Targeting practicesBlue eye trevalla Targeted by dropliners, also taken as incidental catch by
trawlers off western Tasmania and when targeting alfonsino inthe ECDWZ.Targeted by trawlers, mainly off western Tasmania duringwinter.
Blue warehou Historically have been targeted by gillnet, longline and trawlerstargeting has been reduced in recent years
Flathead Targeted by Danish seiners, mainly operating out of LakesEntrance
Gemfish(eastern)
Historically have been targeted on their spawning run up theeast coast of NSW, now caught as byproduct
Gemfish(western)
Caught mainly in the winter blue grenadier trawl fishery offwestern Tasmania and in the GAB trawl fishery on the shelf.
Jackassmorwong
Targeted by trawlers in southern NSW and eastern Bass Strait.Also caught as byproduct by Danish seiners and trawlers in theGAB
John dory Primarily caught as byproduct in targeted flathead, redfish andjackass morwong shots by trawlers and Danish seiners insouthern NSW and eastern Bass Strait
Ling Targeted by trawlers, mainly in winter off western Tasmania,also by demersal longlines (including autolongliners) and traps.
Mirror dory Mainly taken as byproduct by trawlers, historically high catches

12
Species Targeting practiceswere taken when targeting eastern gemfish
Ocean perch Some of the catch is targeted by trawlers, the remainder is takenas byproduct by trawlers, Danish seiners and dropliners
Orange roughy(eastern)
Targeted by trawlers targeting large aggregations
Orange roughy(southern)
Targeted by trawlers targeting large aggregations
Orange roughy(western)
Largely targeted by trawlers targeting large aggregations butalso in a mixed bag at night with black shark and oreo.
Orange roughy(western)
Targeted by trawlers targeting large aggregations
Orange roughy(CascadePlateau)
Targeted by trawlers targeting an aggregation
Redfish Targeted by trawlers in southern NSW, also taken as byproductby Danish seiners targeting flathead and morwong
Royal redprawns
Targeted by deep water prawn trawlers with prawn gear
School whiting Mainly taken as targeted catch of Danish seiners, some asbyproduct of targeted flathead shots
Silver trevally Mainly taken as byproduct by trawlers, with small catches bygillnets and line methods
Spotted warehou Targeted by trawlers mainly during winter from depths of 150-250m, also caught as byproduct by trawlers in the winter bluegrenadier fishery
Gummy shark Targeted by gillnets and demersal longlines, also caught asbyproduct by trawlers
School shark Historically have been targeted by gillnet and longline, alsotaken as byproduct by trawlers
Sawshark Taken as byproduct by gillnets, demersal longlines and trawlersElephant fish Mainly taken as byproduct by gillnets, also by trawlers and
demersal longlines. Deepwater chimaeras are also covered bythis quota and are caught as byproduct by trawlers
Deepwaterflathead
Targeted by trawlers in the GAB trawl sector in shelf waters
Bight redfish Targeted by trawlers in the GAB trawl sector in shelf watersOreos Mainly taken as byproduct of targeted orange roughy fishing, or
as similarly targeted shots on oreo aggregations, also taken as abyproduct of night time trawling of deep flats for black sharkand roughy.
Oreos Mainly taken as byproduct during targeted orange roughyfishing
Alfonsino Targeted by trawlers in the ECDWZ, also taken as byproduct insome orange roughy shots
Barracouta Can be targeted by trawlers, but little has recently occurred dueto the lack of market for this species. Some is taken asbyproduct of warehou trawling
Ribbonfish Historically taken as byproduct by trawlers targeting eastern

13
Species Targeting practicesgemfish
Arrow squid Trawlers can target squid, but most of the catch is frombyproduct of trawling over shelf waters
Hapuku Can be targeted by dropliners, but mainly taken as byproductwith blue eye trevalla
A full description of the biological parameters for the quota and major non-quota speciescan be found in the Southern and Eastern Scalefish and Shark Fishery StrategicAssessment Report, AFMA November 2002 or www.afma.gov.au

GABTF
0
1000
2000
3000
4000
5000
6000
1986
1988
1990
1992
1994
1996
1998
2000
2002
Cat
ch (t
)
Main species
All other species
SETF
0
10000
20000
30000
40000
50000
60000
70000
1986
1988
1990
1992
1994
1996
1998
2000
2002
Cat
ch (t
)
Orange roughyBlue grenadierOther quota speciesNon-quota species
Gillnet
0
500
1000
1500
2000
2500
3000
1986
1988
1990
1992
1994
1996
1998
2000
2002
Cat
ch (t
)
Main species
All other species
Shark hook
0
20
40
60
80
100
1986
1988
1990
1992
1994
1996
1998
2000
2002
Cat
ch (t
)
Main species
All other species
Scalefish hook
0
200
400
600
800
1000
1986
1988
1990
1992
1994
1996
1998
2000
2002
Cat
ch (t
)
Main species
All other species
Figure 2 Total catches by sector 1986 - 2002

15
GABTF
0
1000
2000
3000
4000
5000
1986
1988
1990
1992
1994
1996
1998
2000
2002
Catc
h (t)
Orange roughy
Gummy shark
School shark
Bight redfish
Deepwater flathead
SETF
0
4000
8000
12000
16000
1986
1988
1990
1992
1994
1996
1998
2000
2002
Catc
h (t)
Ro yal red p rawns
Sp ot ted wareho u
Blue wareho u
Blue eye
Gemfis h
J ackas s morwo ng
Silver t revally
Scho o l whit ing
Tig er flathead
Ocean p erch
J ohn d o ry
Mirror d o ry
Redfis h
Ling
Gillnet
0
500
1000
1500
2000
2500
1986
1988
1990
1992
1994
1996
1998
2000
2002
Catc
h (t)
Ling
Elephant fish
Blue eye
Saw sharks
Blue warehou
School shark
Gummy shark
Shark hook
0
20
40
60
80
1986
1988
1990
1992
1994
1996
1998
2000
2002
Catc
h (t)
School shark
Gummy shark
Scalefish hook
0
200
400
600
800
1986
1988
1990
1992
1994
1996
1998
2000
2002
Cat
ch (t
)
Ling
Blue eye
Figure 3 Catches of main species by sector 1986 - 2002

16
Triglidae -gurnardsSquantina - angel sharksPentacerotidae - boarfishesMonacanthidae - Chinaman leatherjacketGempylidae - gemfishes, barracouta and oilfishCarangidae - mackeral and kingfishOreosomatidae - oreosSqualidae - dogfishesCephalopoda - arrow squidTriakidae - houndsharks
Centrolophidae - warehousCarcharhinidae - whaler, tiger and blue sharksHexanchidae - seven gill sharksSparidae - snapperMylobatididae - eagle raysSerranidae - hapukuScorpaenidae - ocean perchMoridae - ribaldoCheilodactylidae - jackass morwong
GABTF
0
500
1000
1500
2000
1986
1988
1990
1992
1994
1996
1998
2000
2002
Cat
ch (t
)Gemfishes
Chinaman leatherjacket
Boarfishes
Angel sharks
Gurnards
All others
SETF
0
1000
2000
3000
4000
5000
6000
7000
1986
1988
1990
1992
1994
1996
1998
2000
2002
Catc
h (t)
Arrow squid
Dogfishes
Oreos
Barracouta and oilfish
Mackeral and kingfish
All others
Gillnet
0
100
200
300
400
1986
1988
1990
1992
1994
1996
1998
2000
2002
Cat
ch (t
)
Boarfishes
Whaler, t iger and bluesharksWarehous
Seven gill sharks
Houndsharks
All others
Shark hook
0
2
4
6
8
10
12
14
1986
1988
1990
1992
1994
1996
1998
2000
2002
Cat
ch (t
)
Whaler, t iger and bluesharksWarehous
Seven gill sharks
Eagle rays
Snapper
All others
Scalefish hook
0
50
100
150
200
250
1986
1988
1990
1992
1994
1996
1998
2000
2002
Cat
ch (t
)
Jackass morwong
Ribaldo
Ocean perch
Hapuku
Houndsharks
All others
Figure 4 Catches of non-main species 1986 - 2002

2.3. The discardsDiscarding of quota and non-quota species vary considerably between sectors of thisfishery. Key drivers that affect discarding rates are market influences and seasonalvariations in stock abundance that are not incorporated in the current TAC settingprocess. The trawl sectors are currently trialing various gear modifications like largermesh sizes to reduce discarding.
One of the roles of the ISMP is to calculate discard rates for each sector of the fishery.Discarding rates and weights are presented in Figures 6 to 15.
2.4. Protected, Endangered and Threatened Speciesinteractions
Most sectors of this fishery interact or are likely to interact with protected species.There have been recorded deaths of seals, dolphins, great white sharks, syngnathids,turtles, albatross and mutton birds. Up until the commencement of the 2003/06contract, the ISMP, which monitors all sectors excluding the former SSF, onlyrecorded the actual catches of protected species. The program now records anyinteraction with protected species.
Fishery Protected species interacted with
SETF Fur seals, spiny pipefish, White’s seahorse, great white shark,grey nurse shark
GABTF None recorded
SSF Great white shark, dolphin, fur seals, mutton bird (wedge-tailed shearwater), albatross, turtle
SENTF Fur seals
Note: The above is based on available information. The amount of informationavailable is not necessarily even across the fisheries (eg. the monitoring program inthe SETF has been running for a longer time than in other sectors.) (AFMA 2002).

Figure 6 GABTF discard rates
Average of >20%
Average of 5-10%
Average of 10-20%
Average of <5%
0
0.1
0.2
0.3
0.4
0.5
2001 2002 2003
Dis
card
ed ra
te (%
)
Bight Redfish
Deepwater flathead
Orange roughy
none
none
0
20
40
60
80
2001 2002 2003
Dis
card
ed ra
te (%
)
Total other

19
Figure 7 GABTF discard weights
Average of <5% Average of 5-10%
Average of 10-20% Average of >20 %
0
0.5
1
1.5
2
2001 2002 2003
Dis
card
ed w
eigh
t (t)
Bight Redfish
Deepwater flathead
Orange roughy
none
none
0
500
1000
1500
2000
2001 2002 2003
Dis
card
ed w
eigh
t (t)
Total other

20
Figure 8 SETF discard rates
Average of <5% a
0
2
4
6
8
1998 1999 2000 2001 2002 2003
Dis
card
ed ra
te (%
)
Silver trevally
Blue grenadier -spawningSchool whiting -danish seineRoyal red prawn
Pink ling
0
2
4
6
8
10
12
14
1998 1999 2000 2001 2002 2003
Dis
card
ed ra
te (%
)
John dory
Jackass morwong
Orange roughy
Blue eye trevalla
Western gemfish
0
10
20
30
40
50
60
1998 1999 2000 2001 2002 2003
Dis
card
ed ra
te (%
)
T iger flathead
Blue warehou
Blue grenadier -nonspawning
0
10
20
30
40
50
1998 1999 2000 2001 2002 2003
Dis
card
ed ra
te (%
)
SpottedwarehouEastern gemfish
Ocean perch -offshoreSchool whiting
Mirror dory
Average of <5% b
Average of 5-10% Average of 10-20%

21
Total quota and non-quota
Figure 9 SETF discard rates
Average of >20%
0
20
40
60
80
1998 1999 2000 2001 2002 2003
Dis
card
ed ra
te (%
)
Ocean perch - inshore
Redfish
0
20
40
60
80
1998 1999 2000 2001 2002 2003
Dis
card
ed ra
te (%
) Total quota
Nonquota

22
Figure 10 SETF discard weights
Average of <5% a Average of <5% b
0
25
50
75
100
125
150
1998 1999 2000 2001 2002 2003
Dis
card
ed w
eigh
t (t)
Silver trevally
Blue grenadier -spawningRoyal red prawn
Pink ling
School whiting -danish seine
0
500
1000
1500
2000
2500
3000
3500
1998 1999 2000 2001 2002 2003
Dis
card
ed w
eigh
t (t)
T iger flathead
Blue warehou
Blue grenadier -nonspawning
0
50
100
150
200
1998 1999 2000 2001 2002 2003
Dis
card
ed w
eigh
t (t)
John dory
Jackass morwong
Orange roughy
Blue eye trevalla
Western gemfish
0
200
400
600
800
1000
1200
1400
1998 1999 2000 2001 2002 2003
Dis
card
ed w
eigh
t (t)
SpottedwarehouEastern gemfish
Ocean perch -offshoreSchool whiting
Mirror dory
Average of 10-20%Average of 5-10%

Total quota and non-quota
Figure 11 SETF discard weights
Average of >20%
0
5000
10000
15000
20000
1998 1999 2000 2001 2002 2003
Dis
card
ed w
eigh
t (t) Total quota
Nonquota
0
250
500
750
1000
199 2000 2001 2002 2003
Dis
card
ed w
eigh
t (t) Ocean perch - inshore
Redfish
8 1999
23

24
Figure 12 Gillnet discard rates
Average of <5% Average of 5-10%
Average of >20%Average of 10-20%none
none
0
20
40
60
80
100
1999 2000 2001 2002
Dis
card
ed ra
te (%
) Total others
0
2
4
6
8
10
12
1999 2000 2001 2002
Dis
card
ed ra
te (%
)
Blue eye
Blue warehou
Jackass morwong
Ling
Hapuka
Gummy shark

25
Figure 13 Gillnet discard weights
Total others
0
5
10
15
20
1999 2000 2001 2002
Dis
card
ed w
eigh
t (t) Total others
0
2
4
6
8
10
12
1999 2000 2001 2002
Dis
card
ed w
eigh
t (t)
Blue eye
Blue warehou
Jackass morwong
Ling
Hapuka
Gummy shark
Average of <5% Average of 5-10%
Average of >20%Average of 10-20%none
none

26
Figure 14 Scalefish hook discard rates
0
20
40
60
80
100
1999 2000 2001 2002 2003
Dis
card
ed ra
te (%
) Total others
0
1
2
3
4
5
1999 2000 2001 2002 2003
Dis
card
ed ra
te (%
)
LingRibaldoBlue eyeJackass morwong
Average of <5% Average of 5-10%
Average of >20%Average of 10-20%none
none

27
Figure 15 Scalefish hook discard weights
0
0.1
0.2
0.3
0.4
0.5
1999 2000 2001 2002 2003
Dis
card
ed w
eigh
t (t)
Ling
Jackass morwong
Ribaldo
Blue eye
Total others
0
20
40
60
80
1999 2000 2001 2002 2003
Dis
card
ed w
eigh
t (t)
Total others
Average of <5% Average of 5-10%
Average of >20%Average of 10-20%none
none

2.5. Effort in the fisheryFishing effort in the SESSF varies considerably between each sector. In the SETF,nominal fishing effort (hours trawled) increased considerably in the five years afterITQs were introduced. While effort has since stabilised at around 1997 levels, thelevel of effort in the fishery remains around 50% higher than when ITQs wereintroduced (FERM 2004).
Generally, the majority of the SETF fleet tends to work out of their home port but thefleet has become more mobile in recent years (Figure 16). In 2002, the averagedistance between the shot and the port of landing was 191 kms, compared to 149 kmsin 1992.
0
50
100
150
200
250
1992
1993
1994
1995
1996
1997
1998
1999
2000
2001
2002
Ave
rage
dist
ance
trav
elle
d (k
m)
SETF
Figure 16. SETF fleet mobility: average distance between the shot and the portof landing.

29
Vessels that land their catches in Melbourne are generally the most mobile, with anaverage distance of 500 to 600 kms between the shot and the port of landing. Vesselslanding their catch in Bermagui are the least mobile (Figure 17).
0
100
200
300
400
500
600
700
1992 1993 1994 1995 1996 1997 1998 1999 2000 2001 2002
Ave
rage
Km
trav
elle
d
BEACHPORT
BERMAGUI
EDEN
HOBART
LAKES ENTRANCE
PORTLAND
ULLADULLA
W OLLONGONG
MELBOURNE ANDPORT MELBOURNE
Figure 17 SETF fleet mobility by port
Figure 18 Example of fleet mobility from Eden.Figure 18 gives an example of the distance travelled by vessels landing catches atEden in 2002. Generally, shots were located within 415 kms of Eden but somevessels are fishing over 830 kms away from the port of landing.

30
In comparison to SETF, the GHATF sectors tend to be less mobile. However, theGABTF boats tend to fish are significant distance from their home ports of Adelaideand Port Lincoln.
The changes in the intensity and location of fishing effort for each of these sectors isdescribed in Figure 19.
Figure 19 SESSF Catch an effort by sectorSETF 2000 Catch (t)
2000 Catch (t)0 - 250250 - 500500 - 10001000- 25002500+
SETF 1996 Catch (t)
1996 Catch (t)0 - 250250 - 500500 - 10001000- 25002500+
SETF 1991 Catch (t)
1991 Catch (t)0 - 250250 - 500500 - 10001000- 25002500+
SETF 1986 Catch (t)
1986 Catch (t)0 - 250250 - 500500 - 10001000- 25002500+

31
GABTF 2002 Effort (hrs)
2002 Effort (hrs)0 - 200200 - 750750 - 15001500 - 25002500 - 4000
GABTF 1998 Effort (hrs)
1998 Effort (hrs)0 - 200200 - 750750 - 15001500 - 25002500 - 4000
GABTF 2002 Catch (t)
2002 Catch (t)0 - 1010 - 5050 - 100100 - 300300 - 500
GABTF 1998 Catch (t)
1998 Catch (t)0 - 1010 - 5050 - 100100 - 300300 - 500
SETF 2002 Catch (t)
2002 Catch (t)0 - 250250 - 500500 - 10001000- 25002500+
SETF 1986 Effort (hrs)
1986 Effort (hrs)0 - 250250 - 10001000 - 25002500- 50005000+
SETF 1991 Effort (hrs)
1991 Effort (hrs)0 - 250250 - 10001000 - 25002500- 50005000+
SETF 1996 Effort (hrs)
1996 Effort (hrs)0 - 250250 - 10001000 - 25002500- 50005000+

32
SETF 2000 Effort (hrs)
2000 Effort (hrs)0 - 250250 - 10001000 - 25002500- 50005000+
SETF 2002 Effort (hrs)
2002 Effort (hrs)0 - 250250 - 10001000 - 25002500- 50005000+
Gillnet 2002 Catch (t)
2002 Catch (t)0 - 1010 - 2525 - 5050 - 100100 - 250
Gillnet 2000 Catch (t)
2000 Catch (t)0 - 1010 - 2525 - 5050 - 100100 - 250
Gillnet 1998 Effort (km.lifts)
1998 Effort (km.lifts)0 - 200200 - 700700 - 15001500 - 30003000 - 5000
Gillnet 2000 Effort (km.lifts)
2000 Effort (km.lifts)0 - 200200 - 700700 - 15001500 - 30003000 - 5000

33
Shark hook 2000 Effort (number of hooks)
2000 Effort (number of hooks)0 - 30003000 - 1000010000 - 3000030000 - 8000080000 - 200000
Shark hook 1998 Effort (number of hooks)
1998 Effort (number of hooks)0 - 30003000 - 1000010000 - 3000030000 - 8000080000 - 200000
Shark hook 2002 Catch (t)
2002 Catch (t)0 - 22 - 55- 1515 - 2020 - 30
Shark hook 2000 Catch (t)
2000 Catch (t)0 - 22 - 55- 1515 - 2020 - 30
Shark hook 1998 Catch (t)
1998 Catch (t)0 - 22 - 55- 1515 - 2020 - 30
Gillnet 2002 Effort (km.lifts)
2002 Effort (km.lifts)0 - 200200 - 700700 - 15001500 - 30003000 - 5000
Scalefish hook 2002 Effort (number of hooks)
2002 Effort (number of hooks)1 - 3000030000 - 8000080000 - 150000150000 - 350000350000 - 700000
Scalefish hook 1998 Effort (number of hooks)
1998 Effort (number of hooks)1 - 3000030000 - 8000080000 - 150000150000 - 350000350000 - 700000

34
Scalefish hook 2002 Catch (t)
2002 Catch (t)0 - 33 - 1010 - 2525 - 5050 - 200
Scalefish hook 1998 Catch (t)
1998 Catch (t)0 - 33 - 1010 - 2525 - 5050 - 200
Shark hook 2002 Effort (number of hooks)
2002 Effort (number of hooks)0 - 30003000 - 1000010000 - 3000030000 - 8000080000 - 200000
2.6. Quota tradingITQs were introduced into various sectors for various species since 1992.
Table 3 History of ITQ implementation in the fishery1988 Eastern gemfish – SETF1989 Orange roughy off eastern Tasmania – SETF1990 Orange roughy off southern Tasmania – SETF1992 A further 14 species or species groups – SETF1998 Blue eye trevalla, ling and blue warehou - SENTF.2001 School and gummy shark - SSF, SETF and GABTF. Restriction to
whole package transfer due to litigation re allocation formula. Thiscontinues today. SENTF only operators on a 5 carcass trip limit forschool and gummy shark.
The remaining 13 SETF scalefish quota species – SENTF. SSF onlyoperators on a 300kg trip limits for these species.
2002 Elephant fish and saw shark – SETF, GABTF and SSF.2003 ITQ for all scalefish and shark quota species applied for SENTF and
SSF that were previously on trip limits.
2.7. Quota movement – GHATF Sector
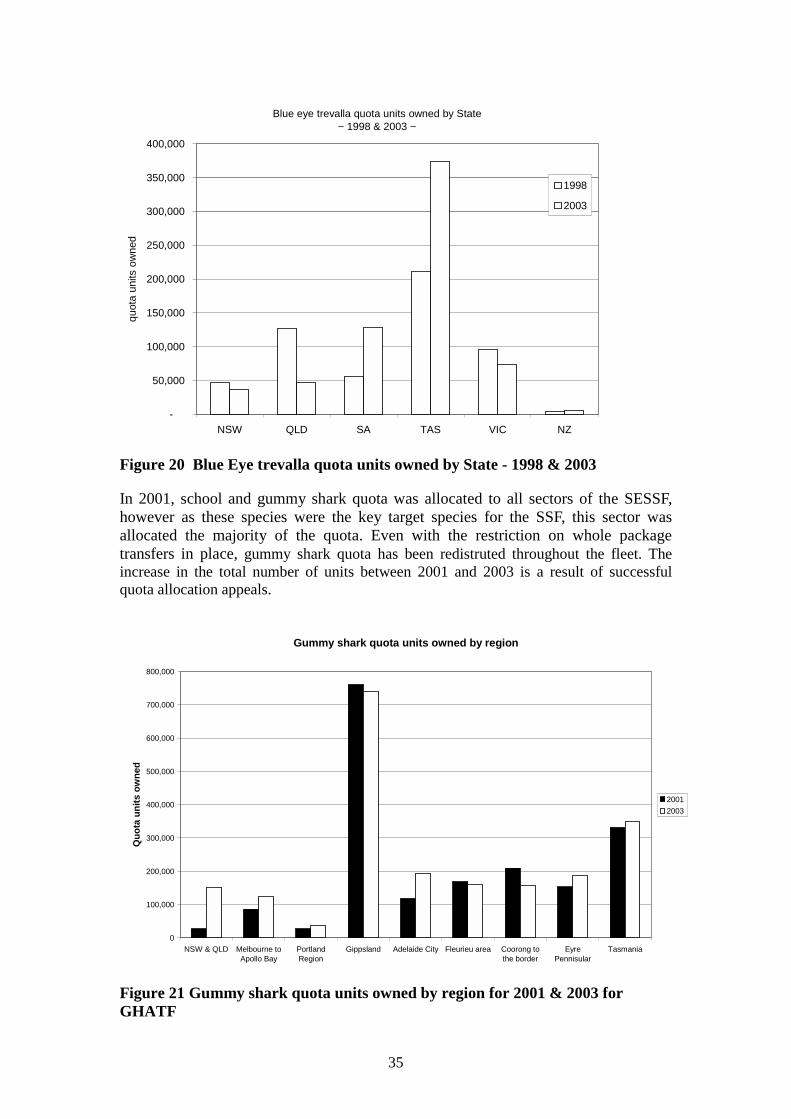
With the introduction of ITQs on the 3 key SENTF species in 1998, a large percentageof the blue eye trevalla quota was allocated to operators who resided in Queensland.Since then, quota has moved to operators who reside in Tasmania.
35
Blue eye trevalla quota units owned by State~ 1998 & 2003 ~
-
50,000
100,000
150,000
200,000
250,000
300,000
350,000
400,000
NSW QLD SA TAS VIC NZ
quot
a un
its o
wne
d
1998
2003
Figure 20 Blue Eye trevalla quota units owned by State - 1998 & 2003
In 2001, school and gummy shark quota was allocated to all sectors of the SESSF,however as these species were the key target species for the SSF, this sector wasallocated the majority of the quota. Even with the restriction on whole packagetransfers in place, gummy shark quota has been redistruted throughout the fleet. Theincrease in the total number of units between 2001 and 2003 is a result of successfulquota allocation appeals.
Gummy shark quota units owned by region
0
100,000
200,000
300,000
400,000
500,000
600,000
700,000
800,000
NSW & QLD Melbourne toApollo Bay
PortlandRegion
Gippsland Adelaide City Fleurieu area Coorong tothe border
EyrePennisular
Tasmania
Quo
ta u
nits
ow
ned
20012003
Figure 21 Gummy shark quota units owned by region for 2001 & 2003 forGHATF

36
School shark units owned by region
0
20,000
40,000
60,000
80,000
NSW & QLD Melbourne toApollo Bay
PortlandRegion
Gippsland Adelaide City Fleurieu area Coorong tothe border
EyrePennisular
Tasmania
quot
a un
its o
wne
d
20012003
Figure 22 School shark quota units owned by region for 2001 & 2003 forGHATFSince 2001, there has been some movement in quota between regions in the SETF.
1992 SETF Quota owned
-
2,000,000
4,000,000
6,000,000
8,000,000
10,000,000
12,000,000
Sydne
y to th
e nort
h
Illawarr
a
Sth NSW C
oast
Melbou
rne to
the w
est
Gippsla
nd
QLD/W
A/NZ
South
Australi
a
Tasm
ania
Uni
ts o
f quo
ta o
wne
d RedfishLingBlue & Spotted trevallyFlatheadBlue grenadierOrange roughyOther spp
Figure 23 1992 SETF Quota owned

37
SET 2003 quota owned
0
1,000,000
2,000,000
3,000,000
4,000,000
5,000,000
6,000,000
7,000,000
8,000,000
9,000,000
10,000,000
Sydney to thenorth
Illawarra NSW SouthCoast
Melbourne tothe west
Gippsland QLD andbeyond
SouthAustralia
Tasmania
quot
a un
its o
wne
d redfishflatheadlingblue warehoublue grenadierorange roughyminor spp
Figure 24 2001 SETF Quota owned
2.8. Cross sector leasing
Quota allocated in the SETF is managed on a separate register to the GHATF andGABTF. Permanent transfers of quota cannot be undertaken between these secotrs,leasing of quota is permited. This is refered to as cross sector leasing. There are nolimits on the quantity of quota that can be leased between sectors, except for blue eyetrevalla, where 10% of the TAC can be leased from GHATF to SETF since 2002.
The main species leased in from SETF to GHATF is ling and blue eye trevalla, thequantiy of ling leased each year has increased as a result of the additional autolongliners operating in the fishery. The main species leased out from GHATF to SETFis blue warehou (although this decline is a reflection of the reduction in the TAC andstock declines), ling and the shark quota species.

38
Cross Sector leasing from trawl to GHATF
0
100,000
200,000
300,000
400,000
SPECIES
BLUE EYE TREVALL
A
BLUE G
RENADIER
BLUE W
AREHOU
ELEPHANTFISH FAMILY
FLATHEAD
GEMFISH (eas
t)
GEMFISH (wes
t)
GUMMY SHARK
JACKASS M
ORWONG
JOHN D
ORYLIN
G
MIRROR D
ORY
OCEAN PERCH
REDFISH
SAW SHARK FAMILY
SCHOOL SHARK
SCHOOL WHITIN
G
SILVER TREVALL
Y
SPOTTED WAREHOU
kg
2001 In 2003 In
Figure 25 Cross sector leasing from SETF to GHATF 2001 and 2003
Cross Sector Leasing from GHATF to trawl
0
100,000
200,000
300,000
400,000
SPECIES
BLUE EYE TREVALL
A
BLUE G
RENADIER
BLUE W
AREHOU
ELEPHANTFISH FAMILY
FLATHEAD
GEMFISH (eas
t)
GEMFISH (wes
t)
GUMMY SHARK
JACKASS M
ORWONG
JOHN D
ORYLIN
G
MIRROR D
ORY
OCEAN PERCH
REDFISH
SAW SHARK FAMILY
SCHOOL SHARK
SCHOOL WHITIN
G
SILVER TREVALL
Y
SPOTTED WAREHOU
kg
2001 Out2003 Out
Figure 26 Cross sector leasing from GHATF to SETF 2001 and 2003

39
2.9. Port of LandingFigures 27 to 29 show the ports of landing and the volume of catch landed in 2003 foreach SESSF Sector.
SETF 2003 Landings by port
0
1,000,000
2,000,000
3,000,000
4,000,000
5,000,000
6,000,000
7,000,000
8,000,000
HOBART
BURNIE
PORTLAND
LAKES ENTRANCE
EDEN
PORT MELBOURNE
BERMAGUI
ULLADULLA
STRAHAN
PORT WELS
HPOOL
WOLLONGONG
BEACHPORT
GREENWELL
POINT
DEVONPORT
PORT JACKSON
QUEENSCLIFF
TRIABUNNA
BELL BAY
kg
LingSpotted WarehouFlatheadOrange RoughyBlue GrenadierOther Spp
Figure 27 SETF 2003 Landings by port
GHATF 2003 Landings by Port
0
100,000
200,000
300,000
400,000
500,000
600,000
700,000
800,000
LAKES E
NTRANCE
HOBART
STRAHAN
SAN REM
O
PORT WELS
HPOOL
PORT LIN
COLN
ST HELENS
DEVONPORT
ROBE
PORT FAI
RY
BICHENO
STREAKY BAY
PORT ADELA
IDE
SYDNEY
THEVENARD
VICTOR H
ARBOUR
STANLEY
TRIABUNNA
DOVER
PORT ALB
ERT
BRIDPORT
BEACHPORT
kg
other speciesSchool SharkSaw sharksLingBlue Eye TrevallaGummy Shark
Figure 28 GHATF 2003 Landings by port

40
GABTF 2003 Landings by Port
0
500,000
1,000,000
1,500,000
2,000,000
2,500,000
PORT LINCOLN THEVENARD PORT ADELAIDE ESPERANCE ALBANY ADELAIDE
kg
Orange RoughyGould's squid - Arrow squidChinaman-LeatherjacketBight RedfishOther SppDeepwater Flathead
Figure 29 GABTF 2003 Landings by port
2.10. Management Costs
AFMA implements the Government’s cost recovery policy for Commonwealthmanaged fisheries. The amount that AFMA has cost recovered from industry hassteadily increased. This is a result of increased requirements on AFMA and industryin the area of environmental and conservation accountability for target, byproduct,bycatch and protected species.
Actual Management Costs - SETF
0
500,000
1,000,000
1,500,000
2,000,000
2,500,000
3,000,000
3,500,000
4,000,000
1998/99 1999/00 2000/01 2001/02 2002/03
$
O/headsDirectGovInd
Figure 30 Actual management Costs - SETF

41
Actual Management Costs - GHATF
0
500,000
1,000,000
1,500,000
2,000,000
2,500,000
3,000,000
3,500,000
1998/99 1999/00 2000/01 2001/02 2002/03
$
O/headsDirectGovInd
Figure 31 Actual management costs GHATF
Actual Management Costs - GABTF
0
50,000
100,000
150,000
200,000
250,000
300,000
350,000
400,000
450,000
1998/99 1999/00 2000/01 2001/02 2002/03
$
O/headsDirectGovInd
Figure 32 Actual management costs GABTF
Economic performance in this fishery has decreased over the past 12 years. This is adirect result of reduced catches, static fish prices, increased operational costs ie fuel,AFMA and insurance.

42
GVP for each sector 1998-2003
0
10,000
20,000
30,000
40,000
50,000
60,000
70,000
80,000
1998/99 1999/00 2000/01 2001/02 2002/03
year
$'00
0 SETFGHATFGAB
Figure 33 GVP for sector of the SESSF 1998-2003The Gross Value of Production for the various sectors of the SESSF has been relativelystable since 1998.

43
3. List of AcronymsAFMA Australian Fisheries Management Authority
ALL Automatic Longlining
AMS Alternative Management Strategies Project
BAOI Broad Areas of Interest
BRS Bureau of Resource Sciences
CSIRO Commonwealth Scientific Industrial Research Organisation
DAFF Department of Forestry, Fisheries and Agriculture
EBFM Ecosystem Based Fisheries Management
ECDWZ East Coast Deepwater Zone
EPBC Environmental Protection Biodiversity Conservation Act 1999
ESD Ecological Sustainable Development
FRDC Fisheries Research and Development Corporation
GABTF Great Australian Bight Trawl Fishery
GHATF Gillnet, Hook & Trap Fishery
MACs Management Advisory Committees
MPAs Marine Protected Areas
MSE Management Strategy Evaluation
NGO Non-government Organisation
NOO National Oceans Office
QMS Quota Management System
SENTF South East Non trawl Fishery
SERMP South East Regional Marine Plan
SESSF Southern and Eastern Scalefish and Shark Fishery
SESSF Southern and Eastern Scalefish and Shark Fishery
SETF South East Trawl Fishery
SSF Southern Shark Fishery
TAC Total Allowable Catch
TACC Total Allowable Commercial Catch
TEP Threatened, Endangered and Protected Species
VIT Victorian Inshore Trawl Fishery

44
4. ReferencesAFMA (2002) Assessment Report Southern and Eastern Scalefish and Shark Fishery,Canberra
AFMA (2003) Gillnet, Hook & Trap Fishery – a guide to 2004 managementarrangements. Australian Fisheries Management Authority, Canberra.
Grieve, C and G. Richardson. 2001. Recent history of Australia’s South East Fishery: amanager’s perspective. Marine and Freshwater Research, 54: 377-386.
FERM (Fisheries Economics, Research and Management) and Richey Fishing 2004,ITQs, ageing boats and the price of fish – Profitability and autonomous adjustment in thesouth east fishery, Draft report to the Fisheries resources Research Fund, June.
Prince, J., Baelde, P., and Wright, G. (1999). Synthesis of industry information onfishing patterns, technological change and the influence of oceanographic effects onfish stocks. Project No 97/114 (Fisheries Research and Development Corporation:Canberra.)
Sachse, M. and O’Brien, C. (1995) South East Trawl Fishery Logbook Data Summary1986 – 1994. Australian Fisheries Management Authority, Canberra.
Smith, A.D.M. and Wayte, S.E. (eds) (2002) The South East Fishery 2002 FisheryAssessment Report compiled by the South East Fishery Assessment Group.Australian Fisheries Management Authority, Canberra.
Smith, K.L. (2002) Description of Danish seine fleet based at Lakes Entrance:Implications for the quantification of fishing effort in the South East Fishery.Australian Maritime College.
Tilzey, R.D.J. and Wise, B. (1999) Great Australian Bight Trawl Fishery 1998,Fisheries Assessment Report. Australian Fisheries Management Authority, Canberra.
Walker, T.I (1999). Southern Australian Shark Fishery Management. In Case studiesof the management of elasmobranch fisheries. Ed. Shotton, R. FAO FisheriesTechnical Paper 378/2 Pp480-514.


![Southern and Eastern Asia Notes [EDocFind.com]](https://img.pdfslide.us/doc/110x75/577cc4541a28aba71198eb81/southern-and-eastern-asia-notes-edocfindcom.jpg)