Embed Size (px)
Citation preview

IN DEGREE PROJECT COMPUTER SCIENCE AND ENGINEERING,SECOND CYCLE, 30 CREDITS
, STOCKHOLM SWEDEN 2017
Background scheduling in Android and its effect on battery usage
VIKTOR BJÖRKHOLM
KTH ROYAL INSTITUTE OF TECHNOLOGYSCHOOL OF COMPUTER SCIENCE AND COMMUNICATION

Background scheduling inAndroid and its effect onbattery usage
VIKTOR BJÖRKHOLM
Master in Computer ScienceDate: November 9, 2017Supervisor: Stefan NilssonExaminer: Johan HåstadSwedish title: Schemaläggning av bakgrundsarbete i Android ochdess effekt för batterianvändningSchool of Computer Science and Communication


iii
Abstract
Background network communication is an important feature for ap-plications running on smartphone devices. When using the networkcomponent on a smartphone, only a portion of the time that the com-ponent is awake is used for the transfer. The rest of the time when thecomponent uses energy is known as tail energy. Tail energy can makeup for a majority of the battery used for network communication. Oneapproach to lower the overhead energy is to batch transfers instead ofrunning them separately. Another way is to limit network access forapplications who use it too often from the background.This thesis investigates improvements in Android from version 4.4 to5.0 and 7.0 and the scheduling APIs AlarmManager and JobSchedulerin how they handle background work. The two factors investigatedare how well it batches pending tasks and how often applications inthe background are allowed to access the network. The results show anadvantage to JobScheduler over AlarmManager in how well it batchesbackground work as well as an advantage to newer versions of An-droid over older. The results suggest an impact from tail energy andthat it could be relevant to batch background work.

iv
Sammanfattning
Nätverkskommunikation i bakgrunden är en viktig funktionalitet försmartphone-applikationer. När nätverksmodulen på en smartphoneanvänds så går enbart en del av tiden som den är igång åt till kom-munikationen. Resten av tiden när enheten använder energi kallas för”tail energy”. ”Tail energy” kan utgöra en majoritet av energin somgår åt till nätverkskommunikation. En metod för att minska den ener-giåtgången är att gruppera nätverksanrop för att minska den totalamängden overhead-energi. Ett annat sätt är att begränsa åtkomsten tillnätverk för applikationer som använder det för ofta från bakgrunden.Den här rapporten undersöker förbättringar i Android från version 4.4till 5.0 och 7.0 samt schemaläggnings-APIerna AlarmManager och Job-Scheduler sett till hur de hanterar bakgrundsarbete. De två faktorernasom avsågs var hur väl de grupperar anrop och hur ofta applikationertilläts använda nätverksresurser från bakgrunden. Resultaten visar enfördel för JobScheduler över AlarmManager sett till hur väl de grup-perar bakgrundsarbete. De visar även en fördel för nyare versioner avAndroid över äldre. Resultaten implicerar en påverkan av ”tail ener-gy” och påvisar att det kan vara relevant att gruppera bakgrundsarbe-te.

Contents
1 Introduction 11.1 Background . . . . . . . . . . . . . . . . . . . . . . . . . . 11.2 Research Question . . . . . . . . . . . . . . . . . . . . . . 2
2 Theory 32.1 Related Work . . . . . . . . . . . . . . . . . . . . . . . . . 3
2.1.1 Dynamic voltage and frequency scaling . . . . . . 32.1.2 Heterogeneous architecture and dynamic power
management . . . . . . . . . . . . . . . . . . . . . 42.1.3 Tail energy in network communication . . . . . . 62.1.4 Energy saving through scheduling . . . . . . . . . 8
2.2 Android . . . . . . . . . . . . . . . . . . . . . . . . . . . . 122.2.1 Android versions . . . . . . . . . . . . . . . . . . . 132.2.2 APIs for background tasks . . . . . . . . . . . . . . 132.2.3 Doze mode . . . . . . . . . . . . . . . . . . . . . . 142.2.4 Battery historian . . . . . . . . . . . . . . . . . . . 152.2.5 App development . . . . . . . . . . . . . . . . . . 15
3 Method 163.1 Devices . . . . . . . . . . . . . . . . . . . . . . . . . . . . . 163.2 The background work . . . . . . . . . . . . . . . . . . . . 173.3 Background noise . . . . . . . . . . . . . . . . . . . . . . . 183.4 Logging . . . . . . . . . . . . . . . . . . . . . . . . . . . . . 183.5 Simultaneous applications . . . . . . . . . . . . . . . . . . 19
3.5.1 The applications . . . . . . . . . . . . . . . . . . . 203.5.2 Scheduling setup . . . . . . . . . . . . . . . . . . . 203.5.3 Comparing . . . . . . . . . . . . . . . . . . . . . . 223.5.4 Battery usage . . . . . . . . . . . . . . . . . . . . . 223.5.5 Battery historian . . . . . . . . . . . . . . . . . . . 24
v

vi CONTENTS
3.6 Misbehaving application . . . . . . . . . . . . . . . . . . . 253.7 Busy application . . . . . . . . . . . . . . . . . . . . . . . . 263.8 User device . . . . . . . . . . . . . . . . . . . . . . . . . . . 27
4 Result 284.1 Simultaneous applications . . . . . . . . . . . . . . . . . . 28
4.1.1 Android 4.4 . . . . . . . . . . . . . . . . . . . . . . 284.1.2 Android 5.0, JobScheduler . . . . . . . . . . . . . . 324.1.3 Android 5.0, AlarmManager . . . . . . . . . . . . 344.1.4 Android 7.0 . . . . . . . . . . . . . . . . . . . . . . 374.1.5 Comparison . . . . . . . . . . . . . . . . . . . . . . 424.1.6 Battery usage . . . . . . . . . . . . . . . . . . . . . 444.1.7 Android 5.1 on Nexus 6 using 3G . . . . . . . . . . 48
4.2 Aggressive application . . . . . . . . . . . . . . . . . . . . 504.2.1 Periodic . . . . . . . . . . . . . . . . . . . . . . . . 504.2.2 Fire-once . . . . . . . . . . . . . . . . . . . . . . . . 52
4.3 Busy application . . . . . . . . . . . . . . . . . . . . . . . . 534.4 User device . . . . . . . . . . . . . . . . . . . . . . . . . . . 56
5 Discussion 575.1 Sources of error . . . . . . . . . . . . . . . . . . . . . . . . 575.2 Android versions . . . . . . . . . . . . . . . . . . . . . . . 585.3 Network timeouts . . . . . . . . . . . . . . . . . . . . . . . 595.4 Noise . . . . . . . . . . . . . . . . . . . . . . . . . . . . . . 595.5 JobScheduler and Flex time . . . . . . . . . . . . . . . . . 605.6 Simultaneous applications . . . . . . . . . . . . . . . . . . 61
5.6.1 Time between events, deviation . . . . . . . . . . . 625.6.2 Shortest time between two startups . . . . . . . . 62
5.7 Misbehaving applications . . . . . . . . . . . . . . . . . . 635.8 Busy application . . . . . . . . . . . . . . . . . . . . . . . . 635.9 Doze mode . . . . . . . . . . . . . . . . . . . . . . . . . . . 645.10 Battery usage . . . . . . . . . . . . . . . . . . . . . . . . . 64
5.10.1 Battery historian . . . . . . . . . . . . . . . . . . . 645.10.2 Battery levels . . . . . . . . . . . . . . . . . . . . . 65
5.11 User device . . . . . . . . . . . . . . . . . . . . . . . . . . . 695.12 Sustainable Development and ethical aspects . . . . . . . 70
6 Conclusions 726.1 Research question . . . . . . . . . . . . . . . . . . . . . . . 736.2 Future work . . . . . . . . . . . . . . . . . . . . . . . . . . 73

CONTENTS vii
Bibliography 76


Chapter 1
Introduction
This chapter of the report includes a background to the topic and theresearch question for this thesis.
This thesis aims to evaluate how far Android has come from ver-sion 4.4 to 7.0 in handling overly aggressive component usage andoverhead energy.
1.1 Background
Smartphones rapid takeover of the cell phone market has led to 3.9billion subscriptions in 2016 according to Ericsson’s mobility reportfrom the same year [1]. The same report states an expected growth ofsmartphone subscriptions to 6.8 billion in the 6 years to follow, whichwould mean a growth of 76% by 2022. Smartphones also overtook thePC market in number of units sold in 2011 [2].
Among mobile operating systems Android has a clear majority ofthe market, with around 70% of the market when considering Internetuse [3] and above 80% of the market considering units shipped [4].
With 65 billion cumulative downloads from the Google play store[5] and the number of subscriptions, it is clear that smartphones con-stitute a considerable amount of user value. Being mobile devices, bat-tery forms a limitation due to their limited weight and size [6]. Energydensities in Lithium-ION batteries increase on average 5% each year[7], meaning a doubled capacity roughly every 15 years.
1

2 CHAPTER 1. INTRODUCTION
Inefficient application design and bugs can lead to an excessive bat-tery drain from applications [8, 9]. When such applications are run-ning in the background, it can be difficult for a user to be aware oftheir impact. Overly aggressive usage of components with high ratesof low intensive work can lead to unintended large overheads energywise [10, 11, 8]. Examples of such behavior could be an applicationquerying a server at a higher rate than necessary. This leads to anoverhead energy-wise; the network component is awake for a longertime than the time required for one network request. Previous workhas researched systems acting alongside of Android or replacing it torepel bugs and overly aggressive behavior from applications [12, 13,14].
In recent versions of Android, there has been focus on improvingbattery life and behavior of background work. In Android version 5.0a new API, JobScheduler, was introduced that aimed to help devel-opers to schedule background work, such as syncing to servers. Incomparison with the older API AlarmManager, JobScheduler makesit easier for developers to set certain preconditions that they want toapply, such as access to an unmetered network or that the device ischarging. The JobScheduler API also gives the operating system morefreedom do choose when the work should be executed. In Androidversion 6.0 Doze mode was introduced that activates when the deviceis idle with the screen turned off. In Doze mode, certain APIs eventsare deferred to allow the device to sleep undisturbed in order to con-sume less power.
1.2 Research Question
• How has the behavior of background work scheduling in An-droid changed with the introduction of the JobScheduler API andDoze mode?
• What are the effects from the changed scheduling behavior froma battery usage perspective?

Chapter 2
Theory
This chapter presents relevant theory for battery saving in mobile de-vices, as well as relevant APIs in Android.
2.1 Related Work
This section presents a number of different methods for reducing theenergy usage of a smartphone.
The two main factors are:
• components use less energy when they are in a sleeping state,
• there is overhead energy spent when switching between states.
2.1.1 Dynamic voltage and frequency scaling
Dynamic Voltage and Frequency Scaling (DVFS) is a method to reducethe energy consumption of the CPU. DVFS changes the running fre-quency of the CPU to reduce its power consumption. This is done dy-namically to adapt to the current workload to reduce power consump-tion when performance is not critical. When the operating frequencyof the CPU is lowered the voltage can be lowered as well, leading to areduction in power consumption.
According to Kim et al. [15] the formula for power consumption ina CPU can be modeled as follows:
3
4 CHAPTER 2. THEORY
P = ACV
2f + V Ileak (2.1)
Where A is the fraction of gates actively switching, C is the totalcapacitance load of all gates, V the voltage, f the operating frequencyand Ileak is the leakage of the chip.It is clear from the formula that reducing the supplied voltage of theCPU has the largest impact on the power draw due to its quadraticrelationship. Kim et al. [15] also states that by halving the voltage, thepower draw is decreased by a factor of four while the possible operat-ing frequency is reduced by a factor of two. This shows the relation-ship between performance and power draw.The first part of the formula is the dynamic power lost from charg-ing and discharging the processors capacitive loads, having the CPUrunning. The second term is called the static power that is lost due toleakage current [15]. The proportion of the static power consumptionincreases with more advanced manufacturing processes. According toARM R� Cortex R�-A Series Version: 4.0 Programmer’s Guide for Cortex-Aseries [16] it becomes a larger factor on fabrication geometrics of 130nmand below.Le Sueur and Heiser [17] writes that as transistors reach 32nm staticpower reaches or exceeds dynamic power. This is partly because therequired voltage for full speed has been reduced to 1.1-1.4V and thereis a threshold at 0.7V for silicon transistors. DVFS still has a role toplay as running at a lower voltage has a linear relationship to staticenergy. This can be utilized while the device is awake but not doingany work in the foreground. Le Sueur and Heiser [17] does, however,state that the potential to save energy via DVFS has become limited,and among other factors describes the more efficient sleep modes as afactor that can reduce energy use more than DVFS alone.
2.1.2 Heterogeneous architecture and dynamic powermanagement
Heterogeneous architecture means combining different processing ca-pabilities. One example of a heterogeneous architecture, introduced in2011, is Arm’s big.LITTLE architecture. The big.LITTLE architecturecombines higher performing CPU cores with lower performing ones

CHAPTER 2. THEORY 5
[18, 19]. It is parted in two, with equal amounts of high performing aslow performing cores and distributes work over these two clusters de-pending on the performance requirement. The benefits of this divisionare that while the lower performing cores deliver around half of theperformance of the higher performing ones, they are up to 3.8 timesmore efficient energy-wise [19]. This makes it possible to deliver highperformance when required, and high efficiency when performance isnot crucial.When the higher performing cores are not being used they can beturned off and thus consume minimum power [18], relating well tothe conclusion by Le Sueur and Heiser [17]. Powering off componentswhen they are not being used is called Dynamic Power Management(DPM) [20]. Li and Mishra [21] writes that the overhead for DPM re-garding CPU cores is lower than that of migrating work to a new clus-ter in a big.LITTLE architecture. Greenhalgh [19] also mentions this,that the overhead that exists to migrate tasks between the two clustersis an important consideration with big.LITTLE.
Li and Mishra [21] confirms that there exists an overhead in bring-ing back cores online that were turned off. In their work, Li and Mishra[21] evaluate a balance between the number of operating cores and fre-quency considering power draw and performance from a user experi-ence perspective. Their goal is to consume as little power as possiblewhile delivering enough performance for users not to experience anyproblems, to evaluate what gains that are available through CPU gov-erning. They manage to use up to 25% less energy than the defaultAndroid scheduler while maintaining user experience, showing theimportance of proper use of hardware components.
The work by Lukefahr et al. [22] relates to that of Li and Mishra [21].Lukefahr et al. [22] evaluate the role DVFS and heterogeneous microar-chitecture has with regard to each other. Their goal is to find an opti-mal relationship between distribution of cores(big/little), the comple-tion time for a unit of work, and the energy consumption. Their workshows great advantages to using ARMs big.LITTLE architecture overDVFS and even greater power saving capabilities when combined.
6 CHAPTER 2. THEORY
2.1.3 Tail energy in network communication
Tail energy is the name for the energy spent in a high power state af-ter an activity is finished and the component waits before it returns toits idle state [11]. The behavior can be found in several components[11], one of which, where extensive research has been done, is the ra-dio component of mobile devices using 3G and 4G [11, 10, 23, 24].
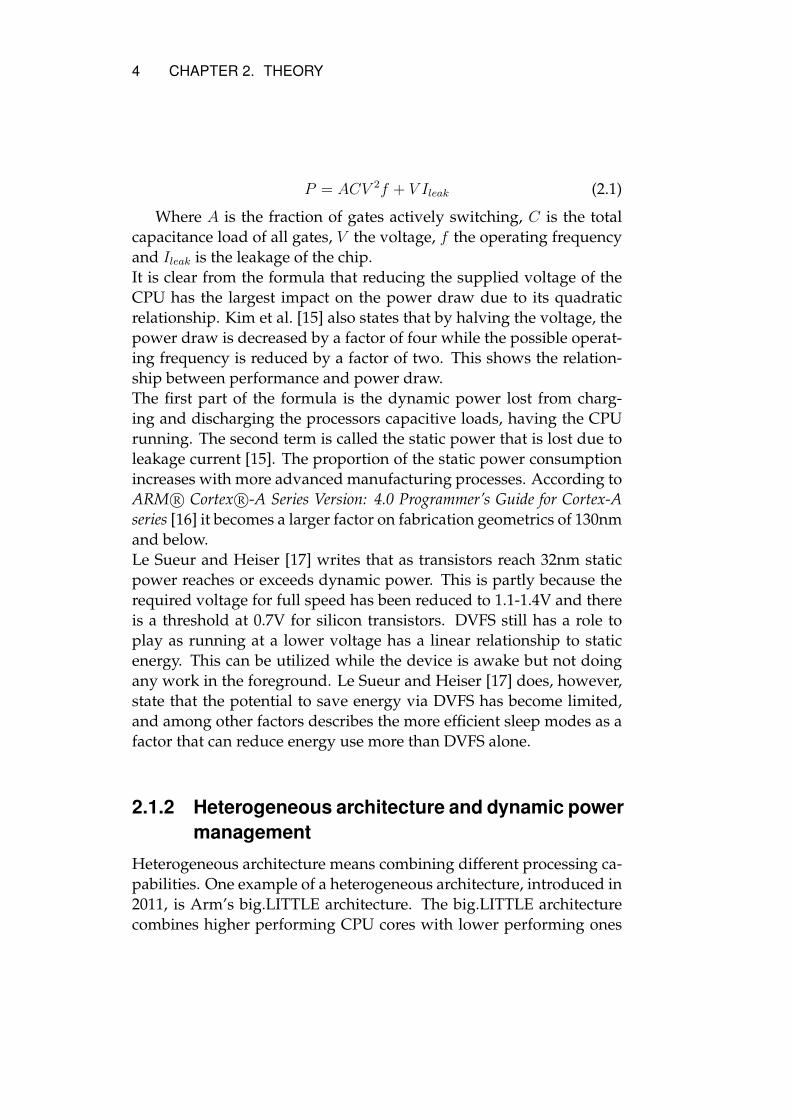
There are different power states of radios in mobile devices. Bala-subramanian, Balasubramanian, and Venkataramani [11] describe threedifferent states for 3G: Dedicated channel (DCH), Forward access chan-nel (FACH), and Idle. Könönen and Pääkkönen [25] and Vergara andNadjm-Tehrani [14] describes four states, adding a paging channel(PCH). In 4G, Huang et al. [26] describes two states that they callRCC_IDLE and RCC_CONNECTED. Below is an explanation of tailenergy using the three states as described by Balasubramanian, Bal-asubramanian, and Venkataramani [11]. The power consumption issimilar between PCH and idle [14].
Figure 2.1: Image from Balasubramanian, Balasubramanian, andVenkataramani [11], visualizing the different states and energy spentduring a transfer.
When network communication is initiated (with enough data toreach a threshold, more on that in section 2.1.4) the radio moves withsome ramp from its idle state to DCH, the high power state, for thetransaction. After handling the data in the DCH state it continues in

CHAPTER 2. THEORY 7
that state until an inactivity timer has expired. After that, it movesto the lower power state FACH where it stays until another inactivitytimer expires [25, 14]. The energy spent when waiting for these inac-tivity timers is the tail energy. The states and the energy spent can beseen in Figure 2.1.
Figure 2.2: Illustration of the energy spent in different network states
Figure 2.2 illustrates the energy of different network states as de-scribed in [25, 11, 26, 14]. From 0-2 seconds is the idle state, at 2 sec-onds it enters the FACH state before entering the DCH state at 3 sec-onds and stays there until the 9-second mark where it returns to theFACH state until it finally returns to idle at the 15-second mark. Herethe transaction of data could have occurred during the 5 seconds be-tween 3 and 8, then waited for a timeout until 9 seconds and from therewait until 15 seconds for the next timeout. In this illustration, the tailenergy would account for around 40% of the total energy, but it is de-pendent on the transmission size. Pathak, Hu, and Zhang [10] showsan example where almost 60% of the total energy is overhead, and Bal-asubramanian, Balasubramanian, and Venkataramani [11] states thatthe tail energy can cause a 60% energy overhead alone.
The reason for the inactivity timers is an energy versus perfor-mance trade-off, and the length of the timers has been researched byChuah, Luo, and Zhang [23] and Lee, Yeh, and Chen [24]. During the
8 CHAPTER 2. THEORY
tail, the radio component can return to the DCH state faster than fromidle in case of more traffic which could be likely depending on theusage pattern. In that case, it can respond faster to the user.
Chuah, Luo, and Zhang [23] concludes that a timeout of some-where between 10-15s is a good trade-off between response time andpower saving. Lee, Yeh, and Chen [24] concluded that an optimaltimeout varied depending on the usage pattern.Research has been done regarding possibilities to use the tail energy ofnetwork transmissions to piggyback other transfers. Further informa-tion about this research is presented in the next section.
2.1.4 Energy saving through scheduling
Tail energy
Könönen and Pääkkönen [25] researched tail energy and if it could beuseful in some other way. They managed to utilize the tail energy todo low intensive work without strict deadlines that the system wouldotherwise execute at a different time. Such work could be to checkfor emails, news updates, weather information etc. By batching upnetwork jobs and thus minimizing the number of times the radio needsto leave idle and lowering the overhead lead them to be able to reducethe energy spent in the radio by up to 50%.
Calder and Marina [27] also writes that batch scheduling of net-working from recurring background work is interesting to look at.They define a model to get an overview of the potential energy sav-ing from batching small groups of network work together. Followingis the model as described by Calder and Marina [27].
CR is the energy cost of the ramp.CT is the energy cost of the tail.
C50K is the energy cost of a 50K transfer.
With the above notation total energy cost of n independent transferswould accumulate to
n(CR + C50K + CT ) (2.2)
If the transfers are batched the accumulated cost of a transfers in b
batches would be described as

CHAPTER 2. THEORY 9
b(CR + aC50K + CT ) (2.3)
Figure 2.3: Visualization of three different applications without andwith batched background work. Image taken from Calder and Marina[27].
Calder and Marina [27] proceeds with comparing 9 transfers doneindependently and batched in three groups, as seen in Figure 2.3, giv-ing:
9CR + 9C50K + 9CT (2.4)
as well as3CR + 9C50K + 3CT (2.5)
arguing that the former is clearly greater than the latter. Quantifyingthe variables CR = 2.5J , C50K = 3J , and CT = 7.5J gives a total of117J for equation 2.4 and 57J for equation 2.5, a reduction of 50% in

10 CHAPTER 2. THEORY
energy consumption. The quantifications above relate well with Bal-asubramanian, Balasubramanian, and Venkataramani [11], who mea-sure around 20% each for ramp and transfer of the total energy con-sumption and 60% for the tail.
Vergara and Nadjm-Tehrani [14] also researched batching networkjobs and discovered that aggregating the work creating a larger amountof data to be sent at once could unnecessarily reach the data bufferthresholds between a FACH-DCH transition. This causes the radiocomponent to enter the DCH state when it otherwise would have re-mained in the FACH state. In an experiment, they sent 7 packets of100 bytes each with an interval of 300ms and compared it to aggre-gating them before sending. The results were an increase in energyconsumption with 42% in the aggregated case. They propose an al-gorithm called Cross-Layer Burst Buffering to take in considerationboth batching and avoiding the FACH-DCH transition threshold. San-juan [28] implements the Cross-Layer Burst Buffering algorithm in akernel module in the Android operating system to control low-levelpacket handling. They manage to achieve an energy saving of up to59% with minimum overhead from the implementation. Rosen et al.[8] distributed 20 Samsung galaxy SIII to people at their university andmeasured data from them during a 2-year span. They concluded that84% of network energy is spent on applications that are in the back-ground. They also conclude that popular applications are working onmaking their network usage better by making it sparser. Facebook asan example used to update once every minute but has moved to onlyupdating once every five minutes and less frequent. They write abouthow tail energy is an important part of network energy and that batch-ing applications would be good, developers who use the network inthe background should try to batch it.
CPU
Legout, Jan, and Pautet [29] describes an approach to lower static en-ergy through minimizing the number of switches from the idle state ofthe CPU. They argue that as there exist penalties and delays to movebetween operating states it is beneficial to minimize the number ofidle periods by aggregating work. It could also be beneficial to have tomedium length idle periods rather than one longer and one shorter.Legout, Jan, and Pautet [29] describes a model with four variables

CHAPTER 2. THEORY 11
to consider while switching between power states of the CPU: Break-Even time (BET ), Instantaneous cost (Co), Transition delay (Td), andPenalty consumption to come back from a state (P ). BETs is the timethat the CPU must remain in a power state s without losing morepower from switching to it. Cos is the instantaneous cost to be in s.Tds is the time delay to switch from a lower state s to a higher state.Pens is the energy penalty to come back from a power state s. Withreference to Awan and Petters [30], Legout, Jan, and Pautet [29] calcu-late Pens as a average between the power consumption between thetwo states that the switch occur with Tds in consideration.
Pens =1
2⇥ Tds ⇥ (Cons � Cos)
Cons in the formula is interpreted as the state that they move to froms. In their example, they do, however, assume an immediate transitionto a low power state if the time spent in it before having to leave itagain is higher than the BET . This seems to be assuming knowledgeof the future rather than using BET as a timeout value before enteringthe low power state. This makes it difficult to see the gains in havingtwo middle length idle periods rather than a longer and a smaller. Ifthe transitions to idle were immediate then the difference would bezero as an equal amount of time is spent in idle and an equal amountof transitions occurs. Their first argument is, however, sound, min-imizing the number of idle periods considering the penalty to movebetween states should reduce energy consumption. We can relate toformula (2.2) as well as (2.3) and consider CR and CT penalties forstate transitions.
A more complex model where the overhead of switching betweenand across several power states is described by Park et al. [31]. Theirconclusions are that switching between power states could account for0.4% to 1.6% overhead for CPU work.
Application design
Pathak, Hu, and Zhang [9] defines energy bugs (ebugs) as "an error inthe system (application, OS, hardware, firmware, external conditionsor combination) that causes an unexpected amount of high energy con-sumption by the system as a whole.". They argue that such bugs areincreasing in importance, pointing out that 70% of returned MotorolaAndroid phones were returned due to ebugs [9, 32]. An example of

12 CHAPTER 2. THEORY
an ebug could be to not release a wake lock (A functionality in An-droid to keep the device awake [33]) after acquiring it and finishingthe intended work, disallowing the phone to enter its idle mode. An-other could be a too aggressive usage of the network component, notconsidering the significant overhead to small data sizes in networkcommunication as described in subsection 2.1.3. The nature of ebugsdiffer from other bugs in the sense that the device continues to op-erate normally, providing the functionality that it usually does with-out crashing. The difference is that it does it with an unexpectedlylarge consumption of energy [9]. Martins, Cappos, and Fonseca [12]attempt to solve the problem by selectively taming background ap-plications, disallowing them runtime if they discover an exaggeratedbackground activity. They differ between bugs and overly aggressiveusage of components; One unintended behavior from the developersand one intended. They develop an OS mechanism, Tamer, that canblock or rate limit the usage of resources for applications running inthe background to improve battery life [12].Huang et al. [13] writes about the increasing number of applicationsand the growing number of "immature applications" (young applica-tions that need time to mature), describing a behavior similar to howPathak, Hu, and Zhang [9] describe ebugs. They call it Disruptive AppBehavior (DAB) and presents a modification of Android, defDroid, thatworks to adjust applications behavior in the background. The adjust-ments could as an example be enforcing back-off for continuous re-tries and using a minimum pause for network communication, with-out breaking the applications main functionality [13]. After releasingthe system to 185 real users they evaluate defDroids impact on 96 DABcases. They manage to show a significant reduction in resource usagewith a marginal impact for the users [13].
2.2 Android
Android is a mobile operating system developed by the the Open Hand-set Alliance led by Google. Android has a dominating part of the mo-bile operating system’s market with a majority of devices sold and inuse globally [34, 3].

CHAPTER 2. THEORY 13
2.2.1 Android versions
This thesis studies Android versions 4.4 (Kitkat), 5.0 (Lollipop) and7.0 (Nougat). In Android 5.0, Google introduces project Volta whichaimed at improving battery life for Android devices [35]. Among otheroptimizations, they introduced a new API called JobScheduler [35].In Android 7.0 Google made Doze mode (described in 2.2.3) more ag-gressive, making a lighter version of Doze mode activate when thedisplay is turned off and the device is on the move, for an examplewhile traveling in a user’s pocket. This lighter variant applies a subsetof the restrictions of Doze mode when the device is stationary, whichremained similar as in Android 6.0 [36].
2.2.2 APIs for background tasks
Android presents different APIs that can be used to schedule back-ground work. AlarmManager was the most used API for backgroundscheduling. Since the introduction of JobScheduler AlarmManager isused when exact execution is required rather than general backgroundwork.
AlarmManager
The information in this subsection is a summary from Android docu-mentation [37]. AlarmManager was included in API level 1, meaningthat it was included in the first version of Android. It allows the de-veloper to schedule their application to be run at some point in the fu-ture, meaning that without their application running in the foregroundor background the application gets some runtime to do backgroundwork. It could be used to check for new emails for an email applica-tion as an example. The email application might not be running at alltimes, but it can still be relevant for it to check for emails in the back-ground and notify the user when there are new ones.With Android version 4.4, the behavior of AlarmManager changed.The alarm delivery (the scheduling) became inexact in order for thedevice to be able to wake up less frequent to minimize battery use.New interfaces were introduced for when the developer needed ex-act delivery: setExact and setWindow. The first one defining an exactexecution time and the second one takes two time points defining awindow for the execution.

14 CHAPTER 2. THEORY
This report uses setInexactRepeating() to schedule the background work.According to documentation, the method is suitable for repeating back-ground work that is not dependent on exact execution times.
JobScheduler
The information in this subsection is a summary from Android docu-mentation [38].JobScheduler was introduced in Android 5.0 and belongs to API level21 and is from that version the preferred way to schedule backgroundwork that does not need an exact execution time. Before schedulingthe work, a JobInfo object is created where the developer set whichconditions that should apply for the work. It includes access to anunmetered network, if the device is charging, in which time windowduring which the executions should occur. The framework will be "in-telligent", as quoted from the documentation, regarding when the ap-plication receives its callback and can perform its work, trying to deferand batch up as much as possible.The report uses the setPeriodic() method to schedule the backgroundtask. As cited from its documentation [39]: "Specify that this job shouldrecur with the provided interval, not more than once per period. Youhave no control over when within this interval this job will be exe-cuted, only the guarantee that it will be executed at most once withinthis interval."
2.2.3 Doze mode
The information in this subsection is a summary from Android doc-umentation [40]. In Android 6.0 Google introduced a feature calledDoze. When the device is stationary with its screen off, the device en-ters Doze mode where it attempts to keep the device in a sleep state.The device wakes up periodically to resume normal operation, defer-ring scheduled activities from the doze period to this maintenancewindow. The maintenance windows occur less and less frequent ac-cording to an exponential back-off.Some APIs will wake up the device during Doze, such as AlarmMan-agers setExactAndAllowWhileIdle(), but it is restricted to doing soonly once every 15 minutes during Doze periods to counteract a tooaggressive behavior [37].

CHAPTER 2. THEORY 15
2.2.4 Battery historian
Battery historian is a Google developed tool for developers to analyzethe behavior of their applications. Android logs information about dif-ferent sensors into a log-file that Battery historian summarizes. Thismakes the tool interesting to use in this thesis. It is, however, onlyavailable from Android version 5.0 and higher. A more detailed de-scription can be found at the developer site [41, 42].
2.2.5 App development
App development is special because the developer has to keep in mindthat their software is going to run amongst other applications on a sys-tem with very limited resources. This means sharing the available re-sources and being able to halt their execution at any time when theuser switches focus. On a desktop or embedded system as two ex-amples the resources are wither plentiful or not shared. This differ-ence could be the cause immature and misbehaving applications thatHuang et al. [13] wrote about: That developers are not used to the newmind set that the environment requires, causing younger applicationsto contain ebugs.

Chapter 3
Method
This chapter presents which versions of Android and which APIs thatwere used, how the synthetic applications were structured, and howthe evaluation was performed.
Five different synthetic applications were written for each platformto simulate different kinds of behavior.One application simulates overly aggressive component usage by do-ing low intensive work with a high frequency, causing a substantialamount of energy overhead related to the weight of the work. Thegoal is to imitate a misbehaving application as described by Rosen etal. [8], Pathak, Hu, and Zhang [9], and Huang et al. [13].Three applications runs simultaneously and schedule repeating back-ground work with different time periods, as inspired by the experi-ments from Calder and Marina [27].The fifth application schedules 100 events with ten seconds intervalfrom each other, so that there is one event scheduled at 10 seconds,one at 20, the next at 30 and so on. This application will show how thedifferent versions of Android and APIs handle something chaotic.
3.1 Devices
Two different devices were used: one Nexus 6 and one Nexus 5. Nexusdevices were chosen because it is easy to find factory images for differ-ent versions of Android for them. Since they are made by Google, theyalso represent a reference device for Android. Two different deviceswere chosen instead of one since no Nexus device has both Android
16

CHAPTER 3. METHOD 17
4.4 and Android 7.0 available.The following configurations were set up:
• Android 4.4, build number KRT16M, running on Nexus 5
• Android 5.0, build number LRX21O, running on Nexus 5
• Android 5.1, build number LMY47D, running on Nexus 6
• Android 7.0, build number NBD91P, running on Nexus 6
Each device had their respective image [43] installed before the test-ing for a clean environment. The only applications installed apart fromthe default ones were those written for this report.
3.2 The background work
Typical work for an application to perform in the background is tofetch data from a server. This enables the application to present up-to-date data and possibly notify the user that new data is available.
The background work in the applications used for the experimentsperforms network communication.
At each time the background work is triggered timestamps aresaved to see when the work was triggered by the operating system.The gathered data is written to a file for inspection to see that the callswere successful.
The network communication was not performed in different waysbetween the different Android versions. What differs is the way thebackground work is Scheduled.
For practical reasons, the devices were connected to a WIFI net-work rather than a 3 or 4G network. An assumption is made that thisdoes not affect the scheduling of the background work. 3G was, how-ever, used in an attempt to better investigate the battery usage on theNexus 6 device. More about that in Section 3.5.4.

18 CHAPTER 3. METHOD
More details about the background work are provided in section3.5.1.
3.3 Background noise
It is important for the result to know if background work is batchedup. In order to get a clearer view, minimal noise from other back-ground work is desirable. Since the applications written for this thesisare the only applications installed except for default applications, thenoise originates from the OS and system services.
During the install phase of Android, no Google account was signedin to and every request to participate with data was declined. Thesesteps were taken with the hopes of minimizing background noise. Wheninstalling applications outside of the Google play store, the user isprompted with a question to let Google scan such apps for insecurebehavior. This offer was declined for all devices.
Charles proxy
In order to get a complete view of the background work using the net-work, a proxy software, Charles [44], was run on a laptop to tunnelall traffic from the included devices. The traffic was analyzed to seewhat factors that could influence the results from background worknot generated by the test set up by this report. A registered version ofCharles was provided from Bontouch.The phone can be configured to use the proxy be entering wifi settings-> modify network, and then setting up a manual proxy via instruc-tions found in the Charles software.
3.4 Logging
Android logs some values by default in a bugreport-file that can beaccessed and analyzed through a Google developed tool called "Bat-tery historian". What values that are available from Battery historiandiffers between different versions of Android and is not officially sup-ported for Android 4.4 and earlier versions, the summary presentedby Battery historian was shown to be very brief for Android 4.4. The

CHAPTER 3. METHOD 19
bugreport file will, however, be gathered and analyzed for each deviceand data gathering.The applications log their background work with timestamps withmillisecond granularity. The results were later summarized using Googlesheets built-in charts to visualize the execution time of the backgroundwork.The following values were logged by the applications:
• the time between initiating the API call and callback,
• time since last background work,
• time to read files locally (to verify that it is not a large factor),
• battery level,
• temperature,
• voltage from the battery,
• and time in a readable format (Thur Apr 18 13:50:00 as an exam-ple).
Battery temperature and voltage were logged in order to see if anyabnormalities occur during testing. The readable date is logged to en-able easier verification when comparing to the Charles logged data.
The devices lie still and undisturbed during the entire data collec-tion.
3.5 Simultaneous applications
Referring to Calder and Marina [27] to simulate several running ap-plications with different intervals in background work in order to seehow well Android batches their work to decrease the effect of over-head energy. Three different applications were written to simulate thisenvironment.
Each Android version uses the available method that gives the OSmost freedom in scheduling the event. Since a developer cannot know

20 CHAPTER 3. METHOD
how other applications schedule their events, giving the OS more free-dom should lead to more batching. Giving the OS more freedom shouldbe considered best practice when exact delivery is not crucial.
3.5.1 The applications
Querying the Twitter API to perform a search for tweets mentioninga specific user. The URL queried was the following: https://api.twitter.com/1.1/search/tweets.json?q=%40realdonaltrump.Information for how to use Twitter’s API can be found at [45].
Swedish Meteorological and Hydrological Institute, SMHI
Open API provides weather data for a specific location defined by lon-gitude and latitude. More information can be found at [46].The application requests weather data for Stockholm. The URL queriedwas the following: http://opendata-download-metfcst.smhi.se/api/category/pmp2g/version/2/geotype/point/lon/16/lat/58/data.json.
International Space Station, ISS
Open API, query for next time the International Space Station will passabove a location, within a 10 degree radius, defined by latitude andlongitude. More information can be found at [47].The URL queried was the following: http://api.open-notify.org/iss-pass.json?lat=59&lon=18&n=5&alt=20.
3.5.2 Scheduling setup
Android 4.4
Using AlarmManager’s setInexactRepeating-method and intervals of2, 5, and 7 minutes. Each different application queries one of the aboveAPIs.

CHAPTER 3. METHOD 21
Android 5.0
Using JobScheduler method setPeriodic(long) to schedule events at 2,5, and 7 minutes.In order to distinguish between Android version and scheduling API,Android 5.0 also used AlarmManager’s setInexactRepeating-methodwith the same time intervals.
Android 7.0
JobScheduler on Android 7.0 does not allow time periods shorter than15 minutes for a recurring event. To adapt to this the applications run-ning in Android 7.0 uses a multiplier of 7.5 to turn 2 minutes to 15, 5minutes to 37, and 7 minutes to 53. This gives the same periodic rela-tionship between the scheduled events as on the other systems.The only difference from the applications running on Android 5.0 isthe different time periods.Android 7.0 also uses setPeriodic(long, long), where a flex time is specif-ically set. More about this below.
Flex time
For the JobScheduler API, from Android 7.0, it is possible to set a flextime for the periodic time. The flex time tells the operating system howlarge window that is acceptable for the job to be scheduled within asan offset from the target time. A periodic time of one hour and a flextime of half an hour would mean that it is within expected behaviorfor the job to occur anytime between 0h30m and 1h30m. [39]The default value for flex time which applies when no flex time isgiven is equal to the entire period. That means that it is expected be-havior that an event scheduled for one hour from now, with no specificflex given, to occur anywhere between immediately and in two hours.Early tests showed the effects of this. When an event had fired andcalled that it was done using jobFinished() it could fire again a fewmilliseconds later. This is unwanted behavior as it provides no newinformation and increases the amount of traffic to be handled by thenetwork. The method setPeriodic(period, flex) was introduced alongwith Android 7.0. To avoid the double events, and use preferred meth-ods, the tests on Android 7.0 was run with a 50% flex time.

22 CHAPTER 3. METHOD
3.5.3 Comparing
The results are be compared by measuring how many times the net-work adapter in the phone had to turn on in relation to how manynetwork calls were performed. The network module is be consideredto sleep after 13 seconds of inactivity, relating to Figure 2.1.Formula:
NW
SE
(3.1)
Where NW is the number of Network Wake-ups and SE is thenumber of Events. So if ten events occur causing the network mod-ule to wake up at ten different occasions the result would be 1.0. If tenevents caused the network module to wake up five times due to batch-ing, the result would be 0.5. A lower number indicates more batchingof events.
The results are also compared using the formula described by Calderand Marina [27], formula (2.3).
b(CR + aC50K + CT ) (2.3 revisited)
To get comparable results, the first 100 network calls from each de-vice are used for the results. Time constraints limited the number ofevents to 100.Due to difficulties to gather large amounts of events with Android 7.0,only 30 events were analyzed for Android 7.0.
Each device ran the tests five times in order to present an average.
3.5.4 Battery usage
As mentioned, the battery level of each device is logged. A compari-son between the two different devices (Nexus 5 and 6) that were usedwould be complicated since the size and the age of the battery differsalong with all other hardware components.A comparison on one of the devices might, however, be valuable. Mea-suring energy usage via battery level is not the preferred way, dueto inaccuracies in the battery level estimations. Nexus 5 uses a fuel

CHAPTER 3. METHOD 23
gauge based on voltage, and such estimations will suffer from inac-curacies [48, 49, 50]. (Maxim integrated, who manufactures the fuelgauges used in both Nexus 5 and 6, describes the fuel gauges as ac-curate. There are, however, no promises as to how accurate they arein the long term with an aging battery.) It is not clear how the inac-curacies behave on the same hardware, meaning how two runs aftereach other would compare. Among relative factors that affects the bat-tery is temperature, so the devices were lying at a position where theywere only affected by room temperature and not other factors such asthe sun. Both recorded temperature and voltage is presented for thedifferent configurations.To get an exact reading of spent energy for the entire system, special-ized hardware such as a Monsoon device [51] is required. Such a de-vice was not considered for this thesis results due to the extra cost. Italso requires access to the batteries of the devices, in other words thatthe devices can be opened. This is not the case for most newer devices,as they are often glued together. Both Nexus 5 and Nexus 6 are gluedto some extent.One way to measure energy usage without specialized hardware usedby Martins, Cappos, and Fonseca [12] is to let the device go from fullcharge to empty and measure time. The assumption is that this valueis more stable than looking at percentages of the reported battery level.Trials to gather battery life time for the Nexus 5 devices suggested thatthe battery was old as the results fluctuated substantially. Betweentwo runs the result differed with 100%, meaning that the battery lifetime could double between two runs. Due to that reason, the simulta-neous applications using AlarmManager and JobScheduler were runon the Nexus 6 with Android 5.1, since the Nexus 6 device seemed toprovide a more stable prediction for battery levels. This is likely dueto a newer battery and an upgraded fuel gauge [52]. Android 5.1 wasinstalled rather than 5.0 due to the latter not being able to install on theused Nexus 6 device for unknown reasons.
As stated above, the Nexus 5 device was left idle with no appli-cations running other than OS and system services until the batteryreached zero. This was done with both Android 4.4 and 5.0 twice foreach configuration to get a view of how stable the results were. The de-vices then ran the three simultaneous applications until they reachedzero battery, to see if any differences could be seen. The same results

24 CHAPTER 3. METHOD
was not repeated with the Nexus 6 device. Instead, the reported bat-tery levels from running the applications for around 16 hours is pre-sented. A SIM-card was also available for a short duration, making itpossible to use 3G with the Nexus 6 device in order to better relate totheory.
In order to possibly confirm the theory regarding tail energy an-other test was run on the Nexus 6 device. A new application waswritten that based on the result from the simultaneous applications. Itperforms as many network operations per hour as the three simultane-ous applications combined, but without batching. That meaning thatif the simultaneous applications generated 10 events over the coarseof 20 minutes, then this application would run one event every 120seconds. The results showed that the simultaneous applications withJobScheduler on the Nexus 6 device on average ran one event every80 seconds. An application that performs as many network operationsbut without batching should use more energy than the three simulta-neous applications.
To further prove that tail energy has an impact on energy usage, an-other application was also written that performs network operationsmore frequently than every 80 seconds, but downloads less data. Thesought out experiment was to download less data, but fetch data morefrequent to see what the result would be when the network modulespends less or no time in idle mode. An application was written thatqueries the ISS API, that used the least amount of data, once every 10seconds.
3.5.5 Battery historian
The data provided by battery historian proved to be too coarse in mostcases to be useful for experiments. During the experiments with 3G itcould report the mobile radio component as not being active for hourlong periods when it evidently was active according to the loggeddata.Battery historian did, however, provide a way to get an overview ofthe device to see if anything unexpected is happening in the back-ground. For each test-run presented in the result, the respective bat-tery historian overview was analyzed. The sensor value that seemed

CHAPTER 3. METHOD 25
most detailed was the CPU runtime, which also proved a good indica-tor of unexpected background work. For each result, the CPU runtimeis presented.Battery Historian has a Table in its summary called "Device’s Esti-mated Power" that provides an estimation of power usage in the de-vice. According to Google’s documentation, the Table presents "anextremely rough estimate and should not be considered experimentdata" [41]. Because of this statement, the Table was not used in the re-sults. The Table could report some applications as using above 100%of the power consumed. It was difficult to know how to use these val-ues.Battery historian was unfortunately unavailable for Android 4.4.
Battery historian was run locally using Docker as described by itsrepository [53].
3.6 Misbehaving application
Huang et al. [13] distinguished between applications as intentionallyaggressive using resources or as unintentionally using resources. Anintentionally aggressive application was simulated that uses the net-work once every minute. The application queries the Twitter API inthe same way that one of the simultaneous applications did.As with the simultaneous applications, the misbehaving/aggressiveapplication uses best practice to schedule its events, giving more free-dom to the OS.
The configurations are compared by counting how many times theapplications were allowed run time during one hour. The amount pre-sented is an average of five test runs. The experiment is relevant asthis high frequency of querying is undesired for most applications.Therefore it is interesting to see how using the scheduling methodsthat gives the OS most freedom handles it.
Android 4.4
Using Alarmanager setInexactRepeating for one minute interval back-ground work.

26 CHAPTER 3. METHOD
Android 5.0
Using JobScheduler setPeriodic(long)-method for one minute inter-vals.
Due to the limitations in Android 7.0 with a minimum period of 15minutes, Android 5.0 also used fire-once alarms that schedule the nextevent at the end of the previous one. This in order to see the differencesbetween Android 5.0 and 7.0.
Android 7.0
The setPeriodic(long) in Android 7.0 is restricted timewise and doesnot allow any periods smaller than 15 minutes. To circumvent this,the application targeting Android 7.0 uses both fire-once events andperiodic, for a total of two applications. The fire-once uses methodssetMinimumLatency and setOverrideDeadline instead of setPeriodic.
When using setPeriodic(1 minute), the following output is givenfrom Android:“... W/JobInfo: Specified interval for 1 is +1m0s0ms. Clamped to+15m0s0ms... W/JobInfo: Specified flex for 1 is +1m0s0ms. Clamped to +5m0s0ms”Meaning that the call setPeriodic(1 minute) becomes equal to a call tosetPerodic(15 minutes, 5 minutes), a 15 minute period with 5 minutesflex time.
3.7 Busy application
One application will schedule a larger number of events at multiples often second intervals to see how the different versions of Android andAPIs handle a larger number of events being scheduled. For each setup 100 events were scheduled at periods of 10, 20, 30, ..., 1000 seconds.What will be analyzed from this result is how large proportion of thetime that the devices held the network module awake and how muchof the time it got to sleep.
Android 4.4
Using Alarmmanager setInexactRepeating for different intervals.

CHAPTER 3. METHOD 27
Android 5.0
Using JobScheduler setPeriodic(long) for different intervals.
Android 7.0
Using JobScheduler setPeriodic(long, long) for different intervals.
3.8 User device
A short recording from a personal device is included to show howbackground scheduling might behave in a real world scenario. The de-vice used was a Sony Xperia 3 plus with Android 7.0 and around 100applications installed in total. The application count includes those in-stalled by default, origin from Google and Sony.The events were captured using Charles proxy. Only network eventswere recorded. The device was lying still without user interaction dur-ing the time that events were recorded.

Chapter 4
Result
The charts in this chapter present the gathered events, battery, temper-ature, and voltage levels.Event means runtime for an application. The events are presented onseparate horizontal lines for a better overview, as seen in Figure 4.1.The vertical lines represent when the network module woke up fromsleeping, events aligned vertically over these lines are batched. Timeis presented in seconds for all charts.
4.1 Simultaneous applications
This section presents the results for the three simultaneously runningapplications.
4.1.1 Android 4.4
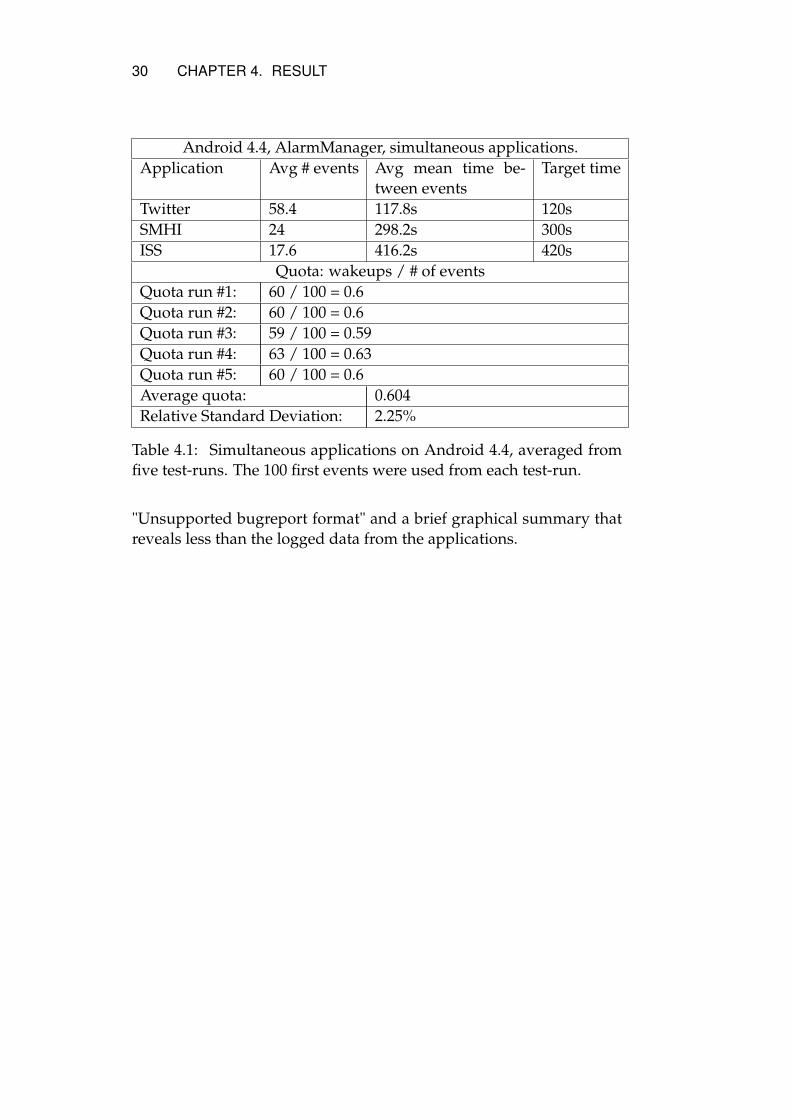
The results for the three applications running on Android 4.4 are pre-sented in Table 4.1. Figure 4.1 shows a graphical overview of test-run#1. Five test-runs were gathered and summarized.
Batching
The average quota between startups and events for AlarmManager onAndroid 4.4 was 0.6, with more details in Table 4.1. During the test-runs, the smallest gap between two startups observed was 16 seconds,
28

CHAPTER 4. RESULT 29
Figure 4.1: The sync events from the three applications over a span ofsix hours on Android 4.4.
meaning that instead of running an event batched along with otherevents, it ran 16 seconds later.
Deviation, how much was the work moved by the OS
Mean value between events for the different applications can be seenin table 4.1. The applications was on average close to the target period,but the time between events fluctuated a bit. For the Twitter applica-tion, a standard deviation of around 50 seconds were recorded, around60 seconds for the SMHI application and above 160 seconds for the ISSapplication.
Noise
A minimal number of noise was present according to Charles proxy: atotal of 6 instances was present during the five test-runs.
Battery usage
Battery levels are presented in Figure 4.2. Temperature, which as men-tioned affects the battery, is presented in Figure 4.3.
Battery historian
Battery historian is only supported for Android versions above 4.4.The data available from Battery historian for Android 4.4 is very lim-ited. When trying to use Battery historian with Android 4.4 it outputs
30 CHAPTER 4. RESULT
Android 4.4, AlarmManager, simultaneous applications.Application Avg # events Avg mean time be-
tween eventsTarget time
Twitter 58.4 117.8s 120sSMHI 24 298.2s 300sISS 17.6 416.2s 420s
Quota: wakeups / # of eventsQuota run #1: 60 / 100 = 0.6Quota run #2: 60 / 100 = 0.6Quota run #3: 59 / 100 = 0.59Quota run #4: 63 / 100 = 0.63Quota run #5: 60 / 100 = 0.6Average quota: 0.604Relative Standard Deviation: 2.25%
Table 4.1: Simultaneous applications on Android 4.4, averaged fromfive test-runs. The 100 first events were used from each test-run.
"Unsupported bugreport format" and a brief graphical summary thatreveals less than the logged data from the applications.

CHAPTER 4. RESULT 31
Figure 4.2: Recorded battery levels for the simultaneous applicationsrunning on Android 4.4. The final estimated battery level vary be-tween 96% and 73%. The idle test runs shows a steeper decline inbattery than when running the simultaneous applications.
Figure 4.3: Recorded temperature for the simultaneous applicationsrunning on Android 4.4. Overall the temperature drops initially downto ambient levels after being warm from the charging.
32 CHAPTER 4. RESULT
4.1.2 Android 5.0, JobScheduler
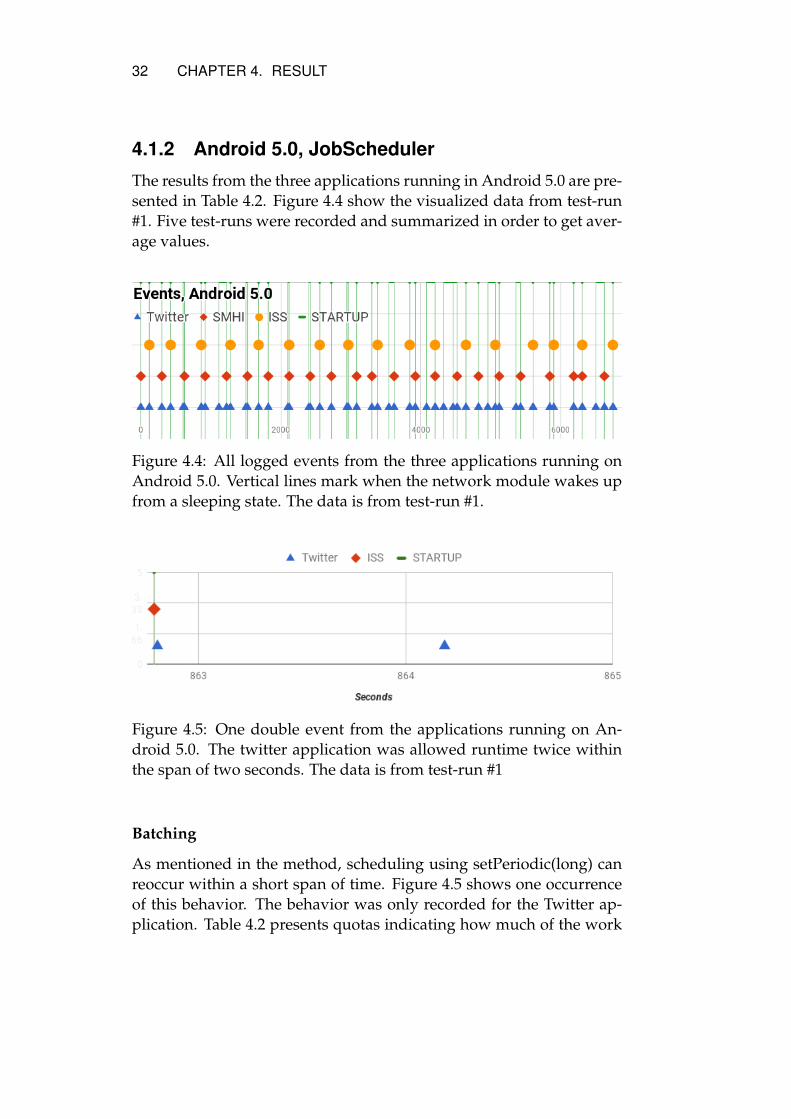
The results from the three applications running in Android 5.0 are pre-sented in Table 4.2. Figure 4.4 show the visualized data from test-run#1. Five test-runs were recorded and summarized in order to get aver-age values.
Figure 4.4: All logged events from the three applications running onAndroid 5.0. Vertical lines mark when the network module wakes upfrom a sleeping state. The data is from test-run #1.
Figure 4.5: One double event from the applications running on An-droid 5.0. The twitter application was allowed runtime twice withinthe span of two seconds. The data is from test-run #1
Batching
As mentioned in the method, scheduling using setPeriodic(long) canreoccur within a short span of time. Figure 4.5 shows one occurrenceof this behavior. The behavior was only recorded for the Twitter ap-plication. Table 4.2 presents quotas indicating how much of the work

CHAPTER 4. RESULT 33
Android 5.0, simultaneous applications. Double calls included.Application Avg # events Avg mean time be-
tween eventsTarget time
Twitter 56.8 129.8s 120sSMHI 25 300s 300sISS 18.2 417.4s 420s
Quota: wakeups / # of events (double calls removed)Quota run #1: 50 / 100 = 0.5 (0.56)Quota run #2: 44 / 100 = 0.44 (0.51)Quota run #3: 45 / 100 = 0.45 (0.48)Quota run #4: 52 / 100 = 0.52 (0.55)Quota run #5: 51 / 100 = 0.51 (0.56)Average quota: 0.484 (0.532)Relative Standard Deviation: 6.74% (5.99%)
Table 4.2: Simultaneous applications on Android 5.0. The 100 firstevents were used from each test-run. The values with double callsremoved, double calls explained earlier, are presented within paren-thesis.
that was batched. Quotas with and without double calls removed arepresented, since the double calls lower the quota without providingnew data. The shortest time between two startups recorded was 14seconds.
Deviation, how much was the work moved by the OS
Mean value for how frequent the applications ran is presented in Table4.2. The mean values were close to the target period, but the valuesfluctuated a bit. The standard deviation was around 90, 50, and 50seconds for the Twitter, SMHI and ISS applications.
Noise
Around 3% of recorded events in Charles proxy was accounted asnoise for Android 5.0. The assumption is made that this did not af-fect the results.

34 CHAPTER 4. RESULT
Battery usage
Figure 4.6 shows androids estimations for battery level for the devices.Included are two base lines displaying the battery level for the devicelying idle without applications running, apart from OS and systemservices. No deviations in temperature were recorded for any of thetest runs.
Figure 4.6: Recorded battery levels for the simultaneous applicationsrunning on Android 5.0 using JobScheduler. The final estimated bat-tery level vary between 86% and 73%. The two idle lines drop to 93%and 78% in this image.
Battery historian
The Battery historian data did not show any deviations for the simul-taneous applications on Android 5.0. The active CPU-time was about20% more active in two of the cases, test-run #1 & #2, but it is diffi-cult to know why. Test-run #1 showed the least decline in battery levelwhile testrun #2 showed the steepest decline.
4.1.3 Android 5.0, AlarmManager
Using AlarmManager on Android 5.0, instances of double calls oc-curred. This would indicate that it is something that Android 5.0 in-troduced and not the JobScheduler API specifically. Table 4.3 presentsa summary of the results from running the simultaneous applicationson Android 5.0 using AlarmManager.

CHAPTER 4. RESULT 35
Figure 4.7: All logged events from the three applications running onAndroid 5.0 with AlarmManager. Vertical lines mark when the net-work module wakes up from a sleeping state. The data is from test-run#1.
Batching
Table 4.3 shows the quota for each test run. The shortest time betweentwo startups recorded was 14 seconds.
Deviation
The average period for the applications were close to their target timeperiod. Standard deviations were measured at around 60, 75, and 145seconds
Noise
Similar levels of noise as Android 5.0 with JobScheduler was recorded,around 3%. This is expected since they ran on the same device withthe same configuration. The noise was assumed to not affect the resultin a significant way.
Battery usage
Figure 4.8 shows the recorded battery levels. The temperature levelsdid not differ between test-runs.

36 CHAPTER 4. RESULT
Android 5.0, AlarmManager, simultaneous applications. Double calls included.Application Avg # events Avg time between
eventsTarget time
Twitter 58.4 117.8s 120sSMHI 24 297.2s 300sISS 17.6 409s 420s
Quota: wakeups / # of events (double calls removed)Quota run #1: 0.52 (0.56)Quota run #2: 0.5 (0.55)Quota run #3: 0.52 (0.56)Quota run #4: 0.49 (0.55)Quota run #5: 0.55 (0.58)Average quota: 0.51 (0.56)Relative Standard Deviation: 3.7% (2%)
Table 4.3: Simultaneous applications on Android 5.0 using Alarm-Manager. The 100 first events were used from each test-run. The val-ues with double calls removed, double calls explained earlier, are pre-sented within parenthesis.
Battery historian
Battery historian showed the lowest amount of CPU usage for test-run#5, and test-run #4 had the highest with almost twice the CPU time of#5. Test-run #4 showed the steepest battery decline while test-run #5had the lowest decline in battery level. The increased CPU usage wasnot possible to attribute to a single source but seemed to origin fromincreased system and OS noise during the test-run.

CHAPTER 4. RESULT 37
Figure 4.8: Recorded battery levels for the simultaneous applicationsrunning on Android 5.0 with AlarmManager. The final estimated bat-tery level vary between 86% and 78%. The idle times result in 93% and78%.
4.1.4 Android 7.0
The results from the three applications in Android 7.0 are presented inFigure 4.9. Table 4.4 summarizes the results.
Figure 4.9: All logged events from the three applications running onAndroid 7.0.
Batching
Table 4.4 shows the quota for each application. As seen, the behav-ior was very similar between test-runs. The shortest time recordedbetween two events was 466 seconds.

38 CHAPTER 4. RESULT
Android 7.0, simultaneous applications.Application Avg # events Avg mean time be-
tween eventsTarget time
Twitter 11.75 12238s 900sSMHI 9.5 14875s 2220sISS 8.75 15675s 3180s
Quota: wakeups / # of eventsQuota run #1: 12 / 30 = 0.4Quota run #2: 12 / 30 = 0.4Quota run #3: 12 / 30 = 0.4Quota run #4: 12 / 30 = 0.4Quota run #5: 12 / 30 = 0.4Average quota: 0.4Relative Standard Deviation: 0%
Table 4.4: Simultaneous applications on Android 7.0. The 30 firstevents were used from each test-run. The mean values between eventsfor the applications differ from the target time to such extent becauseof Doze mode.
Deviation
The average time between events for the application differed substan-tially from the target periods. This is due to Doze mode, as seen inFigure 4.10. The Figure displays time since last event for one of theapplications running on Android 7.0, and looks mostly the same foreach of the applications, due to Doze mode.
Noise
For Android 7.0 more noise was present. Around 50% of recordedevents was accounted to noise. The noise, along with the events, arepresented in Figure 4.11.
Battery usage
The Nexus 6 device showed a more stable behavior in battery levelsthan the Nexus 5 device. Figure 4.12 shows the recorded battery levelsfor the Nexus 6 device. The final battery level differed between 85%and 77%. The recorded temperature levels followed the ambient tem-

CHAPTER 4. RESULT 39
Figure 4.10: Time periods between sync events for the Twitter applica-tion, full flex time.
Figure 4.11: Events along with noise for Android 7.0. The noise isnot divided, each mark of noise might contain multiple occasions thatwere batched or chained.
perature. The battery levels were more stable for the Nexus 6 devicethan for the Nexus 5 device.
Battery historian
Battery historian was only gathered for four of the test-runs for An-droid 7.0 due to failure fetching it at one time, as the bugreport wasaccidentally erased from the device. Each of the bugreport file over-flowed, as there is an upper limit to how long Android will log data.The result of the overflow is that only a part of the time can be ana-lyzed with Battery historian, the part up until the bugreport-file over-flowed.
Table 4.5 presents values from the Table "Device state summary",and Table 4.6 presents a summary over Doze mode during the test-

40 CHAPTER 4. RESULT
Figure 4.12: Battery levels for Android 7.0 running on Nexus 6 for thesimultaneous applications.
runs. Test-run #3 had the lowest CPU usage according to Battery his-torian and it reported among the lowest resulting battery levels.
CPURunning, Android 7.0Testun Seconds / Hr# 1 482s# 2 589s# 3 418s# 5 455s
Table 4.5: The value "CPURunning" from Table "Device State Sum-mary" from Battery historian.

CHAPTER 4. RESULT 41
Doze mode summary, Android 7.0Testrun #1
Name Seconds / Hr Total Num Total Duration Max Durationfull 3459 8 31h15m37s 5h57m57slight 120 5 1h5m9s 25m41soff 8 11 4m30s 39s
Testrun #2Name Seconds / Hr Total Num Total Duration Max Durationfull 3437 7 29h19m13s 5h58m10slight 138 5 1h10m42s 26m3soff 8 10 4m7s 38s
Testrun #3Name Seconds / Hr Total Num Total Duration Max Durationfull 3470 9 39h18m48s 5h56m49slight 110 6 1h15m10s 22m25soff 7 13 5m6s 39s
Testrun #5Name Seconds / Hr Total Num Total Duration Max Durationfull 3473 9 36h57m53s 5h54m50slight 105 5 1h7m7s 26m0soff 8 12 5m15s 39s
Table 4.6: The Table "Doze mode summary" from Battery historian.

42 CHAPTER 4. RESULT
4.1.5 Comparison
This section presents a comparison of the gathered results. Values forAndroid 5.0 are presented with double calls removed.
Wake ups relative network calls
The values calculated by Formula (3.1) presented in Figure 4.13. Table4.7 presents a summary with the values.
Batching
Presenting the results from Formula (2.3) from the results in a chart.
b(CR + aC50K + CT ) (2.3 revisited)
Figure 4.14 presents the results from Formula (2.3) for the 100 firstevents for the different Android versions. The values for Android 7.0were scaled up using the quota of 0.4 from Table 4.7, giving 100 eventswith 40 startups in order to get comparable values.
Comparison, quota between wake ups and events.Android version Avg #
wake upsNumberof calls
Avg Quota &deviation
4.4 60.4 100 0.604, 2.3%5.0 52.8 100 0.532, 6%5.0 (AlarmManager) 56 100 0.56, 2%7.0 12 30 0.4, 0%
Table 4.7: Summary of the quotas from the different configurations.

CHAPTER 4. RESULT 43
Figure 4.13: Quota between network wake ups and number of calls onthe different Android versions.
Figure 4.14: Energy spent for 100 events, using the values provided byCalder and Marina [27] presented in section 2.1.4.

44 CHAPTER 4. RESULT
4.1.6 Battery usage
This section presents the recorded battery levels.
Figure 4.15 presents an average of the recorded battery levels forthe devices. An average of the voltage for the devices is presented inFigure 4.16. Average temperature for the devices is presented in Fig-ure 4.17. AlarmManager seems to use less battery than JobSchedulerdespite its higher quota as seen in Table 4.7.
Idle devices
Android 4.4 and Android 5.0 were allowed to discharge from full toempty while running no other applications other than OS and systemservices, in order to provide a base line. The configurations were leftto discharge twice. The results can be seen in figure 4.18. Android4.4 reached 0% after 6 and 12 hours. Android 5.0 reached 0% after 15and 26 hours. The deviations can probably be explained by the ageof the battery. Temperature is unfortunately not available for Android4.4 due to Battery historian not fully being supported. For Android 5.0the temperature data is rough, but it reports similar levels to previousdata such as that in Figure 4.17. It starts out close to 30 degrees Celsiusat both times for Android 5.0 and then rapidly decreases to level outbetween 27 and 25 degrees. From previous measurements there wouldbe no reason to assume that the temperature for Android 4.4 did notbehave similarly.
Simultaneous applications
Android 4.4 and Android 5.0 ran the three simultaneous applicationsfrom full battery to empty. The resulting battery times are presentedin Figure 4.19. As can be seen, the values between runs differ. Thevariance is too high to get a valuable result, and for Android 4.4 the re-sults from running the simultaneous applications resulted in a longerbattery life than when idle. Because of these deviations, the Nexus6 device running Android 5.1 ran the simultaneous applications foraround 16 hours, as seen below.

CHAPTER 4. RESULT 45
Figure 4.15: Average of recorded battery levels during the simulta-neous applications for Android 4.4 and Android 5.0. The resultingaverage levels were 87% for Android 4.4, 79% for Android 5.0 withJobScheduler, and 85% for Android 5.0 with AlarmManager.
Figure 4.16: Average of recorded voltage during the simultaneous ap-plications for Android 4.4 and Android 5.0.

46 CHAPTER 4. RESULT
Figure 4.17: Average of recorded temperature during the simultaneousapplications for Android 4.4 and Android 5.0.
Figure 4.18: Battery levels for Android 4.4 and 5.0 while idle.

CHAPTER 4. RESULT 47
Figure 4.19: Battery levels for Android 4.4 and 5.0 (using JobScheduler)while running the three simultaneous applications.

48 CHAPTER 4. RESULT
4.1.7 Android 5.1 on Nexus 6 using 3G
The Nexus 6 device reported a more stable behavior on battery lev-els, as seen in Figure 4.12, so the hopes were that the battery level forNexus 6 would not fluctuate as much since the battery is newer andthe fuel gauge is upgraded. The Nexus 6 also used 3G instead of WiFiduring the time period, in order to better relate to theory. The resultingbattery levels are presented in Figure 4.20.
The Nexus 6 device ran the simultaneous applications for above 16hours. The time frame was limited by the access to a SIM-card. Theresults show a slightly steeper decline in battery levels for the appli-cations using AlarmManager. A summary is presented in Table 4.8.Notable is the deviation from the target time that the most frequentapplication on JobScheduler is reporting.
Figure 4.20: Recorded battery levels for the Nexus 6 device runningAndroid 5.1 and using 3G while running the simultaneous applica-tions.
Battery historian
For the device using 3G it is interesting to see how much of the timethat the radio component was active. Battery historian did, however,

CHAPTER 4. RESULT 49
Android 5.1, Simultaneous applications, using 3GJobSchedulerApplication Avg time between
eventsTarget time
Twitter 157s 120sSMHI 294s 300sISS 404s 420s
Avg quota (without double calls): 0.31 (0.42)AlarmManagerApplication Avg time between
eventsTarget time
Twitter 116s 120sSMHI 298s 300sISS 417s 420s
Avg quota: 0.6
Table 4.8: Simultaneous applications on Android 5.1. The quota forJobScheduler is presented with and without double calls. The Twitterapplication deviated from its target time with 30% with JobScheduler.
not prove to be an efficient tool to investigate this. An application us-ing the network every two minutes (even less, as presented in Table4.8) was reported as using it a majority of the time, as seen in Table4.9. In comparison, the application using the network once every tenseconds was reported as using network 53 minutes per hour. This in-dicates that the data from Battery historian is not as fine grained asdesired for these experiments.Table 4.10 shows how active the CPU was according to Battery histo-rian during the test-runs. The values correlates well to the reportedbattery levels, the configurations using the CPU more has a steeperdecline in battery levels.
Battery levels without batching
The application that ran on their own scheduling background work asoften as the simultaneous applications did together on average havetheir battery levels presented in Figure 4.20. Their CPU time is pre-sented in Table 4.10. The results for the application running every 80th

50 CHAPTER 4. RESULT
Ranking Name Uid Duration / Hr Count / Hr Total Duration Count0 Twitter 10097 42m10s 0.16 13h0m18s 31 ROOT 0 8m5s 0.16 2h29m36s 32 SMHI 10096 4m30s 0.22 1h23m32s 43 ISS 10095 2m3s 0.22 37m57s 4
Table 4.9: The Table "Mobile Radio Activity per App" from Batteryhistorian. It shows the Twitter application as using the network onaverage 42 minutes per hour.
Configuration Testrun CPURunning, s / hrIdle # 1 10Idle # 2 7JobScheduler # 1 99JobScheduler # 2 100AlarmManager # 1 152AlarmManager # 2 15780th second # 1 18680th second # 2 19210th second # 1 82510th second # 2 837
Table 4.10: The values "CPURunning" for each of the configurations.
second show a slightly steeper battery decline than the simultaneousapplications, as it should according to theory. The Application runningevery ten seconds shows a much steeper line than any other configu-ration.The application running every 80th second downloaded on average0.7 MB / hr. The application running every tenth second downloadedon average 0.3 MB / hr.
4.2 Aggressive application
4.2.1 Periodic
The results from requesting runtime once a minute with best practicescheduling methods are presented in Table 4.11.

CHAPTER 4. RESULT 51
Number of events in 3600 seconds, periodic scheduling.Android version Avg # of events Deviation4.4 61 0.05.0 38.6 1.07.0 4 0.0
Table 4.11: Average number of time an application were allowed run-time during one hour.
Battery usage
An average of the battery levels for Android 4.4 and 5.0 is presentedin Figure 4.21. Average voltage levels is presented in figure 4.22.Despite recording a lower activity for Android 5.0, Android 4.4 dis-plays a higher battery level remaining after one hour.
Figure 4.21: Averaged battery levels during one hour for Android 4.4and 5.0 running on Nexus 5.

52 CHAPTER 4. RESULT
Figure 4.22: Averaged voltage levels for Android 4.4 and 5.0 runningon Nexus 5. The voltage for Android 4.4 maintains a higher levelthroughout the measurement.
Figure 4.23: Averaged temperature recorded for Android 4.4 and 5.0running on Nexus 5.
4.2.2 Fire-once
Because of the limitations in setPeriodic in Android 7.0 results for An-droid 5.0 and 7.0 were gathered with fire-once scheduling as well. Ta-ble 4.12 presents a comparison. For Android 5.0, a larger deviationwas seen, results varied between 50 and 26 events.

CHAPTER 4. RESULT 53
Number of events in 3600 seconds, fire-once scheduling.Android version Avg # of events standard deviation5.0 36.2 8.67.0 8.67 0.5
Table 4.12: Average number of time an application were allowed run-time during one hour.
4.3 Busy application
For the busy application, the results focus on the amount of time thatthe network adapter and device was allowed to sleep. Figures 4.25and 4.24 shows a graphical summary from Battery historian, showingthe difference in how the devices were allowed to sleep.
Figure 4.24: A graphical summary from Battery historian for Android7.0 showing the state of the CPU, time spent with active wakelocksand JobScheduler activity.
Busy applicationAndroid version Avg Awake time Avg Idle time Quota4.4 3275s 329s 105.0 3450s 149s 23.27.0 272s 5687s 0.05
Table 4.13: Distribution of idle time and active time for the busy appli-cation for one hour runtime. The quota is calculated from the averagetimes.

54 CHAPTER 4. RESULT
CPURunning, Android 7.0 and 5.0Android 7.0 Android 5.0834.84 s / hr 3600 s / hr804.57 s / hr 3600 s / hr887.36 s / hr 3600 s / hr914.40 s/hr 3600 s/hr589.43 s/hr 3600 s/hr
Table 4.14: The values "CPURunning" from the Table "Device statesummary" from battery historian. For Android 7.0 and 5.0 with thebusy application.
Figure 4.25: A graphical summary from Battery historian for Android5.0 showing the state of the CPU, time spent with active wakelocksand JobScheduler activity.
Battery usage
Battery levels for the Nexus 5 device can be seen in Figure 4.26, alongwith temperature in Figure 4.27 and voltage in Figure 4.28. The lowerbattery levels for Android 5.0 could be a result from the higher activitylevel or a deviation in the battery as seen in earlier results.

CHAPTER 4. RESULT 55
Figure 4.26: Average battery levels for the Nexus 5 device.
Figure 4.27: Average temperature for the Nexus 5 device. For Android5.0, the temperature can be seen as rising above what would probablybe the ambient temperature. This could be caused by the high level ofactivity.
Figure 4.28: Voltage levels for the Nexus 5 device. As seen before,Android 4.4 starts with a higher voltage than Android 5.0.
56 CHAPTER 4. RESULT
4.4 User device
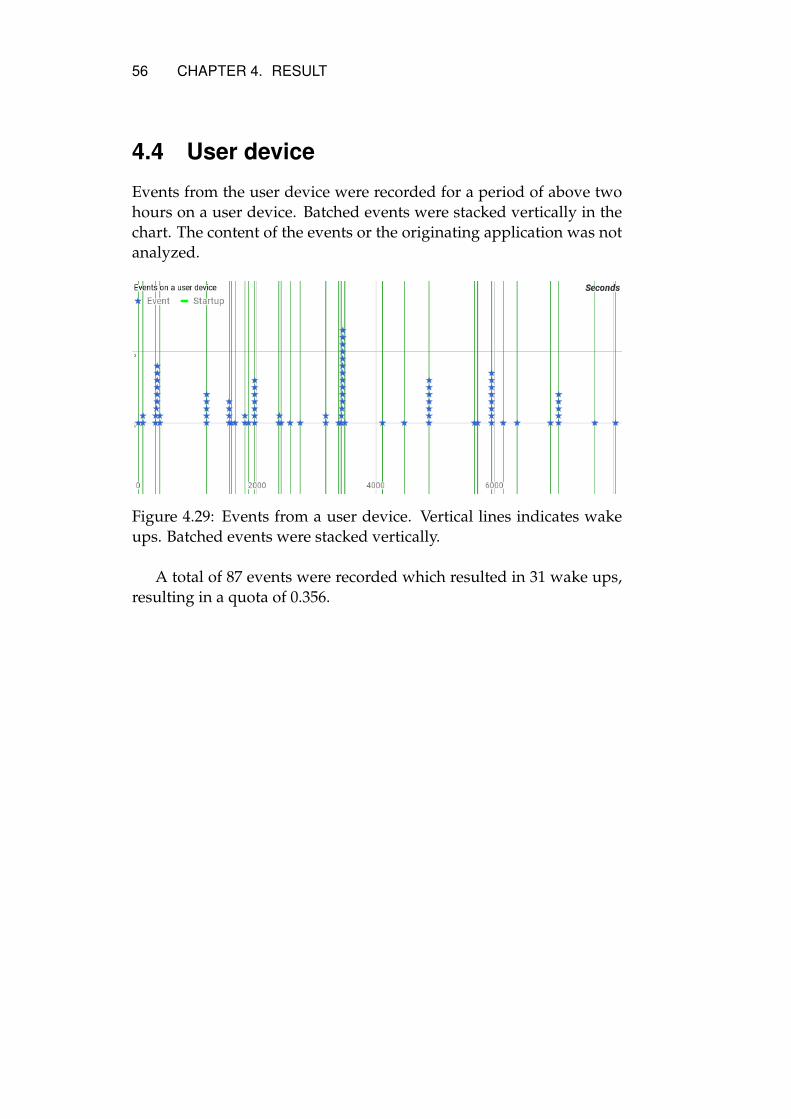
Events from the user device were recorded for a period of above twohours on a user device. Batched events were stacked vertically in thechart. The content of the events or the originating application was notanalyzed.
Figure 4.29: Events from a user device. Vertical lines indicates wakeups. Batched events were stacked vertically.
A total of 87 events were recorded which resulted in 31 wake ups,resulting in a quota of 0.356.

Chapter 5
Discussion
This chapter contains a discussion of the method and the results.
5.1 Sources of error
One source of error is that the amount of data in the network transfersare not measured. As mentioned by Vergara and Nadjm-Tehrani [14]the amount of data can affect the energy states of the network module.This could affect the battery measurements on the Nexus 6 device us-ing a sim-card. It could affect the result if the data in some cases wasnot enough to enter a higher power state. The amount of availabledata from mainly the Twitter API differs from query to query.
Another source of error is that other kinds of background work thatdoes not use the network module is not analyzed to any larger extent.The data available from Battery historian is coarse and difficult to relyon to identify small deviations. CPU activity as an example, it can dis-play when the CPU is active, but it does not show how active it was,relating to Dynamic Voltage and Frequency Scaling and hot-pluggingsome of the cores. Battery Historian did however display if any otherapplication or service on the device was exceedingly active or used acomponent such as GPS that otherwise was not used at all. This wasuseful information when deviations in battery levels were detected.
When an open application is "swiped away" or "closed" in Android,the state of the application might change and so its behavior. This hasnot been considered during the experiments.
57

58 CHAPTER 5. DISCUSSION
As mentioned earlier, energy measurements based on battery lev-els is not the preferred method. The results from letting the Nexus 5device discharge showed clear deviations without any explanations.The Nexus 6 device behaved significantly more stable, probably dueto a newer battery and upgraded fuel gauge, but but the results arenot really clear enough. In some cases, as with the application thatused network every tenth second, the results are very clear as no de-viations that large had been seen before and the result was repeated.With the simultaneous applications however, the results seem to indi-cate that the one using AlarmManager that did not batch to the sameextent uses more battery, but with less margins. A better result wouldbe available if the devices were left to discharge completely while run-ning the applications, but the time and resources was not available.
The small amount of data gathered along with the deviations seenwith the Nexus 5 device makes it hard to make any extensive conclu-sions.
5.2 Android versions
For each major version of Android there are a a set of different im-ages that can be used with sub-versions such as 5.0.1 and 5.1.1. Theseversions might yield different results, as the Nexus 6 device runningAndroid 5.1 got somewhat different results regarding quota than theNexus 5 device running Android 5.0. The results from Android 5.1,where AlarmManager got a similar quota as on Android 4.4, contra-dicts the progress that Android 5.0 showed with AlarmManager doesmake it a bit difficult to assign the progress in scheduling to eitherAPI or Android version. In both cases JobScheduler performed betterwith concern to batching, so JobScheduler is better according to theresults shown in this report. It is hard do determine how well Alarm-Manager performs. With Android 5.0 AlarmManager showed a clearimprovement from Android 4.4 but with Android 5.1 the result wasmore similar to Android 4.4 again. This could indicate differences be-tween Android versions.
When reviewing the aggressive and busy applications the effects

CHAPTER 5. DISCUSSION 59
of doze mode can be seen clearly. As Doze forces the device to sleepwhen most alarms are deferred, the device gets more time to sleepwhere earlier versions of Android did not. The comparison betweenAndroid 5.0 and Android 7.0 with the busy application show a clearexample of this. There are methods available within AlarmManager tocircumvent Doze mode, but Doze mode has a desired effect on alarmswhere exact delivery is not important. It should have a positive im-pact on the devices battery levels during the night as an example. Theresult from the application using network every tenth second confirmsthat the batching enforced by Doze mode is positive from a battery us-age perspective. During the night, as an example, a user will probablynot be affected by some operations not being performed in a high fre-quency.
The results are interesting from a user perspective. With each stepof Android versions, the batching seems to have become better, withthe exemption of the AlarmManager result on Andorid 5.1. For a userpicking out a new device today, the lifespan of that device could beaffected by what Android version the company behind the phone willupgrade it to. Manufactures differ in this aspect, and that could beinteresting to look in to as a consumer. Applications will also probablyin the future deprecate older versions of Android at some point, in thataspect as well a device with a newer version of Android is desirable.
5.3 Network timeouts
A few events are on the limit for being accounted as a new start up,between 12 and 13 seconds. Not knowing the state of the networkadapter, it is hard to come to any conclusions regarding the effect fromsuch a behavior. Would the network adapter enter the high powerstate or remain in a lower power state and proceed to idle shortly after?
5.4 Noise
Did noise disrupt the results?For Android 4.4 and 5.0 there was minimal noise present. For An-droid 7.0, the work did not seem to batch up with the present noise,rather the opposite. Considering Figure 4.11 where noise was pre-

60 CHAPTER 5. DISCUSSION
sented, multiple occasions of noise did not cause the test applicationsto run. This could be accounted to the kind of noise and how Androidprioritizes system background work. Doze mode might have had apart in the behavior of the noise. During the Doze periods where thedevice sleeps and only special wake ups are allowed, noise is present.Available APIs that could cause a wake up would probably cause theentire device to wake up and the waiting applications would get runtime. This is not the case, which shows that background work from theOS could have special priority and works with other types of triggersand scheduling.
There might be a difference between different kinds of noise. Thecontent of the noise has not been analyzed.
5.5 JobScheduler and Flex time
For the JobScheduler API, the developer has an option, as mentioned,to set a flex time for the periodic scheduling. For Android 5.0 whenJobScheduler was introduced, setPeriodic(long) was the only optionfor scheduling periodic background work through JobScheduler. Bydefault, setPeriodic(long) sets a flex time equal to the period. The ef-fects of this were shown in Figure 4.5 that shows an occasion whereone application were given run time within a few seconds. At thispoint, no new data is available from the server. These double calls hasseveral effects:
• For the user, it consumes data from a data plan without provid-ing new information.
• For the server, it is unnecessary traffic.
• For battery consumption, it leads to slightly longer times in ahigh power state for the network module.
• For the operating system, it might be logical. When the work isdone, the next event is starting to be considered. Since the deviceis already awake it makes sense to schedule it right away froman energy overhead perspective. It also gives the OS more time

CHAPTER 5. DISCUSSION 61
to idle before executing the event again, since the documentationonly promises to run the event at most once every period.
Accounting for these double calls in the quota does not seem fairsince it does not provide any user value. That is why the results arepresented both with and without these calls removed. The doubleevents experienced when using JobScheduler were also seen again withAlarmManager on Android 5.0. The fact that no double events wereseen on Android 4.4 indicates that some change to Android in 5.0 in-troduced this bug. Double events were also seen in Android 5.1 whenusing 3G. Android 5.1 did, however, not show any double calls forAlarmManager. It is unclear why no double events are seen for Alar-mManager. It could indicate differences between Android 5.0 and 5.1or it could indicate a difference in how the scheduling APIs or Androidprioritizes depending on what resources are available, WiFi or 3G inthis case. It could also mean that the extra time added from performingthe call on 3G added enough delay for the event not to be scheduledagain. The behavior with JobScheduler contradicts both these theoriesas double calls were present to a large extent for the most frequent ap-plication. To make any conclusions regarding this, more testing wouldbe needed. Running the tests with WiFi on Android 5.1 could as an ex-ample give interesting results.
A difference for the default flex time is seen when trying to sched-ule short periods in Android 7.0. From Android 7.0 it is not possibleto schedule events with periods shorter than 15 minutes. When anapplication tries to do so, the system outputs to the developer that theperiod is changed to 15 minutes period with 5 minutes flex time. Whenmanually scheduling for 15 minutes, the flex time is set to 15 minutes.The lower flex time is an improvement, considering the downsides ofrunning an event twice in a row. It is strange though that the defaultsettings differ.
5.6 Simultaneous applications
The potential energy saving might have been greater with more ap-plications running. With three applications the lowest possible quotawithout including double calls is 1/3 = 0.333. The behavior of Dozemode on Android 7.0 causes the quota to strive towards 0.33, but it

62 CHAPTER 5. DISCUSSION
was not visible with the limited number of events that was gathered.With more applications however, the result would have been clearerand could lead to a greater advantage to Android 7.0. The busy ap-plication is an example of this, where Doze mode forced the most fre-quent alarms to deffer to the next maintenance window
5.6.1 Time between events, deviation
The mean values for time between events presented are a mean valueof averages. The average was calculated for each test-run and then av-eraged all together. It is interesting that both on Android 4.4 and 5.0each application had a relatively large standard deviation. This couldindicate that the scheduling algorithms aims at the requested periodas a whole, and not just from time to time. Meaning that if the targetis 100 seconds, if it fires the first time at 80 seconds the next one mightfire in another 120 seconds as to reach an average that is closer to therequested period. Android 5.0 showed a larger deviation for the mostfrequent application while Android 4.4 had a larger deviation for theleast frequent. If relative standard deviation is considered, Android5.0 had the highest number as the relative standard deviation for themost frequent application was 75%. That application also deviated themost from its targeted time period both in total time and relative its re-quested period. This result could indicate that larger deviations fromthe requested period enables more batching of events, as Android 5.0got a better quota.
5.6.2 Shortest time between two startups
When analyzing the results, one could probably see interesting resultsin all test-runs where events were positioned in a peculiar way. Look-ing at the shortest time between two startups gives some indicationto see if there was any cases where the scheduler could quite possiblyhave done a better job. For all configurations on Android 5.0 and 4.4the shortest time between two start ups was below 20 seconds. In thesecases, the scheduler could probably have done a better job at batchingthe events. The result was the same on the Nexus 6 device using 3G,both APIs got a shortest time between start ups below 20 seconds.

CHAPTER 5. DISCUSSION 63
5.7 Misbehaving applications
What is the best way to simulate a misbehaving application? Is it try-ing to do aggressive work but still using preferred methods from theAPI? Using setInexactRepeating in AlarmManager gives the OS morefreedom, or should you use setExactAndAllowWhileIdle? The latterwould probably be more aggressive since it is documented to allowmore runtime, but then what is proven?
An aggressive application that uses best practice scheduling is in-teresting because it shows how the device would handle an uninten-tional aggressive behavior which was described as a problem by Pathak,Hu, and Zhang [9]. The results show improvements between the An-droid versions. It is hard to decide if it should be accounted to Job-Scheduler or the Android versions, but it is clear that the handling hasimproved as the application was not allowed as much runtime as onAndroid 4.4. The results indicate that an unintentional aggressive be-havior within an application would not negatively affect the battery ona device running Android 5.0 and higher as much as a device runningAndroid 4.4. The fact that JobSchedulers setPeriodic has enforced aminimum period of 15 minutes from Android 7.0 also sends a messageto the developer that they have to think and maybe spend some extratime to have more frequent events, such as using fire once alarms ordifferent methods. This makes it a conscious choice for a developer tocircumvent the recommended behavior, which would arguably lowerthe odds for an unintentionally high battery usage (ebug [9]) to occur.
5.8 Busy application
The results from the Busy application are interesting and could be anindication on how a device with a larger number of applications couldbehave, or one really misbehaving application. The result gives anindication to where Doze solves a problem that perhaps a schedulercould not without deviating from its default behavior too much. In acase with that many events in the background, it seems likely that theevents can be deferred as Doze does without the user suffering fromit.

64 CHAPTER 5. DISCUSSION
One interesting aspect from the result was that JobScheduler on An-droid 5.0 performed worse than AlarmManager on Android 4.4.
5.9 Doze mode
Doze enforces batching for all background events with the mainte-nance windows. It applies an exponential backoff with a max timeof around 5 hours, as can be seen in Table 4.6. DefDroid is a systemdeveloped by Huang et al. [13]. Doze relates well to DefDroid, as itenforces a backoff and only activates when the device is idle, whichshould minimize user impact. The result from the application usingthe network every tenth second proves the impact of performing op-erations individually rather than in a batch. The application that usednetwork every 80th second downloaded twice the amount of data butused much less battery.
5.10 Battery usage
The battery usage discussion is divided between battery historian’sability to help in these kind of experiments, and measured battery lev-els in the devices.
5.10.1 Battery historian
The data provided by Battery historian was more coarse than hopedfor in most cases. As an example it reported an application using net-work once every two minutes as using it uninterrupted during theentire test-run. This could be seen as true to some extent and to a de-veloper this might be valuable information, as it is a simple way to getan overview of certain aspects of an application. A developer coulddiscover that the application apparently uses network more than antic-ipated. For the experiments in this report, a more detailed data wouldhave been valuable. This is a weakness of software based logging ofsensors. The more detailed data and higher frequency of sampling,the more energy the logging system itself uses which could interferewith the results energy and CPU-wise. If Battery historian would havebeen more detailed on the sensor data it would have been possible tocompare the time that the Mobile network module was awake for each

CHAPTER 5. DISCUSSION 65
Figure 5.1: Battery historian overview of the application using 3G onceevery 80 seconds. As can be seen, after a while the CPU starts runningconstantly and the GPS becomes active.
configuration and compare those numbers. Now it does not differ be-tween an application using network once every two minutes, and oneusing it every ten seconds. The latter clearly used more battery due toits high frequency and the behavior of the radio mobile component asdescribed in the background. The data for the CPU-runtime seemedto be more detailed than for other sensors. The data could perhaps beeasier to gather, or it is seen as more important for the results. Thismade it possible to use the CPU-runtime data as an indication of howactive the device was to some extent, mainly for the Nexus 6 deviceusing 3G.
Battery historian was, however, a useful tool when devices behavedunexpectedly. During the experiments with the Nexus 6 device witha sim card using 3G, one of the test-runs showed a steeper decline inbattery levels than expected. Upon inspection with battery historian,visible in Figure 5.1, it was discovered that another system app wasusing a substantial amount of system resources, mostly the GPS andlistening to audio feedback from the user. The security settings of thedevice were changed before the test-run to require no pattern or swipeto unlock. This could have allowed the system app to remain activeand use resources. Without battery historian, this would have beenhard to discover. Battery historian was also used to investigate thedeviations on the Nexus 5 device, but no pattern could be found thatwould explain the differences in battery decline.
5.10.2 Battery levels
This section is divided into subsections to provide a clearer overview.

66 CHAPTER 5. DISCUSSION
Nexus 5
On the nexus 5 device the recorded battery levels suggest that An-droid 4.4 and AlarmManager uses less battery than Android 5.0 withJobScheduler for the gathered results. This goes against the theory,and there are multiple factors that can affect this. The biggest factoris probably inaccuracies due to the age of the batteries. The batterylevels differ to a large extent between test-runs without obvious rea-sons. One factor could be differences in how well the battery was actu-ally charged when the device reported 100%, where some runs showa higher battery voltage from the beginning. The average voltage lev-els reported for Android 4.4 start higher than for Android 5.0, whichcould indicate differences in when the operating systems reports as be-ing fully charged. The result from using AlarmManager on Android5.0 did, however, behave more similar to Android 4.4 regarding bat-tery levels and voltage levels, as seen in Figure 4.15 and 4.16. Thedifference in how well the devices were charged could perhaps relateto when the charger is disconnected. When the device reports 100%,does that mean that it is full or that it just reached a threshold between99 and 100%? In other words: would there be a difference betweendisconnecting the charger directly when the battery reaches 100%, andwaiting a few minutes before disconnecting it? It is possible betweenthe test-runs that this behavior differed as it was not considered. Thedevices were left to charge until they reported 100% and some may justhave reached that level while others could have done so for a while.An example where Android 4.4 should without a doubt use more bat-tery than Android 5.0 is the aggressive application. The Android 4.4device did more work during the time but the Android 5.0 device stillreported a steeper decline for the battery levels. The fact that Both An-droid 4.4 and 5.0 reported a steeper decline in battery levels when idlerather than when running the simultaneous applications also indicatesthat the values for the Nexus 5 device are unreliable.
For the Nexus 5 device it is clear from the results that the batterylevels fluctuate to a large extent from time to time. In an attempt toaccurately measure battery life of the device with different versions ofAndroid and applications the results show such large deviations thatthey can not be used. What is interesting is that Android 5.0 in mostcases reports a higher battery level throughout the test-runs where

CHAPTER 5. DISCUSSION 67
they discharged completely. For the other test-runs Android 5.0 re-ported lower average battery levels than Android 4.4 consistently. Thedeviations is probably caused by the age of the battery, as temperaturereadings were as consistent as they could be given the ambient tem-perature. The deviations in ambient temperature was small enoughfor it to not have an impact on the results.
Nexus 6, simultaneous applications and 3G
The Nexus 6 device reported more stable battery levels for Android7.0. For this reason, the Nexus 6 device was set up using 3G, as thiswould relate better to theory on energy usage, and Android 5.1. Theresults showed a higher amount of batching for JobScheduler with aquota of 0.42 in comparison to AlarmManagers quota of 0.6. The re-sulting battery levels followed theory, displaying a small but presentdifference between JobScheduler and AlarmManager considering de-cline in battery level. Table 4.10 that displays the reported CPU timefor each of the configurations shows an interesting result. Each config-uration that according to theory should use less battery and less timewith the mobile radio uses less CPU time according to Battery histo-rian. The correlation is probably due to the CPU having to be activewhen the radio is active with transmissions.According to both reported battery level and CPU time, JobSched-uler is more efficient than AlarmManager. The mean time betweenevents did, however, show that the applications under JobSchedulerwas scheduled less frequently as a total, due to the most frequent ap-plication. The most frequent application, targeted at 2 minutes, gota mean time between events at 157 seconds. Using the mean timebetween events for all the applications, JobScheduler had around 44events in one hour, and AlarmManager 51. The difference will giveJobScheduler an advantage in both battery level and CPU time that isnot due to better batching of events, but rather from the lower amountof events. The difference in the amount of events is, however, not aslarge as the differences in CPU time. AlarmManager ran 18% moreevents in one hour while using 50% more CPU-time than JobSched-uler. When subtracting the base line of a CPU time of around 9 sec-onds for an idle configuration, the difference between JobSchedulerand AlarmManager is 56%, compensating for the excess work for Alar-
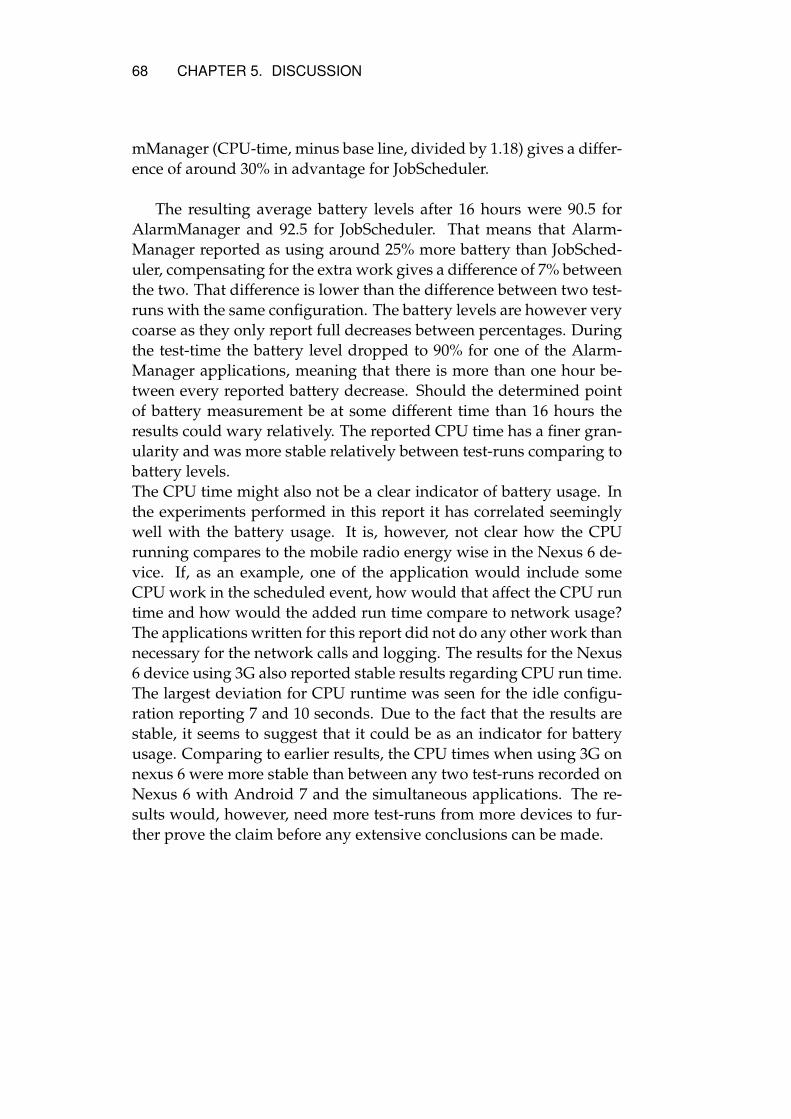
68 CHAPTER 5. DISCUSSION
mManager (CPU-time, minus base line, divided by 1.18) gives a differ-ence of around 30% in advantage for JobScheduler.
The resulting average battery levels after 16 hours were 90.5 forAlarmManager and 92.5 for JobScheduler. That means that Alarm-Manager reported as using around 25% more battery than JobSched-uler, compensating for the extra work gives a difference of 7% betweenthe two. That difference is lower than the difference between two test-runs with the same configuration. The battery levels are however verycoarse as they only report full decreases between percentages. Duringthe test-time the battery level dropped to 90% for one of the Alarm-Manager applications, meaning that there is more than one hour be-tween every reported battery decrease. Should the determined pointof battery measurement be at some different time than 16 hours theresults could wary relatively. The reported CPU time has a finer gran-ularity and was more stable relatively between test-runs comparing tobattery levels.The CPU time might also not be a clear indicator of battery usage. Inthe experiments performed in this report it has correlated seeminglywell with the battery usage. It is, however, not clear how the CPUrunning compares to the mobile radio energy wise in the Nexus 6 de-vice. If, as an example, one of the application would include someCPU work in the scheduled event, how would that affect the CPU runtime and how would the added run time compare to network usage?The applications written for this report did not do any other work thannecessary for the network calls and logging. The results for the Nexus6 device using 3G also reported stable results regarding CPU run time.The largest deviation for CPU runtime was seen for the idle configu-ration reporting 7 and 10 seconds. Due to the fact that the results arestable, it seems to suggest that it could be as an indicator for batteryusage. Comparing to earlier results, the CPU times when using 3G onnexus 6 were more stable than between any two test-runs recorded onNexus 6 with Android 7 and the simultaneous applications. The re-sults would, however, need more test-runs from more devices to fur-ther prove the claim before any extensive conclusions can be made.

CHAPTER 5. DISCUSSION 69
Nexus 6, static applications and 3G
To test the theory and confirm the presence of overhead energy, the ex-periments with one application using network once every 80 secondsand one application using network once every ten seconds was setup. The results from those two application follow theory, they shoulduse more energy since they use the mobile network module more of-ten. The application that uses network once every 80 seconds do asmuch work as the simultaneous applications, with a batching quota of1, meaning no batching occurred. This should according to theory usemore energy, which was also suggested by the results. The second ap-plication that uses network once every ten seconds was set up to testthe basics of the theory, as it downloads less data than the other setupsbut uses the network more frequent. The results for the Nexus 6 devicewere clear, the battery levels decreased substantially faster while run-ning the second application, even though it only downloaded aroundhalf as much data in total as the application using network every 80thsecond.
Summary
Considering the fact that Google does not provide accurate power us-age of components in Battery historian, but rather leaves a disclaimerand presents extremely rough estimated values, indicates that it is adifficult problem to estimate power usage. The reported battery val-ues from the Nexus 6 device seemed stable enough to give an indi-cation, and in the case with the application that used network onceevery ten seconds the result was clearer. This contributes to the confir-mation of the theory, but given the uncertainty within the data, moremeasurements would be needed with many more devices. This was,unfortunately, beyond the scope of what was feasible in this report.
5.11 User device
The user device gets a similar quota as the test device running Android7.0 in the results. It does, however, run more applications, which aspreviously discussed could have let Android 7.0 in the results reach alower quota. There are several factors that might affect the behavior of

70 CHAPTER 5. DISCUSSION
the background work for the user device.
• Some applications might use scheduling methods that make itharder for Android to batch.
• Some events might originate from the OS and system services,which was considered noise and were not included in the quotasof the previous results.
• Some of the events that were considered to be batched might bechained events or double events. It is unclear how these eventsshould be counted. The Twitter application as an example per-forms two calls right after each other due to the authenticationsystem.
It is difficult to make any conclusions from the user device. It is,however, interesting to see that it seems to batch most of its back-ground work.
5.12 Sustainable Development and ethical as-pects
The information communications and technology (ICT) industry con-tributes to 2% of global emissions, the same as the aviation industry[54]. Suckling and Lee [55] writes that a majority of environmentalimpact from a smartphone’s life cycle comes from the manufacturingof the device. An argument for exchanging an older device could bethat battery life has gone bad, and as Gohring [32] wrote ebugs can bea common factor for devices to be returned. The progress presentedin this thesis in handling overhead energy and ebugs would have apositive impact on the environment if it leads to fewer devices beingreturned and a longer life cycle of a device.
In an ethical aspect, devices that would benefit from longer batterylife could be small devices used for surveillance. However, the im-provements in battery usage are available when multiple applicationsrun on the same device or when an application unintentionally uses acomponent a lot from the background. A device created for surveil-lance that would benefit from a longer battery life might not see these
CHAPTER 5. DISCUSSION 71
positive effects due to its single purpose. As a positive aspect, a smart-phone owner in a country where the access to electricity is limited,due to frequent outages or similar, would greatly benefit from a longerbattery life and a lower risk of an application unintentionally using upbattery life.

Chapter 6
Conclusions
This report suggests that there has been improvements to Androidbackground scheduling going from Android 4.4 to 7.0 and AlarmMan-ager to JobScheduler. In Table 4.7 a 50% increase can be seen in batch-ing background work. In Figure 4.14 and improvement of 29% canbe seen in energy usage from the applications when using the perfor-mance model by Calder and Marina [27].For an aggressive or misbehaving application, the results show a de-creased access rate of 93% going from Android 4.4 to 7.0 for an applica-tion trying to use the network once a minute. For the busy applicationAndroid 4.4 reported as being active by a factor of 200 more than An-droid 7.0. Both the aggressive and the busy application show a largeimprovement when considering unintentional ebugs draining batteryfrom the background.
The battery levels recorded from the Nexus 6 device running An-droid 5.1 and using 3G supports the theory as it shows that batchingevents use less battery. They also contribute to the theory regardingthe impact of overhead energy with the result from the application us-ing network every ten seconds compared to every 80th second. Moretest-runs with more devices would however be needed for any sureconclusions.
72

CHAPTER 6. CONCLUSIONS 73
6.1 Research question
How has the behavior of background work scheduling in Androidchanged with the introduction of the JobScheduler API and Dozemode?
When using JobScheduler the results show a less aggressive behaviorand a greater tendency to batch the background work, seemingly lead-ing to a lower battery usage. It has also become harder for a developerto unintentionally create an aggressive behavior from an application.Doze mode is shown to enforce batching of the background work inits maintenance windows, minimizing the overhead from the back-ground work. For the aggressive applications using fire-once alarms,Doze is shown to enforce a backoff even when using a bad practice.And with the busy application Doze mode is shown to allow the de-vice to sleep more.
What are the effects from the changed scheduling behavior from abattery usage perspective?
The results suggest that JobScheduler uses less energy than Alarm-Manager to perform the same amount of background work due to bet-ter utilization of batching background work. More data from moredevices would however be needed to make any sure conclusions re-garding the effects on battery life.
6.2 Future work
If Doze can be inactivated, it would be interested to investigate differ-ences between Android 5.0 and 7.0.
App standby was introduced in Android 6.0, it would be interest-ing to investigate how it affects aggressive applications. If the userdoes not interact with the application by bringing it up to the fore-ground, app standby should deactivate the application.
Doze mode in Android 7.0 activates even when the device is mov-ing as opposed to the first iteration of Doze mode in Android 6.0. Itdoes, however, only apply a subset of restrictions when the device is

74 CHAPTER 6. CONCLUSIONS
moving. Would the results have been different if the devices were notlying still during the data collection?
Running the tests that were run on the Nexus 6 device with An-droid 5.1 for a longer period of time with more devices using 3G wouldgive a clearer indication on the battery usage. The result after 16 hoursgave an indication but the results would probably be clearer if the de-vice were allowed to run until discharged.
Testing an application that batches network operations on its ownand compare it to the application with ten seconds interval would beinteresting. If the same application instead used 30 second intervalsand performed three network calls to the ISS API the result would beinteresting as it could further confirm the theory.
Using WiFi on Android 5.1 with the simultaneous applications couldbe interesting to see if any double events occur with AlarmManager.No double events were recorded on Android 5.1 when using 3G andAlarmManager, so the question is if this is a behavior accounted to An-droid 5.1 or if the reason was that 3G was being used.
Running the simultaneous applications on Android 7.0 with 3Gcould give an interesting result. The result would probably be closeto the idle values, given the behavior of Doze. The experiment couldshow how a user device would behave during the night with applica-tions running in the background, and what impact Doze mode couldhave on remaining battery levels in the morning.
Measuring the energy of the devices with a monsoon device [51]would give more reliable results. This would require a device wherethe battery is accessible. A monsoon device makes it possible to viathe battery measure the energy usage of the device.
Android O was presented shortly after this thesis was written. Itdelivers further improvements to battery life by restricting lifetime ofapplications in the background. It also permits location updates lessfrequently for applications in the background. Limiting location up-dates goes along well with presented theory and it could be interestingto compare Android 7.0 with Android O.

CHAPTER 6. CONCLUSIONS 75

Bibliography
[1] Ericsson mobility report. Nov. 2016. URL: https://www.ericsson.com/assets/local/mobility-report/documents/2016/ericsson-mobility-report-november-2016.pdf⇥Accessed: 01. Mar. 2017
⇤.
[2] Chris Taylor. Smartphone sales overtake PCs for the first time [STUDY].2012.
[3] Statista. 2016. URL: https://www.statista.com/statistics/272698 / global - market - share - held - by - mobile -operating-systems-since-2009/⇥Accessed: 08. Mar. 2017
⇤.
[4] Smartphone OS Market Share, 2016 Q3. 2016. URL: http://www.idc.com/promo/smartphone-market-share/os⇥Accessed: 16. Mar. 2017
⇤.
[5] Statista. 2016. URL: https://www.statista.com/statistics/281106/number-of-android-app-downloads-from-google-play/⇥Accessed: 15. Mar. 2017
⇤.
[6] Aaron Carroll, Gernot Heiser, et al. “An Analysis of Power Con-sumption in a Smartphone.” In: USENIX annual technical confer-ence. Vol. 14. Boston, MA. 2010, pp. 21–21.
[7] G Gonzalez Franco. “Advanced and Post Lithium-ion Batter-ies 2016-2026: Technologies”. In: Markets, Forecasts-Silicon anode,solid-state, sulphur, lithium-air, sodium-ion and magnesium batteries,and lithium capacitors, IDTechEx (2015).
[8] Sanae Rosen et al. “Revisiting Network Energy Efficiency of Mo-bile Apps: Performance in the Wild”. In: Proceedings of the 2015Internet Measurement Conference. IMC ’15. Tokyo, Japan: ACM,2015, pp. 339–345. ISBN: 978-1-4503-3848-6. DOI: 10.1145/2815675.
76

BIBLIOGRAPHY 77
2815713. URL: http://doi.acm.org/10.1145/2815675.2815713.
[9] Abhinav Pathak, Y. Charlie Hu, and Ming Zhang. “Bootstrap-ping Energy Debugging on Smartphones: A First Look at En-ergy Bugs in Mobile Devices”. In: Proceedings of the 10th ACMWorkshop on Hot Topics in Networks. HotNets-X. Cambridge, Mas-sachusetts: ACM, 2011, 5:1–5:6. ISBN: 978-1-4503-1059-8. DOI: 10.1145/2070562.2070567. URL: http://doi.acm.org/10.1145/2070562.2070567.
[10] Abhinav Pathak, Y. Charlie Hu, and Ming Zhang. “Where is theEnergy Spent Inside My App?: Fine Grained Energy Accountingon Smartphones with Eprof”. In: Proceedings of the 7th ACM Euro-pean Conference on Computer Systems. EuroSys ’12. Bern, Switzer-land: ACM, 2012, pp. 29–42. ISBN: 978-1-4503-1223-3. DOI: 10.1145/2168836.2168841. URL: http://doi.acm.org/10.1145/2168836.2168841.
[11] Niranjan Balasubramanian, Aruna Balasubramanian, and ArunVenkataramani. “Energy Consumption in Mobile Phones: A Mea-surement Study and Implications for Network Applications”.In: Proceedings of the 9th ACM SIGCOMM Conference on Inter-net Measurement. IMC ’09. Chicago, Illinois, USA: ACM, 2009,pp. 280–293. ISBN: 978-1-60558-771-4. DOI: 10.1145/1644893.1644927. URL: http://doi.acm.org/10.1145/1644893.1644927.
[12] Marcelo Martins, Justin Cappos, and Rodrigo Fonseca. “Selec-tively Taming Background Android Apps to Improve BatteryLifetime”. In: Proceedings of the 2015 USENIX Conference on UsenixAnnual Technical Conference. USENIX ATC ’15. Santa Clara, CA:USENIX Association, 2015, pp. 563–575. ISBN: 978-1-931971-225.URL: http://dl.acm.org/citation.cfm?id=2813767.2813810.
[13] Peng Huang et al. “DefDroid: Towards a More Defensive MobileOS Against Disruptive App Behavior”. In: Proceedings of the 14thAnnual International Conference on Mobile Systems, Applications,and Services. MobiSys ’16. Singapore, Singapore: ACM, 2016, pp. 221–234. ISBN: 978-1-4503-4269-8. DOI: 10.1145/2906388.2906419.URL: http://doi.acm.org/10.1145/2906388.2906419.

78 BIBLIOGRAPHY
[14] Ekhiotz Jon Vergara and Simin Nadjm-Tehrani. “Energy-awareCross-layer Burst Buffering for Wireless Communication”. In:Proceedings of the 3rd International Conference on Future Energy Sys-tems: Where Energy, Computing and Communication Meet. e-Energy’12. Madrid, Spain: ACM, 2012, 24:1–24:10. ISBN: 978-1-4503-1055-0. DOI: 10.1145/2208828.2208852. URL: http://doi.acm.org/10.1145/2208828.2208852.
[15] N. S. Kim et al. “Leakage current: Moore’s law meets static power”.In: Computer 36.12 (Dec. 2003), pp. 68–75. ISSN: 0018-9162. DOI:10.1109/MC.2003.1250885.
[16] ARM R� Cortex R�-A Series Version: 4.0 Programmer’s Guide for Cortex-A series. (Have to register a free account for access). URL: https://silver.arm.com/download/Software/BX100-DA-98001-r0p0-01rel3/DEN0013D_cortex_a_series_PG.pdf⇥Accessed: 15. Mar. 2017
⇤.
[17] Etienne Le Sueur and Gernot Heiser. “Dynamic Voltage and Fre-quency Scaling: The Laws of Diminishing Returns”. In: Proceed-ings of the 2010 International Conference on Power Aware Computingand Systems. HotPower’10. Vancouver, BC, Canada: USENIX As-sociation, 2010, pp. 1–8. URL: http://dl.acm.org/citation.cfm?id=1924920.1924921.
[18] big.LITTLE Technology: The Future of Mobile. URL: https://www.arm.com/files/pdf/big%5C_LITTLE%5C_Technology%5C_the%5C_Futue%5C_of%5C_Mobile.pdf.
[19] Peter Greenhalgh. In: EETimes (Oct. 2011). URL: http://www.eetimes.com/document.asp?doc_id=1279167&⇥Accessed: 09. Mar. 2017
⇤.
[20] Pi-Cheng Hsiu et al. “User-Centric Scheduling and Governingon Mobile Devices with Big.LITTLE Processors”. In: ACM Trans.Embed. Comput. Syst. 15.1 (Jan. 2016), 17:1–17:22. ISSN: 1539-9087.DOI: 10.1145/2829946. URL: http://doi.acm.org/10.1145/2829946.
[21] Shaosong Li and Shivakant Mishra. “Optimizing power consump-tion in multicore smartphones”. In: Journal of Parallel and Dis-tributed Computing 95 (2016). Special Issue on Energy EfficientMulti-Core and Many-Core Systems, Part I, pp. 124–137. ISSN:

BIBLIOGRAPHY 79
0743-7315. DOI: http://dx.doi.org/10.1016/j.jpdc.2016.02.004. URL: http://www.sciencedirect.com/science/article/pii/S0743731516000198.
[22] Andrew Lukefahr et al. “Heterogeneous Microarchitectures TrumpVoltage Scaling for Low-power Cores”. In: Proceedings of the 23rdInternational Conference on Parallel Architectures and Compilation.PACT ’14. Edmonton, AB, Canada: ACM, 2014, pp. 237–250. ISBN:978-1-4503-2809-8. DOI: 10.1145/2628071.2628078. URL:http://doi.acm.org/10.1145/2628071.2628078.
[23] M. Chuah, Wei Luo, and X. Zhang. “Impacts of inactivity timervalues on UMTS system capacity”. In: 2002 IEEE Wireless Com-munications and Networking Conference Record. WCNC 2002 (Cat.No.02TH8609). Vol. 2. Mar. 2002, 897–903 vol.2. DOI: 10.1109/WCNC.2002.993390.
[24] Chi-Chen Lee, Jul-Hung Yeh, and Jyh-Cheng Chen. “Impact ofinactivity timer on energy consumption in WCDMA and cdma2000”.In: 2004 Symposium on Wireless Telecommunications. May 2004, pp. 15–24. DOI: 10.1109/WTS.2004.1319545.
[25] V. Könönen and P. Pääkkönen. “Optimizing power consumptionof always-on applications based on timer alignment”. In: 2011Third International Conference on Communication Systems and Net-works (COMSNETS 2011). Jan. 2011, pp. 1–8. DOI: 10.1109/COMSNETS.2011.5716468.
[26] Junxian Huang et al. “A Close Examination of Performance andPower Characteristics of 4G LTE Networks”. In: Proceedings of the10th International Conference on Mobile Systems, Applications, andServices. MobiSys ’12. Low Wood Bay, Lake District, UK: ACM,2012, pp. 225–238. ISBN: 978-1-4503-1301-8. DOI: 10.1145/2307636.2307658. URL: http://doi.acm.org/10.1145/2307636.2307658.
[27] M. Calder and M. K. Marina. “Batch Scheduling of RecurrentApplications for Energy Savings on Mobile Phones”. In: 2010 7thAnnual IEEE Communications Society Conference on Sensor, Meshand Ad Hoc Communications and Networks (SECON). June 2010,pp. 1–3. DOI: 10.1109/SECON.2010.5508209. URL: https://doi.org/10.1109/SECON.2010.5508209.
80 BIBLIOGRAPHY
[28] Joseba Sanjuan. “3G Energy-Efficient Packet Handling KernelModule for Android”. MA thesis. Linköping University, The In-stitute of Technology, 2012, p. 91.
[29] Vincent Legout, Mathieu Jan, and Laurent Pautet. “Schedulingalgorithms to reduce the static energy consumption of real-timesystems”. In: Real-Time Systems 51.2 (2015), pp. 153–191. ISSN:1573-1383. DOI: 10.1007/s11241-014-9207-7. URL: http://dx.doi.org/10.1007/s11241-014-9207-7.
[30] M. A. Awan and S. M. Petters. “Enhanced Race-To-Halt: A Leakage-Aware Energy Management Approach for Dynamic Priority Sys-tems”. In: 2011 23rd Euromicro Conference on Real-Time Systems.July 2011, pp. 92–101. DOI: 10.1109/ECRTS.2011.17.
[31] S. Park et al. “Accurate Modeling of the Delay and Energy Over-head of Dynamic Voltage and Frequency Scaling in Modern Mi-croprocessors”. In: IEEE Transactions on Computer-Aided Design ofIntegrated Circuits and Systems 32.5 (May 2013), pp. 695–708. ISSN:0278-0070. DOI: 10.1109/TCAD.2012.2235126.
[32] Nancy Gohring. URL: http://www.computerworld.com.au/article/388831/motorola_ceo_open_android_store_leads_quality_issues/.
[33] PowerManager.WakeLock. URL: https://developer.android.com/reference/android/os/PowerManager.WakeLock.html⇥Accessed: 16. Mar. 2017
⇤.
[34] Linda Sui. Oct. 2016. URL: https://www.strategyanalytics.com/access-services/devices/mobile-phones/smartphone/smartphones/market-data/report-detail/global-smartphone-os-market-share-by-region-q3-2016#.WMAT2CErKb9⇥Accessed: 08. Mar. 2017
⇤.
[35] Android 5.0 APIs. URL: https://developer.android.com/about/versions/android-5.0.html#Power⇥Accessed: 16. Mar. 2017
⇤.
[36] Android 7.0 Behavior Changes. URL: https://developer.android.com/about/versions/nougat/android-7.0-changes.html⇥Accessed: 16. Mar. 2017
⇤.

BIBLIOGRAPHY 81
[37] AlarmManager. URL: https://developer.android.com/reference/android/app/AlarmManager.html⇥Accessed: 16. Mar. 2017
⇤.
[38] JobScheduler. URL: https : / / developer . android . com /reference/android/app/job/JobScheduler.html⇥Accessed: 16. Mar. 2017
⇤.
[39] JobInfo.Builder documentation. URL: https://developer.android.com/reference/android/app/job/JobInfo.Builder.html#setPeriodic(long)⇥Accessed: 20. Apr. 2017
⇤.
[40] Android 6.0 Changes. URL: https://developer.android.com/about/versions/marshmallow/android- 6.0-changes.html⇥Accessed: 16. Mar. 2017
⇤.
[41] Battery Historian Charts. URL: https://developer.android.com/studio/profile/battery- historian- charts.html⇥Accessed: 19. June. 2017
⇤.
[42] Batterystats and Battery Historian Walkthrough. URL: https://developer.android.com/studio/profile/battery-historian.html⇥Accessed: 19. June. 2017
⇤.
[43] Factory Images for Nexus and Pixel Devices. URL: https://developers.google.com/android/images⇥Accessed: 16. May. 2017
⇤.
[44] Charles, web debugging proxy application. URL: https://www.charlesproxy.com/⇥Accessed: 20. Apr. 2017
⇤.
[45] Twitter developer documentation. URL: https://dev.twitter.com/oauth/application-only⇥Accessed: 19. Apr. 2017
⇤.
[46] SMHI Open Data API Docs. URL: http://opendata.smhi.se/apidocs/metfcst/index.html.
[47] Open notify API. URL: http://open-notify.org/Open-Notify-API/⇥Accessed: 19. Apr. 2017
⇤.

82 BIBLIOGRAPHY
[48] How to Measure State-of-charge. URL: http://batteryuniversity.com / learn / article / how _ to _ measure _ state _ of _charge⇥Accessed: 06. June. 2017
⇤.
[49] MAX17048/MAX17049. URL: https://datasheets.maximintegrated.com/en/ds/MAX17048-MAX17049.pdf⇥Accessed: 06. June. 2017
⇤.
[50] Measuring Device Power. URL: https://source.android.com/devices/tech/power/device⇥Accessed: 06. June. 2017
⇤.
[51] Monsoon Solutions, Inc. URL: https : / / www . msoon . com /LabEquipment/PowerMonitor/⇥Accessed: 06. June. 2017
⇤.
[52] MODELGAUGE BATTERY FUEL GAUGE TECHNOLOGY. URL:https://www.maximintegrated.com/en/design/partners-and - technology / design - technology / modelgauge -battery-fuel-gauge-technology.html⇥Accessed: 06. June. 2017
⇤.
[53] Battery Historian. URL: https://github.com/google/battery-historian⇥Accessed: 10. July. 2017
⇤.
[54] Chien A Chan et al. “Methodologies for assessing the use-phasepower consumption and greenhouse gas emissions of telecom-munications network services”. In: Environmental science & tech-nology 47.1 (2012), pp. 485–492.
[55] James Suckling and Jacquetta Lee. “Redefining scope: the trueenvironmental impact of smartphones?” In: The International Jour-nal of Life Cycle Assessment 20.8 (2015), pp. 1181–1196. ISSN: 1614-7502. DOI: 10.1007/s11367-015-0909-4. URL: http://dx.doi.org/10.1007/s11367-015-0909-4.

www.kth.se

![Android Development Lecture 5 - unipr.itmobdev.ce.unipr.it/2013/download/[9] Android Background Services.pdf · Università degli Studi di Parma Marco Picone, Ph.D. Mobile Application](https://img.pdfslide.us/doc/110x75/5ac5459f7f8b9af91c8d857d/android-development-lecture-5-unipr-9-android-background-servicespdfuniversit.jpg)