Embed Size (px)
Citation preview
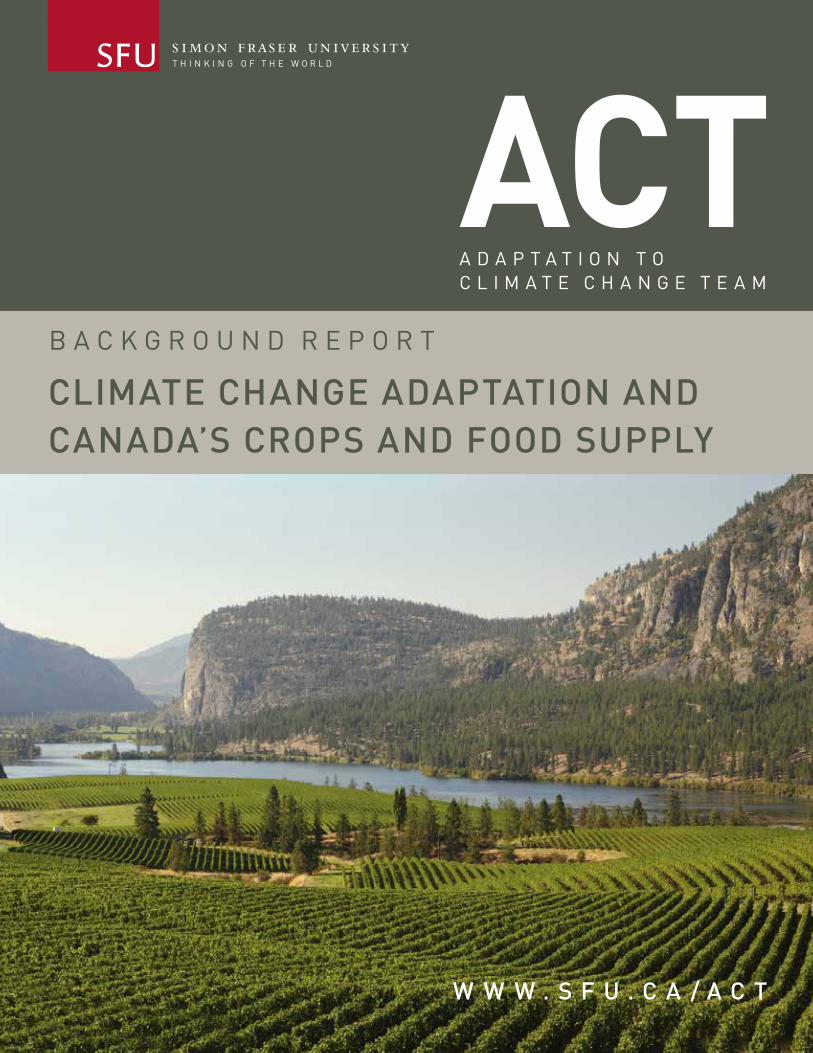
ACT
B A C K G R O U N D R E P O R T
W W W . S F U . C A / A C T
A D A P T A T I O N T O C L I M A T E C H A N G E T E A M
CLIMATE CHANGE ADAPTATION AND CANADA’S CROPS AND FOOD SUPPLY
B A C K G R O U N D R E P O R T
CLIMATE CHANGE ADAPTATION AND CANADA’S CROPS AND FOOD SUPPLY
JULY 03, 2013

ACKNOWLEDGEMENTS
Jon O’Riordan, co-author for this Briefing Note, was the lead policy author of ACT’s first set of findings: Climate Change Adaptation and Biodiversity. Jon has previously held the position of Deputy Minister in the former BC Ministry of Sustainable Resource Management. Jon serves on the Board of Directors for ACT at Simon Fraser University, as well as many other boards and committees working to improve water governance in Canada.
Erik Karlsen, co-author for this Briefing Note, the Summary Report, and the Background Report, is a professional land use planner with almost 40 years experience in advisory through management level positions in federal, provincial, regional and local levels of government and private sector. Erik worked for the BC Provincial Government for 29 years, leaving in April 2002. Since then he has been a consultant, a member of advisory committees and taught at Royal Roads University in the Masters of Environment and Management Program. He has been awarded several awards of distinction for his contribution to sustainable development planning and management in BC and Canada.
Bob Sandford, co-author for this Briefing Note, was the lead policy author for ACT’s fourth set of findings: Climate Change Adaptation and Water Governance. He is the EPCOR Chair of the Canadian Partnership Initiative in support of United Nations “Water for Life” Decade, and sits on the Advisory Committee for the Rosenberg International Forum on Water Policy, where he works to bring international example to bear on Canadian water issues. Bob is the author of four books on water policy in Canada and abroad.
Lenore Newman, also a co-lead policy author for this series, holds the Canada Research Chair in Food Security and Environmental Change at the University of the Fraser Valley. Her research interests include food security; sustainable food systems/urban food systems; place, space, and urban nature; and urban spatial geography.
Development of this Briefing Note, and the accompanying Summary and Background reports, relied heavily on the support of committed and highly dedicated research assistants who laid down the foundation for the policy recommen-dations put forward:
Ngaio Hotte, a senior ACT researcher and graduate of the UBC Master of Food and Resource Economics program, is a UBC Fisheries Economist. During her graduate studies, Ngaio worked to develop a policy framework for adaptation of British Columbia’s agricultural sector to climate change.
Linsay Martens, a senior ACT researcher and graduate of the SFU Master of Public Policy program, also contributed extensively to ACT’s fourth report.
Matt Strand, a sustainability expert and sessional lecturer for Ryerson’s Continuing Education Sustainability Program, researched impacts on international food crops.
Kaleen McNamara, a graduate of SFU’s Master of Public Policy Program, researched local food, farmers’ markets, and issues for small-scale agriculture.
The authors would also like to offer special thanks to the Executive Director of ACT, Deborah Harford, who helped establish the research direction and vision for this project, and patiently and tirelessly steered it toward completion.
CLIMATE CHANGE ADAPTATION AND CANADA’S CROPS AND FOOD SUPPLY BACKGROUND REPORT
I I I
PARTNERS
ACT is deeply grateful to the partners on this project, whose support was invaluable:
Zurich Financial Services was a key sponsor for this research session and conference series. Zurich is taking an active role when considering change to the earth’s climate and the associated risks it presents. We aim to help customers manage the risks associated with climate change through a dedicated climate change unit exploring approaches to help global businesses respond to this emerging risk, including solutions for customers participating in the growth carbon credit market.
Zurich is an insurance-based financial services provider with a global network of subsidiaries and offices in North America and Europe as well as in Asia Pacific, Latin America and other markets. Founded in 1872, our Group is head-quartered in Zurich, Switzerland. We employ approximately 60,000 people serving customers in more than 170 countries.
The Real Estate Foundation of BC acts as a pivotal connection in making land use knowledge and practice in BC a model for the world. In our unique role as a funder of organizations doing good work related to real estate and land use, we have a bird’s eye view of many initiatives across the province. We also have access to new research, case studies, and other fresh information on innovative and unique solutions to land use issues. We see our role as being able to make connections and to share and promote the research and knowledge to which we have access.
Please note: The views expressed herein reflect solely those of the authors and do not necessarily represent the views of the Partners.
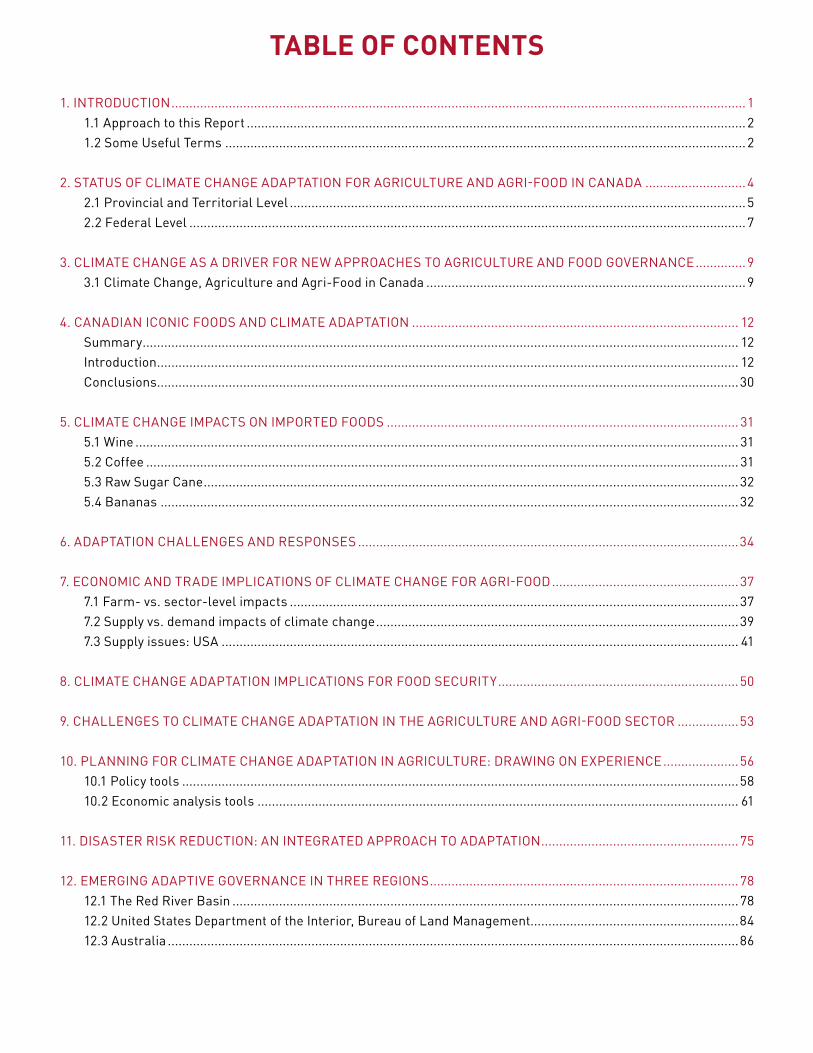
TABLE OF CONTENTS
1. INTRODUCTION ................................................................................................................................................................11.1 Approach to this Report ...........................................................................................................................................21.2 Some Useful Terms .................................................................................................................................................2
2. STATUS OF CLIMATE CHANGE ADAPTATION FOR AGRICULTURE AND AGRI-FOOD IN CANADA ............................42.1 Provincial and Territorial Level ...............................................................................................................................52.2 Federal Level ...........................................................................................................................................................7
3. CLIMATE CHANGE AS A DRIVER FOR NEW APPROACHES TO AGRICULTURE AND FOOD GOVERNANCE ..............93.1 Climate Change, Agriculture and Agri-Food in Canada .........................................................................................9
4. CANADIAN ICONIC FOODS AND CLIMATE ADAPTATION ........................................................................................... 12Summary ...................................................................................................................................................................... 12Introduction .................................................................................................................................................................. 12Conclusions ..................................................................................................................................................................30
5. CLIMATE CHANGE IMPACTS ON IMPORTED FOODS .................................................................................................. 315.1 Wine ........................................................................................................................................................................ 315.2 Coffee ..................................................................................................................................................................... 315.3 Raw Sugar Cane .....................................................................................................................................................325.4 Bananas .................................................................................................................................................................32
6. ADAPTATION CHALLENGES AND RESPONSES ..........................................................................................................34
7. ECONOMIC AND TRADE IMPLICATIONS OF CLIMATE CHANGE FOR AGRI-FOOD ....................................................377.1 Farm- vs. sector-level impacts .............................................................................................................................377.2 Supply vs. demand impacts of climate change .....................................................................................................397.3 Supply issues: USA ................................................................................................................................................ 41
8. CLIMATE CHANGE ADAPTATION IMPLICATIONS FOR FOOD SECURITY ...................................................................50
9. CHALLENGES TO CLIMATE CHANGE ADAPTATION IN THE AGRICULTURE AND AGRI-FOOD SECTOR .................53
10. PLANNING FOR CLIMATE CHANGE ADAPTATION IN AGRICULTURE: DRAWING ON EXPERIENCE .....................5610.1 Policy tools ...........................................................................................................................................................5810.2 Economic analysis tools ...................................................................................................................................... 61
11. DISASTER RISK REDUCTION: AN INTEGRATED APPROACH TO ADAPTATION .......................................................75
12. EMERGING ADAPTIVE GOVERNANCE IN THREE REGIONS ......................................................................................7812.1 The Red River Basin .............................................................................................................................................7812.2 United States Department of the Interior, Bureau of Land Management..........................................................8412.3 Australia ...............................................................................................................................................................86
CLIMATE CHANGE ADAPTATION AND CANADA’S CROPS AND FOOD SUPPLY BACKGROUND REPORT
V
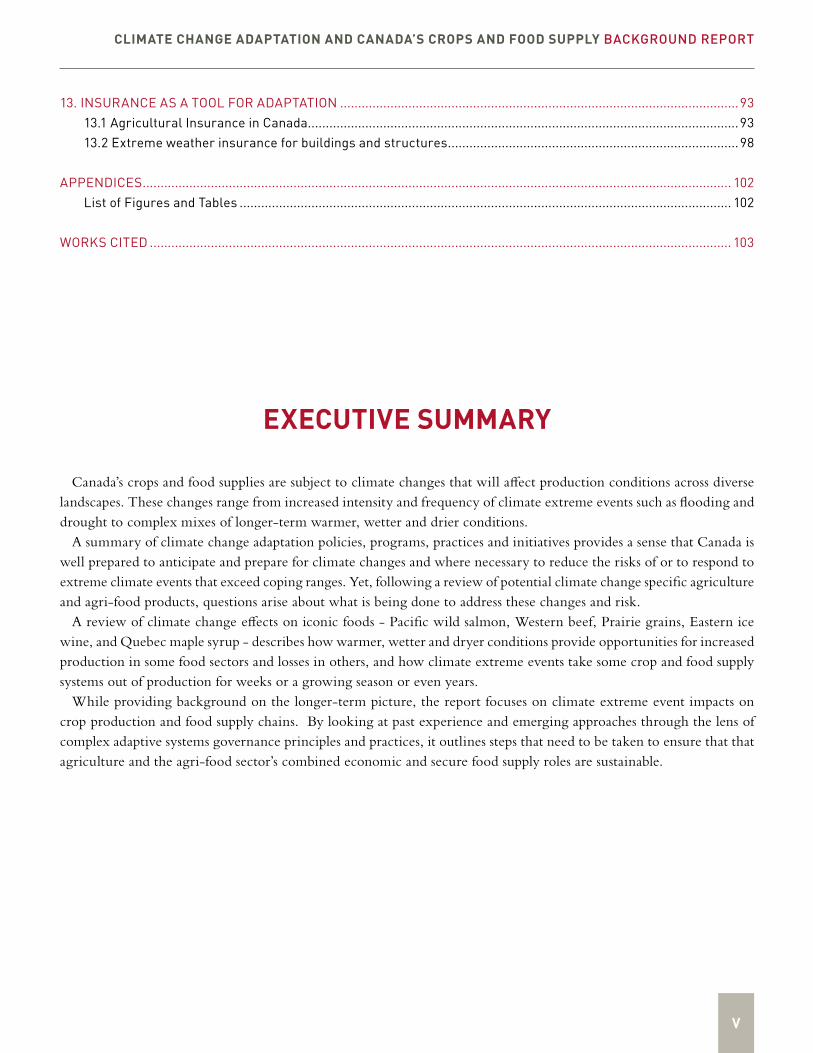
EXECUTIVE SUMMARY
Canada’s crops and food supplies are subject to climate changes that will affect production conditions across diverse landscapes. These changes range from increased intensity and frequency of climate extreme events such as flooding and drought to complex mixes of longer-term warmer, wetter and drier conditions.
A summary of climate change adaptation policies, programs, practices and initiatives provides a sense that Canada is well prepared to anticipate and prepare for climate changes and where necessary to reduce the risks of or to respond to extreme climate events that exceed coping ranges. Yet, following a review of potential climate change specific agriculture and agri-food products, questions arise about what is being done to address these changes and risk.
A review of climate change effects on iconic foods - Pacific wild salmon, Western beef, Prairie grains, Eastern ice wine, and Quebec maple syrup - describes how warmer, wetter and dryer conditions provide opportunities for increased production in some food sectors and losses in others, and how climate extreme events take some crop and food supply systems out of production for weeks or a growing season or even years.
While providing background on the longer-term picture, the report focuses on climate extreme event impacts on crop production and food supply chains. By looking at past experience and emerging approaches through the lens of complex adaptive systems governance principles and practices, it outlines steps that need to be taken to ensure that that agriculture and the agri-food sector’s combined economic and secure food supply roles are sustainable.
13. INSURANCE AS A TOOL FOR ADAPTATION ...............................................................................................................9313.1 Agricultural Insurance in Canada ........................................................................................................................9313.2 Extreme weather insurance for buildings and structures .................................................................................98
APPENDICES .................................................................................................................................................................... 102List of Figures and Tables ......................................................................................................................................... 102
WORKS CITED .................................................................................................................................................................. 103
1
1. INTRODUCTION
Food producers must constantly anticipate, prepare for and respond to a complex range of interacting environmental, social and economic changes as they make decisions about what and how much to grow. They have to consider grow-ing conditions, markets, prices and costs as well as public policies and programs. All of these and other factors are to a degree in a constant state of flux, a condition which the agricultural sector in Canada has been able to cope with, given the resilient nature of food producers and the roles played by governments and insurers to support business continuity through difficult circumstances. Emerging climate changes are beginning to affect growing conditions, and climate change induced extreme weather conditions in particular have begun to test the resiliency of food supply chains in Canada.
Slow or “creeping” climate changes alter rainfall, evaporation, runoff, and soil moisture conditions, and increase crop pest populations and plant disease affecting production and yield. These changes will vary by region, for instance with warmer temperatures and longer growth seasons in more northern regions, food production may subject to soil capability and rainfall increase.
More challenging are the increased risks of unprecedented, unpredictable climate change induced extreme weather, for example the wide spread floods in Manitoba in 2011 and the record breaking heat stress damage to corn crops in the summer of 2012. Given the urgency of these types of impacts on food supply chains in Canada, this report focuses on the extreme weather adaptation and risk reduction challenges to start a process that begins to address key governance questions:
1. How are crops being affected by current and foreseeable extreme weather events and climate trends?2. How will these events and trends affect local, regional, national and international food supplies?3. What adaptation responses are possible?4. How are decisions currently being made and implemented to determine and apply adaptation responses?5. What gaps and risks exist in existing governance approaches?6. With reference to gaps and risks, what do we need to do to improve the governance of crops and food supply
systems in the face of known (foreseeable) and uncertain conditions? 7. Acknowledging that adaptation and mitigation involve changes and those changes will likely require innova-
tion (doing things that have not yet proven to be effective and/or viable), how do we create and maintain an innovative/adaptive governance culture for crops and food supply?
We will revisit these questions at the end of this report.This background report offers supporting information for the policy approach laid out in the ACT CFS Summary
Report and Briefing Note. It provides a review of existing policies and tools for climate change adaptation in Canada’s
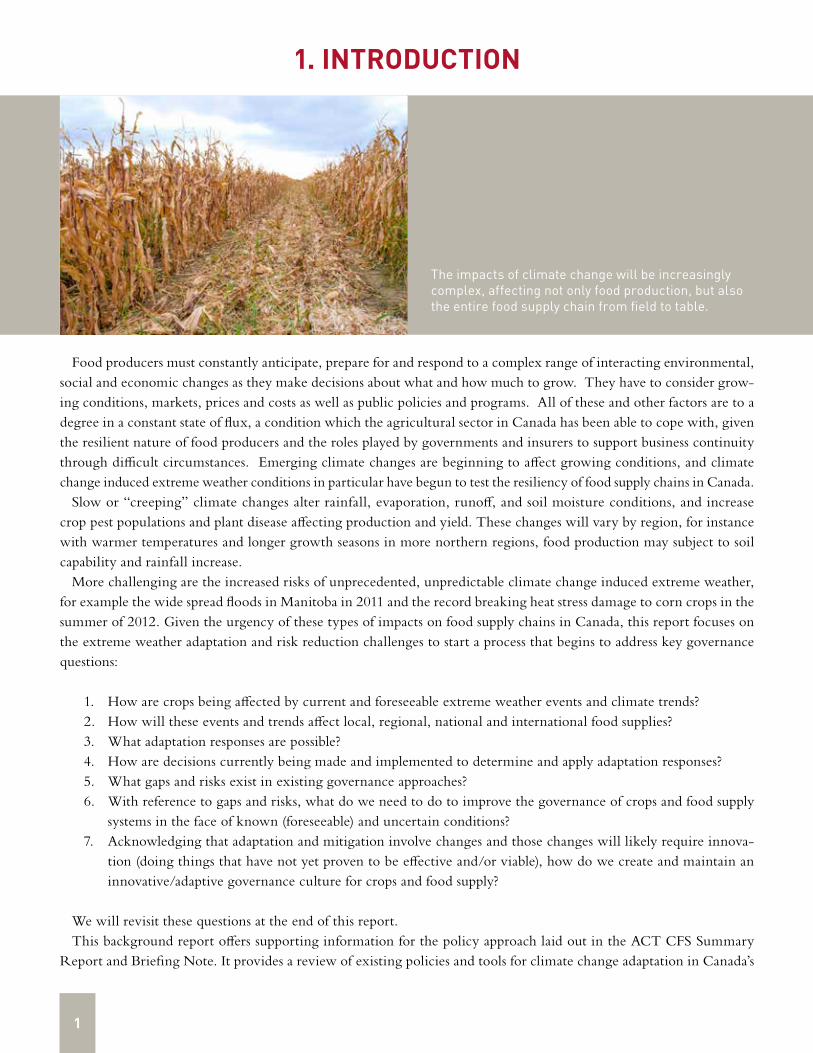
The impacts of climate change will be increasingly complex, affecting not only food production, but also the entire food supply chain from field to table.
CLIMATE CHANGE ADAPTATION AND CANADA’S CROPS AND FOOD SUPPLY BACKGROUND REPORT
2
agricultural sector and draws on experience in Canada and from other areas, where the impacts of extreme weather have prompted action towards effective, resilient adaptation policies, programs and practices
1.1 APPROACH TO THIS REPORT
The first section summarizes climate change (CC) and extreme climate event (ECE) impacts on crop and food supplies in Canada (Agriculture and Agri-food Canada 2010); and reports on the status of agricultural climate change adaptation policies and programs.
The second section explores climate change vulnerabilities and adaptabilities for selected “iconic” foods in Canada which will be, and in some cases are being affected by both “creeping “and “coping range exceeding” climate changes.
The third section uses flooding of prairie grain growing areas as an ECE case example. It introduces a range of as-sessment, planning and financial (e.g., insurance) approaches for anticipating, preventing and managing the impacts of ECEs using examples from Canada, the United Kingdom and the United States.
The fourth section suggests a multi-faceted governance strategy to achieve resilience in Canada’s crops and food supply systems, and strategies to develop opportunities driven by climate change.
1.2 SOME USEFUL TERMS
Before any discussion about adaptation can occur, it is important to establish accepted terminology around which the discussion will focus. The following is a selection of key terms that are commonly used during discussions about climate change and adaptation, with definitions quoted from the IPCC’s Special Report on Managing the Risks of Extreme Events and Disasters to Advance Climate Change Adaptation.
Climate Change: A change in the state of the climate that can be identified (e.g., by using statistical tests) by changes in the mean and/or the variability of its properties and that persists for an extended period, typically decades or longer. Climate change may be due to natural internal processes or external forcing, or to persistent anthropogenic changes in the composition of the atmosphere or in land use.
Climate Extreme (extreme weather or climate event): The occurrence of a value of a weather or climate variable above (or below) a threshold value near the upper (or lower) ends of the range of observed values of the
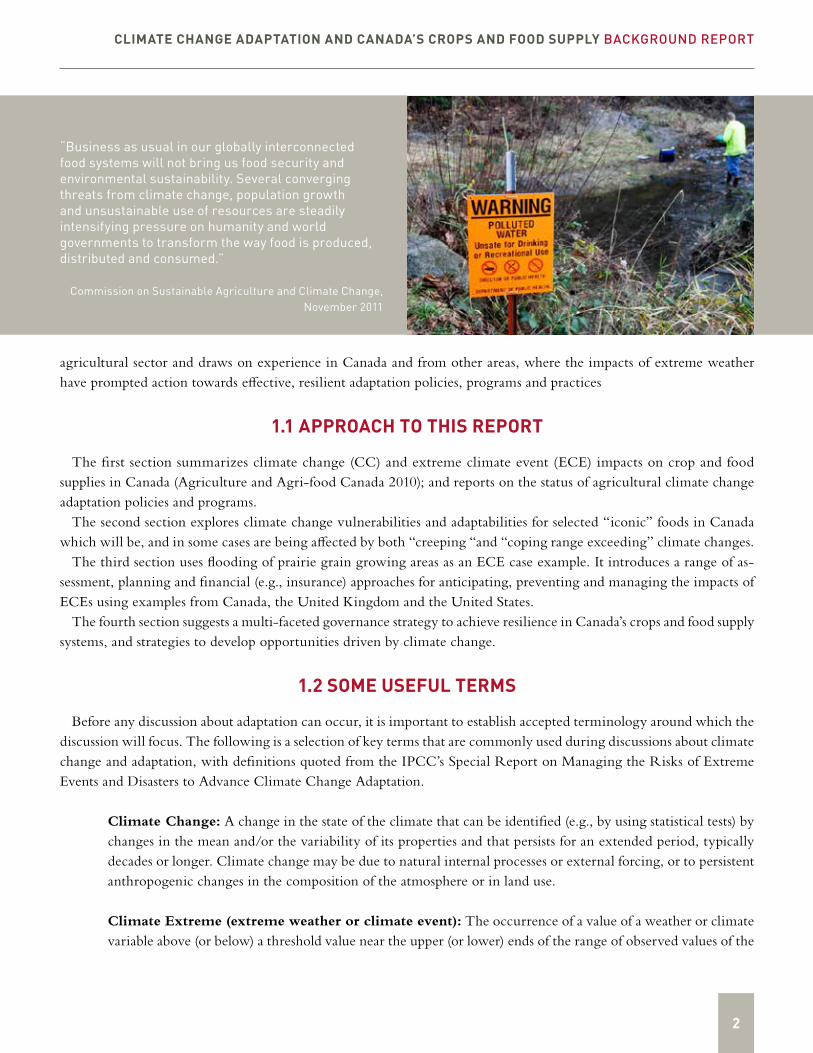
“Business as usual in our globally interconnected food systems will not bring us food security and environmental sustainability. Several converging threats from climate change, population growth and unsustainable use of resources are steadily intensifying pressure on humanity and world governments to transform the way food is produced, distributed and consumed.”
Commission on Sustainable Agriculture and Climate Change, November 2011
3
ACT ( A DA P TAT ION TO CL IM AT E CH A NGE T E A M)
variable. For simplicity, both extreme weather events and extreme climate events are referred to collectively as climate extremes.
Exposure: The presence of people, livelihoods, environmental services and resources, infrastructure, or eco-nomic, social, or cultural assets, in places that could be adversely affected.
Vulnerability: The propensity or predisposition to be adversely affected.
Disaster: Severe alterations in the normal functioning of a community or a society due to hazardous physical events interacting with vulnerable social conditions, leading to widespread adverse human, material, economic, or environmental effects that require immediate emergency response to satisfy critical human needs and that may require external support for recovery.
Disaster Risk: The likelihood over a specified time period of severe alterations in the normal functioning of a community or a society due to hazardous physical events interacting with vulnerable social conditions, leading to widespread adverse human, material, economic, or environmental effects that require immediate emergency response to satisfy critical human needs and that may require external support for recovery.
Disaster Risk Management: Processes for designing, implementing, and evaluating strategies, policies, and measures to improve the understanding of disaster risk, foster disaster risk reduction and transfer, and promote continuous improvement in disaster preparedness, response, and recovery practices, with the explicit purpose of increasing human security, well-being, quality of life, resilience, and sustainable development.
Adaptation: In human systems, the process of adjustment to actual or expected climate and its effects, in order to moderate harm or exploit beneficial opportunities. In natural systems, the process of adjustment to actual climate and its effects; human intervention may facilitate adjustment to expected climate.
Resilience: The ability of a system and its component parts to anticipate, absorb, accommodate, or recover from the effects of a hazardous event in a timely and efficient manner, including through ensuring the preservation, restoration, or improvement of its essential basic structures and functions.
Transformation: The altering of fundamental attributes of a system (including value systems; regulatory, legislative, or bureaucratic regimes; financial institutions; and technological or biological systems).”
The following definition is provided by the United Nations International Strategy for Disaster Reduction (UNISDR).
Coping capacity: The ability of people, organizations and systems, using available skills and resources, to face and manage adverse conditions, emergencies or disasters.
CLIMATE CHANGE ADAPTATION AND CANADA’S CROPS AND FOOD SUPPLY BACKGROUND REPORT
4
2. STATUS OF CLIMATE CHANGE ADAPTATION FOR AGRICULTURE AND AGRI-FOOD IN
CANADA
Acknowledging that agriculture, by definition, involves adaptive management is a necessary starting point for under-standing adaptive responses to climate change. Although food production began with and continues to take advantage of naturally occurring relationships between the primary production of food and existing ambient conditions1, for thousands of years agriculture has involved, for example, technologically adapting ambient conditions (i.e., through irrigation) and/or biological systems (i.e., through hybridization) to increase yields. These adaptations have always been and to the extent that they are possible, given unmitigated climate change (see box) will continue to be social and economic issues, hence matters of governance
Reflecting these points, the current and anticipated challen-ges for agricultural adaptation to climate change is described in following quote from Agriculture and Agri-Food Canada’s (AAFC) Climate Change Strategy (September 2010). This quote starts with description of about how agriculture in Canada will be affected by climate changes, which are matters of changes in ambient environments, and ends with a description of social and economic considerations. Agriculture in Canada is:
“…impacted by climate change and these impacts will likely grow in intensity and frequency. Changing pre-cipitation and temperature patterns will alter the distribution and availability (including timing of availability) of freshwater resources. Extreme climate events are expected to increase in frequency and magnitude including: an increase in the number of heat waves per year; less frequent and more intense precipitation events; more frequent and severe droughts in those areas where precipitation averages are projected to decrease; and decrease in the number of days of severe cold per year. The combination of increasing average temperature and changing water availability may change agricultural production potential, possibly reducing opportunities in some areas while opening opportunities in others where the growing season had previously been too short. Finally, land and water ecosystems will continue to be disturbed meaning animals, plants, bacteria and viruses will migrate to new areas with more favorable conditions, and that infectious diseases and certain species could invade pre-viously unaffected areas. Potentially, the behavior and distribution of pests and pathogens will be altered. The Canadian agricultural sector’s capacity to cope with these various changes in climate and impacts will vary by region, as will the socio-economic impacts, including such things as impacts on infrastructure, rural life, cultural shifts with increasing demand for local food, impacts on vulnerable populations, emotional stress etc. Adaptation is critical.” (Pages 12 and 13)
1 Another term that could be used here is “ecosystem goods and services.”
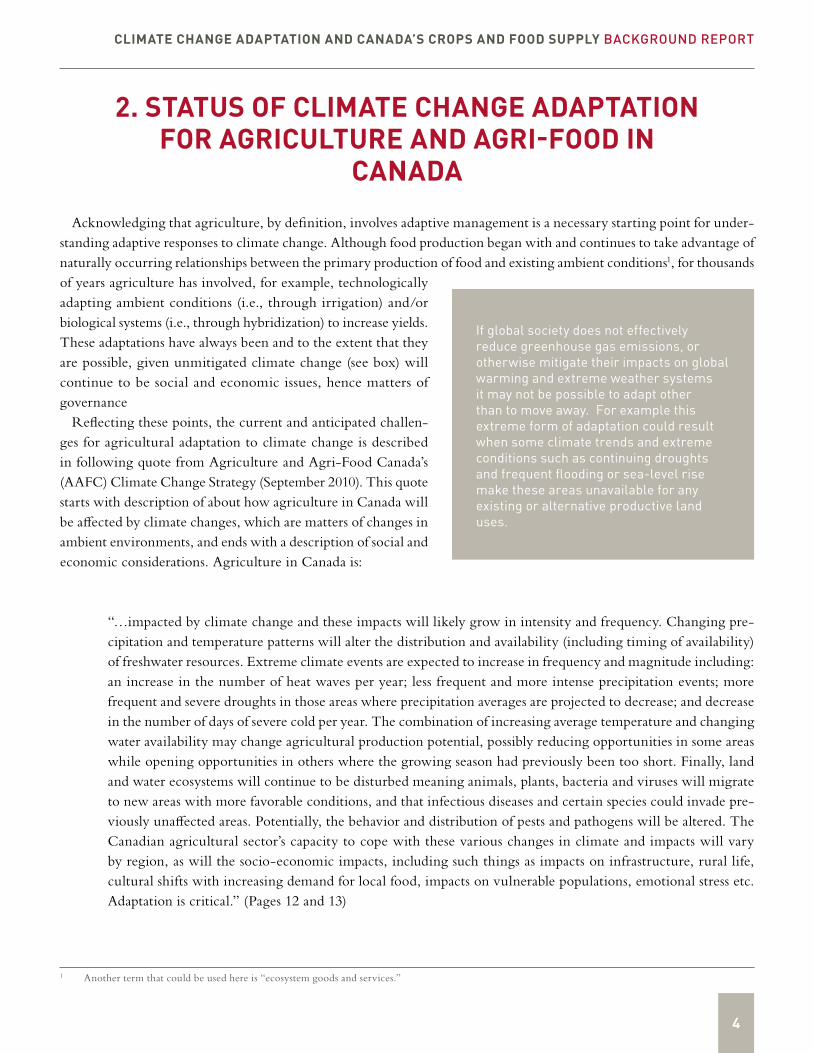
If global society does not effectively reduce greenhouse gas emissions, or otherwise mitigate their impacts on global warming and extreme weather systems it may not be possible to adapt other than to move away. For example this extreme form of adaptation could result when some climate trends and extreme conditions such as continuing droughts and frequent flooding or sea-level rise make these areas unavailable for any existing or alternative productive land uses.
5
ACT ( A DA P TAT ION TO CL IM AT E CH A NGE T E A M)
In Canada, provincial/territorial governments and the federal government collaboratively manage public interests in the agriculture and agri-food sector. The following summary of provincial policies, programs, practices and initiatives2, provides a status report on government CCA programs for this sector.3
2.1 PROVINCIAL AND TERRITORIAL LEVEL
At this level there are broad and focused initiatives to improve the state of knowledge regarding risks and opportun-ities associated with climate change; address priority adaptation research and development gaps; enable consideration of agricultural climate change adaptation issues in government decision-making; integrate climate change adaptation considerations into decision-making of agricultural organizations and operations. These include:
Soft Path Approaches4
• Preparing manuals to guide organizations through a process of understanding sensitivities and existing adaptive capacity. These guides are used to assess vulnerabilities and to help prioritize key climate change risks according to the likelihood of occurrence and magnitude of impacts, including vulnerabilities within the agricultural sector.
• Identifying climate changes and extreme climate event risks for the agricultural and agri-food sector focusing on specific crops, pests and diseases.
• Assessing the sector’s vulnerability, prioritizing the risks the industry will face to each impact and Identifying adaptation options to allow agriculture to respond to the negative impacts and take advantage of any new opportunities that may exist.
• Preparing plans for agricultural adaptation measures in the form of strategies to address water shortages as well as to address the introduction of new species and hybrid species that are more resistant to heat and drought.
• Carrying out Integrated Watershed Management Planning (IWMP) as a cooperative effort including water-shed residents, government and other stakeholders to create long-term plans to manage land, water and related resources on a watershed basis.
• Identifying opportunities for northern agriculture (in those areas which will be subject to warmer and wetter conditions).
• Establishing management protocols for new diseases and pests and the arrival of new species with different economic values and environmental impacts.
• Increasing the agricultural sector’s resilience to climate change by updating the Environmental Farm Plan (EFP) program.
• Requiring EFP adaptation risks assessments as a prerequisite for funding on-the-ground actions to address these.• Inclusion of climate change outcomes as part of environmental impact assessments. • Creation of a web-based clearinghouse of information on practices and support for adaptation.• Supporting organizations involving scientists and professionals who focus on climate sciences and impacts &
adaptation.• Developing a strategy for the sustainability of natural capital.• Inquiring whether the recent global climate patterns and more extreme weather events across the Canadian
landscape were concerning producers. Producers were asked to describe the ways they historically and currently
2 The word “initiatives” is used to describe opportunity, problem or issue focused activities and projects that are generally cross-disciplinary and trans-organizational in nature.
3 Based on a government-by-government summary prepared by Linsay Martens in late 2011/early 2012. See Appendix 24 This is a term used to describe the integration of demand and supply side management, which is used for water management. In a climate
change context, this term could be elaborated to describe a triple loop learning approach starting with linear responses (in water context this would be a supply-side approach), moving to responsive approaches (demand and supply considerations) to transformative/resilient ap-proaches that encompass and consider whole system synergies. The listed initiatives are primarily soft path, responsive in nature.

CLIMATE CHANGE ADAPTATION AND CANADA’S CROPS AND FOOD SUPPLY BACKGROUND REPORT
6
deal with risks and opportunities arising from changing climate and what they intend to use as longer term strategies.
Technology Development, Demonstrations, and On-the-Ground Investments5
• Identifying and supporting the development of new technologies and practices to assist the agricultural and agri-food sector with CCA and DRR.
• Funding technology demonstrations or transfers that encourage sustainable agri-environmental practices, with priority given to quality management, environmental goods and services (EG&S), and improvements in crop system efficiency, all of which have the potential to contribute indirectly to agricultural adaptation.
• Investigating the role of the EG&S concept in the development of future agri-environment policy, including the possibility of incentive payments for the continued provision of EG&S on agricultural land.
• Protecting plant health by searching for new crop varieties and cropping systems and encouraging the adoption of best management practices.
• Responding to animal health risks, including those emerging as a result of climate change; through increased veterinary outreach activities, improved biosecurity practices and protocols, disease surveillance, early detection, and by working in partnership with non-government institutions.
• Researching and advocating farm energy conservation.• Supporting coaching and specialized consulting services and supporting the adoption of better agro-environ-
mental practices. • Evaluating the potential for new business risk-management models to better reflect climate change stimuli.• Reforesting marginally productive agricultural lands.• Promoting reduced tillage management, cover crops, improved manure storage and nutrient management systems• Creating a climate change adaptation fund (at the provincial level).• Creating farm investment programs for various projects and investments, including: water management; bio-
diversity management; fencing; and business succession planning, which may include consideration of climate changes.
Jacques, De Vit, and Gagnon-Lebrun conducted an assessment of the status of climate change adaptation in Canada’s agricultural sector in June 2010 for the Policy Research Initiative. While somewhat out-of-date – some of the initiatives outlined in the summary above were not yet underway during the 2010 assessment – the report provides the following analysis:
In all the provinces and territories, we saw an effort to integrate and take account of the challenges that climate change poses for the agricultural sector in various policies and various sectoral programs (e.g., energy, the en-vironment). There is increasing coordination of actions by those responsible for questions related to adaptation by the agricultural sector to climate change.6
5 These initiatives tend to be linear or reactive initiatives. Neither of these terms is pejorative; they simply describe approaches that deal with specific tools. Such tools are absolutely essential to addressing climate change adaptation and disaster risk reduction. However, as described at the end of this report, in order for these to be fully effective, attention also needs to given to contextual considerations.
6 http://www.horizons.gc.ca/sites/default/files/Publication-alt-format/2010-0040-eng.pdf
7
ACT ( A DA P TAT ION TO CL IM AT E CH A NGE T E A M)
2.2 FEDERAL LEVEL
The Growing Forward multilateral framework was completed at the federal-provincial-territorial Ministers of Agriculture meeting in July 2008. The Growing Forward framework replaced the Agricultural Policy Framework and is supported by a commitment of $1.5 billion in federal-provincial-territorial funding over five years for non-business risk management cost-shared programs. The $1.3 billion is cost-shared on a basis of 60/40 between the federal government and the provincial and territorial governments.
Included in the Growing Forward framework is the National Farm Stewardship Program that provides cost-shared incentives for beneficial management practices (BMPs) that help maintain or improve the quality of soil, water, air or biodiversity resources. Through this program, farmers can obtain up to $50,000 in cost-shared incentives; projects are required to be either 50 or 70% funded by farmers. Eligible BMPs include:
• Cropping systems, including low disturbance seeding and fertilizing as well as precision farming applications (global positioning system technology);
• Livestock site management, including remote watering systems and farmyard runoff control;• Manure management, including manure nutrient planning;• Land management, including re-vegetating waterways and riparian areas, protecting marginal soil areas, and
establishing shelterbelts;• Water well management, including protecting existing wells; • Irrigation management, including equipment modification; and• Pest management, including native plant re-establishment and integrated pest management planning.7
Though not explicitly climate change adaptation practices, it is clear that each of the BMPs aims to enhance the resilience of farmers, while better protecting the environment.
In order to obtain cost-shared incentives, farmers must complete an environmental farm plan (EFP). EFPs are:
“… voluntary, confidential, self-assessment tools used by producers to raise awareness about environmental risks and opportunities on their operations. As part of their EFP, farmers develop their own action plans to identify management practices that can reduce environmental risk on their operations.”8
To complete an EFP, a farmer must attend two free informational workshops – facilitated by other farmers who func-tion as facilitators – and undertake an assessment of the soil and site characteristics of their farms. With the help of the EFP workshop facilitators, farmers develop action plans to manage any identified risks. Farmers submit their completed action plans to confidential, anonymous peer review process conducted by a panel of farmers. Upon endorsement of the action plan by the peer review committee, farmers become eligible to apply for cost-shared funding.
In July 2011, FPT Agriculture Ministers (with the notable exception of the Ontario Agriculture Minister9) endorsed the Saint Andrews Statement (SAS) at their annual meeting.
• In addition to identifying overarching and operational principles, the SAS identifies key policy objectives:• Competitiveness in domestic and international markets;• Adaptability and sustainability for the sector;
7 http://www.gov.mb.ca/agriculture/growingforward/gf_programs/pdf/aaa19s19d.pdf8 Canada Saskatchewan Farm Stewardship Program. (2009). Retrieved on June 14, 2013 from: http://saskpcab.com/environmental-farm-plan/efp-faq/9 Ontario Agriculture Minister Carol Mitchell refused to sign the document, saying that: “We’re not supportive of any cuts to our current suite of
programs. There is a consensus around the (Ontario agriculture) table that the current suite of programs is not meeting our needs and to bring forward cuts to programs that already are not meeting our needs is just compounding the problem.” (Western Producer, July 28, 2011).
CLIMATE CHANGE ADAPTATION AND CANADA’S CROPS AND FOOD SUPPLY BACKGROUND REPORT
8
• Innovation from discovery to adoption; and• Institutional, physical, and human resource infrastructure.
The SAS references climate variability affecting production, but no explicit reference to climate change itself or climate change adaptation is contained in the statement.10
According to Western Producer reports, “The St. Andrews Statement down-played business risk management issues and concentrated on investment in science, innovation and trade expansion. It did not mention tighter rules for AgriStability triggers.”11
Government officials will now be developing a multilateral agreement that will provide greater detail on the next iteration of the Growing Forward suite of programs.
In addition to above policies, programs, practices and initiatives that primarily address adapting to “creeping” cli-mate changes, there are also extreme climate event disaster risk approaches in Canada. Some of these will be noted in following sections of this report.
10 This is perhaps reflective of a recently funded federal government policy to “mainstream” climate change adaptation, rather than address this policy theme holistically. In this context mainstreaming calls on programs in government to give climate adaptation attention to the adminis-tration of specified programs. The following URLs were accessed on August 13, 2012.
For a list of programs and related initiatives be funded by the Government of Canada from 2012 to 2017 see:http://www.ec.gc.ca/default.asp?lang=En&n=56D4043B-1&news=B67A7995-A1CA-4DE3-89D2-E4E3C0E24BFB
For information on funding that could benefit climate adaptation in the agriculture and agri-food sector, see:http://www.dfo-mpo.gc.ca/science/oceanography-oceanographie/accasp/index-eng.html
Although details about the basins initiative highlighted on this page are not available, perhaps this will be comparable in some respect to the US Department of Interior basin approach described later in this paper.
11 Wilson, B. ( July 28, 2011). Tweaking still needed on next round of support: Ontario. Western Producer. Retrieved on June 8, 2013 from: http://www.producer.com/issue/july-28-2011-the-western-producer/
9
ACT ( A DA P TAT ION TO CL IM AT E CH A NGE T E A M)
3. CLIMATE CHANGE AS A DRIVER FOR NEW APPROACHES TO AGRICULTURE
AND FOOD GOVERNANCE
3.1 CLIMATE CHANGE, AGRICULTURE AND AGRI-FOOD IN CANADA
During the past five years, the Canadian agricultural and agri-food sector has suffered from drought, freezing, fire, flooding and hail, compounded by pest and disease problems. Widespread events, impacting entire regions of producers, included the following:
• Flooding that damaged homes and cropland in northeastern and southeastern Alberta in June and July 2011.• Flooding that damaged vegetable and potato crops and damaged livestock pastures in southwestern and central
British Columbia during fall 2010.• Flooding that inundated farmland in the Assiniboine River basin of Manitoba in April and June 2011.• Extensive flooding that affected farmland along the Richelieu River in Quebec during April and May 2011.• Flooding that affected crop and livestock producers across parts of Alberta, Saskatchewan, and Manitoba during
the spring and early summer of 2011. • Drought that impacted central and northern Alberta and west central and northern Saskatchewan crop and
livestock producers in 2008 and 2009.
The most apparent impacts of climate change on producers are those that directly result in production or yield losses, such as drought or flooding. Indirect impacts are not as obviously linked to climate change. Reduced agricultural yields due to pests and diseases that benefit from changing climatic conditions, yield reduction from plant heat stress, diminished agricultural worker productivity due to extreme heat and associated health impacts, and increased produce spoilage due to transportation infrastructure losses associated with extreme events are all examples of potential indirect impacts of climate change.
Market impacts can be measured based on established prices and quantities available of agricultural goods. For example, if an extreme climatic event or period (as was the case in 2012 in Ontario which experienced early spring high temper-atures followed by damaging late spring freezing temperatures) diminishes the annual harvest of tree fruits, the market impact of that event can be measured based on lost production or lost revenue to agricultural producers. Disruptions in the production of agricultural goods due to climate and weather-related events are reflected in the prices of these goods. While the relationship between production and price is complex and influenced by numerous factors, such as declines in the value of the U.S. dollar, rising energy prices, increasing costs of production, commodity speculation, and trade policies of major importers or exporters12, price increases are commonly observed in conjunction with supply decreases.
Non-market impacts are more difficult to quantify, because non-market goods and services are not traded openly and have no assigned prices. The values of non-market goods, such as human health and well-being and environmental quality, may be impacted by climate change and should be accounted for in any assessment of potential impacts, even if only a qualitative impact assessment is possible.
12 Trostle, R. (2008). Global Agricultural Supply and Demand: Factors Contributing to the Recent Increase in Food Commodity Prices. WRS 0801. USDA Agricultural Research Service.
CLIMATE CHANGE ADAPTATION AND CANADA’S CROPS AND FOOD SUPPLY BACKGROUND REPORT
10
Climate change has already begun to diminish global crop yields and has pushed up food prices. In a recent study, Lobell et al.13 estimate that rising global temperatures have boosted maize and wheat prices by 20% since 1980.14 In August 2011, global food prices had nearly climbed back up to 2008 levels.15 The World Bank Food Price Index increased 33% in 2011 alone.16 The damage to global consumers has been compounded by extreme price volatility, particularly for dietary staples such as rice, maize, and wheat.
While the effects of climate change will vary across geographic regions, consensus among the scientific community has been reached regarding a number of expected impacts. Global climate projections indicate that many developing countries, and South Asian countries in particular, will experience significant yield declines for many crops, leading to reduced food availability and insufficient food calorie availability across the world by 2050.17 Decreased yields will result in further price increases for many culturally and nutritionally significant crops, including rice, maize, wheat, and soybeans.18 These factors are expected to create a combined effect of increasing malnutrition among children by an estimated 20%.
Regional impacts of extreme weather events and periods were reflected in grain supply and prices during 2010-2011, with the global wheat market demonstrating some of the most dramatic responses. In 2010, Russia, a major global wheat exporter, banned exports following the worst drought in 50 years.19 The ban contributed to a foreseeable effect on global wheat prices, which rose 70% by June 2011.20
Global supply shortages continued into May 2011 as flooding in western Canada prevented seeding while dry weather in Europe and the U.S. threatened winter crops.21 A wet spring and late start to the growing season on the Canadian Prairies was expected to cost wheat producers an estimated $1.5 billion to $2.5 billion in lost revenue during the 2011 growing season.22 Ontario farmers were also forced to delay seeding in 2011 due to wet ground conditions, causing some corn farmers to switch to shorter-season varieties or abandon corn cultivation in favour of other crops.23
Wheat is only one of several agricultural goods that were costing Canadian consumers more money in 2011. In the twelve months preceding June 2011, food prices in Canada rose 4.3%, while the Consumer Price Index increased by only 3.1%.24 Price increases were experienced across most commodities, including meat (5.9%), bakery products (7.2%), bread (10.1%) and fresh vegetables (8.4%).25 A portion of these price increases was also passed on by value-added service providers, observed in a 3.3% increase in the price of food purchased from restaurants.26
The year 2012 has also proven challenging for Canadian and American farmers, with drought-related effects so severe they are expected to be felt into next year.27 Excessive heat and dryness have plagued the Great Plains and southern states including Nebraska, Kansas, Oklahoma and Texas, while excessive precipitation has affected much of the Canadian 13 (2011).14 Lobell, D., Schenkler, W., Costa-Roberts, J. (2011). Climate Trends and Global Crop Production Since 1980. Science 333(6042): 616-620.15 World Bank (2011) Food Price Watch (August 2011). Retrieved on September 9, 2011 from the World Bank website:http://siteresources.worldbank.
org/INTPOVERTY/News%20and%20Events/22982477/Food-Price-Watch-August-2011.htm16 World Bank. (2011).17 Nelson, G. C., Rosegrant, M. W., Koo, J., Robertson, R., Sulser, T., Zhu, T., Ringler, C., Msangi, S., Palazzo, A., Miroslav, B., Magalhaes, M.,
Valmonte-Santos, R., Ewing, M., Lee, D. (2009). Food Policy Report: Climate Change – Impact on Agriculture and Costs of Adaptation. International Food Policy Research Institute. Retrieved on August 8, 2011 from the IFPRI website: http://www.ifpri.org/sites/default/files/publications/pr21.pdf
18 Nelson et al. (2009).19 CBC News (2011, May 10) Wheat prices rise on weather worries. CBC News. Retrieved August 8, 2011 from the CBC News website: http://www.cbc.ca/
news/business/story/2011/05/10/wheat-prices-rise.html20 CBC News (2011, June 14) Wet weather affects Prairie wheat seeding. CBC News. Retrieved August 8, 2011 from the CBC News website: http://www.
cbc.ca/news/business/story/2011/06/14/wheat-planting.html21 CBC News (2011, May 10).22 CBC News (2011, June 14). 23 Miner, J., Hensen, M. (2011, May 5). Lousy weather creates trouble in the fields. London Free Press. Retrieved August 8, 2011 from the London Free
Press website: http://www.lfpress.com/news/london/2011/05/04/18103791.html24 Statistics Canada (2011, July 22) Latest Release from the Consumer Price Index. Retrieved on August 17, 2011 from the Statistics Canada website:
http://www.statcan.gc.ca/subjects-sujets/cpi-ipc/cpi-ipc-eng.htm25 Statistics Canada (2011).26 Statistics Canada (2011).27 Schwartz, D. (2012, August 9) Drought has major impact in North America and worldwide. CBC News. Retrieved on August 15, 2012 from the CBC
News website: http://www.cbc.ca/news/world/story/2012/08/09/f-drought-impact.html
11
ACT ( A DA P TAT ION TO CL IM AT E CH A NGE T E A M)
prairies.28 US corn crops have been hit the hardest; as of August 2012, the USDA forecast that corn production would be down 13% from 2011, the lowest level since 2006.29 The USDA soybean forecast was also down, by 12% since 2011, while wheat production was forecast to increase by 11%.30
Weather and climate conditions have long been recognized as key determinants to the success of agricultural ven-tures, yet the effects of variations on crop productions are often underrated.31 However, as the effects of climate change become more noticeable, adaptation to climate change and its impacts is receiving increasing attention. In areas where economic health is largely dependent on high yields of agricultural crops, policy debates on climate change are looking not only at mitigating the effects of climate change through reductions of greenhouse gas emissions, but also at adapting agricultural production in light of climate change.32
28 Schwartz, D. (2012, August 9).29 USDA (2012, August 14) Weekly weather and crop bulletin. Retrieved on August 15, 2012 from the USDA website: http://www.usda.gov/oce/weath-
er/pubs/Weekly/Wwcb/wwcb.pdf30 USDA (2012, August 14).31 Wall & Smit (2005). Climate change in light of sustainable agriculture. Journal of Sustainable Agriculture 27(1).32 Smit et al. (2000); UNFCCC ( January 26, 2011).
CLIMATE CHANGE ADAPTATION AND CANADA’S CROPS AND FOOD SUPPLY BACKGROUND REPORT
12
4. CANADIAN ICONIC FOODS AND CLIMATE ADAPTATION
Dr. Lenore Newman, Canada Research Chair, Food Security and Environment, University of the Fraser Valley
SUMMARY
An examination of iconic Canadian food products revealed that climate change has the potential to impact produc-tion of these products through long-term gradual climate trends and an increase in severe weather events capable of creating catastrophic damage. Adaptation strategies can mitigate the impact of these changes, but action will be needed in advance of significant climate shifts.
INTRODUCTION
Much of Canada’s culture has been defined by cold weather, from the national fascination with ice hockey to the popularity of the Quebec Winter Carnival and the giant bonhomme de neige who symbolizes it. Canadian cuisine is also highly informed by cold weather; the most well known examples include maple syrup and wild Pacific salmon, but less well-known products such as icewine also play a role in Canada’s food culture and in our export and tourism industries. Although Canadian cuisine has proven difficult to define, it combines the use of native ingredients with techniques and recipes originated elsewhere.33 Canada’s strong culinary connections to cold weather foods, as well as wild foods, was firmly established at Expo 67 in Montreal, where the Canadian pavilion restaurant featured cuisine from the Northern regions of the country.
Maintaining culinary identity through such products has been identified as important to food security. Efforts to ensure food security include safeguarding and strengthening cultural foods as a secondary goal.34 Climate change poses unusual challenges to many northern foodways, and particularly to crops that require extensive periods of extreme cold to properly mature. This in turn poses a direct threat to the producers of such crops, and also poses a challenge to culinary tourism, a growing industry in many regions of Canada.35 On a deeper level, food is used to define group identity36, it helps to create the image of a place, and has been called a central definer of a nation - on par with lan-guage37. Without maple syrup, ice wine, cold water seafoods, and other such products, Canadian cuisine would reflect a very different nation.
This report examines five major Canadian food products that are particularly iconic of their region. These products are largely “foods of locality”, that is products that represent their region and have considerable marketing potential as Canadian products. Each product is examined in terms of potential climate impacts, and adaptation paths are suggested.
33 Jacobs, H. (2009). Structural elements in Canadian cuisine. Cuizine: The Journal of Canadian Food Cultures Vol. 2(1). Accessed June 8, 2013 from: http://www.erudit.org/revue/cuizine/2009/v2/n1/039510ar.html
34 Koc et al. (1999). Introduction: Food Security as a Global Concern. In Koc, M. et al. (eds). For Hunger Proof Cities: Sustainable Urban Food Systems. Ottawa: International Development Research Centre.
35 Hashimoto, A. &Telfer, D. J. (2006). Selling Canadian culinary tourism: Branding the global and the regional product. Tourism geographies, 8(1), 31-55.
36 Locher et al. (2005). Comfort Foods: An Exploratory Journey into the Social and Emotional Significance of Food. Food and Foodways: Explorations in the History and Culture of Human Nourishment 13(4).
37 Bell & Valentine (1997). We Are What We Eat: Consuming Geographies. New York: Routledge.
13
ACT ( A DA P TAT ION TO CL IM AT E CH A NGE T E A M)
1. Maple Syrup and Climate AdaptationCanada’s best known national food of locality, maple syrup is a major part of our folklore, and an important income
generator in rural areas of Quebec and Eastern Ontario. Quebec produces 80% of the world’s supply, and in a world where food conscious consumers are questioning the safety of sweeteners such as high fructose corn syrup, demand for maple products is likely to rise. Made from the sap of the Acer Saccharum, or sugar maple, maple syrup and sugar provides on average one quarter of the annual income of the producers. This income, however, comes before planting season, and can be critical in the sustainability of rural farming38. There are roughly 13,500 producers in Quebec, and the industry produces $610 million in GDP.
Maple syrup is an indigenous North American food. When European explorers first arrived in North America they discovered many distinct civilizations of Aboriginal people whose ancestors had occupied the land for thousands of years. These different Aboriginal societies had their own cultures and traditions, including distinct cuisines. The cuisines of the different tribes varied based largely on their location and environment, as well as on the preparation techniques known and practiced. Maple syrup and maple sugar were among the products that early colonists incorporated into their diets long before learning the techniques necessary to produce these foods themselves, trading for sugar with native populations in exchange for iron goods.
Anthropologists have long attempted to discover the beginnings of maple syrup and maple sugar production among the Aboriginal peoples of North America, but the exact origins are lost to history. In 1891, anthropologist A. F. Chamberlain published an article in American Anthropologist entitled “The maple among the Algonkian tribes”, which discussed the records of the origins of maple syrup and maple sugar that were available. Chamberlain recounts numerous stories from various tribes, including a legend from the Ottawa and Chippewa tribes. According to this account, the mischievous Ne-naw-bo-zhoo tasted the sweet sap of the maple tree, and then diluted it with water until the sweet taste disappeared. “Now,” he said, “my nephews will have to labour hard to make the sugar out of this sap, and the sugar will be much more valuable to them in the future time.”
Despite the labour involved in the extraction of maple syrup and maple sugar, Aboriginal peoples who lived in maple regions used to produce both in large quantities. Sugaring techniques allowed for a product that was easier to pack and transport than maple syrup, and a far-reaching maple sugar trade was developed amongst the different Aboriginal tribes. The production of maple sugar was a large commercial operation among some tribes, including among the different Chippewa and Algonquian peoples.39 When European settlers arrived in North America they began to trade for maple sugar; the Canadian Settlers’ Guide, produced in 1860, recommended the purchase of “Indian sugar,” despite the author’s perception that this sugar had a “peculiar taste.”40 Although eventually European settlers began their own maple syrup operations, they did not reach the large scale or attain the market share of the Aboriginal producers. Instead, immediate and extended family units often undertook maple syrup production, and left maple sugaring to large commercial buyers and cooperatives.41
Although maple syrup and maple sugar became culturally important foods and major parts of the cultural economy of certain Aboriginal peoples long before colonization, they might never have reached the same importance to colonists were it not for the slave trade. In the United States, maple syrup production and maple sugaring came to be seen as a means of self-sufficiency and of independence from the British-dominated sugar trade. In Canada, the production and consumption of maple syrup and maple sugar was presented as a moral imperative; unlike imported sugar, it was not produced by slave labour. Abolitionists presented maple syrup and maple sugar as being “more pleasant and more patriotic than that ground by the hand of slavery.”42 Although many settler families began to produce maple syrup at levels that
38 Hinrichs, C. C. (1998). Sideline and lifeline: The cultural economy of maple syrup production. Rural Sociology, 63(4), 507-532.39 Mason, C. I. (1990). A sweet small something: Maple sugaring in the New World. In J. A. Clifton (Ed.), The invented Indian: Cultural fictions and govern-
ment policies (91-105). New Brunswick, NJ: Transaction Publishers.40 Chamberlain, A.F. (1891). The maple among the Algonkian tribes. American Anthropologist, 4(1), 39-44.41 Hinrichs (1998).42 Pierce, A. (2002). Maple syrup (acersaccharrum). In P. Shanley, A. Pierce, S. Laird, & A. Guillen (Eds.), Tapping the green market: Certification and
CLIMATE CHANGE ADAPTATION AND CANADA’S CROPS AND FOOD SUPPLY BACKGROUND REPORT
14
made them self-sufficient, maple sugaring remained more common among Aboriginal producers than among the less skilled settlers.43 In modern times, maple syrup production persists among farmers and non-farmers alike both where it is economically important and where it is an economically marginal activity, as it both emerges from and helps create the local community culture and resource environment.44
Maple syrup production is particularly vulnerable to climate change. The tree roots require snow cover for protection, and the syrup season only lasts four to six weeks in the early spring, when temperatures crossing back and forth across the freezing point cause the sap in the trees to run freely.
In the last fifteen years, sap production has declined as April temperatures have risen. It is estimated that the industry will decline by about 20% in the next forty years; decline in the US will be much sharper. Extreme weather can also pose a threat to syrup production. The 1998 ice storm destroyed 12.5% of the taps in Eastern Ontario, and dropped syrup production by 25% for a cost of $2.9 million in damage and $4.2 million in lost revenue.45
Adapting the industry will require opening up areas in Quebec North of the current regions of production. 17% of Quebec’s commercial forest is sugar maple, and only a small portion of that is used for sugaring. However such a move will not help small farmers facing declining production in the South, and access to Quebec’s remote regions will hinder expansion. Given the long lead time in establishing managed sugar bush regions, the industry should proceed quickly to develop climate mitigation strategies.
2. Alberta Beef and Climate AdaptationThe beef industry of Alberta provides an excellent study of the role of advertising in the creation of culturally important
foods; through a strong lobby group and proactive marketing, Alberta beef producers have positioned their product as an important part of Canadian food identity. However, the Alberta beef industry is both threatened by climate change and a major contributor to climate change. The national taste for Alberta beef will likely have to be adjusted to accept forage-fed beef as the predicted scarcity of grain limits feed choices, and the industry will have to adapt to changing water conditions in Alberta. The effects of climate change on the Alberta beef industry can be mitigated by decreasing the density of cattle, adopting small-scale farming techniques, and getting away from the large industrial feedlots that currently produce the majority of beef cattle in the country.
The first cattle were introduced to Alberta from the United States in 1876. The cattle ranches that were quickly established became economically successful, as they provided meat to European settlers at the same time the bison that had formed such an important part of the First Nations diet disappeared due to over-hunting. From its very inception, ranching in Alberta was a commercial enterprise. Large ranching establishments existed in both southwestern and southeastern Alberta, and by the mid-1880s dominated the Alberta ranching industry, by 1905 small to medium-sized ranches became the most common units of livestock production as frontier settlers established owner-occupied ranches throughout the province.46 The early beef industry in Alberta was entrepreneurially-motivated and market-oriented, and soon grew large enough not only to provide meat for domestic consumption but also for export, primarily to Great Britain. The rising population of that country, and the long hours of physical labour that characterized life during the Victorian era, led to an increased demand for meat protein. The British demand for meat was greater than what national producers could supply, and by 1914 approximately half of all meat consumed domestically was imported. By the late 19th century, live cattle had become an important Canadian export.47
management of non-timber forest products (162-171). London, UK: Earthscan Publications.43 Mason (1990).44 Hinrichs (1998).45 Kindon, J, Fox, G, McKenney, D, & Rollins, K. (2001) Economic impact of the 1998 ice storm on the Eastern Ontario maple syrup industry. The Forestry
Chronicle, 77(4).46 Klassen, H. (1999). A Business History of Alberta. Calgary, AB: University of Calgary Press.47 Evans, S.M. (1979). Canadian beef for Victorian England.Agricultural History, 53(4), 748-762.
15
ACT ( A DA P TAT ION TO CL IM AT E CH A NGE T E A M)
As of July 1, 2010, Alberta has an estimated 5.5 million head of cattle. Over half of Alberta’s farms raise cattle, and approximately 31% of all Alberta farmland is natural land for pasture.48 The development of the Alberta beef industry has been fairly steady from its inception, and has benefitted from a strong lobbying presence and targeted marketing campaigns. In 1969 a lobby organization, the Alberta Beef Producers, was established to advance the interests of cattle producers in the region. The following year the Alberta Beef Producers began collecting fees from cattle sales in Alberta to help fund its lobbying activities at the federal level. In the 1980s this organization began its first major marketing initiative, aimed at branding Alberta beef. This marketing campaign was noteworthy, as it represented both the first and the most sustained efforts by any Canadian beef producers to brand their product.49 The campaign successfully positioned Alberta beef as an important cultural food in Canada. A study conducted in Québec by Unterschultz et al.50 found that although Alberta beef producers are geographically more distant from Québec than suppliers in Ontario and the United States, restaurateurs, wholesalers, and retailers in that province prefer Alberta beef. Their study showed that Alberta beef had a strong image among Québécois consumers, and that marketing around beef has not only promoted the product to consumers, but also the importance of beef origins. While the first marketing campaigns of the Alberta Beef Producers had the goal of creating an image for beef, a campaign that ran from 2002 to 2007 was a direct reaction to the bovine spongiform encephalopathy (BSE) scare in the United Kingdom and North America. Earlier campaigns had positioned Alberta beef as a desirable Canadian food, this one managed to make the consumption of Alberta beef into a patriotic act. The campaign was a success; beef consumption in Canada actually increased after domestic cases of BSE were discovered.51
Water shortages are the largest challenge posed by climate change to the beef industry. Cattle require very high levels of clean water; a study by Willems et al.52 found that cattle avoid drinking contaminated water, and that clean water is a prerequisite for weight gain. Ingesting contaminated water from wells, ponds, or troughs leads cattle to avoid either grazing or eating large amounts of provided food. Cattle must have high weights at time of slaughter in order for their meat to achieve a desirable grade,53 and in order to be economically valuable to producers. Thus, clean water is essential to the Alberta beef industry. Fresh water is currently at risk from climate change, although ground water systems tend to respond more slowly to climate variability than surface water systems, both are at risk in the long term.54 Ground water is the more viable source of fresh water for most Alberta ranches and feedlots, and need to be protected in order to ensure that Alberta beef producers continue to have an adequate supply of fresh water. As surface water becomes more endangered there will be greater competition for ground water; in fact, Loáiciga55 found that to certain aquifers, the greatest threat to ground water come from the predicted rise in ground water use, rather than directly from climate change; as rivers along the Rocky Mountains become less predictable and suffer greater seasonal flow variation stake-holders will turn to groundwater to make up the difference. Water scarcity is a threat to the Alberta beef industry, as it is to any industry that relies on fresh water, but in the short and medium term Alberta beef producers can best protect their access to water by taking steps to decrease contamination of their ground water supplies by decreasing the amount of manure produced in each feedlot.
As well as fresh water, the diet provided to cattle is currently under threat. While historically cattle were finished in small farm feedlots, common practice in Alberta today is to send cattle to large, highly specialized feedlots where they are finished on a diet that is 85%-90% grain.56 Although this type of diet is common in North America, most
48 Alberta Beef Producers. (2011). Industry. Retrieved from http://albertabeef.org/industry/49 Blue, G. (2009). Branding Beef: Marketing, Food Safety, and the Governance of Risk. Canadian Journal of Communication, 34(2), 229-244.50 Unterschultz, J., Quagrainie, K., & Vincent, M. (1998). Evaluating Québec’s preference for Alberta beef versus US beef. Agribusiness, 13(5), 457-468.51 Blue (2009).52 Willems, W., Kenzie, O., McAllister, T., Colwell, D., Veira, D., Wilmshurst, J., Entz, T., & Olson, M. (2002). Effects of water quality on cattle per-
formance. Journal of Range Management, 55, 452-46053 Alberta Beef Producers (2011).54 Alley, W. M. (2001). Ground water and climate. Ground Water, 39(2), 161.55 Loáiciga, H. A. (2003). Climate Change and Ground Water. Annals of the Association of American Geographers, 93(1), 30-41.56 Alberta Beef Producers (2011).
CLIMATE CHANGE ADAPTATION AND CANADA’S CROPS AND FOOD SUPPLY BACKGROUND REPORT
16
beef produced globally is fed on forage in pastures or rangeland. Alberta has much land suitable to providing forage for cattle, but retailers and consumers are found to object to the yellow fat produced by cattle finished entirely on grasses. Beef from cattle finished almost exclusively on grain diets attains a much higher grade, and has less variability in flavour than grass-fattened beef.57 However, grain diets are less environmentally sustainable as they impact food security among humans, and require that land available for food crops be instead used for feed crops.58 Further, they are becoming less economically viable as the cost of grains increases. Meanwhile forage-fed beef is reported to have significant health benefits in comparison to grain-fed beef, and Martin and Rogers59 note that there is an increasing market for forage-fed beef among both environmentally aware and health-conscious consumers. As human food security becomes an increasingly important issue in Canada, Alberta beef producers will likely have to decrease the amount of grains fed to cattle and increase the percentage of forage in their diets. Increasing temperatures and decreasing levels of precipitation resulting from climate change are expected to increase the quantity of forage available, but to decrease its quality.60
The beef industry in Canada is a major contributor to climate change, and many of the specific practices used in Alberta are environmentally unsustainable. Greenhouse gas emissions are inherent to ranching; agriculture is responsible for one-fifth of anthropogenic greenhouse gas emissions, and approximately one-half of all anthropogenic methane emissions. Methane from agriculture arises primarily from enteric fermentation of ruminants, especially cattle.61 The beef industry is responsible for approximately 68% of the methane from agriculture, and in Canada beef cattle were the source of 76% of total agricultural methane emissions;62 however, while methane emissions are an unavoidable part of cattle ranching, many of the other practices of the Alberta beef industry can be changed to become more environmentally sustainable.
One of the major problems facing Alberta beef producers is the disposal of manure. Traditionally manure produced on ranches and feedlots is viewed as valuable soil amendment, useful as a nutrient source.63 As livestock production in Alberta has changed dramatically in recent decades, and feedlots of 10,000 heads of cattle and more are now common, the amount of manure produced by feedlots each year has intensified.64 Due to the high water content of raw manure it is uneconomical to haul it more than 15-20 km, and most manure is thus applied to land close to the source at increasingly high application rates.65 This is leading to a degradation of the soil, as high manure application rates are unsustainable and in the long term make land unsuitable for agriculture.66 As much of the agricultural land in Alberta that is not dedicated to ranching is used to grow grain for cattle feedlots, degradation of the soil caused by over-use of manure poses a significant threat to the long-term health of the Alberta beef industry. Hao & al.67 find that “Proper utilization of manure is crucial to the long-term sustainability of feedlot operations.” Composting of manure has been suggested as an alternative to direct-land application of manure, and as a method to decrease the volume and mass of manure so as to be able to transport it further distances,68 but research by Larney and Hao69 and Hao et al.70 indicate that composting of the manure can further increase the greenhouse gas emissions of the Alberta beef industry.57 Martin, J. M., & Rogers, R. W. (2004). Forage-Produced Beef: Challenges and Potential. The Professional Animal Scientist, 20, 205-210.58 Stehfest, E., Bouwman, L., van Vuuren, D., den Elzen, M., Eickhout, B., &Kabat, P. (2009). Climate benefits of changing diet. Climatic Change 95,
83-102.59 (2004).60 Craine, J. M., Elmore, A. J., Olson, K. C., &Tolleson, D. (2010). Climate change and cattle nutritional stress. Global Change Biology 16, 2901-2911.61 Ellis, J. L., Kebreab, E., Odongo, N. E., McBride, B. W., Okine, E. K., & France, J. (2007). Prediction of Methane Production from Dairy and Beef
Cattle. .Journal of Dairy Science 90(7), 3456-3466.62 Vergé, X. C., Dyer, J. A., Desjardins, R. L., & Worth, D. (2008). Greenhouse gas emissions from the Canadian beef industry. Agricultural Systems
98(2), 126-134.63 Larney, F. J., & Hao, X. (2007). A review of composting as a management alternative for beef cattle feedlot manure in southern Alberta, Canada.
Bioresource Technology, 98(17), 3221-3227.64 Hao, X., Chang, C., Larney, F.J., & Travis, G. R. (2001). Greenhouse gas emissions during cattle feedlot manure composting. Journal of Environmental
Quality, 30, 376-386.65 Larney & Hao (2007).66 Hao, X. & Chang, C. (2003). Does long-term heavy cattle manure application increase salinity of a clay loam soil in semi-arid southern Alberta?
Agriculture, Ecosystems, & Environment, 94, 89-103.67 (2001).68 Peigné, J., & Girardin, P. (2004). Environmental impacts of farm-scale composting practices. Water, Air and Soil Pollution, 153(1-4), 45-68.69 (2007).70 (2001).
17
ACT ( A DA P TAT ION TO CL IM AT E CH A NGE T E A M)
Excess manure from ranches and feedlots contaminates not only soil, but also water and air.71 The composting of manure can also severely contaminate water supplies and pollute air, although Peigné & Girardin72 suggest methods that can help control pollution.
Though temperature changes are likely in the Alberta region, particularly in the winter months, there is no evidence of yet that temperature change will significantly change cattle disease vectors in the province, or overly change the nature of heat and cold stresses to cattle.
The Alberta beef producers have been effective in positioning their product as a culturally important food by means of careful advertising campaigns; their famous tagline states that: “If it ain’t Alberta, it ain’t beef.” They use imagery of traditional ranchers raising cattle on small farms, promoting the idea of beef production in Alberta being small-scale and historic, embedded in local communities.73 However, production no longer looks anything like this. Some feedlots have as many as 40,000 cattle at any given time,74 and Alberta has some of the most densely-populated cattle regions in North America.75 In order to adapt to the effects of climate change on beef production in Alberta, though, and to maintain the viability of this culturally important food, beef producers may in fact have to go back to the kinds of small-scale farms that they use to promote their product. The predicted scarcity of both the fresh water and nutritionally dense foods required to finish cattle can be in part mitigated by decreasing the number of cattle raised in Alberta, and decreasing the density of cattle in any given region. When the density of cattle is not too great manure is considered a valuable soil amendment; only when it is produced at levels too high for local use is it viewed as a disposal problem that can pollute the air and contaminate the water. Having fewer cattle in a region reduces the risk of contaminating the fresh water necessary to cattle weight gain and health, and concomitant economic viability.
Reducing the density of cattle can also help to mitigate the effects of decreased forage quality. As climate change is expected to necessitate a shift away from high grain diets and toward the increased use of forage, ranchers must either supplement forage with higher-protein foods, including grain or soybeans, or decrease the density of the cattle population. Cattle naturally graze on the highest-quality forage available first, and suffer low levels of nutritional stress until higher-quality forage is used up.76 This will necessitate a decrease in the amount of beef produced in Alberta, and consequently a reduction in beef consumption, however it will increase the value of cattle. As cattle prices are declining, and grain prices rising, the profit margin for finished cattle is decreasing.77 Forage is far less expensive than grain, so the inputs required by beef production would drop in cost if the diets fed to cattle were to include a higher level of forage. Further, a decreased beef supply is not likely to correlate with a decrease in demand, so ranchers would still realise a profit if small-scale, traditional farms were once again to become the norm.
If the Alberta beef industry is to adapt to climate change, Canadians are going to have to adapt to eating grass-fed cattle, and ultimately, less beef. The predicted scarcity of fresh water, and the importance of fresh water to cattle weight gain, requires that beef producers take precautions not to contaminate their water supplies through the over-production of manure. The diet fed to cattle will likely have to shift, as the high grain diet that cattle commonly eat in North America negatively impacts human food security. The shift to forage will be made easier if cattle are kept less densely in Alberta. The negative effects on the predicted decrease in forage quality could also be mitigated by supplementation, but as protection of ground water resources requires decreasing the density of cattle supplementation can likely be avoided as individual cattle will have larger areas to graze and can choose the highest-quality forage available to them. An additional benefit of decreasing the density of cattle in Alberta will be to reduce greenhouse gas emissions, and thus
71 Larney & Hao (2007).72 (2004).73 Blue (2009).74 Alberta Beef Producers (2011).75 Larney & Hao (2007).76 Craine et al. (2010).77 Martin & Rogers (2004).
CLIMATE CHANGE ADAPTATION AND CANADA’S CROPS AND FOOD SUPPLY BACKGROUND REPORT
18
the effect of the Alberta beef industry on climate change. A reduction in the number of cattle will decrease the amount of methane produced by enteric fermentation, as well as that which can arise from the composting of excess manure.
3. Climate Adaptation and the Canadian Icewine IndustryThe creation of icewine requires very specific weather and temperature conditions, leaving this product vulnerable
to climate change. Icewine is a sweet dessert wine made from grapes harvested when frozen on the vine. Most of the world’s icewine comes from Germany, Canada, and Austria, although icewine is also produced in countries such as France, Italy, Hungary, Slovenia, and Switzerland.78 Icewine is an expensive and valuable wine that is often paired with desserts, rich cheeses, or foiegras.79 It has come to be known as Canada’s specialty wine, and is strongly associated with Canadian terroir in the world wine community. As with other cold-reliant crops, climate change poses a threat to Canadian icewine production. Only very small areas of Canada have a climate suited to the growing and harvesting of grapes for icewine, and temperature or weather pattern changes within these areas has the potential to affect the quality, flavour, and yield of frozen wine grapes.
The lore of icewine suggests that the product was the result of an accidental freezing in Germany in 1794.80 Individual small vintners in Germany continued to produce the sweet drink through the 19th century when grapes froze on the vine, more often as a result of freak weather conditions and than a decision to grow grapes specifically for icewine, but by the mid 20th century icewine became a popular and valued commodity in Europe. In the 1970s, German immigrants introduced icewine production to Canada, and a successful icewine industry was developed in the early 1980s.81 Canada has become the world’s largest producer of icewine,82 a status it has achieved as a result of the inherent climatic conditions necessary for icewine production: Germany, formerly the world’s leading icewine producer, cannot guarantee a crop every year. Because of inconsistent weather and the very specific temperatures necessary for the harvesting of grapes to make icewine, Germany’s crop is small or nonexistent some years. Canada is the only major icewine producing country that can guarantee an annual crop of frozen grapes.83
Because of the demand for and high price point of icewine, American vintners have started creating their own version of the beverage. In the United States wine can be sold as icewine if the grapes have been artificially frozen after harvest, leading countries that are known for high quality icewine to set strict labeling standards in order to protect their domestic reputation and the icewine label. In Canada, the VQA requires that grapes be naturally frozen on the vine at -8°C or colder and that this temperature be maintained throughout the pressing process without artificial refrigeration.84 Further, the sugar content must meet a certain standard, requiring exacting weather conditions.85 The standards for icewine in Canada are significantly higher than the standards in either Germany or Austria, leading Canadian icewines to be considered among the best in the world. Although Canadian table wines do not have a strong international reputation, and Canada remains a small producer of table wines both in terms of total production and retail value, the value of
78 Rolle, L., Torchio, F., Cagnasso, E., & Gerbi, V. (2010). Evolution of mechanical variables of winegrapes for icewine production during on-vine drying. Italian Journal of Food Science 22(2): 143-149.
79 Lawlor, J. (2010, February 26). Frozen Vines (and Fingers) Yield a Sweet Reward. New York Times, p. 32.80 Lawlor, (2010).81 Subden, R. E., Husnik, J. I., van Twest, R., van der Merwe, G., & van Vuuren, H. J. J. (2003). Autochthonous microbial population in a Niagara
Peninsula icewine must. Food Research International 36(7): 747.82 Cyr, D. & Kusy, M. (2007). Canadian ice wine production: A case of the use of weather derivatives. Journal of Wine Economics 2(2), 145.83 Lawlor, (2010).84 Rolle et al. (2010).85 Subden et al. (2003).
19
Canadian icewines is increasing substantially as global demand for Canadian icewine increases. A 750 ml bottle of award winning Niagara region icewine recently sold for $30,000 CAD, making it the most expensive icewine in the world.86
Thus far, only wines from British Columbia and Ontario have managed to meet the standards required for VQA labeling. The main wine grape growing regions in Canada comprise the Niagara Peninsula and the adjacent areas of Pelee Island and Lake Erie North Shore in southern Ontario, along with the Okanagan and Similkameen Valleys in British Columbia.87 The majority of icewine is produced from grapes grown in the Niagara Peninsula region.88 Although wine grape cultivation has begun to expand to the emerging cool climate wine regions of Eastern Canada, found in Quebec and Nova Scotia,89 these areas are unsuited to the specific requirements of icewine production. The position of the Niagara Peninsula between the cooler waters of Lake Ontario to the north and the eastern end of Lake Erie to the south exposes the region to strong lake breezes that help to cool the summer temperatures, while the lakes act as heat sinks that warm the air in the winter.90 The Niagara Peninsula, like the Okanagan and Similkameen Valleys of British Columbia, do not experience the same kind of extreme temperatures of emerging regions, making them uniquely suited to icewine production. According to Cyr and Kusy, “It is generally recognized in the industry that the optimal temperature for harvesting grapes destined for icewine is between -8 and -12°C.” 91 However, many producers leave their grapes intact through several occurrences of temperatures within these ranges, as a preference exists in the industry toward an accumulation of at least 70 hours which the temperature is in the range of -8° to -12°C, from the beginning of November until the grapes are harvested.92 This results in a higher quality product with greater depth of flavour.
The regions of Canada that produce icewine each have their own unique terroir. The notion of terroir looks at all the natural conditions which influence the biology of the vinestock and thus the composition of the grape itself, including soil composition, climatic factors such as temperature, rainfall, and sunshine, and topography. The actual value of terroir as a concept is under debate by academics and scientists, the most critical of whom claim that it is nothing more than a concept advanced due to commercial interests, and is used as “a device to advance and perpetuate the reputation of European classics.”93 However, scientists agree that soil composition is important to the flavor of grapes: soil quality affects water retention, important to the varieties of grapes that can be grown and the quality of the harvest,94 and soil elements like nitrogen playing a role in the acidity of the wines produced.95 Climate and temperature are generally considered to play the most significant role in the quality of wine vintages.96 The cycles of freezing and thawing that Canadian icewine producers deem so valuable to the quality of their product is a good example of the role of terroir in wine. Further, in the Niagara Peninsula region, the wild yeasts and other indigenous micro flora are significant as they affect the flavour of the wine.97 Although the types of grapes that can be grown and overall wine style that a region produces are a result of the baseline climate, and climate variability determines the differences in quality between vin-tages,98 it is important to note that the specific icewines that are so valuable on the global market cannot be produced elsewhere, as the specific terroir of the vineyards cannot be reproduced.
86 Cyr & Kusy (2007).87 Shaw, A. B. (1999). The emerging cool climate wine regions of Eastern Canada. Journal of Wine Research, 10(2), 79.88 Cyr & Kusy (2007).89 Shaw (1999).90 Shaw, A. B. (2005). The Niagara Peninsula viticultural area: A climatic analysis of Canada’s largest wine region. Journal of Wine Research, 16(2),
85-103. 91 (2007).92 Cyr & Kusy (2007).93 Bohmrich, R. (1996). Terroir: Competing perspectives on the roles of soil, climate and people. Journal of Wine Research, 7(1), 33.94 Schultz, H. R. & Stoll, M. (2010). Some critical issues in environmental physiology of grapevines: future challenges and current limitations. Australian
Journal of Grape and Wine Research, 16, 4-24. 95 Bohmrich (1996).96 Bohmrich (1996); Jones, G., White, M., Cooper, O., & Storchmann, K. (2005). Climate Change and Global Wine Quality. Climatic Change, 73(3),
319-343.97 Subden et al. (2003).98 Jones et al. (2005).
CLIMATE CHANGE ADAPTATION AND CANADA’S CROPS AND FOOD SUPPLY BACKGROUND REPORT
20
The successful cultivation of wine grapes requires adequate heat accumulation, low risk of severe frost damage, and the absence of extreme heat.99 Although many individual climate factors, including solar radiation, wind, and humidity, play a role in yield formation, grape development and grape composition, Schultz and Jones100 found that temperature and water supply are among the most important. Changes in climatic conditions that jeopardize any of these climatic factors, particularly temperature and temperature extremes, pose high risk for icewine producers.101 Currently, many wine producing regions are under threat from climate change; a study by White et al.102 found that the area available for production of premium wine grapes in the United States will both contract and shift over the next century. When the authors studied the effects of extreme temperatures, principally extreme heat in the growing season, they found that areas marginally suitable for wine grape production in the current climate were nearly eliminated and that the area capable of consistently producing grapes required for the highest-quality and highest-priced wines declined by more than 50%. Climate change is manifesting in increasing mean temperatures, altered precipitation patterns, greater frequency of temperature extremes, and increased climatic variability.103 Increasing mean temperatures are opening up new areas to viticulture, hence the emerging wine regions in Quebec and Nova Scotia. Although these provinces are known for short, cool summers and cold winters, the effects of climate change are rendering areas within the provinces more conducive to wine grapes.104 In cool climate regions, warmer mean temperatures associated with climate change can lead to more consistent vintage quality.105 However, none of the potential or emerging wine regions in Canada will likely be able to support extensive icewine production, as the winters will continue to be too harsh to sustain such high-risk agriculture, icewine grapes require a very specific temperature range, and the industry has a preference for multiple cycles of freezing and thawing.
Icewine production is already inherently more difficult than the production of other wines: because grapes must be pressed while frozen; the juice yield from icewine grape pressing is only 15% to 20% by volume of what the same grapes would have produced if destined for table wine.106 The scarcity of icewine in relation to demand is part of the reason it can command such a high price in relation to table wine. Like other wine producing regions, the icewine growing regions of Ontario and British Columbia are expected to experience higher mean annual temperatures as a result of climate change. These regions are already classed as cool climate wine regions and thus can bear much more warming than warm climate wine regions,107 and because of the sheltered nature of the Niagara Peninsula cool breezes will help moderate the effects of higher summer temperatures. At present time, unusually cold winters pose a greater risk to grape cultivation in the Niagara Peninsula than do unusually hot summers.108 In the short term, warmer temperatures have the potential to increase grape yields in icewine producing regions,109 and to result in a sweeter juice from the grapes.110 As the growth in demand for icewine is outstripping the growth in icewine production, warmer average mean temperatures in Ontario and British Columbia wine regions may increase the return for icewine producers. However, while Canada currently benefits from being the only icewine producing country that can guarantee annual temperatures low enough to produce an adequate supply of frozen grapes, if mean temperatures increase to the point where winter temperature conditions are not optimal for icewine production Canadian producers will experience significant value loss. The major
99 White, M. A., Diffenbaugh, N. S., Jones, G. V., Pal, J. S., & Giorgi, F. (2006). Extreme heat reduces and shifts United States premium wine production in the 21st century. Proceedings of the National Academy of Sciences of the United States of America, 103(30), 11217-11222.
100 Schultz, H. R., & Jones, G. V. (2010). Climate Induced Historic and Future Changes in Viticulture. Journal of Wine Research, 21(2/3), 137-145.101 Cyr & Kusy (2007).102 (2006).103 Holland, T., & Smit, B. (2010). Climate Change and the Wine Industry: Current Research Themes and New Directions. Journal of Wine Research,
21(2/3), 125-136.104 Shaw (1999).105 Holland & Smit (2010).106 Cyr & Kusy (2007).107 Holland & Smit (2010).108 Shaw (2005).109 Holland & Smit (2010).110 White et al. (2006).
21
ACT ( A DA P TAT ION TO CL IM AT E CH A NGE T E A M)
risk faced by producers is that a mild winter with relatively high daily temperatures can result in grapes being harvested later in the winter months which puts them at much greater risk of deterioration from wind, rot, and other factors.111
At present, the risk of increasing mean temperatures is not as great to icewine producers as is that of climate variability. Other factors, such as decreased water supply, will pose risks to grape yields, but Holland and Smit112 demonstrate that the ‘human factor’ in wine production can mitigate these pressures through climate adaptation. Different strategies exist to adapt to changing rainfall patterns, but climate extremes expose an area of particular vulnerability for producers. Shaw113 claims that climate variability in the Niagara Peninsula poses the greatest degree of risk to viticulture in the area, while Cyr and Kusy114 note that, despite increasing mean average temperatures, temperature outliers were due to seasons of extreme cold as opposed to exceptionally warm winters. While icewine grapes are put at risk if sufficient freezing does not take place until later in the winter months, exceptionally cold winter weather can pose significant risk to icewine producers who leave grapes on the vine to experience the patterns of freezing and thawing considered so important to the complexity and flavour of Canadian icewines. Climate variability is an intrinsic element of climate change, and one of the riskiest aspects for icewine producers. It is also possibly the most difficult element of climate change to which to adapt. In the long term increasing mean temperatures will pose the greatest risk to the Canadian icewine industry, but climate variability is immediately responsible for the greatest risk of value and production loss.115
Icewine is possibly the most internationally renowned variety of wine from Canada, and despite the limited annual yield is an economically important and culturally valuable product. Because of the inherently regional nature and specific climatic requirements of production, it does not lend itself to a shift in cultivation location. While climate change has the potential to increase yields and quality of icewine grapes, and thus the value of icewine to producers, both temperature extremes due to climate variability and significant increases in mean winter temperatures have the potential to cause significant losses in value and yields.
4. Prairie Grains and Climate AdaptationWeather and climate conditions have long been recognized as key determinants to the success of agricultural ven-
tures, yet the effects of variations on crop productions are often underrated;116 however, as the effects of climate change become more noticeable, adaptation to climate change and its impacts is receiving increasing attention. In areas where economic health is largely dependent on high yields of agricultural crops, policy debates on climate change are looking not only at mitigating the effects of climate change through reductions of greenhouse gas emissions, but also at adapting agricultural production in light of climate change.117 Much of the economy of the Canadian Prairie Provinces is based upon wheat and other grains, thus it is important to understand the impacts of climate change on these crops, and the possible strategies for adapting production to climate change.
The settlement and development of the Canadian Prairie Provinces is largely a story of wheat and other grains. The prairies remained almost completely unsettled by colonial immigrants before 1872, the year that the Canadian Government passed the Dominion Lands Act. This Act attempted to direct European immigrants to the prairies and to protect the land from speculation by giving 160 acres of prairie land free to any male over the age of 21 who agreed
111 Cyr & Kusy (2007).112 (2010).113 (2005).114 (2007).115 Cyr & Kusy (2007).116 Wall & Smit (2005). 117 Smit, B., Burton, I., Klein, R., & Wandel, J. (2000). An anatomy of adaptation to climate change and variability. Climatic Change, 45(1), 223.
CLIMATE CHANGE ADAPTATION AND CANADA’S CROPS AND FOOD SUPPLY BACKGROUND REPORT
22
to cultivate at least 40 acres and to build a permanent dwelling within three years, and who paid a $10 registration fee. However, the rate of settlement between 1872 and 1896 remained well below expectations and in many years as many people left their homesteads as registered under the Act.118 The soil was poor, farming was difficult, and the land offered by the United States Government was far more appealing to potential settlers. The Canadian Prairie Provinces were largely unsuited to the growth of any crops that required warmer temperatures, such as corn, soybean, or sweet potato, but had the potential to support cool season crops such as spring wheat, barley, canola, oat, and rye.119 This potential was not realized until 1896, though, when Canada rapidly became one of the world’s leading wheat producers.120 Only then did the Prairie Provinces benefit from large-scale migration as the trend of Canadian farmers emigrating to the United States was reversed and an influx of American farmers migrated to the Prairie Provinces.
Norrie121 credits the introduction of dry farming to Canada for this shift, as the agricultural techniques previously used were largely an extension of traditional methods of cultivation not suited to the semi-arid climate of the Canadian Prairies. Dry farming is generally defined as “agriculture without irrigation in semi-arid regions.”122 It involves a crop rotation schedule that involves devoting land to a use that requires very little moisture in alternate years, as well as the selection of plant types that require the least amount of water.123 In the Canadian prairies, dry farming manifested in a wheat-fallow rotation and saw the widespread shift toward the Red Fife cultivar of wheat, which came to dominate the market in the late 1800s.124 In 1909 Marquis wheat was introduced to farmers, a cultivar bred from Red Fife wheat to be of the same quality but earlier maturing. It entirely supplanted Red Fife wheat, but when it proved susceptible to the stem-rust epidemics of the 1930s it was largely replaced by the Thatcher cultivar. That remained the most popular cultivar until 1968 when it was overtaken by the Manitou cultivar, which was soon overtaken by the Neepawa cultivar. From 1986 to 1993 Katepwa wheat became the dominant cultivar, until it was supplanted by AC Barrie, the current dominant cultivar.125 Almost all of the other wheat cultivars currently grown in Canada have been bred from these key cultivars.126 Wheat breeding programs were essential to the economic development of the Prairie Provinces as they produced early maturing cultivars with high grain yield.127
Another objective of grain breeding was standardization; originally conceived of by the Chicago Board of Trade in the 1850s, the idea that grain should be graded to ensure uniformity of quality began to take hold in North America and Europe. Wheat grades were dependent on the suitability of crops to the baking of bread, and when the Canada Grain Act of 1912 was introduced it set out grading definitions based on these principles.128 The Board of Grain Commissioners, which had been established to carry out the Act, was dissolved in 1920; however, the national grading system was re-vived in 1935 with the creation of a new Canadian Wheat Board charged with controlling grain prices in the aftermath of the Great Depression. It became the only buyer of wheat and barley in Canada, and bore sole responsibility for the grading and marketing of these grains. In 1910 wheat was responsible for 60.5% of all seeded land in the Prairie Province, totaling 7,867,400 acres; by 1940 wheat farming totaled 27,750,000 acres, or 68.4% of the seeded land.129 Other grains
118 Norrie, K. H. (1975). The rate of settlement of the Canadian prairies, 1870-1911.The Journal of Economic History, 35(2): 410.119 Qian, B., Zhang, X., Chen, K. Feng, Y., & O’Brien, T. (2010). Observed long-term trends for agroclimatic conditions in Canada. Journal of Applied
Meteorology and Climatology 49: 604-618.120 Norrie (1975).121 (1975).122 Hargreaves, M. (1977). The dry-farming movement in retrospect. Agricultural History, 51(1): 149.123 Norrie (1975; Hargreaves (1977).124 Lamari, L., McCallum, B., & dePauw, R. (2005). Forensic pathology of Canadian bread wheat: The case of tan spot. Phytopathology, 95(2); Norrie
(1975).125 Lamari, L. et al. (2005).126 Lamari, L. et al. (2005); Fu, Y-B., Peterson, G., Yu, J-K., Gao, L., Jia, J., & Richards, K. (2006). Impact of plant breeding on genetic diversity of the
Canadian hard red spring wheat germplasm as revealed by EST-derived SSR markers. Theoretical & Applied Genetics, 112(7).127 Duguid, S., & Brule-Babel, A. (1994). Rate and duration of grain filling in five spring wheat (Triticumaestivum L.) genotypes. Canadian Journal of Plant
Science (74).; Iqbal et al. (2007).128 Varty, J. (2004). On protein, Prairie wheat, and good bread: Rationalizing technologies and the Canadian state, 1912-1935. Canadian Historical Review,
85(4).129 Eaton, E. (2009). Getting behind the grain: The politics of genetic modification on the Canadian prairies. Antipode, 41(2).
23
grown in the Canadian prairies during this period included oats, barley, flax, and corn. As Canada became known for its high-quality grain exports, producing grain crops with high standardization and uniformity became essential to farmers.130 By 2007 the land share of wheat had decreased to 37.2% of seeded areas, at 20,820,000 acres, but even as other crops like canola, soybeans, lentils, mustard seeds, and dried peas were planted, diversity in wheat crops became increasingly rare.131 Modern wheat is genetically very dissimilar to older varieties such as Red Fife,132 and makes a very different quality of bread.133
Wheat continues to be Canada’s largest agricultural crop,134 and is grown almost exclusively in the Prairie Provinces. Producers in this area are concerned about the effects of climate change on their crops; they cite the projected changes in climate and weather conditions as presenting the greatest risks to their livelihoods. In particular, changes in the frequency, severity, and extent of extreme events like extended droughts and heavy rain are perceived as threats.135 Fears regarding variability in climate condition are clearly justified by the 2001-2002 drought on the Canadian prairies, which resulted in a 30% reduction of spring wheat yield relative to the 1976-2005 30-year mean.136 Climate variability, including extremes, provides some of the greatest challenges for climate adaptation.137
Breeding programmes for wheat have developed cultivars that produce higher yields, mature earlier in the season, have increased levels of protein, and are resistant to multiple diseases.138 At the same time, wheat breeding has significantly decreased genetic diversity. This decrease in genetic diversity makes crops more susceptible to climate variability and to new diseases.139 Although wheat is the Canadian prairie crop that has seen the greatest loss of genetic diversity, Fu et al.140 also found losses in genetic diversity in their study of Canadian oats. The breeding methods applied to Canadian wheat and Canadian oats have largely been the same.141 One of the challenges that breeders have faced has been increasing yields and decreasing time to maturity while simultaneously maintaining or increasing the protein content in grains; high protein content is important to achieving a high rank under the grading system set out by the Canada Wheat Board, but there is a clear negative association between grain yield and grain protein content. The maintenance of high protein content while increasing grain yield has been responsible for much loss in genetic diversity, as it decreases the number of cultivars used in breeding programmes.142 Reif et al.143 point out that the loss of genetic diversity that occurs in eliminating undesirable or even deleterious alleles may also reflect an erosion of alleles valuable for future adaptation to climate variability. In order to ensure that breeding programmes continue to be sustainable for the future and can serve future climate-related adaptation needs, there is a need to diversify wheat breeding materials.144
130 Varty (2004).131 Fu et al. (2006); Reif, J., Zhang, P., Dreisigacker, S., Warburton, M., van Ginkel, M., Hoisington, D., Bohn, M. &Melchinger, A. (2005). Wheat genetic di-
versity trends during domestication and breeding. Theoretical & Applied Genetics, 110(5).132 Fu et al. (2006).133 Hucl, P., and Baker, R. J. (1987). A study of ancestral and modern Canadian spring wheats. Canadian Journal of Plant Science, (67).134 Statistics Canada (2011).135 Wall, E. & Smit, B. (2005). Climate change in light of sustainable agriculture. Journal of Sustainable Agriculture, 27(1).136 Qian, B., De Jong, R., Warren, R., Chipanshi, A., & Hill, H. (2009). Statistical spring wheat yield forecasting for the Canadian Prairie Provinces.
Agricultural and Forest Meteorology, 149(6/7).137 Smit et al. (2000); Wall & Smit (2005).138 Duguid & Brule-Babel, (1994); Iqbal, M., Navabi, D., Salmon, D., Yang, R-C., and Spaner, D. (2007). Simultaneous selection for early maturity, increased
grain yield and elevated grain protein content in spring wheat. Plant Breeding, 126(3); Fu et al. (2006); Lamari et al. (2005); Reif et al. (2005); Hucl & Baker (1987).
139 Fu et al. (2006); Reif et al. (2005); Lamari et al. (2005).140 Fu, Y-B., Peterson, G., Scoles, G., Rossnagel, B., Schoen, D., & Richards, K. (2003). Allelic Diversity Changes in 96 Canadian Oat Cultivars Released
from 1886 to 2001. Crop Science 43(6).141 Fu, Y-B., Peterson, G., Richards, K., Somers, D., DePauw, R., & Clarke, J. (2005). Allelic reduction and genetic shift in the Canadian hard red spring
wheat germplasm released from 1845 to 2004. Theoretical & Applied Genetics 110(8). 142 Iqbal et al. (2007).143 (2005).144 Fu et al. (2006); Reif et al. (2005).
CLIMATE CHANGE ADAPTATION AND CANADA’S CROPS AND FOOD SUPPLY BACKGROUND REPORT
2 4
In addition to increased climate variability, climate change is seeing both increased average temperatures in the Canadian prairies,145 and increase average precipitation.146 There has been a significant increase in the number of precipitation events on the Canadian prairies, which, according to Akinremi et al.,147 is mainly due to an increase in the number of low-intensity events. There has been an increase in rainfall, coupled with a decrease in snowfall and frost. The benefits of increased precipitation are partially offset, however, by the increasing levels of water evaporation resulting from increased temperatures.148 Rising temperatures will lengthen the growing season of wheat and other grains and likely contribute to an increase in yields, although Qian et al.149 note that moisture is still the major yield-limiting factor for field crop production in the Prairie Provinces. Mendelsohn and Reinsborough find that “warmer temperatures will have ambiguous effects in Canadian farms but increased (decreased) precipitation will clearly increase (decrease) farm values.”150 Further, soil degradation caused by frequent summer fallowing and mechanical tillage is decreasing the ability of soil to retain moisture, and putting prairie farms at even greater risk from droughts.151 Qian et al. conclude that the challenge in adapting to climate change is in “taking advantage of the increases in growing season length and heat accumulations and managing the risks associated with seasonal water deficits.”152 There is definitely potential for a northern expansion of agriculture as a result of changes in heat and moisture in the region, although most of these lands will remain only marginally suitable for farming because of poor soil conditions.153
The changes in heat patterns in the Prairie Provinces that are opening northern regions up to grain farming are also increasing the potential for high yields of agricultural oil crops, most notably canola, in the southern regions. McGinn et al.154 suggest that along with wheat, yields of canola and corn are likely to significantly increase in Alberta, while Cutforth et al.155 suggest that warmer temperatures and earlier springs in Saskatchewan allow for earlier seeding and thus higher yields of crops such as field pea and canola. In the last five years, the amount of land seeded with canola crops has increased by over 22%.156 The positive rainfall trends on the Canadian prairies157 will benefit canola yields, as greater-than-average precipitation is correlated with higher yields; however, higher-than average summer temperatures in the Prairie Provinces cause heat stress for canola, and are correlated with reduced yields.158 The potential for increasing yields of agricultural oil crops in areas once considered suitable only to grain production159 points to increased capacity for crop diversity. Wall and Smit160 point out the logic in growing a diversity of crop types in different areas of farm properties: this practice spreads risk and decreases the likelihood of losing an entire year’s production since different crops vary in how they respond to climate conditions. Crop diversity is essential component of adaptation to climate change and variability.161
145 Qian et al. (2010); Wall & Smit (2005); Akinremi, O. O., McGinn, S. M., & Cutforth, H. W. (1999). Precipitation trends on the Canadian prairies. Journal of Climate, 12, 2996-3003; Mendelsohn, R., & Reinsborough, M. (2007). A Ricardian analysis of US and Canadian farmland. Climatic Change, 81(1).
146 Akinremi et al. (1999); Qian et al. (2010).147 (2009).148 Qian et al. (2010).149 (2009).150 (2007): 16.151 Zentner, R. P., Campbell, C. A., Biederbeck , V. O., Miller, P. R., Selles, F., & Fernandez, M. R. (2001). In search of a sustainable cropping system for the
semiarid Canadian prairies. Journal of Sustainable Agriculture, 18(2/3), 117-136.152 (2010): 617.153 Qian et al. (2010).154 McGinn, S. M., Toure, A., Akinremi, O. O., Major, D. J. and Barr, A. G. (1999). Agroclimate and crop response to climate change in Alberta, Canada.
Outlook on Agriculture, 28(1), 19-28. 155 (1999).156 Statistics Canada. (2011). Field and special crops (table). CANSIM (database). Last updated: April 26. http://www40.statcan.gc.ca/l01/cst01/prim11a-
eng.htm (accessed May 29, 2011).157 Akinremi, O. O., Cutforth, H. W., McConkey, B. G., Woodvine, R. J., Smith, D. G., & Jefferson, P. G. (1999). Climate change in the semiarid prairie of
southwestern Saskatchewan: Late winter-early spring. Canadian Journal of Plant Science, 79, 343-350. 158 Kutcher, H. R., Warland, J. S., & Brandt, S. A. (2010).Temperature and precipitation effects on canola yields in Saskatchewan, Canada. Agricultural &
Forest Meteorology, 150(2), 161-165.159 Norrie (1975).160 (2005).161 Wall & Smit (2005); Smit et al., (2000).
25
ACT ( A DA P TAT ION TO CL IM AT E CH A NGE T E A M)
Methods to diversify crops include crop rotation and the choosing of crops that enhance soil quality and moisture retention, thus improving drought tolerance.162 Some producers in the Prairie Provinces are experimenting with crop rotations that include lentils or other pulses along with wheat and grains, with significant success.163 The average per-centage yield increase in cereals following pulse crops compared with cereals following cereals is approximately 54%, although the yield increase is highly dependent on what variety of pulse is grown.164 More than simply contributing to crop diversity, rotations that include lentils help to conserve water in the soil; a study by Zentner et al.165 found that lentils tended to extract about 1.5 cm less water than wheat. Generally, the most critical parameter for crop growth on the semi-arid Canadian prairies is the availability of soil water.166 As well as rotating with lentil rather than wheat or fallow, using tall stubble to trap snow also enhances the availability of spring soil water.167 Adderley et al.168 also found that lentils and field peas make additional nutrients, most notably nitrogen, available for the growth of wheat crops. In areas of poor soil quality or low soil nutrients, rotating with field peas has a significantly greater effect on wheat yields and nitrogen accumulation than does rotating with lentils. The positive effects of rotating with field peas on both the yields of grain crops and the quality of soil may help producers in the Prairie Provinces to take advantage of the potential for northern expansion of agriculture; the poor soil conditions inherent to the areas that will be opened up by changes in heat and moisture patterns may be in part mitigated by rotations with field peas or other pulses beneficial to grain yields and to soil nutrient availability. Of course, the cropping systems chosen will largely be dependent on the economic return and the economic risks to producers.169 The economic viability of, and incentive for, different crop rotations depend on the prices for grains and pulses. One study170 found that although lentils have a higher cropping intensity than wheat and thus cost more to produce, a wheat-lentil crop rotation was significantly more profitable than a rotation excluding pulses in years when the market value of lentils was high. The global import value of pulses is growing; between 2006 and 2009 the total value of pulse imports grew by approximately 66%. Canadian pulse export value grew by 123%, as the volume of Canada’s pulse exports grew by 24%. Lentil exports saw the greatest increase in both volume and value, at 86% and 292% respectively.171 Current global trends in pulse imports helps to decrease the risk inherent in adding pulses to grain crop rotations, and to increase the potential economic reward to producers.
The use of pulses in rotation with grain crops in the Prairie Provinces has the potential to help mitigate the negative effects of climate change, by helping to preserve both nutrients and moisture content in the soil.172 Given the critical role of moisture to the yields of prairie crops in Canada, the adoption of wheat-pulse rotations not only contributes to crop diversity but also to managing the risks associated with seasonal water deficits and the potential for drought. Including pulses in crop rotation has been found to reduce production risk and increasing long-term sustainability.173 It may also provide an avenue to reintroduce genetic diversity to wheat breeding programmes: one of the greatest challenges in breeding wheat is the generally negative correlation between high yields and high protein content, but rotating wheat
162 Wall & Smit (2005).163 Zentner et al. (2001).164 Adderley, D., Schoenau, J., Holm, R., & Qian, P. (2006). Nutrient availability and yield of wheat following field pea and lentil
in Saskatchewan, Canada. Journal of Plant Nutrition, (29).165 (2001).166 McGinn, S. M., & Shepherd, A. (2003). Impact of climate change scenarios on the agroclimate of the Canadian prairies.Canadian Journal of Soil
Science, (83).167 Zentner et al. (2001).168 (2006).169 Zentner, R. P., Lafond, G. P., Derksen, D. A., & Campbell, C. A. (2002). Tillage method and crop diversification: effect on economic returns and risk-
iness of cropping systems in a Thin Black Chernozem of the Canadian Prairies. Soil & Tillage Research, 67(1).170 Zentner et al. (2001).171 Agriculture and Agri-Food Canada. (2009). Overview of the Canadian Pulse Industry. Last updated: June 29, 2010. Retrieved from: http://www.ats.agr.
gc.ca/can/4753-eng.htm (accessed June 5, 2011).172 Zentner et al. (2001).173 Khakbazan, M., Mohr, R. M., Derksen, D. A., Monreal, M. A., Grant, C. A., Zentner, R. P., Moulin, A. P., McLaren, D. L., Irvine, R. B., & Nagy, C. N. (2009).
Effects of alternative management practices on the economics, energy and GHG emissions of a wheat–pea cropping system in the Canadian prairies. Soil & Tillage Research, 104(1): 30-38; Zentner et al. (2002).
CLIMATE CHANGE ADAPTATION AND CANADA’S CROPS AND FOOD SUPPLY BACKGROUND REPORT
26
with lentil provides a method to increase the protein content of wheat that doesn’t involve breeding. Zentner et al.174 found that rotating wheat with lentil did not significantly affect the wheat yield, but that wheat grown after lentil had significantly higher grain protein than in 11 of 18 years. Other pulses have been found to increase grain protein while also increasing yield. Adaptation to climate change must take into consideration protein content in wheat and other grains, as climate change has been found to cause protein loss in wheat crops. Increased atmospheric carbon dioxide levels have been correlated with higher yields of wheat and other grains, but lower grain and flour protein levels.175 Because the Canadian Wheat Board pays a premium for higher protein wheat, any practice that contributes to higher grain protein at reasonable cost is desirable.176 In the past this has been achieved through careful selection and breeding of wheat cultivar;177however, alternate methods to increase wheat protein may present an avenue to reorienting Canadian prairie wheat breeding goals towards increased genetic diversity.
The genetic modification of grains provides another possible method to aid Canadian prairie farmers in adapting to climate change; however, there has been widespread opposition to genetically modified wheat from producers, con-sumers, and civil society organizations in Canada.178 Genetic modification can be used to design higher quality wheat for baking bread, by altering glutens, starches, proteins, and amino acids.179 It can also be used to design crops that are resistant to stress caused by drought or soil salinity.180 Currently, Monsanto is working on genetically engineering wheat with traits taken from corn and soy in order to improve yield, drought tolerance, and nitrogen-use efficiency.181 The use of genetically modified crops has the potential to help Canadian producers take advantage of the changes in heat and moisture accumulation that are opening up northern areas to the expansion of agriculture; like crop rotations that include field pea, genetic modification could help mitigate the impacts of poor soil quality. Further, the creation of herbicide-resistant crops makes no-till farming easier. No-till farming helps mitigate loss of soil water to evaporation, and prevents much soil erosion.182 However, designer seeds further decrease genetic diversity in crops. Safeguarding genetic diversity is essential to ensuring that wheat and grain crops can adapt to different climate change stressors that may arise in the long-term, and thus must be considered in plans for adaptation to climate change.183 The potential benefits of genetically modified crops to climate change adaptation must be weighed against the potential loss of biodiversity.
Crop yields of wheat and other grains in the Canadian prairies are largely dependent on weather and climate con-ditions, including temperature and moisture. As climate change shifts temperature and moisture patterns, methods of production must adapt. Producers face significant risks from climate change, particularly as a result of climate variability, but changes in temperature and moisture patterns may have the potential to increase crop yields and open up new land to farming. Adaptation strategies that put emphasis on crop diversity, breeding programmes that emphasize genetic diversity, the inclusion of lentils and other pulses in grain crop rotations, and the increased planting of agricultural oil products may help reduce risks to producers.
174 (2001).175 Ziska, L. H., Morris, C. F., &Goins, E. W. (2004). Quantitative and qualitative evaluation of selected wheat varieties released since 1903 to increasing
atmospheric carbon dioxide: Can yield sensitivity to carbon dioxide be a factor in wheat performance?. Global Change Biology, 10(10): 1810-1819. 176 Zentner et al. (2001).177 Iqbal et al. (2007); Fu et al. (2006); Lamari et al. (2005); Reif et al. (2005).178 Eaton (2009).179 Jones, H. D. (2005). Wheat transformation: current technology and applications to grain development and composition. Journal of Cereal Science, 41(2),
137-147.180 Wang, W., Vinocur, B., & Altman, A. (2003). Plant responses to drought, salinity and extreme temperatures: towards genetic engineering for stress tol-
erance. Planta, 218: 1-14.181 Monsanto. (2011). Monsanto Wheat Breeding. Retrieved from http://www.monsanto.com/products/Pages/wheat.aspx (accessed June 1, 2011)182 Nielsen, D., Vigil, M., & Benjamin, J. (2011). Evaluating decision rules for dryland rotation crop selection. Field Crops Research, 120(2): 254-261.183 Fu et al. (2006); Reif et al. (2005).
27
ACT ( A DA P TAT ION TO CL IM AT E CH A NGE T E A M)
5. Pacific Salmon and Climate AdaptationSalmon play an important role in both the cuisine and the culture of Canada’s West Coast. Prior to colonisation, the
First Nations in the area relied extensively on salmon for food. As well as being essential to the diet of the coastal First Nations peoples, salmon played a significant role in the organisation of communities. Settlements were established on rivers and streams where salmon could be fished heavily. Salmon were harvested in tidal or fresh water with weirs, traps, dip nets, harpoons, or spears.184 The development of advanced technologies for fishing, processing, and storing salmon led to the increasing permanence of these coastal settlements, which in turn allowed the development of sophisticated stone and plant technologies and complex social organisations.185 According to Johnsen “the importance of salmon to the native economy cannot be overstated. Most tribes’ livelihood revolved around the yearly cycle of salmon runs that began in early summer and continued late into fall.”186
Although salmon was fished primarily for food, its central position in the diet of many of the coastal First Nations saw it used for different ceremonial purposes as well. Salmon were central to the potlatch tradition at which a tribal chief would host representatives of another tribe, providing guests with “a lavish feast during which they bore witness as he asserted various privileges and justified his claims to productive resources such as fine salmon streams. At the conclusion of the ceremony, the chief distributed gifts to his guests, with the value of the gifts increasing according to the recipient’s social prestige. Having accepted these gifts without objection, guests were virtually estopped from disputing the chief ’s claims at a later time.”187 Unlike the more nomadic hunting and gathering inland First Nations, the coastal First Nations had entrenched social hierarchies, in which salmon again played a central role. Rights to fish in certain areas and quotas on fish were allocated by leaders who acted as local resource managers.188 The importance of salmon is also evidenced by some of the rituals surrounding the fisheries. The Tsimshian believed that the salmon were led upstream by their chief. The first salmon caught every year was honoured in a special ceremony, as it was believed that in performing this ceremony they were honouring the salmon chief. Only those who were ritually clean could eat the salmon at this ceremony; menstruating women, new parents, those who had had recent contact with the dead, and children who had not yet reached puberty were excluded.189 In other First Nations, the first salmon was ceremonially placed with its head facing upstream, so that the other salmon would continue and not turn back to sea.190
When colonists settled traditional First Nations territories, they also began fishing salmon. In the 1870s colonial salmon fisheries were reoriented towards export, and large industrial fishing operations were established to cater both to local and global markets.191 Traditional First Nations dishes such as smoked salmon became popular among the West Coast population, as did fusion dishes that incorporated salmon into immigrant cuisines. Salmon has been branded as a traditional Canadian food, and in turn has been used to brand British Columbia.192 Smoked salmon is sold alongside maple syrup at tourist shops, both resulting from and further increasing its reputation as a traditional Canadian food. Further, the importance of salmon as a source of protein is growing, increasing demand for the fish.193 Perhaps the best
184 Johnsen, D. B. (2006). A culturally correct proposal to privatize the British Columbian salmon fishery. In T. L. Anderson, B. L. Benson, & T. E. Flanagan (Eds.), Self-determination: The other path for Native Americans (94-133). Stanford: Stanford University Press.
185 Muckle, R. J. (2007). The First Nations of British Columbia: An anthropological survey. Vancouver: UBC Press.186 (2006): 100. 187 Johnsen, D. B. (2009). Salmon, science, and reciprocity on the Northwest Coast. Ecology and society, 14(2): 43.188 Johnsen (2006). 189 Obayashi, T. (1996). Salmon in myth and ritual in the Northern Pacific area.In J. Pentikäinen (Ed.), Shamanism and Northern ecology: 313-332. Berlin:
Mouton de Gruyter.190 Johnsen (2006).191 Schreiber, D. (2006). First Nations, consultation, and the rule of law: Salmon farming and colonialism in British Columbia. American Indian culture
and research journal, 30(4): 19-40.192 Hashimoto & Telfer (2006).193 Gerwing, K. & McDaniels, T. (2006). Listening to the salmon people: Coastal First Nations’ objectives regarding salmon aquaculture in British
Columbia. Society & natural resources 19(3).
CLIMATE CHANGE ADAPTATION AND CANADA’S CROPS AND FOOD SUPPLY BACKGROUND REPORT
28
example of the ubiquity of salmon in British Columbian food culture comes from the BC roll, a popular type of maki sushi that features barbecued or grilled salmon along with cucumber and a sweet sauce. This roll is extremely common to Japanese restaurants on Canada’s West Coast, yet rare in Japan.
There are five distinct species of Pacific salmon: chinook (Oncorhynchus tschawytscha), chum (Oncorhynchus keta), coho (Oncorhynchus kisutch), pink (Oncorhynchus gorbuscha), and sockeye (Oncorhynchus nerka). All are fished on Canada’s West Coast, although harvests have decreased significantly since the 1980s. Sockeye salmon are the most valuable species fished in Canada; in 2002 commercial fishers caught approximately 3,080,000 sockeye salmon, worth an approximate total value of $21.49 million. The total salmon catch in 2002 was worth an estimated $37.45 million. However, the value of farmed salmon far surpassed that of the catch of wild salmon.194 Most of the farmed salmon produced in Canada is Atlantic, although both the chinook and coho species of Pacific salmon are also farmed. Despite being foreign to the area, Atlantic salmon are farmed in British Columbia as well as native Pacific salmon.195
In the wild, all five of the species of Pacific salmon are born in freshwater lakes or streams, make their way out to the saltwater seas, and after anywhere between one and five years, depending on their species¾ they return to their natal stream to spawn. Pacific salmon are extremely heritable; the biological characteristics of a given salmon stock can evolve dramatically in only a few generations in response to environmental changes.196 However, despite the inherent adaptability of salmon, runs have decreased dramatically. Salmon stocks have exhibited radical fluctuations in the past; runs were large in the 1930s and early 1940s, but decreased from the late 1940s to the late 1970s.197 The early 1980s saw a resurgence of Pacific salmon, but runs thereafter decreased substantially.198 Beamish199 claims that these variations are rarely random; they are dependent on the external factors, such as fisheries, climate, and ecosystem. Even though wild salmon stocks are declining, though, there has been an increased consumer demand for salmon within Canada. In the late 1970s and early 1980s, public perception of the health benefits of salmon increased, leading to the beginning of a commercial salmon farming industry in Canada.200 Salmon farming is highly contentious; there is significant evidence of environmental harm stemming from this industry, including additional damage to wild salmon stocks. Further, many of the coastal First Nations oppose the industry, as it threatens the destruction of their traditional ways of life.201 Many First Nations people argue that rather than establishing fish farms, the focus should be on protecting the environment and caring for the ecosystem of wild Pacific salmon.202
Pacific salmon face threats from numerous sources. Temperature changes, reductions in summer flows, increased winter flooding, and increased sedimentation are all among the threats caused by climate change.203 Salmon farming operations also threaten Pacific salmon; pollution from salmon farms poses a risk to the ecosystem, and provisioning of food to cultured salmon reduces aquatic protein available to wild salmon. Further, Atlantic salmon, foreign to the local ecosystem, can escape to colonise local streams, competing with Pacific salmon for resources and infecting them with diseases or parasites.204 Sea lice pose one of the greatest threats to wild salmon stocks.205 Overfishing is another threat. Beamish206 points out that if the decline in fish stocks is the result of climate change or ecosystem degradation, then
194 BC Salmon Marketing Council. (1997). Salmon Market Database. Retrieved from: http://www.bcsalmon.ca/dbase_local/home.html195 Fisheries and Oceans Canada. (2011). Aquaculture. Retrieved from http://www.dfo-mpo.gc.ca/aquaculture/aquaculture-eng.htm196 Johnsen (2009).197 Hare, S. R. & Francis, R. C. (1995). Climate change and salmon production in the Northeast Pacific Ocean. In R. J. Beamish (Ed.) Climate change and
northern fish populations (357-372). Ottawa: National Research Council of Canada.198 BC Salmon Marketing Council.199 (1995).200 Fisheries and Oceans Canada (2011).201 Page, J. (2007). Salmon farming in First Nations’ territories: A case of environmental injustice on Canada’s West Coast. Local environments, 12(6):
613-626.202 Gerwing & McDaniels, 2006).203 Miller, K. A. (2000). Pacific salmon fisheries: Climate, information, and adaptation in a conflict-ridden context. Climatic Change, 45.204 Page, J. (2007). 205 Fisheries and Oceans Canada (2011).206 Beamish, R. J. (1995). Introduction - The need to understand the relationship between climate and the dynamics of fish populations. In R. J. Beamish
(Ed.) Climate change and northern fish populations (1-2). Ottawa: National Research Council of Canada.
29
ACT ( A DA P TAT ION TO CL IM AT E CH A NGE T E A M)
simply restricting the catch will not rebuild abundance. However, if stock depletion is the result of overfishing, then quotas can help rebuild salmon stocks. Canada faces certain dilemmas in attempting to combat overfishing, though; in addition to domestic pressure from both commercial fisheries and from First Nations groups, there is a territorial element to Pacific salmon fisheries. Salmon travel through both Canadian and American waters, and those two states have had “a long and rocky history of alternating between joint management of Pacific salmon harvests and squabbling over their share of the catch.”207
In terms of the threats posed to Pacific salmon from climate change, temperature has been identified as one of the most essential factors to survival. Temperatures that are either too high or too low are lethal, although temperature resistance is based upon adaptation. Tolerance of extremes of either high or low temperatures is based on previous temperature history.208 Temperature affects salmon differently depending on the stage they are at in their life cycle, although they are most vulnerable at the same stages when they are in freshwater.209 Many streams once inhabited by large salmon runs are now at lethal temperatures; salmon are considered extinct in 142 watershed systems throughout British Columbia where they are traditionally found.210 Further, even where salmon populations can adapt to higher temperatures, in-fection rates and virulence of fish pathogens increase and lessen the ability of a fish to withstand disease.211 Spring and coho salmon are most resistant to high temperatures, while pink and chum salmon are least resistance. Sockeye salmon are distinguishable from the other two only by greater resistance to prolonged exposure to high temperatures. None of these species can tolerate temperatures above 25.1 degrees Celsius.212
Stream and river flows have a significant impact on Pacific salmon survival. Water levels rise during cool temperature phases, and decline during warm phases. Warmer atmospheric temperatures associated with climate change are predicted to continue reducing winter snowfall, thus contributing to significant summer flow reductions in all streams and rivers that depend on melting snow. River flows are expected to increase in the winter, resulting from the increase in rainfall relative to snowfall also concomitant to warmer atmospheric temperatures, and strong currents pose a risk to salmon roe. However, decreased summer flows pose a much greater threat to Pacific salmon, and are associated with lower survival rates. Both increased winter flows and decreased summer flows pose risks to the ecosystem surrounding both Pacific salmon and the freshwater streams and rivers in which they can be found, as they affect the surrounding forests and other plant life.213
Death occurs for salmon shortly after they finish spawning. The decaying salmon carcasses release organic matter into the water, which influences the nutrients available to the next generation of salmon, as well as the bacteria in the water. The process of streambed disturbance intrinsic to salmon spawning also kicks up inorganic particulate matter. The amounts of both organic nutrients and inorganic particulate matter in natal streams are lower following small salmon runs, and are believed to contribute to lower survival rates for the next generation of Pacific salmon.214 This risk is compounded by the increasing sedimentation of rivers and streams associated with climate change. Warmer winter temperatures and increased flows during the cool period, when flows are naturally at their highest, increase sedimentation. Higher levels of sedimentation are associated with decreased chances of embryo survival.215
207 Miller (2000): 38.208 Brett, J. R. (1952). Temperature tolerance in young pacific salmon, genus oncorhynchus. Journal of the fish research board of Canada, 9(6).209 Beacham, T. D. & Murray, C. B. (1990). Temperature, egg size, and development of embryos and alevins of five species of pacific salmon: A compara-
tive analysis. Transactions of the American Fisheries Society,119(6); Mantua, N. J., Hare, S. R., Zhang, Y., Wallace, J. M., & Francis, R. C. (1997). A Pacific interdecal climate oscillation with impacts on salmon production. Bulletin of the American Meteorological Society 78.
210 Slaney, T. L., Hyatt, K. D., Northcote, T. G., and Fielden, R. J. (1996). Status of anadromous salmon and trout in British Columbia and Yukon. Fisheries, 21(10); Price, M. H., Darimont, C. T., Temple, N. F., &MacDuffee, S. M. (2008). Ghost runs: management and status assessment of Pacific salmon (Oncorhynchus spp.) returning to British Columbia’s central and north coasts. Canadian Journal Of Fisheries & Aquatic Sciences, 65(12).
211 Richter, A. & Kolmes, S. A. (2005). Maximum temperature limits for chinook, coho, and chum salmon, and steelhead trout in the Pacific Northwest. Reviews in fisheries science (13): 23-49.
212 Brett (1952).213 Mote, P. W., Parson, E. A., Hamlet, A. F., Keeton, W. S., Lettenmaier, D., Mantua, N., Miles, E. L., Peterson, D. W., Peterson, D. L., Slaughter, R., & Snover,
A. K. (2003). Preparing for climatic change: The water, salmon, and forests of the Pacific Northwest. Climatic change, 61(1-2): 45-88.214 Rex, J. F. & Petticrew, E. L. (2008). Delivery of marine-derived nutrients to streambeds by Pacific salmon. Nature geoscience, 1.215 Crouse, M. R., Callahan, C. A., Malueg, K. W., & Dominguez, S. E. (1981). Effects of fine sediments on growth of juvenile coho salmon in laboratory
CLIMATE CHANGE ADAPTATION AND CANADA’S CROPS AND FOOD SUPPLY BACKGROUND REPORT
30
Long-term projections for Pacific salmon are extremely poor. Fishers and communities in British Columbia are recommended to decrease economic reliance on salmon.216 Strategies to release young salmon into streams and rivers raise community awareness about salmon habitats; however, they have not had significant impacts on salmon runs.217 Temperature variability and increased atmospheric temperatures, reductions of summer flows and enlarged winter flows, and increased sedimentation are among the greatest climate change-related risks to salmon.218 Not all strategies to increase Pacific salmon survival rates rely on combating climate change-related risks, though; the risks posed by fish farms are easier to mitigate than those posed by climate change. A moratorium on aquaculture in British Columbia, or even a move towards closed-containment fish farms, would increase Pacific salmon survival rates. Climatic adaptation is more difficult, but the effects of temperature must be taken into account. Shading of rivers and streams can help moderate freshwater temperature increases somewhat; the effects on water and on salmon must be taken into account in forestry practices. While summer flows are predicted to decrease further, and salmon are predicted to become extinct in further habitats, steps must be taken not to exacerbate this process. Water is a finite resource, and must not be removed from rivers and streams where it would jeopardize salmon habitats. The survival of Pacific salmon, and the ecosystem that supports them, must be considered in any decision affecting watersheds in British Columbia.
CONCLUSIONS
Climate change has the potential to create challenges of varying impact to the production of Canada’s foods of local-ity. Disruptions can be categorized into an increase in extreme events that can cause one-time damage, and long-term challenges posed by rising temperature. Potential impact varies by product. Maple syrup production is likely to decrease as temperatures rise, and the industry may have to shift north, which will decrease the role of syrup production as an early season cash crop for the small farmer. Alberta beef is likely to encounter higher costs for water, and may have to shift feeding regimes to grass from grains. Icewine production could rise as temperatures rise and the potential growing range increases, but only if winter temperatures continue to be cold enough for production and if the industry can weather extreme events that are detrimental to crop and vineyard infrastructure. Canadian grain production, which is of critical importance both within the country and on the export market, will need to adapt to drier conditions that could require a shift to grain and pulse intercropping. An increase in extreme events will also be of concern to the grain farmer. Lastly, protecting BC salmon will require a concerted effort to shade streams and control water levels, and the range of the species in the long term may shift north.
Canada is well placed to maintain a robust food industry in the face of a shifting climate, but advance planning will be required if the farm base is to weather the potential economic and physical challenges created by a changing world.
streams. Transactions of the American Fisheries Society, 110(2): 281-286.216 Mote et al. (2003)217 Beamish (2005).218 Miller (2000).
31
ACT ( A DA P TAT ION TO CL IM AT E CH A NGE T E A M)
5. CLIMATE CHANGE IMPACTS ON IMPORTED FOODS
Among Canada’s top food imports are several commodities that could be adversely impacted by climate change, including: wine; coffee; sugar cane; and bananas.
5.1 WINE
• A 2011 study found that a 1.1°C average global temperature increase over the next 30 years—a highly con-servative assumption—could lead to a 50% reduction in the amount of land suitable for cultivating premium wine grapes in the western United States, a region which currently accounts for 90% of US wine production.219
• A 2006 study found that as much as 81% of premium wine grape acreage in the United States could become unsustainable by the end of the century, due to increased frequency of extremely hot days (above 35°C).220
• “Excess heat raises the sugar level of grapes to potentially ruinous levels. Too much sugar can result in wine that is unbalanced and too alcoholic — wine known as “cooked” or “jammy.” Higher temperatures may also increase the risk of pests and parasites, because fewer will die off during the winter. White wines, whose skins are less tolerant of heat, face particular difficulties as global warming intensifies.”221
5.2 COFFEE
• “Coffee likes a pretty narrow range of temperatures, and one of the hallmarks, really, of climate change will be increased extremes in temperatures”222
• “Because coffee varieties have adapted to specific climate zones, a temperature rise of even half a degree can make a big difference. A long-term increase in the number of extreme and unseasonal rainfall events has con-tributed to lower crop yields that are threatening the livelihood of coffee growers. For example, between 2002 and 2011, Indian coffee production declined by nearly 30 percent.”223
• “Brands like Maxwell House, Yuban, and Folgers have increased the retail prices of many grinds by 25 percent or more between 2010 and 2011, in light of tight supply and higher wholesale prices.”224
• Many coffee-growing countries—including Bolivia, Burundi, Central African Republic, Cuba, Democratic Republic of the Congo, Dominican Republic, Haiti and Rwanda—rank at highest risk (top 15) for agricultural productivity loss due to the effects of climate change.225
• A third of coffee land in Mexico and Central America could be lost due to increased average temperatures and altered precipitation regimes associated with climate change.226
219 Diffenbaugh, N.S., White, M.A., Jones, G.V., and Ashfaq, M. (2011). Climate adaptation wedges: a case study of premium wine in the western United States. Environ. Res. Lett. 6 (April-June 2011).
220 White, M.A., Diffenbaugh, N.S., Jones, G.V., Pal, J.S., and Giorgi, F. (2006). Extreme heat reduces and shifts United States premium wine production in the 21st century. Proceedings of the National Academy of Sciences 103(30).
221 http://www.wired.com/wiredscience/2010/04/climate-desk-wine-industry/222 Climate change pushing coffee to extinction. (October 17, 2011) CBS News. http://www.cbsnews.com/stories/2011/10/17/earlyshow/leisure/gamesgad-
getsgizmos/main20121250.shtml223 Union of Concerned Scientists. (2011). Coffee and climate: what’s brewing with climate change? http://ucsusa.org/global_warming/science_and_im-
pacts/impacts/impacts-of-climate-on-coffee.html?utm_source=sp&utm_medium=head&utm_campaign=coffee-and-climate-10-13-11-head224 Union of Concerned Scientists. (2011). 225 Wheeler, D. (2011). Quantifying vulnerability to climate change: implications for adaptation assistance. Working Paper 240. Center for Global
Development.226 Grainger, S. (2010). Central America coffee land to shrink as globe warms. Reuters. Retrieved June 8, 2013 from: http://www.reuters.com/
article/2010/05/19/centralamerica-coffee-idUSN1924362420100519?type=marketsNews
CLIMATE CHANGE ADAPTATION AND CANADA’S CROPS AND FOOD SUPPLY BACKGROUND REPORT
32
• If temperature rises by 3°C by the end of the century, the lower altitude limit for quality coffee production may rise by about 15 feet per year, “meaning that over time areas that are currently too cold for coffee could become suitable; but it is uncertain whether land at higher altitudes would in fact become available (or be rendered suitable) for coffee production.”
• Higher temperatures will lead to increased proliferation of certain pests and diseases (including coffee berry borer, leaf miner, nematodes, and coffee rust); it will also lead them to spread to regions in which they are not normally present.227
• The optimal altitude range for coffee production in Central America will shift from the present 1,200 m to 1,400 m in 2020 and 1,600 m in 2050. This will put the viability of coffee from Antigua, Guatemala, and Las Sevogias, Nicaragua at risk.228
• By 2050, Nicaragua will lose between 20 and 60% of the areas that are currently suitable to grow coffee as increased average temperatures and altered precipitation regimes will determine that “traditional coffee growing regions may disappear and new regions may appear.”229
• Starbucks International acknowledges these challenges: “What we are really seeing as a company as we look 10, 20, 30 years down the road – if conditions continue as they are – is a potentially significant risk to our supply chain, which is the Arabica coffee bean … Even in very well established coffee plantations and farms, we are hearing more and more stories of impacts.”230
• “We are concerned about the potential impacts of climate change on coffee-growing regions. To help address this issue, we’ve partnered with Conservation International …”231
5.3 RAW SUGAR CANE
• Climate change is predicted to have varying effects in different regions: a study in southern Brazil found that sugar cane yield will increase by approximately 7% by 2050;232 but a study conducted for the World Bank in a region of India concluded that climate change may reduce sugar cane yields by 30%;233 and the science advisor to the Alliance of Small Island States (AOSIS) says that higher carbon dioxide concentrations in the atmosphere could reduce yields of sugar cane.234
5.4 BANANAS
• “In Africa and Latin America changes in climate are raising the vulnerability of bananas and plantains to disease as well as reducing the typical yield.”235
227 International Trade Centre. The coffee sector and climate change. The Coffee Guide. 228 Laderach, P., Jarvis, A., Ramirez, J. (2008). The impact of climate change in coffee-growing regions. In.: Taller de Adaptacion al Cambio Climatico en las
Comunidades Cafetaleras de la Sierra Madre de Ciapas, Tuxtla Gutierrez, Chiapas: 17-18.229 Laderach, P., Lundy, M., Jarvis, A., Ramirez, J., Perez Portilla, E., Schepp, K., and Eitzinger, A. (2011). Predicted impact of climate change on coffee supply
chains. In Filho, W.L. (Ed.) The economic, social and political elements of climate change. Berlin/Heidelberg: Springer-Verlag.230 http://www.starbucks.com/responsibility/environment/climate-change231 http://www.starbucks.com/responsibility/environment/climate-change232 Marin, F.R., Jones, J., Royce, F., Pellegrino, G., and Assad, E. (2011). Climate change impacts on sugarcane production in southern Brazil. http://a-c-s.
confex.com/crops/2011am/webprogram/Paper64919.html233 D’Mello, A., (May 27, 2009). Climate change may hit sugarcane crop: WB report. The Times of India. Retrieved June 8, 2013 from: http://timesofindia.
indiatimes.com/city/mumbai/Climate-change-may-hit-sugarcane-crop-WB-report/articleshow/4581721.cms234 Hutchinson-Jafar, L., (December, 2011). Caribbean sizes up climate threats to food security. Thomson Reuters Foundation Online. Retrieved June 8, 2013
from: http://www.trust.org/alertnet/news/caribbean-sizes-up-climate-threats-to-food-security235 Parnell, J., (2012). Off the menu: the climate change food crises. Responding to Climate Change. Retrieved June 8, 2013 from: http://www.rtcc.org/
living/off-the-menu-the-climate-change-food-crises/
3 3
ACT ( A DA P TAT ION TO CL IM AT E CH A NGE T E A M)
• “Caribbean farmers are struggling to maintain production of key crops, including bananas and vegetables, in the face of more extreme weather. … Bananas, for example, are highly dependent on water, requiring 1,300-1,800 mm per year. Dwindling water supplies could reduce fruit size and trigger the onset of Black Sigatoka disease.”236
• “Fear of the adverse effects of climate change and the global crisis has forced banana companies [in the Philippines] to be more cautious in their expansion projects.”237
236 Hutchinson-Jafar, L., (2011).237 Philippines: Banana industry on edge over effects of climate change. (2009). FreshPlaza: Global Fresh Produce and Banana News. Retrieved June 8, 2013
from: http://www.freshplaza.com/news_detail.asp?id=38315
CLIMATE CHANGE ADAPTATION AND CANADA’S CROPS AND FOOD SUPPLY BACKGROUND REPORT
3 4
6. ADAPTATION CHALLENGES AND RESPONSES
Ngaio Hotte, agricultural and resource economist, ACT
Preparing for the effects of climate change to the degree possible based on current and emerging information can reduce the negative consequences of climate change and help to identify new opportunities. By identifying the potential impacts of climate change and developing capacity to adapt, it is possible to manage some of the risks the Canadian agricultural sector.
The first actors involved in adaptation are typically those individuals, countries, or regions that experience first-hand the impacts of climate change. Neighbouring farmers or jurisdictions soon follow, hoping to avoid negative impacts themselves. One example of this leader-follower pattern occurred between the State of California, which has experienced serious water shortages in the agricultural sector, and its neighbours to the north, Oregon and Washington. The State of California began developing a climate change adaptation plan in 2008, and was followed by the States of Oregon and Washington in 2009. Leaders are motivated to act swiftly by the immediacy of their situation and the need for damage control, while followers have the benefit of time to carefully consider options and learn from the experiences of others.
These two types of adaptation have also been referred to as “reactive” and “anticipatory” adaptation in the literature,238 with the former occurring after the direct effects of climate change are experienced and the latter occurring before. However, the distinction between reactive and anticipatory adaptation is blurred by the fact that responses to prior events are also intended to prevent future impacts. The occurrence of a disastrous event may facilitate political deci-sion-making on an issue, but the important fact remains that preventing damage is generally less costly than repairing damage and compensating victims.239
Demand is a necessary precursor to generating the financial capital required for adaptation projects. In the absence of demand, only no-regrets or low-cost adaptation options will appear politically palatable because the public and de-cision-makers will be unwilling to allocate scarce financial resources to adaptation projects. Where communities have already begun to experience the impacts of climate change or where awareness of climate change and its impacts are high, demand may already exist for adaptation. In other areas, individuals in leadership positions may need to create demand within their communities. Representatives from ICLEI - Local Governments for Sustainability, propose that it is more valuable to frame the discussion around adaptation in terms of building resilience to improve investment performance, rather than risk reduction.240 Since adaptation priorities should be established based on input at the local level, activities will require some, if not all, of project investment to be generated at the local level. ICLEI maintains that the performance of adaptation projects needs to be effectively demonstrated in terms of benefits and utility delivered to communities and individuals, as well as predictable returns to investors.241 Local, provincial, and federal government decision-makers are motivated to invest in projects to achieve maximum benefit, rather than those that minimize risk.242
Climate change adaptation can be incorporated into existing regional planning practices with the use of scenarios. For example, an agricultural land use planner may consider the potential effect on regional agriculture if the 100-year flood flow rate increases by 5%, and ask key questions, such as, “How will this impact agricultural producers with farms located adjacent to a river?” 238 Hallegatte, S., Henriet, F., Corfee-Morlot, J. (2011). The economics of climate change impacts and policy benefits at city scale: a conceptual framework.
Climate Change 104: 51-87.239 Hallegatte. (2011).240 ICLEI. (2011). Financing the Resilient City: A demand driven approach to development, disaster risk reduction and climate adaptation - An ICLEI White Paper, ICLEI Global Report. Retrieved on October 4, 2011, from the ICLEI website:
http://iclei.org/fileadmin/user_upload/documents/Global/Publications/Report-Financing_Resilient_City-Final.pdf241 ICLEI. (2011).242 ICLEI. (2011).
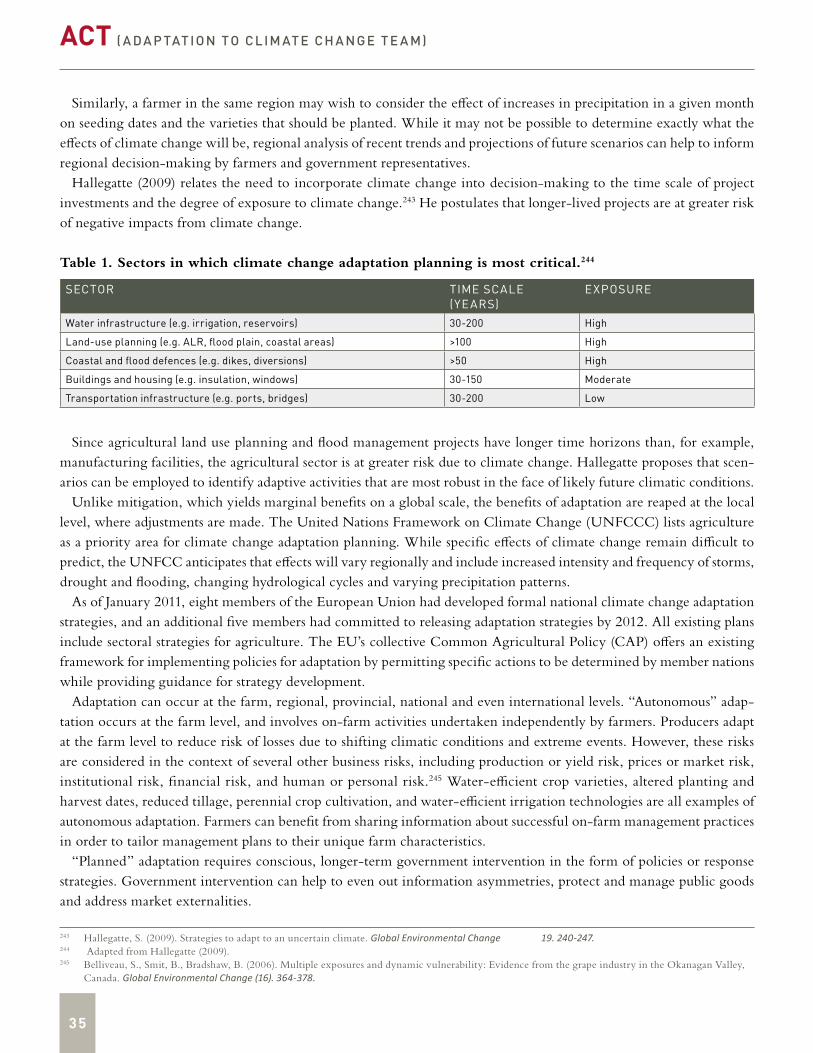
35
ACT ( A DA P TAT ION TO CL IM AT E CH A NGE T E A M)
Similarly, a farmer in the same region may wish to consider the effect of increases in precipitation in a given month on seeding dates and the varieties that should be planted. While it may not be possible to determine exactly what the effects of climate change will be, regional analysis of recent trends and projections of future scenarios can help to inform regional decision-making by farmers and government representatives.
Hallegatte (2009) relates the need to incorporate climate change into decision-making to the time scale of project investments and the degree of exposure to climate change.243 He postulates that longer-lived projects are at greater risk of negative impacts from climate change.
Table 1. Sectors in which climate change adaptation planning is most critical.244
SECTOR TIME SCALE (YEARS)
EXPOSURE
Water infrastructure (e.g. irrigation, reservoirs) 30-200 High
Land-use planning (e.g. ALR, flood plain, coastal areas) >100 High
Coastal and flood defences (e.g. dikes, diversions) >50 High
Buildings and housing (e.g. insulation, windows) 30-150 Moderate
Transportation infrastructure (e.g. ports, bridges) 30-200 Low
Since agricultural land use planning and flood management projects have longer time horizons than, for example, manufacturing facilities, the agricultural sector is at greater risk due to climate change. Hallegatte proposes that scen-arios can be employed to identify adaptive activities that are most robust in the face of likely future climatic conditions.
Unlike mitigation, which yields marginal benefits on a global scale, the benefits of adaptation are reaped at the local level, where adjustments are made. The United Nations Framework on Climate Change (UNFCCC) lists agriculture as a priority area for climate change adaptation planning. While specific effects of climate change remain difficult to predict, the UNFCC anticipates that effects will vary regionally and include increased intensity and frequency of storms, drought and flooding, changing hydrological cycles and varying precipitation patterns.
As of January 2011, eight members of the European Union had developed formal national climate change adaptation strategies, and an additional five members had committed to releasing adaptation strategies by 2012. All existing plans include sectoral strategies for agriculture. The EU’s collective Common Agricultural Policy (CAP) offers an existing framework for implementing policies for adaptation by permitting specific actions to be determined by member nations while providing guidance for strategy development.
Adaptation can occur at the farm, regional, provincial, national and even international levels. “Autonomous” adap-tation occurs at the farm level, and involves on-farm activities undertaken independently by farmers. Producers adapt at the farm level to reduce risk of losses due to shifting climatic conditions and extreme events. However, these risks are considered in the context of several other business risks, including production or yield risk, prices or market risk, institutional risk, financial risk, and human or personal risk.245 Water-efficient crop varieties, altered planting and harvest dates, reduced tillage, perennial crop cultivation, and water-efficient irrigation technologies are all examples of autonomous adaptation. Farmers can benefit from sharing information about successful on-farm management practices in order to tailor management plans to their unique farm characteristics.
“Planned” adaptation requires conscious, longer-term government intervention in the form of policies or response strategies. Government intervention can help to even out information asymmetries, protect and manage public goods and address market externalities.
243 Hallegatte, S. (2009). Strategies to adapt to an uncertain climate. Global Environmental Change 19. 240-247.244 Adapted from Hallegatte (2009).245 Belliveau, S., Smit, B., Bradshaw, B. (2006). Multiple exposures and dynamic vulnerability: Evidence from the grape industry in the Okanagan Valley,
Canada. Global Environmental Change (16). 364-378.
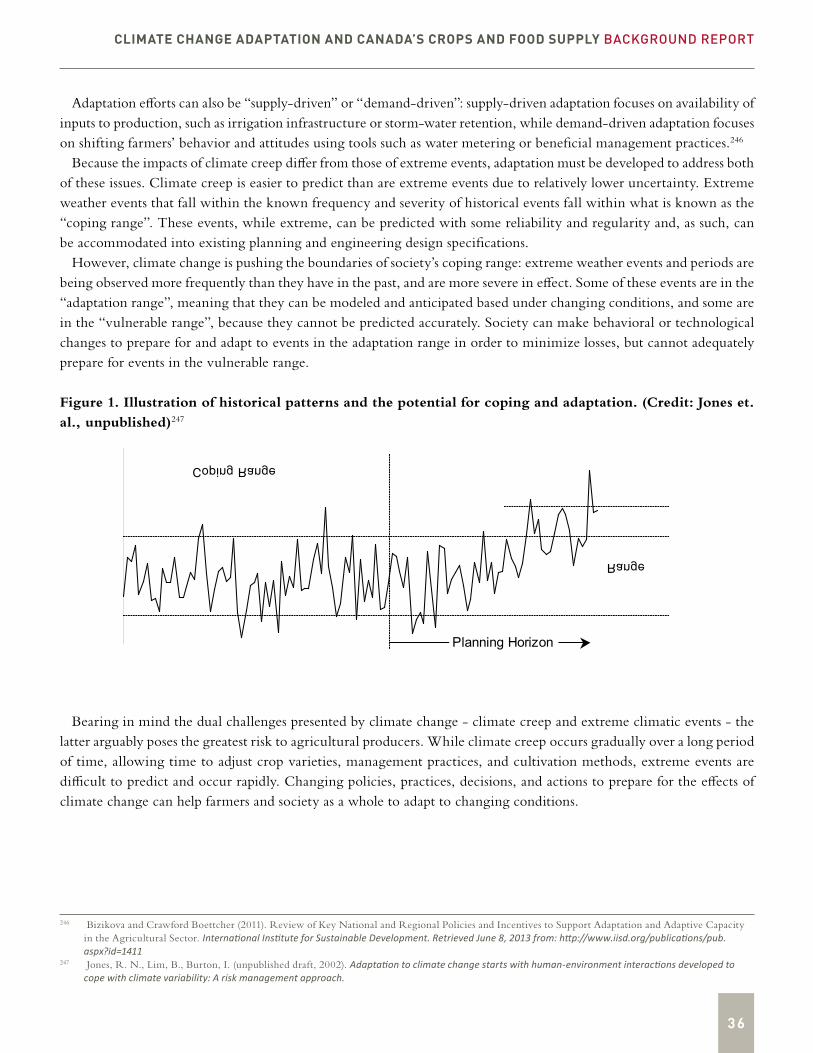
CLIMATE CHANGE ADAPTATION AND CANADA’S CROPS AND FOOD SUPPLY BACKGROUND REPORT
36
Adaptation efforts can also be “supply-driven” or “demand-driven”: supply-driven adaptation focuses on availability of inputs to production, such as irrigation infrastructure or storm-water retention, while demand-driven adaptation focuses on shifting farmers’ behavior and attitudes using tools such as water metering or beneficial management practices.246
Because the impacts of climate creep differ from those of extreme events, adaptation must be developed to address both of these issues. Climate creep is easier to predict than are extreme events due to relatively lower uncertainty. Extreme weather events that fall within the known frequency and severity of historical events fall within what is known as the “coping range”. These events, while extreme, can be predicted with some reliability and regularity and, as such, can be accommodated into existing planning and engineering design specifications.
However, climate change is pushing the boundaries of society’s coping range: extreme weather events and periods are being observed more frequently than they have in the past, and are more severe in effect. Some of these events are in the “adaptation range”, meaning that they can be modeled and anticipated based under changing conditions, and some are in the “vulnerable range”, because they cannot be predicted accurately. Society can make behavioral or technological changes to prepare for and adapt to events in the adaptation range in order to minimize losses, but cannot adequately prepare for events in the vulnerable range.
Figure 1. Illustration of historical patterns and the potential for coping and adaptation. (Credit: Jones et. al., unpublished)247
Planning Horizon
CopingRange
Vulnerable
Vulnerable
Adaptation
Changing Climate Stationary Climate & Coping Range
Bearing in mind the dual challenges presented by climate change - climate creep and extreme climatic events - the latter arguably poses the greatest risk to agricultural producers. While climate creep occurs gradually over a long period of time, allowing time to adjust crop varieties, management practices, and cultivation methods, extreme events are difficult to predict and occur rapidly. Changing policies, practices, decisions, and actions to prepare for the effects of climate change can help farmers and society as a whole to adapt to changing conditions.
246 Bizikova and Crawford Boettcher (2011). Review of Key National and Regional Policies and Incentives to Support Adaptation and Adaptive Capacity in the Agricultural Sector. International Institute for Sustainable Development. Retrieved June 8, 2013 from: http://www.iisd.org/publications/pub.aspx?id=1411
247 Jones, R. N., Lim, B., Burton, I. (unpublished draft, 2002). Adaptation to climate change starts with human-environment interactions developed to cope with climate variability: A risk management approach.
37
ACT ( A DA P TAT ION TO CL IM AT E CH A NGE T E A M)
7. ECONOMIC AND TRADE IMPLICATIONS OF CLIMATE CHANGE FOR AGRI-FOOD
Ngaio Hotte, agricultural and resource economist, ACT
There are several perspectives from which to examine the economic impacts of climate change on the agriculture and food in Canada. This paper will explore three areas where climate change has the potential to impact agriculture and agri-food in Canada: farm- vs. sector-level impacts in agriculture, supply vs. demand impacts for agri-food, and implications for food security.
7.1 FARM- VS. SECTOR-LEVEL IMPACTS
The farm- and sector-level economics of climate change adaptation are vastly different. Microeconomic policy is focused on the producer or farm level, whereas macroeconomic policy concentrates on the sector as a whole.
Individual producers are affected by climate change as it relates to the gross cost and value of production, the difference between these two values (or net value of production), and the effect on farm income.248 Farmers make production de-cisions at both the extensive and intensive margins by considering what to produce on their land and how to produce it with the inputs available to them, respectively.249 These decisions are used to maximize economic returns to production while managing multiple risks.250 Of course, climate change is only one of several considerations farmers must address with respect to risk; government policies, prices of and access to inputs such as labour and energy, and transportation costs are also major influences on production decisions.251
At the farm level, climate change adaptation makes sense because producers need to make production decisions, using full information about inputs to production, to the best of their ability in order to maximize profitability and remain competitive. Changes in climate shift the economically efficient level of production and input decisions.252 Farmers need to be able to access information easily in order to incorporate changes into their decisions, without having to conduct extensive and time-consuming research. Based on the status of data and climate modeling, as well as the complexity of interacting variables and their effect on climate, information is currently too uncertain for farmers to make farm-level decisions to adapt with confidence, resulting in high discount rates on the future benefits of adaptation.253 Farmers need better information to decrease uncertainty and reduce their discounting of perceived future gains from adaptation. In order to adapt, farmers need to see that the expected benefits of adaptation outweigh the expected costs.254
The risks presented by climate change are different for small and large farms. Small farms tend to produce a greater diversity of crop types, with farmers relying on multiple sources of income.255 Both of these characteristics can reduce exposure to risk by decreasing reliance on one crop or one income stream. Larger farms are more specialized, but have greater access to financial capital and receive a larger proportion of government subsidies.256 Larger farms also have greater access to market-based risk management tools.257 In order to assess farm-level risk due to climate change, financial performance can be modeled as a function of production income, debt structure, off-farm income, and the 248 Antle, J. (2009). Agriculture and the Food System: Adaptation to Climate Change. Resources for the Future. Retrieved on September 2, 2011, from the
Resources for the Future website: http://www.rff.org/rff/documents/RFF-Rpt-Adaptation-Antle.pdf249 Antle. (2009).250 Antle. (2009).251 Antle. (2009).252 Antle. (2009).253 Antle. (2009).254 Antle. (2009).255 Antle. (2009).256 Antle. (2009).257 Antle. (2009).
CLIMATE CHANGE ADAPTATION AND CANADA’S CROPS AND FOOD SUPPLY BACKGROUND REPORT
38
availability of risk management tools such as futures markets, crop insurance, and agricultural subsidies.258 The impact of climate change on transportation infrastructure, making it difficult or impossible for farms to transport their products to market, also has the potential to impact farm revenues.259 Risks to roads, ports, shipping routes, and other transportation infrastructure have the potential to negatively impact the ability to ship goods to market.
Across businesses, investors and shareholders increasingly consider the potential for environmental risks to affect the bottom line. Duty to report sources of environmental risks is transitioning from a voluntary commitment to a legal requirement in many jurisdictions and industries.
One relevant example comes from the Canadian Securities Administrators (CSA) Staff Notice 51-333: Environmental Reporting Guidance, which provides guidance to reporting issuers about interpretation of continuous disclosure re-quirements for environmental risk to businesses.260 The CSA identifies several ways in which environmental matters can affect business operations, including the following:
• Interrupting operations, such as supply and distribution• Causing unforeseen material costs, such as those to manage unplanned events• Influencing capital expenditures and project viability• Altering consumer preferences• Affecting access to and cost of capital• Affecting affordability and availability of insurance coverage, and• Generating new business opportunities.
As such, the CSA requires disclosure of all environmental matters with the potential to have a material effect on business operations, including risks, trends and uncertainties, and environmental liabilities.261 Similar requirements have been imposed by the U.S. Securities and Exchange Commission.262 While the CSA guidance document applies broadly to all environmental matters, climate change clearly falls within the aforementioned categories. The CSA reports that investors are increasingly concerned about disclosure of environmental risks, and wish to see these risks specifically and explicitly categorized in securities regulatory filings and financial reports with more stringent controls on data and reporting timelines than are applied to voluntary reports.263 As such, the guidance document was intended for use by securities report issuers listed on Canadian exchanges such as the Toronto Stock Exchange, which houses several major companies in the agricultural and food industries. The reporting requirements affect companies ranging from food processors, such as Smucker’s,264 to suppliers of agricultural inputs, including Agrium Inc.
Stern argues that, while the agricultural sector in developed countries is a relatively small component of GDP, it is highly sensitive to climate change and that losses suffered by the sector could create significant impacts to GDP growth.265 In 2011, Canada’s agricultural sector contributed only 1.9% of GDP.266 However, rising global food prices could significantly boost the contribution of agriculture to GDP if the sector is able to successfully adapt to climate change and minimize negative impacts to yields and input prices.
258 Antle. (2009).259 Antle. (2009).260 Canadian Securities Administrators. (2010, October 27). 51-333 Environmental Reporting Guidance. CSA Staff Notice. Retrieved on August 19, 2011,
from the British Columbia Securities Commission website: http://www.bcsc.bc.ca/uploadedFiles/securitieslaw/policy5/CSA%20Staff%20Notice%2051-333.pdf
261 CSA. (2010).262 Rubin, Josh. (2011, August 16). Global warming could deliver a jolt to coffee lovers. The Toronto Star. Retrieved August 19, 2011, from the Toronto Star
website: http://www.thestar.com/business/article/1040301--grounds-for-concern263 CSA. (2010).264 Rubin. (2011).265 Stern. (2005). Part II: The Impacts of Climate Change on Growth and Development: 3.266 CIA. (2012). CIA World Factbook 2012 - Canada. Retrieved on May 31, 2012, from the CIA website: https://www.cia.gov/library/publications/
the-world-factbook/geos/ca.html
39
ACT ( A DA P TAT ION TO CL IM AT E CH A NGE T E A M)
Adaptation is also necessary to remain viable and competitive at the industry level, and governments have an interest in protecting the broader economy and the livelihoods of their citizens by engaging in adaptation planning. Industry-level impacts of climate change can influence the value of production, consumption, and trade.267 Losses suffered by the agricultural industry can also have negative repercussions for government expenditures through depletion of government resources by producer support and disaster relief payments.
The additional wear on infrastructure projects due to climate change has the potential to increase life-cycle project costs.268 Weathering and deterioration of infrastructure can reduce lifespan, increase maintenance and repair costs, and reduce performance.269 For example, bridge or dike structures that are exposed to more frequent and severe storm and flood events will require greater investment in maintenance and repair. These costs are difficult to estimate based on limited knowledge of the regional rate of climate change and magnitude of impact,270 and may be overlooked in project cost-benefit analysis. For publicly funded projects, these costs can increase government expenditure over the lifespan of a project.271
Shifting climatic conditions may adversely affect agricultural yields, resulting in increased per unit production costs272 and reducing revenues to farmers in affected regions. Changes in food prices due to large scale, aggregate impacts of climate change on production of one or more crops are called “non-marginal” impacts273 to production, and must be considered when evaluating the potential costs of failure to adapt. In the event of food price spikes, such as those seen in the global wheat market in 2010, successful producers can reap the benefits of higher prices while providing food to other geographical regions that have experienced diminished harvests. For example, rural China benefited greatly from higher wheat prices due to their position as a major exporter.274 An important consideration with respect to adaptation of the agricultural sector is the role of increasing food prices on the marginal benefit of adaptation. Some adaptation projects that appear too costly based on the present value of agricultural goods may actually be revealed to have lower net cost based on the future value of the initial investment as the price of food increases. For example, a flood like the one that occurred in late 2010 that caused $30 million worth of damage to vegetable crops in the Fraser Valley,275 British Columbia, could cause much greater financial losses in a future with high vegetable prices.
7.2 SUPPLY VS. DEMAND IMPACTS OF CLIMATE CHANGE
Climate change has already begun to diminish global crop yields and has pushed up food prices. A recent study by Lobell et al. (2011) estimates the effect of global temperature increases on maize and wheat prices to be in the range of a 20% increase since 1980.276 The August 2011 World Bank Food Price Watch reports that global food prices are higher than they were one year ago, and are approaching 2008 levels.277 The World Bank Food Price Index has increased 33% 267 Antle. (2009).268 Keats, T. (2008.) Assessing our vulnerability and adapting to a changing climate. Climate Change Adaptation Workshop presentation. Engineers
Canada and the Government of Newfoundland and Labrador. Saint John, NB. Retrieved on September 13, 2011, from the Government of Newfoundland and Labrador website: http://www.gnb.ca/0009/0373/0004/pdf/Keats-e.pdf
269 Keats. (2008).270 Keats. (2008).271 Keats. (2008).272 Howitt, R., Medellin-Azuara, J., MacEwan, D. (2009). Estimating the Economic Impacts of Agricultural Yield Related Changes for California.
California Climate Change Center. Retrieved on September 7, 2011, from the California Energy Commission website: http://www.energy.ca.gov/2009publications/CEC-500-2009-042/CEC-500-2009-042-F.PDF
273 Metroeconomica Ltd. (2004). Costing the impacts of climate change in the UK – Overview of guidelines. UKCIP. Retrieved on October 3, 2011, from the UKCIP website: http://www.ukcip.org.uk/wordpress/wp-content/PDFs/Costings_overview.pdf
274 Carmichael, K. (2011, August 25). How rising food prices can ease poverty. The Globe and Mail. Retrieved on August 25, 2011, from the Globe and Mail website: http://www.theglobeandmail.com/report-on-business/economy/economy-lab/daily-mix/how-rising-food-prices-can-ease-poverty/article2141472/
275 Corbett, N. (2011, February 3). Farmers face uncertainty about reimbursement for washed-out crops. Abbotsford News. Retrieved on September 15, 2011, from the BC Local News website: http://www.bclocalnews.com/fraser_valley/abbynews/news/115145169.html
276 Lobell, D., Schenkler, W., Costa-Roberts, J. (2011). Climate Trends and Global Crop Production Since 1980. Science 333(6042): 616-620.277 World Bank. (2011). Food Price Watch (August 2011). Retrieved on September 9, 2011, from the World Bank website:http://siteresources.worldbank.
org/INTPOVERTY/News%20and%20Events/22982477/Food-Price-Watch-August-2011.htm
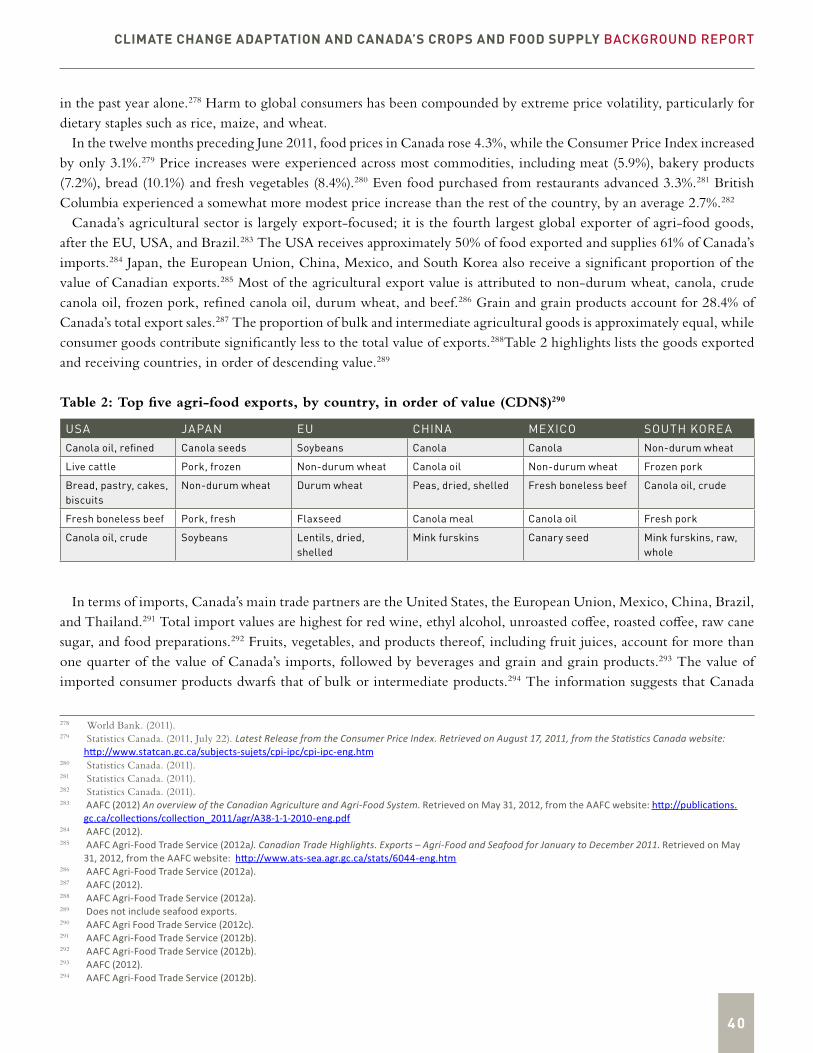
CLIMATE CHANGE ADAPTATION AND CANADA’S CROPS AND FOOD SUPPLY BACKGROUND REPORT
4 0
in the past year alone.278 Harm to global consumers has been compounded by extreme price volatility, particularly for dietary staples such as rice, maize, and wheat.
In the twelve months preceding June 2011, food prices in Canada rose 4.3%, while the Consumer Price Index increased by only 3.1%.279 Price increases were experienced across most commodities, including meat (5.9%), bakery products (7.2%), bread (10.1%) and fresh vegetables (8.4%).280 Even food purchased from restaurants advanced 3.3%.281 British Columbia experienced a somewhat more modest price increase than the rest of the country, by an average 2.7%.282
Canada’s agricultural sector is largely export-focused; it is the fourth largest global exporter of agri-food goods, after the EU, USA, and Brazil.283 The USA receives approximately 50% of food exported and supplies 61% of Canada’s imports.284 Japan, the European Union, China, Mexico, and South Korea also receive a significant proportion of the value of Canadian exports.285 Most of the agricultural export value is attributed to non-durum wheat, canola, crude canola oil, frozen pork, refined canola oil, durum wheat, and beef.286 Grain and grain products account for 28.4% of Canada’s total export sales.287 The proportion of bulk and intermediate agricultural goods is approximately equal, while consumer goods contribute significantly less to the total value of exports.288Table 2 highlights lists the goods exported and receiving countries, in order of descending value.289
Table 2: Top five agri-food exports, by country, in order of value (CDN$)290
USA JAPAN EU CHINA MEXICO SOUTH KOREACanola oil, refined Canola seeds Soybeans Canola Canola Non-durum wheat
Live cattle Pork, frozen Non-durum wheat Canola oil Non-durum wheat Frozen pork
Bread, pastry, cakes, biscuits
Non-durum wheat Durum wheat Peas, dried, shelled Fresh boneless beef Canola oil, crude
Fresh boneless beef Pork, fresh Flaxseed Canola meal Canola oil Fresh pork
Canola oil, crude Soybeans Lentils, dried, shelled
Mink furskins Canary seed Mink furskins, raw, whole
In terms of imports, Canada’s main trade partners are the United States, the European Union, Mexico, China, Brazil, and Thailand.291 Total import values are highest for red wine, ethyl alcohol, unroasted coffee, roasted coffee, raw cane sugar, and food preparations.292 Fruits, vegetables, and products thereof, including fruit juices, account for more than one quarter of the value of Canada’s imports, followed by beverages and grain and grain products.293 The value of imported consumer products dwarfs that of bulk or intermediate products.294 The information suggests that Canada
278 World Bank. (2011).279 Statistics Canada. (2011, July 22). Latest Release from the Consumer Price Index. Retrieved on August 17, 2011, from the Statistics Canada website:
http://www.statcan.gc.ca/subjects-sujets/cpi-ipc/cpi-ipc-eng.htm280 Statistics Canada. (2011).281 Statistics Canada. (2011).282 Statistics Canada. (2011).283 AAFC (2012) An overview of the Canadian Agriculture and Agri-Food System. Retrieved on May 31, 2012, from the AAFC website: http://publications.
gc.ca/collections/collection_2011/agr/A38-1-1-2010-eng.pdf284 AAFC (2012).285 AAFC Agri-Food Trade Service (2012a). Canadian Trade Highlights. Exports – Agri-Food and Seafood for January to December 2011. Retrieved on May
31, 2012, from the AAFC website: http://www.ats-sea.agr.gc.ca/stats/6044-eng.htm286 AAFC Agri-Food Trade Service (2012a).287 AAFC (2012).288 AAFC Agri-Food Trade Service (2012a).289 Does not include seafood exports.290 AAFC Agri Food Trade Service (2012c). 291 AAFC Agri-Food Trade Service (2012b).292 AAFC Agri-Food Trade Service (2012b).293 AAFC (2012).294 AAFC Agri-Food Trade Service (2012b).
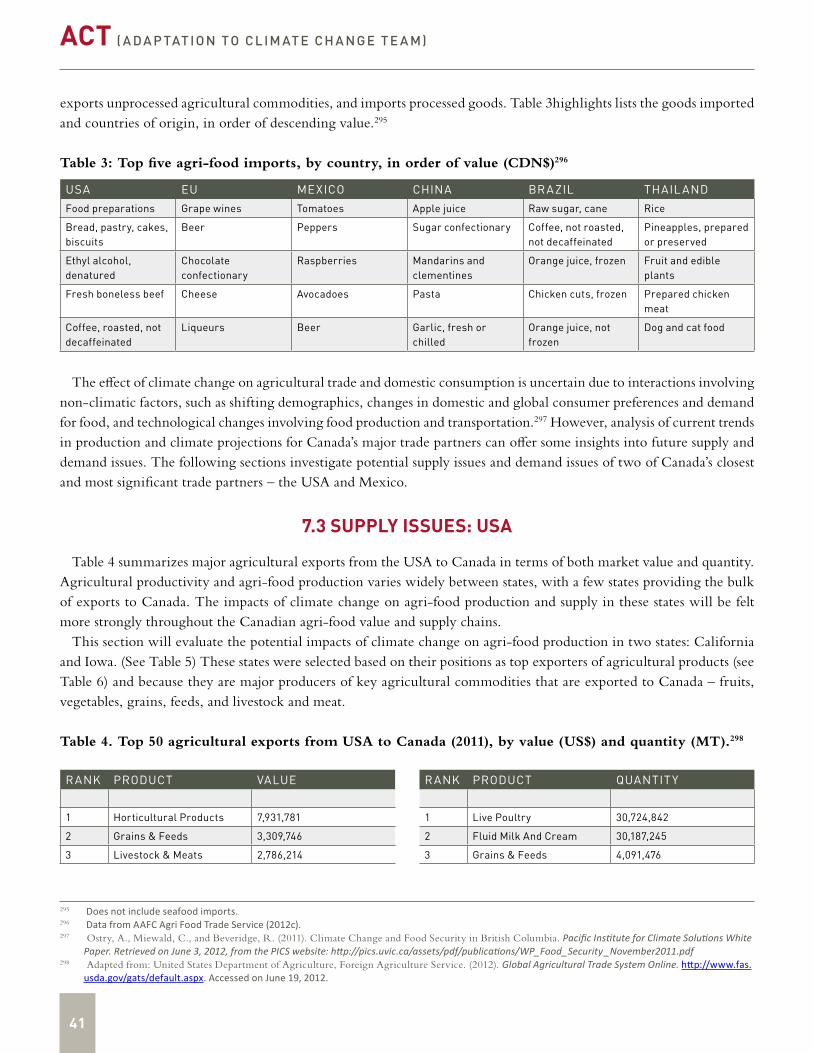
41
ACT ( A DA P TAT ION TO CL IM AT E CH A NGE T E A M)
exports unprocessed agricultural commodities, and imports processed goods. Table 3highlights lists the goods imported and countries of origin, in order of descending value.295
Table 3: Top five agri-food imports, by country, in order of value (CDN$)296
USA EU MEXICO CHINA BRAZIL THAIL ANDFood preparations Grape wines Tomatoes Apple juice Raw sugar, cane Rice
Bread, pastry, cakes, biscuits
Beer Peppers Sugar confectionary Coffee, not roasted, not decaffeinated
Pineapples, prepared or preserved
Ethyl alcohol, denatured
Chocolate confectionary
Raspberries Mandarins and clementines
Orange juice, frozen Fruit and edible plants
Fresh boneless beef Cheese Avocadoes Pasta Chicken cuts, frozen Prepared chicken meat
Coffee, roasted, not decaffeinated
Liqueurs Beer Garlic, fresh or chilled
Orange juice, not frozen
Dog and cat food
The effect of climate change on agricultural trade and domestic consumption is uncertain due to interactions involving non-climatic factors, such as shifting demographics, changes in domestic and global consumer preferences and demand for food, and technological changes involving food production and transportation.297 However, analysis of current trends in production and climate projections for Canada’s major trade partners can offer some insights into future supply and demand issues. The following sections investigate potential supply issues and demand issues of two of Canada’s closest and most significant trade partners – the USA and Mexico.
7.3 SUPPLY ISSUES: USA
Table 4 summarizes major agricultural exports from the USA to Canada in terms of both market value and quantity. Agricultural productivity and agri-food production varies widely between states, with a few states providing the bulk of exports to Canada. The impacts of climate change on agri-food production and supply in these states will be felt more strongly throughout the Canadian agri-food value and supply chains.
This section will evaluate the potential impacts of climate change on agri-food production in two states: California and Iowa. (See Table 5) These states were selected based on their positions as top exporters of agricultural products (see Table 6) and because they are major producers of key agricultural commodities that are exported to Canada – fruits, vegetables, grains, feeds, and livestock and meat.
Table 4. Top 50 agricultural exports from USA to Canada (2011), by value (US$) and quantity (MT).298
RANK PRODUCT VALUE RANK PRODUCT QUANTIT Y
1 Horticultural Products 7,931,781 1 Live Poultry 30,724,842
2 Grains & Feeds 3,309,746 2 Fluid Milk And Cream 30,187,245
3 Livestock & Meats 2,786,214 3 Grains & Feeds 4,091,476
295 Does not include seafood imports.296 Data from AAFC Agri Food Trade Service (2012c).297 Ostry, A., Miewald, C., and Beveridge, R. (2011). Climate Change and Food Security in British Columbia. Pacific Institute for Climate Solutions White
Paper. Retrieved on June 3, 2012, from the PICS website: http://pics.uvic.ca/assets/pdf/publications/WP_Food_Security _November2011.pdf298 Adapted from: United States Department of Agriculture, Foreign Agriculture Service. (2012). Global Agricultural Trade System Online. http://www.fas.
usda.gov/gats/default.aspx. Accessed on June 19, 2012.
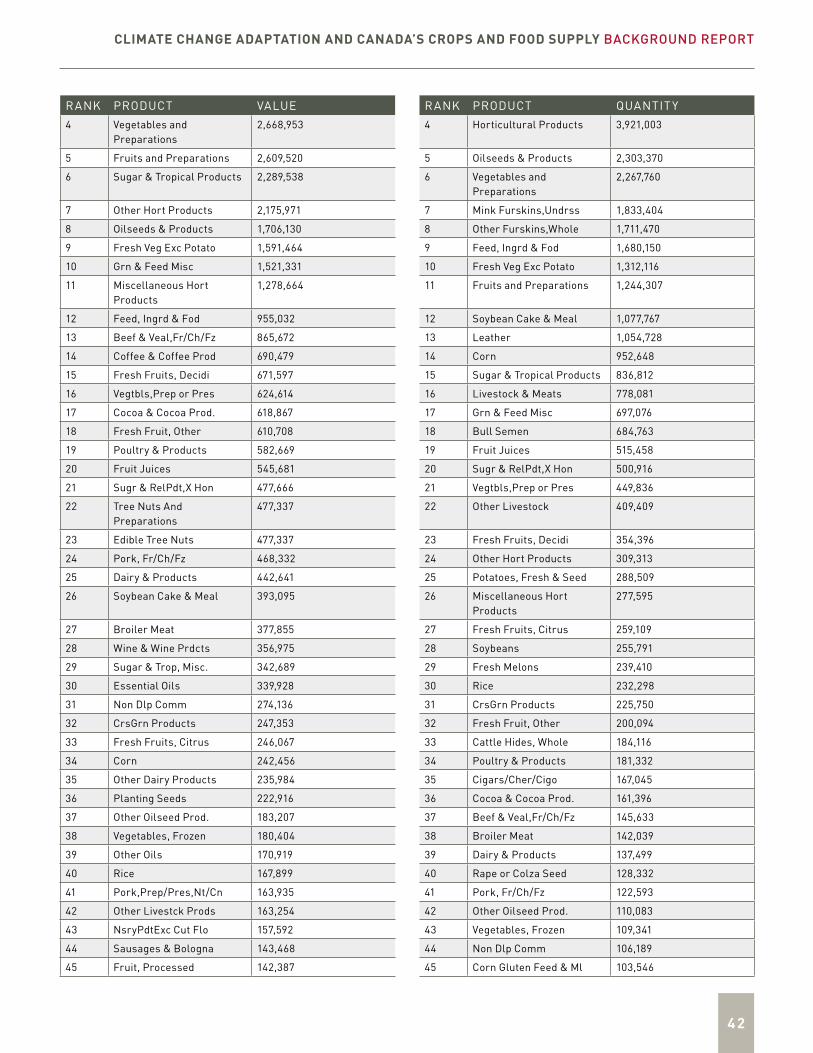
CLIMATE CHANGE ADAPTATION AND CANADA’S CROPS AND FOOD SUPPLY BACKGROUND REPORT
4 2
RANK PRODUCT VALUE RANK PRODUCT QUANTIT Y 4 Vegetables and
Preparations2,668,953 4 Horticultural Products 3,921,003
5 Fruits and Preparations 2,609,520 5 Oilseeds & Products 2,303,370
6 Sugar & Tropical Products 2,289,538 6 Vegetables and Preparations
2,267,760
7 Other Hort Products 2,175,971 7 Mink Furskins,Undrss 1,833,404
8 Oilseeds & Products 1,706,130 8 Other Furskins,Whole 1,711,470
9 Fresh Veg Exc Potato 1,591,464 9 Feed, Ingrd & Fod 1,680,150
10 Grn & Feed Misc 1,521,331 10 Fresh Veg Exc Potato 1,312,116
11 Miscellaneous Hort Products
1,278,664 11 Fruits and Preparations 1,244,307
12 Feed, Ingrd & Fod 955,032 12 Soybean Cake & Meal 1,077,767
13 Beef & Veal,Fr/Ch/Fz 865,672 13 Leather 1,054,728
14 Coffee & Coffee Prod 690,479 14 Corn 952,648
15 Fresh Fruits, Decidi 671,597 15 Sugar & Tropical Products 836,812
16 Vegtbls,Prep or Pres 624,614 16 Livestock & Meats 778,081
17 Cocoa & Cocoa Prod. 618,867 17 Grn & Feed Misc 697,076
18 Fresh Fruit, Other 610,708 18 Bull Semen 684,763
19 Poultry & Products 582,669 19 Fruit Juices 515,458
20 Fruit Juices 545,681 20 Sugr & RelPdt,X Hon 500,916
21 Sugr & RelPdt,X Hon 477,666 21 Vegtbls,Prep or Pres 449,836
22 Tree Nuts And Preparations
477,337 22 Other Livestock 409,409
23 Edible Tree Nuts 477,337 23 Fresh Fruits, Decidi 354,396
24 Pork, Fr/Ch/Fz 468,332 24 Other Hort Products 309,313
25 Dairy & Products 442,641 25 Potatoes, Fresh & Seed 288,509
26 Soybean Cake & Meal 393,095 26 Miscellaneous Hort Products
277,595
27 Broiler Meat 377,855 27 Fresh Fruits, Citrus 259,109
28 Wine & Wine Prdcts 356,975 28 Soybeans 255,791
29 Sugar & Trop, Misc. 342,689 29 Fresh Melons 239,410
30 Essential Oils 339,928 30 Rice 232,298
31 Non Dlp Comm 274,136 31 CrsGrn Products 225,750
32 CrsGrn Products 247,353 32 Fresh Fruit, Other 200,094
33 Fresh Fruits, Citrus 246,067 33 Cattle Hides, Whole 184,116
34 Corn 242,456 34 Poultry & Products 181,332
35 Other Dairy Products 235,984 35 Cigars/Cher/Cigo 167,045
36 Planting Seeds 222,916 36 Cocoa & Cocoa Prod. 161,396
37 Other Oilseed Prod. 183,207 37 Beef & Veal,Fr/Ch/Fz 145,633
38 Vegetables, Frozen 180,404 38 Broiler Meat 142,039
39 Other Oils 170,919 39 Dairy & Products 137,499
40 Rice 167,899 40 Rape or Colza Seed 128,332
41 Pork,Prep/Pres,Nt/Cn 163,935 41 Pork, Fr/Ch/Fz 122,593
42 Other Livestck Prods 163,254 42 Other Oilseed Prod. 110,083
43 NsryPdtExc Cut Flo 157,592 43 Vegetables, Frozen 109,341
44 Sausages & Bologna 143,468 44 Non Dlp Comm 106,189
45 Fruit, Processed 142,387 45 Corn Gluten Feed & Ml 103,546

4 3
ACT ( A DA P TAT ION TO CL IM AT E CH A NGE T E A M)
RANK PRODUCT VALUE RANK PRODUCT QUANTIT Y 46 OtOlsd Prod Non-Agr 141,724 46 Tree Nuts And
Preparations99,624
47 Beef & Veal, Prep/Pres 138,336 47 Edible Tree Nuts 99,624
48 Potatoes, Fresh & Seed 136,375 48 Wheat Flour 99,338
49 Fresh Melons 133,278 49 Coffee & Coffee Prod 96,893
50 Soybeans 120,457 50 Other Oils 93,677
Table 5. Total value of agri-food exports for the top 25 exporting states (2010).299
STATE VALUE OF EXPORTS (2010 US$, MILLIONS)California 12,794
Iowa 7,041
Texas 6,125
Illinois 5,786
Nebraska 5,317
Minnesota 5,037
Kansas 4,866
Indiana 3,422
North Dakota 3,245
Missouri 2,861
Arkansas 2,810
North Carolina 2,744
Wisconsin 2,675
Ohio 2,662
Washington 2,646
South Dakota 2,419
Georgia 1,783
Michigan 1,754
Idaho 1,566
Florida 1,544
Colorado 1,429
Mississippi 1,417
Pennsylvania 1,404
Kentucky 1,364
Oregon 1,329
United States 108,664
299 USDA Economic Research Service. (2012). State Export Data. Total agricultural exports by state, last 5 fiscal years. http://www.ers.usda.gov/data/stateexports/
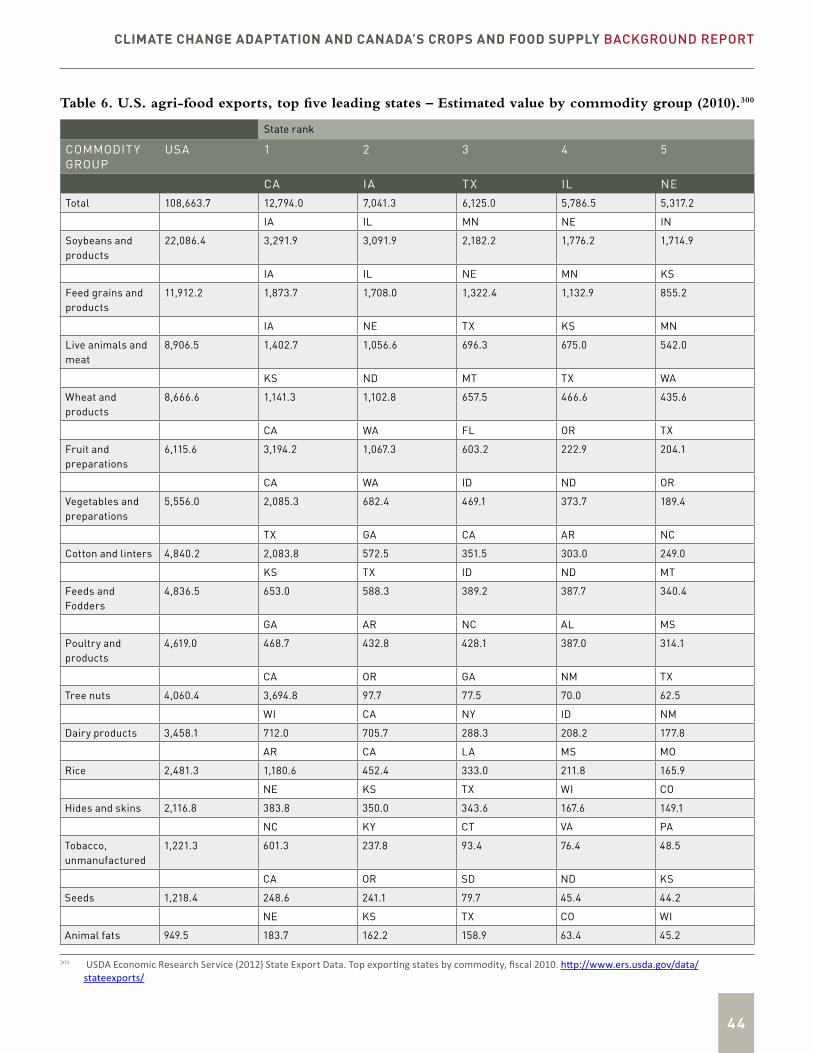
CLIMATE CHANGE ADAPTATION AND CANADA’S CROPS AND FOOD SUPPLY BACKGROUND REPORT
4 4
Table 6. U.S. agri-food exports, top five leading states – Estimated value by commodity group (2010).300
State rank
COMMODIT Y GROUP
USA 1 2 3 4 5
CA IA TX IL NETotal 108,663.7 12,794.0 7,041.3 6,125.0 5,786.5 5,317.2
IA IL MN NE IN
Soybeans and products
22,086.4 3,291.9 3,091.9 2,182.2 1,776.2 1,714.9
IA IL NE MN KS
Feed grains and products
11,912.2 1,873.7 1,708.0 1,322.4 1,132.9 855.2
IA NE TX KS MN
Live animals and meat
8,906.5 1,402.7 1,056.6 696.3 675.0 542.0
KS ND MT TX WA
Wheat and products
8,666.6 1,141.3 1,102.8 657.5 466.6 435.6
CA WA FL OR TX
Fruit and preparations
6,115.6 3,194.2 1,067.3 603.2 222.9 204.1
CA WA ID ND OR
Vegetables and preparations
5,556.0 2,085.3 682.4 469.1 373.7 189.4
TX GA CA AR NC
Cotton and linters 4,840.2 2,083.8 572.5 351.5 303.0 249.0
KS TX ID ND MT
Feeds and Fodders
4,836.5 653.0 588.3 389.2 387.7 340.4
GA AR NC AL MS
Poultry and products
4,619.0 468.7 432.8 428.1 387.0 314.1
CA OR GA NM TX
Tree nuts 4,060.4 3,694.8 97.7 77.5 70.0 62.5
WI CA NY ID NM
Dairy products 3,458.1 712.0 705.7 288.3 208.2 177.8
AR CA LA MS MO
Rice 2,481.3 1,180.6 452.4 333.0 211.8 165.9
NE KS TX WI CO
Hides and skins 2,116.8 383.8 350.0 343.6 167.6 149.1
NC KY CT VA PA
Tobacco, unmanufactured
1,221.3 601.3 237.8 93.4 76.4 48.5
CA OR SD ND KS
Seeds 1,218.4 248.6 241.1 79.7 45.4 44.2
NE KS TX CO WI
Animal fats 949.5 183.7 162.2 158.9 63.4 45.2
300 USDA Economic Research Service (2012) State Export Data. Top exporting states by commodity, fiscal 2010. http://www.ers.usda.gov/data/stateexports/
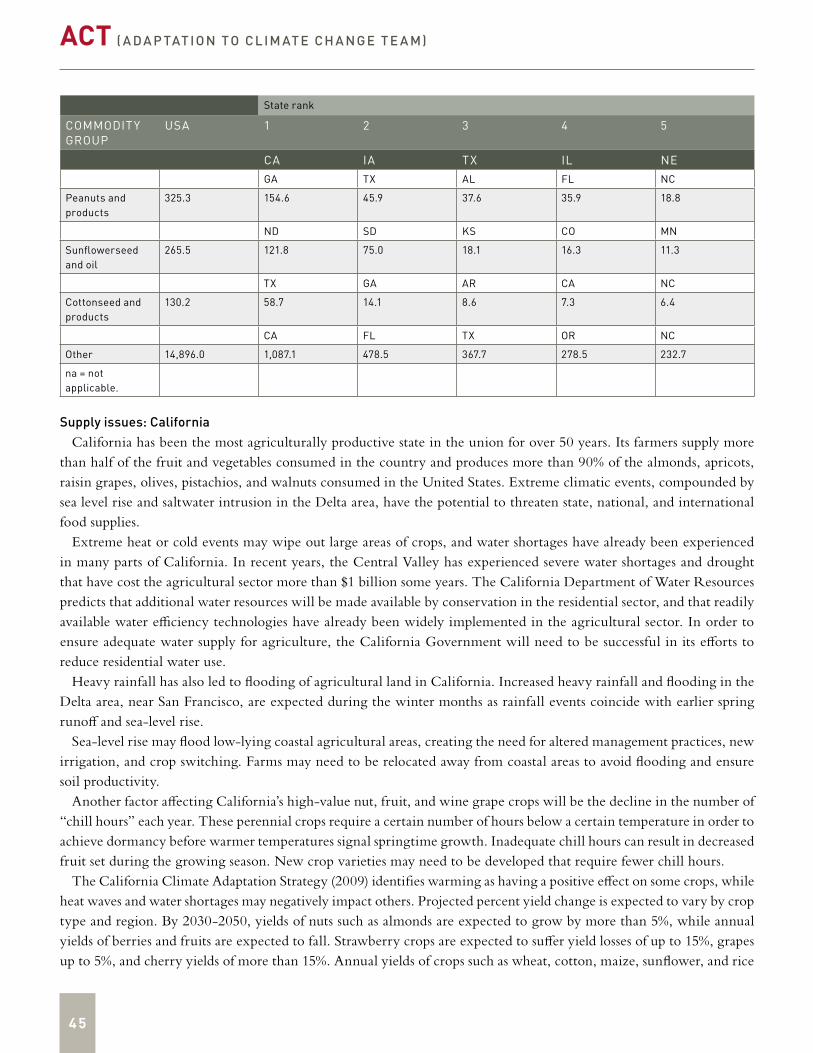
4 5
ACT ( A DA P TAT ION TO CL IM AT E CH A NGE T E A M)
State rank
COMMODIT Y GROUP
USA 1 2 3 4 5
CA IA TX IL NEGA TX AL FL NC
Peanuts and products
325.3 154.6 45.9 37.6 35.9 18.8
ND SD KS CO MN
Sunflowerseed and oil
265.5 121.8 75.0 18.1 16.3 11.3
TX GA AR CA NC
Cottonseed and products
130.2 58.7 14.1 8.6 7.3 6.4
CA FL TX OR NC
Other 14,896.0 1,087.1 478.5 367.7 278.5 232.7
na = not applicable.
Supply issues: CaliforniaCalifornia has been the most agriculturally productive state in the union for over 50 years. Its farmers supply more
than half of the fruit and vegetables consumed in the country and produces more than 90% of the almonds, apricots, raisin grapes, olives, pistachios, and walnuts consumed in the United States. Extreme climatic events, compounded by sea level rise and saltwater intrusion in the Delta area, have the potential to threaten state, national, and international food supplies.
Extreme heat or cold events may wipe out large areas of crops, and water shortages have already been experienced in many parts of California. In recent years, the Central Valley has experienced severe water shortages and drought that have cost the agricultural sector more than $1 billion some years. The California Department of Water Resources predicts that additional water resources will be made available by conservation in the residential sector, and that readily available water efficiency technologies have already been widely implemented in the agricultural sector. In order to ensure adequate water supply for agriculture, the California Government will need to be successful in its efforts to reduce residential water use.
Heavy rainfall has also led to flooding of agricultural land in California. Increased heavy rainfall and flooding in the Delta area, near San Francisco, are expected during the winter months as rainfall events coincide with earlier spring runoff and sea-level rise.
Sea-level rise may flood low-lying coastal agricultural areas, creating the need for altered management practices, new irrigation, and crop switching. Farms may need to be relocated away from coastal areas to avoid flooding and ensure soil productivity.
Another factor affecting California’s high-value nut, fruit, and wine grape crops will be the decline in the number of “chill hours” each year. These perennial crops require a certain number of hours below a certain temperature in order to achieve dormancy before warmer temperatures signal springtime growth. Inadequate chill hours can result in decreased fruit set during the growing season. New crop varieties may need to be developed that require fewer chill hours.
The California Climate Adaptation Strategy (2009) identifies warming as having a positive effect on some crops, while heat waves and water shortages may negatively impact others. Projected percent yield change is expected to vary by crop type and region. By 2030-2050, yields of nuts such as almonds are expected to grow by more than 5%, while annual yields of berries and fruits are expected to fall. Strawberry crops are expected to suffer yield losses of up to 15%, grapes up to 5%, and cherry yields of more than 15%. Annual yields of crops such as wheat, cotton, maize, sunflower, and rice
CLIMATE CHANGE ADAPTATION AND CANADA’S CROPS AND FOOD SUPPLY BACKGROUND REPORT
4 6
are expected to decrease as temperatures rise. Production of wine grapes may increase to a point, due to longer seasons and more favourable growing conditions, but the climate may shift beyond the optimal temperature and precipitation range for wine grapes, resulting in a subsequent decrease in yields.
A study published by the California Climate Change Center evaluated the projected impacts of climate change over the next 20-50 years on the 20 highest-value perennial crops in California, based on harvest and weather data from 1985-2005 and climate modeling projections. The research focused only on average monthly temperature and pre-cipitation projections, and did not account for extreme weather events. Their research revealed that only cherry crops were undoubtedly threatened by climate change, however, no crops were found to benefit from warmer temperatures. Contrary to the results of the California Climate Adaptation Strategy, the California Climate Change Center found that almond yields would decrease by approximately 10% due to winter warming and a decrease in chill hours, while the effect of summer warming on almond crops was inconclusive. The study revealed the importance of monitoring and tracking uncertainties, and the complexity associated with characterizing crop-climate interactions.
Yield reductions are expected to vary between regions across California; however, significant average annual revenue losses are expected for the state over the coming decades. The fertilizing effect of increased carbon dioxide levels on C3 plants, such as tomato, wheat, and barley, may also have a negative effect by inhibiting photorespiration.
Average prices of agricultural goods produced in California are projected to rise by 2050, with increases varying by crop type. Citrus (12.26%) and orchard fruits (8.05%) are expected to experience the largest increases, while “trucks crops” – vegetable crops grown in large quantities for market – are expected to increase more modestly (2.72%). Tomato prices may actually decrease slightly (0.83%). The impact of price increases on consumers is expected to be less than the impact of increased production costs on farmers. Total revenue is expected to fall field crops (-48.40%), grains (-30.05%), corn (-22.61%), rice (-21.22%), truck crops (-10.88%), citrus (-8.36%), grapes (-5.60%), and orchard fruits (-2.94%). Additionally, the cultivated land area is expected to decrease for most crops, with the greatest losses attributed to those crops with considerable decreases associated with grain crops.
Based on existing trade pathways, the effects of climate change on agricultural production in California has the potential to significantly impact the price and availability of fresh fruit and vegetables in Canada in coming years. The outlook for California’s climate indicates reduced yields, shorter growing periods, diminished product quality, and shifting patterns of production for specialty crops. Drought has already begun to impede agricultural productivity in California, which may put pressure on supplies of fruit, vegetables, and nuts in Canada.
While the State of California has developed a Climate Adaptation Strategy, the sector-specific adaptation plan prepared by the California State Board of Food and Agriculture and the California Department of Food and Agricultural offers a limited scope for adaptation activities in the agricultural sector. Objectives and strategies are proposed for evaluating impacts on agriculture and addressing water supply issues, but a comprehensive adaptation plan for action is not yet in place. The lack of an appropriate institutional and policy framework for adapting the sector to climate change increases the level of uncertainty regarding the future of the sector in California. Additionally, specific crop-climate projections are inconclusive.
The California Water Plan (CWP), administered through the California Department of Water Resources, offers one avenue toward climate change adaptation for agriculture. Updated every five years, with a recent update in 2009 (CWP 2009) and subsequent changes planned for 2013 (CWP 2013), the CWP offers a “collaborative planning framework for elected officials, agencies, tribes, water and resource managers, businesses, academia, stakeholders, and the public to develop findings and recommendations and make informed decisions for California’s water future.” It provides the most current available information on the status and trends of water resources, supplies and demands under several future scenarios as well as potential management options to achieve critical objectives. While CWP 2009 relied on scenarios to project likely future conditions, CWP 2013 is expected to provide a framework for management decisions in an uncertain future based on i) potential threats; ii) expected outcomes of different management options; and iii) tradeoffs between
47
ACT ( A DA P TAT ION TO CL IM AT E CH A NGE T E A M)
options.This approach is intended to accommodate multiple potential future conditions with significant uncertainty using a Robust Decision Making approach and may offer new options for managing water resources in a changing climate.
The California Energy Commission’s California Climate Change Center (CCCC) has recognized the importance of developing public awareness of biophysical and socioeconomic factors that contribute to agricultural vulnerability and resilience in order to establish public support for climate change mitigation and adaptation. To provide the public with necessary information to understand these conditions, the CCCC has developed a spatially explicit vulnerability index based on 22 climate, crop, land use and socioeconomic variables. The index has been used to identify priority regions for adaptation based on high vulnerability to climate change. However, the research team noted the need for a place-based approach to identifying underlying causes of vulnerability and relevant approaches to adaptation based on regional characteristics. A place-based study was conducted for Yolo County to assess future crop acreages and associated hydrological conditions under climate change, current levels of agricultural greenhouse gas emissions, farmers’ current perspectives on climate change and willingness to adopt mitigation and adaptation strategies and future urban growth scenarios. Studies of potential climate change impacts, adaptation options, and contributors to vulnerability and resilience (i.e. socio-economic, infrastructure, community services and natural resources) have also been conducted for Fresno County. These efforts indicate progress toward adaptation at the state and regional levels.
Current trends in California’s climate create both challenges and opportunities for Canadian consumers. If diminished yields decrease the supply of fruits and vegetables from California, importers from may need to shift to other producers, such as Mexico and China. While diminished quality of produce from California could spur lower prices, Canadian consumers may reject lower-quality projects.
Supply issues: IowaIowa farmers have also begun to experience the impacts of climate change. The 2011 Iowa Farm and Rural Life
Poll, conducted by Iowa State University, revealed that 68% of farmers in the state believe climate change is already occurring. Impacts have included longer growing seasons, wetter spring planting conditions, wetter summers, higher summer humidity, and drier autumn harvest conditions. Iowa farmers are responding at the farm level by planting earlier, using larger machinery to take advantage of short periods of favourable conditions, planting at higher densities, and spraying for pests more frequently.
While these types of autonomous measures can be used to adapt to creeping climate changes, planned adaptation will be necessary to adapt to an increased frequency of extreme events, such as seasonal flooding. In 2008, more than 3.3 million acres of corn and soybeans were flooded across the state, and in 2011, floodwaters from the Missouri river submerged more than a quarter of a million acres for several months.
Climate change has been on the State’s radar since 2007, when Iowa Governor Chet Culver signed Senate File 485, a bill that established a registry for monitoring and reporting of greenhouse gas emissions and mandated the creation of the Iowa Climate Change Advisory Council (ICCAC). The ICCAC includes 23 government-appointed members with a range of expertise as well as four ex-officio members of the General Assembly.
The ICCAC was tasked with submitting a proposal to Governor Culver and the General Assembly that included policies, strategies, and scenarios to reduce greenhouse gas emissions within the state. While the final report of the ICCAC, released in 2008, offered many options for climate change mitigation, it created questions about the unavoidable impacts of climate change and how Iowans can adapt. In 2009, the Iowa Legislature enacted an amendment to Senate File 471: Office of energy independence (Sec. 27, Section 473.7, Code 2009), which offered the following direction for a review of climate change, impacts within the state:

CLIMATE CHANGE ADAPTATION AND CANADA’S CROPS AND FOOD SUPPLY BACKGROUND REPORT
4 8
Conduct a study on activities related to energy production and use which contribute to global climate change in conjunction with institutions under the control of the state board of regents. The study shall take the form of a climate change impacts review, to include the following:
a. Performance of an initial review of available climate change impacts studies relevant to this state.
b. Preparation of a summary of available data on recent changes in relevant climate conditions.
c. Identification of climate change impacts issues which require further research and an estimate of their cost.
d. Identification of important public policy issues relevant to climate change impacts.
The Iowa Climate Impacts Steering Committee (ICISC) was formed to complete this task. In January 2011, the ICISC submitted its report to the Governor and the Iowa General Assembly on the potential impacts of climate change. Climate Change Impacts on Iowa 2010 summarizes the implications for agriculture, biodiversity, public health, economy, infrastructure, and emergency services.
The ICISC relied on a review of published literature for its assessment, and offered few concrete results in its report. It was unable to provide conclusions about the effect of climate change on corn and soybean yields due to interactive effects with management practices and genetics. Higher nighttime temperatures were reported to reduce corn yields by reducing the time for dry matter accumulation. Conflicting studies of greenhouse trials yielded inconsistent results about the effect of carbon dioxide fertilization on greenhouse plants due to higher atmospheric carbon dioxide. Production gains from increased precipitation during summer months were suspected to be offset by losses due to flooding or planting delays earlier in the season as well as shallower root systems and greater pest losses associated with wetter spring condi-tions. With respect to livestock, higher temperatures were reported to reduce milk production in dairy cattle, impair immunological and digestive functions, and increase mortality rates, as well as cause direct mortality during heat waves.
The report highlighted concerns regarding the potential for increased global food prices to create incentives for more intense cultivation of agricultural lands, leading to degradation of soil and water quality. Combined with climatic changes that produce more extreme rainfall, soil erosion and degradation can exacerbate impacts of flooding in agricultural areas.
While Governor Culver was quick to establish the ICISC and the ICCIC, little action has been taken at the state level to adapt the agricultural sector to climate change. Experts from the ICCIC have met with the USDA to attempt to advance adaptation activities, but without a formal plan for adaptation, the agricultural sector in Iowa remains vulnerable.
Supply issues: MexicoMexico’s agricultural sector is highly vulnerable to extreme weather events. The northern region has suffered water
shortages, while the southern region is plagued by tropical storms. Approximately two thirds of the country, located in the northern and central region, is classified as arid and receives little precipitation throughout the year, however, the west-central and Yucatan regions are sub-humid. Under a doubling of current atmospheric greenhouse gas levels, the country is expected to see decreased aquifer recharge and increased desertification, with an increase in the total area of desert land of between 36% and 39%. In the absence of adaptation, output from the grains, livestock, and other agricultural sectors is expected to decline by 11.56%, 13.78%, and 12.23%, respectively. Climate change is projected to result in increased average annual temperatures, reduced precipitation, and increased frequency and severity of extreme weather events. Over the past two decades, the country’s agricultural sector has incurred more than 80% of total eco-nomic losses associated with extreme weather events. During the coming decades, agricultural production is expected to decrease, particularly with respect to livestock production, due to droughts resulting from warmer temperatures.
49
ACT ( A DA P TAT ION TO CL IM AT E CH A NGE T E A M)
The majority of Mexico’s fruit and vegetable production occurs in the northeastern region of the country. Irrigation is widely used in this area. Over the coming decades, this region is projected to become warmer and drier, resulting in decreased water availability and reduced yields.
Corn crops occupy approximately 50% of Mexico’s agricultural land area, and are highly vulnerable to changes in weather and climate. In a changing climate, the total area of corn crops is expected to shrink by up to 4.2%. Where growing conditions become unsuitable for corn, farmers may shift cultivation to other crops, such as wheat or oats. Drought and disease are expected to cause further losses of productive agricultural pastureland (6% decrease by 2020 and 13.2% decrease by 2050, relative to 2002 land area) in northern and central Mexico.
The genetic diversity that characterizes Mexico’s more than 59 maize landraces, or regional varieties, may help the nation’s agricultural producers adapt to an increasing temperature trend. Each landrace is adapted to the regional climate in which it was developed. As average annual temperatures rise, some landraces are expected to thrive while others fail. The diversity of landraces available to farmers may reduce the need for development of new maize varieties to adapt to climate change; an advantage that could reduce the cost of adaptation for the agricultural sector and reduce vulnerability of farmers, livestock producers, and consumers. However, the total area available for growing maize is expected to shrink by 15% by 2030, and 30% by 2050, putting downward pressure on total production.
Mexico is the only developing country to have submitted three national communications to the UNFCCC asserting national government commitment to addressing climate change across all economic sectors. President Felipe Calderón was even granted the United Nations Flagship Environment award for policy Leadership for his commitment to lead international efforts on climate change.
The National Climate Change Strategy was first released in 2007, and addresses measures for adaptation at the local level across all economic sectors, including agriculture. In 2008, a Special Program on Climate Change was implemented to develop priority actions and identify sources of funding.
The Agricultural Sector Program 2007-2012 asserts the important of specific actions to combat climate change and describes initiatives to facilitate adaptation, including targeted research, gene banks, seed reserves, and conservation corridors and areas.
The National Water Program 2007-2012 focuses specifically on water-related issues and proposes adaptation measures, such as increased water efficiency in the agricultural sector and integrated, sustainable water management.
The Inter-Ministerial Commission on Climate Change was assembled in 2005 to provide support integration of cli-mate change and development policy with existing sectoral programs. The Commission hosts several working groups, including the Working Group on Adaptation, which serves to incorporate adaptation activities at the sectoral, regional, and national levels.
Failure to adapt to climate change has been projected to lead to considerable economic costs over the long run, despite short-term gains in some sectors. Costs are projected to increase over the coming century, particularly in the agricultural and water sectors, and losses to non-market assets such as ecosystem services are expected. The Mexican Government has accepted the results of the study and committed to addressing risks and seizing opportunities in the areas of growth and development. However, the country’s relatively low wealth may present a challenge to capital-intensive adaptation projects.
CLIMATE CHANGE ADAPTATION AND CANADA’S CROPS AND FOOD SUPPLY BACKGROUND REPORT
50
8. CLIMATE CHANGE ADAPTATION IMPLICATIONS FOR FOOD SECURITY
Ngaio Hotte, agricultural and resource economist, ACT
The 1996 World Food Summit established that food security exists “when all people at all times have access to sufficient, safe, nutritious food to maintain a healthy and active life.” Food security encompasses four dimensions: food availability, food accessibility, food utilization, and food systems stability. The interactions between these dimensions are shaped by the existing food system, described as follows by Global Environmental Change and Food Systems (GECAFS):
Food systems encompass (i) activities related to the production, processing, distribution, preparation and con-sumption of food; and (ii) the outcomes of these activities contributing to food security (food availability, with elements related to production, distribution and exchange; food access, with elements related to affordability, allocation and preference; and food use, with elements related to nutritional value, social value and food safety). The outcomes also contribute to environmental and other securities (e.g. income). Interactions between and within biogeophysical and human environments influence both the activities and the outcomes.”
Activities conducted within the food system include agricultural production, processing, distribution, sales, and con-sumption. These activities are conducted through agri-food supply chains, which represent the physical paths taken by agricultural products from the farm to the consumer. Supply chains are distinct from but related to value chains, which are driven by economics, and which in turn influences the shape and complexity of supply chains.
All activities within the food system influence socio-economic and environmental factors, such as employment, revenue, and environmental quality, which affect food security. But food security also affects socio-economic and environmental outcomes, as illustrated in Figure 2
Figure 2. Interactions between activities and outcomes associated with the food system (GECAFS, no date).
While the majority of Canadians are fortunate to maintain a food secure status from day-to-day, United Nations envoy Olivier De Schutter, Special Rapporteur on the Right to Food made the following comments after completing an investigation in Canada Trade during May 2012:
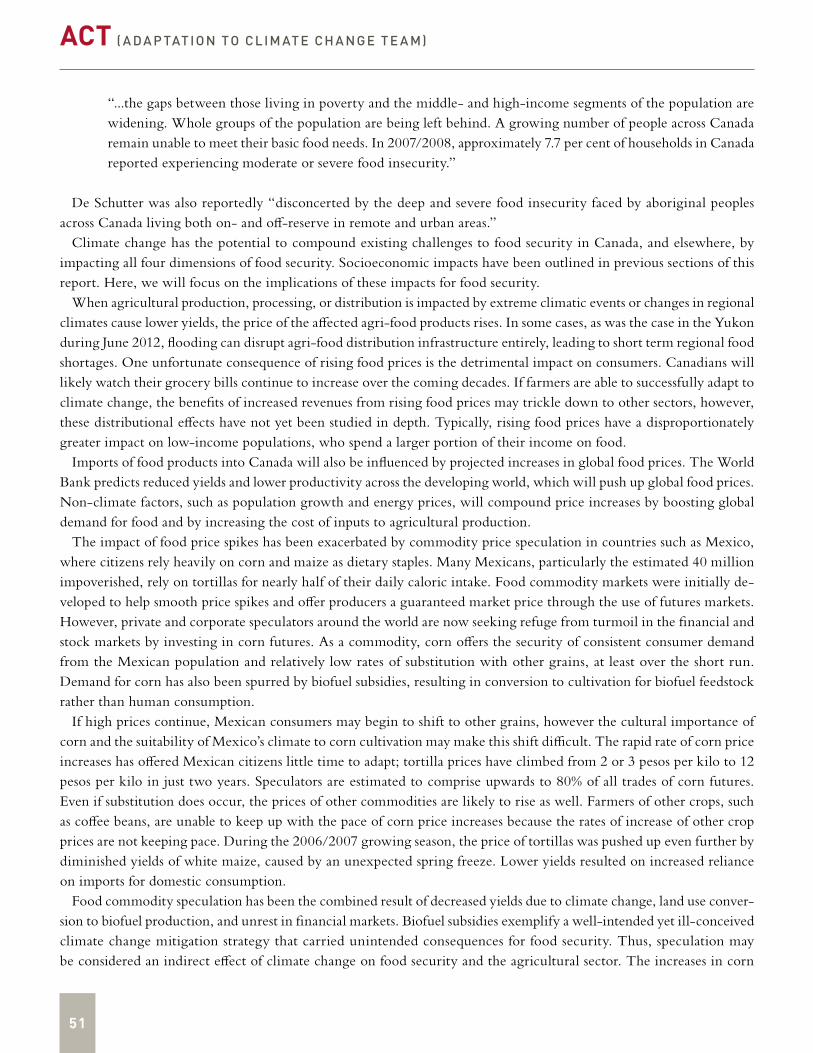
51
ACT ( A DA P TAT ION TO CL IM AT E CH A NGE T E A M)
“...the gaps between those living in poverty and the middle- and high-income segments of the population are widening. Whole groups of the population are being left behind. A growing number of people across Canada remain unable to meet their basic food needs. In 2007/2008, approximately 7.7 per cent of households in Canada reported experiencing moderate or severe food insecurity.”
De Schutter was also reportedly “disconcerted by the deep and severe food insecurity faced by aboriginal peoples across Canada living both on- and off-reserve in remote and urban areas.”
Climate change has the potential to compound existing challenges to food security in Canada, and elsewhere, by impacting all four dimensions of food security. Socioeconomic impacts have been outlined in previous sections of this report. Here, we will focus on the implications of these impacts for food security.
When agricultural production, processing, or distribution is impacted by extreme climatic events or changes in regional climates cause lower yields, the price of the affected agri-food products rises. In some cases, as was the case in the Yukon during June 2012, flooding can disrupt agri-food distribution infrastructure entirely, leading to short term regional food shortages. One unfortunate consequence of rising food prices is the detrimental impact on consumers. Canadians will likely watch their grocery bills continue to increase over the coming decades. If farmers are able to successfully adapt to climate change, the benefits of increased revenues from rising food prices may trickle down to other sectors, however, these distributional effects have not yet been studied in depth. Typically, rising food prices have a disproportionately greater impact on low-income populations, who spend a larger portion of their income on food.
Imports of food products into Canada will also be influenced by projected increases in global food prices. The World Bank predicts reduced yields and lower productivity across the developing world, which will push up global food prices. Non-climate factors, such as population growth and energy prices, will compound price increases by boosting global demand for food and by increasing the cost of inputs to agricultural production.
The impact of food price spikes has been exacerbated by commodity price speculation in countries such as Mexico, where citizens rely heavily on corn and maize as dietary staples. Many Mexicans, particularly the estimated 40 million impoverished, rely on tortillas for nearly half of their daily caloric intake. Food commodity markets were initially de-veloped to help smooth price spikes and offer producers a guaranteed market price through the use of futures markets. However, private and corporate speculators around the world are now seeking refuge from turmoil in the financial and stock markets by investing in corn futures. As a commodity, corn offers the security of consistent consumer demand from the Mexican population and relatively low rates of substitution with other grains, at least over the short run. Demand for corn has also been spurred by biofuel subsidies, resulting in conversion to cultivation for biofuel feedstock rather than human consumption.
If high prices continue, Mexican consumers may begin to shift to other grains, however the cultural importance of corn and the suitability of Mexico’s climate to corn cultivation may make this shift difficult. The rapid rate of corn price increases has offered Mexican citizens little time to adapt; tortilla prices have climbed from 2 or 3 pesos per kilo to 12 pesos per kilo in just two years. Speculators are estimated to comprise upwards to 80% of all trades of corn futures. Even if substitution does occur, the prices of other commodities are likely to rise as well. Farmers of other crops, such as coffee beans, are unable to keep up with the pace of corn price increases because the rates of increase of other crop prices are not keeping pace. During the 2006/2007 growing season, the price of tortillas was pushed up even further by diminished yields of white maize, caused by an unexpected spring freeze. Lower yields resulted on increased reliance on imports for domestic consumption.
Food commodity speculation has been the combined result of decreased yields due to climate change, land use conver-sion to biofuel production, and unrest in financial markets. Biofuel subsidies exemplify a well-intended yet ill-conceived climate change mitigation strategy that carried unintended consequences for food security. Thus, speculation may be considered an indirect effect of climate change on food security and the agricultural sector. The increases in corn
CLIMATE CHANGE ADAPTATION AND CANADA’S CROPS AND FOOD SUPPLY BACKGROUND REPORT
52
prices that occurred in Mexico and around the world also affected the prices of substitute food goods, such as rice. As consumers looked for lower-cost options to feed themselves and their families, demand for rice also increased, pushing up rice prices, although the effect on rice prices was less dramatic.
Due to the effects of globalized production, the future of agriculture worldwide is a key determinant of the effects on consumption in Canada. Climate and production conditions in other countries could dampen the effect of decreased production and increased price of fruit and vegetable imports from California and Mexico if energy costs for transpor-tation remain low.
If Canada’s agricultural sector is able to adapt to climate change and reduce negative impacts on yields and the quality of food produced, the nation may emerge as a more prominent supplier of high-quality grains and produce for domestic consumption and international trade. Food price increases have the potential to increase producer revenues and increase profitability if successful adaptation can prevent production costs from rising and eclipsing these increases. Estimating the cost of adaptation is a complex issue that will require projections of provincial and global economic growth; demographic shifts; structural, social, and climate changes; and government investment. Over the coming half-century, producers will continue to need to respond to other dynamics in addition to climate change, such as production costs, government policies, interest rates, technological development, competition, and tourism, which can alter their vulnerability to climate creep and extreme events.
One key message is clear: increasing the productivity of Canadian agriculture, protecting the industry from the im-pacts of climate change, and supporting growth of the nation’s agricultural sector can increase production for domestic consumption and international trade.
The UK Government has already started down a path toward integrated planning for agriculture, health, and the environment to decrease future risks to food security over the coming decades. In 2008, the UK Cabinet Office Strategy Unit published Food Matters: Towards a Strategy for the 21st Century. The document addressed the recent spikes in food prices and the effects on consumers, issues of diet-related obesity, and the environmental and climate impacts of foods. It also outlined several detailed recommendations and offices responsible, with timelines for completion.
One product of Food Matters was Food 2030, a strategy to implement a new approach to the agri-food system, pub-lished by the Department for Environment, Food and Rural Affairs. The strategy commits to increased coordination across government on all policies related to food, new partnerships with farmers, consumers, and organizations, and investment in research and innovation. Goals established for 2030 include the following:
• Enabling and encouraging people to eat a healthy, sustainable diet.• Ensuring a resilient, profitable and competitive food system.• Increasing food production sustainably.• Reducing the food system’s greenhouse gas emissions.• Reducing, reusing, and reprocessing waste.• Increasing the impact of skills, knowledge, research, and technology.
The Canadian Agricultural Policy Institute (CAPI) publication Canada’s Agri-Food Destination - A New Strategic Approach (2011) demonstrates efforts to integrate similar considerations into the future of the Canadian agri-food sector. The plan lists several drivers for change, including chronic unprofitability of the sector, a national shift toward greater imports and diminished exports, unsustainable health care costs, and environmental stresses such as climate change. Among the recommendations are longer sectoral planning horizons of up to 15 years, specific planning targets, greater emphasis on agri-food systems planning rather than fragmented segments or value chains, and integrated agri-food,
health, and environment policies.
53
ACT ( A DA P TAT ION TO CL IM AT E CH A NGE T E A M)
9. CHALLENGES TO CLIMATE CHANGE ADAPTATION IN THE AGRICULTURE
AND AGRI-FOOD SECTORNgaio Hotte, agricultural and resource economist, ACT
When mitigating any risk, decision-makers must wrestle with a degree of uncertainty. Indeed, if all risks were 100% known, policy development would be irrelevant. There is no government policy in Canada against putting one’s finger in an electrical socket, jumping off the roof of a building, or flooding one’s own home, because the risks are 100% known to the actor. Yet, there is a policy instrument, in the form of legislation, that we must wear seatbelts inside a moving vehicle, and even wear a bicycle helmet while cycling in some jurisdictions, because the risks may be uncertain to individuals but are deemed socially unacceptable by regulators. Policies are used to manage risk by limiting it to a level deemed acceptable in the broader interests of personal and public well-being.
The nature of climate change presents a number of unique challenges to policy-makers that must be considered when developing adaptation policies. These challenges include the following:
• Climate change occurs slowly• Effects are uncertain• Effects are small relative to variability • Effects are spatially heterogeneous• Future emission levels are unknown• Effects are interactive• Change occurs slowly
The speed with which climate change occurs over the lifetime of individuals presents both risks and opportun-ities. Since the effects of climate change will continue to be experienced over the next fifty years and beyond, some policy-makers might argue that they have the benefit of time to develop and implement adaptive policies. Unfortunately, this characteristic can also have the effect of reducing the urgency of the issue, enabling the issue to be placed on the back burner while more immediate issues are addressed, and putting agriculture and agri-food supply chains at greater risk than may be tolerable.
Effects are uncertainUncertainty associated with the exact effects of climate change in a given region is compounded by other uncertainties
about the future, including the future of the B.C., Canada, and U.S. economies, the rate of renewable energy technology development, the rate of global emissions of greenhouse gases, and the state of climate policies. Choosing a particular course of adaptive action is difficult in the light of so much uncertainty, as uncertainty affects the perceived benefits and costs of adaptive activities and technologies on the part of both farmers and the government. As such, climate change adaptation policies should focus on building resilience to a variety of scenarios using scalable and triple loop synergistic strategies, rather than attempting to develop a course of action based on unpredictable too low or too high outcomes.
Effects are small relative to variabilityRegional climates vary greatly both between and within years; a fact that has further confused scientists, farmers,
and government policy-makers. Teasing apart normal climate variations from the effects of climate change has been
CLIMATE CHANGE ADAPTATION AND CANADA’S CROPS AND FOOD SUPPLY BACKGROUND REPORT
5 4
challenging and confronted with skepticism. Adapting to climate change will take time, with attention starting with current and ongoing vulnerabilities and risks, such as flooding and water supply shortages through to longer-term strategies to take advantage of beneficial trends where these exist.
Effects are spatially heterogeneousVast spatial differences exist in the effects of climate change. For example, one geographic region may receive increased
rainfall, while another nearby region experiences prolonged drought. Adaptation policies must be strong and localized enough to be effective.
Future emission levels are unknownSince future global levels of greenhouse gas emissions are unknown, it is difficult to predict the effects of climate
change using even the most accurate models available. Climate impact modeling is currently conducted using multiple scenarios: emission levels are reduced to meet climate targets, emission levels are maintained according to the status quo, or emissions increase with population growth and follow a predicted trajectory of economic development. Each of these scenarios produces a vastly different picture of the effects of climate change in the future, and it is currently impossible to determine which of these is most accurate. Climate change induced extreme weather impacts are clearly with us, and lack of action on reducing GHG emissions prompts high priority attention to physical protection and business continuance systems.
Effects are interactiveThe interactive nature of climate change further complicates efforts to predict effects. For example, with respect to
agriculture, increasing atmospheric carbon dioxide levels may in fact stimulate plant growth. The threshold at which increasing carbon dioxide levels may begin to hinder plant growth remains uncertain, but an increase in plant growth would lead to more rapid uptake of ground and surface water by field crops. The net effect on water availability when increased plant growth is combined with changing precipitation levels and timing is even more difficult to forecast. Worst through best-case scenarios will be needed to inform decision-making.
Managing uncertaintyAll of these challenges limit the usefulness of cost-benefit analysis when evaluating different policy options, because
they create difficulty when estimating future benefits of adaptive activities. Traditional cost-benefit analyses may be supplanted with alternative methods that account for non-market benefits of adaptation. A comprehensive adaptation policy must account for all of these characteristics and remain flexible to accommodate long time frames and uncertain effects.
There are four approaches to managing the uncertainty created by these challenges: no-regrets strategies, reversible strategies, safety margin strategies, and soft strategies.
No-regrets options generate benefits to society as a whole even in the event that the effects of climate change are not as severe and negative as predicted. For example, a policy to invest in research examining drought-resistant plant var-ieties could be considered a no-regrets policy, because increased drought resistance is unlikely to have a negative effect on crop performance. It is important to note that, what may be a no-regrets strategy in one region is not necessarily a no-regrets option in another region. Conversely, “climate-justified” policies include those that are only functional in a changing climate. But while no-regrets options are attractive, they represent the low-hanging fruit on the policy tree; many riskier policies also have the potential to generate significant positive effects in a changing climate.
Reversible strategies are those that offer the implementer a “way out” of their planned course of action if climate change does not unfold in the way that it was anticipated. This could include development of seawalls that have an
55
ACT ( A DA P TAT ION TO CL IM AT E CH A NGE T E A M)
option for rapid, low-cost additional vertical development. Land use plans can incorporate reversible options to allow development on floodplain areas if flood frequency and severity do not increase as projected by a climate model. A decision to restrict development in an area may be reversed, while a decision to permit development is more difficult to remedy. The reversibility of an action may also be referred to as its “option value.”
Unlike no regrets options, which yield benefits regardless of the direction of climate change, safety margin strategies create no added benefit if climate change does not occur as predicted but offer reduced vulnerability to climate change at little or no cost. An example of a safety margin strategy is development of stormwater management systems using exaggerated estimates of runoff flow volumes. Where increasing stormwater management infrastructure capacity does not contribute significantly to project development and maintenance costs, this approach could reduce vulnerability to future extreme events. The availability of low-cost safety margin options is of particular importance where reversible or flexible options are unavailable.
Soft strategies are non-technical options, such as financial incentives or institutional changes, which can be imple-mented to reduce vulnerability to climate change. A requirement to integrate climate change adaptation planning into Regional Growth Strategies and Official Community Plans within British Columbia would constitute a soft strategy. The B.C. Drought Response Plan and weather index insurance programs for agricultural producers are also examples of soft strategies. Soft strategies benefit from their reversible nature, although some programs and policies require longer phase-out periods, and even soft strategies result in development of “hard” or tangible projects.
CLIMATE CHANGE ADAPTATION AND CANADA’S CROPS AND FOOD SUPPLY BACKGROUND REPORT
56
10. PLANNING FOR CLIMATE CHANGE ADAPTATION IN AGRICULTURE: DRAWING ON
EXPERIENCENgaio Hotte, agricultural and resource economist, ACT
Erik Karlsen, co-lead policy author, ACT
Comprehensive climate change assessment, adaptation and disaster risk reduction strategies are fundamental starting points for the preparing for climate change actions. Given what’s at risk-food and, as will be discussed later, water security-starting with narrower linear, policy and program focused approaches will result in plans and practices that could omit consideration of critical factors, make costly assumptions, and lead to damaging trade-offs. Unlike local governments which have learned the hard lessons of narrowly focused sector planning and management systems and replaced these with strategic approaches, federal, provincial and territorial orders of government in Canada are still highly “siloed” in their approaches to environmental, social and economic well-being. Over the years the federal level has ventured into more integrated approaches, for example work that led to the establishment of the Okanagan Basin Management Board and Fraser Basin Council in BC, Environment Canada’s Ecosystem Initiatives across Canada, and more recently the Climate Change Adaptation Collaboratives in Canada’s major regions which with brought together multiple groups, agencies, and non-government stakeholders to address issues that spanned their interests rather than divided them.
While the needs of each jurisdiction or sector seeking to develop adaptation strategies, plans and policies vary widely; the considerations that must be addressed during the planning process remain similar. For example, in the United States, the Interagency Climate Change Adaptation Task Force (2010), co-chaired by the Council on Environmental Quality (CEQ), the National Oceanic and Atmospheric Administration (NOAA), and the Office of Science and Technology Policy (OSTP), recommends that any process that seeks to integrate climate change adaptation into ongoing activities focus on the following goals:
Adopt Integrated Approaches: Adaptation should be incorporated into core policies, planning, practices, and programs whenever possible.
Prioritize the Most Vulnerable: Adaptation plans should prioritize helping people, places and infrastructure that are most vulnerable to climate impacts and be designed and implemented with meaningful involvement from all parts of society.
Use Best-Available Science: Adaptation should be grounded in the best-available scientific understanding of climate change risks, impacts, and vulnerabilities.
Build Strong Partnerships: Adaptation requires coordination across multiple sectors and scales and should build on the existing efforts and knowledge of a wide range of public and private stakeholders.
Apply Risk-Management Methods and Tools: Adaptation planning should incorporate risk-management meth-ods and tools to help identify, assess, and prioritize options to reduce vulnerability to potential environmental, social, and economic implications of climate change.
57
ACT ( A DA P TAT ION TO CL IM AT E CH A NGE T E A M)
Apply Ecosystem-based Approaches: Adaptation should, where relevant, take into account strategies to increase ecosystem resilience and protect critical ecosystem services on which humans depend to reduce vulnerability of human and natural systems to climate change.
Maximize Mutual Benefits: Adaptation should, where possible, use strategies that complement or directly support other related climate or environmental initiatives, such as efforts to improve disaster preparedness, promote sustainable resource management, and reduce greenhouse gas emissions including the development of cost-effective technologies.
Continuously Evaluate Performance: Adaptation plans should include measureable goals and performance metrics to continuously assess whether adaptive actions are achieving desired outcomes.
To help policymakers navigate through the process of planning and policy development, The Center for Climate Strategies (CCS, 2011) created a guidance document with a stepwise process for adaptation. The ten-step process outlined in the CCS Climate Adaptation Planning Process includes the following:
1. Initiation – Bring together stakeholders and technical experts, identify and frame key climate change risks and adaptation needs, and identify available information and data gaps. Establish an Executive Order, outlining goals and objectives for the process.
2. Organize resources – Establish committees and technical working groups, set a schedule to completion, and allocate a budget.
3. Categorization - Group vulnerabilities by major topic area, analyze relevant existing policies, identify alternative policies, and outline adaptation options.
4. Prioritize – Establish priorities using risk analysis and established decision criteria rather than a detailed vul-nerability assessment.
5. Compare – Use a systematic process to compare several adaptation options based on aspects such as costs and benefits, co-benefits, feasibility, urgency.
6. Detailed evaluation – Identify attributes of adaptation options, including externalities, distributional and equity effects, and feasibility issues and address uncertainty.
7. Assess related consequences and impacts – Identify potential direct and indirect impacts of adaptation options.8. Analyze socio-economic and environmental impacts – Aggregate impacts of all adaptation options and compile
a report of the findings.9. Develop recommendations – Recommend potential policy and adaptation options.10. Launch adaptation plan.
The adaptation options referred to in the CCS Climate Adaptation Planning Process can include a variety of policy tools used by governments to achieve progress toward adaptation. These policy tools can be analyzed and compared using the framework provided by CCS.
The following sections describe the suite of policy tools available to governments as well as the economic analysis tools that can be employed to compare their expected results over time.
CLIMATE CHANGE ADAPTATION AND CANADA’S CROPS AND FOOD SUPPLY BACKGROUND REPORT
58
10.1 POLICY TOOLS
To translate policies into action, seven broad categories of policy tools can be implemented. A comprehensive climate change adaptation policy will employ several of these options, but regional differences in areas of focus may occur. Categories of policy tools are as follows:
Planning
• Regulations, standards & taxation• Research & development• Education and extension• Market-based incentives• Infrastructure investment• Producer support• Planning
Planning approaches to adaptation involve charting a course of action, including flexible mechanisms that can be broadly applied in the face of multiple effects of climate change. Adaptation plans can build resilience and employ a phased approach to address short-term, medium-term, and long-term changes in the climate over time. Typically, strong government support is needed, with active participation and input from within lead and partner agencies of federal and provincial/territorial governments and other governments, where applicable, to ensure a comprehensive approach. The 2010 British Columbia Drought Response Plan is an example of a planning policy tool.
Planning requires a strong foundation of data to inform the process. Gathering information, monitoring effects, and assessing risks on an ongoing basis are necessary components of the planning process.
A global leader in climate change adaptation, the Australian Government, identified the need to build and share knowledge among decision-makers at both the national and regional levels as a first step in its Adaptation Framework. The multidisciplinary National Climate Change Adaptation Research Facility, established in 2007 at Griffith University in Queensland, serves as a national research centre and repository for information, and provides regional decision-makers with tools and information. Vulnerability assessments were coordinated through the Centre to identify critical sectors and regions, collect additional information, and identify barriers and involved collaboration between multiple levels of government. A National Climate Change Forum on Adaptation Priorities was coordinated in 2010 as a venue for discussion between local, state, and federal decision-makers to identify a number of coastal adaptation issues including planning frameworks, disaster management and construction standards. Individual climate change adaptation plans have now been developed for vulnerable aspects and regions such as biodiversity and coastal regions.
A planning approach has also been recommended for managing the future of water resources in the province of Ontario. The Expert Panel on Climate Change Adaptation (2009) recommended developing a water conservation and efficiency strategy and strengthening regulations governing inter-basin water transfer as part of a provincial climate change adaptation strategy.
Standards, guidelines, regulations, and legislationUpdating standards, guidelines, regulations, and legislation to reflect government priorities and current climate
change modeling provides a top-down approach to adaptation. For example, municipal standards such as those guiding stormwater engineering and management could be updated to accommodate projected river flows.
59
ACT ( A DA P TAT ION TO CL IM AT E CH A NGE T E A M)
Existing standards may be amended to reflect the shifting risk profile of the agricultural sector. Acceptable risk levels may be updated for flood protection structures based on expected future frequency and magnitude of natural events. More complex is the identification and modification of existing standards that are indirectly maladaptive, because of their effect on intermediate factors. For example, property tax regulations may encourage maladaptive behavior through the existing tax rate structure. Procedural standards are also needed to supplement technical standards by incorporating climate change adaptation into decision-making. Where existing regulations and guidelines do not exist, these could be developed to mandate improvements in infrastructure and activities to adapt to climate change.
The municipality of London, Ontario, is currently working to address increased seasonal river flows associated with climate change through infrastructure design standards. Through partnership with researchers from the University of Western Ontario, the City of London has identified how climate change will affect the historical rainfall Intensity, Duration, and Frequency (IDF) curves that are used to design stormwater management systems. Use of the new curves as a stormwater design standard is being incorporated into the City’s forthcoming Stormwater Management Strategy and Climate Change Adaptation Strategy, to be released in 2013.
Research and developmentPublic and private investment in research and development (R&D) of adaptive technologies and management practices
can offer farmers new options for managing both extreme events and creeping climate change. For example, R&D of drought-resistant or water-efficient plant species may provide farmers with more options for longer-term adaptation. One potential drawback of these types of R&D policy tools is the length of time required for results; new commercial plant varieties may not become available for 10 to 20 years. New applications of existing plant species and varieties may develop more quickly, in approximately 10 years. Due to the relatively slow progression of climate change and high rate of successful development and commercialization of both new varieties and applications of existing varieties, R&D may be a low-risk policy option with viable returns.
Research and development has formed the backbone of the Ontario government’s adaptation plan for agriculture. The Ontario Ministry of Agriculture, Food, and Rural Affairs (OMAFRA) has committed to a research partnership with the University of Guelph until 2018 under the Productive Systems Research Theme. Research will focus on sustainable, profitable agricultural production in both the plant and livestock sectors under changing climatic conditions. Specific topics include genetic improvement, precision farming, pest management, biosecurity, and adaptive research.
Education and extensionProviding information to farmers and decision-makers can foster adaptation by offering the support they require to
make good decisions for the future. Extension programs provide information about management options and beneficial practices to farmers on an individual or small-group basis. Priorities for extension programs must be identified and assessed on a cost-benefit basis. Extension requires building the confidence and trust of the farmers, and the information must lead to a change in behaviour in order to be effective. Since site characteristics are highly varied, success may be limited by extension agents’ lack of familiarity with individual farms. Additionally, longer-term climate change adaptation measures may conflict with more immediate practices to manage climate variation. Pre-emptive action may not prove valuable to the farmer in the near term.
One role for extension could be to provide information about new crops, varieties, or farming practices. These types of programs have been implemented in a number of drought-stricken regions to reduce crop water requirements. Once information is provided by the public sector, individuals in the private sector can make decisions and implement tech-nologies where opportunities for private benefits are apparent.
CLIMATE CHANGE ADAPTATION AND CANADA’S CROPS AND FOOD SUPPLY BACKGROUND REPORT
60
Similarly, information can be provided to local governments and non-government organizations to inform manage-ment decisions at the regional level. Local groups can use this information to determine the most appropriate solutions for their communities to support a bottom-up approach to adaptation.
Market-based programsMarket-based programs such as insurance, water markets, and payment for ecosystem services (PES) programs can
offer flexible mechanisms for managing resources under changing conditions because they effectively convey signals of scarcity. While climate change adaptation is not always the focus of these programs, they can be applied to achieve multiple environmental and social goals.
Agricultural insurance, discussed in detail in Insurance as a Tool for Adaptation, is an example of a market-based program that can create an incentive for adaptation while protecting farmers from financial risks associated with extreme events.
Water markets have emerged as a tool to encourage efficient freshwater use and conservation in agricultural regions. Water markets may establish initial rates for use that rise or fall based on water use and availability. This creates incen-tives to conserve water when water resources are scarce. These types of market are said to be resilient, because they function efficiently under a variety of conditions. Water markets have received particular attention in drought-prone and drought-stricken areas in the past decade. Australia, for example, has been working to establish water markets in high-risk watersheds since the 1980s.
Other market-based incentive programs can be implemented to provide public funding to farmers in exchange for conserving and improving public goods, such as ecosystem services; the suite of goods and functions that are offered by the environment, including water purification, carbon storage, flood control, and biodiversity. Because farmers are often involved in managing very large areas of land, they have the opportunity to conserve or even improve the condition of agricultural ecosystems and the goods and services they provide. However, changes to farm management practices may require additional time, effort, or resources on the part of the farmer. They may even require farmers to retire portions of their land, such as those in wetland or riparian areas, which could decrease farm revenues. Market-based incentive programs are designed to compensate farmers for on-farm economic losses sustained while contributing benefits to society as a whole. An assessment of costs and benefits is typically conducted prior to implementation to evaluate whether the benefits to social well-being and avoided losses outweigh the costs of program administration.
Infrastructure investmentClimate change risks to infrastructure merit particular attention where they relate to drought and flood management,
water storage, transport and irrigation, and goods transport. In regions where water is forecast to become scarce, water storage, extraction and distribution planning will need to become more robust. Additional investment in water-related infrastructure will need to be justified by increased scarcity and perceived value of water. In areas where precipitation is forecast to increase, planning will need to focus on water storage during peak rainfall events.
Climate change will not only affect what farmers can grow and where, but also how food gets to market. Maintaining efficient supply chains for agricultural products will require consideration of vulnerable aspects of the supply chain and building resilience where possible. The individuals and firms that make up supply chains are inter-dependent and must operate under multiple constraints and risks, including food safety, plant or livestock diseases, commodity price volatility, and climate change.
Infrastructure investment is closely linked with planning, as well as standards and guidelines. Indeed, each of these policy tools cannot operate exclusively of the others. A combined approach, where multiple policy tools are combined, is likely to offer the most robust approach to adaptation.
61
ACT ( A DA P TAT ION TO CL IM AT E CH A NGE T E A M)
10.2 ECONOMIC ANALYSIS TOOLS
In order to maximize the profitability of the agricultural sector, it is necessary to minimize losses due to extreme weather events or periods and ensure economically optimal production. Compared to business-as-usual, adaptation offers policy-makers and farmers the benefit of improved productivity under changing climatic conditions, but to adapt requires full information about the options available and the associated costs and benefits as well as climate projections.
The decision to adapt to future conditions is tantamount to an investment; present costs incurred are expected to yield future returns. Sustainability-related investments, such as those in adaptation policies or projects, require evaluation of both market and non-market costs and benefits. Market costs and benefits are more easily quantified than non-market effects, because their values can be observed through purchases and sales in traditional markets.
When evaluating the cost of adaptation projects, economists assess both the up-front costs as well as maintenance costs over the lifespan of the project. The up-front costs can be further divided into capital costs of the project and “opportunity costs”, the cost associated with locking funds into the project rather than investing them elsewhere.
Un-captured non-market effects of a project, investment, or activity are benefits or costs that are enjoyed or incurred by a stakeholder group without the individual or group that generated them receiving remuneration or compensation. These effects are referred to as “positive externalities” when they create benefits and “negative externalities” when they create costs. For example, a government-funded adaptation project that reduces flooding of agricultural land by restoring an upstream wetland for seasonal water storage generates a positive externality by creating additional fish-spawning and wildlife habitat, producing new opportunities for recreation, and increasing biodiversity. The scarcity value of clean, fresh water is one non-market value that is frequently overlooked.
Failing to account for externalities in economic modeling and estimates tends to under- or over-value a project and lead to “market failure”, the inability of the market to efficiently allocate resources. Adaptation projects have the potential to create numerous positive externalities that may not be accounted for using traditional economic analysis, which commonly focuses on market-valued costs and benefits. Additionally, the value of ecosystem services provided to the agricultural sector by the environment is likely to change as a result of shifts in climate. For example, loss of biodiversity due to warmer weather and a decrease in predator species for invasive pests may compound the issue of crop loss due to climate change. Although the dataset for these types of impacts is far from complete, attempts should be made to characterize these changes when examining the impacts of climate change on agriculture and associated costs.
The sum of total market and non-market benefits is the Total Economic Value (TEV) of a project, while the sum of total market and non-market costs to implement and maintain a project is the Total Economic Cost (TEC). Since the benefits of long-lived adaptation projects are accrued far into the future, the difference between these two values in present terms is the Net Present Value (NPV).
When evaluating investments, a discount rate is applied to the value of future benefits based on the expected value of future income and consumption. Based on the rate of inflation and anticipated increases in income over time, future generations are expected to value a given amount of money less than their relatives that are alive today. The exact discount rate applied to a model is highly contended between economists. If a high discount rate is applied, the balance of the analysis will indicate higher costs of mitigation relative to benefits.
Traditional economic methods of discounting may be inadequate for projects with long life cycles, so undiscounted values should also be considered in decision-making. Stern (2005) identified a flaw in the use of conventional discounting practices when applied to climate change: discounting is appropriate only when marginal effects are similar for both scenarios. In this context, marginal effects are the incremental changes in income or GDP over time. A discount rate should only be applied to the present value of future investments when expected income or GDP will be similar in both the Business-as-Usual (i.e. status quo) and adaptation cases. In the short-run scenario, before the onset of significant effects of climate change, marginal effects may remain similar between these two possible paths, in which case a discount
CLIMATE CHANGE ADAPTATION AND CANADA’S CROPS AND FOOD SUPPLY BACKGROUND REPORT
62
rate may be appropriate. Stern developed several possible discount rates that can be applied to reflect the perceived value of future generations’ consumption compared to society’s current level of consumption. The discount rate incorporates an ethical judgment based on whether future generations deserve to enjoy the current level of consumption, or another higher or lower level of consumption. Stern proposes that growing uncertainty about future conditions as new infor-mation reduces our confidence that climate will remain the same serves to decrease the discount rate.
All investments involve trade-offs, and the government’s role is to maximize the well-being of citizens while mini-mizing negative impacts. The trouble is that, while climate change adaptation policies and projects have the potential to reduce the costs of future damage and create positive externalities, they also have low potential to generate revenue; a measure which causes them to appear politically unpalatable. Governments focus on making decisions that minimize costs when investing in projects that have low potential revenue generation. Mitigating or adapting to climate change will require investment in the short-term, but is intended to decrease costs and even provide economic benefits for the sector in the longer-term. This requires full life-cycle assessment of costs and benefits, or avoided costs, over the long run to obtain an estimate of true net financial performance of an investment in adaptation. Sustainable investments commonly require a large initial capital investment but have a longer life cycle, such that benefits are cumulative over several years or decades.
The economics of climate change adaptation are somewhat different than that of mitigation, since mitigation re-quires a change in operations in order to prevent future climate change. Adaptation, on the other hand, can be viewed as incorporating new information into current and future production and policy decisions. Since the climate can be considered a public good, because valued aspects such as growing conditions cannot be owned exclusively by any one party, the benefits of mitigation cannot be restricted to free-riders who do not take action to mitigate greenhouse gas emissions, while the benefits of adaptation are private or “club” (i.e. small group) goods that will be enjoyed primarily by one or a small group of individuals who take action.
Economic theory indicates that private or club goods should be managed by individuals, rather than governments, except in the case where the following caveats apply:
• There is a lack of available information;• There are barriers to collective action at the local or regional level;• Existing decision-making structures do not adequately account for long-term benefits or consequences;• Externalities exist, major infrastructure that is provided in the public interest will be impacted;• Present standards and regulations are inadequate to influence efficient outcomes; or • Poverty and budget constraints limit the ability of individuals to act.
If one or more of these caveats apply, either private markets will fail to assign adequate value to adaptation or the ability of individuals to adapt independently will be limited. The issue of climate change touches on most, if not all of these caveats, resulting in the need for government intervention despite private or club benefits.
The economic study of climate change adaptation is in its infancy, but several attempts to quantify the costs and benefits of mitigation have been published over the past decade. Integrated Assessment Models (IAMs) have been utilized in the study of mitigation with varying results. Some of these models, including the Dynamic Integrated Climate-Economy (DICE) model proposed by William Nordhaus, appeared to indicate that emissions should actually be allowed to rise in the coming decades, because they are too costly compared to projected benefits. However, models are constructed to operate using several assumptions regarding the discount rate on future benefits and the potential economic benefits of climate change, and can yield unreliable results if incorrect or incomplete assumptions are used.
Economists Frank Ackerman and Ian Finlayson, from the Stockholm Environment Institute and the Massachusetts Executive Office of Energy, respectively, also noted that the DICE model included a considerable benefit due to the
63
ACT ( A DA P TAT ION TO CL IM AT E CH A NGE T E A M)
projected increase in average global temperature. This benefit reduced the future costs of climate change and resulted in smaller projected negative impacts on a global scale.
Older economic models also ignored the potential impacts of climate change on the provision of “ecosystem services”, the functions that the environment performs at no cost to producers, such as provision of clean water and nutrient cycling. If climate change hampers future provision of ecosystem services, this represents a potentially significant unaccounted future cost. While newer models attempt to account for impacts to ecosystem services, the scope of modeling of impacts is typically very limited due to low data availability.
Nicholas Stern, Chief Economist for the U.K. Treasury, released an influential report examining the costs and benefits of mitigation in 2006. His report, the Stern Review, projected global economic losses of between 5 percent and 20 percent of gross domestic product (GDP) due to climate change-related losses. At the time, the cost of mitigating global climate change to a maximum of 2 degrees Celsius was projected to be only 1 percent of GDP. IAM was also the foundation of Stern’s research, which revealed several policy interventions for which the benefits of mitigation exceeded costs.
Jeffrey Sachs, Director of the Earth Institute at Columbia University, estimated that mitigating emissions to within manageable levels would cost $1.8 trillion per year globally, a figure that far outweighed the potential costs of inaction.
Although some mitigation or adaptation options have little or no associated cost, many will require investment in future gains. Cost-benefit analysis is but one of a suite of potential analytical or decision-making tools available for com-paring different mitigation or adaptation options and associated trade-offs. Other tools include matrix-based appraisals, multi-criteria assessment, multiple accounts analysis, ecosystem-based planning, integrated assessment, backcasting, scenario comparison, life-cycle analysis, total economic value calculations, risk assessment, alternatives assessment, systems analysis and many more. While cost-benefit analysis may be attractive due to its relative simplicity, calculations often include implicit or explicit assumptions that can skew results.
Much of the work that has been done to date regarding the economics of climate change adaptation has focused on costing, including research into the cost of adaptation for developing countries worldwide. Costing is fraught with methodological challenges, but is useful to highlight the need for planning and response. Howes and Dobes (2011) report that costing approaches typically focus on public goods, but public-sector pricing reform and financial instruments, including micro-credit and insurance, can also be powerful tools for adaptation. These latter tools depend less on public funding and can be equally useful to help individuals adapt. For example, water pricing can be used to manage water scarcity and create incentives for conservation and even be paired with micro-credit programs to provide access to capital required for water-saving technologies.
Due to the inherent regional variability of climate change effects, decision-making tools can be more broadly applied than specific instruments. Decision-making tools can help local governments to determine appropriate actions for their unique communities and challenges. The following tools are most commonly used to evaluate risks associated with climate change:
• Multi-criteria analysis• Vulnerability, adaptive capacity, and resiliency indexes• Cost-effectiveness analysis • Cost-benefit analysis
Each of these tools uses a different approach to decision-making, has different labour and data requirements, and provides different outputs. The first two tools listed are qualitative in nature, while the last two are quantitative. This section will review each tool as well as its respective benefits and limitations. Since cost-benefit analysis provides the foundation for much of the existing economic research on the impacts of climate change, a detailed assessment of its strengths and its weaknesses is included.
CLIMATE CHANGE ADAPTATION AND CANADA’S CROPS AND FOOD SUPPLY BACKGROUND REPORT
6 4
Multi-criteria analysisMulti-criteria analysis (MCA) evaluates the relative contribution of selected outcomes of actions to achievement of a goal
or objective. MCA employs both quantitative market values as well as qualitative non-market values for decision-mak-ing, and can be valuable where projects produce significant intangible benefits, such as those to ecosystem services. It can also be employed where data is scarce or uncertainty about future benefits is high. While costs of collecting and compiling data for MCA are lower than for other options, it requires greater training and expertise to conduct if an unbiased outcome is to be achieved. The pitfall of this decision-making tool is that attributes, as well as their relative contributions, are assigned subjectively by the analyst. This type of bias could be reduced through the use of dialogic processes or random statistical surveys.
Vulnerability, adaptive capacity, and resiliency indexesIndexes have been developed to help decision-makers identify and rank risks based on an established set of social,
environmental, and economic factors in order to develop a course of action for adaptation. Indexes have been developed for use at the community, regional, and national level, and can be an accessible and easy-to-implement tool with relatively low costs to implement. Yet, similar to MCA, indexes also rely on subjective rating of risks, and may fail to provide guidance for specific actions and timelines. Where multiple risks are correlated, these types of indexes may provide unreliable estimates of impacts and fail to inform policy decisions.
Cost-effective analysisCost-effective analysis (CEA) is a more empirically sound decision tool than MCA or indexes and measures technical
efficiency in terms of the cost associated with achieving a particular goal. It is used to compare the relative costs of two or more projects or actions that are capable of achieving the same outcome. The results of CEA are generally expressed as a ratio of project cost to outcome, where the outcome is expressed in non-monetary units. This characteristic makes CEA appropriate for comparing the costs of projects that provide non-market benefits.
Cost-benefit analysisCost-benefit analysis (CBA), also called benefit-cost analysis, is similar to CEA in that it is used to measure the costs
associated with achieving a certain goal, but unique in that it expresses these benefits in monetary terms. Monetary measurement offers greater flexibility than CEA because it allows comparison of projects with different outcomes based on their cost-to-benefit ratio. However, it is important to compare projects or actions of a similar scale in order to account for the magnitude of costs or benefits incurred.
There are two broad approaches to CBA for climate change adaptation: top-down and bottom-up. Top down ap-proaches, such as that employed by the World Bank (2009) in its estimate of the global, annual cost of adaptation for developing countries, rely on simple methods and assumptions to estimate the value of investment required and often ignore operating costs for adaptation projects. Bottom-up estimates are tailored to specific sectors or projects and employ a range of assumptions and methods, and are difficult to compare amongst one another.
CBA has been historically limited to consideration of market values of costs and benefits, assumed that all stakeholders benefit equally from a project, and has been expensive to undertake. Concerns about the distribution of benefits may be remedied by assigning different distributional weights to each stakeholder group, but the other issues are difficult to mitigate. Despite these challenges, cost-benefit analysis is the most effective policy decision-making tool because it offers a straightforward and relatively transparent approach to weighing the present value of benefits to society against the present value of costs.
In 2004, UKCIP released a set of simple guidelines for costing adaptation investments to enable decision-makers to develop order-of-magnitude estimates of project cost, which could then be used to prioritize adaptation projects. The

65
ACT ( A DA P TAT ION TO CL IM AT E CH A NGE T E A M)
guidelines were intended to be simple enough to apply across a range of sectors and at the local, regional, or national scale in the UK, and address the value of select positive and negative environmental externalities on aspects such as habitats and biodiversity, human health, recreation and amenity, cultural objects, leisure and working time, and non-use benefits. Impact matrices are included to identify specific climate-related impacts to coastal zones, water resources, agriculture, and buildings and infrastructure, along with specific valuation methods to quantify the direct and indirect costs of cli-mate change in monetary terms. Impacts on manufactured goods and services are assessed based on their market value, while impacts on assets are measured using other methods, such as replacement cost. The guidelines for public sector costing involved the use of accepted discount rates from the UK Treasury Green Book, while those for private sector costing recommended the opportunity cost of capital approach. These guidelines provide a straightforward approach to CBA using available data and basic microeconomic methodologies that can be applied by planners, municipal officials, businesspeople, farmers, or decision-makers at any scale. Implementation guidelines were also developed to provide technical assistance to economists undertaking CBA for climate change adaptation projects, and include examples of valuation calculations for reference.
In order to identify the costs and benefits of adaptation under changing social, political, economic, and environmental conditions and uncertainty more precisely and accurately, economists employ computer-based models that include data concerning climate, economics, society, demographics, and domestic and international policy. Projecting economic and environmental changes in the midst of multiple uncertain variables requires complex modeling, known as Integrated Environmental Economic Modeling (IEEM), using vast quantities of historical and modeled data inputs.
The field of environmental modeling is a rapidly evolving. For example, IBM has recently developed river modeling technology to predict the dynamics of flooding across regions. Data from river systems, weather and sensors can now be integrated to simulate not only the behavior of major rivers in response to precipitation events, but also smaller tributaries that can affect vast tracts of agricultural land. The technology was developed for use by municipalities and emergency management and response teams in planning and preparedness and has been tested in the Guadalupe River watershed, Texas.
Economic modeling can be integrated with environmental models to predict the economic impact of environmental events due to climate change and the effect of adaptive behaviour and activities on reducing these impacts. As new models are developed to examine the frequency and severity of events such as flooding and drought and additional data is collected to populate these models, linkages can be made with economic projections.
CBA enables consideration of extreme events, involving “probabilistic” modeling, as well as generalization based on averages and climate creep, or “deterministic” modeling. Extreme climatic events can be modeled using historical data and probability distributions that are augmented using climate models to account for future shifts, however, results will differ based on the model employed. These distributions can be used to generate a set of cost functions associated with damage due to the event and integrated with Monte Carlo simulations that select random climatic events to generate probability distributions of costs for each time period being analyzed. This provides a more accurate range of costs due to damage from climatic events than single point estimates that are based on average data.
One key benefit of cost-benefit analysis is the ability to incorporate uncertainty associated with the extent, frequency, and timing of climate change into decision-making using Monte Carlo simulation and what is known as the “real options” approach. A major challenge associated with long-term infrastructure investments under changing conditions is the need to design for both current and future conditions. For example, an irrigation channel with a lifespan of 150 years will need to be designed to accommodate both current conditions and projected conditions 150 years in the future. These types of long-lived projects are both difficult to design and are at greater risk of being maladaptive because decisions must be made far in advance, based on the limited information available under current conditions. Engineers can either design infrastructure with a shorter lifespan and risk high replacement costs, or design infrastructure to accommodate a
CLIMATE CHANGE ADAPTATION AND CANADA’S CROPS AND FOOD SUPPLY BACKGROUND REPORT
66
broader range of environmental conditions and risk high up-front capital costs. Somewhere between these two options lies the “real options approach”, which allows decision-makers to consider a phased-in approach to project development
The real options approach is used to consider physical, or “real”, asset investments to adapt to climate change. This approach is useful for planning, because it enables planners to consider the option of delaying full investment in projects while creating enabling conditions for future investment. Real options analysis can help governments with tight budgets to evaluate investment in adaptation projects over time, while ensuring the capacity to respond exists when it is needed in the future. Compared to the precautionary approach, which dictates that full investment should be made in the present, the real options approach incorporates greater flexibility and delays decisions until uncertainty is reduced an more information is available about actual future climatic conditions. In these situations, the small initial investment is similar to purchasing a financial option and grants the investor the opportunity but not the obligation to invest in the full project at a later date. The decision to fully invest is triggered when the present value of the benefit of adapting to the effects of climate change outweigh the present costs of the project. Monte Carlo simulation can help to predict when this tipping point may occur, based on estimated probability distributions of damage costs. Ecosystem-based adaptation relies on the enhancement or restoration of natural areas and processes to build resilience against the impacts of climate change and is readily supported by the real options approach because it builds capacity for future adaptation without committing to costly infrastructure developments.
The real options approach challenges traditional approaches to decision making, and consequently may be met with initial resistance. Humans tend to be risk-averse, meaning that they are willing to pay a premium today to reduce their future risk of suffering negative consequences due to disastrous events. For example, many people purchase health insurance despite the fact that, on average, they will pay more over their lifetime in insurance payments than they will receive in benefits. The degree of risk aversion observed within a population and the premium that population is willing to pay to avoid risk must be factored in to any economic modeling that weighs the costs of future climate change against the benefits of adaptation projects.
The use of two different approaches to estimating the benefits of adaptation – avoided cost and willingness to pay - makes it difficult to compare cost-benefit analyses that have been conducted independently. Adaptation to climate change may be viewed as an investment in avoided costs of anticipated future damage in the absence of project development, however, some economists recommend measuring the benefit of adaptation projects in terms of public willingness to pay to avoid negative impacts because the former approach is likely to overlook significant benefits. Individuals may be willing to pay significantly more than the value of avoided damages to preserve non-market benefits and prevent stress and disruption of their daily lives resulting from climatic events. Unfortunately, surveys and contingent valuation methods that are used to gather and analyze data about willingness to pay are costly to undertake, and avoided cost information is more readily available. Estimates of avoided cost may be used to identify the lower bound for the benefits of adaptation.
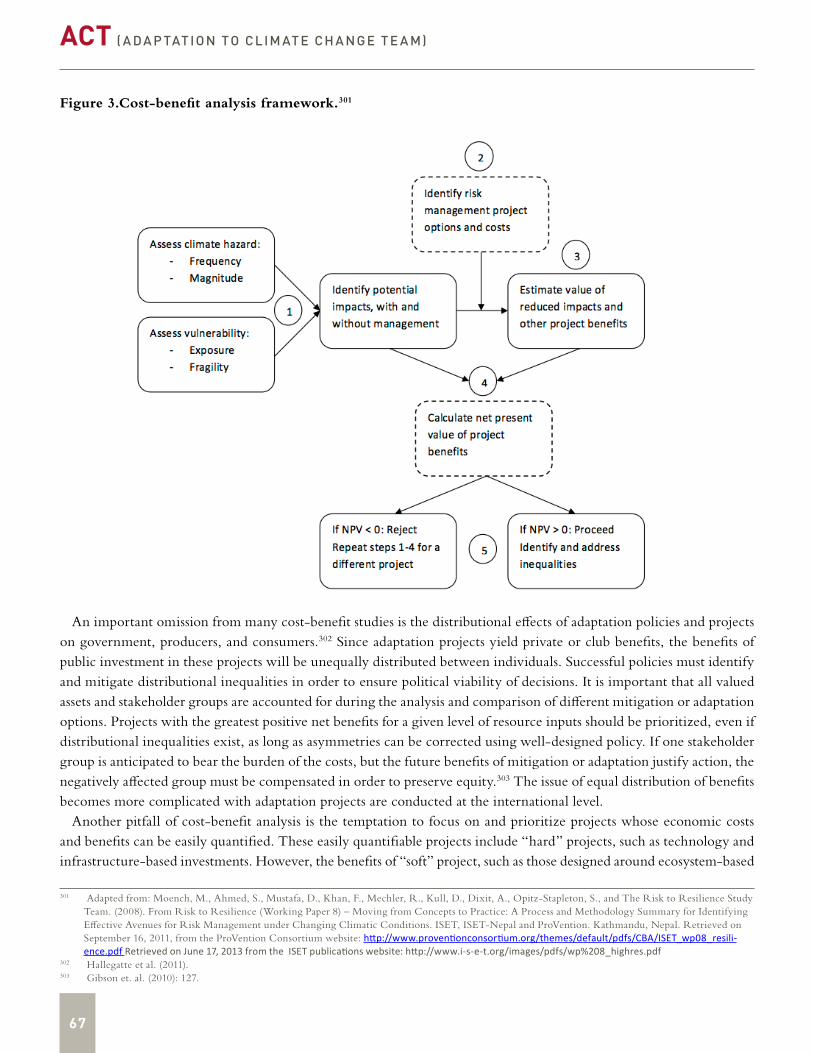
67
ACT ( A DA P TAT ION TO CL IM AT E CH A NGE T E A M)
Figure 3.Cost-benefit analysis framework.301
An important omission from many cost-benefit studies is the distributional effects of adaptation policies and projects on government, producers, and consumers.302 Since adaptation projects yield private or club benefits, the benefits of public investment in these projects will be unequally distributed between individuals. Successful policies must identify and mitigate distributional inequalities in order to ensure political viability of decisions. It is important that all valued assets and stakeholder groups are accounted for during the analysis and comparison of different mitigation or adaptation options. Projects with the greatest positive net benefits for a given level of resource inputs should be prioritized, even if distributional inequalities exist, as long as asymmetries can be corrected using well-designed policy. If one stakeholder group is anticipated to bear the burden of the costs, but the future benefits of mitigation or adaptation justify action, the negatively affected group must be compensated in order to preserve equity.303 The issue of equal distribution of benefits becomes more complicated with adaptation projects are conducted at the international level.
Another pitfall of cost-benefit analysis is the temptation to focus on and prioritize projects whose economic costs and benefits can be easily quantified. These easily quantifiable projects include “hard” projects, such as technology and infrastructure-based investments. However, the benefits of “soft” project, such as those designed around ecosystem-based
301 Adapted from: Moench, M., Ahmed, S., Mustafa, D., Khan, F., Mechler, R., Kull, D., Dixit, A., Opitz-Stapleton, S., and The Risk to Resilience Study Team. (2008). From Risk to Resilience (Working Paper 8) – Moving from Concepts to Practice: A Process and Methodology Summary for Identifying Effective Avenues for Risk Management under Changing Climatic Conditions. ISET, ISET-Nepal and ProVention. Kathmandu, Nepal. Retrieved on September 16, 2011, from the ProVention Consortium website: http://www.proventionconsortium.org/themes/default/pdfs/CBA/ISET_wp08_resili-ence.pdf Retrieved on June 17, 2013 from the ISET publications website: http://www.i-s-e-t.org/images/pdfs/wp%208_highres.pdf
302 Hallegatte et al. (2011).303 Gibson et. al. (2010): 127.
CLIMATE CHANGE ADAPTATION AND CANADA’S CROPS AND FOOD SUPPLY BACKGROUND REPORT
68
adaptation, are more difficult to estimate ex ante. Thus, these projects compare less favourably in present terms, despite their relative effectiveness and lower cost.304 For example, costs and benefits of a sea wall development project may be easy to estimate, but can cause loss of inter-tidal habitats as the sea level rises, resulting in loss of ecosystem-based adapt-ive capacity.305 Inter-tidal zones can buffer the effect of storms, provide habitat for wildlife, and retain water, but the present value of these benefits is difficult to quantify. In this case, a multi-criteria approach may be used to supplement cost-benefit analysis.306
Cost-benefit analysis also ignores the dimension of human risk aversion, unless a specific factor is included to address this issue. Costs and benefits should account for the probability of occurrence of an event but may not assign particular socio-political significance to low-probability, high-cost climatic events.307 One option is to employ a risk management model to limit the probability that losses due to extreme events reach an established unacceptable threshold.308 Conversely, a “maximum” approach can be used to minimize the chance that a threshold will be exceeded by focusing on extreme events and ignoring the most likely climate scenarios.309
Examples of Cost Benefit Analysis Several large-scale attempts have been made to assess the costs and benefits of adaptation to climate change. Examples
of CBA for adaptation conducted by the following government and non-government organizations are reviewed in this section:
• Agriculture and Agri-Food Canada• Prairie Farm Rehabilitation Administration, AAFC• National Roundtable on Energy and the Environment• The World Bank• National Autonomous University of Mexico • California Energy Commission
Agriculture and Agri-Food CanadaAAFC first implemented Integrated Environmental-Economic Modeling of climate change impacts (IEEM) to esti-
mate the cost of wind and water erosion on the Canadian Prairies in 1996, was later applied during an environmental assessment of the Federal-Provincial Crop Insurance program in 1998.310
Presently, AAFC relies predominantly on a few key models to forecast economic conditions in Canada’s agricultural sector, including the Canadian Regional Agriculture Model (CRAM), Environmental Policy Integrated Climate (EPIC), Canadian Economic and Emission Model for Agriculture (CEEMA), and Canadian Regional Agriculture Water Use Model (CRAWUM).
CRAM is the main economic model, and is used to predict changes in resource allocations to different crops and other activities due to changes in technology, government programs or policies, and market conditions.311 This model encompasses grains and oilseeds, forage, beef, hogs, dairy, poultry, and more recently, biofuels.
By linking CRAM to other models, such as EPIC and CEEMA, AAFC is able to make projections based on changing environmental conditions. EPIC is used to predict agricultural yields, and then applied to CRAM to assess the medium- to
304 Hallegatte et. al. (2011).305 Coombes et al. (2005). 306 Hallegatte et. al. (2011).307 Hallegatte et. al. (2011).308 Hallegatte et. al. (2011).309 Hallegatte et. al. (2011).310 Statistics Canada. (2011).311 Morand, H. (2010). Environmental Sustainability of Canadian Agriculture: Agri-Environmental Indicator Report Series – Report No. 3. AAFC.
Retrieved on August 19, 2011, from the AAFC website: http://www4.agr.gc.ca/AAFC-AAC/display-afficher.do?id=1290720809246&lang=eng
69
ACT ( A DA P TAT ION TO CL IM AT E CH A NGE T E A M)
long-term effects of climate change on the agricultural sector.312 CEEMA is used to predict the changes in greenhouse gas emissions from the sector under various mitigation policies, and CRAWUM is used to project demand for water by the agricultural sector by sub-sector and region.313
These models have been used in over the past decade to predict the effects of policy changes on agri-environmental performance indicators and climate change mitigation, and have potential applications in modeling adaptation scenarios for the agricultural sector under climate change. However, current and future usefulness of economic models depends on the quality and availability of data upon which the models operate.314 AAFC recognizes specific limitations with respect to differences in boundaries for economic versus environmental data and availability of integrated econom-ic-environmental models.
Political boundaries and data availability are two major hurdles for economists seeking to employ IEEM. Political boundaries rarely coincide with environmental boundaries, such as those delineated by soil landscape. AAFC has identified a need to obtain more site- or regionally-specific CRAM data to determine specific economic effects of environmental practices, potentially using a Land Use Allocation Model (LUAM).315 Lack of integrated economic-environmental models limits policy-makers’ ability to assess impacts of changes in management practices on economic and environmental performance at the farm level.316 Data about economic or environmental effects of policies are simply not available for many management practices. Current models also do not incorporate information about feedback linkages. Specifically, models predict environmental performance based on results of policy implementation, but do not consider the effects of economic performance resulting from changes in environmental quality.
AAFC is working to fill in some of these gaps with respect to IEEM. With improved data quality and availability, AAFC may be able to predict both the environmental impacts of economic policy and the economic impacts of en-vironmental management. However, another challenge associated with IEEM is the need to assign monetary value to environmental impacts in order to perform cost-benefit analysis and evaluate trade-offs. This type of valuation is cur-rently being investigated as part of the Agri-Environmental Valuation component of the National Agri-Environmental Health Analysis and Reporting Program (NAHARP).
NAHARP was developed in 1993 to assess and report on the environmental performance of Canada’s agricultural sector using science-based performance indicators in order to inform policy development.317 The program focused on six categories of agri-environmental indicators (AEIs): soil quality, water quality, air quality, biodiversity, farm manage-ment, and the food and beverage industry.318 Information about how management practices affected these indicators was used to estimate economic values of public goods generated by improved farm management, both on and off the farm.
NAHARP recognizes that the environment provides three main types of services: provisioning, regulating, and en-riching/cultural.319 Provisioning services are used as direct inputs to economic activity, such as fresh water and clean air. Regulating services are functions that support the provision of other services, and include water purification. Enriching or cultural services are not used directly or indirectly by people, but have spiritual value.
All activities have positive, negative, or neutral an impact on the ability of the environment to provide these services. For example, if a farmer increases the amount of vegetation along a stream on their property, they can increase water purification and availability of clean water. NAHARP characterizes the types of effects of major agricultural activities on the environment, with the hope of estimating their economic value in terms of the effect on ecosystem services once appropriate methodologies have been developed. Pilot studies have been undertaken at farms to study and quantify the
312 Morand. (2010).313 Morand. (2010).314 Morand. (2010).315 Morand. (2010).316 Morand. (2010).317 Straub, Matthew. (2007, August 30). AAFC Workshop: Valuing public benefits in agricultural landscapes. AAFC. Retrieved on August 22, 2011, from
the AAFC website: http://www.agr.gc.ca/pol/egs-bse/pdf/straub_e.pdf318 Straub. (2007).319 Straub. (2007).
CLIMATE CHANGE ADAPTATION AND CANADA’S CROPS AND FOOD SUPPLY BACKGROUND REPORT
70
effects of management practices. The information from these studies was then used to extrapolate broader effects at the watershed level in the Grand River Watershed, near Toronto, Ontario.320 Additional studies were conducted to quantify the economic and environmental effects of beneficial management practices in watersheds across Canada, in Salmon River, British Columbia; Lower Little Bow, Alberta; South Tobacco Creek, Manitoba; South Nation, Ontario; Bras d’Henri, Quebec; Black Brook, New Brunswick; and Thomas Brook, Nova Scotia.321 Ultimately, NAHARP seeks to aggregate data from the local or watershed level up to the national level. AAFC has used NAHARP data as a foun-dation for policy decisions related to environmental assessment of business risk management programs, comparison of environmental performance against international competitors at the commodity level, and evaluation of environmental risk and beneficial management practices.322
AAFC made a limited attempt to quantify the net benefit of its Environmental Farm Plan program in 2005, with a study that investigated a conceptual framework for understanding the benefit and cost implications of the program across the agri-food chain.323 This conceptual framework was subsequently applied to the pork, beef, grain, and dairy sectors to offer preliminary qualitative results. The benefits assessment concentrated on the financial benefits to farmers of signaling environmentally sustainable on-farm management practices to consumers.324 The framework treated the benefits of mitigating environmental costs as externalities because its characterization of benefits was limited to private demand-side and supply-side aspects of environmental farm planning, and public goods accrue outside the boundaries of the farm site.325 Demand-side benefits included reducing transaction costs for consumers in terms of time required to seek out sustainable products, building consumer confidence, and differentiating products on international markets. Supply-side aspects include advances in productivity and logistics. Costs are associated with program management and compliance for producers and EFP administration for the federal government.
While the proposed approach focused largely on the costs to government and producers of administering the pro-gram as well as private benefits associated with marketing and sales of EFP-labeled products, the framework could be modified and expanded to evaluate a broader range of costs and benefits of EVP programs aimed at climate adaptation and to include public goods.
Prairie Farm Rehabilitation Administration Saskatchewan’s Rural Municipality of Corman’s Landscape and Infrastructure Resiliency Assessment (LIRA) Manual
provides a sub-basin approach to assessment and adaptive management approaches with a focus on flooding resulting from extreme rainfall events.326 This bottom-up approach applies an economic framework to assess and compare the impacts of potential management approaches under projected climate conditions.
The LIRA framework was applied as a case study to the Rural Municipality of Corman Park, Saskatchewan. The LIRA approach was used to contrast costs and outcomes under the following two options:327
1. Updated zoning regulations and practices intended to discourage high-value developments at sites with high risk of flooding, and
320 Straub. (2007).321 Straub. (2007).322 Kalff, S., Lefebvre, A. (no date). Using Agri-Environmental Indicators in Decision-Making: Examples from Canada and Issues to Consider. AAFC.
Retrieved on August 22, 2011, from the AAFC website: http://www.oecd.org/dataoecd/40/45/44810481.pdf323 Hobbs, J. E. (2005). OFFS and EFP: A Conceptual Framework for Identifying and Classifying Benefits and Costs. Agriculture and Agri-Food Canada.
Retrieved on August 17, 2011, from the University of Minnesota website: http://ageconsearch.umn.edu/bitstream/55297/2/rpt2_e.pdf324 Hobbs. (2005).325 Hobbs. (2005).326 Sparks (2008) Adapting to Climate Extreme Events Risks across Canada’s Agricultural Economic Landscape: An Integrated Pilot Study of Watershed Infrastructure System Adaptation. Natural Resources Canada. http://www.rmcormanpark.ca/media/tinymce_files/news/
planning/LIRA%20Report%20-%20Part%201.pdf327 Sparks (2008).
71
ACT ( A DA P TAT ION TO CL IM AT E CH A NGE T E A M)
2. A combination of zoning regulations and investment in water retention and drainage infrastructure to divert floodwaters towards a receiving waterbody (i.e. the South Saskatchewan River).
Future costs associated with rainfall damage were estimated based on a 25-year planning horizon and addressed regional rainfall forecasts, flood maps of high-risk areas, regional development forecasts, GIS maps illustrating potential flood impact on development, estimated damage costs, and forecasted damage costs. An economic assessment framework was applied to compare the cost investing in adaptation with the value of resulting benefits, expressed in terms of avoided damage. Sparks (2010) compared damage costs under a baseline scenario with future projections and compared these to the costs of adaptation projects using a Net Present Value (NPV) approach.
In order to incorporate the probability of different levels of rainfall over time, a simulation procedure was included to generate thousands of rainfall forecasts, each of which resulted in a different NPV. The average, or expected, NPV values were compared for each adaptation option, along with the probability of that NPV occurring over the 25-year period.
The researchers’ decision rule established that if the value of avoided damages exceeded adaptation costs (i.e. NPV>0), an adaptation project should proceed. Conversely, if adaptation costs exceeded the value of avoided damages (i.e. NPV<0), the adaptation project was deemed too costly.
The LIRA approach involves steps to assess vulnerabilities and risks, to determine ways of physically addressing these, and equally important, provides specific guidance on financially weighing options. In effect the LIRA Manual is a complete decision support tool, aimed at farmers and local authorities in farming areas.
National Roundtable on Energy and the EnvironmentIn 2011, the National Roundtable on Energy and the Environment (NRTEE) released a report that estimated the
economic cost of climate change in Canada. The study involved a top-down approach to calculate the impact of climate change, with a focus on three sectors of the economy: prosperity of the timber industry; flooding of coastal regions; and public health.328 This was coupled with a bottom-up approach to identifying the costs of adaptation activities, in order to develop a benefit-cost comparison based on avoided damage and adaptation costs. This was the first national-level attempt to identify the economic costs of climate change based on population growth and climate projections in Canada.329 Modeling was conducted using the Policy Analysis of the Greenhouse Effect IEEM model, adapted for a Canadian policy perspective.330 NRTEE found that the annual costs of climate change to these three sectors are anticipated to increase from $5 billion per year in 2020 to between $21 billion and $43 billion by the 2050s.331 Average annual damage costs due to climate change are expected to equate to between 0.8% and 1% of GDP by 2050.332
NRTEE also evaluated the costs of adapting these three sectors to climate change, and compared these costs to the benefits of avoided damage. They estimated the avoided damage value of forest fire prevention, pest control, and planting climate-resilient tree species to improve resilience of the forestry sector, and found that the benefit-to-cost ratio of these actions was 38:1 under a high rate of climate change and population growth and 9:1 under a low rate of climate change and population growth.333 Restricting development of flood-prone areas and strategically eliminating habitation of dwellings following flood damage reduced the cost of damage in coastal areas by up to 97%.334 Installing pollution-control technologies to limit ozone formation was also found to be cost-effective.
328 NRTEE. (2011). Paying the Price: The Economic Impacts of Climate Change for Canada. NRTEE. Retrieved on September 29, 2011, from the NRTEE web-site: http://nrtee-trnee.ca/wp-content/uploads/2011/09/paying-the-price.pdf
329 NRTEE. (2011).330 NRTEE. (2011).331 NRTEE. (2011).332 NRTEE. (2011).333 NRTEE. (2011).334 NRTEE. (2011).
CLIMATE CHANGE ADAPTATION AND CANADA’S CROPS AND FOOD SUPPLY BACKGROUND REPORT
72
Other jurisdictions and agencies have made progress toward quantifying the economic impacts of climate change on the global economy as well as individual nations’ agricultural sectors. The following are examples of efforts to quantify the economic impacts of climate change.
The World BankThe World Bank estimates that, to adapt key sectors in developing countries to a 2°C temperature increase by 2050
would cost between $70 billion and $100 billion.335Bottom-up estimates that examine the cost of adaptation on a cross-sectoral basis per country, inclusive of social aspects, project higher costs. In any case, these figures represent only 0.17% of global GDP and are the same order of magnitude as the foreign aid delivered to developing countries each year.336 The lower and higher estimates represent the driest and wettest global climate projections, respectively, due to the relatively higher cost of flood management infrastructure.337 For both scenarios, the bulk of adaptation cost is associated with infrastructure, coastal zones, and water supply and flood protection.338
For its estimate of the costs of adaptation, the World Bank used a simple methodology that involved selecting baseline conditions, choosing climate projections, predicting impacts of climate change across sectors, and identifying options for adaptation and associated costs. Researchers compared future conditions without climate change to future conditions with climate change plus necessary adaptation measures, accounting for different development baselines for each sector in addition to population and GDP forecasts. Adaptation activities were chosen to offset the impacts of climate change and restore welfare in key economic sectors, namely infrastructure, coastal zones, water supply and flood protection, agriculture, fisheries, human health, and forestry and ecosystem services.339 A cross-sectoral analysis was not conducted for the global analysis, but was conducted for estimates developed at the country-level for five select countries. Social impacts were also only addressed at the country-level.
Researchers decided to conduct the study using the following assumptions:340
• Countries adapt fully, thereby offsetting any negative welfare effects of climate change.• Development occurs separately from adaptation, so the cost of adaptation is additional.• Capital-intensive adaptation options are favoured over institutional or governance-based options, because they
are easier to quantify.• All adaptation is planned, and autonomous adaptation does not occur.• Beneficiaries of climate change were treated differently, using several approaches. • Only the wettest and driest climate scenarios are considered. If the actual outcome is uncertain, costs of adap-
tation will be higher.
Researchers reported the limitations of their estimates due to mathematical models; uncertainty surrounding climate, technological development, and population growth; omission of institutional, migration, and urbanization considerations; limited scope of adaptation strategies; and lack of data for environmental services.341
In both climate scenarios, crop yields and production in developing countries are predicted to decline.342 Developing countries are also predicted to suffer greater losses than developed countries, on average, with South Asia projected to experience the most significant production declines.343 Exports from developed countries are expected to become more
335 World Bank. (2010). 336 World Bank. (2010).337 World Bank. (2010).338 World Bank. (2010).339 World Bank. (2010).340 World Bank. (2010).341 World Bank. (2010).342 World Bank. (2010).343 World Bank. (2010).
73
ACT ( A DA P TAT ION TO CL IM AT E CH A NGE T E A M)
significant. Fortunately, welfare losses and associated costs of adaptation are expected to be smaller for agriculture than for other sectors due to redistribution of food through international trade.
National Autonomous University of Mexico In 2008, the National Autonomous University of Mexico conducted a study examining the economic impacts of
climate change across Mexico’s economic sectors. The study incorporated a baseline scenario of 3.5% annual GDP growth for the period with a 60% probability range and additional sector-specific GDP scenarios.344 Climate data was obtained from the GCM models.345 Three economic models were employed to project economic impacts: production functions, Ricardian models, and conditional heteroskedasticity models.346 Discount rates of 0.5%, 2%, and 4% were applied, respectively, and projection were made for the years 2050 and 2100.347 The study evaluated the impacts of cli-mate change on agriculture, water resources, biodiversity, extreme weather, tourism, and human health.348 Both market and non-market impacts were considered. The impact on the agricultural sector alone varied by climate scenario and discount rate, however, a net cost was observed across all scenarios.
California Energy Commission Few attempts have been made to quantify the economic impact of extreme events on agricultural crops. Extreme
events are rare, so little data is available and modeling is difficult. However, a report commissioned by the California Energy Commission’s Climate Change Center provides one example of a methodology characterize this economic risk. The researchers examined the insurance and disaster payment records associated with extreme weather events during the period from 1993-2007, and categorized risks broadly according to dry versus wet weather events and hot versus cold weather events.349 Crop insurance data was collected from the USDA’s Risk Management Agency, and disaster payment data was collected from the Environmental Working Group and the National Oceanic and Atmospheric Administration Storm Event database.350 The researchers found that, for historical weather events in California, the most common cause for insurance and disaster payments was excess moisture or flooding, followed by cold spells and heat waves.351 The researchers also examined the probability of each event in a changing climate, with cold spells occurring less frequently and heat waves increasing in both frequency and duration.352 Net effects of these combined influences were not considered in the report.
Another study by the California Climate Change Center used the Statewide Agricultural Production Model (SWAP) to estimate revenue impacts to the sector by incorporating data from hydrological models and climate-related agronomic models as well as base cropping data from 26 agricultural regions within the state.353 The model also included projected log-linear growth rates of technological change by crop type.354 Increased population and incomes are reflected in in-creased demand, while the proportion of exports is held constant at the current level.355 Income and price elasticities are included by crop type in order to model shifts in demand.356 The effect of proposed dairy waste legislation on the total dairy herd size is also considered.357 The study projected a decrease in total irrigated acres of between 26% and 17%, as
344 Gallido. (2010).345 Gallido. (2010).346 Gallido. (2010).347 Gallido. (2010).348 Gallido. (2010).349 Lobell, D.B., Torney, A., Field, C.B. (2009). Climate Extremes in California Agriculture. California Climate Change Center. Retrieved on September 6,
2011, from the California Energy Commission website: http://www.energy.ca.gov/2009publications/CEC-500-2009-040/CEC-500-2009-040-F.PDF350 Lobell et al. (2009).351 Lobell et al. (2009).352 Lobell et al. (2009).353 Howitt et al. (2009).354 Howitt et al. (2009).355 Howitt et al. (2009).356 Howitt et al. (2009).357 Howitt et al. (2009).
CLIMATE CHANGE ADAPTATION AND CANADA’S CROPS AND FOOD SUPPLY BACKGROUND REPORT
74
well as reductions in total farm revenues of between 16.3% and 10.6% by 2050 under a warm-dry climate scenario.358 Price and productivity changes are anticipated to produce the lower revenues observed from the model.359 Increasing scarcity is projected to push up the value of water, leading to changes in the types of crops cultivated and crop-related technologies.360 One significant assumption of the model is the ability to transfer water from wetter to drier areas by 2050, and the existence of established water markets.361
358 Howitt et al. (2009).359 Howitt et al. (2009).360 Howitt et al. (2009).361 Howitt et al. (2009).
75
ACT ( A DA P TAT ION TO CL IM AT E CH A NGE T E A M)
11. DISASTER RISK REDUCTION: AN INTEGRATED APPROACH TO ADAPTATION
Erik Karlsen, co-lead policy author, ACT
Ngaio Hotte, agricultural and resource economist, ACT
How we approach adaptation to climate change depends largely on the way it is framed by decision-makers. “Framing” is a term used to describe the set of assumptions, experiences, and information that shapes how issues are perceived and decisions are made.362
Disaster Risk Reduction (DRR) focuses on the impacts of extreme events, such as drought and flooding, and the potential for resulting disasters in order to reduce the damage caused by these events. In and of themselves, extreme events are not disasters, but they can cause disasters where a hazard exists, risk is poorly managed, vulnerability is high, and resilience is low.
DRR can be used to address a wide variety of disasters (e.g. earthquakes, tsunamis, flooding) of which climate-related disasters is a subset. Thus, many of the applications of DRR are not climate-related, but experiences with DRR can be broadly applied to pro-actively managing the effects of extreme weather events. DRR can mitigate physical, social, environmental, and economic vulnerabilities.
The United Nations International Strategy for Disaster Reduction (UNISDR) adopted the Hyogo Framework for Action (HFA) in 2005 for the purpose of “reducing disaster risks through systematic efforts to analyze and reduce the causal factors of disasters.”363 The HFA was developed by multiple international partners including governments, inter-national agencies, and disaster experts to outline the partnerships and actions required from various sectors to reduce losses due to disasters. It builds on previous groundwork laid with the Yokohama Strategy for a Safer World: Guidelines for Natural Disaster Prevention, Preparedness and Mitigation and its Plan of Action (Yokohama Strategy), adopted in 1994, and outlines the following five priority actions to reduce disaster risk and the impacts of disasters:364
Priority Action 1: Ensure that disaster risk reduction is a national and a local priority with a strong institutional basis for implementation.
Priority Action 2: Identify, assess and monitor disaster risks and enhance early warning.
Priority Action 3: Use knowledge, innovation and education to build a culture of safety and resilience at all levels.
Priority Action 4: Reduce the underlying risk factors.
Priority Action 5: Strengthen disaster preparedness for effective response at all levels.
362 Fünfgeld, H. and McEvoy, D. (2011) VCCCAR Project: Framing Adaptation in the Victorian Context, Framing Climate Change Adaptation in Policy and Practice. Working Paper 1. Retrieved on May 22, 2012, from the Climate Access website: http://www.climateaccess.org/sites/default/files/Funfgeld_Framing%20Climate%20Adaptation%20in%20Policy%20and%20Practice.pdf
363 UNISDR. (2012). What is disaster risk reduction? Retrieved on May 25, 2012, from the UNISDR website: http://www.unisdr.org/who-we-are/what-is-drr
364 UNISDR. (2005). Hyogo Framework for Action 2005-2015: Building the resilience of nations and communities to disasters. Final report of the World Conference on Disaster Reduction (A/CONF.206/6). Retrieved on May 25, 2012, from the UNISDR website: http://www.unisdr.org/files/1037_hyo-goframeworkforactionenglish.pdf.
CLIMATE CHANGE ADAPTATION AND CANADA’S CROPS AND FOOD SUPPLY BACKGROUND REPORT
76
The HFA emphasizes the need for international cooperation to develop the knowledge and capacity necessary for building resilience, as well as the need for national and international support for regional initiatives to develop locally appropriate policies and practices.
While the HFA can be applied to reduce the risk of climate-related disasters due to extreme events, it does not spe-cifically address these challenges. In Europe, the Commission of European Communities (CEC) White Paper set about creating a framework for climate change adaptation to reduce disaster risk in 2009. Adapting to climate change: Towards a European framework for action offers Member States a series of recommendations to integrate risk mitigation into existing policies to decrease vulnerability of health and social policies; agriculture and forests; biodiversity, ecosystems, and water; coastal and marine areas; and production systems and physical infrastructure.365
In 2011, UNISDR and the Council of Europe applied the CEC recommendations to the challenge of reducing disaster risk from climate change in Europe using governance approaches.366 The study focused on how information flows from researchers to policy-makers, and into regional and national adaptation strategies. It recognized both the strengths and limitations of operating within the European Union and recommended strategies for local and Member State governments to expand networks and communication, increase capacity, participate in joint projects and programs, improve on and increase national platforms, and improve the flow of information across levels and between sectors.367
To address the need for an overarching, global framework for DRR and climate change adaptation, the IPCC has published the “Special Report on Managing the Risks of Extreme Events and Disasters to Advance Climate Change Adaptation” (SREX).368The document focuses on risk exposure, vulnerability, and management related to extreme events, identifies potential losses, offers a range of adaptation options that may be applied at various scales (i.e. local, state, international), highlights the role of sustainable development in reducing risk, and offers case studies.
In a call to action aimed at the federal government in the USA, titled Disaster Resilience: A National Imperative, the National Academy of Sciences (2012) outlines the following recommendations for integrating DRR into decision-making at the federal level in the USA:369
1. Risk cannot be eliminated completely, so some residual risk will continue to exist and require management actions.
2. The nature of risk perceptions and behavioral biases are important to consider in developing risk management strategies.
3. A diverse portfolio of disaster risk management measures provides options for decision makers and communities before, during, and after disasters.
4. The need for science-based objective hazard identification and risk assessments is a critical input into the risk management process.
5. Reflecting risk in insurance premiums while keeping insurance acquisition affordable to those requiring special treatment can encourage more individuals to purchase insurance policies.
6. Communicating risk in ways that are understandable to the public is a critical aspect of the risk management process.
365 Commission of the European Communities (2009) White Paper - Adapting to climate change: Towards a European framework for action. Retrieved on May 29, 2012, from the CEC website: http://eur-lex.europa.eu/LexUriServ/LexUriServ.do?uri=COM:2009:0147:FIN:EN:PDF
366 UNISDR (2011) Climate change adaptation and Disaster Risk Reduction in Europe - A review of risk governance. Retrieved on May 29, 2012, from the preventionweb website: http://www.preventionweb.net/files/submissions/20591_governanceccriskeurope.pdf
367 UNISDR (2011).368 IPCC (2012) Managing the Risks of Extreme Events and Disasters to Advance Climate Change Adaptation. A Special Report of Working Groups I
and II of the Intergovernmental Panel on Climate Change [Field, C.B., V. Barros, T.F. Stocker, D. Qin, D.J. Dokken, K.L. Ebi, M.D. Mastrandrea, K.J. Mach, G.-K. Plattner, S.K. Allen, M. Tignor, and P.M. Midgley (eds.)]. Cambridge University Press, Cambridge, UK, and New York, NY, USA, 582 pp.
369 National Academy of Sciences (2012) Disaster Resilience: A National Imperative. Committee on Increasing National Resilience to Hazards and Disasters and Committee on Science, Engineering, and Public Policy. Washington, DC: The National Academies Press.
7 7
ACT ( A DA P TAT ION TO CL IM AT E CH A NGE T E A M)
These recommendations highlight the need for improved public availability of data including risk maps, impact forecast-ing, impact modeling and the effective risk reduction strategies to support private risk assessment and decision-making.370
Together, these sources inform wording for the following governance framework for protecting crops and food supplies from overland flooding. The first point is a paradigm. The second point and its sub-points are statements of principle.
• The anticipation, avoidance and management of climate extreme flood event impacts on crops and food supply are fundamental to environmental, social, and economic sustainability.
• Sustainability in relation to climate extreme flood event impacts on crops and food supply depends on accountable and effective governance systems, which:
• Contain “cause and effect” relationships within their individual jurisdictional boundaries or through inter-gov-ernmental arrangements.
• Value and prioritize impact avoidance, emergency preparedness, recovery and relief. • Share evidence-based understandings about impacts, causes and solutions. • Have the capacity to anticipate potential impacts and prepare and implement focused and, where needed,
multi-faceted, contingency robust approaches
Putting these into effect would involve policies, programs, practices and initiatives.
370 National Academy of Sciences (2012).
CLIMATE CHANGE ADAPTATION AND CANADA’S CROPS AND FOOD SUPPLY BACKGROUND REPORT
78
12. EMERGING ADAPTIVE GOVERNANCE IN THREE REGIONS
Ngaio Hotte, agricultural and resource economist, ACT
Erik Karlsen, co-lead policy author, ACT
Three case studies are presented to inform recommendations on features of top-down/bottom-up governance frame-work for the sustainable development and continuance of food systems. The case studies have been selected because they provide examples of leading policies, programs and practices that anticipate and adapt to the opportunities and challenges of climate changes, in particular those related to:
• Growing conditions (e.g. temperatures)• Surface and groundwater supplies• Flood and drought risks
With reference to these issues, the following questions are addressed:
• How are climate change adaptation opportunities and risk reduction measures being pursued?• What information (sources) on climate changes and extreme weather events is being used? Is this being kept up
to date? If so how is new information being considered in adaptation and risk reduction strategies• What are the roles (e.g., delivery, communication, administration) of national, provincial/state, and local au-
thorities and other organizations (academia, producers, industry, public interest groups, etc.)?• Are organizations working together? If so, describe arrangements made for this. If not what are the barriers to
collaboration, i.e., structural holes or silos where various organizations seem not to be communicating?• What are the drivers (formally stated principles and priorities) that stimulated/influenced, and continue to drive
these roles?• What are leading examples of policies, programs (i.e. regulatory, financial, facilitative), and practices are being
pursued?• How are these integrated with other policies, programs and practices?• What gaps and risks have participants in or observers of these policies, programs and practices noted as needing
attention? • What are the outcomes to date?• In summary, what aspects of these approaches are relevant to designing a food systems climate adaptation
governance framework?
The focus will remain on high-level aspects of governance in each of the three case studies presented.
12.1 THE RED RIVER BASIN
BackgroundThe Red River Basin is a 45,000 square mile cross-boundary watershed, 20% of which is in Manitoba, Canada, and
80% of which is in the United States. The Red River has its headwaters in Minnesota and flows north through North
79
ACT ( A DA P TAT ION TO CL IM AT E CH A NGE T E A M)
Dakota and into Canada. It receives runoff from 116,500 square kilometers of primarily agricultural land, 12,900 square kilometers of which are in Manitoba. It is home to more than half a million residents and encompasses 18 counties in Minnesota and 22 in North Dakota.371
A devastating flood in 1950 in the Red River Valley caused over $700 million372 worth of damage and resulted in evacuation of 100,000 Manitoba residents. The provincial government responded by ordering development of a series of dikes around Winnipeg and an assessment of costs and benefits of various flood management options. In 1958, the Royal Commission on Flood Cost-Benefits recommended construction of the Shellmouth Reservoir, Portage Diversion and Red River Floodway.373 Construction occurred between 1962 and 1968, cost a total of $94 million374 ($63 million for the Red River Floodway alone), and has prevented more than $30 billion worth of flood damage to the City of Winnipeg.375 Funding for the project was shared 60:40 between the federal and provincial governments.376 During high water events, the water in the Red River naturally rises and spills over the entrance to the Floodway, which diverts excess water away from the City. Raising or lowering of the gates to the Floodway allows the water level in the Red River south of the City to be maintained at a natural level, similar to that which would occur if no flood controls were in place.377
The 1997 Flood of the Century378 caused $500 million in damages in Manitoba alone; if the Floodway surrounding the City of Winnipeg had been breached, losses could have climbed to $7 billion.379 Since 1997, more than $1 billion has been invested in flood control infrastructure throughout the province.
South of the Canada-US border, the 1997 flood devastated the metropolitan area of Grand Forks-East Grand Forks.380 In North Dakota and Minnesota, the Red River has flooded during 48 of the past 109 years, and every year since 1993.381 In the event of a one-in-500 year flood, most of the metropolitan area of Fargo-Moorhead would be flooded.382
The Need for AdaptationOverland flooding is one type of extreme event that is predicted to increase in frequency and severity in some regions
as the climate changes. Increased seasonal flow rates in some rivers, such as the Red River, crosses the Canada-US border through Minnesota and North Dakota and into Manitoba, will increase the risk of disasters due to flooding.
Historically, the Red River Basin has experienced extensive periodic flooding, but climate change has caused earlier, wetter spring conditions and shorter, milder winters.383 The Manitoba Government has identified that these changes will increase the likelihood of extreme events and periods, including flooding and drought.384 The Province has com-mitted to adapting to these changes by improving flood protection and upgrading the Red River Floodway from its 371 RRBC. (2011). Red River Basin Commission’s Long Term Flood Solutions for the Red River Basin. Final Report to that States of Minnesota
Pursuant to Session Laws (2009 Chapter 93) and North Dakota Pursuant to the 2009 North Dakota Chapter 20, House Bill 1046, section 9. http://www.redriverbasincommission.org/Comprehensive_Report_12-15-11_FINAL.pdf
372 Norquay, D. (2010, January 20). Development of Flood Mitigation Programs in Manitoba (Presentation). Manitoba Water Stewardship, Manitoba Government. Retrieved on August 31, 2011, from the RRRBC website: http://www.redriverbasincommission.org/Conference/Proceedings/27th_Proceedings/Norquay_Development_Of_Flood_Mitigation_Programs_in_Manitoba__Jan_15__2009B_.pdf
373 Manitoba Government. (2011). Flood Information. Retrieved on August 26, 2011, from the Province of Manitoba website: http://www.gov.mb.ca/flood-ing/fighting/print,index.htm
374 Norquay. (2010).375 Manitoba Government. (2011).376 Norquay. (2010).377 Manitoba Government. (2011).378 Manitoba Government. (2011).379 George, S., and Nielsen, E. (2003).Flooding & Climate Change in Southern Manitoba. Natural Resources Canada and Manitoba Industry, Trade and
Mines. Retrieved August 10, 2011 from the International Institute for Sustainable Development website: http://www.iisd.org/taskforce/pdf/manitoba_geo_survey.pdf
380 RRBC (2011).381 U.S. Army Corps of Engineers. (2011). Fargo-Moorhead Feasibility Study. Retrieved on August 31, 2011, from the International Water Institute web-
site: http://www.internationalwaterinstitute.org/feasibility/index.htm382 USACE. (2011).383 Manitoba Government. (no date). Adapting to Climate Change: Preparing for the Future. Retrieved August 10, 2011 from the Manitoba Government
website: http://www.gov.mb.ca/asset_library/en/beyond_kyoto/adapting_to_climate_change.pdf384 Manitoba Government. (no date).
CLIMATE CHANGE ADAPTATION AND CANADA’S CROPS AND FOOD SUPPLY BACKGROUND REPORT
80
current engineered protection against a 1-in-90 year spring flood to a 1-in-700 year spring flood. Additionally, a land planning initiative is now underway to integrate traditional and modern scientific knowledge into decision-making and the Province is working with producers to encourage adoption of sustainable farm practices and funding the National Water Supply Expansion Program.
The Red River Basin Commission (RRBC) was formed in 2002 to address land and water issues within the Red River watershed at a “grass-roots level”.385 It is a non-profit organization formed through a merger of the former Red River Basin Board, the International Coalition, and the Red River Water Resources Council.386 Offices are located on both sides of the Canada-U.S. border, in Manitoba and Minnesota. The RRBC also includes members from North Dakota and South Dakota. The 41-member Board of Directors includes representatives from local governments, First Nations, a water supply cooperative, a lake improvement association, environmental groups, and the public at-large.387 Governors of the three represented states and the premier of Manitoba have all appointed representatives of their re-spective governments to the RRBC. The RRBC exists to develop and implement a collaborative, integrated natural resource plan for the watershed.388
Overland flooding impacts can range from restricting access to displacing people from their homes and livelihoods, to creating minor to potentially irrecoverable property damage, to putting human life at risk. When flooding affects crop production, food supply chain impacts can occur locally through to globally with financial through to food security consequences.
The increasing frequency and severity of flooding events experienced in the RRB led the International Joint Commission (IJC), the organization responsible for water-related matters of mutual importance to Canada and the USA, to conclude that governments operating within the RRB must prepare the region for floods of even greater magnitude than that experienced in 1997.389 Two major projects were launched to address this need:
• The Red River Basin Watershed Feasibility Study, led by the United States Army Corps of Engineers (USACE) St. Paul District to develop a management plan for the basin, and
• The Long Term Flood Solutions (LTFS) study, directed and supported by the state legislatures of North Dakota and Minnesota and led by the Red River Basin Commission (RRBC) to identify flood management options and recommendations.
These projects occurred in tandem to address different aspects of flood management. The LTFS study benefited from the work done under the Feasibility Study, including development of Hydrologic Model Systems and modeling con-ducted using existing MIKE 11 and USACE HEC/RAS models.390Through the LTFS, the RRBC assessed projected costs of flood damage to urban, other residential, and agricultural areas due to 100-year, 200-year, and 500-year floods. The benefits of existing project options are quantified in terms of the avoided damages that have occurred as a result of project development.391
Key Organizations in Adaptation GovernanceOrganizations that have partnered to work towards long-term flood planning and management within the Red River
Basin are listed in Table 7.
385 RRBC website: http://www.redriverbasincommission.org/Board_Info/History/history.html386 RRBC website: http://www.redriverbasincommission.org/Board_Info/History/history.html387 RRBC website: http://www.redriverbasincommission.org/Board_Info/History/history.html388 RRBC website: http://www.redriverbasincommission.org/Board_Info/History/history.html389 RRBC (2011).390 Yohe, L. (2010) January 19-20, 2010 - Long Term Flood Solutions Update. Red River Basin Commission. http://www.redriverbasincommission.org/
Conference/Proceedings/27th_Proceedings/Lance_Yohe.pdf391 RRBC. (2011).
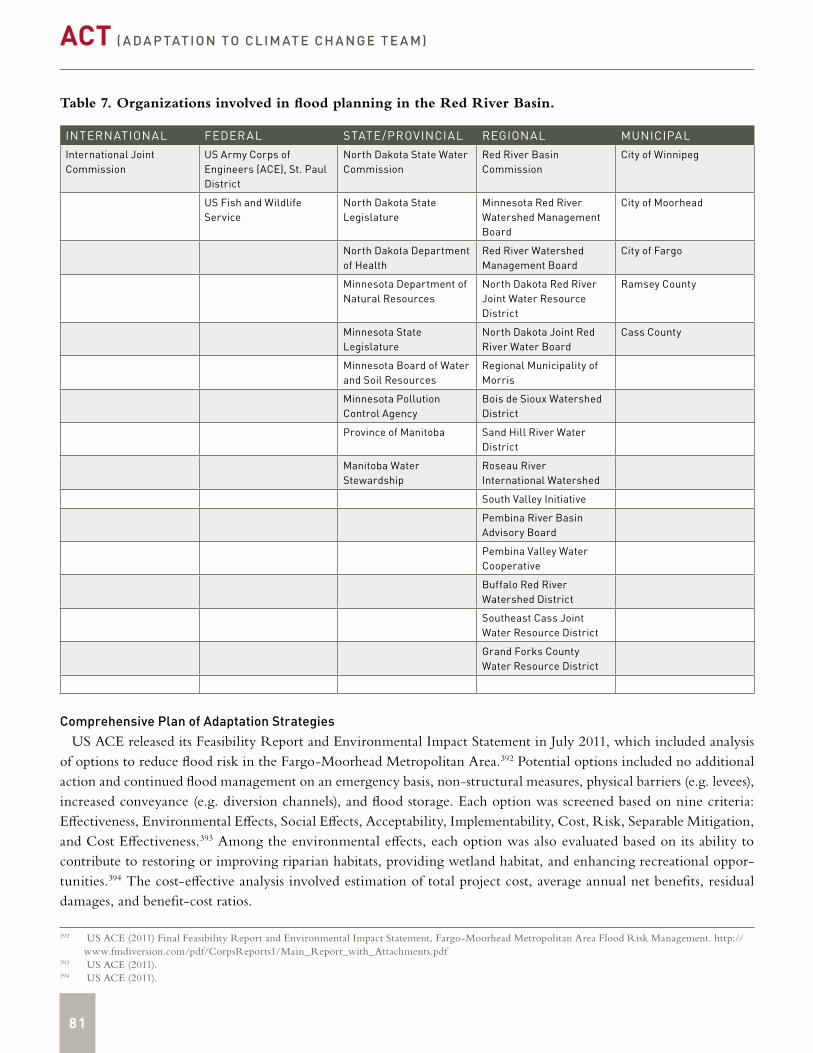
81
ACT ( A DA P TAT ION TO CL IM AT E CH A NGE T E A M)
Table 7. Organizations involved in flood planning in the Red River Basin.
INTERNATIONAL FEDERAL STATE/PROVINCIAL REGIONAL MUNICIPALInternational Joint Commission
US Army Corps of Engineers (ACE), St. Paul District
North Dakota State Water Commission
Red River Basin Commission
City of Winnipeg
US Fish and Wildlife Service
North Dakota State Legislature
Minnesota Red River Watershed Management Board
City of Moorhead
North Dakota Department of Health
Red River Watershed Management Board
City of Fargo
Minnesota Department of Natural Resources
North Dakota Red River Joint Water Resource District
Ramsey County
Minnesota State Legislature
North Dakota Joint Red River Water Board
Cass County
Minnesota Board of Water and Soil Resources
Regional Municipality of Morris
Minnesota Pollution Control Agency
Bois de Sioux Watershed District
Province of Manitoba Sand Hill River Water District
Manitoba Water Stewardship
Roseau River International Watershed
South Valley Initiative
Pembina River Basin Advisory Board
Pembina Valley Water Cooperative
Buffalo Red River Watershed District
Southeast Cass Joint Water Resource District
Grand Forks County Water Resource District
Comprehensive Plan of Adaptation StrategiesUS ACE released its Feasibility Report and Environmental Impact Statement in July 2011, which included analysis
of options to reduce flood risk in the Fargo-Moorhead Metropolitan Area.392 Potential options included no additional action and continued flood management on an emergency basis, non-structural measures, physical barriers (e.g. levees), increased conveyance (e.g. diversion channels), and flood storage. Each option was screened based on nine criteria: Effectiveness, Environmental Effects, Social Effects, Acceptability, Implementability, Cost, Risk, Separable Mitigation, and Cost Effectiveness.393 Among the environmental effects, each option was also evaluated based on its ability to contribute to restoring or improving riparian habitats, providing wetland habitat, and enhancing recreational oppor-tunities.394 The cost-effective analysis involved estimation of total project cost, average annual net benefits, residual damages, and benefit-cost ratios.
392 US ACE (2011) Final Feasibility Report and Environmental Impact Statement, Fargo-Moorhead Metropolitan Area Flood Risk Management. http://www.fmdiversion.com/pdf/CorpsReports1/Main_Report_with_Attachments.pdf
393 US ACE (2011).394 US ACE (2011).
CLIMATE CHANGE ADAPTATION AND CANADA’S CROPS AND FOOD SUPPLY BACKGROUND REPORT
82
Based on the performance of each option on the nine criteria selected, US ACE provided a plan for action to protect the Fargo-Moorhead Metropolitan areas. The plan recommends construction of the ND35K, a 36-mile (58-kilometre) diversion from near the confluence of the Red and Rice Rivers to north of the confluence of the Red and Sheyenne Rivers.395 While the diversion would offer the two cities protection from most flooding, it would result in the loss of 1,053 acres (426 hectares) of wetlands and 6,540 acres (2,647 hectares) of prime agricultural land.396
In September 2011, the Red River Basin Commission released its Long Term Flood Solutions for the Red River Basin (LTFS) report, which outlines a comprehensive plan for flood management across the Red River Basin. The report sum-marizes the findings of research and consultation with various agencies, organizations, and citizens’ groups since 2009, when serious flooding prompted governments to seek assistance from the RRBC to work with other stakeholders and develop a plan to manage the growing threat of flooding over the past half century, including two additional floods in 2010 and 2011.397 The draft report chronicles flood events over the past several decades, identifies factors that contribute to flooding, forecasting challenges, the role of a changing climate, and current risks and challenges. Although the LTFS report does not explicitly refer to CCA literature, it does address extreme events and shifts in climate variables, and involves adaptive management approaches consistent with recent CCA/DRR literature and practices.398The US ACE hydrological modeling that underpins the LTFS does not account for climatic change, however, it is based on revised flow frequency curves for the region that were developed using data from recent decades and reflect a higher frequency of extreme flooding events than those based on average data from the 1940s to the present.
It should also be noted that the LTFS focuses on flood protection and management issues that are were not fully addressed by the flood protection works constructed to protect urban areas after the major 1997 flood. To complement this infrastructure, Manitoba enacted a flood protection regulation, which requires new buildings to be elevated two feet above the 1997 flood level (Government of Manitoba, 2001) In the United States portion of the RRB similar approaches exist, for example North Dakota also legislated requirements for flood protection (North Dakota, 2011)
The following list of crop production flood damages is drawn from the RRBC LTFS report:399
• Direct damage from flooding of crop lands varies with respect to crops and yields and is influenced by time of seeding, soil conditions, seed variety, fertilizer use, emergence, disease, weed control, amount and timing of rainfall. (
• Flooding delays seeding, creates unfavorable seeding conditions, prevents planting if floodwaters stay long enough, results in harvest losses from later maturities, and where it stops planting in one year, soil water retention capacity is reduced in the next year.
• Erosion from flooding results in loss of yield from soil loss, costs for additional fertilizer applied to regain pro-ductivity, costs for cleaning sedimentation out of drainage systems and small streams, excessive sedimentation and nutrients to river and lake systems, and potentially affects relationships between stream bank erosion and control of runoff. ()
• Retention of floodwaters as a flood management measure takes cropland out of production. (0) The study goes on to describe the potential avoided cost associated with two future development options: achieving
recommended levels of local protection for sites, and adding upstream retention to reduce peak flows during 100-year 395 US ACE (2011).396 US ACE (2011).397 RRBC. (2011). Finding Long Term Flood Solutions Together – Report to State and Federal Officials on a Comprehensive Plan of Flood Strategies for
the Basin of the Red River of the North, 2009-2011. (Draft Report). Retrieved on September 2, 2011, from the RRBC website: http://www.redriver-basincommission.org/comprehensive_draft_8-29-11x.pdf
398 Black et al., 2010 provide a comprehensive step by step risk assessment based approach to CCA, which follows the Canadian Standards Association’s “Risk Management: Guidelines for Decision-makers” (CAN/CSAQ850- 01). Another example of a step-wise process for CCA is Alberta’s Climate Change Adaptation Framework Manual. When the risk is overland flooding, other more technical sources are available, for example, engineering stan-dards are provided in the Engineers Canada. “April 2009. PIEVC Engineering Protocol for Climate Change Infrastructure Vulnerability Assessment.”
399 RRBC September 30, 2011. Flood protection of homes, buildings and structures, and infrastructure associated with agricultural production, and other uses are contained in that report, but are not listed here.
8 3
ACT ( A DA P TAT ION TO CL IM AT E CH A NGE T E A M)
events by 20%.400 The RRBC concludes that, by implementing these two projects in tandem by 2050, current damages to urban areas of $2.7 billion and $6.2 billion due to 100-year and 200-year floods, respectively, would be eliminated, and damages due to 500-year floods would be reduced from $10.9 billion under current conditions to $0.7 billion.401 Direct and indirect costs of flooding to agricultural producers are also described.
In order to address these risks, the RRBC LTFS report calls for multipurpose strategy for agricultural land which is “Designed and engineered for both private benefits and public water management objectives… with the goal to reduce crop loss and to reduce planting delays by moving water off of land by mid-May in the spring and maximize flood control designs for peak run off for a 24-hour summer rainfall event with a 10 year reoccurrence interval.” (Pages 125-126)
The strategy would involve:
• Drainage works and controls with reference to physical capacity.• Improved floodplain management through:
» non-structural strategies, » local protection measures for rural residences, farmsteads, cropland, and transportation infrastructure,
supported by a multipurpose drainage strategy, and » retention strategies.
• Governance considerations, including improved collaboration between and across jurisdictions, equitable timing and movement of water, consideration of landowner incentives and needs that would be implemented throughout the basin.
The RRBC’s 2005 and 2011 reports and the IJC report by Halliday (2009) comment on continuing governance concerns. The following points made about governance are from the RRBC’s LTFS 2011 report:
“The Red River Basin, a vast geographic area of three states and one Canadian province, has great need for cooperation across boundaries for uniform data and information gathering efforts, an understanding of our differences, and a shared vision of what needs to be accomplished.
The current local, state, and federal partnership in comprehensive flood risk reduction strategies is disjointed and operates in a piecemeal fashion.
Each flood varies, creating unique issues regarding preparation and protection needs.
Levels of protection recommended by RRBC for the LTFS Report will provide the safety net needed and allow for variations in floods, weather, and forecasting.
Further improvements in flood forecasting such as new data sets, modeling improvements, and real time information to account for variables related to precipitation and temperature are needed to build upon those instituted after the 1997 flood.
Additional efforts and information are needed as a guide for the future as updated needs become evident.”
These concerns are similar to those made in the Council of Europe and UNISDR June 2011 report (see Section 11: Disaster risk reduction: an integrated approach to adaptation).400 RRBC. (2011). 401 RRBC. (2011).
CLIMATE CHANGE ADAPTATION AND CANADA’S CROPS AND FOOD SUPPLY BACKGROUND REPORT
8 4
In Manitoba, watershed-based Agricultural Land Use and Management (ALUM) reports are being prepared by Agriculture and Agrifood Canada and Manitoba Agriculture (AAFC, April 18th, 2011), to inform the preparation of Integrated Water Management Plans (IWMP) by Manitoba’s Conservation Districts. The ALUM reports provide a de-tailed profile of agricultural land capability and land uses, and are excellent starting point for any assessment of flooding and drainage considerations in relation to existing and potential agricultural land uses.402
In the American portion of the RRB—notwithstanding the governance concerns expressed in the RRBC LTFS report—state of the art assessment and analytical “tools” are being developed to help determine flood and drainage management approaches in rural and agriculturally productive areas in prairie settings.403
With these planning, legislated and technical approaches in mind, protecting crops and food supplies from overland flooding in prairie grain production settings is not hampered by lack of knowing what to do, or how to do it. The information needed to inform decisions about priorities, policies, programs and practices is beginning to be collected and presented. The challenge involves deciding to prioritize and finance actions.
12.2 UNITED STATES DEPARTMENT OF THE INTERIOR, BUREAU OF LAND MANAGEMENT
BackgroundThe United States Department of the Interior (USDOI) Bureau of Land Management (BLM) is responsible for man-
aging activities on federally-owned public lands across the continental USA, including land use and leasing for energy and grazing, land use planning, conservation, recreation, and wildfire control. It is primarily focused on the western states, and also has offices in Wisconsin, Virginia, and Mississippi. The BLM manages 245 million acres (nearly 100 million hectares) of land surface as well as 700 million acres (283 million hectares) worth of subsurface mineral rights.404
The Need for AdaptationIn September 2009, Secretary of the Interior Ken Salazar issued an order to the USDOI regarding renewable energy
and climate change. Secretarial Order No. 3285 commits to “a Department-wide approach for applying scientific tools to increase understanding of climate change and to coordinate an effective response to its impacts on tribes and on the land, water, ocean, fish and wildlife, and cultural heritage resources that the Department manages.”405
According to Salazar, the Order was provided to offer the support of the USDOI’s considerable resources to reduce the impacts of climate change on Americans:406
“Across the country, Americans are experiencing first-hand the impacts of climate change, from growing pressure on water supplies to more intense droughts and fires to rampant bark beetle infestations. Because Interior manages one-fifth of our nation’s landmass and 1.7 billion acres on the Outer Continental Shelf, it is imperative that we tackle these impacts of a failed and outdated energy policy. This secretarial order is another
402 This approach in Manitoba has some similarities to the approach being used by the US Department of Interior, Bureau of Reclamation in the prepara-tion of multi-sector climate adaptation strategies through the use of Integrated Water Resource Management Plans.
403 The following websites provide access to US-based technical documents and approaches:http://www.rrbdin.org/toolshttp://www.rrbdin.org/
Accessed on February 8, 2012404 BLM website: http://www.blm.gov/wo/st/en/prog/energy.html405 Salazar, K. (2009) Order No. 3289. The Secretary of the Interior. http://www.doi.gov/archive/climatechange/SecOrder3289.pdf406 USDOI (2009) Press release: Salazar launches DOI Climate Change Response Strategy. September 14, 2009. http://www.doi.gov/news/pressreleases/
Salazar-Launches-DOI-Climate-Change-Response-Strategy.cfm
85
ACT ( A DA P TAT ION TO CL IM AT E CH A NGE T E A M)
milestone in our continuing effort to change how Interior does business to respond to the energy and climate challenges of our time.”
The Order established a Climate Change Response Council to develop and carry out a strategy for the US DOI to identify, research, and develop adaptive management tools for natural and cultural resources and specifies the following mechanisms for integrating climate change into US DOI operations:407
• Climate change response planning requirements for all long-range planning exercises, research activities, management plans, and major decisions.
• Eight USDOI regional climate change response centers to offer technical climate-related and management information to USDOI staff and decision-makers.
• Landscape conservation cooperatives to coordinate climate change adaptation measures between departments and organizations.
In addition to tackling climate change adaptation, the Order re-iterates the US DOI commitment to mitigating climate change impacts through supporting renewable energy projects on public lands and establishes two additional projects:
• The DOI Carbon Storage Project, to research and develop geological and biological carbon sequestration methodologies.
• The DOI Carbon Footprint Project, to develop a Department-wide GHG emission reduction program.
The Order took effect immediately and applies to all branches that operate within the USDOI, including the Bureau of Indian Affairs, Bureau of Ocean Energy Management, Bureau of Safety and Environmental Enforcement, Bureau of Reclamation, National Park Service, U.S. Fish and Wildlife Service, U.S. Geological Survey, Office of Surface Mining, and the BLM.
Key Organizations in Adaptation GovernanceThe USDOI seeks to support climate change adaptation and work with all interested partners within its operating area.
Comprehensive Plan of Adaptation StrategiesThe BLM has identified several challenges to management of public lands associated with climate change.408 Climate
change will require new approaches to water management to address seasonal water shortages in some regions and periodic flooding in others. Sea level rise may require managed retreat from coastal regions to upland areas and restoration of coastal wetlands to protect from storm surges. As wildlife populations respond to changing conditions, habitats may need to be managed in areas where management was not previously necessary, and migration corridors may be required to provide access to these new habitats. Invasive species may outcompete native species under new or changing conditions, resulting in new management challenges. Decreased precipitation and warmer temperatures may increase the frequency and severity of forest and grassland fires on public lands. These challenges have increased pressure on governments to respond with new approaches that are capable of responding to changing conditions, rather than assuming stationarity.
In order to address the increasing and complex challenges imposed on public lands and the resulting impacts to the well-being of American citizens, the BLM is supporting two initiatives: a landscape approach to land management and Rapid Ecoregional Assessments (REAs). The BLM states the following objectives:409
407 Salazar (2009).408 Salazar, K. (2009) Order No. 3289. The Secretary of the Interior. http://www.doi.gov/archive/climatechange/SecOrder3289.pdf409 BLM website: http://www.blm.gov/wo/st/en/prog/more/climatechange.html
CLIMATE CHANGE ADAPTATION AND CANADA’S CROPS AND FOOD SUPPLY BACKGROUND REPORT
86
“The purpose of these initiatives is to help BLM managers and public land stakeholders understand environmental conditions and trends from a broader landscape perspective, and to use this information to inform, focus, and coordinate management efforts on-the-ground. The REAs and proposed landscape approach offer a way to integrate the BLM’s conservation, restoration, and development programs in a cohesive manner. These efforts will help sustain important public land values and meet the Nation’s energy needs in an era of climate change and other profound environmental challenges.”
The landscape approach is intended to facilitate land management decisions concerning areas with similar environ-mental characteristics. Landscapes typically span multiple jurisdictions, including those of the BLM. Offering the BLM’s support to coordinating management planning and activities offers other local stakeholders an opportunity to coordinate management efforts across jurisdictional boundaries.
REAs are developed to synthesize information about valued ecological areas across the BLM’s operating area, such as wildlife habitats and corridors, as well as risks to these areas due to climate change, wildfires, invasive species, energy development, and expansion of urban areas.410 The initiative will help governments and local organizations to make in-formed decisions about management priorities, including those related to land use, conservation and energy development. Baseline ecological data will be collected and indicators monitored to evaluate the outcomes of management decisions.
The BLM is also supporting climate change mitigation efforts by encouraging and supporting citing of environment-ally sound renewable energy projects on federal lands, investigating subsurface carbon storage, and investing in energy efficient retrofits at its facilities.
12.3 AUSTRALIA
BackgroundMean annual temperatures across Australia have risen since 1910, with a pronounced increase since the mid-1970s.411
Hot days and hot nights have become more common, and the number of cold days each year has fallen.412 Warming has occurred in the oceans around Australia. Interannual variability in precipitation has also created extreme conditions, including monsoons and droughts.413 In New South Wales, average annual precipitation has increased, while in south-west and southeast regions rainfall has decreased since the mid-20th century.414 Annual snowpack depth in southeastern Australia has fallen by nearly 40% over the past four decades, indicating a strong drying trend.415 The combined effects of these changes have vast implications for human health, agriculture, fisheries, and forestry across the country.
While nearly 60% of Australia is used for agriculture, production is concentrated in the Murray-Darling Basin, which encompasses a large area of New South Wales as well as portions of South Australia, Victoria, and Queensland. This area has experienced drier, warmer annual conditions, which has placed stress on farmers. Further climatic change in accordance with current trends could lead to the following impacts to the agricultural sector in the Murray-Darling Basin:416
• Water-logging, soil acidification, soil erosion and dryland salinity.• Increased distribution of exotic weeds.
410 BLM website: http://www.blm.gov/wo/st/en/prog/more/Landscape_Approach.html411 PMSEIC Independent Working Group (2007) Climate Change in Australia: Regional Impacts and Adaptation – Managing the Risk for Australia, Report Prepared for the Prime Minister’s Science, Engineering and Innovation Council, Canberra. http://www.innovation.gov.au/Science/PMSEIC/Documents/ClimateChangeinAustralia.pdf412 Climate Change in Australia website: http://www.climatechangeinaustralia.gov.au/pastchange.php413 PMSEIC Independent Working Group (2007).414 PMSEIC Independent Working Group (2007).415 PMSEIC Independent Working Group (2007).416 PMSEIC Independent Working Group (2007).
87
ACT ( A DA P TAT ION TO CL IM AT E CH A NGE T E A M)
• Reduced pasture growth, with subsequent impacts on cattle weight gain.• Lower crop yields.• Livestock mortality.
In response to these pressing water-related challenges, the formation of the Murray Darling Basin Authority and its predecessor, the Murray-Darling Basin Commission, was mandated under the 2007 Water Act to coordinate water management planning, activities, and programs among jurisdictions within the Murray-Darling Basin.417 The Australian Government recognizes water-related risks to be of particular concern, and has expressed that crop production in south-ern Australia may no longer be viable in dry margins if annual rainfall continues to diminish.418 By 2100, the State of South Australia is forecast to experience a 33% decline in livestock productivity, and a 44% reduction in the area of land suitable for cultivation of wine grapes.419 Wheat production in the State of Victoria is expected to fall by nearly 25%.420
In addition to shifting climatic conditions, farmers have been faced with extreme events, such as hail storms and cyclones, which can damage crops and trees.421
The Need for AdaptationThe Australian Government recognizes that further climatic change is inevitable.422 Decades’ worth of climate data
provides strong evidence that the climate in Australia will continue to become hotter, with more frequent extreme temperature events, and there is uncertainty around projections of exact local and regional climate characteristics, such as rainfall.423 While the Australian Government continues to work on data collection and climate modeling, adaptation planning is proceeding in spite of uncertainty. The approach remains flexible, and will involve ongoing assessment, analysis, and response to changing conditions.
Australia’s market-driven, export-focused agricultural sector offers some parallels to that of Canada. Approximately 65% of Australia’s agricultural goods are exported.424 However, producer support in Australia has fallen considerably in recent years, and the country now offers the second-lowest level of producer support of all OECD countries.425 The country minimizes its degree of policy intervention and regulation, and offers support to producers only during short-term, low-frequency events that occur at most every 20 years, on average.426 These events are referred to as “Exceptional Circumstances”, and support is offered in the form of Relief Payments and Interest Rate Subsidies.427
Key Organizations in Adaptation GovernanceTable 8 provides a summary of organizations that are working collaboratively on climate change adaptation for
agriculture in Australia.
417 Murray-Darling Basin Authority website: http://www.mdba.gov.au/about418 PMSEIC Independent Working Group (2007).419 Garnut, R. (2010) The Garnut Climate Change Review. Chapter 6: Climate Change Impacts on Australia. http://www.garnautreview.org.au/pdf/
Garnaut_Chapter6.pdf420 Garnut (2010).421 PMSEIC Independent Working Group (2007).422 Australian Government. (2010). Adapting to Climate Change in Australia – An Australian Government Position Paper. http://www.climatechange.gov.
au/~/media/publications/adaptation/gov-adapt-climate-change-position-paper.pdf423 Samson, C. (2006). Farming profitably in a changing climate: A risk management approach. Bureau of Rural Sciences, Australian Government.
Retrieved on August 22, 2011 from the Bureau of Rural Sciences website: http://adl.brs.gov.au/data/warehouse/pe_abare99001237/pc13379.pdf424 AAFC. (2007). Australia Agriculture Policy Review. AAFC. Retrieved initially on October 11, 2011 and again with new URL on June 18, 2013 from
the AAFC website: http://www4.agr.gc.ca/resources/prod/doc/pol/pub/oecd-oced/pdf/aust_e.pdf425 OECD. (2011b). Agricultural Policy Monitoring and Evaluation 2011 – OECD Countries and Emerging Economies. Australia. Retrieved on
October 11, 2011 from the OECD website: http://www.oecd-ilibrary.org/agriculture-and-food/agricultural-policy-monitoring-and-evaluation-2011/australia_agr_pol-2011-8-en
426 OECD. (2011b).427 OECD. (2011b).
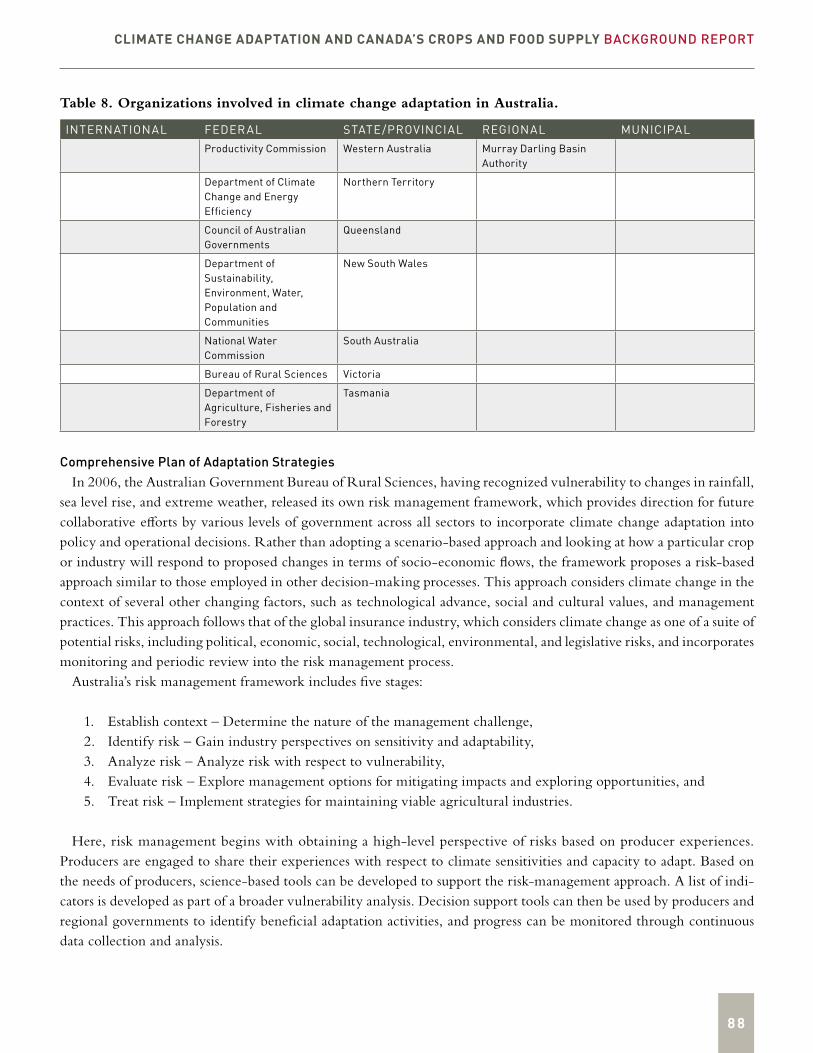
CLIMATE CHANGE ADAPTATION AND CANADA’S CROPS AND FOOD SUPPLY BACKGROUND REPORT
8 8
Table 8. Organizations involved in climate change adaptation in Australia.
INTERNATIONAL FEDERAL STATE/PROVINCIAL REGIONAL MUNICIPALProductivity Commission Western Australia Murray Darling Basin
Authority
Department of Climate Change and Energy Efficiency
Northern Territory
Council of Australian Governments
Queensland
Department of Sustainability, Environment, Water, Population and Communities
New South Wales
National Water Commission
South Australia
Bureau of Rural Sciences Victoria
Department of Agriculture, Fisheries and Forestry
Tasmania
Comprehensive Plan of Adaptation StrategiesIn 2006, the Australian Government Bureau of Rural Sciences, having recognized vulnerability to changes in rainfall,
sea level rise, and extreme weather, released its own risk management framework, which provides direction for future collaborative efforts by various levels of government across all sectors to incorporate climate change adaptation into policy and operational decisions. Rather than adopting a scenario-based approach and looking at how a particular crop or industry will respond to proposed changes in terms of socio-economic flows, the framework proposes a risk-based approach similar to those employed in other decision-making processes. This approach considers climate change in the context of several other changing factors, such as technological advance, social and cultural values, and management practices. This approach follows that of the global insurance industry, which considers climate change as one of a suite of potential risks, including political, economic, social, technological, environmental, and legislative risks, and incorporates monitoring and periodic review into the risk management process.
Australia’s risk management framework includes five stages:
1. Establish context – Determine the nature of the management challenge,2. Identify risk – Gain industry perspectives on sensitivity and adaptability,3. Analyze risk – Analyze risk with respect to vulnerability,4. Evaluate risk – Explore management options for mitigating impacts and exploring opportunities, and5. Treat risk – Implement strategies for maintaining viable agricultural industries.
Here, risk management begins with obtaining a high-level perspective of risks based on producer experiences. Producers are engaged to share their experiences with respect to climate sensitivities and capacity to adapt. Based on the needs of producers, science-based tools can be developed to support the risk-management approach. A list of indi-cators is developed as part of a broader vulnerability analysis. Decision support tools can then be used by producers and regional governments to identify beneficial adaptation activities, and progress can be monitored through continuous data collection and analysis.
89
ACT ( A DA P TAT ION TO CL IM AT E CH A NGE T E A M)
In 2006, the Australian Department of Agriculture, Fisheries and Forestry (DAFF) and state governments produced the National Agriculture and Climate Change Action Plan 2006-2009, which identified four areas in where multiple risks to agriculture from climate change should be managed: adaptation, mitigation, research and development invest-ment, and awareness and communication. The plan leveraged knowledge gained during development of the National Biodiversity and Climate Change Action Plan 2004-2007, and outlined strategies and actions to integrate climate change considerations into training, farm management and communications, integrate adaptation into agricultural adjustment programs using a risk management approach, develop approaches and tools to manage climate change risks, develop monitoring networks to improve understanding of the effects of climate change and variability, and improve models to predict climate impacts on agriculture.
The National Climate Change Adaptation Framework was published in 2007 by the Coalition of Australian Governments, an intergovernmental forum consisting of the Australian Prime Minister, State Premiers, Territory Chief Ministers and the President of the Australian Local Government Association. The Adaptation Framework followed from the COAG’s 2006 Plan of Collective Action on Climate Change, and outlines a “future agenda of collaboration between governments to address key demands from business and the community for targeted information on climate change impacts, and to fill critical knowledge gaps which currently inhibit effective adaptation.” The Adaptation Framework directs the following actions to support build understanding and adaptive capacity and reduce vulnerability in key sectors by helping decision-makers to incorporate climate change into policies and operational decisions:
• support decision-makers with practical guides and tools to assist in managing climate change impacts; • establish a new centre for climate change adaptation to provide decision-makers with robust and relevant in-
formation on climate change impacts, vulnerability and adaptation options; • provide, for the first time, climate change projections and regional scenarios at scales relevant to decision-makers; • generate the knowledge to understand and manage climate change risks to water resources, biodiversity, coasts,
agriculture, fisheries, forestry, human health, tourism, settlements and infrastructure; • work with stakeholders in key sectors to commence developing practical strategies to manage the risks of climate
change impacts; and • assess the implications of climate change and possible adaptations for important regions such as the Murray-
Darling Basin, south-west Western Australia, the tropical north, and the drying regions of eastern Australia.
The Australian Government acted quickly on these recommendations with the establishment of the National Climate Change Adaptation Research Facility, a research facility that brings together national experts to conduct research on climate change and its impacts, and the development of a series of aspect and sector-specific adaptation plans and pro-grams. Research, planning, and program management are carried out under the National Climate Change Adaptation Program, a $126 million (AUS) initiative to help understand and manage the risks of climate change.
With respect to agriculture, the key challenges to Australian policy-makers are to increase the economic viability of farming while conserving natural resources and mitigating the risks associated with climate change. Water scarcity is a limiting factor for many Australian farmers.
Australia’s New Farming Future is a program to support farm-level adaptation that was developed on the basis of an assessment of agricultural producers’ needs, which was conducted in 2009. Consultants were retained by the DAFF to develop an evidence-based communications strategy that could encourage farmers, fishers, and foresters to act on climate change adaptation. The assessment included a desktop review of issues facing producers; consultations with key stakeholders, including interviews and focus groups; and a national survey, reaching 1,000 urban residents and 1,000 primary agricultural producers. The final report categorized the agricultural sector according to five groups, based on producers’ attitudes toward climate change and adaptation and provided recommendations about how to engage in
CLIMATE CHANGE ADAPTATION AND CANADA’S CROPS AND FOOD SUPPLY BACKGROUND REPORT
90
dialogue with each group. The program allocated funding to assist with adaptation to projected physical, social, and economic impacts of climate change over four years, from 2008-2012.
Australia’s New Farming Future includes the following five components:
• Climate Research Program – Offers funding for research and on-farm demonstration projects focused on re-ducing greenhouse gas emissions, improving soil management, and climate change adaptation.
• FarmReady – Assists producers and food processors with adaptation to climate change through Reimbursement Grants (up to $1,500) and Industry Grants (up to $80,000).
• Climate Change Adjustment Program – Supports farmers suffering losses due to climate change to manage impacts and develop financially sustainable long-term plans by offering business analysis, financial assessments, professional advice, and training. Advice and training grants of up to $5,500 are offered.
• Transitional income support – Offers short-term income support, advice, and training to producers experiencing financial hardship due to climate change while they adapt their operations.
• Community Networks and Capacity Building – Fosters development of networks to build representative leadership and capacity in order to strengthen the resilience of producer communities facing challenges due to climate change. The program is specifically focused on helping women, young people, indigenous people, and other minorities to build capacity for resilience.
To address water-related challenges, including climate change, the Australian Government launched Water for the Future in 2009. At $12.9 billion (AUS), the ten-year program is the government’s single largest investment in adaptation to date. It was designed to address four priorities: taking action on climate change, securing water supplies, using water wisely, and supporting healthy rivers. Rural water, including water for agricultural use, is addressed through water policies and programs, such as the Sustainable Water Use and Infrastructure program (SWUI). The $5.8 billion (AUS) program was developed to improve rural water use by supporting private investments in irrigation infrastructure and rural community investments in climate change adaptation through securing long-term water supplies. The program is run jointly by the Australian Government and the Murray-Darling Basin Authority, and has invested in fifteen state-led projects across the Basin.
In 2010, the Australian Government published a position paper which established climate change adaptation as a priority and highlighted six national priority areas for action: coastal management, water, infrastructure, natural systems of significance, preparation for and management of natural disasters, and agriculture. Rather than creating new policies for adaptation, Adapting to Climate Change in Australia proposes that climate change impacts be embedded in policy development in order to benefit from “existing institutions and frameworks.” The document states that “new institu-tional or policy structures will be considered only where a demonstrated case has been made and existing frameworks cannot manage those risks effectively.”
Following from this recommendation, the Australian Government reviewed its National Drought Policy to incor-porate current climatic, social, and economic information. A pilot project to evaluate the performance of new drought management measures was conducted in Western Australia from July 2010 to June 2011. These measures are intended to shift the approach to drought from crisis-based management to risk management.
The most recent stage in the evolution of Australia’s climate change governance of adaptation governance is the current study being undertaken by the Productivity Commission of the Australian Government to assess the role of regulation and policy barriers to effective climate change adaptation. The study will examine the costs and benefits of various policy options, including a business-as-usual approach; evaluate the role of markets in adaptation, including insurance markets; and assess non-market mechanisms, such as government intervention. Policies will include those that can be implemented at each level of government. The project is intended to assist the COAG to advance climate
91
ACT ( A DA P TAT ION TO CL IM AT E CH A NGE T E A M)
change adaptation through policy approaches that demonstrate the highest net benefits of implementation. The results of the study will be released in September 2012.
The report, Barriers to Effective Climate Change Adaptation, was released in Draft in April 2012. Recommendations include the following:
Policy reforms that would help people, firms and governments deal with current climate variability and extreme weather events should be prioritised. These ‘no-regret’ or ‘low-regret’ reforms would deliver benefits and build adaptive capacity for responding effectively to future impacts. Examples include:
– reducing perverse incentives in tax, transfer and regulatory arrangements that impede the mobility of labour and capital
– improving information on climate risks by increasing the quality and availability of natural hazard mapping
– clarifying the roles, responsibilities and legal liability of local governments, and improving their capacity to manage climate risks
– improving emergency management arrangements
– avoiding regulatory distortions in insurance markets.
The case for implementing reforms now to address barriers to adaptation to uncertain future climate trends is less clear.
– For reforms with low up-front costs and potentially large but distant benefits some preparatory action could be worthwhile. The case is stronger for reforms that would deliver benefits under a range of climate change scenarios. For instance: producing and disseminating localised (downscaled) climate projections designing flexible planning regulation to respond to uncertain climate change impacts developing ap-proaches to managing risks to existing settlements.
– Where measures have high up-front costs, there is likely to be a benefit to the community in deferring action until better information becomes available.
Governing authorities within individual basins, such as the largely agricultural Corangamite basin in the state of Victoria, have launched their own initiatives to manage natural resources under multiple pressures including changing climatic conditions, growing populations, and habitat degradation. In 2012, the Corangamite Catchment Management Authority (CCMA) published its Regional Catchment Strategy 2012-2018 and encouraged feedback from the public through review of the document, open houses, workshops, listening posts, and online forums before finalization. The CCMA developed the draft Strategy through partnership with the national, state, and local governments as well as local communities, aboriginal groups, and industry representatives but recognized from the outset that, since nearly 78% of land within the basin is privately owned,public engagement and feedback would be critical for successful implementation.
The Regional Catchment Strategy 2012-2018 establishes a 50-year vision, priority assets, 20-year objectives, and six-year strategic actions for managing resources within the basin. A map of management “hot spots”, which represent
CLIMATE CHANGE ADAPTATION AND CANADA’S CROPS AND FOOD SUPPLY BACKGROUND REPORT
92
clusters of high-value agricultural lands, aquifers, coastal areas, marine areas, rivers and floodplains, terrestrial habitat, threatened flora and fauna, and wetlands is also included to guide actions. With respect to agriculture, the Regional Catchment Strategy 2012-2018 highlights the social and economic values offered by agriculture in the basin, its role in supporting other natural resource sectors, and the opportunity that agricultural landowners possess to contribute to achieving environmental goals. The draft document draws from existing legislation and policies at the national and state levels to establish management priorities and establish strategic actions.
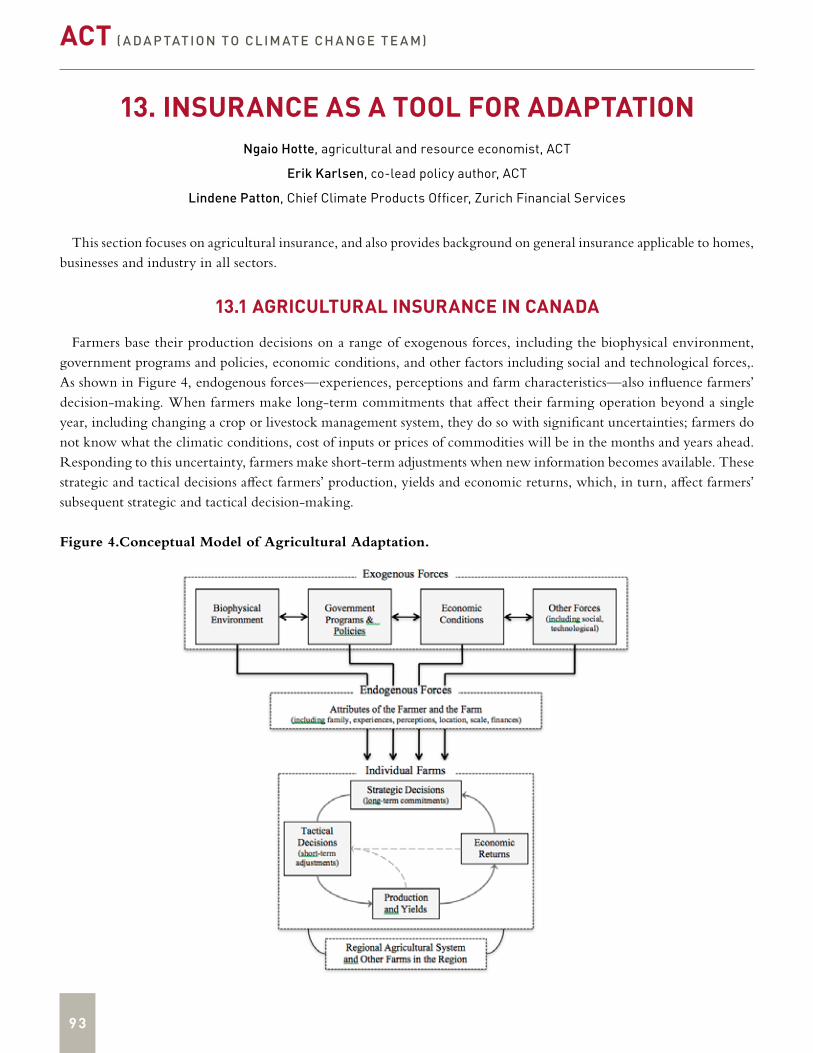
93
ACT ( A DA P TAT ION TO CL IM AT E CH A NGE T E A M)
13. INSURANCE AS A TOOL FOR ADAPTATIONNgaio Hotte, agricultural and resource economist, ACT
Erik Karlsen, co-lead policy author, ACT
Lindene Patton, Chief Climate Products Officer, Zurich Financial Services
This section focuses on agricultural insurance, and also provides background on general insurance applicable to homes, businesses and industry in all sectors.
13.1 AGRICULTURAL INSURANCE IN CANADA
Farmers base their production decisions on a range of exogenous forces, including the biophysical environment, government programs and policies, economic conditions, and other factors including social and technological forces,. As shown in Figure 4, endogenous forces—experiences, perceptions and farm characteristics—also influence farmers’ decision-making. When farmers make long-term commitments that affect their farming operation beyond a single year, including changing a crop or livestock management system, they do so with significant uncertainties; farmers do not know what the climatic conditions, cost of inputs or prices of commodities will be in the months and years ahead. Responding to this uncertainty, farmers make short-term adjustments when new information becomes available. These strategic and tactical decisions affect farmers’ production, yields and economic returns, which, in turn, affect farmers’ subsequent strategic and tactical decision-making.
Figure 4.Conceptual Model of Agricultural Adaptation.
CLIMATE CHANGE ADAPTATION AND CANADA’S CROPS AND FOOD SUPPLY BACKGROUND REPORT
94
Research indicates that economic considerations are the main factor in influencing changes in farming practices. For farmers, climate risks are closely linked to economic considerations, in that they have a profound effect on production levels, yields, input costs and environmental factors.
Given the primary focus on economic considerations, and given the significant impact of climate risks on those economic considerations, it is not surprising that insurance is important to the agricultural sector. In general, insurance is used to reduce exposure to financial risk by dispersing risk temporally, spatially, and among multiple industries and individuals. Private insurers also seek to limit their exposure to risk and maximize profits by instituting policies and employing strategies such as charging premiums on claims, implementing underwriting standards, or refusing coverage to high-risk applicants. Many insurers even purchase re-insurance to cover their own financial risks. Agricultural in-surance presents a challenge to private insurers because risks are spatially correlated (i.e. several farmers will be affected simultaneously by an extreme event) and information asymmetry about these risks exists between farmers and insurance providers. The former can lead to very large indemnities in some years and very low indemnities in other years, resulting in the need for smoothing over time.
There are five main types of agricultural insurance available to producers in different regions of the world:
• Crop insurance, • Revenue insurance, • Index insurance, • Livestock insurance • Forage and pasture insurance.
Crop insurance is frequently used to cover short-term harvest losses due to weather- and even pest-related events, and can be further categorized as single-risk insurance (e.g. hail or fire), combined insurance (e.g. hail, frost, and flood), and yield insurance (e.g. all climatic risks, including drought). Single-risk and combined insurance policies are more commonly offered by private companies, while more comprehensive yield coverage is more likely to be offered by governments. The differences in policy types offered by private and government insurers reflect the respective mandates, priorities, and business models of these organizations. In addition to isolated events, yield insurance covers highly correlated and systemic events such as drought that have characteristically large indemnities that have high associated re-insurance costs. Significant public support is required to support higher-cost, extensive yield coverage. All three types of crop insurance are offered by the Government of British Columbia, with specific policies differing by industry and commodity type.
Revenue insurance provides producers protection against price or market fluctuations. Federal government risk management programs in Canada currently address revenue insurance.
Index insurance programs are more akin to financial derivatives or options than to conventional insurance policies; indeed, some index programs can be brokered as either insurance contracts or traded options. Weather derivatives or options are managed by financial institutions, whereas weather and index insurance are the jurisdiction of insurers. Compared to traditional crop insurance, weather index insurance avoids moral hazard (a deliberate action to bring about a peril) and adverse selection and allows greater coverage because of reduced administrative costs and welfare losses. The drawback of index insurance remains that insured events may not reflect individual production losses; this type of insurance is most appropriate for homogenous areas that experience consistent regional effects. Index insurance is also difficult to price; financial derivatives have been employed but actuarial methods may be more appropriate.Two types of index insurance are used: Area yield and revenue insurance, and indirect index insurance. The former are more complex and use one or more indicators to adjust yield, while the latter use a fixed or proportional payment per unit decrease in the value of the index. Pilot index insurance programs have been successfully implemented to manage multiple covariate climate-related risks.
95
ACT ( A DA P TAT ION TO CL IM AT E CH A NGE T E A M)
Livestock survival and quality are related to health, survival, and environmental risks, all of which may covary with climate and weather. Specific environmental concerns are those that affect availability of pasture, forage, and water; the presence of diseases and pathogens; and heat or cold stress. Since livestock issues that affect human health are typically regulated and covered by aid programs, livestock insurance may not typically cover livestock disease. In many countries, livestock insurance covers accidents and non-contagious diseases.
Although rare due to the difficulties of assessing loss, index-based pasture and forage insurance has been offered in some regions such as Alberta and Spain. Insurers in these regions have developed methods to evaluate losses based on satellite imagery and vegetation health indexes.
The first federal agricultural production insurance legislation was introduced in Canada in 1959, and has since been replaced by the Farm Income Protection Act and Production Insurance Regulations. Presently, there are two types of federal-provincial programs available to protect Canadian agricultural producers from financial hardship resulting from and climate- and weather-related risks: Production Insurance and Business Risk Management programs. These programs are intended not to interfere with regular market signals and functioning, or to address fluctuations in prices received by producers due to changes in the business cycle, but to provide support in the event of natural disasters and disease- or pest-related events.
The majority of crop insurance in Canada is provided to producers by the federal and provincial governments, which share the cost of providing insurance on a 60:40 basis. Private crop hail and fire insurance is also available in provinces such as Alberta, Saskatchewan and Manitoba.
Provincial governments establish their own respective agricultural insurance legislation under the federal Act, grant-ing provinces the freedom to tailor the program to the needs of its producers. Crop Insurance was first introduced to British Columbia in 1967. British Columbia rebranded its Crop Insurance program as Production Insurance to reflect the variety of agricultural goods covered by the program, which include berries, forage, grains, grapes, flower bulbs, tree fruits, and vegetables. Production Insurance is divided into minimum and optional coverage. Producers in British Columbia contribute 25%-30% of the total cost of Production Insurance, compared to 40% in other provinces.
Nearly all government-subsidized agricultural insurance programs are based on a Public Private Partnership (PPP) between governments and private insurers.428 Where national programs exist, risk is aggregated and shared among multiple insurance companies, while extreme events are backed by re-insurers. Governments that offer subsidized in-surance do so to avoid financial exposure and market failures that can result when correlated events cause agricultural losses over large areas.
Climate change is emerging as a game-changer for the insurance industry, and agricultural insurance providers in particular. Traditionally, insurers have estimated their risk during a future crop year based on historical data. Risk to insurers is influenced by both the probability that an event will occur and lead to financial losses by insured producers and the probability that insured producers will be unable to absorb financial losses.429 However, a changing climate means that insurers are less able to predict natural disasters based on historical data, let alone forecast risks based on interactions of multiple variables.430
The Insurance Bureau of Canada (IBC) reports that combined losses to homes and businesses from extreme events as well as smaller climate-related events were approximately $1 billion in 2009 and 2010 and $1.6 billion in 2011.431 These losses were, in part, due to the combined impacts of increased peak levels of precipitation and aging stormwater infrastructure.432 IBC has also raised concerns about projected increases in the size and intensity of wildfires across the country and the implications of sea level rise.
428 http://media.swissre.com/documents/rethinking_insurance_solutions_for_managing_the_food_crisis_en.pdf429 International Institute for Sustainable Development430 Meyer, Marion (1997) The Insurance Industry and Climate Change on the Prairies, International Institute for Sustainable Development (Accessed July 15,
2011) http://www.Meyer (1997)..org/pdf/insurance_climate.pdf431 IBC (2012) Telling the Weather Story. Prepared by the Institute for Catastrophic Loss Reduction.432 IBC (2012).
CLIMATE CHANGE ADAPTATION AND CANADA’S CROPS AND FOOD SUPPLY BACKGROUND REPORT
96
In 2007, an assessment of the financial risks of climate change to federal and private insurers conducted by the United States Government Accountability Office (GAO) concluded that the effects of climate change and weather-related events to insured and uninsured crops in the coming decades are potentially significant.433 The study identified that a changing climate is likely to increase the frequency and severity of crop-damaging events, including flooding and drought, despite uncertainties in timing and magnitude of such events.434
In Canada, the federal and provincial governments along with farmers fund agricultural insurance programs, which are delivered by the provinces. In June 2010, an assessment undertaken for the federal government concluded that:
For now, these institutions are not making any specific changes to take climate change into account. They adjust premiums and coverages based on previous yields and losses. Thus, the impacts of climate change are an implicit part of the process for updating insurance programs. To date, insurance program managers have not had enough information to go further in terms of integrating future climate change into their insurance products.435
The only provinces identified as taking tangible steps with regard to crop insurance and climate change were: (1) Quebec, which is establishing data collection and research projects to help farmers adapt to climate change; and (2) Ontario and (3) Manitoba, which are considering using insurance tools to deal with climate change impacts.436
Insurance exists to protect against the financial impacts of relatively low-frequency events and cannot guard farmers against permanent shifts in climate conditions,437 however, increased variability of climatic conditions may offer a role for private insurers to help farmers transfer risks to a third party by paying a premium that reflects the long-term costs associated with those risks. The challenge to insurers is to model and predict future climatic conditions (i.e. average conditions and variation) at sufficiently fine resolution as to address regional differences in risk to agricultural production and price insurance premiums accordingly – a daunting task, given the inherent uncertainty in climate models, which has been emphasized by work done for USDA insurance program.
The U.S. Government Accountability Office (GAO, 2007)438 issued a report recommending that that the Secretaries of Agriculture and Homeland Security analyze the potential, long-term fiscal implications of climate change for the Federal Crop Insurance Corporation’s (FCIC’s) crop insurance program and for the National Flood Insurance Program (NFIP), respectively. The FCIC report was completed by the Department of Agriculture’s Risk Management Agency (USDA, 2010)439 and Beach et al. 2010.440
433 United States Government Accountability Office (2007) Report to the Committee on Homeland Security and Government Affairs, U.S. Senate – Climate Change: Financial risks to federal and private insurers in coming decades are potentially significant (Accessed July 1, 2011) http://www.gao.gov/new.items/d07285.pdf
434 U.S. GAO (2007).435 Jacques, L., De Vit, C., & Gagnon-Lebrun, F. (2010) Status of Climate Change Adaptation in Canada’s Agricultural Sector. Ottawa: Policy Research
Initiative, Government of Canada.436 Jacques et al. (2010).437 Skees, J.R., Barnett, B.J., & Collier, B. (2008).438 United States Government Accountability Office (2007) 439 Beach, Robert H., Chen Zhen, Allison Thomson, Roderick M. Rejesus, Paramita Sinha, Anthony W. Lentz, Dmitry V. Vedenov and Bruce A.
McCarl. (May 2010). Climate Change Impacts on Crop Insurance. Contract AG-645S-C-08-0025. Final Report Prepared for Terrence Katzer, USDA Risk Management Agency. Retrieved on August 22, 2010 from: http://www.usda.gov/oce/climate_change/files/ImpactsCropInsurance062010.pdf
440 http://www.usda.gov/oce/climate_change/files/SAP4_3/Agriculture.pdf
97
ACT ( A DA P TAT ION TO CL IM AT E CH A NGE T E A M)
In addition to offering support to producers affected by extreme events agricultural insurance has the potential to play a critical role in promoting agricultural adaptation to climate change.441,442,443,444,445,446,447. Purchasing agricultural insurance cannot be considered adaptation unto itself, because it does not address the underlying risk associated with production and because an increase in losses due to extreme events is likely to cause an increase in insurance premiums, but insurers can improve access to credit to implement adaptive technologies and practices (i.e. lenders are more willing to extend credit to insured farmers)448 and motivate farmers to undertake adaption measures to lessen the climate risks they face.449 The insurance industry can facilitate adaptation to climate change by drawing on its expertise to support adaptation efforts through:
• Protecting farmers by reducing variability in crops’ prices and yield and by providing better credit access for farmers: Financially secure farmers are better equipped to undertake agricultural adaptation measures.
• Risk reduction as a prerequisite for insurance: Insurers can require policyholders to undertake specific risk reduction measures as a prerequisite for coverage.
• Prioritizing adaptation measures: Insurers can work with the agricultural sector to prioritize adaptation measures.• Information gathering and risk and hazard analysis.• Risk Pricing: Insurers can incentivize risk-reducing decision-making by establishing reliable and consistent
price signals.• Awareness and risk education: Insurers can provide extensive knowledge on the loss causes associated with many
of the risks anticipated from climate change.450,451,452,453
The use of the insurance tool in the agricultural sector ought not to be viewed merely as a mechanism to cushion against financial losses; insurance needs to be accompanied by ongoing risk assessment and implementation of effective risk prevention and reduction measures.454,455,456 Olmstead and Kleinschmit (2011) have issued a clarion call to United States legislators, who are currently deliberating on a new Farm Bill, to recognize the urgent need for agricultural adaptation and the opportunity to link that with insurance measures:
441 Dolan, A.H., Smit, B., Skinner, M.W., Bradshaw, B. and Bryant, C.R. (2001). Adaptation to Climate Change in Agriculture: Evaluation of Options. Guelph: University of Guelph.
442 Hohl, R. (2004). Extreme Climate Events and Agriculture Insurance. MICE Workshop. Florencia, October 2004.443 McLeman and Smit (2006) 444 Skees, J.R., Barnett, B.J., and Collier B. (2008). Agricultural Insurance: Background and Context for Climate Adaptation Discussions. Lexington: Global
AgRisk.445 Economics of Climate Adaptation (ECA) (2009) Shaping Climate-Resilient Development: A Framework for Decision-Making. Report of the
Economics of Climate Adaptation. Working Group.446 Schwank, O.M., Steinemann, M., Bhojwani, H., Holthaus, E., Norton, M., Osgood, D., Sharoff, J., Bresch, D., Spiegel, A. 2010.Insurance as an
Adaptation Option under UNFCCC. Background Paper. Final Version. Zurich: INFRAS / IRI / SWISS RE.447 Garrido, A., Bielza, M., Rey, D., Mínguez, M.I. & Ruiz-Ramos, M. (2010)448 O’Hara, J. (2012) Ensuring the Harvest – Crop Insurance and Credit for a Healthy Farm and Food Future. Union of Concerned Scientists.449 Skees et al. (2008).450 Hohl, R. (2004) Extreme climate events and agricultural insurance. MICE Workshop. Florencia, October 2004.451 Ward, R.E.T., Herweijer, C., Patmore, N., and Muir-Wood, R. (2008) The Role of Insurers in Promoting Adaptation to the Impacts of Climate
Change. The Geneva Papers 33: 133-139.452 Warner, K. (2009). Adaptation to Climate Change: Linking Disaster Risk Reduction and Insurance. Geneva: United Nations International Strategy for
Disaster Reduction Secretariat.453 ClimateWise Secretariat (2011) Global Insurance Industry Statement on Adapting to Climate Change in Developing Countries. London: ClimateWise.454 Fosse, E.R., and Changnon, S.A. (1993) Potential Impacts of Shifts in Climate on the Crop Insurance Industry. Bulletin of the American Meteorological
Society 74(9): 1703-1708.455 Schwank, O., Steinemann, M., Bhojwani, H., Holthaus, E., Norton, M., Osgood, D., Sharoff, J., Bresch, D. & Spiegel, A. (2010) Insurance as an
Adaptation Option under UNFCCC, Background Paper. Final Version. INFRAS / IRI / SWISS RE, Zurich. Retrieved in October 2010 from the BAFU website: http://www.bafu.admin.ch/klima/10343/index.html?lang=en&download=NHzLpZeg7t,lnp6I0NTU042l2Z6ln1ad1IZn4Z2qZ-pnO2Yuq2Z6gpJCGeH99hGym162epYbg2c_JjKbNoKS n6A
456 Olmstead, J. & Kleinschmit, J. (2011). A Risky Proposition: Crop Insurance in the Face of a Changing Climate. Washington: Institute for Agriculture and Trade Policy.
CLIMATE CHANGE ADAPTATION AND CANADA’S CROPS AND FOOD SUPPLY BACKGROUND REPORT
98
Crop insurance policies that compensate farmers financially for yield loss are essential in such a volatile environ-ment, but so are measures that can actually reduce expected crop losses in the field. … It’s like offering a home owner a fire insurance policy, but not even requiring the most basic preventative measures, such as smoke alarms or fire extinguishers. … There are real things farmers can do to reduce their risk from climate change. When extreme weather hits, the farms that do best are generally not huge monoculture acreages. They are diversified, often small- to mid-scale operations that frequently combine row crops with livestock and incorporate perennials. They are not one-size-fits-all, but instead adapted to local conditions, and responsive to climate change. Farm programs need to emphasize such risk mitigation strategies, and help farmers to access the necessary technical and financial support to ensure that not only their incomes, but also their actual production systems are sup-ported as weather becomes increasingly volatile. … [we need] to link crop insurance support with programs and funding to help farmers transition toward more resilient systems. Expanding the crop insurance program without a concurrent focus on climate adaptation makes agriculture riskier for everyone.457
By requiring farmers to engage in certain actions and behaviours to reduce their vulnerability to climate- and weather-related events, insurance companies can both increase resilience among agricultural producers and minimize their own financial risk. Examples of requirements by insurers are common for all types of insurance (e.g. wearing seat belts while driving, requiring smoke detectors in homes, mandating pest and wildlife controls in agriculture); in many cases, to reduce the “moral hazard” effect, by which purchasers of insurance have less incentive to protect themselves from insurable events because they are protected from losses. New requirements must be evaluated and implemented to target actions specifically related to climate change mitigation and adaptation, and these adaptive requirements must be supported by government policies to support climate change adaptation.458
The Farm Bill has also been criticized for excluding small producers from USDA-subsidized agricultural insurance programs because of its focus on commodity-specific coverage.459 Producers of goods with smaller or niche markets are not eligible for USDA insurance coverage, ostensibly because data on yields and prices are not widely available.460 Lack of coverage perpetuates lack of data availability, because producers are provided with a disincentive to grow crops that are not insurable, which prevents farmers from experimenting with new crops or technologies to adapt to changing climate conditions. These same farmers are further prevented from investing in adaptation because their lack of insurance coverage makes them unappealing to lenders of credit.461
13.2 EXTREME WEATHER INSURANCE FOR BUILDINGS AND STRUCTURES
Canada does not have overland flooding insurance, so the following information is provided about the United States experience with this type of insurance. The UK experience is also briefly described.
Non-farm extreme weather event insurance in the United States also received attention in the same U.S. Government Accountability Office (GAO, 2007) report that called for a review of Federal Crop Insurance Corporation’s (FCIC’s) crop insurance program.
The largest US government or public insurance programs, such as the NFIP, Florida Citizens Insurance, and Federal Emergency Management Agency programs, are largely based upon ex-post financing structures planning to pay for loss after the occurrence of an extreme weather event. As such, these kinds of financing programs often place the risk and 457 Olmstead & Kleinschmit (2011).458 Garrido et al. (2010).459 O’Hara (2012).460 O’Hara (2012).461 O’Hara (2012).

99
ACT ( A DA P TAT ION TO CL IM AT E CH A NGE T E A M)
ultimate cost of loss with parties who have no control over the creation of the risk, management of the risk, or recovery of damages caused by the risk. In some cases, the theory of the viability of ex-post financing is being challenged by economic reality of the imbalance between the risk created (loss cost recovery / repayment needs) and the financial value and viability of the assets or impacted economies themselves.462
The US National Flood Insurance Program (NFIP) is under scrutiny for its inability to protect private property owners while avoiding exposure to losses. Flood insurance is characterized by many of the same challenges as agricul-tural insurance because losses are typically large and correlated, requiring large amounts of capital in a short time, and purchasing of insurance is subject to moral hazard.463 While some believe that this challenge is best overcome through subsidized flood insurance premiums, the Presidential Task Force on Federal Flood Control Policy offered the following warning in 1966:464
“A flood insurance program is a tool that should be used expertly or not at all. Correctly applied it could pro-mote wise use of flood plains. Incorrectly applied, it could exacerbate the whole problem of flood losses. For the federal government to subsidize low premium disaster insurance or provide insurance in which premiums are not proportionate to risk would be to invite economic waste of great magnitude.”
The NFIP insures over 5.6 million homes and $1 trillion in assets, but has experienced recurring debts that now total over $18 billion, in part due to increased flooding associated with climate change.465 Premiums under the NFIP are based on historical flood risk and are not adjusted to account for increased risk due to shifting climate conditions.466 Critics of the existing NFIP structure recommend adjusting premiums, supporting investment in flood mitigation, and preparing for future extreme events.
At the state level, many coastal states have increased their participation in the insurance market as property owners in “high risk” areas experience difficulty in obtaining insurance in the regular private market. To make basic coverage more readily available, special insurance plans known as residual, shared or involuntary markets have been set up by state regulators working with the insurance industry (Insurance Information Institute, 2012). Between 1990 and 2010, total exposure to loss in the national residual property insurance market (comprised of Fair Access to Insurance Requirements [FAIR] Plans, and state Beach and Windstorm Insurance Plans along the Atlantic and Gulf coasts) increased from $54.7 billion to $757.9 billion, while the number of policies in force increased from more than 930,000 to 2.8 million (Insurance Information Institute, 2012). In terms of existing exposure to impacts of extreme events (i.e., not including increased risks associated with climate change), many state insurance programs are not prepared to cover expected losses. Of 10 state natural disaster funds investigated by GAO (2010), six charged rates that were not actuarially sound given today’s known risks. With climate change expected to increase losses associated with coastal storms and sea-level rise, the financial risks borne by the public sector through these residual programs may, in fact, be much worse.
The current situation in Florida exemplifies this concern. State-run entities that expanded over the past decade to provide what are called affordable homeowners insurance in Florida are in danger of becoming so big that they pose a significant threat to the local economy. 467 Citizens Property Insurance Corp. (CPIC), for example, has 1.5 million policyholders and a total exposure of $511 billion, about one-quarter of the Florida homeowners insurance market. 468
462 Scism, Leslie. (2012). Storm Clouds Gather Over Florida Insurers Wall Street Journal, Feb. 6, 2012, at C1.463 Huber, D. (2012) Fixing a Broken National Flood Insurance Program: Risks and Potential Reforms. Center for Climate and Energy Solutions.464 U.S. Task Force on Federal Flood Control Policy (1966, August 10) A Unified National Program for Managing Flood Losses. Communication from the
President of the United States transmitting a report by the Task Force on Federal Flood Control Policy. Washington, DC: U.S. Government Printing Office. Retrieved on August 15, 2012 from the Advisory Committee on Water Information website: http://acwi.gov/hydrology/minutes/floods89-465.pdf
465 Huber (2012).466 Huber (2012).467 Scism, Leslie, Storm Clouds Gather Over Florida Insurers, Wall Street Journal, Feb. 6, 2012, at C1.468 Scism (2012).
CLIMATE CHANGE ADAPTATION AND CANADA’S CROPS AND FOOD SUPPLY BACKGROUND REPORT
10 0
The Florida Hurricane Catastrophe Fund would be required to reimburse insurers operating in the state up to $18.4 billion in the event of losses from major storms, despite having only about $7 billion on its books from accumulated premiums. 469 Observers are concerned that in the event of a major hurricane, if these two entities were unable to sell post-disaster bonds as planned, some insurers could become insolvent, homeowner repair claims could go unpaid, and assessments and surcharges on policyholders statewide could damage the economy. 470
Efforts are underway to try to address some of the problems with the current structure of publicly subsidized disaster relief programs. At both the state and federal levels, stakeholders have proposed granting these entities greater authority to raise insurance rates. Current legislative proposals relating to the NFIP, for example, would increase the annual limitation on premium increase from the current 10% level to either 15% or 20%.471 Other measures being explored at the state level include seeking to reduce the size of state disaster relief funds and move more of the funding for losses to the global reinsurance market. 472 Risk can only be moved to the global reinsurance market for a price that reflects the risk. As such, to move from public funding - which may subsidize risk takers, - to private insurance will likely require adaptive steps to increase resilience of the insured assets to have socially accepted premiums.
Such measures are steps in the right direction, although concern persists about the pace and scale of reform. Historic experience in the insurance industry has shown that subsidies of any nature, as contrasted with rights and liability creation, result in business models that contain an unacceptable level of political risk. Subsidies may actually discourage active participation by the financial services industry in innovative and beneficial activities unless the business or technology supported can survive without the subsidy.473 “
In summary, privatization of flood insurance in the USA would almost certainly lead to an increase in premiums as property owners would be required to pay the full cost of risks to their property. Short-term, this could make privatiz-ation politically unpalatable, but would create incentives to reduce private risk if lower premiums could be achieved. Whether the government opts to reform the current policy or privatize flood insurance, private property owners should expect to see their premiums adjusted over the coming years, as the current NFIP structure is financially unsustainable over the long term.
These types of questions were faced in the United Kingdom in the early 2000s in relation to increased coastal area flooding, ultimately leading to changes in coastal management policies and to a nationwide agreement with the in-surance industry (Giddens, 2011. Pages 170 to 178)474. A decade later, the UK is pursuing a blended public-private approach involving investment in physical risk reduction on an area and property specific basis, and risk-based pricing for insurance (UK-DEFRA).475
Insurance offers a market-based instrument for protecting farmers from financial risk due to extreme events by creating private incentives to mitigate and manage risk,.476However, risk-aversion behaviour will only occur if actors are held fully responsible for their risky behaviour. Government can maintain its role of protecting the public from large, market-distorting losses through partnership with or limited regulation of private insurance providers as well 469 Scism (2012).470 Scism (2012.471 Flood Insurance Reform Act of 2011, H.R. 1309, 112th Cong. (2011).472 Scism, Leslie, Storm Clouds Gather Over Florida Insurers, Wall Street Journal, Feb. 6, 2012, at C1.473 Zurich Financial Services, The Climate Risk Challenge: The Role of Insurance In Pricing Climate-Related Risks 4 (2009), http://www.zurich.com/
internet/main/SiteCollectionDocuments/insight/ClimateRiskChallenge.pdf.474 Giddens, Anthony. (2011). The Politics of Climate Change: Second Edition, Revised and Updated. London. Polity.475 UK-DEFRA. Insurance webpage (20 July 2012).http://www.defra.gov.uk/environment/flooding/funding-outcomes-insurance/insurance/ Accessed: August 22, 2012 See also: UK-DEFRA. (27 January 2012). The Government’s Response to Sir Michael Pitt’s Review of the summer 2007 Floods Final Progress Report. Retrieved on
August 22, 2012 from: http://www.defra.gov.uk/publications/files/2012-01-31-pb13705-pitt-review-progress.pdfUK-DEFRA. (December 2011). Flood risk and insurance: A roadmap to 2013 and beyond: Final report of the flood insurance working groups. Retrieved on
August 22, 2012 from: http://www.defra.gov.uk/publications/2011/12/19/pb13684-flood-risk-insurance476 Zurich Financial Services (2009). The Climate Risk Challenge: The Role of Insurance In Pricing Climate-Related Risks. Retrieved August 22, 2012 from:
http://www.zurich.com/internet/main/SiteCollectionDocuments/insight/ClimateRiskChallenge.pdf.
101
ACT ( A DA P TAT ION TO CL IM AT E CH A NGE T E A M)
as correcting information asymmetries and providing full information to insurers and the public about the projected impacts and risks associated with climate change. By compiling and disseminating information, governments can reduce their own exposure to climate-related risks where agricultural insurance is currently provided under PPP and support private adaptation and risk reduction. Where private insurers are poised to offer new products in response to climate-related risk, information about climate impacts and risks can be shared with governments to help governments prioritize adaptation efforts.
CLIMATE CHANGE ADAPTATION AND CANADA’S CROPS AND FOOD SUPPLY BACKGROUND REPORT
102
APPENDICES
LIST OF FIGURES AND TABLES
Table 1. Sectors in which climate change adaptation planning is most critical. .............................................................35Figure 1. Illustration of historical patterns and the potential for coping and adaptation. (Credit: Jones et. al.,
unpublished) ................................................................................................................................................................36Table 2: Top five agri-food exports, by country, in order of value (CDN$) .......................................................................40Table 3: Top five agri-food imports, by country, in order of value (CDN$) ....................................................................... 41Table 4. Top 50 agricultural exports from USA to Canada (2011), by value (US$) and quantity (MT). ............................. 41Table 5. Total value of agri-food exports for the top 25 exporting states (2010). ............................................................43Table 6. U.S. agri-food exports, top five leading states – Estimated value by commodity group (2010). .......................44Figure 2. Interactions between activities and outcomes associated with the food system (GECAFS, no date). ............50Figure 3.Cost-benefit analysis framework. ...................................................................................................................... 67Table 7. Organizations involved in flood planning in the Red River Basin. ....................................................................... 81Table 8. Organizations involved in climate change adaptation in Australia. ....................................................................88Figure 4.Conceptual Model of Agricultural Adaptation. ...................................................................................................93
103
ACT ( A DA P TAT ION TO CL IM AT E CH A NGE T E A M)
WORKS CITED
AAFC. (2007). Australia Agriculture Policy Review. AAFC. Retrieved on October 11, 2011, from the AAFC website: http://www4.agr.gc.ca/AAFC-AAC/display-afficher.do?id=1225582575741&lang=eng
Adderley, D., Schoenau, J., Holm, R., & Qian, P. (2006). Nutrient availability and yield of wheat following field pea and lentil in Saskatchewan. Canada. Journal of Plant Nutrition 29: 25-34.
Agriculture and Agri-Food Canada. (AAFC). (2012) An overview of the Canadian Agriculture and Agri-Food System. Retrieved on May 31, 2012, from the AAFC website: http://publications.gc.ca/collections/collection_2011/agr/A38-1-1-2010-eng.pdf
Agriculture and Agri-Food Canada. (AAFC). Agri-Food Trade Service (2012a). Canadian Trade Highlights. Exports – Agri-Food and Seafood for January to December 2011. Retrieved on May 31, 2012, from the AAFC website:http://www.ats-sea.agr.gc.ca/stats/6044-eng.htm
Agriculture and Agri-Food Canada. (AAFC). Agri-Food Trade Service (2012b) Canadian Trade Highlights. Imports – Agri-Food and Seafood for January to December 2011. Retrieved on May 31, 2012, from the AAFC website: http://www.ats-sea.agr.gc.ca/stats/6043-eng.htm
Agriculture and Agri-Food Canada. (AAFC). Agri Food Trade Service (2012c) Factsheets. Retrieved on May 31, 2012, from the AAFC website: http://www.ats-sea.agr.gc.ca/stats/fs-fd-eng.htm#Europe
Agriculture and Agri-Food Canada (AAFC). (2011). Climate Change: Questions and Answers. Retrieved on November 4, 2011, from the AAFC website: http://www4.agr.gc.ca/AAFC-AAC/display-afficher.do?id=1188220105158&lang=eng
Agriculture and Agri-Food Canada. (2009). Overview of the Canadian Pulse Industry. Last updated: June 29, 2010. Retrieved from: http://www.ats.agr.gc.ca/can/4753-eng.htm (accessed June 5, 2011).
Agriculture and Agri-Food Canada (1998) The Federal-Provincial Crop Insurance Program – An Integrated Environmental-Economic Assessment (Accessed July 5, 2011) http://www4.agr.gc.ca/resources/prod/doc/pol/pub/fpcip-pfpar/pdf/fpcip-pfpar_e.pdf
Akinremi, O. O., McGinn, S. M., & Cutforth, H. W. (1999). Precipitation trends on the Canadian prairies. Journal of Climate 12: 2996-3003.
Alberta Beef Producers. (2011). Industry. Retrieved from http://albertabeef.org/industry/
Alley, W. M. (2001).Ground water and climate. Ground Water 39(2): 161.
CLIMATE CHANGE ADAPTATION AND CANADA’S CROPS AND FOOD SUPPLY BACKGROUND REPORT
10 4
Antle, J. (2009). Agriculture and the Food System: Adaptation to Climate Change. Resources for the Future. Retrieved on September 2, 2011, from the Resources for the Future website: http://www.rff.org/rff/documents/RFF-Rpt-Adaptation-Antle.pdf
Australian Government. (2010). Adapting to Climate Change in Australia – An Australian Government Position Paper. http://www.climatechange.gov.au/~/media/publications/adaptation/gov-adapt-climate-change-position-paper.pdf
Australian Government, Department of Climate Change and Energy Efficiency. (2012). Climate Change Adaptation Program: http://www.climatechange.gov.au/government/initiatives/climate-change-adaptation-program.aspx
Australian Government, Department of Sustainability, Environment, Water, Population and Communities. (2011). Sustainable Water Use and Infrastructure Program. http://www.environment.gov.au/water/publications/policy-programs/srwui-factsheet.html
Australian Government National Water Commission. (2011). Water Markets in Australia - A Short History. Canberra, Australia: National Water Commission; 139 pp. Retrieved on May 26, 2012, from the NWC website: http://nwc.gov.au/__data/assets/pdf_file/0004/18958/Water-markets-in-Australia-a-short-history.pdf
Australian Government, Department of Climate Change and Energy Efficiency. (2010). Developing a national coastal adaptation agenda - A report on the National Climate Change Forum. Canberra, Australia: Department of Climate Change and Energy Efficiency. Retrieved on May 26, 2012, from the DCCEF website: http://www.climatechange.gov.au/~/media/publications/adaptation/developing-national-coastal-adaptation-agenda.pdf
Australian Government, Productivity Commission. (2012). Projects – Barriers to Effective Climate Change Adaptation. http://www.pc.gov.au/projects/inquiry/climate-change-adaptation/terms-of-reference
Productivity Commission. (2012). Barriers to Effective Climate Change Adaptation, Draft Report, Canberra.http://www.pc.gov.au/__data/assets/pdf_file/0007/116539/climate-change-adaptation-draft-report.pdf
BC Ministry of Agriculture and Lands (2011) Production Insurance – General information brochure (Accessed July 6, 2011) http://www.agf.gov.bc.ca/production_insurance/plans/general/general_bro.pdf
BC Salmon Marketing Council. (1997). Salmon Market Database. Retrieved from http://www.bcsalmon.ca/dbase_local/home.html
Beach, Robert H., Chen Zhen, Allison Thomson, Roderick M. Rejesus, Paramita Sinha, Anthony W. Lentz, Dmitry V. Vedenov and Bruce A. McCarl. (May 2010). Climate Change Impacts on Crop Insurance. Contract AG-645S-C-08-0025. Final Report Prepared for Terrence Katzer, USDA Risk Management Agency. Retrieved on August 22, 2010 from: http://www.usda.gov/oce/climate_change/files/ImpactsCropInsurance062010.pdf
Beacham, T. D. & Murray, C. B. (1990). Temperature, egg size, and development of embryos and alevins of five species of pacific salmon: A comparative analysis. Transactions of the American Fisheries Society 119(6): 927-945.
105
ACT ( A DA P TAT ION TO CL IM AT E CH A NGE T E A M)
Beamish, R. J. (1995). Introduction - The need to understand the relationship between climate and the dynamics of fish populations. In R. J. Beamish (Ed.) Climate change and northern fish populations (1-2). Ottawa: National Research Council of Canada.
Bell, D., and Valentine, G., (Eds.). (1997). We Are What We Eat: Consuming Geographies. New York: Routledge.
Belliveau, S., Bradshaw, B., Smit, B., & Reid, S. (2006). Farm-level adaptation to multiple risks: Climate change and other concerns. Occasional Paper No. 27. Guelph: University of Guelph Department of Geography.
Belliveau, S., Smit, B., Bradshaw, B. (2006). Multiple exposures and dynamic vulnerability: Evidence from the grape industry in the Okanagan Valley, Canada. Global Environmental Change (16): 364-378.
Bizikova and Crawford Boettcher. (2011). Review of Key National and Regional Policies and Incentives to Support Adaptation and Adaptive Capacity in the Agricultural Sector. International Institute for Sustainable Development. Retrieved June 8, 2013 from: http://www.iisd.org/publications/pub.aspx?id=1411
Blue, G. (2009). Branding Beef: Marketing, Food Safety, and the Governance of Risk. Canadian Journal of Communication 34(2): 229-244.
Bohmrich, R. (1996). Terroir: Competing perspectives on the roles of soil, climate and people. Journal of Wine Research 7(1): 33.
Bootsma, A., Gameda, S., &McKenney, D. W. (2005). Impacts of potential climate change on selected agroclimatic indices in Atlantic Canada. Canadian Journal of Soil Science (85): 329-343.
Boyd, R., Ibarrarán, M. (2009). Extreme climate events and adaptation: an exploratory analysis of drought in Mexico. Environment and Development Economics (14). 371-395.
Brett, J. R. (1952). Temperature tolerance in young pacific salmon, genus oncorhynchus. .Journal of the fish research board of Canada 9(6): 265-323.
C-CIARN Agriculture. (2003). Meeting the challenges of climate change. Guelph: Canadian Climate Impact and Adaptation Research Network.
California Government. (2009). California Climate Adaptation Strategy. Retrieved on September 6, 2011, from the California Climate Change Portal website: http://resources.ca.gov/climate_adaptation/docs/Statewide_Adaptation_Strategy.pdf
California Department of Water Resources. (2012). California Water Plan. http://www.waterplan.water.ca.gov/
Canadian Securities Administrators. (2010, October 27). 51-333 Environmental Reporting Guidance. CSA Staff Notice. Retrieved on August 19, 2011, from the British Columbia Securities Commission website: http://www.bcsc.bc.ca/uploadedFiles/securitieslaw/policy5/CSA%20Staff%20Notice%2051-333.pdf
CLIMATE CHANGE ADAPTATION AND CANADA’S CROPS AND FOOD SUPPLY BACKGROUND REPORT
106
CAPI. (2011). Canada’s Agri-Food Destination - A New Strategic Approach. Retrieved on June 1, 2012, from the CAPI website: http://www.capi-icpa.ca/destinations/CAPI-Agri-Food_Destination_FULL.pdf
Carmichael, K. (2011, August 25). How rising food prices can ease poverty. The Globe and Mail. Retrieved on August 25, 2011, from the Globe and Mail website: http://www.theglobeandmail.com/report-on-business/economy/economy-lab/daily-mix/how-rising-food-prices-can-ease-poverty/article2141472/
CBC News. (2011, June 14). Wet weather affects Prairie wheat seeding. CBC News. Retrieved August 8, 2011 from the CBC News website: http://www.cbc.ca/news/business/story/2011/06/14/wheat-planting.html
CBC News. (2011, May 10). Wheat prices rise on weather worries. CBC News. Retrieved August 8, 2011 from the CBC News website: http://www.cbc.ca/news/business/story/2011/05/10/wheat-prices-rise.html
CCMA. (2012). Corangamite Regional Catchment Strategy 2012-2018, Community Draft for Comment. http://joinin.ccma.vic.gov.au
CCS. (2011). Center for Climate Strategies Adaptation Guidebook – Comprehensive Action Plan. http://www.cli-matestrategies.us/library/library/view/908
Chamberlain, A.F. (1891). The maple among the Algonkian tribes. American Anthropologist 4(1): 39-44.
CIA. (2012). CIA World Factbook 2012 - Canada. Retrieved on May 31, 2012, from the CIA website: https://www.cia.gov/library/publications/the-world-factbook/geos/ca.html
Climate change pushing coffee to extinction. (October 17, 2011). CBS News. http://www.cbsnews.com/stories/2011/10/17/earlyshow/leisure/gamesgadgetsgizmos/main20121250.shtml
COAG. (2007). National Climate Change Adaptation Framework. http://www.coag.gov.au/coag_meeting_out-comes/2007-04-13/docs/national_climate_change_adaption_framework.pdf
Commission of the European Communities (2009) White Paper - Adapting to climate change: Towards a European framework for action. Retrieved on May 29, 2012, from the CEC website: http://eur-lex.europa.eu/LexUriServ/LexUriServ.do?uri=COM:2009:0147:FIN:EN:PDF
Coombes, E., Burgess, D., Jackson, N., Turner, K., and Cornell, S. (2005). Case study: Climate Change and Coastal Management in Practice – A cost-benefit assessment in the Humber, UK. Retrieved on September 15, 2011, from The Eloise Group website: http://www.eloisegroup.org/themes/climatechange/doc/case_study.doc
Corbett, N. (2011, February 3). Farmers face uncertainty about reimbursement for washed-out crops. Abbotsford News. Retrieved on September 15, 2011, from the BC Local News website: http://www.bclocalnews.com/fraser_valley/abbynews/news/115145169.html
Craine, J. M., Elmore, A. J., Olson, K. C., &Tolleson, D. (2010). Climate change and cattle nutritional stress.Global Change Biology 16: 2901-2911.
107
ACT ( A DA P TAT ION TO CL IM AT E CH A NGE T E A M)
Crouse, M. R., Callahan, C. A., Malueg, K. W., & Dominguez, S. E. (1981). Effects of fine sediments on growth of juvenile coho salmon in laboratory streams. Transactions of the American Fisheries Society 110(2): 281-286.
Cutforth, H. W., McConkey, B. G., Woodvine, R. J., Smith, D. G., Jefferson, P. G. & Akinremi, O. O. (1999). Climate change in the semiarid prairie of southwestern Saskatchewan: Late winter-early spring. Canadian Journal of Plant Science (79): 343-350.
Cyr, D. & Kusy, M. (2007). Canadian ice wine production: A case of the use of weather derivatives. Journal of Wine Economics 2(2): 145-167.
D’Mello, A., (May 27, 2009). Climate change may hit sugarcane crop: WB report. The Times of India. Retrieved June 8, 2013 from: http://timesofindia.indiatimes.com/city/mumbai/Climate-change-may-hit-sugarcane-crop-WB-report/articleshow/4581721.cms
DAFF. (2011). Australia’s Farming Future. Retrieved on October 11, 2011, from the DAFF website: http://www.daff.gov.au/climatechange/australias-farming-future
DAFF. (2006). National Agriculture and Climate Change Action Plan 2006-2009. http://www.coserve.com.au/PDF/VirtualMeeting/climate-change-action-plan-2006-09.pdf
DEFRA. (2008). Food 2030. Retrieved on June 1, 2012, from the DEFRA website: http://archive.defra.gov.uk/food-farm/food/pdf/food2030strategy.pdf
Diffenbaugh, N.S., White, M.A., Jones, G.V., and Ashfaq, M. (2011). Climate adaptation wedges: a case study of premium wine in the western United States. Environ. Res. Lett. 6 (April-June 2011).
Dolan, A.H., Smit, B., Skinner, M.W., Bradshaw, B. and Bryant, C.R. (2001). Adaptation to Climate Change in Agriculture: Evaluation of Options. Guelph: University of Guelph.
Donnelly, D., Mercer, R., Dickson, J., Wu, E. (2009). Australia’s Farming Future – Final Market Research Report. Prepared for the Australian Government Department of Agriculture, Fisheries and Forestry. Retrieved on October 11, 2011, from the DAFF website: http://www.daff.gov.au/__data/assets/pdf_file/0010/1879885/aus-farming-future-mrr.pdf
Duchesne, L, Houle, D, Cote, M, & Logan, T. (2009). Modeling the effect of climate on maple syrup production in Quebec, Canada. Forest Ecology and Management 258: 2683-2689
Duguid, S., & Brule-Babel, A. (1994).Rate and duration of grain filling in five spring wheat (Triticumaestivum L.) genotypes. Canadian Journal of Plant Science 74: 681-686.
Eaton, E. (2009). Getting behind the grain: The politics of genetic modification on the Canadian prairies. Antipode 41(2): 256-281.
CLIMATE CHANGE ADAPTATION AND CANADA’S CROPS AND FOOD SUPPLY BACKGROUND REPORT
108
Economics of Climate Adaptation (ECA). (2009). Shaping Climate-Resilient Development: A Framework for Decision-Making. Report of the Economics of Climate Adaptation. Working Group.
Ellis, J. L., Kebreab, E., Odongo, N. E., McBride, B. W., Okine, E. K., & France, J. (2007). Prediction of Methane Production from Dairy and Beef Cattle. Journal of Dairy Science 90(7): 3456-3466.
Evans, S.M. (1979). Canadian beef for Victorian England. Agricultural History 53(4): 748-762.
Everest, Paul. (2008). Inspection of hail-damaged crops in Osoyoos completed. Osoyoos Times, August 6, 2008. Retrieved July 11, 2011 from: http://www.bcca.coop/news/inspection-hail-damaged-crops-osoyoos-completed
FAO (2008) Climate Change and Food Security: A Framework Document. Rome, Italy: FAO. http://www.fao.org/forestry/15538-079b31d45081fe9c3dbc6ff34de4807e4.pdf
Fisheries and Oceans Canada. (2011). Aquaculture. Retrieved from: http://www.dfo-mpo.gc.ca/aquaculture/aquacul-ture-eng.htm
Flood Insurance Reform Act of 2011, H.R. 1309, 112th Cong. (2011).
Fu, Y-B., Peterson, G., Yu, J-K., Gao, L., Jia, J., & Richards, K. (2006). Impact of plant breeding on genetic diversity of the Canadian hard red spring wheat germplasm as revealed by EST-derived SSR markers. Theoretical & Applied Genetics 112(7): 1239-1247.
Fu, Y-B., Peterson, G., Richards, K., Somers, D., DePauw, R., & Clarke, J. (2005). Allelic reduction and genetic shift in the Canadian hard red spring wheat germplasm released from 1845 to 2004. Theoretical & Applied Genetics 110(8): 1505-1516.
Fu, Y-B., Peterson, G., Scoles, G., Rossnagel, B., Schoen, D., & Richards, K. (2003). Allelic Diversity Changes in 96 Canadian Oat Cultivars Released from 1886 to 2001. Crop Science, 43(6): 1989-1995.
Fünfgeld, H. and McEvoy, D. (2011). VCCCAR Project: Framing Adaptation in the Victorian Context, Framing Climate Change Adaptation in Policy and Practice. Working Paper 1. Retrieved on May 22, 2012, from the Climate Access website: http://www.climateaccess.org/sites/default/files/Funfgeld_Framing%20Climate%20Adaptation%20in%20Policy%20and%20Practice.pdf
Galindo, L.M. (2010). The Economics of Climate Change in Mexico – Synopsis. Federal Government of Mexico. Retrieved on September 9, 2011, from the United Nations Climate Change Conference 2010 website: http://www.cc2010.mx/assets/001/5075.pdf
Garnut, R. (2010). The Garnut Climate Change Review. Chapter 6: Climate Change Impacts on Australia. http://www.garnautreview.org.au/pdf/Garnaut_Chapter6.pdf
Garrido, A., Bielza, M., Rey, D., Mínguez, M.I. & Ruiz‐Ramos, M. (2010) Insurance as an Adaptation to Climate Variability in Agriculture.Research Centre for the Management of Agricultural and Environmental Risks. Retrieved
109
ACT ( A DA P TAT ION TO CL IM AT E CH A NGE T E A M)
on May 26, 2012, from the CEIGRAM website: http://www.ceigram.upm.es/sfs/otros/ceigram/Contenido%20Divulgaci%C3%B3n/Contenido%20Publicaciones/Contenido%20Working%20Papers/CEIGRAM_WP%20NO%20002.pdf
GECAFS. (no date). Glossary & Acronyms. http://www.gecafs.org/glossary/index.html#foodsystems
George, S., Nielsen, E. (2003).Flooding & Climate Change in Southern Manitoba. Natural Resources Canada and Manitoba Industry, Trade and Mines. Retrieved August 10, 2011 from the International Institute for Sustainable Development website: http://www.iisd.org/taskforce/pdf/manitoba_geo_survey.pdf
Gerwing, K. &McDaniels, T. (2006). Listening to the salmon people: Coastal First Nations’ objectives regarding salmon aquaculture in British Columbia. Society & natural resources 19(3): 259-273.
Gibson, R. B. (2005). Sustainability Assessment. Earthscan. London, Great Britain. ISBN 9781849772716.
Giddens, Anthony. (2011). The Politics of Climate Change: Second Edition, Revised and Updated. London. Polity
Godoy, E. (2011, September 8). Traditional Maize Can Cope with Climate Change. Inter Press Service. Retrieved on September 29, 2011, from the IPS website: http://ipsnews.net/news.asp?idnews=105035
Grainger, S. (2010). Central America coffee land to shrink as globe warms. Reuters. Retrieved June 8, 2013 from: http://www.reuters.com/article/2010/05/19/centralamerica-coffee-idUSN1924362420100519?type=marketsNews
Groves, D., Bloom, E., and Joyce, B. (2011). A Decision Framework for the 2013 California Water Plan. Presentation at the SWAN meeting, May 13, 2011. http://www.waterplan.water.ca.gov/docs/meeting_materials/swan/2011-0513/CWP_2013-RAND_DECISION_FRAMEWORK-2011.05.12.pdf
Hallegatte, S., Henriet, F., Corfee-Morlot, J. (2011). The economics of climate change impacts and policy benefits at city scale: a conceptual framework. Climate Change 104: 51-87.
Hallegatte, S. (2009). Strategies to adapt to an uncertain climate. Global Environmental Change (19): 240-247.
Hao, X., Chang, C., Larney, F.J., & Travis, G. R. (2001). Greenhouse gas emissions during cattle feedlot manure com-posting. Journal of Environmental Quality 30: 376-386.
Hao, X. & Chang, C. (2003). Does long-term heavy cattle manure application increase salinity of a clay loam soil in semi-arid southern Alberta? Agriculture, Ecosystems, & Environment 94: 89-103.
Hare, S. R. & Francis, R. C. (1995). Climate change and salmon production in the Northeast Pacific Ocean. In R. J. Beamish (Ed.) Climate change and northern fish populations: 357-372. Ottawa: National Research Council of Canada.
Hargreaves, M. (1977). The dry-farming movement in retrospect. Agricultural History 51(1): 149-165.
CLIMATE CHANGE ADAPTATION AND CANADA’S CROPS AND FOOD SUPPLY BACKGROUND REPORT
110
Hashimoto, A. &Telfer, D. J. (2006). Selling Canadian culinary tourism: Branding the global and the regional product. Tourism geographies 8(1): 31-55.
Hinrichs, C. C. (1998). Sideline and lifeline: The cultural economy of maple syrup production. Rural Sociology 63(4): 507-532.
Hobbs, J. E. (2005). OFFS and EFP: A Conceptual Framework for Identifying and Classifying Benefits and Costs. Agriculture and Agri-Food Canada. Retrieved on August 17, 2011, from the University of Minnesota website: http://ageconsearch.umn.edu/bitstream/55297/2/rpt2_e.pdf
Hobbs, J., Gervais, J., Gray, R., Kerr, W., Larue, B. (2005). On-Farm Food Safety and Environmental Farm Plans: A Conceptual Framework for Identifying and Classifying Benefits and Costs. Agriculture and Agri-Food Canada. Retrieved on August 17, 2011, from the University of Minnesota Department of Applied Economics website: http://ageconsearch.umn.edu/bitstream/55297/2/rpt2_e.pdf
Hohl, R. (2004). Extreme Climate Events and Agriculture Insurance. MICE Workshop. Florencia, October 2004.
Holland, T., & Smit, B. (2010). Climate Change and the Wine Industry: Current Research Themes and New Directions. Journal of Wine Research 21(2/3): 125-136.
Howes and Dobes. (2011). Climate Change and Fiscal Policy: A Report for APEC. World Bank. http://www-wds.worldbank.org/external/default/WDSContentServer/WDSP/IB/2011/02/01/000333038_20110201000150/Rendered/PDF/565630REV0ESW010Policy01Jan13112011.pdf
Howitt, R., Medellin-Azuara, J., MacEwan, D. (2009). Estimating the Economic Impacts of Agricultural Yield Related Changes for California. California Climate Change Center. Retrieved on September 7, 2011, from the California Energy Commission website: http://www.energy.ca.gov/2009publications/CEC-500-2009-042/CEC-500-2009-042-F.PDF
Huber, D. (2012). Fixing a Broken National Flood Insurance Program: Risks and Potential Reforms. Center for Climate and Energy Solutions
Hucl, P., and Baker, R. J. (1987). A study of ancestral and modern Canadian spring wheats. Canadian Journal of Plant Science 67: 87-97.
Hutchinson-Jafar, L., (December, 2011). Caribbean sizes up climate threats to food security. Thomson Reuters Foundation Online. Retrieved June 8, 2013 from: http://www.trust.org/alertnet/news/caribbean-sizes-up-climate-threats-to-food-security
IBM Press Release. (2011, August 24). Made in IBM Labs: New Flood Prediction Technology Simulates Rivers 100x Faster than Real Time. Retrieved on August 25, 2011, from the IBM website:http://www-03.ibm.com/press/us/en/pressrelease/35263.wss
IBC. (2012). Telling the Weather Story. Prepared by the Institute for Catastrophic Loss Reduction

111
ACT ( A DA P TAT ION TO CL IM AT E CH A NGE T E A M)
ICCIC (2011). Climate Change Impacts on Iowa, Report to the Governor and the Iowa General Assembly. http://www.water.iastate.edu/Documents/CompleteReport,%20final.pdf
ICLEI. (2011). Financing the Resilient City: A demand driven approach to development, disaster risk reduction and climate adaptation - An ICLEI White Paper, ICLEI Global Report. Retrieved on October 4, 2011, from the ICLEI website: http://iclei.org/fileadmin/user_upload/documents/Global/Publications/Report-Financing_Resilient_City-Final.pdf
Interagency Climate Change Adaptation Task Force (2010) Progress Report of the Interagency Climate Change Adaptation Task Force: Recommended Actions in Support of a National Climate Adaptation Strategy. http://www.whitehouse.gov/sites/default/files/microsites/ceq/Interagency-Climate-Change-Adaptation-Progress-Report.pdf
Iowa State Legislature (2011). Senate File 471: Office of energy independence. http://search.legis.state.ia.us/nxt/gateway.dll/acts/2009%20Iowa%20Acts/1/116?f=templates$fn=document-frame.htm$3.0$q=%5Bfield%20folio-destination-name%3A%5C’ch_108_sec_34%5C’%5D$uq=$x=Advanced$up=1
Iowa State University Extension and Outreach (2011). Iowa Farm and Rural Life Poll: 2011 Summary Report. https://store.extension.iastate.edu/ItemDetail.aspx?ProductID=13717
Iowa State University News Service. (2012). Iowa State’s Takle addresses USDA on climate change and its effect on agriculture. http://www.news.iastate.edu/news/2012/jun/USDAclimatechange
International Trade Centre. The coffee sector and climate change. The Coffee Guide.
IPCC. (2012). Managing the Risks of Extreme Events and Disasters to Advance Climate Change Adaptation. A Special Report of Working Groups I and II of the Intergovernmental Panel on Climate Change [Field, C.B., V. Barros, T.F. Stocker, D. Qin, D.J. Dokken, K.L. Ebi, M.D. Mastrandrea, K.J. Mach, G.-K. Plattner, S.K. Allen, M. Tignor, and P.M. Midgley (eds.)]. Cambridge University Press, Cambridge, UK, and New York, NY, USA, 582 pp.
IPCC Working Groups I & II. (2011). Special Report: Managing the Risks of Extreme Events and Disasters to Advance Climate Change Adaptation (SREX). Retrieved on May 22, 2012, from the IPCC website: http://ipcc-wg2.gov/SREX/
Iqbal, M., Navabi, D., Salmon, D., Yang, R-C., and Spaner, D. (2007). Simultaneous selection for early maturity, in-creased grain yield and elevated grain protein content in spring wheat. Plant Breeding 126(3): 244-250.
Jackson, L., Haden, V.R., Wheeler, S.M., Hollander, A.D., Perlman, J., O’Geen, T., Mehta, V.K., Clark, V., Williams, J., and Thrupp, A. (2012a). Vulnerability and Adaptation to Climate Change in California Agriculture. California Energy Commission. Publication number: CEC-500-2012-031. http://www.energy.ca.gov/2012publications/CEC-500-2012-031/CEC-500-2012-031.pdf
Jackson, L., Haden, V.R., Hollander, A.D., Lee, H., Lubell, M., Mehta, V.K., O’Geen, T., Niles, M., Perlman, J., Purkey, D., Salas, W., Sumner, D., Tomuta, M., Dempsey, M., and Wheeler, S.M. (2012b). Adaptation Strategies
CLIMATE CHANGE ADAPTATION AND CANADA’S CROPS AND FOOD SUPPLY BACKGROUND REPORT
112
for Agricultural Sustainability in Yolo County, California. California Energy Commission. Publication number: CEC-500-2012-032. http://www.energy.ca.gov/2012publications/CEC-500-2012-032/CEC-500-2012-032.pdf
Jacobs, H. (2009). Structural elements in Canadian cuisine. Cuizine: The Journal of Canadian Food Cultures Vol. 2(1). Accessed June 8, 2013 from: http://www.erudit.org/revue/cuizine/2009/v2/n1/039510ar.html
Jacques, Louis-Samuel, De Vit, C. & Gagnon-Lebrun, F. (2010). Status of Climate Change Adaptation in Canada’s Agricultural Sector: Research Paper. Ottawa, Government of Canada Policy Research Initiative. Retrieved on June 8, 2013 from: http://www.horizons.gc.ca/sites/default/files/Publication-alt-format/2010-0040-eng.pdf
Jaffee, S., Siegel, P. and Andrews, C. (2008.) Rapid agricultural supply chain risk assessment - Conceptual framework and guidelines for application. World Bank Agriculture and Rural Development Department, Commodity Risk Management Group. Retrieved on May 27, 2012, from the World Bank website: http://siteresources.worldbank.org/INTCOMRISMAN/Resources/RapidAgriculturalSupplyChainRiskAssessmentConceptualFramework.pdf
Johnsen, D. B. (2006). A culturally correct proposal to privatize the British Columbian salmon fishery. In T. L. Anderson, B. L. Benson, & T. E. Flanagan (Eds.), Self-determination: The other path for Native Americans: 94-133. Stanford: Stanford University Press.
Johnsen, D. B. (2009). Salmon, science, and reciprocity on the Northwest Coast. Ecology and society, 14(2): 43.
Jones, G., White, M., Cooper, O., & Storchmann, K. (2005). Climate Change and Global Wine Quality. Climatic Change, 73(3): 319-343.
Jones, H. D. (2005). Wheat transformation: current technology and applications to grain development and composition. Journal of Cereal Science, 41(2): 137-147.
Jones, R. N., Lim, B., Burton, I. (unpublished draft, 2002). Adaptation to climate change starts with human-environment interactions developed to cope with climate variability: A risk management approach.
Kalff, S., Lefebvre, A. (no date). Using Agri-Environmental Indicators in Decision-Making: Examples from Canada and Issues to Consider. AAFC. Retrieved on August 22, 2011, from the AAFC website: http://www.oecd.org/dataoecd/40/45/44810481.pdf
Keats, T. (2008.) Assessing our vulnerability and adapting to a changing climate. Climate Change Adaptation Workshop presentation. Engineers Canada and the Government of Newfoundland and Labrador. Saint John, NB. Retrieved on September 13, 2011, from the Government of Newfoundland and Labrador website: http://www.gnb.ca/0009/0373/0004/pdf/Keats-e.pdf
Keevil, G. ( June 11, 2012) Food scarce in Yukon towns cut off by flooding. The Globe and Mail. http://www.the-globeandmail.com/news/national/food-scarce-in-yukon-towns-cut-off-by-flooding/article4249680/
Khakbazan, M., Mohr, R. M., Derksen, D. A., Monreal, M. A., Grant, C. A., Zentner, R. P., Moulin, A. P., McLaren, D. L., Irvine, R. B., & Nagy, C. N. (2009). Effects of alternative management practices on the economics, energy
113
ACT ( A DA P TAT ION TO CL IM AT E CH A NGE T E A M)
and GHG emissions of a wheat–pea cropping system in the Canadian prairies. Soil & Tillage Research, 104(1): 30-38.
Kindon, J, Fox, G, McKenney, D, & Rollins, K. (2001) Economic impact of the 1998 ice storm on the Eastern Ontario maple syrup industry. The Forestry Chronicle, Vol. 77(4)
Klassen, H. (1999). A Business History of Alberta. Calgary, AB: University of Calgary Press.
Knowler, D. & Bradshaw, B. (2007) Farmers’ adoption of conservation agriculture: A review and synthesis of recent research. Food Policy 32(1): 25-48.
Koc, M., McRae, R., Mougeot, L. & Welsh, J. (1999). Introduction: Food Security as a Global Concern. In Koc, M. et al. (eds). For Hunger Proof Cities: Sustainable Urban Food Systems. Ottawa: International Development Research Centre. pp. 1-7.
Kutcher, H. R., Warland, J. S., & Brandt, S. A. (2010). Temperature and precipitation effects on canola yields in Saskatchewan, Canada. Agricultural & Forest Meteorology, 150(2): 161-165.
Laderach, P., Lundy, M., Jarvis, A., Ramirez, J., Perez Portilla, E., Schepp, K., and Eitzinger, A. (2011). Predicted impact of climate change on coffee supply chains. In Filho, W.L. (Ed.) The economic, social and political elements of climate change. Berlin/Heidelberg: Springer-Verlag.
Laderach, P., Jarvis, A., Ramirez, J. (2008). The impact of climate change in coffee-growing regions. In.: Taller de Adaptacion al Cambio Climatico en las Comunidades Cafetaleras de la Sierra Madre de Ciapas, Tuxtla Gutierrez, Chiapas: 17-18.
Lamari, L., McCallum, B., & dePauw, R. (2005). Forensic pathology of Canadian bread wheat: The case of tan spot. Phytopathology, 95(2): 144-152.
Larney, F. J., &Hao, X. (2007). A review of composting as a management alternative for beef cattle feedlot manure in southern Alberta, Canada. Bioresource Technology, 98(17): 3221-3227.
Lawlor, J. (2010, February 26). Frozen Vines (and Fingers) Yield a Sweet Reward. New York Times: 32.
Levitt, T. (2011, September 12). Food speculation fuels Mexico’s tortilla crisis. The Ecologist. Retrieved on September 13, 2011, from The Ecologist website: http://www.theecologist.org/trial_investigations/1051194/mexicos_poor_suffer_as_food_speculation_fuels_tortilla_crisis.html
Loáiciga, H. A. (2003). Climate Change and Ground Water. Annals of the Association of American Geographers, 93(1): 30-41.
Lobell, D., Schenkler, W., Costa-Roberts, J. (2011). Climate Trends and Global Crop Production Since 1980. Science 333(6042): 616-620.
CLIMATE CHANGE ADAPTATION AND CANADA’S CROPS AND FOOD SUPPLY BACKGROUND REPORT
114
Lobell, D.B., Field, C.B. (2009). California Perennial Crops in a Changing Climate. California Climate Change Center. Retrieved on September 6, 2011, from the California Energy Commission website: http://www.energy.ca.gov/2009publications/CEC-500-2009-039/CEC-500-2009-039-F.PDF
Lobell, D.B., Torney, A., Field, C.B. (2009). Climate Extremes in California Agriculture. California Climate Change Center. Retrieved on September 6, 2011, from the California Energy Commission website: http://www.energy.ca.gov/2009publications/CEC-500-2009-040/CEC-500-2009-040-F.PDF
Locher, J., Yoels, W., Maurer, D., & van Ells, J. (2005). Comfort Foods: An Exploratory Journey into the Social and Emotional Significance of Food. Food and Foodways: Explorations in the History and Culture of Human Nourishment 13(4): 273-297.
Manitoba Government. (no date). Adapting to Climate Change: Preparing for the Future. Retrieved August 10, 2011 from the Manitoba Government website: http://www.gov.mb.ca/asset_library/en/beyond_kyoto/adapting_to_cli-mate_change.pdf
Manitoba Government. (2011). Flood Information. Retrieved on August 26, 2011, from the Province of Manitoba website: http://www.gov.mb.ca/flooding/fighting/print,index.htm
Manitoba Sustainable Agriculture Practices Program: Beneficial Management Practices Catalogue. (August 2010). Manitoba Agriculture, Food and Rural Initiatives. Retrieved on June 8, 2013 from: http://www.gov.mb.ca/agriculture/growingforward/gf_programs/pdf/aaa19s19d.pdf
Mantua, N. J., Hare, S. R., Zhang, Y., Wallace, J. M., & Francis, R. C. (1997). A Pacific interdecal climate oscillation with impacts on salmon production. Bulletin of the American Meteorological Society,78: 1069-1079.
Marin, F.R., Jones, J., Royce, F., Pellegrino, G., and Assad, E. (2011). Climate change impacts on sugarcane produc-tion in southern Brazil. Retrieved June 8, 2013 from: http://a-c-s.confex.com/crops/2011am/webprogram/Paper64919.html
Martin, J. M., & Rogers, R. W. (2004). Forage-Produced Beef: Challenges and Potential. The Professional Animal Scientist (20): 205-210.
Mason, C. I. (1990). A sweet small something: Maple sugaring in the New World. In J. A. Clifton (Ed.), The invented Indian: Cultural fictions and government policies (91-105). New Brunswick, NJ: Transaction Publishers.
McDonough, B., Hoyer, W.,Osterberg, D. (2012). Advice Ignored: Climate Change and Iowa Water Quality Policy. The Iowa Policy Project. http://www.iowapolicyproject.org/2012docs/120521-climate-water.pdf
McGinn, S. M., & Shepherd, A. (2003). Impact of climate change scenarios on the agroclimate of the Canadian prairies. Canadian Journal of Soil Science (83): 623-630.
McGinn, S. M., Toure, A., Akinremi, O. O., Major, D. J. and Barr, A. G. (1999). Agroclimate and crop response to climate change in Alberta. Canada.Outlook on Agriculture 28(1): 19-28.
115
ACT ( A DA P TAT ION TO CL IM AT E CH A NGE T E A M)
McLeman, Robert and Barry Smit. Vulnerability to climate change hazards and risks: crop and flood insurance. Canadian Geographer 50 (2): (Summer 2006): 217-226. Retrieved on February 10, 2012 from:
http://www.uoguelph.ca/gecg/images/userimages/McLeman%20%26%20Smit%20(2006)_Canadian%20Geographer.pdf
Mendelsohn, R., & Reinsborough, M. (2007). A Ricardian analysis of US and Canadian farmland. Climatic Change, 81(1): 9-17.
Metroeconomica Ltd. (2004). Costing the impacts of climate change in the UK – Overview of guidelines. UKCIP. Retrieved on October 3, 2011, from the UKCIP website: http://www.ukcip.org.uk/wordpress/wp-content/PDFs/Costings_overview.pdf
Meyer, Marion (1997) The Insurance Industry and Climate Change on the Prairies, International Institute for Sustainable Development. Retrieved July 15, 2011 from: http://www.Meyer (1997)..org/pdf/insurance_climate.pdf
Miller, K. A. (2000). Pacific salmon fisheries: Climate, information, and adaptation in a conflict-ridden context. Climatic Change (45): 37-61.
Miner, J., Hensen, M. (2011, May 5). Lousy weather creates trouble in the fields. London Free Press. Retrieved August 8, 2011 from the London Free Press website: http://www.lfpress.com/news/london/2011/05/04/18103791.html
Moench, M., Ahmed, S., Mustafa, D., Khan, F., Mechler, R., Kull, D., Dixit, A., Opitz-Stapleton, S., and The Risk to Resilience Study Team. (2008). From Risk to Resilience (Working Paper 8) – Moving from Concepts to Practice: A Process and Methodology Summary for Identifying Effective Avenues for Risk Management under Changing Climatic Conditions. ISET, ISET-Nepal and ProVention. Kathmandu, Nepal. Retrieved on September 16, 2011, from the ProVention Consortium website: http://www.proventionconsortium.org/themes/default/pdfs/CBA/ISET_wp08_resilience.pdf
Monsanto. (2011). Monsanto Wheat Breeding. Retrieved from http://www.monsanto.com/products/Pages/wheat.aspx (accessed June 1, 2011)
Morand, H. (2010). Environmental Sustainability of Canadian Agriculture: Agri-Environmental Indicator Report Series – Report No. 3. AAFC. Retrieved on August 19, 2011, from the AAFC website: http://www4.agr.gc.ca/AAFC-AAC/display-afficher.do?id=1290720809246&lang=eng
Moser, S.C. &Ekstrom, J. (2012). Toward a Vibrant, Prosperous and Sustainable Fresno County: Vulnerability and Adaptation in the Midst of Rapid Change. California Energy Commission. Publication number:CEC-500-2012-055. http://www.energy.ca.gov/2012publications/CEC-500-2012-055/CEC-500-2012-055.pdf
Mote, P. W., Parson, E. A., Hamlet, A. F., Keeton, W. S., Lettenmaier, D., Mantua, N., Miles, E. L., Peterson, D. W., Peterson, D. L., Slaughter, R., & Snover, A. K. (2003). Preparing for climatic change: The water, salmon, and forests of the Pacific Northwest. Climatic change 61(1-2): 45-88.
Muckle, R. J. (2007). The First Nations of British Columbia: An anthropological survey. Vancouver: UBC Press.
CLIMATE CHANGE ADAPTATION AND CANADA’S CROPS AND FOOD SUPPLY BACKGROUND REPORT
116
National Academy of Sciences. (2012). Disaster Resilience: A National Imperative. Committee on Increasing National Resilience to Hazards and Disasters and Committee on Science, Engineering, and Public Policy. Washington, DC: The National Academies Press.
Natural Resources Canada. (2010). London, Ontario’s Climate Change Adaptation Strategy. Retrieved on May 26, 2012, from the NRCan website: http://www.nrcan.gc.ca/earth-sciences/climate-change/community-adaptation/municipalities/726
Nelson, G. C., Rosegrant, M. W., Koo, J., Robertson, R., Sulser, T., Zhu, T., Ringler, C., Msangi, S., Palazzo, A., Miroslav, B., Magalhaes, M., Valmonte-Santos, R., Ewing, M., Lee, D. (2009). Food Policy Report: Climate Change – Impact on Agriculture and Costs of Adaptation. International Food Policy Research Institute. Retrieved on August 8, 2011 from the IFPRI website: http://www.ifpri.org/sites/default/files/publications/pr21.pdf
Nielsen, D., Vigil, M., & Benjamin, J. (2011). Evaluating decision rules for dryland rotation crop selection. Field Crops Research 120(2): 254-261.
Norquay, D. (2010, January 20). Development of Flood Mitigation Programs in Manitoba (Presentation). Manitoba Water Stewardship, Manitoba Government. Retrieved on August 31, 2011, from the RRRBC website: http://www.redriverbasincommission.org/Conference/Proceedings/27th_Proceedings/Norquay_Development_Of_Flood_Mitigation_Programs_in_Manitoba__Jan_15__2009B_.pdf
Norrie, K. H. (1975). The rate of settlement of the Canadian prairies, 1870-1911. The Journal of Economic History 35(2): 410-427.
NRTEE. (2011). Paying the Price: The Economic Impacts of Climate Change for Canada. NRTEE. Retrieved on September 29, 2011, from the NRTEE website: http://nrtee-trnee.ca/wp-content/uploads/2011/09/paying-the-price.pdf
Obayashi, T. (1996). Salmon in myth and ritual in the Northern Pacific area. In J. Pentikäinen (Ed.), Shamanism and Northern ecology: 313-332. Berlin: Mouton de Gruyter.
OECD. (2011b). Agricultural Policy Monitoring and Evaluation 2011 – OECD Countries and Emerging Economies. Australia. Retrieved on October 11, 2011, from the OECD website: http://www.oecd-ilibrary.org/agriculture-and-food/agricultural-policy-monitoring-and-evaluation-2011/australia_agr_pol-2011-8-en
OECD (2006). Total Economic Value. OECD, Cost-Benefit Analysis and the Environment: Recent Developments. OECD Publishing. doi: 10.1787/9789264010055-7-en
Olmstead, J. & Kleinschmit, J. (2011). A Risky Proposition: Crop Insurance in the Face of a Changing Climate. Washington: Institute for Agriculture and Trade Policy
OMAFRA. (2011). Production Systems Research Theme (2008-2018) website. Retrieved May 17, 2011 from: http://www.omafra.gov.on.ca/english/research/uofgresearch/prodsystemsindex.html
117
ACT ( A DA P TAT ION TO CL IM AT E CH A NGE T E A M)
Ostry, A., Miewald, C., and Beveridge, R. (2011). Climate Change and Food Security in British Columbia. Pacific Institute for Climate Solutions White Paper. Retrieved on June 3, 2012, from the PICS website: http://pics.uvic.ca/assets/pdf/publications/WP_Food_Security_November2011.pdf
Page, J. (2007). Salmon farming in First Nations’ territories: A case of environmental injustice on Canada’s West Coast. Local environments 12(6): 613-626.
Parnell, J., (2012). Off the menu: the climate change food crises. Responding to Climate Change. Retrieved June 8, 2013 from: http://www.rtcc.org/living/off-the-menu-the-climate-change-food-crises/
Peigné, J., & Girardin, P. (2004). Environmental impacts of farm-scale composting practices. Water, Air and Soil Pollution, 153(1-4): 45-68.
Philippines: Banana industry on edge over effects of climate change. (2009). FreshPlaza: Global Fresh Produce and Banana News. Retrieved June 8, 2013 from: http://www.freshplaza.com/news_detail.asp?id=38315
Pierce, A. (2002). Maple syrup (acersaccharrum). In P. Shanley, A. Pierce, S. Laird, & A. Guillen (Eds.), Tapping the green market: Certification and management of non-timber forest products: 162-171. London, UK: Earthscan Publications.
PMSEIC Independent Working Group (2007) Climate Change in Australia: Regional Impacts and Adaptation – Managing the Risk for Australia, Report Prepared for the Prime Minister’s Science, Engineering and Innovation Council, Canberra. http://www.innovation.gov.au/Science/PMSEIC/Documents/ClimateChangeinAustralia.pdf
Price, M. H., Darimont, C. T., Temple, N. F., & MacDuffee, S. M. (2008). Ghost runs: management and status assess-ment of Pacific salmon (Oncorhynchus spp.) returning to British Columbia’s central and north coasts. Canadian Journal Of Fisheries & Aquatic Sciences 65(12): 2712-2718.
Qian, B., De Jong, R., Warren, R., Chipanshi, A., & Hill, H. (2009). Statistical spring wheat yield forecasting for the Canadian Prairie Provinces. Agricultural and Forest Meteorology 149(6/7): 1022-1031.
Qian, B., Zhang, X., Chen, K. Feng, Y., & O’Brien, T. (2010) Observed long-term trends for agroclimatic conditions in Canada. Journal of Applied Meteorology and Climatology (49): 604-618.
Reif, J., Zhang, P., Dreisigacker, S., Warburton, M., van Ginkel, M., Hoisington, D., Bohn, M. &Melchinger, A. (2005). Wheat genetic diversity trends during domestication and breeding. Theoretical & Applied Genetics 110(5): 859-864.
Rex, J. F. & Petticrew, E. L. (2008). Delivery of marine-derived nutrients to streambeds by Pacific salmon. Nature geoscience 1: 840-843.
Richter, A. & Kolmes, S. A. (2005). Maximum temperature limits for chinook, coho, and chum salmon, and steelhead trout in the Pacific Northwest. Reviews in fisheries science (13): 23-49.
CLIMATE CHANGE ADAPTATION AND CANADA’S CROPS AND FOOD SUPPLY BACKGROUND REPORT
118
Rolle, L., Torchio, F., Cagnasso, E., &Gerbi, V. (2010). Evolution of mechanical variables of winegrapes for ic.wine production during on-vine drying. Italian Journal of Food Science 22(2): 143-149.
RRBC. (2011). Red River Basin Commission’s Long Term Flood Solutions for the Red River Basin. Final Report to that States of Minnesota Pursuant to Session Laws (2009 Chapter 93) and North Dakota Pursuant to the 2009 North Dakota Chapter 20, House Bill 1046, section 9. http://www.redriverbasincommission.org/Comprehensive_Report_12-15-11_FINAL.pdf
RRBC. (2011). Finding Long Term Flood Solutions Together – Report to State and Federal Officials on a Comprehensive Plan of Flood Strategies for the Basin of the Red River of the North, 2009-2011. (Draft Report). Retrieved on September 2, 2011, from the RRBC website: http://www.redriverbasincommission.org/comprehensive_draft_8-29-11x.pdf
Rubin, Josh. (2011, August 16). Global warming could deliver a jolt to coffee lovers. The Toronto Star. Retrieved August 19, 2011, from the Toronto Star website: http://www.thestar.com/business/article/1040301--grounds-for-concern
Salazar, K. (2009) Order No. 3289. The Secretary of the Interior. http://www.doi.gov/archive/climatechange/SecOrder3289.pdf
Samson, C. (2006). Farming profitably in a changing climate: A risk management approach. Bureau of Rural Sciences, Australian Government. Retrieved on August 22, 2011, from the Bureau of Rural Sciences website: http://adl.brs.gov.au/data/warehouse/pe_abare99001237/pc13379.pdf
Schor, J. (2010). Plenitude – The New Economics of True Wealth. Penguin Press. New York, NY, USA.
Scism, Leslie. (2012). Storm Clouds Gather Over Florida Insurers. Wall Street Journal, Feb. 6, 2012, at C1.
Schreiber, D. (2006). First Nations, consultation, and the rule of law: Salmon farming and colonialism in British Columbia. American Indian culture and research journal 30(4): 19-40.
Schultz, H. R., & Jones, G. V. (2010). Climate Induced Historic and Future Changes in Viticulture. Journal of Wine Research 21(2/3): 137-145.
Schultz, H. R. & Stoll, M. (2010). Some critical issues in environmental physiology of grapevines: future challenges and current limitations. Australian Journal of Grape and Wine Research 16: 4-24.
Schwank, O.M., Steinemann, M., Bhojwani, H., Holthaus, E., Norton, M., Osgood, D., Sharoff, J., Bresch, D., Spiegel, A. (2010). Insurance as an Adaptation Option under UNFCCC. Background Paper. Final Version. Zurich: INFRAS / IRI / SWISS RE. Retrieved October 2010 from the BAFU website: http://www.bafu.admin.ch/klima/10343/index.html?lang=en&download=NHzLpZeg7t,lnp6I0NTU042l2Z6ln1ad1IZn4Z2qZpnO2Yuq2Z-6gpJCGeH99hGym162epYbg2c_JjKbNoKSn6A--
119
ACT ( A DA P TAT ION TO CL IM AT E CH A NGE T E A M)
Schwartz, D. (2012, August 9). Drought has major impact in North America and worldwide. CBC News. Retrieved on August 15, 2012 from the CBC News website: http://www.cbc.ca/news/world/story/2012/08/09/f-drought-impact.html
Shaw, A. B. (1999). The emerging cool climate wine regions of Eastern Canada. Journal of Wine Research 10(2), 79.
Shaw, A. B. (2005). The Niagara Peninsula viticultural area: A climatic analysis of Canada’s largest wine region. Journal of Wine Research 16(2), 85-103.
Skees, J.R., Barnett, B.J., and Collier B. (2008). Agricultural Insurance: Background and Context for Climate Adaptation Discussions. Lexington: Global AgRisk.
Skees, J.R., Barnett, B.J., Collier, B. (2008) Background and context for climate adaptation discussions. Lexington, KY, USA: GlobalAgRisk Inc. Prepared for the OECD Expert Workshop on Economic Aspects of Adaptation, Paris, France, April 7-8, 2008.
Slaney, T. L., Hyatt, K. D., Northcote, T. G., and Fielden, R. J. (1996). Status of anadromous salmon and trout in British Columbia and Yukon. Fisheries 21(10): 20-38.
Smit, B., Burton, I., Klein, R., & Wandel, J. (2000). An anatomy of adaptation to climate change and variability. Climatic Change 45(1): 223.
Smit, B., McNabb, D., & Smithers, J. (1996) Agricultural adaptation to climate variation. Climatic Change 33: 7-29.
Sparks (2008) Adapting to Climate Extreme Events Risks across Canada’s Agricultural Economic Landscape: An Integrated Pilot Study of Watershed Infrastructure System Adaptation. Natural Resources Canada. http://www.rmcormanpark.ca/media/tinymce_files/news/planning/LIRA%20Report%20-%20Part%201.pdf
Statistics Canada. (2011). Field and special crops (table). CANSIM (database). Last updated: April 26. http://www40.statcan.gc.ca/l01/cst01/prim11a-eng.htm (accessed May 29, 2011).
Statistics Canada (2011, July 22) Latest Release from the Consumer Price Index. Retrieved on August 17, 2011, from the Statistics Canada website: http://www.statcan.gc.ca/subjects-sujets/cpi-ipc/cpi-ipc-eng.htm
Stehfest, E., Bouwman, L., van Vuuren, D., den Elzen, M., Eickhout, B., &Kabat, P. (2009). Climate benefits of changing diet. Climatic Change (95): 83-102.
Stern. (2005). The Economics of Climate Change: the Stern Review. UK Treasury. 27. Retrieved on September 7, 2011, from the UK National Archives website: http://webarchive.nationalarchives.gov.uk/+/http://www.hm-treasury.gov.uk/independent_reviews/stern_review_economics_climate_change/stern_review_report.cfm
Stern. (2005). Part II: The Impacts of Climate Change on Growth and Development: 3.
CLIMATE CHANGE ADAPTATION AND CANADA’S CROPS AND FOOD SUPPLY BACKGROUND REPORT
120
Straub, Matthew. (August 30, 2007). AAFC Workshop: Valuing public benefits in agricultural landscapes. AAFC. Retrieved on August 22, 2011 from the AAFC website: http://www.agr.gc.ca/pol/egs-bse/pdf/straub_e.pdf
Subden, R. E., Husnik, J. I., van Twest, R., van der Merwe, G., & van Vuuren, H. J. J. (2003). Autochthonous microbial population in a Niagara Peninsula icewine must. Food Research International 36(7): 747.
The Expert Panel on Climate Change Adaptation. (2009). Adapting to Climate Change in Ontario: Towards the Design and Implementation of a Strategy and Action Plan. Retrieved from the Province of Ontario, Ministry of Environment website: http://www.ene.gov.on.ca/stdprodconsume/groups/lr/@ene/@resources/documents/resource/std01_079212.pdf
Trostle, R. (2008). Global Agricultural Supply and Demand: Factors Contributing to the Recent Increase in Food Commodity Prices. WRS 0801. USDA Agricultural Research Service.
UK Cabinet Office. (2008). Food Matters: Towards a Strategy for the 21st Century. Retrieved on June 1, 2012, from the UK Cabinet Office website: http://webarchive.nationalarchives.gov.uk/+/http://www.cabinetoffice.gov.uk/media/cabinetoffice/strategy/assets/food/food_matters1.pdf
UK-DEFRA. Insurance webpage ( July 20, 2012). Retrieved August 22, 12 from: http://www.defra.gov.uk/environment/flooding/funding-outcomes-insurance/insurance/
UK-DEFRA. ( January 27, 2012). The Government’s Response to Sir Michael Pitt’s Review of the summer 2007 Floods Final Progress Report. Retrieved on August 22, 2012 from: http://www.defra.gov.uk/publications/files/2012-01-31-pb13705-pitt-review-progress.pdf
UK-DEFRA. (December 2011). Flood risk and insurance: A roadmap to 2013 and beyond: Final report of the flood insurance working groups. Retrieved on August 22, 2012 from: http://www.defra.gov.uk/publications/2011/12/19/pb13684-flood-risk-insurance
UNEP. (2011, May 10). Press releases: UN Announces Winners of Flagship Environment Award. Retrieved on September 8, 2011, from the GRID website: http://www.grida.no/news/press/4756.aspx
UN FAO. (1996). Report of the World Food Summit, 13-17 November, 1996. Retrieved on June 1, 2012, from the UN FAO website: http://www.fao.org/docrep/003/w3548e/w3548e00.htm.
Union of Concerned Scientists. (2011). Coffee and climate: what’s brewing with climate change? http://ucsusa.org/global_warming/science_and_impacts/impacts/impacts-of-climate-on-coffee.html?utm_source=sp&utm_medium=head&utm_campaign=coffee-and-climate-10-13-11-head
UNISDR. (2012). What is disaster risk reduction? Retrieved on May 25, 2012, from the UNISDR website: http://www.unisdr.org/who-we-are/what-is-drr
121
ACT ( A DA P TAT ION TO CL IM AT E CH A NGE T E A M)
UNISDR. (2011). Climate change adaptation and Disaster Risk Reduction in Europe - A review of risk governance. Retrieved on May 29, 2012, from the preventionweb website: http://www.preventionweb.net/files/submis-sions/20591_governanceccriskeurope.pdf
UNISDR. (2005). Hyogo Framework for Action 2005-2015: Building the resilience of nations and communities to disasters. Final report of the World Conference on Disaster Reduction (A/CONF.206/6). Retrieved on May 25, 2012, from the UNISDR website: http://www.unisdr.org/files/1037_hyogoframeworkforactionenglish.pdf.
United Nations Office of the United Nations High Commissioner for Human Rights (2012) Olivier De Schutter, Special Rapporteur on the right to food: Visit to Canada from 6 to 16 May 2012. Retrieved on June 1, 2012, from the Special Rapporteur on the Right to Food website: http://www.srfood.org/images/stories/pdf/officialreports/201205_canadaprelim_en.pdf
United Nations International Strategy for Disaster Reduction (UNISDR). (2009). UNISDR Terminology on Disaster Risk Reduction. Retrieved on November 10, 2011, from the UNISDR website: http://www.unisdr.org/files/7817_UNISDRTerminologyEnglish.pdf
United States Department of Agriculture, Foreign Agriculture Service. (2012). Global Agricultural Trade System Online. Retrieved on June 19, 2012 from: http://www.fas.usda.gov/gats/default.aspx
United States Government Accountability Office. (2007). Report to the Committee on Homeland Security and Government Affairs, U.S. Senate – Climate Change: Financial risks to federal and private insurers in coming decades are potentially significant. Retrieved on July 1, 2011 from: http://www.gao.gov/new.items/d07285.pdf
Unterschultz, J., Quagrainie, K., & Vincent, M. (1998). Evaluating Québec’s preference for Alberta beef versus US beef. Agribusiness 13(5): 457-468.
US ACE (2011) Final Feasibility Report and Environmental Impact Statement, Fargo-Moorhead Metropolitan Area Flood Risk Management. http://www.fmdiversion.com/pdf/CorpsReports1/Main_Report_with_Attachments.pdf
U.S. Army Corps of Engineers. (2011). Fargo-Moorhead Feasibility Study. Retrieved on August 31, 2011, from the International Water Institute website: http://www.internationalwaterinstitute.org/feasibility/index.htm
USDA. (2012, August 14). Weekly weather and crop bulletin. Retrieved on August 15, 2012 from the USDA website: http://www.usda.gov/oce/weather/pubs/Weekly/Wwcb/wwcb.pdf
USDA Economic Research Service. (2012). State Export Data. Total agricultural exports by state, last 5 fiscal years. http://www.ers.usda.gov/data/stateexports/
US DOI (2009) Press release: Salazar launches DOI Climate Change Response Strategy. September 14, 2009. http://www.doi.gov/news/pressreleases/Salazar-Launches-DOI-Climate-Change-Response-Strategy.cfm
U.S. Task Force on Federal Flood Control Policy. (1966, August 10). A Unified National Program for Managing Flood Losses. Communication from the President of the United States transmitting a report by the Task Force on Federal
CLIMATE CHANGE ADAPTATION AND CANADA’S CROPS AND FOOD SUPPLY BACKGROUND REPORT
122
Flood Control Policy. Washington, DC: U.S. Government Printing Office. Retrieved on August 15, 2012 from the Advisory Committee on Water Information website: http://acwi.gov/hydrology/minutes/floods89-465.pdf
Varty, J. (2004). On protein, Prairie wheat, and good bread: Rationalizing technologies and the Canadian state, 1912-1935. Canadian Historical Review 85(4): 721-753.
Vergé, X. C., Dyer, J. A., Desjardins, R. L., & Worth, D. (2008). Greenhouse gas emissions from the Canadian beef industry. Agricultural Systems 98(2): 126-134.
Wall, E. & Smit, B. (2005). Climate change in light of sustainable agriculture. Journal of Sustainable Agriculture 27(1): 113-123.
Wang, W., Vinocur, B., & Altman, A. (2003). Plant responses to drought, salinity and extreme temperatures: towards genetic engineering for stress tolerance. Planta 218: 1-14.
Wheeler, D. (2011). Quantifying vulnerability to climate change: implications for adaptation assistance. Working Paper 240. Center for Global Development.
White, M. A., Diffenbaugh, N. S., Jones, G. V., Pal, J. S., &Giorgi, F. (2006). Extreme heat reduces and shifts United States premium wine production in the 21st century. Proceedings of the National Academy of Sciences of the United States of America 103(30): 11217-11222.
Wilson, B. ( July 28, 2011). Tweaking still needed on next round of support: Ontario. Western Producer. Retrieved on June 8, 2013 from: http://www.producer.com/issue/july-28-2011-the-western-producer/
Willms, W., Kenzie, O., McAllister, T., Colwell, D., Veira, D., Wilmshurst, J., Entz, T., & Olson, M. (2002). Effects of water quality on cattle performance. Journal of Range Management (55): 452-460.
World Bank (2011) Food Price Watch (August 2011). Retrieved on September 9, 2011, from the World Bank website: http://siteresources.worldbank.org/INTPOVERTY/News%20and%20Events/22982477/Food-Price-Watch-August-2011.htm
World Bank. (2010). Economics of Adaptation to Climate Change. Retrieved on August 25, 2011, from the World Bank website: http://climatechange.worldbank.org/sites/default/files/documents/EACCSynthesisReport.pdf
World Bank. (2009). Climate Change Aspects in Agriculture - Mexico Country Note. Retrieved on September 8, 2011, from the World Bank website: http://siteresources.worldbank.org/INTLAC/Resources/257803-1235077152356/Country_Note_Mexico.pdf
Wright, T. 1990.Yield effect of pulses on subsequent cereal crops in the northern prairies. Canadian Journal of Plant Science (70): 1023-1032.
Yohe, L. (2010) January 19-20, 2010 - Long Term Flood Solutions Update. Red River Basin Commission. http://www.redriverbasincommission.org/Conference/Proceedings/27th_Proceedings/Lance_Yohe.pdf
123
ACT ( A DA P TAT ION TO CL IM AT E CH A NGE T E A M)
Zentner, R. P., Campbell, C. A., Biederbeck , V. O., Miller, P. R., Selles, F., & Fernandez, M. R. (2001). In search of a sustainable cropping system for the semiarid Canadian prairies. Journal of Sustainable Agriculture 18(2/3): 117-136.
Zentner, R. P., Lafond, G. P., Derksen, D. A., & Campbell, C. A. (2002). Tillage method and crop diversification: effect on economic returns and riskiness of cropping systems in a Thin Black Chernozem of the Canadian Prairies. Soil & Tillage Research 67(1): 9-22.
Ziska, L. H., Morris, C. F., &Goins, E. W. (2004). Quantitative and qualitative evaluation of selected wheat varieties released since 1903 to increasing atmospheric carbon dioxide: Can yield sensitivity to carbon dioxide be a factor in wheat performance? Global Change Biology 10(10): 1810-1819.
Zurich Financial Services, The Climate Risk Challenge: The Role of Insurance In Pricing Climate-Related Risks 4 (2009), http://www.zurich.com/internet/main/SiteCollectionDocuments/insight/ClimateRiskChallenge.pdf.
Zurich Financial Services (2009). The Climate Risk Challenge: The Role of Insurance In Pricing Climate-Related Risks. Retrieved August 22, 2012 from: http://www.zurich.com/internet/main/SiteCollectionDocuments/insight/ClimateRiskChallenge.pdf

CLIMATE CHANGE ADAPTATION AND CANADA’S CROPS AND FOOD SUPPLY BACKGROUND REPORT
12 4
AC T (A DA P TATION TO CLIM ATE CH A NGE TE A M)SFU Vancouver515 West Hastings StreetVancouver, BC V6B 5K3 TEL: (604) 671-24 49E-M A IL: [email protected]
W W W . S F U . C A / A C T


![EXTREME PROGRAMMINGfse.studenttheses.ub.rug.nl/8856/1/Infor_Ma_2001_TdeJong.CV.pdf · EXTREME PROGRAMMING 3.1. WHAT IS EXTREME PROGRAMMING? According to vd)sitc [3], Extreme Programming](https://img.pdfslide.us/doc/110x75/6008914c858cab1a066c00ad/extreme-extreme-programming-31-what-is-extreme-programming-according-to-vdsitc.jpg)