Embed Size (px)
Citation preview
\\vhb\check\Watertown\52151.05\reports\Pickpocket\December 2017 Update\52151.05_PickpocketDam_Updated.docx
101 Walnut Street
PO Box 9151
Watertown, MA 02472-4026
P 617.924.1770
To: Paul Vlasich, PE
Exeter Town Engineer
Date: December 30, 2016
REVISED December 15, 2017
Project #: 52151.05
From: Annique Fleurat
Todd Monson
Jake San Antonio, PE
Re: Dam Breach Analysis
Pickpocket Dam
Exeter, NH
Background
In accordance with RSA 482:12 and Env-Wr 302.02, the New Hampshire Department of Environmental Services, Dam
Bureau (NHDES) performed a dam inspection of the Pickpocket Dam on September 10, 2010. The dam is currently
owned and operated by the Town of Exeter. Based on the results of the inspection, in addition to subsequent analysis,
NHDES issued a Letter of Deficiency (LOD) for the Pickpocket Dam on March 28, 2011 identifying deficiencies and
remedial measures that NHDES requires. The LOD required that the Town of Exeter perform a breach analysis for the
Pickpocket Dam in accordance with NHDES Env-Wr 500 and report the results to the Dam Bureau.
In October 2016, the Town of Exeter contracted VHB to perform breach analyses for the dam for both the “sunny day”
breach, as well as a breach routed with the 100-year flood event, in accordance with NHDES Env-Wr 502. VHB
evaluated the downstream effects of a potential dam failure and developed potential dam break inundation mapping
in accordance with NHDES Env-Wr 503. The following sections summarize VHB’s hydrologic and hydraulic analyses,
results, and proposed dam hazard classification update, resulting from the required dam breach analyses. The results
also include an assessment of all structures potentially impacted by a dam failure, including the depth of flooding at
critical structures or groups of structures. All elevations in this memorandum are reported in feet and are relative to
the North American Vertical Datum of 1988 (NAVD88).
Site Description
Pickpocket Dam is located within the Exeter River along the municipal boundary between the towns of Exeter and
Brentwood, NH. Pickpocket Dam is an earth embankment dam with a concrete spillway and end walls, and was last
repaired/rebuilt in 1969. The dam is 15-feet high (from dam toe to top of abutments), 230-feet in total length, and the
main spillway length is approximately 130 feet. During a dam inspection performed by NHDES, and attended by VHB
and the Town of Exeter, on December 14, 2016, it was determined that the island located immediately upstream of the
dam on river-right likely limits conveyance over the dam. Based on site inspection and review of aerial topography,
VHB estimates that conveyance across approximately 45 linear feet across the dam would be limited by the island. The
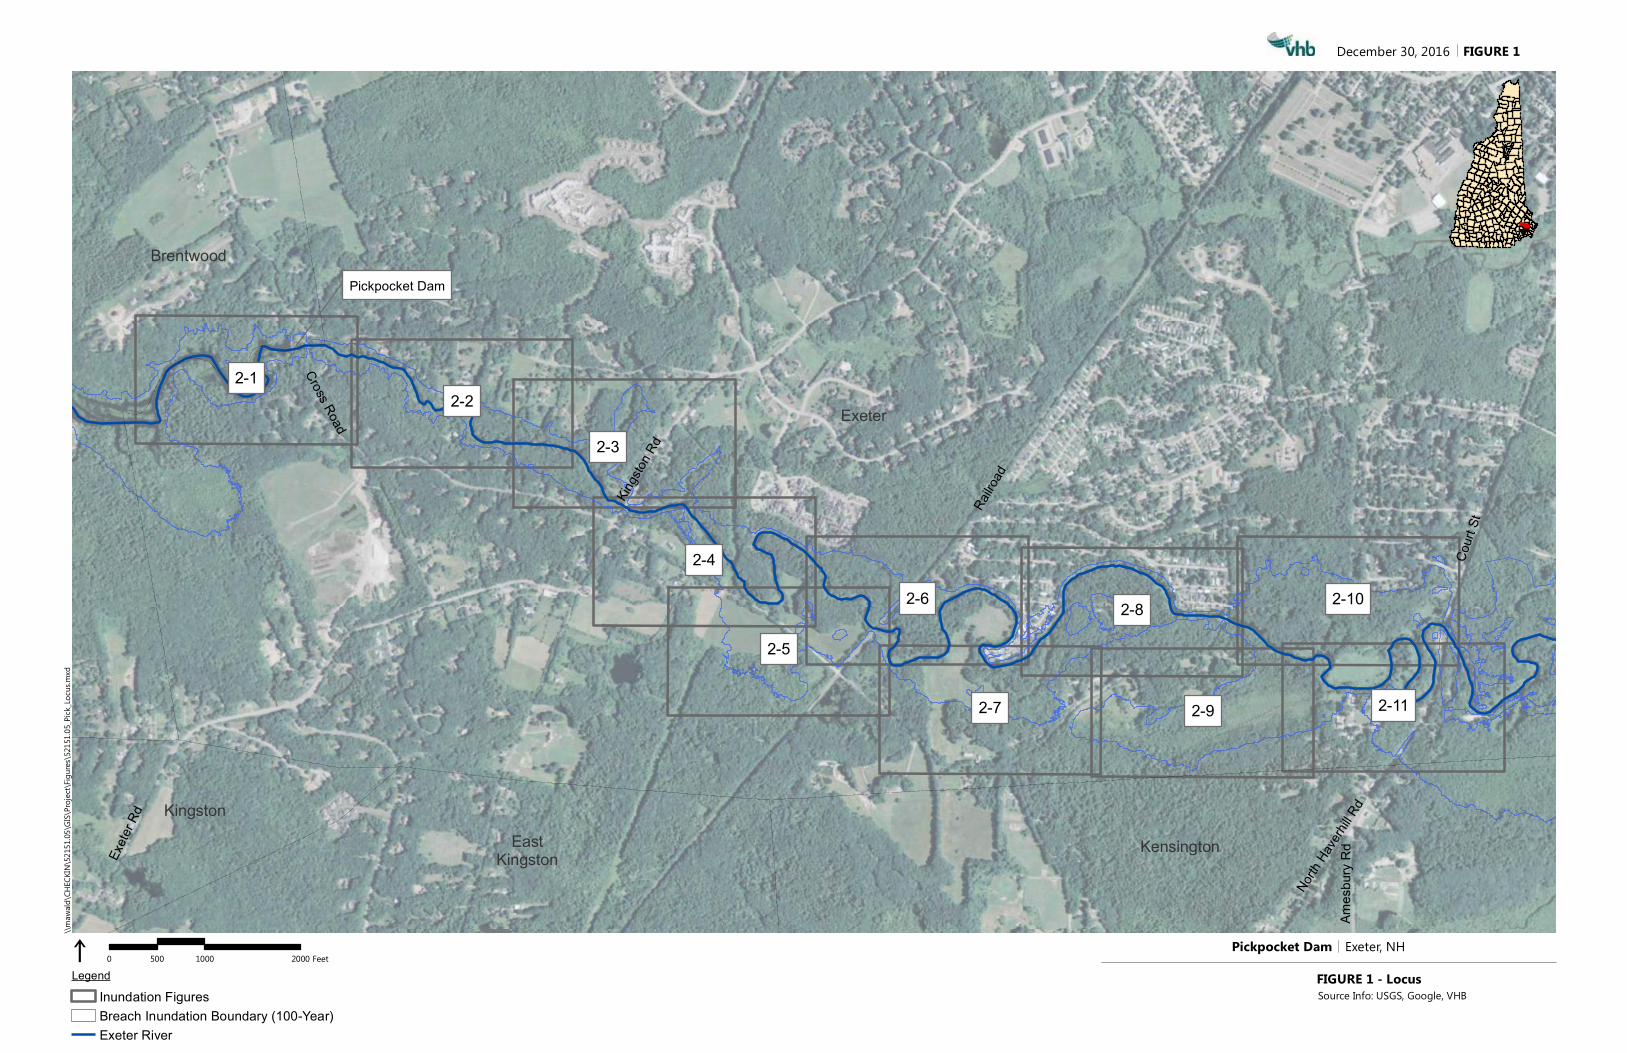
location of the dam is shown in Figure 1.
The contributing drainage area to Pickpocket Dam is approximately 74 square miles. Landcover within the watershed
consists predominately of forested, agricultural, and residential. The watershed is hilly with a well-defined river channel
and bordering wetlands. The River maintains a sinuous and meandering pattern with an average slope of 0.05 %
upstream of the dam and 0.04 % downstream of the dam. River depth upstream of the dam ranges from 1 foot to 10
feet.
Ref: 52151.05
December 30, 2016
Revised December 15, 2017
Page 2
\\vhb\check\Watertown\52151.05\reports\Pickpocket\December 2017
Update\52151.05_PickpocketDam_Updated.docx
Model Input Data Collection
Data for the hydrologic and hydraulic models for this breach analysis were collected from the following sources:
Site Visit and Photographs
VHB staff visited the Pickpocket Dam site and surrounding area on October 12, 2016 and December 14, 2016.
Field notes were recorded for information relative to the dam breach including dam geometry, vegetative cover,
and structures or critical areas within the potential inundation area.
Newly Acquired Survey Data
Survey data at Pickpocket Dam was collected by VHB on October 17, 2016. The collected survey data included
dam geometry and inverts, fish weir geometry and elevations, 1-ft contour data adjacent to and 200-feet
downstream of the dam, and Cross Road bridge geometry, inverts, and elevations.
GIS
Using the New Hampshire Granit GIS Clearinghouse, VHB obtained LiDAR data collected by the USGS in winter
and spring of 2011. VHB used the LiDAR data to develop a digital elevation model (DEM) for use in developing
extracting cross sections for use in the hydraulic model. VHB georeferenced hydraulic input data from the
National Flood Insurance Program (NFIP) Effective Flood Insurance Study (FIS) for Rockingham County, dated May
17, 2005, for the Exeter River upstream of Pickpocket Dam and combined this data with georeferenced hydraulic
inputs from the NFIP Preliminary model for Rockingham County, dated February 2016, for the reach downstream
of Pickpocket Dam.
Previous Studies
VHB collected relevant information from the following sources:
1. NHDES Dam Bureau File for Pickpocket Dam #029.07 provided historic data including inspections,
photographs, construction plans for repair, letters of deficiency, and other relevant correspondence.
2. The 2013 rainfall-runoff model developed using HEC-HMS (Hydrologic Engineering Center, Hydrologic
Modeling System) software and accompanying report from Weston & Sampson (W&S) was used to
develop runoff hydrographs for inputs in the hydraulic model. VHB reviewed model inputs, watershed
based hydrologic parameters, and outlet configurations to confirm model applicability for the breach
analysis.
3. Two NFIP flood insurance studies, and associated hydraulic models, were used to develop the hydraulic
model for the Exeter River both upstream and downstream of Pickpocket Dam. There is an effective study
from May 17, 2005 (modeling completed in April 1998) for the Exeter River upstream of the Pickpocket
Dam and a preliminary study from February 24, 2016 (modeling completed in April 2014) for the Exeter
River from the confluence with the Squamscott River upstream to the Pickpocket Dam.
Ref: 52151.05
December 30, 2016
Revised December 15, 2017
Page 3
\\vhb\check\Watertown\52151.05\reports\Pickpocket\December 2017
Update\52151.05_PickpocketDam_Updated.docx
Hydrologic Analysis
Weston & Sampson performed a hydrologic analysis of the Exeter River Watershed (which includes the Pickpocket
Dam) in 2013 to estimate storm event based peak flows to be used as part of the Great Dam Removal Feasibility
Study, completed by VHB. The hydrologic analysis was conducted in accordance with NHDES Env-Wr 403.05 -
“Hydrologic Investigations” guidance.
The rainfall-runoff model was developed within HEC-HMS, version 3.5, a hydrologic rainfall-runoff model developed
by the US Army Corps of Engineers (USACE). The model utilized the SCS curve number method to estimate runoff
hydrographs resulting from storm event based precipitation. Model watershed input parameters include drainage
area, development and land use characteristics, hydrologic soil groups, NRCS runoff coefficient (curve number), initial
abstraction, and times of concentration. VHB reviewed the model inputs to identify any necessary updates or changes
that should be included since the model’s development.
• VHB updated model precipitation totals and distribution curves using National Oceanic and Atmospheric
Administration (NOAA) Atlas 14 Point Precipitation Frequency Estimates. NOAA Atlas 14 estimates a 100-year,
24-hour precipitation total of 8.40 inches, which is slightly less than the 8.46 inches used in the original W&S
model. VHB obtained the US Department of Agriculture’s “Spreadsheet for Rainfall Distributions developed
for NOAA Atlas 14 Data” from www.usda.gov. This spreadsheet requires the user to input the rainfall depths
for the 5-min, 10-min, 15-min, 30-min, 60-min, 2-hour, 3-hour, 6-hour, 12-hour, and 24-hour design storms
and uses the Atlas 14 ratio to develop the distribution curve.
• VHB used the specified hyetograph method to define the depth and distribution for the 100-year storm,
which differs from the frequency-based hypothetical storm method used in the original W&S model. The
frequency storm method applies an area correction factor to reduce point estimate precipitation estimates for
large watershed areas. This analysis evaluated reduced watershed sizes for the Pickpocket Dam as compared
to the contributing area to the Great Dam. Based on guidance from NHDES Dam Bureau staff that the analysis
should provide a conservative estimate for peak flows in evaluating risk potential, and advice to use NOAA
Atlas 14 data and distributions, VHB selected the specified hyetograph method for this analysis.
• Subwatershed times of concentration (Tc) and associated lag times calculated in accordance with National
Resources Conservation Service (NRCS) National Engineering Handbook, Part 630 Hydrology, Chapter 15
watershed lag method based on calculated flow times for sheet and overland flow using site topographic and
land cover data from the original model were used in the analysis.
• Weighted Runoff Curve Numbers (CNs), which are used to characterize runoff properties for specific land use
and soil conditions, calculated in accordance with TR-55 methodologies for each subwatershed during the
original model were used in this analysis.
VHB estimated the “sunny day” flow based on the annual daily mean flow for the Exeter River at Pickpocket Dam. VHB
obtained flow statistics available from USGS National Water Information System: Web Interface’s Exeter River at Haigh
Road station gage (01073587) and scaled the flows based on the contributing watershed size of the gaged location
and the subject location. The analysis of 19 years of complete annual record data resulted in a “sunny day” estimated
flow of 136 cfs.
Ref: 52151.05
December 30, 2016
Revised December 15, 2017
Page 4
\\vhb\check\Watertown\52151.05\reports\Pickpocket\December 2017
Update\52151.05_PickpocketDam_Updated.docx
Hydraulic Analysis
VHB developed a dynamic (unsteady state) hydraulic model using the U.S. Army Corps of Engineers HEC-RAS
(Hydrologic Engineering Center, River Analysis System) (ver. 5.0.3) software to analyze water surface elevations (WSE)
and velocities downstream of Pickpocket Dam. Analysis of the Exeter River in the Flood Insurance Study for
Rockingham County, NH, was developed from two hydraulic models:
1. The original (Effective) model for Exeter River upstream of Pickpocket Dam developed in April 1998 in HEC-2
format
2. A revised (Preliminary) model for Exeter River downstream of Pickpocket Dam developed in April 2014 as part
of the revised analysis for the preliminary study released in February 2016, in HEC-RAS format
VHB requested both models from the FEMA Engineering Library, and the models were provided on November 11,
2016. Additional details for model development are included in the following sections.
The analysis included a “sunny day” breach and a breach routed with the 100-year flood event. VHB routed the flood
wave from Pickpocket Dam downstream along the Exeter River beyond a location where the water surface elevation
due to failure was no more than 2 feet above the non-failure condition. The study area includes Camelot Drive on
Wadleigh Point and Sir Lancelot Drive to evaluate the impacts to residences, which were identified as potential critical
evaluation areas by NHDES Dam Bureau staff in the LOD. Downstream of the Route 108 (Court Street) Bridge, water
surface elevations for the breach and non-breach scenarios are similar, and therefore results of the dam breach
analyses focus on areas upstream of this bridge.
Model Setup
The Effective model upstream included 13 cross sections between Crawley Falls Road (6.25 miles upstream of
Pickpocket Dam) and Pickpocket Dam. There is one bridge crossing (at Haigh Road) within this reach. VHB
georeferenced the HEC-2 model of the Exeter River upstream of the Pickpocket Dam and added additional cross
sections along the reach. VHB added 51 additional cross sections for a total of 64 cross sections to estimate the
impoundment storage upstream of Pickpocket Dam. VHB used the developed DEM from LiDAR and “burned” in
channel bathymetry below the normal water line by interpolating the river profile and cross-sectional data
provided in the HEC-2 model to estimate river geometry throughout the entire reach. VHB used Geographic
Information System (GIS) software, including HEC-GeoRAS to extract cross sectional elevation data from the
developed DEM and export the data to HEC-RAS format. Using HEC-RAS, VHB combined the georeferenced
upstream model with the preliminary model developed as part of the preliminary FIS to create a combined
continuous model of the Exeter River.
Upstream and downstream boundary conditions were provided for the model. The upstream boundary condition
was set as outflow hydrograph from the Brentwood Hydro Dam provided in the revised HEC-HMS model
developed as part of this analysis. Additional lateral and uniform hydrographs from the HEC-HMS model were
included as inputs along the study reach. The downstream boundary condition was set as normal depth based on
the channel slope at the lower limit of the model. Model scenarios with the Pickpocket Dam sluice gate open and
Ref: 52151.05
December 30, 2016
Revised December 15, 2017
Page 5
\\vhb\check\Watertown\52151.05\reports\Pickpocket\December 2017
Update\52151.05_PickpocketDam_Updated.docx
closed during the dam breach were developed as part of this analysis. VHB also evaluated the impact of removing
the fish weir located immediately downstream of Pickpocket Dam on water surface elevations downstream.
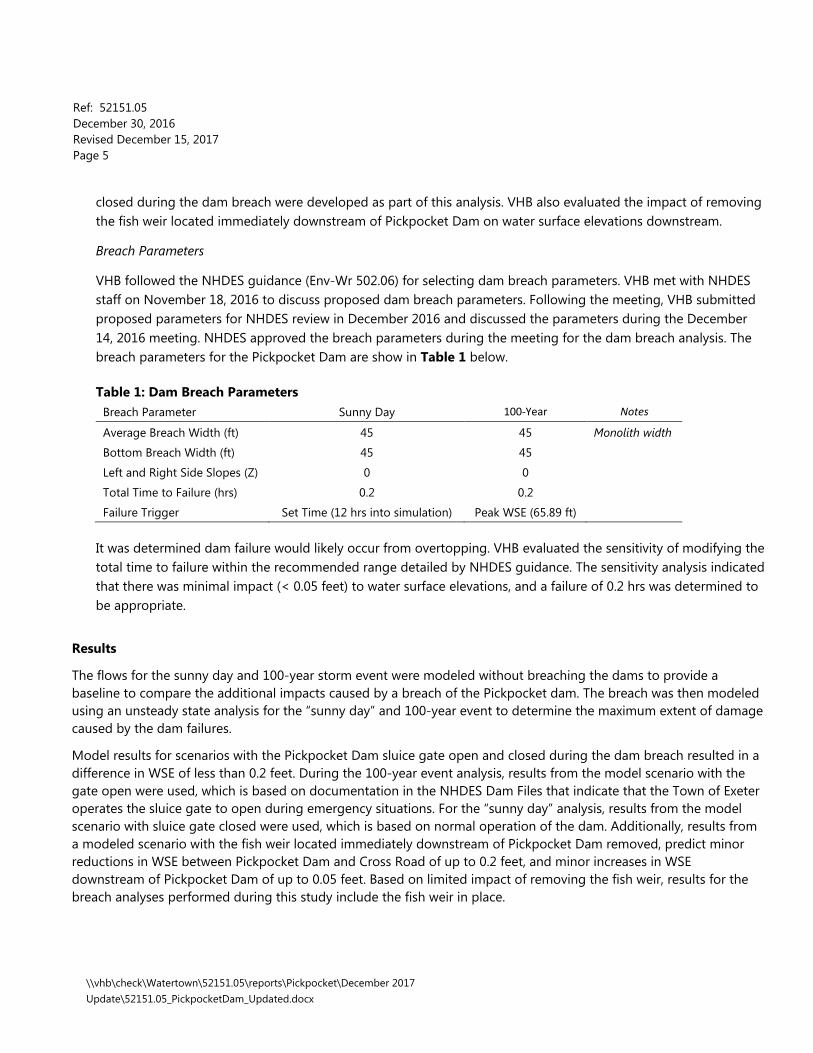
Breach Parameters
VHB followed the NHDES guidance (Env-Wr 502.06) for selecting dam breach parameters. VHB met with NHDES
staff on November 18, 2016 to discuss proposed dam breach parameters. Following the meeting, VHB submitted
proposed parameters for NHDES review in December 2016 and discussed the parameters during the December
14, 2016 meeting. NHDES approved the breach parameters during the meeting for the dam breach analysis. The
breach parameters for the Pickpocket Dam are show in Table 1 below.
Table 1: Dam Breach Parameters
Breach Parameter Sunny Day 100-Year Notes
Average Breach Width (ft) 45 45 Monolith width
Bottom Breach Width (ft) 45 45
Left and Right Side Slopes (Z) 0 0
Total Time to Failure (hrs) 0.2 0.2
Failure Trigger Set Time (12 hrs into simulation) Peak WSE (65.89 ft)
It was determined dam failure would likely occur from overtopping. VHB evaluated the sensitivity of modifying the
total time to failure within the recommended range detailed by NHDES guidance. The sensitivity analysis indicated
that there was minimal impact (< 0.05 feet) to water surface elevations, and a failure of 0.2 hrs was determined to
be appropriate.
Results
The flows for the sunny day and 100-year storm event were modeled without breaching the dams to provide a
baseline to compare the additional impacts caused by a breach of the Pickpocket dam. The breach was then modeled
using an unsteady state analysis for the “sunny day” and 100-year event to determine the maximum extent of damage
caused by the dam failures.
Model results for scenarios with the Pickpocket Dam sluice gate open and closed during the dam breach resulted in a
difference in WSE of less than 0.2 feet. During the 100-year event analysis, results from the model scenario with the
gate open were used, which is based on documentation in the NHDES Dam Files that indicate that the Town of Exeter
operates the sluice gate to open during emergency situations. For the “sunny day” analysis, results from the model
scenario with sluice gate closed were used, which is based on normal operation of the dam. Additionally, results from
a modeled scenario with the fish weir located immediately downstream of Pickpocket Dam removed, predict minor
reductions in WSE between Pickpocket Dam and Cross Road of up to 0.2 feet, and minor increases in WSE
downstream of Pickpocket Dam of up to 0.05 feet. Based on limited impact of removing the fish weir, results for the
breach analyses performed during this study include the fish weir in place.
Ref: 52151.05
December 30, 2016
Revised December 15, 2017
Page 6
\\vhb\check\Watertown\52151.05\reports\Pickpocket\December 2017
Update\52151.05_PickpocketDam_Updated.docx
Inundation mapping was developed for the breach analyses model runs for the “sunny day” and 100-year event. The
inundation maps were created using the HEC-RAS tool, RAS Mapper, and the DEM developed as part of this analysis.
Figure 2-1 through 2-11 depict the predicted downstream flood water boundaries and the following:
• The location of prominent structures and features adjacent to the river.
• The mean channel velocity during the peak flow condition.
• The peak water surface elevation and resulting increase in flood heights due to dam breach.
• The time from the start of dam breach to the arrival of the flood wave.
• The time from the start of dam breach to the peak water surface elevation.
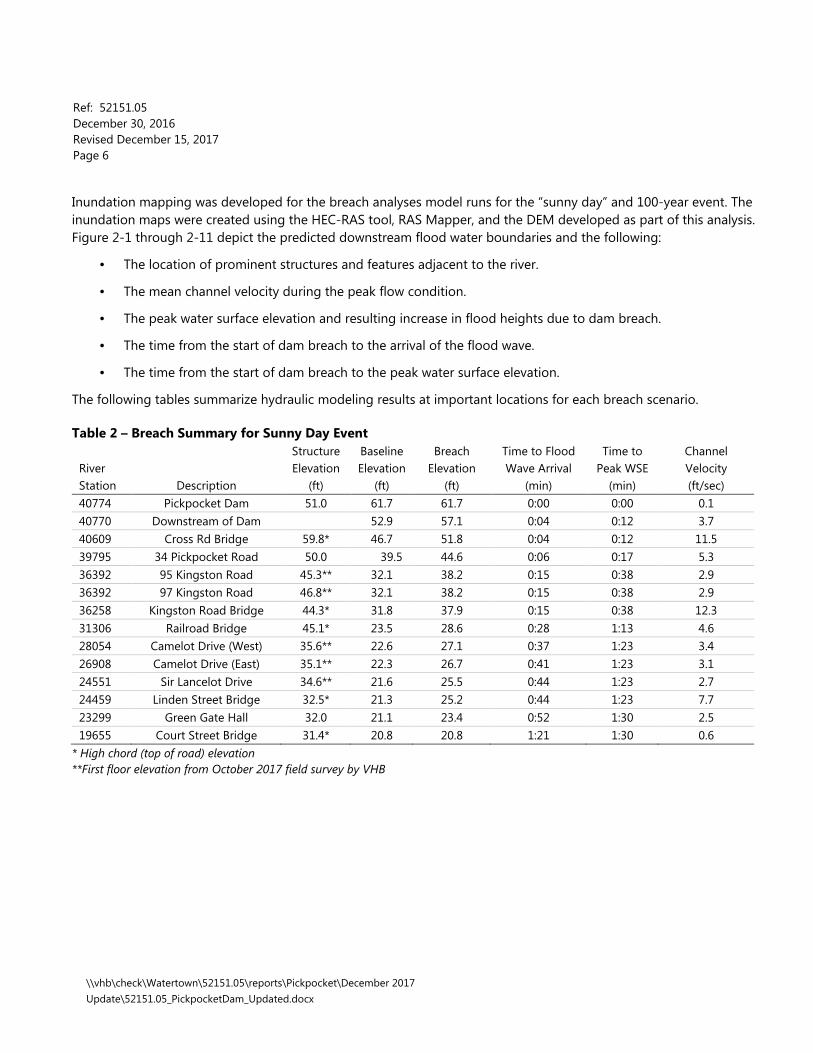
The following tables summarize hydraulic modeling results at important locations for each breach scenario.
Table 2 – Breach Summary for Sunny Day Event
River
Station Description
Structure
Elevation
(ft)
Baseline
Elevation
(ft)
Breach
Elevation
(ft)
Time to Flood
Wave Arrival
(min)
Time to
Peak WSE
(min)
Channel
Velocity
(ft/sec)
40774 Pickpocket Dam 51.0 61.7 61.7 0:00 0:00 0.1
40770 Downstream of Dam 52.9 57.1 0:04 0:12 3.7
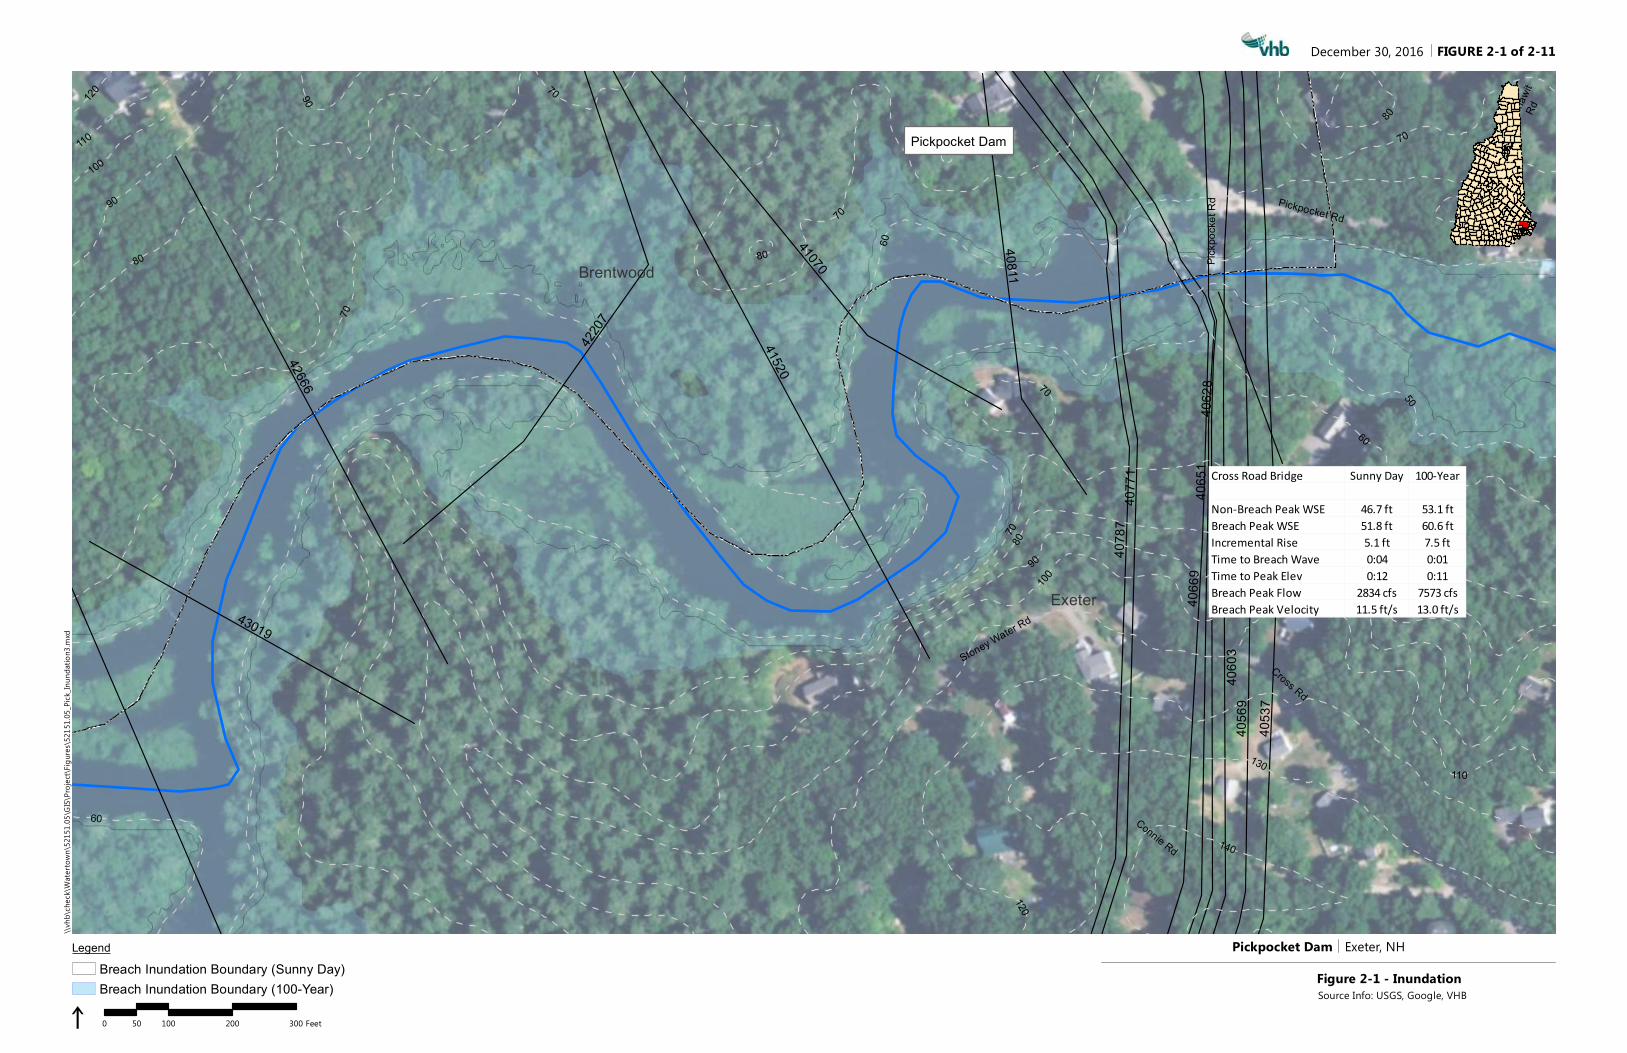
40609 Cross Rd Bridge 59.8* 46.7 51.8 0:04 0:12 11.5
39795 34 Pickpocket Road 50.0 39.5 44.6 0:06 0:17 5.3
36392 95 Kingston Road 45.3** 32.1 38.2 0:15 0:38 2.9
36392 97 Kingston Road 46.8** 32.1 38.2 0:15 0:38 2.9
36258 Kingston Road Bridge 44.3* 31.8 37.9 0:15 0:38 12.3
31306 Railroad Bridge 45.1* 23.5 28.6 0:28 1:13 4.6
28054 Camelot Drive (West) 35.6** 22.6 27.1 0:37 1:23 3.4
26908 Camelot Drive (East) 35.1** 22.3 26.7 0:41 1:23 3.1
24551 Sir Lancelot Drive 34.6** 21.6 25.5 0:44 1:23 2.7
24459 Linden Street Bridge 32.5* 21.3 25.2 0:44 1:23 7.7
23299 Green Gate Hall 32.0 21.1 23.4 0:52 1:30 2.5
19655 Court Street Bridge 31.4* 20.8 20.8 1:21 1:30 0.6
* High chord (top of road) elevation
**First floor elevation from October 2017 field survey by VHB
Ref: 52151.05
December 30, 2016
Revised December 15, 2017
Page 7
\\vhb\check\Watertown\52151.05\reports\Pickpocket\December 2017
Update\52151.05_PickpocketDam_Updated.docx
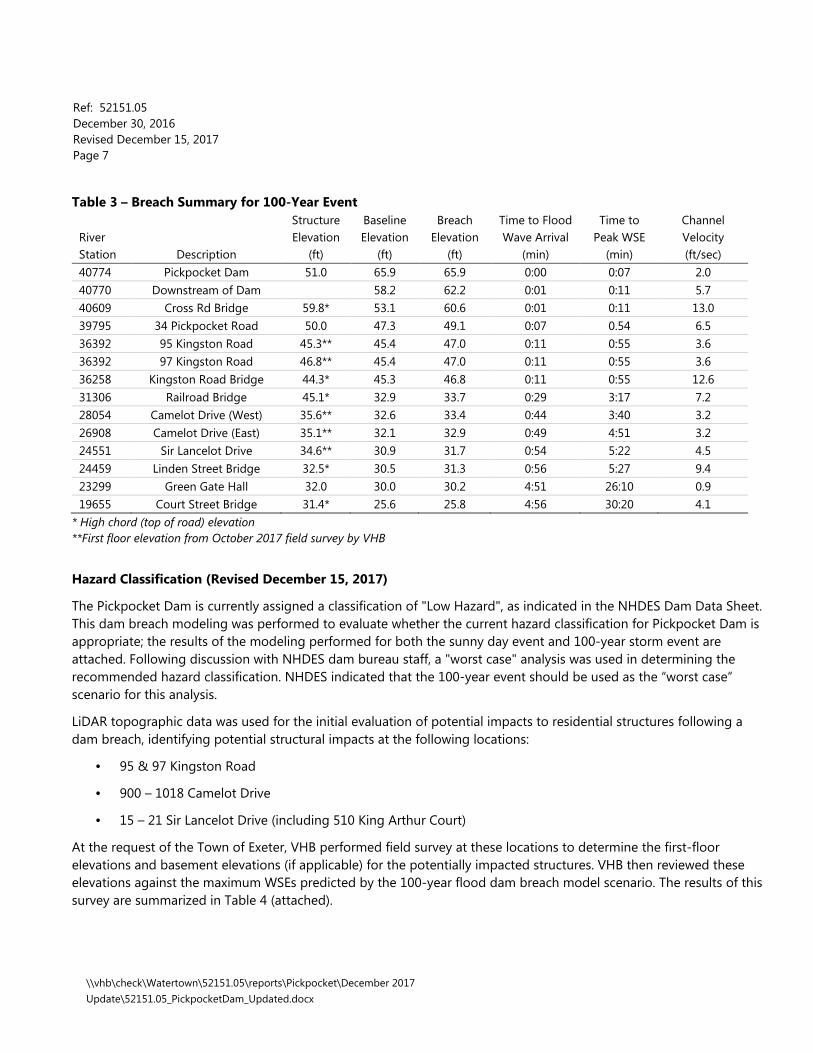
Table 3 – Breach Summary for 100-Year Event
River
Station Description
Structure
Elevation
(ft)
Baseline
Elevation
(ft)
Breach
Elevation
(ft)
Time to Flood
Wave Arrival
(min)
Time to
Peak WSE
(min)
Channel
Velocity
(ft/sec)
40774 Pickpocket Dam 51.0 65.9 65.9 0:00 0:07 2.0
40770 Downstream of Dam 58.2 62.2 0:01 0:11 5.7
40609 Cross Rd Bridge 59.8* 53.1 60.6 0:01 0:11 13.0
39795 34 Pickpocket Road 50.0 47.3 49.1 0:07 0.54 6.5
36392 95 Kingston Road 45.3** 45.4 47.0 0:11 0:55 3.6
36392 97 Kingston Road 46.8** 45.4 47.0 0:11 0:55 3.6
36258 Kingston Road Bridge 44.3* 45.3 46.8 0:11 0:55 12.6
31306 Railroad Bridge 45.1* 32.9 33.7 0:29 3:17 7.2
28054 Camelot Drive (West) 35.6** 32.6 33.4 0:44 3:40 3.2
26908 Camelot Drive (East) 35.1** 32.1 32.9 0:49 4:51 3.2
24551 Sir Lancelot Drive 34.6** 30.9 31.7 0:54 5:22 4.5
24459 Linden Street Bridge 32.5* 30.5 31.3 0:56 5:27 9.4
23299 Green Gate Hall 32.0 30.0 30.2 4:51 26:10 0.9
19655 Court Street Bridge 31.4* 25.6 25.8 4:56 30:20 4.1
* High chord (top of road) elevation
**First floor elevation from October 2017 field survey by VHB
Hazard Classification (Revised December 15, 2017)
The Pickpocket Dam is currently assigned a classification of "Low Hazard", as indicated in the NHDES Dam Data Sheet.
This dam breach modeling was performed to evaluate whether the current hazard classification for Pickpocket Dam is
appropriate; the results of the modeling performed for both the sunny day event and 100-year storm event are
attached. Following discussion with NHDES dam bureau staff, a "worst case" analysis was used in determining the
recommended hazard classification. NHDES indicated that the 100-year event should be used as the “worst case”
scenario for this analysis.
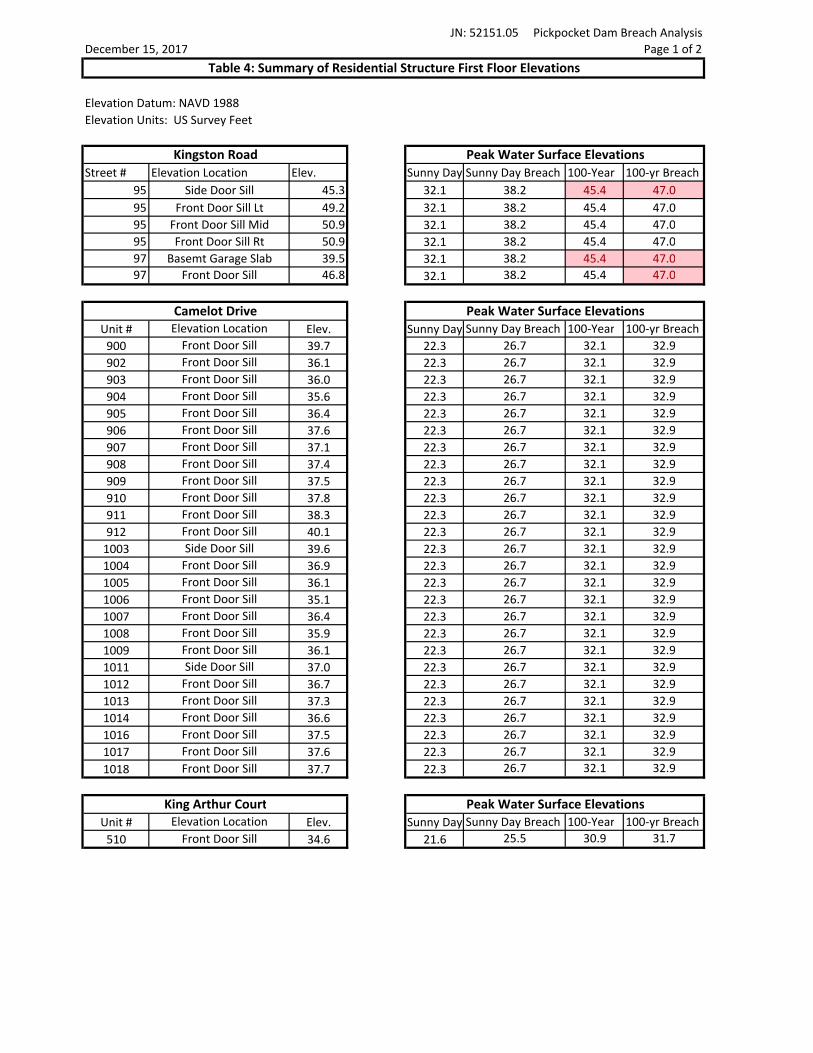
LiDAR topographic data was used for the initial evaluation of potential impacts to residential structures following a
dam breach, identifying potential structural impacts at the following locations:
• 95 & 97 Kingston Road
• 900 – 1018 Camelot Drive
• 15 – 21 Sir Lancelot Drive (including 510 King Arthur Court)
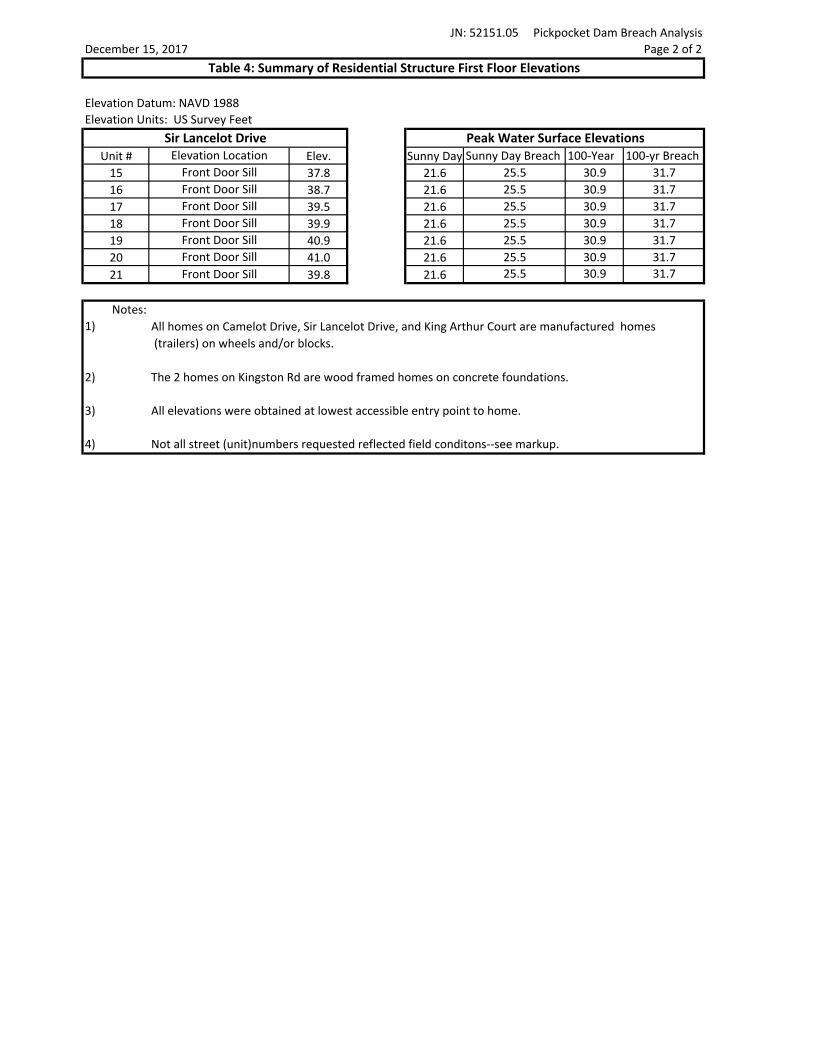
At the request of the Town of Exeter, VHB performed field survey at these locations to determine the first-floor
elevations and basement elevations (if applicable) for the potentially impacted structures. VHB then reviewed these
elevations against the maximum WSEs predicted by the 100-year flood dam breach model scenario. The results of this
survey are summarized in Table 4 (attached).

Ref: 52151.05
December 30, 2016
Revised December 15, 2017
Page 8
\\vhb\check\Watertown\52151.05\reports\Pickpocket\December 2017
Update\52151.05_PickpocketDam_Updated.docx
Model results for the failure of the Pickpocket dam during the 100-year storm event predict greater than one-foot
increase in flood heights that exceed the first-floor elevation of at least one residence with a foundation. Specifically,
the model predicts flood waters to exceed the first floor of 97 Kingston Road by 0.2 feet, and a portion of the first
floor of 95 Kingston Road by 1.7 feet (the structure of 95 Kingston Road is split-level; part of the first floor is below the
flood level and part is above). Although the model indicates potential flooding of ground-mounted residential
structures along Camelot Drive and Sir Lancelot Drive, field survey indicates that the first floor elevations of all
buildings along those roads are at least 2 feet above the flood water surface elevation.
NHDES Env-Wr 101.21 defines dam structures as “High Hazard” in cases where dam failure would result in probable
loss of human life as a result of one or more defined conditions. Based on the 100-year dam breach model results,
Pickpocket dam meets one of these conditions, Env-Wr 101.21 condition (b): water levels rising above the first-floor
elevation of a habitable residential structure. Structural analysis of these structures was not performed as part of this
analysis, but it is possible that Pickpocket dam also meets NHDES Env-Wr 101.21 condition (a): water levels causing
the structural failure of a habitable residential structure.
Additionally, the model results for the failure of the Pickpocket dam during the 100-year storm event predict
overtopping of Cross Road (a Class V roadway) and Route 111 (Kingston Road) (a Class II roadway) that would make
these roads impassable. The predicted overtopping of Route 111, a Class II roadway, indicates Pickpocket dam could
be re-classified as a “Significant Hazard” dam at a minimum, in accordance with NHDES Env-Wr 101.39 condition (c).
Based on model results, Pickpocket dam likely meets the condition of Env-Wr 101.21(a) and possibly Env-Wr
101.21(b), and therefore could be reclassified as a “High Hazard” dam. VHB recommends discussing these results with
the NHDES Dam Bureau to outline the next steps for managing Pickpocket Dam.
In the event that Pickpocket Dam is reclassified as a “High Hazard” structure, NHDES has informed the Town of Exeter
that additional requirements will likely be requested. Potential additional requirements may be imposed by NHDES,
and may include preparation of an Emergency Action Plan (EAP), and a Hydraulic & Hydrologic (H&H) analysis of the
spillway to pass 2.5 times the 100-year storm event.
JN: 52151.05 Pickpocket Dam Breach Analysis
December 15, 2017 Page 1 of 2
Elevation Datum: NAVD 1988
Elevation Units: US Survey Feet
Street # Elevation Location Elev. Sunny Day Sunny Day Breach 100-Year 100-yr Breach
95 45.3 32.1 38.2 45.4 47.0
95 49.2 32.1 38.2 45.4 47.0
95 50.9 32.1 38.2 45.4 47.0
95 50.9 32.1 38.2 45.4 47.0
97 39.5 32.1 38.2 45.4 47.0
97 46.8 32.1 38.2 45.4 47.0
Unit # Elev. Sunny Day Sunny Day Breach 100-Year 100-yr Breach
900 39.7 22.3 26.7 32.1 32.9
902 36.1 22.3 26.7 32.1 32.9
903 36.0 22.3 26.7 32.1 32.9
904 35.6 22.3 26.7 32.1 32.9
905 36.4 22.3 26.7 32.1 32.9
906 37.6 22.3 26.7 32.1 32.9
907 37.1 22.3 26.7 32.1 32.9
908 37.4 22.3 26.7 32.1 32.9
909 37.5 22.3 26.7 32.1 32.9
910 37.8 22.3 26.7 32.1 32.9
911 38.3 22.3 26.7 32.1 32.9
912 40.1 22.3 26.7 32.1 32.9
1003 39.6 22.3 26.7 32.1 32.9
1004 36.9 22.3 26.7 32.1 32.9
1005 36.1 22.3 26.7 32.1 32.9
1006 35.1 22.3 26.7 32.1 32.9
1007 36.4 22.3 26.7 32.1 32.9
1008 35.9 22.3 26.7 32.1 32.9
1009 36.1 22.3 26.7 32.1 32.9
1011 37.0 22.3 26.7 32.1 32.9
1012 36.7 22.3 26.7 32.1 32.9
1013 37.3 22.3 26.7 32.1 32.9
1014 36.6 22.3 26.7 32.1 32.9
1016 37.5 22.3 26.7 32.1 32.9
1017 37.6 22.3 26.7 32.1 32.9
1018 37.7 22.3 26.7 32.1 32.9
Unit # Elev. Sunny Day Sunny Day Breach 100-Year 100-yr Breach
510 34.6 21.6 25.5 30.9 31.7
Front Door Sill
Side Door Sill
Front Door Sill Lt
Front Door Sill Mid
Front Door Sill Rt
Basemt Garage Slab
Peak Water Surface Elevations
Peak Water Surface Elevations
Peak Water Surface Elevations
Front Door Sill
Front Door Sill
Front Door Sill
Front Door Sill
Front Door Sill
Elevation Location
Camelot Drive
Front Door Sill
Front Door Sill
Front Door Sill
Front Door Sill
Front Door Sill
Front Door Sill
Front Door Sill
Side Door Sill
Front Door Sill
Front Door Sill
Front Door Sill
Front Door Sill
Elevation Location
Table 4: Summary of Residential Structure First Floor Elevations
Front Door Sill
Kingston Road
King Arthur Court
Side Door Sill
Front Door Sill
Front Door Sill
Front Door Sill
Front Door Sill
Front Door Sill
Front Door Sill
Front Door Sill
Front Door Sill
JN: 52151.05 Pickpocket Dam Breach Analysis
December 15, 2017 Page 2 of 2
Elevation Datum: NAVD 1988
Elevation Units: US Survey Feet
Unit # Elev. Sunny Day Sunny Day Breach 100-Year 100-yr Breach
15 37.8 21.6 25.5 30.9 31.7
16 38.7 21.6 25.5 30.9 31.7
17 39.5 21.6 25.5 30.9 31.7
18 39.9 21.6 25.5 30.9 31.7
19 40.9 21.6 25.5 30.9 31.7
20 41.0 21.6 25.5 30.9 31.7
21 39.8 21.6 25.5 30.9 31.7
Notes:
1) All homes on Camelot Drive, Sir Lancelot Drive, and King Arthur Court are manufactured homes
(trailers) on wheels and/or blocks.
2) The 2 homes on Kingston Rd are wood framed homes on concrete foundations.
3) All elevations were obtained at lowest accessible entry point to home.
4) Not all street (unit)numbers requested reflected field conditons--see markup.
Peak Water Surface Elevations
Front Door Sill
Sir Lancelot Drive
Front Door Sill
Front Door Sill
Front Door Sill
Front Door Sill
Front Door Sill
Table 4: Summary of Residential Structure First Floor Elevations
Elevation Location
Front Door Sill
Cross Road
Railro
ad
Court
St
Exete
r Rd
Kingst
on Rd
North
Haver
hill Rd
Ames
bury
Rd
2-12-2
2-3
2-4
2-5
2-6
2-7
2-8
2-9
2-10
2-11
Exeter
Brentwood
KensingtonKingston
EastKingston
Pickpocket Dam Exeter, NHi 0 1000 2000500 Feet
December 30, 2016\\m
awald
\CHE
CKIN
\5215
1.05\G
IS\Pro
ject\F
igures
\5215
1.05_P
ick_Lo
cus.m
xd
Source Info: USGS, Google, VHBLegend
Inundation FiguresBreach Inundation Boundary (100-Year)Exeter River
FIGURE 1
FIGURE 1 - Locus
Pickpocket Dam
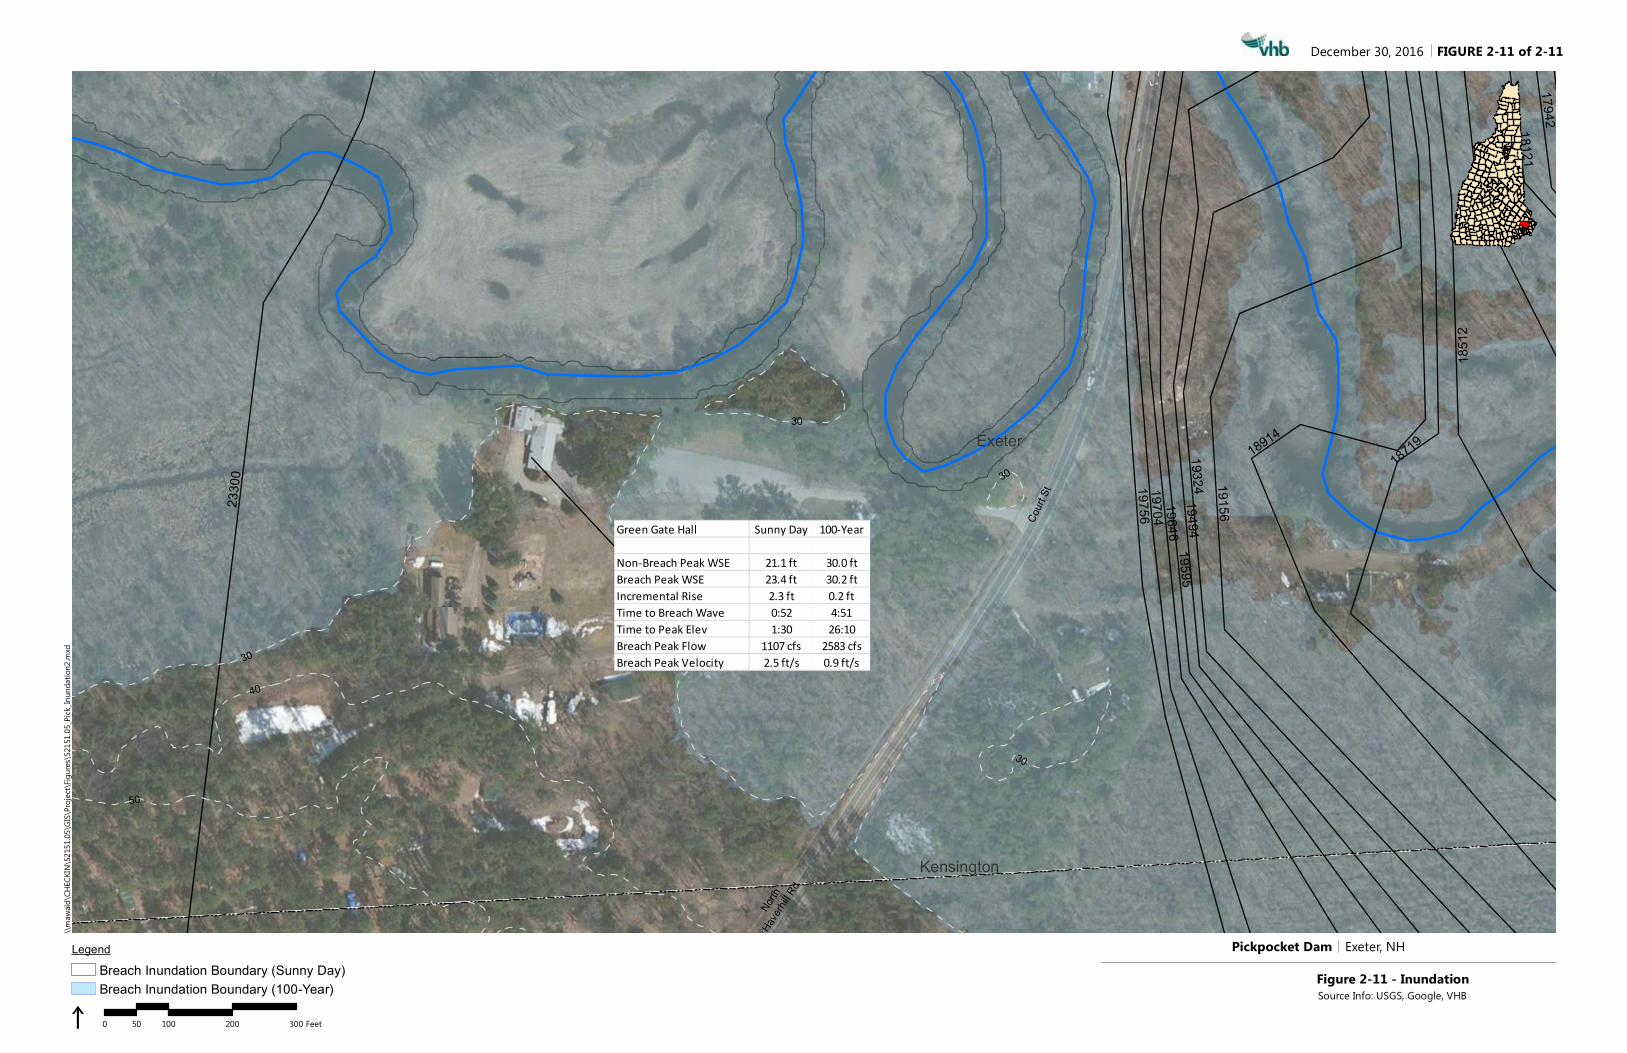
Green Gate Hall Sunny Day 100-Year
Non-Breach Peak WSE 21.1 ft 30.0 ftBreach Peak WSE 23.4 ft 30.2 ftIncremental Rise 2.3 ft 0.2 ftTime to Breach Wave 0:52 4:51Time to Peak Elev 1:30 26:10Breach Peak Flow 1107 cfs 2583 cfsBreach Peak Velocity 2.5 ft/s 0.9 ft/s
1794218121
18313
1851
2
18719
197561970423
300
1964619595
1949419324
1891419156
North
Haver
hill Rd
Court
St
Exeter
Kensington
40
30
50
30
30
30
Pickpocket Dam Exeter, NH
i 0 100 200 30050 Feet
December 30, 2016\\m
awald
\CHE
CKIN
\5215
1.05\G
IS\Pro
ject\F
igures
\5215
1.05_P
ick_In
unda
tion2
.mxd
Source Info: USGS, Google, VHB
LegendBreach Inundation Boundary (Sunny Day)Breach Inundation Boundary (100-Year)
FIGURE 2-11 of 2-11
Figure 2-11 - Inundation
Pickpocket Dam
Cross Road Bridge Sunny Day 100-Year
Non-Breach Peak WSE 46.7 ft 53.1 ftBreach Peak WSE 51.8 ft 60.6 ftIncremental Rise 5.1 ft 7.5 ftTime to Breach Wave 0:04 0:01Time to Peak Elev 0:12 0:11Breach Peak Flow 2834 cfs 7573 cfsBreach Peak Velocity 11.5 ft/s 13.0 ft/s
4056
940
537
4060
340
628
4077
140
787
4065
140
669
Cross Rd
Runa
witRd
Pickp
ocke
t Rd Pickpocket Rd
Stoney Water Rd
Connie Rd
Exeter
Brentwood
100
90
8070
140
130
60
50
110
100
90
80
120
70
70
60
80
70
120
110
90
80
70
60
70
60
4301940811
41070
42666
42207
41520
Pickpocket Dam Exeter, NH
i 0 100 200 30050 Feet
December 30, 2016\\v
hb\ch
eck\W
aterto
wn\52
151.0
5\GIS\
Projec
t\Figu
res\52
151.0
5_Pic
k_Inu
ndati
on3.m
xd
Source Info: USGS, Google, VHB
LegendBreach Inundation Boundary (Sunny Day)Breach Inundation Boundary (100-Year)
FIGURE 2-1 of 2-11
Figure 2-1 - Inundation
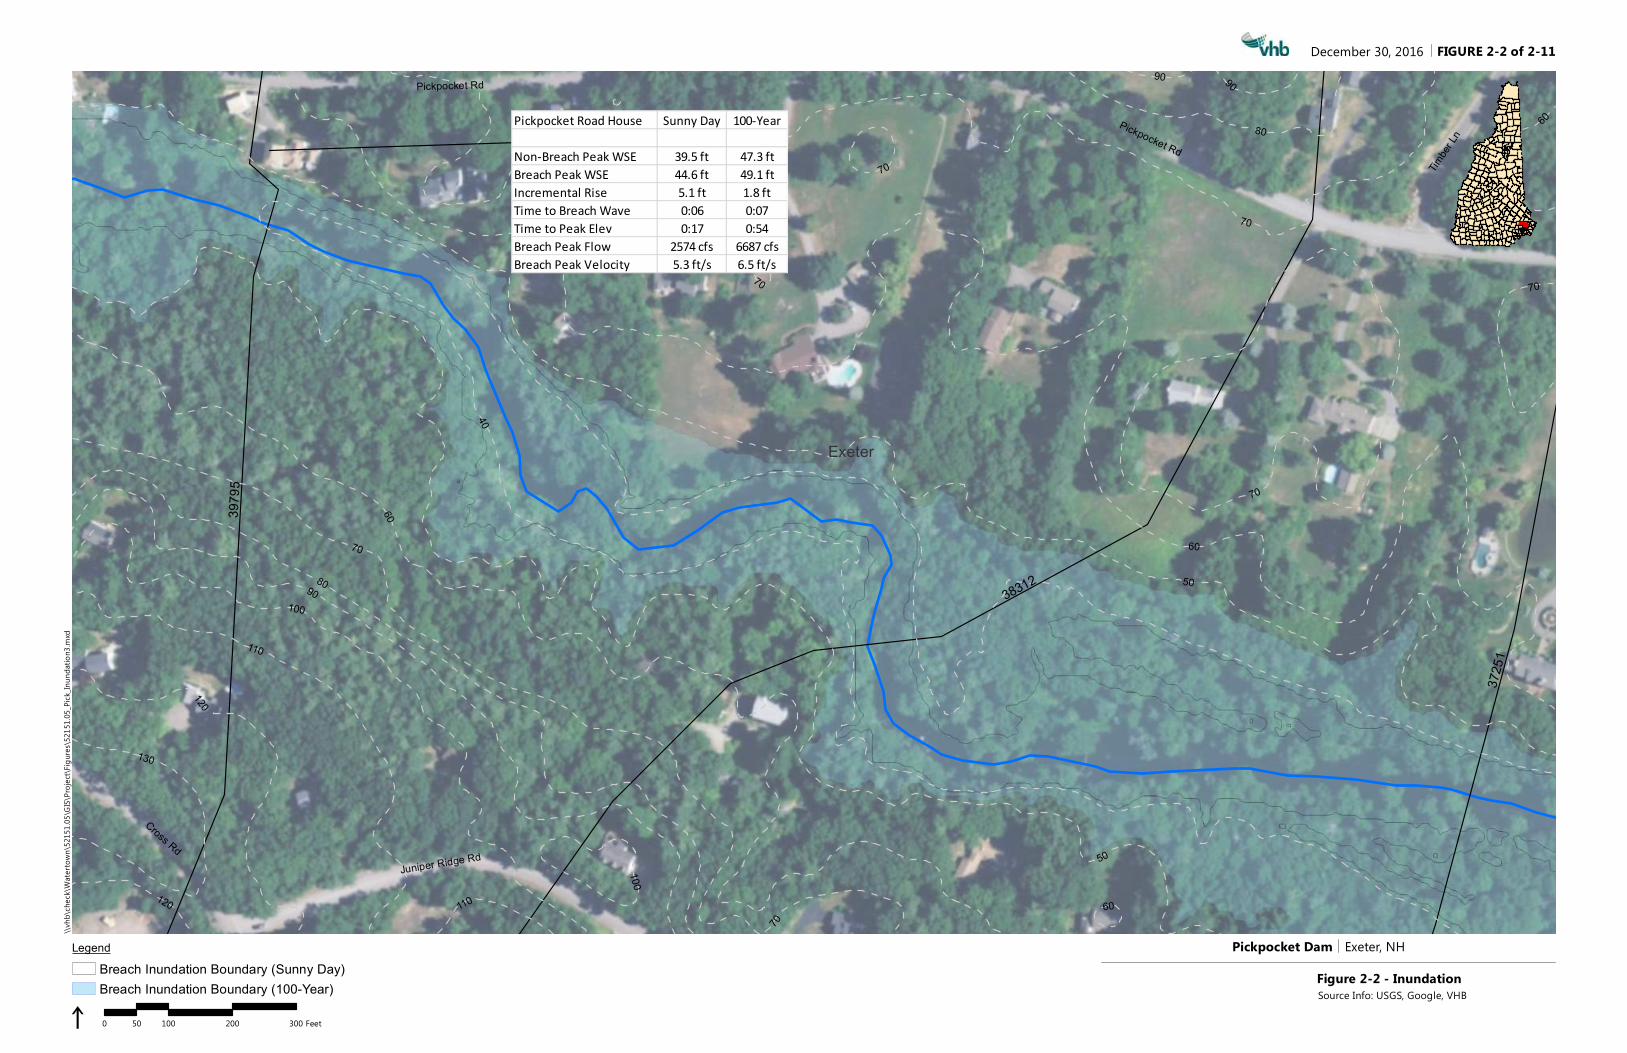
Pickpocket Road House Sunny Day 100-Year
Non-Breach Peak WSE 39.5 ft 47.3 ftBreach Peak WSE 44.6 ft 49.1 ftIncremental Rise 5.1 ft 1.8 ftTime to Breach Wave 0:06 0:07Time to Peak Elev 0:17 0:54Breach Peak Flow 2574 cfs 6687 cfsBreach Peak Velocity 5.3 ft/s 6.5 ft/s
3725
1
3979
5
38312
Pickpocket Rd
Timber
Ln
Cross RdJuniper Ridge Rd
Pickpocket Rd
Exeter
130
120
110
10090
80
70
60
40
80
70
60
50
60
50
90
120
100
90
70
70
70
70
110
70
60
Pickpocket Dam Exeter, NH
i 0 100 200 30050 Feet
December 30, 2016\\v
hb\ch
eck\W
aterto
wn\52
151.0
5\GIS\
Projec
t\Figu
res\52
151.0
5_Pic
k_Inu
ndati
on3.m
xd
Source Info: USGS, Google, VHB
LegendBreach Inundation Boundary (Sunny Day)Breach Inundation Boundary (100-Year)
FIGURE 2-2 of 2-11
Figure 2-2 - Inundation
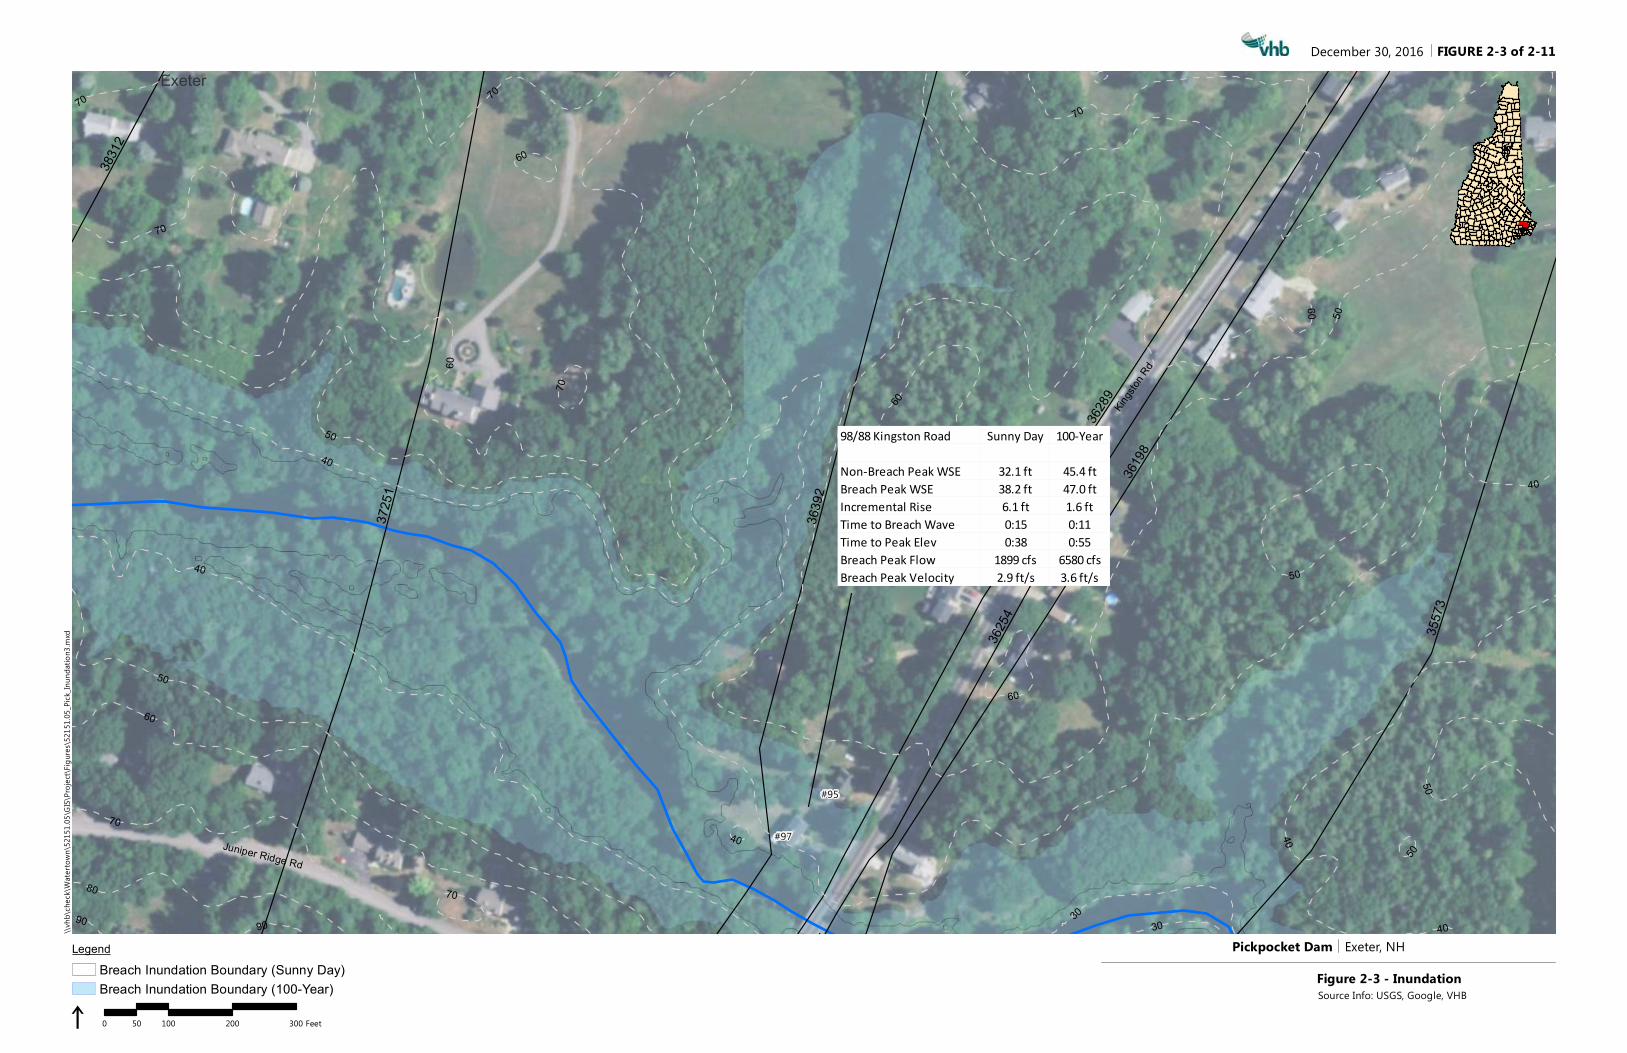
98/88 Kingston Road Sunny Day 100-Year
Non-Breach Peak WSE 32.1 ft 45.4 ftBreach Peak WSE 38.2 ft 47.0 ftIncremental Rise 6.1 ft 1.6 ftTime to Breach Wave 0:15 0:11Time to Peak Elev 0:38 0:55Breach Peak Flow 1899 cfs 6580 cfsBreach Peak Velocity 2.9 ft/s 3.6 ft/s
#97
#95
3831
2
3557
3
3725
1
3639
2
36198
36289
3625
4
Juniper Ridge Rd
Kingst
on Rd
Exeter
90
80
70
60
50
4070
6050
40
60 50
70
60
50
40
50
40
70
90
70
70
60
60
50
30
70
40
40
30Pickpocket Dam Exeter, NH
i 0 100 200 30050 Feet
December 30, 2016\\v
hb\ch
eck\W
aterto
wn\52
151.0
5\GIS\
Projec
t\Figu
res\52
151.0
5_Pic
k_Inu
ndati
on3.m
xd
Source Info: USGS, Google, VHB
LegendBreach Inundation Boundary (Sunny Day)Breach Inundation Boundary (100-Year)
FIGURE 2-3 of 2-11
Figure 2-3 - Inundation
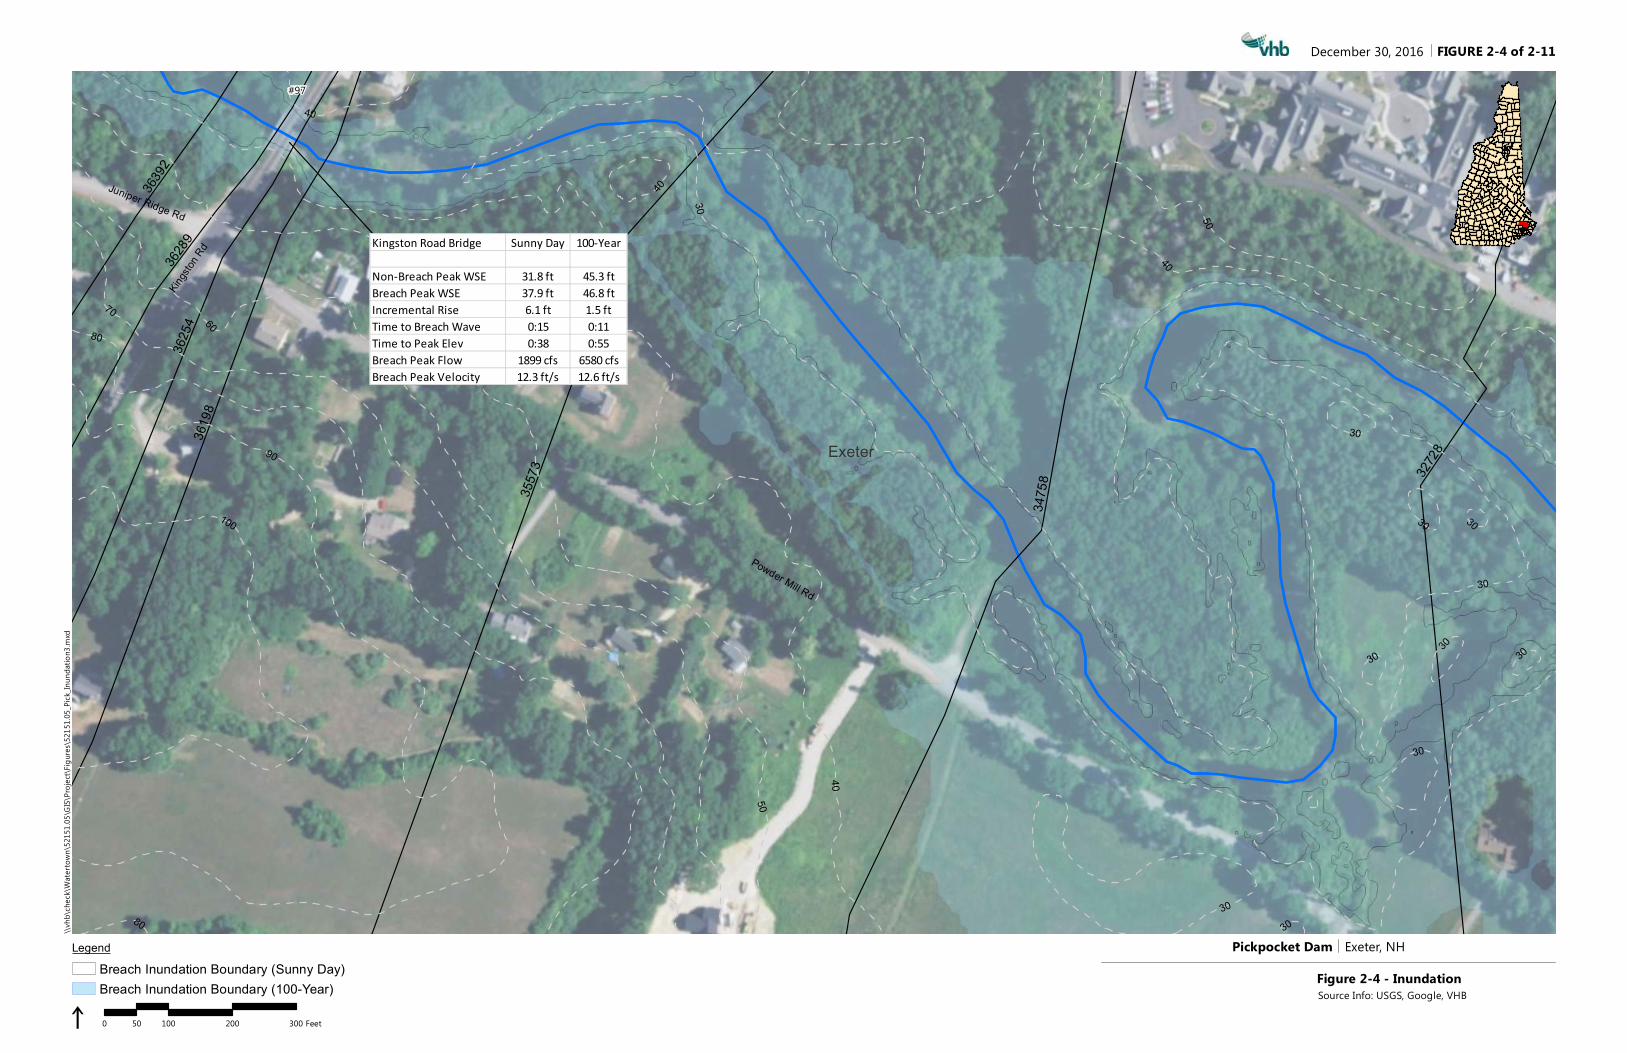
Kingston Road Bridge Sunny Day 100-Year
Non-Breach Peak WSE 31.8 ft 45.3 ftBreach Peak WSE 37.9 ft 46.8 ftIncremental Rise 6.1 ft 1.5 ftTime to Breach Wave 0:15 0:11Time to Peak Elev 0:38 0:55Breach Peak Flow 1899 cfs 6580 cfsBreach Peak Velocity 12.3 ft/s 12.6 ft/s
#97
36392
36289
3625
436
198
32728
3475
8
3557
3
Juniper Ridge Rd
Kingst
on Rd
Powder Mill Rd
Exeter
80
70
100
90
50
40
50
40
40
30
60
80
40
3030
30
30 30
30
30
30
30
30
Pickpocket Dam Exeter, NH
i 0 100 200 30050 Feet
December 30, 2016\\v
hb\ch
eck\W
aterto
wn\52
151.0
5\GIS\
Projec
t\Figu
res\52
151.0
5_Pic
k_Inu
ndati
on3.m
xd
Source Info: USGS, Google, VHB
LegendBreach Inundation Boundary (Sunny Day)Breach Inundation Boundary (100-Year)
FIGURE 2-4 of 2-11
Figure 2-4 - Inundation
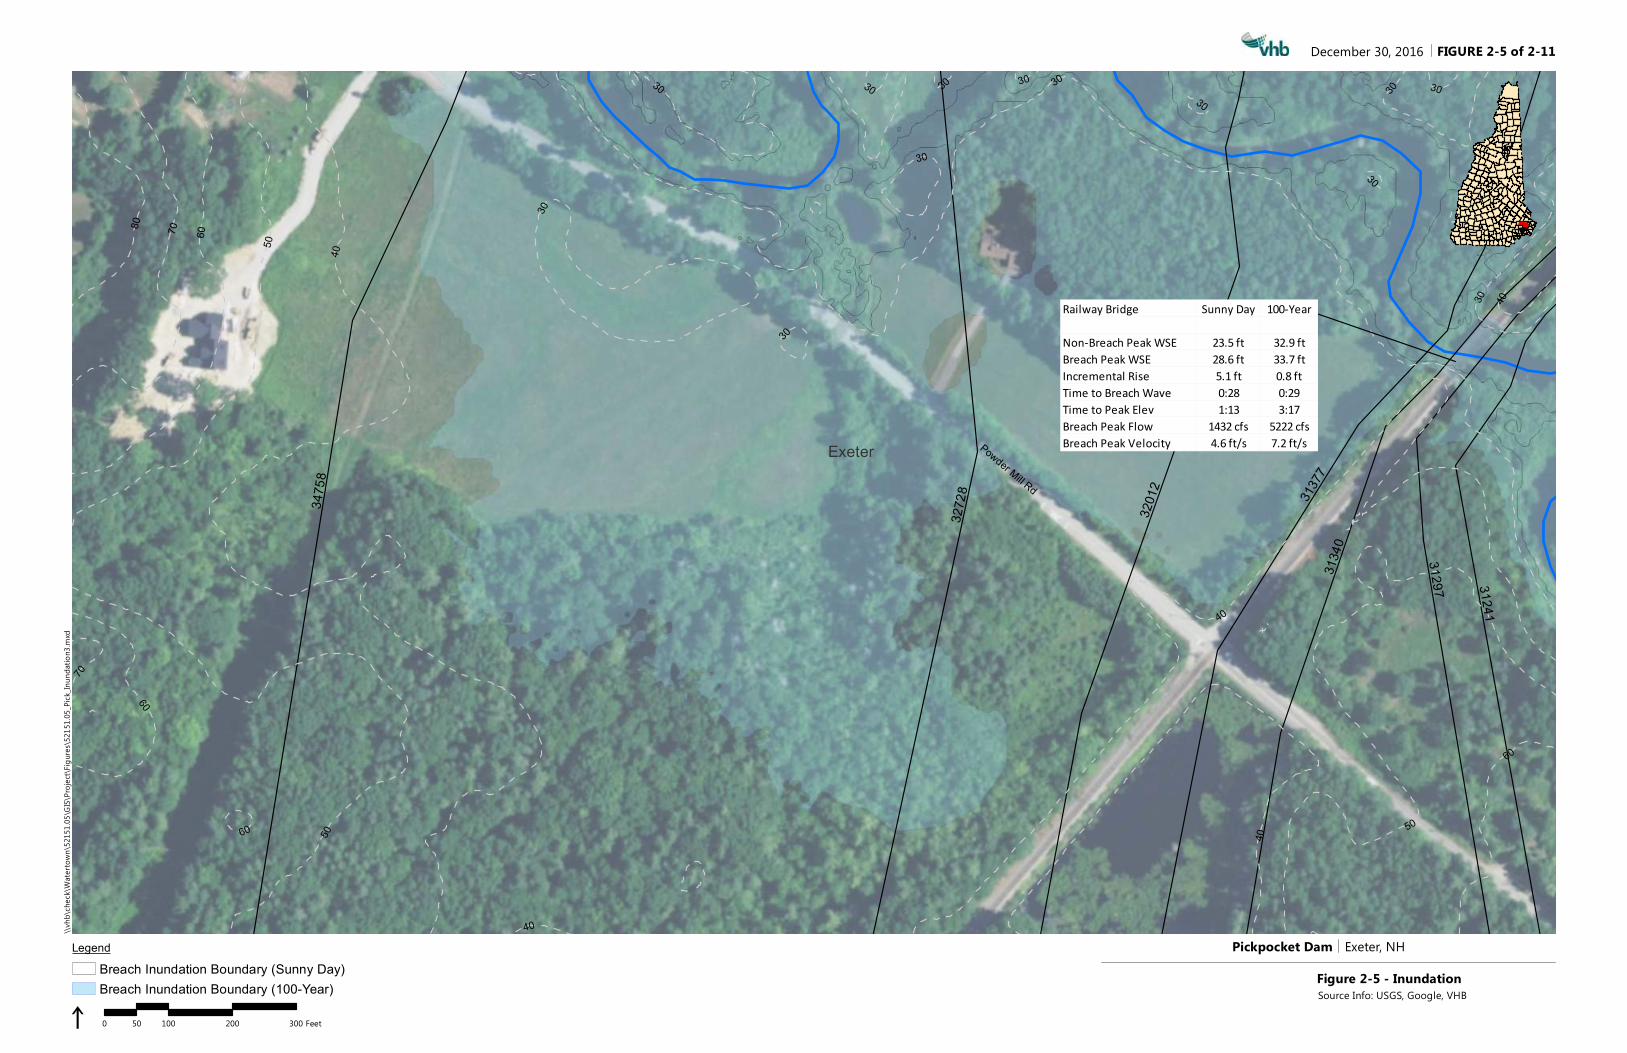
Railway Bridge Sunny Day 100-Year
Non-Breach Peak WSE 23.5 ft 32.9 ftBreach Peak WSE 28.6 ft 33.7 ftIncremental Rise 5.1 ft 0.8 ftTime to Breach Wave 0:28 0:29Time to Peak Elev 1:13 3:17Breach Peak Flow 1432 cfs 5222 cfsBreach Peak Velocity 4.6 ft/s 7.2 ft/s
31241
31297
3134
0
3272
8
3475
8
3201
2 31377
Powder Mill Rd
Exeter
80 70 60 50 40
60
30
50
40
70
50
4030
30
60
4060
30
40
303030
30
3030
30
30
30
Pickpocket Dam Exeter, NH
i 0 100 200 30050 Feet
December 30, 2016\\v
hb\ch
eck\W
aterto
wn\52
151.0
5\GIS\
Projec
t\Figu
res\52
151.0
5_Pic
k_Inu
ndati
on3.m
xd
Source Info: USGS, Google, VHB
LegendBreach Inundation Boundary (Sunny Day)Breach Inundation Boundary (100-Year)
FIGURE 2-5 of 2-11
Figure 2-5 - Inundation
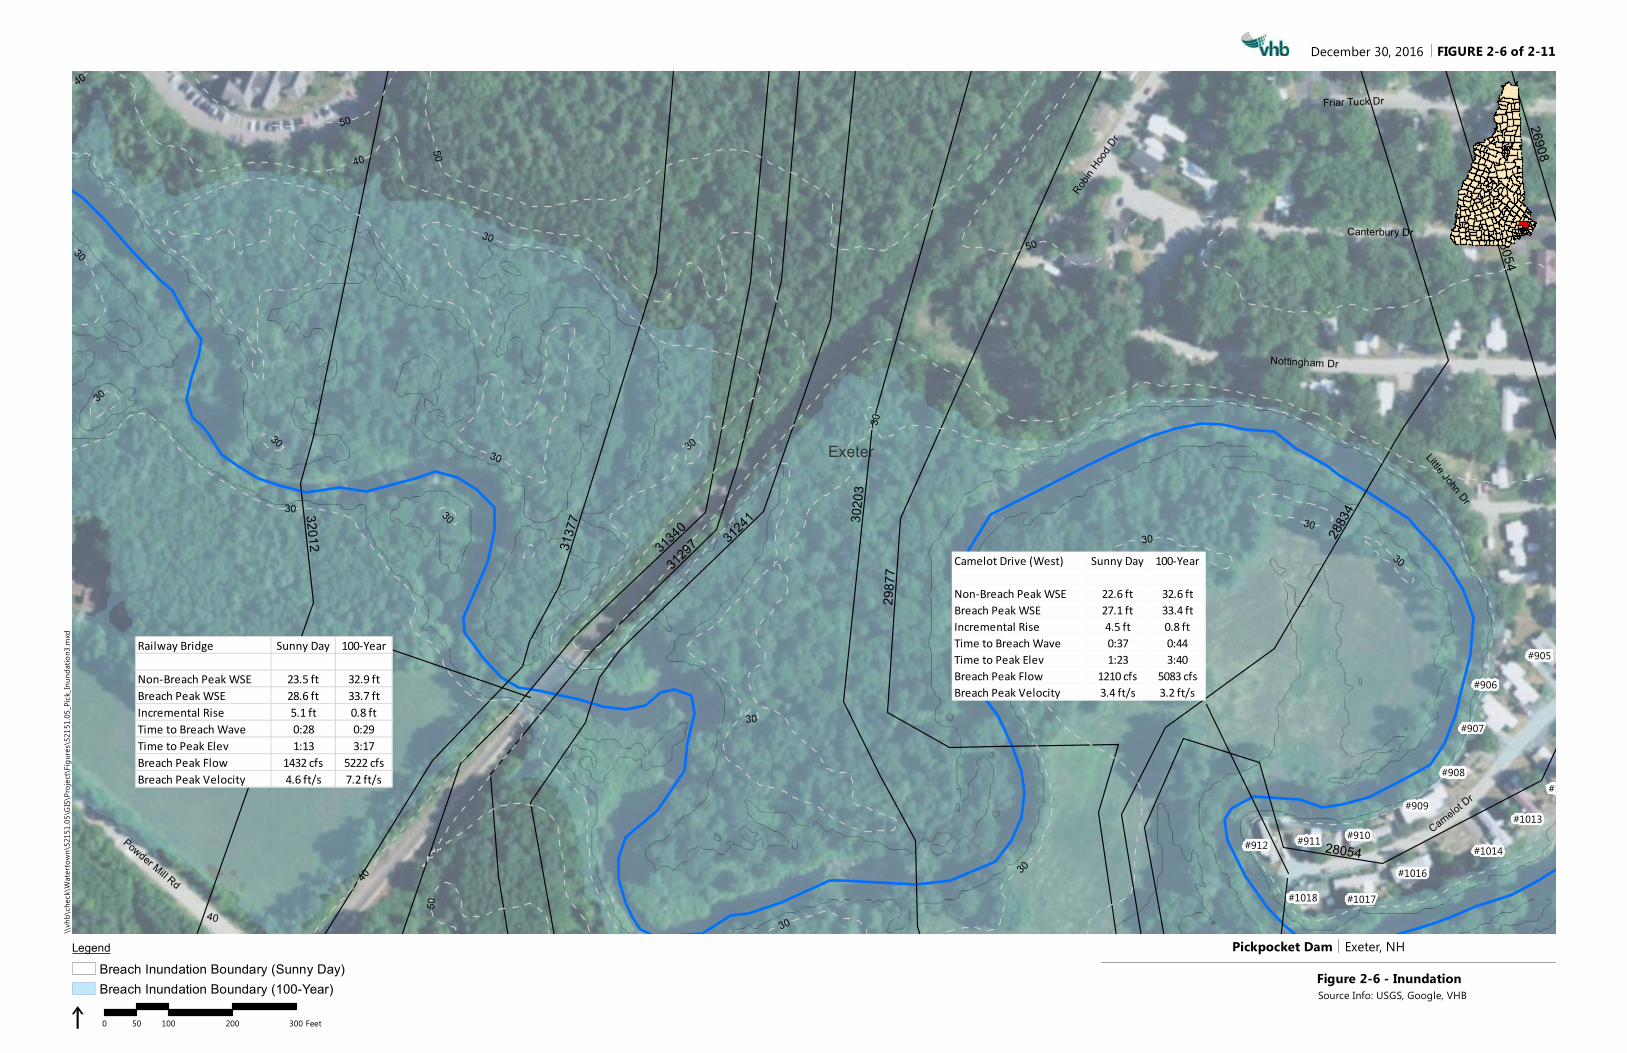
Railway Bridge Sunny Day 100-Year
Non-Breach Peak WSE 23.5 ft 32.9 ftBreach Peak WSE 28.6 ft 33.7 ftIncremental Rise 5.1 ft 0.8 ftTime to Breach Wave 0:28 0:29Time to Peak Elev 1:13 3:17Breach Peak Flow 1432 cfs 5222 cfsBreach Peak Velocity 4.6 ft/s 7.2 ft/s
Camelot Drive (West) Sunny Day 100-Year
Non-Breach Peak WSE 22.6 ft 32.6 ftBreach Peak WSE 27.1 ft 33.4 ftIncremental Rise 4.5 ft 0.8 ftTime to Breach Wave 0:37 0:44Time to Peak Elev 1:23 3:40Breach Peak Flow 1210 cfs 5083 cfsBreach Peak Velocity 3.4 ft/s 3.2 ft/s
#1018 #1017
#1016#1014
#1013#911 #910
#909
#908
#907
#906
#912
#1012
#905
26908
28054
28054
32012
3020
3
3137
7312
97 31241
31340 28
834
2987
7
Little John Dr
Nottingham Dr
Powder Mill Rd
Robin H
ood Dr
Camelot Dr
Canterbury Dr
Friar Tuck Dr
Exeter
50
40
50
40
40
30
30 50
50
40
30
30
30
30
30
30
30
30
30
30
30
30
30
Pickpocket Dam Exeter, NH
i 0 100 200 30050 Feet
December 30, 2016\\v
hb\ch
eck\W
aterto
wn\52
151.0
5\GIS\
Projec
t\Figu
res\52
151.0
5_Pic
k_Inu
ndati
on3.m
xd
Source Info: USGS, Google, VHB
LegendBreach Inundation Boundary (Sunny Day)Breach Inundation Boundary (100-Year)
FIGURE 2-6 of 2-11
Figure 2-6 - Inundation
#1018 #1017
#1016#1014
#1013#911 #910
#909
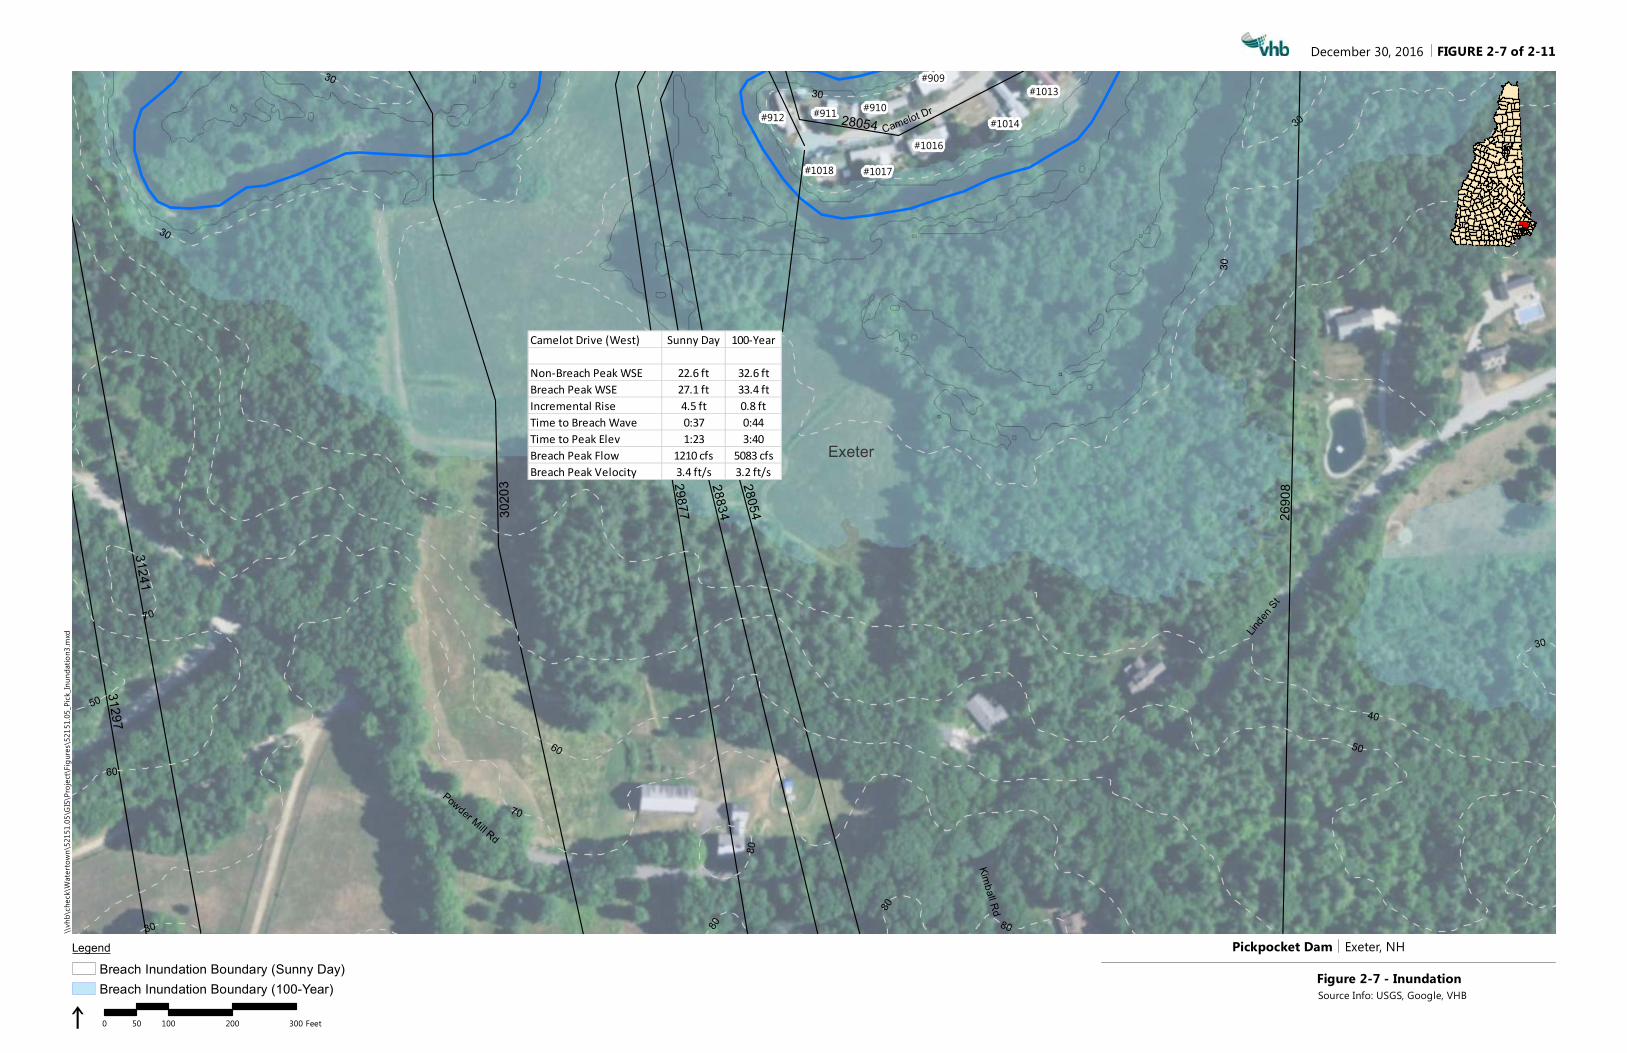
Camelot Drive (West) Sunny Day 100-Year
Non-Breach Peak WSE 22.6 ft 32.6 ftBreach Peak WSE 27.1 ft 33.4 ftIncremental Rise 4.5 ft 0.8 ftTime to Breach Wave 0:37 0:44Time to Peak Elev 1:23 3:40Breach Peak Flow 1210 cfs 5083 cfsBreach Peak Velocity 3.4 ft/s 3.2 ft/s
#912 28054
3129731241
2690
829877
288343020
3 28054
Kimball Rd
Camelot Dr
Linden
St
Powder Mill Rd
Exeter
70
60 50
40
80
60
50
50
40
30
80
80
80
80
70
30
30
30
3030
Pickpocket Dam Exeter, NH
i 0 100 200 30050 Feet
December 30, 2016\\v
hb\ch
eck\W
aterto
wn\52
151.0
5\GIS\
Projec
t\Figu
res\52
151.0
5_Pic
k_Inu
ndati
on3.m
xd
Source Info: USGS, Google, VHB
LegendBreach Inundation Boundary (Sunny Day)Breach Inundation Boundary (100-Year)
FIGURE 2-7 of 2-11
Figure 2-7 - Inundation
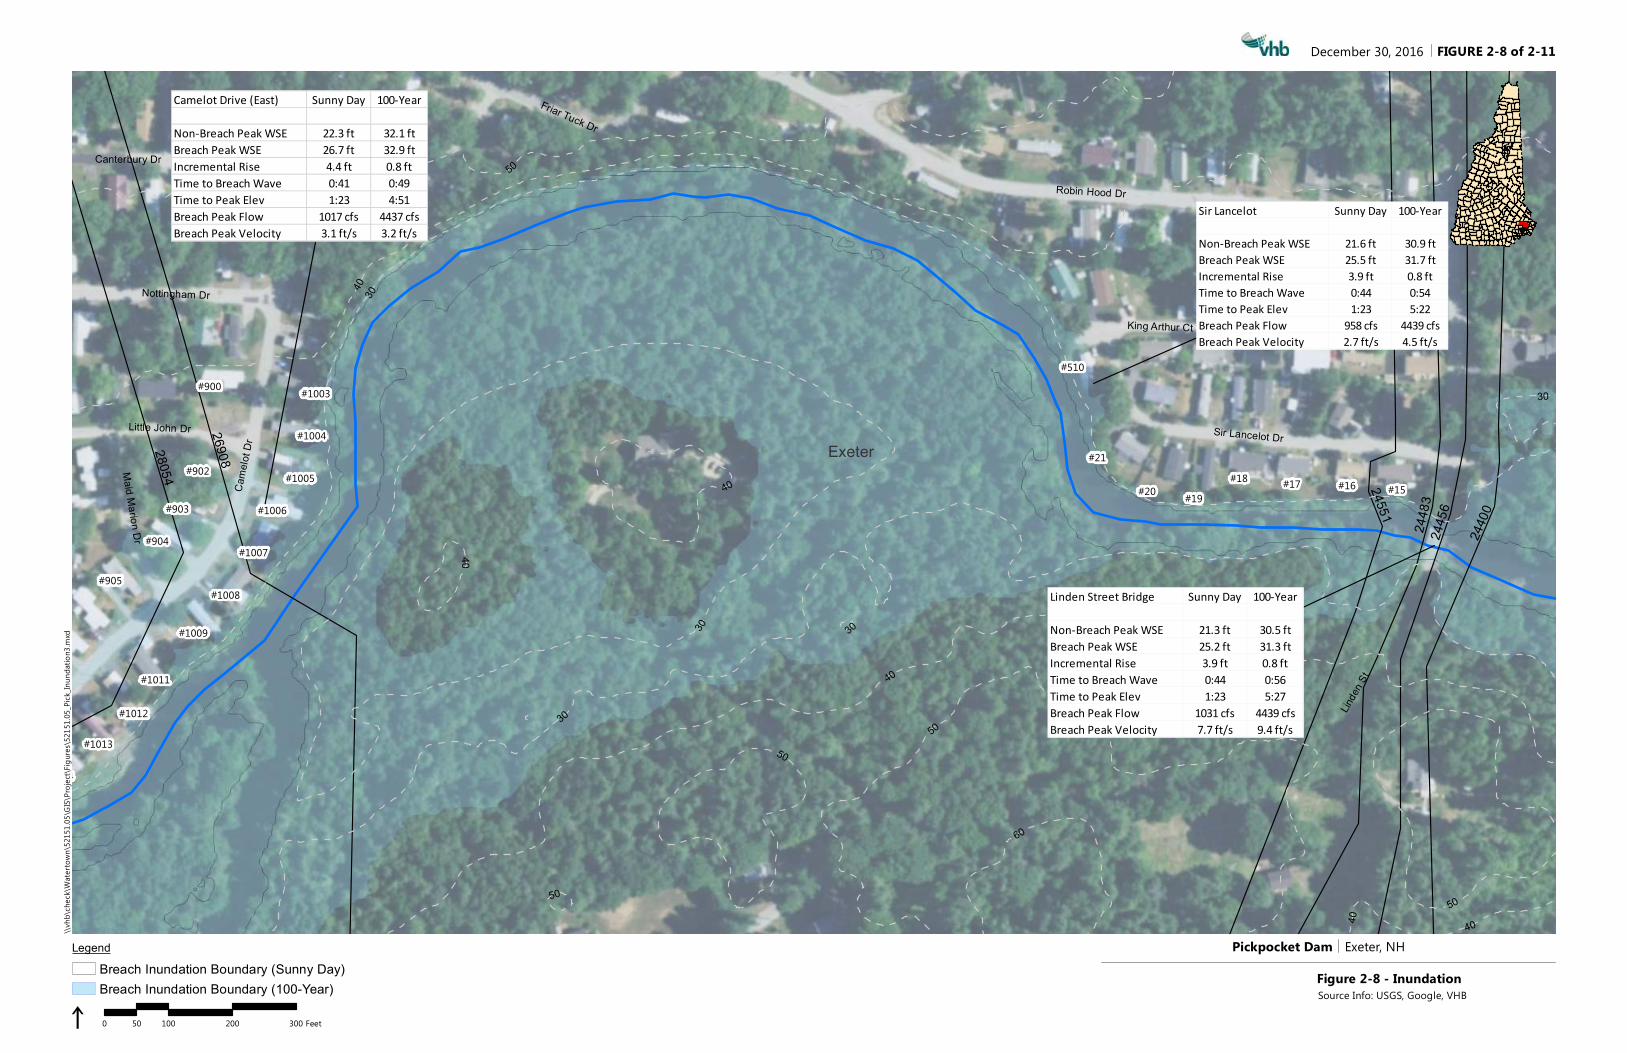
Camelot Drive (East) Sunny Day 100-Year
Non-Breach Peak WSE 22.3 ft 32.1 ftBreach Peak WSE 26.7 ft 32.9 ftIncremental Rise 4.4 ft 0.8 ftTime to Breach Wave 0:41 0:49Time to Peak Elev 1:23 4:51Breach Peak Flow 1017 cfs 4437 cfsBreach Peak Velocity 3.1 ft/s 3.2 ft/s
Sir Lancelot Sunny Day 100-Year
Non-Breach Peak WSE 21.6 ft 30.9 ftBreach Peak WSE 25.5 ft 31.7 ftIncremental Rise 3.9 ft 0.8 ftTime to Breach Wave 0:44 0:54Time to Peak Elev 1:23 5:22Breach Peak Flow 958 cfs 4439 cfsBreach Peak Velocity 2.7 ft/s 4.5 ft/s
Linden Street Bridge Sunny Day 100-Year
Non-Breach Peak WSE 21.3 ft 30.5 ftBreach Peak WSE 25.2 ft 31.3 ftIncremental Rise 3.9 ft 0.8 ftTime to Breach Wave 0:44 0:56Time to Peak Elev 1:23 5:27Breach Peak Flow 1031 cfs 4439 cfsBreach Peak Velocity 7.7 ft/s 9.4 ft/s
#1014
#1013
#1012
#1011
#1009
#1008
#1007
#1006
#1005
#1004
#1003
#905
#904
#903
#902
#900#510
#21
#20 #19#18 #17 #16 #15
2805424
456
2440
0
2448
3
24551
26908
Friar Tuck Dr
Little John Dr
Canterbury Dr
Linde
n St
Came
lot D
r
Maid Marion Dr
Nottingham Dr
King Arthur Ct
Sir Lancelot Dr
Robin Hood Dr
Exeter
60
50
40
40 30
50
40
40
30 30
50
50
40
50
40
30
30
Pickpocket Dam Exeter, NH
i 0 100 200 30050 Feet
December 30, 2016\\v
hb\ch
eck\W
aterto
wn\52
151.0
5\GIS\
Projec
t\Figu
res\52
151.0
5_Pic
k_Inu
ndati
on3.m
xd
Source Info: USGS, Google, VHB
LegendBreach Inundation Boundary (Sunny Day)Breach Inundation Boundary (100-Year)
FIGURE 2-8 of 2-11
Figure 2-8 - Inundation
2330
0
2440
0
2445
6
2455
1
2448
3
Linden St
Exeter
Kensington
50
40
50
40
40
30
50
40
60
50
50
50
50
Pickpocket Dam Exeter, NH
i 0 100 200 30050 Feet
December 30, 2016\\v
hb\ch
eck\W
aterto
wn\52
151.0
5\GIS\
Projec
t\Figu
res\52
151.0
5_Pic
k_Inu
ndati
on3.m
xd
Source Info: USGS, Google, VHB
LegendBreach Inundation Boundary (Sunny Day)Breach Inundation Boundary (100-Year)
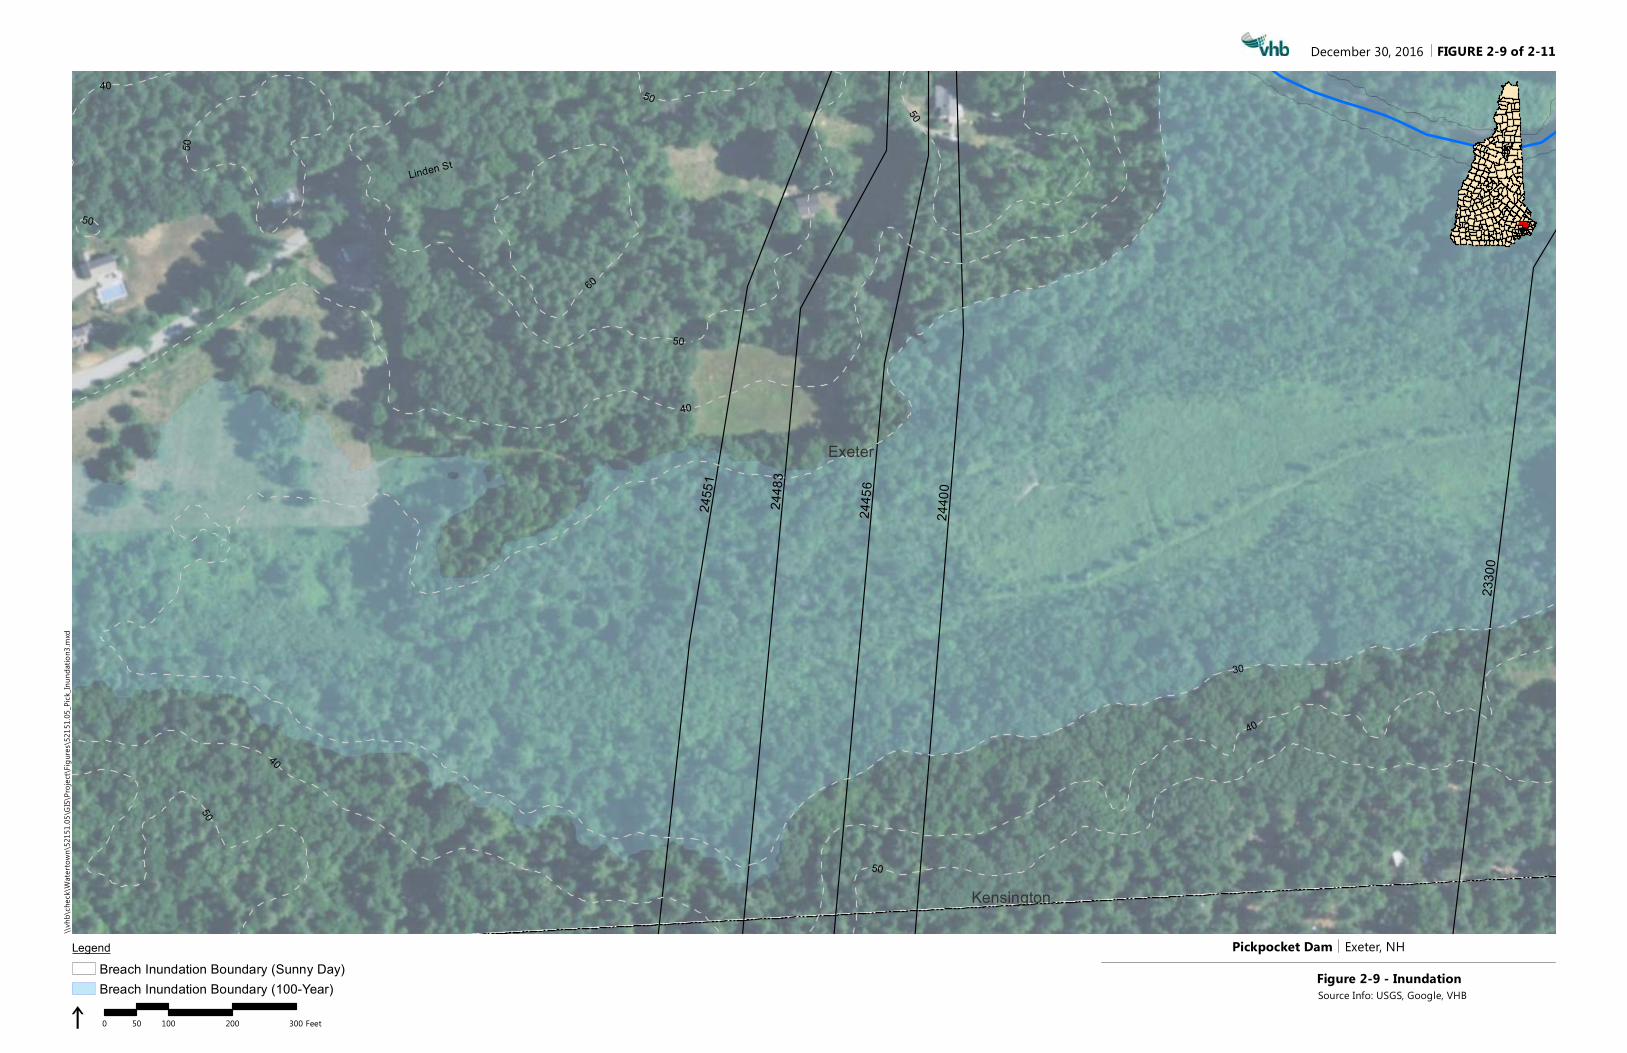
FIGURE 2-9 of 2-11
Figure 2-9 - Inundation
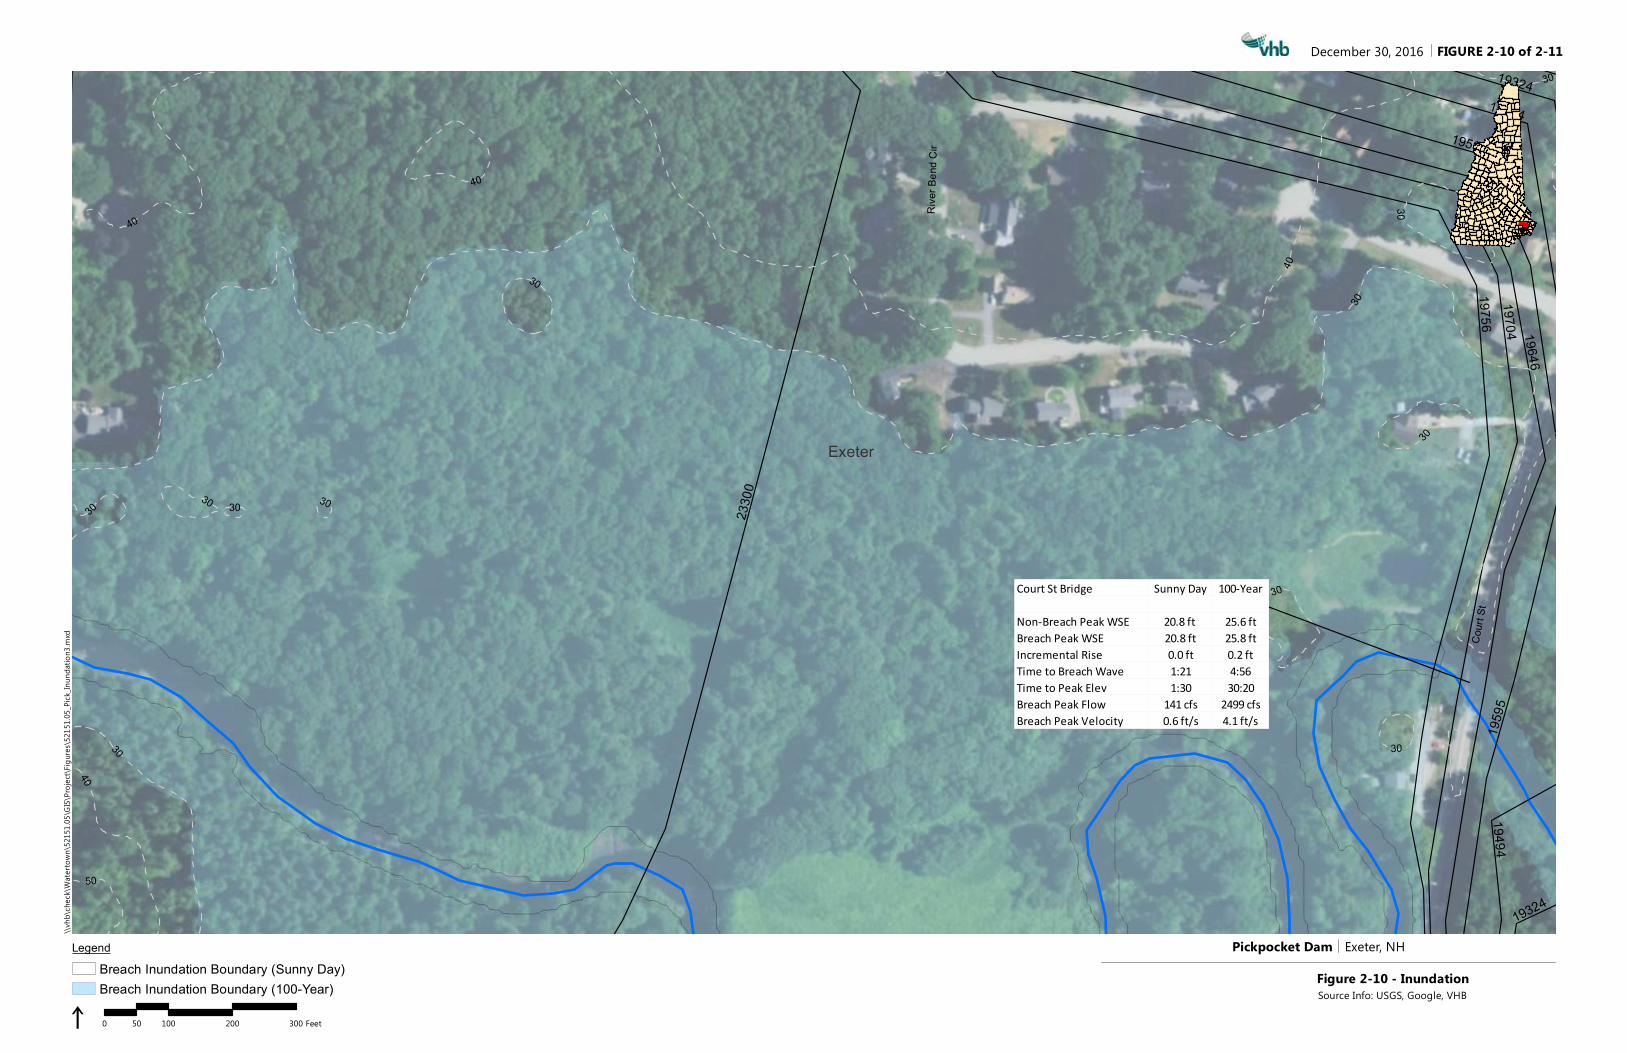
Court St Bridge Sunny Day 100-Year
Non-Breach Peak WSE 20.8 ft 25.6 ftBreach Peak WSE 20.8 ft 25.8 ftIncremental Rise 0.0 ft 0.2 ftTime to Breach Wave 1:21 4:56Time to Peak Elev 1:30 30:20Breach Peak Flow 141 cfs 2499 cfsBreach Peak Velocity 0.6 ft/s 4.1 ft/s
19324
19324
1949419494
1959
5
19595
2330
0
1964619704
19756
Court
St
Rive
r Ben
d Cir
Exeter
40
30
40
30
40
4030
50
30
3030
30
3030
30
30
30
Pickpocket Dam Exeter, NH
i 0 100 200 30050 Feet
December 30, 2016\\v
hb\ch
eck\W
aterto
wn\52
151.0
5\GIS\
Projec
t\Figu
res\52
151.0
5_Pic
k_Inu
ndati
on3.m
xd
Source Info: USGS, Google, VHB
LegendBreach Inundation Boundary (Sunny Day)Breach Inundation Boundary (100-Year)
FIGURE 2-10 of 2-11
Figure 2-10 - Inundation
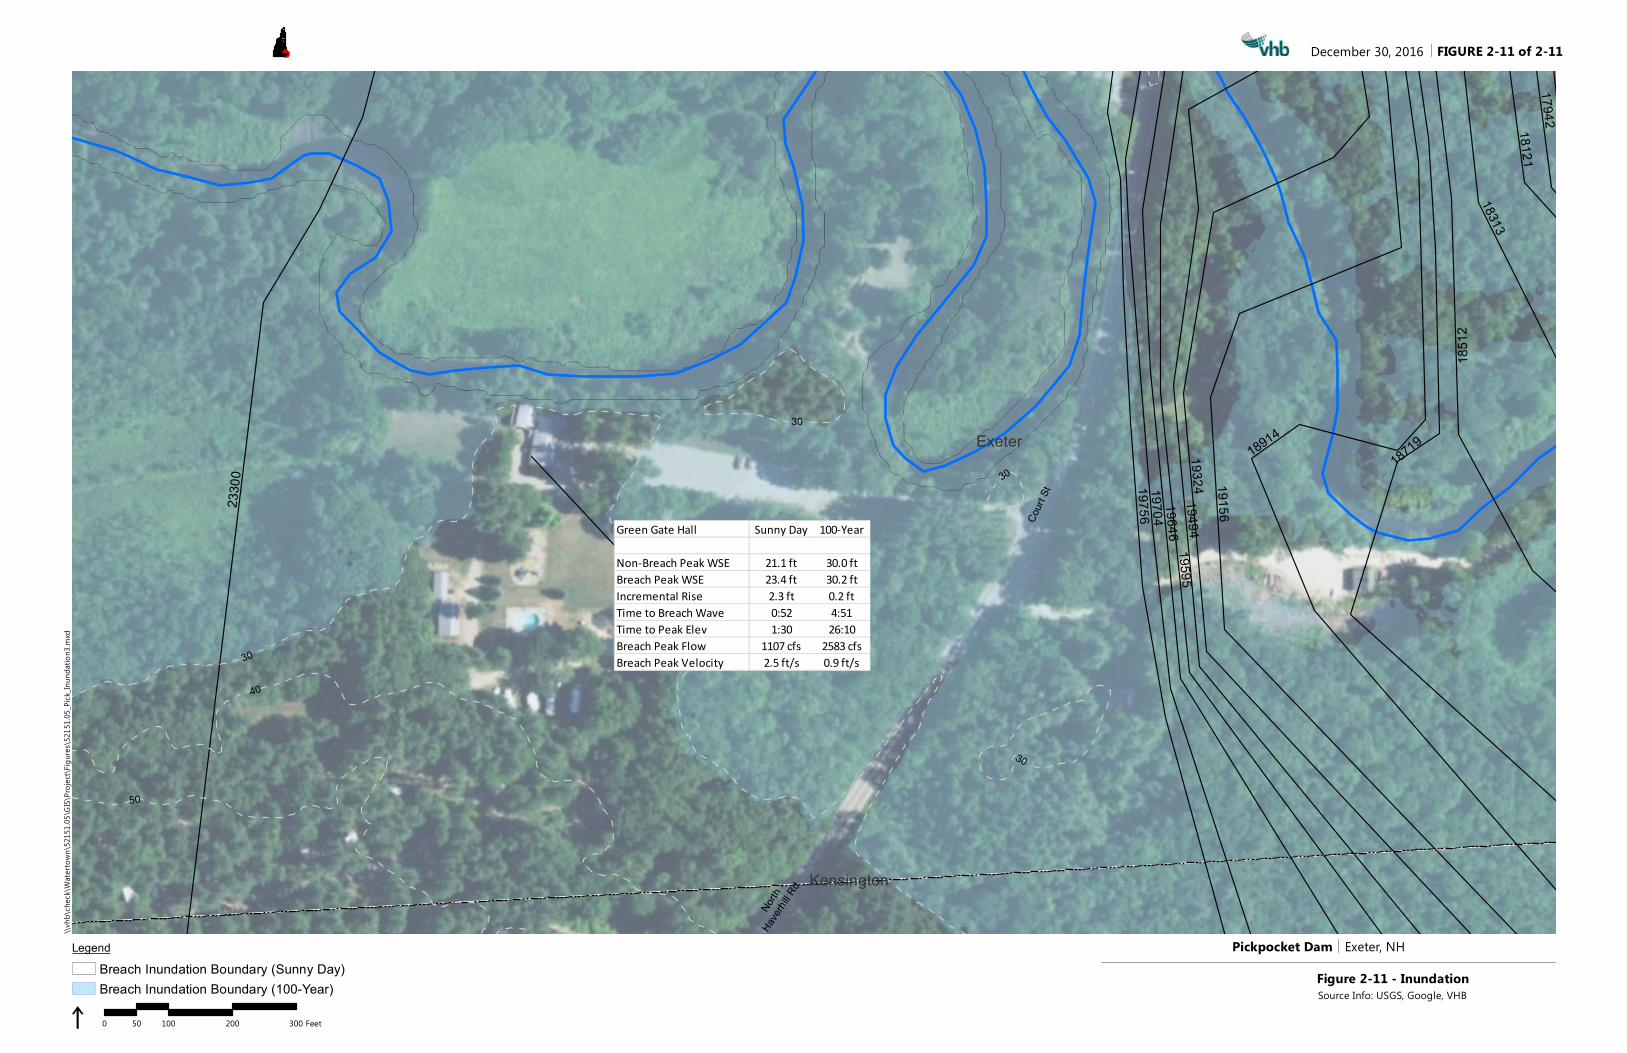
Green Gate Hall Sunny Day 100-Year
Non-Breach Peak WSE 21.1 ft 30.0 ftBreach Peak WSE 23.4 ft 30.2 ftIncremental Rise 2.3 ft 0.2 ftTime to Breach Wave 0:52 4:51Time to Peak Elev 1:30 26:10Breach Peak Flow 1107 cfs 2583 cfsBreach Peak Velocity 2.5 ft/s 0.9 ft/s
1794218121
18313
1851
2
18719
197561970423
300
1964619595
1949419324
1891419156
North
Haverhil
l Rd
Court
St
Exeter
Kensington
40
30
50
30
30
30
Pickpocket Dam Exeter, NH
i 0 100 200 30050 Feet
December 30, 2016\\v
hb\ch
eck\W
aterto
wn\52
151.0
5\GIS\
Projec
t\Figu
res\52
151.0
5_Pic
k_Inu
ndati
on3.m
xd
Source Info: USGS, Google, VHB
LegendBreach Inundation Boundary (Sunny Day)Breach Inundation Boundary (100-Year)
FIGURE 2-11 of 2-11
Figure 2-11 - Inundation