Embed Size (px)
Citation preview

Background on Fast Fault Current Injection
The Power System, traditionally comprised of Synchronous Generating Units directly
connected to the Transmission System with the Distribution Systems simply acting as
networks to supply the net power to consumers. Under these arrangements, the volume of
Generation connected to the Distribution System was very small.
Synchronous Generators also have a unique set of characteristics, the speed of the
mechanical shaft rotates in synchronism with the system with contribution to voltage control
being achieved by changing the machines excitation. This arrangement also delivers many
system benefits which until recently have been taken for granted, for example contribution to
System Inertia, fault infeed, contribution to Synchronising torque etc which all have a
significant impact on the behaviour and characteristics of the Transmission System.
Under fault conditions, a synchronous machine can supply very high levels of fault current (5
– 7pu current) which is also an important characteristic of Power System Protection (ie
equipment necessary to detect, discriminate and isolate faulty items of equipment). This is
also an important benefit in maintaining the voltage profile across the System during fault
conditions.
The down side is that management of fault levels can sometimes be an issue. In addition,
high speed protection systems are required to maintain generator stability. Had the Power
System originally been designed with power electronic converters, then the integration of
Synchronous plant is likely to have created problems in respect of protection operating
times, circuit breaker ratings and the need for adequate levels of system synchronising
torque.
So far as fault current injection is concerned, converter based plant has very different
characteristics to its synchronous counterparts and this starts to become an issue as the
volume of synchronous plant starts to fall away. Certainly studies conducted as part of the
System Operability Framework (SOF) have demonstrated that operating the system post
2021 with falling volumes of synchronous generation starts to become an increasing
challenge.
Unlike a Synchronous Generator which can supply an instantaneous injection of fault current
upon fault inception, this characteristic is not replicated in converter based plant. In addition,
as the fault current from a synchronous machine is injected instantaneously upon fault
inception (ie as soon as the voltage starts to drop) the fault current injection from all the
synchronous generators are in phase with the System.
In a converter based plant, the power output can be configured depending upon the design
of the converters control system. In general, the primary purpose is to protect the switching
devices (IGBT’s) from excessive currents during faulty conditions. Any form of over rating
adds additional cost to the converter.

The problem is that the converter will at best only supply 1 – 1.5pu current (compared to a
synchronous generator of 5 - 7pu) and secondly the injection of reactive current to the
system is generally delayed as a result that the measurement functions within the controller
are i) protecting the IGBT’s and ii) determining the system conditions at the connection point
prior to providing any form of injection. This design philosophy is an common approach used
by many manufacturers and is based on the Phase Locked Loop (PLL) concept. An example
of the typical fault current injected from a XMVA Synchronous Generating Unit and a XMVA
Power Park Module is shown in Figure 4.1 below.
INSERT FIGURE 4.1
Insert Figure 4.1 (Fault current infeed – Synchronous Plant v Power Park Module)
The problem with this approach is that i) the injection of reactive current is already low (ie 1 –
1.5pu compared to 5 – 7pu) and ii) when fault current in injected it is likely to be several tens
of milliseconds after fault inception, so the injection of reactive current is out of phase with
the System which further compounds to a diminishing voltage profile across the system
during system disturbances.
An illustration of this effect is shown in Figure 4.2(a) and 4.2(b). Figure 4.2(a) shows the
effect of a solid three phase short circuit fault at Walpole 400kV substation and the contour
of the voltage depression across the system immediately prior to fault clearance. This study
has been conducted on the basis of a high volume of synchronous generation. In Figure
4.2(b) the study is repeated although in this case the generation background comprises a
high percentage of converter based plant.
Figure 4.2(a) Effect on Voltage Profile of a solid three phase short circuit fault at Walpole
400kV substation under a high Synchronous Generation background

Figure 4.2(b) Effect on Voltage Profile of a solid three phase short circuit fault at Walpole
400kV substation under a high Converter Generation background
To understand these effects in more detail, and develop a set of requirements for fast fault
current injection, National Grid ran a set of detailed studies. The details of these studies are
shown as a set of slides in Annex 3 of this Workgroup report. These slides were discussed
with Workgroup members in April 2017.
In summary, the purpose of the study work was to assess the performance on the
Transmission and Distribution System of different converter topologies against that of a
system made up mainly of synchronous plant with a view to understanding the impact on the
System.
The study considered the effect on the system of
i) Synchronous Generation,
ii) negative demand (i.e. the generator is modelled as negative demand and has no real
dynamic effect nor provides any form of fault current)
iii) a standard Static Generator Model with PLL taken directly from the Power Factory library,
iv) A converter model based on PLL technology which also includes Fast Fault Current
Injection capability (where changes to the injection of reactive current can be varied (eg
delay times, ramp rates and ceiling values) and
v) a Virtual Synchronous Machine model in which the converter controller is set up to reflect
the performance of a synchronous machine. An example of the performance from these
technologies is shown in Figure 4.3 below.

Figure 4.3 – Comparison of Converter performance used to assess the impact on the system
under fault conditions.
The concept of the Virtual Synchronous machine is, as its name suggests, aims to control
the output of a power electronic converter in the same way as a synchronous machine. The
concept is not new with papers and concepts being published on this subject some 20 years
ago.
Similar technologies have also found practical applications in the marine industry, but it has
not been widely used in public Grid Systems due to the dominance of Synchronous
Generation. However, as the volume of Synchronous Generation, particularly at
Transmission levels starts to decline, there is growing concern over the ability to operate a
power system with very high levels of non synchronous generation.
Conventional converters suffer from two major drawbacks when compared to synchronous
generators, these being i) they are unable to supply high fault currents due to the need to
protect the converter devices and ii) they are decoupled from the generator and as such do
not contribute to System inertia or supply any form of synchronising torque with any form of
response being delayed.
The majority of Power Electronic converters use a Phase Locked Loop (PLL) which in
essence means the controller aims to keep the phase shift between the input signal and the
voltage control oscillator (ie the device which ultimately controls the IGBT’s) to zero. The
down side of this type of current source control is that it needs to detect a drop in voltage at
the converter terminals and then determine any form of phase change before undertaking
any processing. Whilst this processing can probably be achieved in 5 cycles (eg 100ms) this
speed is still very slow when compared to a Transmission System fault which can be cleared
by system protection within say 80ms at 400kV and consequently the need to inject fault
current.

In the VSM configuration the converter has slow controls and no PLL so that the phase
angle of the voltage source reference oscillator is frozen to the same state it was in prior to
the fault. The rate of rise of fault current is initially limited by the output filter components
however the converters typically rely on very fast measurement feedback of terminal voltage
or current to protect the IGBT’s by shutting them down or reducing pulse width. With the
current under control or limited, the device then produces fault current within its rating by
reducing the internal AC source voltage. Consequently the phase angle of the current drawn
is typically determined by the load and is generally reactive in nature which is the same
approach of a synchronous machine.
From an electrical perspective, a synchronous machine is basically a balanced 3ph voltage
source connected to the system via an impedance that is largely reactive. The frequency
and phase angle of this voltage source changes relatively slowly as they are directly related
to the angle of the machines rotor which is very heavy and has a high inertia. Likewise the
voltage magnitude also changes relatively slowly as it is related to the current in the field
which is highly inductive and therefore slow to change.
The AC current however is dependent upon the load and network impedance. Load changes
or switching operations such as tripping machines or switching in and out transmission lines,
therefore result in very fast network impedance changes. Consequently theis results in
almost instantaneous changes in AC current and this explains why conventional
synchronous generators naturally respond to load changes instantaneously without having to
measure feedback signals such as voltage or frequency. The aim of this proposal is
therefore to require converter based generation to behave in the same way as a
Synchronous Generator.
This VSM technology offers significant advantages to the System Operator and is also
believed to be a lower cost solution than other alternatives such as connection restrictions or
the installation of Synchronous Compensators which it is acknowledged are a necessity but
would not necessarily be required all year round.

Place your chosen
image here. The four
corners must just
cover the arrow tips.
For covers, the three
pictures should be the
same size and in a
straight line.
RfG – Fast Fault Current Injection
Antony Johnson / Peter Simango National Grid – Network Capability
April 2017

2
Acknowledgements
The authors of this presentation are indebted to Richard Ierna for his help
on the VSM research and associated modelling work.
3
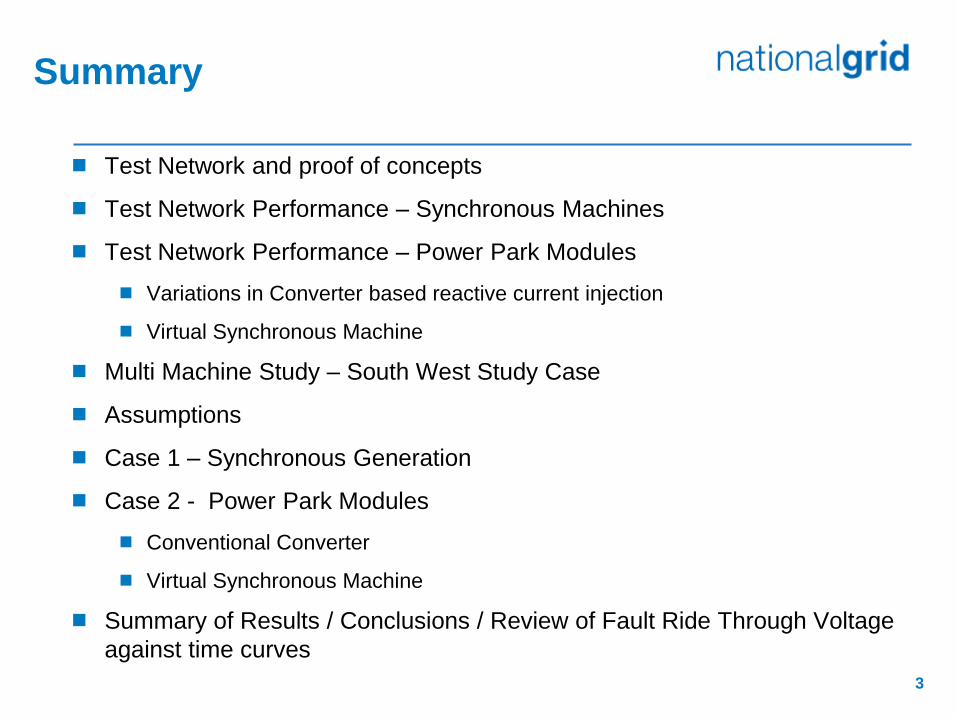
Summary
Test Network and proof of concepts
Test Network Performance – Synchronous Machines
Test Network Performance – Power Park Modules
Variations in Converter based reactive current injection
Virtual Synchronous Machine
Multi Machine Study – South West Study Case
Assumptions
Case 1 – Synchronous Generation
Case 2 - Power Park Modules
Conventional Converter
Virtual Synchronous Machine
Summary of Results / Conclusions / Review of Fault Ride Through Voltage
against time curves

Place your chosen
image here. The four
corners must just
cover the arrow tips.
For covers, the three
pictures should be the
same size and in a
straight line.
RfG – Fast Fault Current Injection
Test Network / Model Validation

5
Test Network (Fig1)

6
Test Network :Study Assumptions
A three phase fault was applied at 400kV Ref Bus
The retained voltage is measured at the machine terminal [33kV]
Machine Rating assumed to be 1MVA. The number of machines
was increased to achieve a higher current injection.

7
Test Network - Results Effect of Synchronous Plant On Retained Voltage at the
Machine terminals

8
Test Network Current Injection from Synchronous plant - Fault at 400kV Ref
Busbar
Fault period

9
Test Network – Synchronous Plant Summary of Results
The current injection from this group of synchronous plant
increases from 0.09kA to 3.5kA as the number of machines
increase (i.e. 1MVA – 50MVA).
The retained voltage at 33kV increases from 0 to 0.24pu as
the number of machines increase
A group of 25MVA machines were sufficient to achieve a
retained voltage of 0.14pu after the fault has been applied at
400kV Ref Bus

10
Test Network Effect of Power Park Modules with different control actions
(PLL, FFCI and VSM)
Assumptions
The same number of machines as synchronous machines was
used
The asynchronous machine was modelled as a static generator
with different controllers
Retained Voltage and current injection plots obtained

11
Test Network - Results Reactive power Injection Comparison
Area across which PLL behaviour cannot be guaranteed,
injection is potentially out of phase with the retained voltage
50ms delay for
illustration, shorter delay would be
prescribed in
practice

12
Test Network Effect of Power Park Modules with PLL control on Retained Voltage at the Machine
terminals
The same number of machines as synchronous machines was
used
The asynchronous machine was modelled as a static generator
with PLL control
Retained Voltage and current injection plots obtained
Due to the low voltage involved, the switch off threshold (i.e.
blocking) was set to zero to allow the static generator to contribute
reactive current at these voltages.
Normally it is the case that for standard PLL controllers a blocking
voltage would apply to this timeframe.

13
Test Network - Results Retained Voltages of different Capacities of Power Park
Module (PLL - No FFCI)*
* Assumes ideal in phase response of the PLL

14
Static Generator With Fast Fault Current Injection(FFCI) Current limiter Setting

15
Test Network – Static Generator with Fast Fault Current Injection (FFCI)
The more the machines the better the retained terminal voltage
As a control function it is desirable to delay the injection to
ensure the injection is in phase with retained voltage
The higher the injection the less the number of machines
required to achieve a particular terminal voltage
Blocking ahead of fault clearance may be required to avoid
Transient Over Voltage following the fault, provided reactive
and active power is rapidly restored thereafter
Current Injection (pu) 1.5 No of Static Generators with FFCI (1MVA each ) 1 25 50 100 33kV Terminal Voltage[pu] 0.00 0.04 0.08 0.17

16
Test Network - Results Retained Voltages of different Capacities of Power Park Module with
FFCI

17
Test Network - Results VSM Model
The network is the same as that shown in Fig 1
VSM technology uses the static generator but the controller has
been modified to reflect the behaviour and performance of a VSM.
The Virtual Synchronous Machine control strategy replicates
several aspects of Synchronous machine behaviour such that a
response to a phase change is immediate and proportionate to the
disturbance, as would be the case for a synchronous machine.

18
Test Network - Results Retained Voltages of different Capacities of Power Park Module with
VSM

19
Test Network – VSM Performance
The more the machines the better the terminal voltage
VSM offers better performance than PLL.

20
Test Network
Retained Voltage - Comparison for the four cases
When the number of machines is very low, the contribution from
them is insignificant
A group of synchronous machines will offer more voltage support
compared to the same number of other technologies (in Phase)
Other than Synchronous machine and VSM approaches there are
challenges over immediate quantity and quality of support
provided.
Option 1MVA 25 MVA 50 MVA 100MVA
Sync. machine Voltage 0.00 0.13 0.24 0.38
Static Generator Voltage (PLL) 0.00 0.03 0.06 0.12
Stat. Gen With FFCI Voltage (Final ) 0.00 0.04 0.08 0.17
Static Generator with VSM Control 0.00 0.035 0.071 0.141

Place your chosen
image here. The four
corners must just
cover the arrow tips.
For covers, the three
pictures should be the
same size and in a
straight line.
RfG – Fast Fault Current Injection
Multi Machine Study Results
South West Study

22
Proposed Study approach and
Methodology
Full GB Transmission Network
Includes DNO Networks
Specific area of interest will focus on an area of the network known
to have a high volume of Embedded Generation: South West
Base case study
Intact network conditions
System conditions – Max / Min Demand
All Embedded Generation initially modelled as negative demand
Solid Three phase short circuit fault applied adjacent to Indian Queens
400kV substation
Voltage profile assessed across the Transmission and Distribution
system during and after the above faults

23
Area Under Study
24
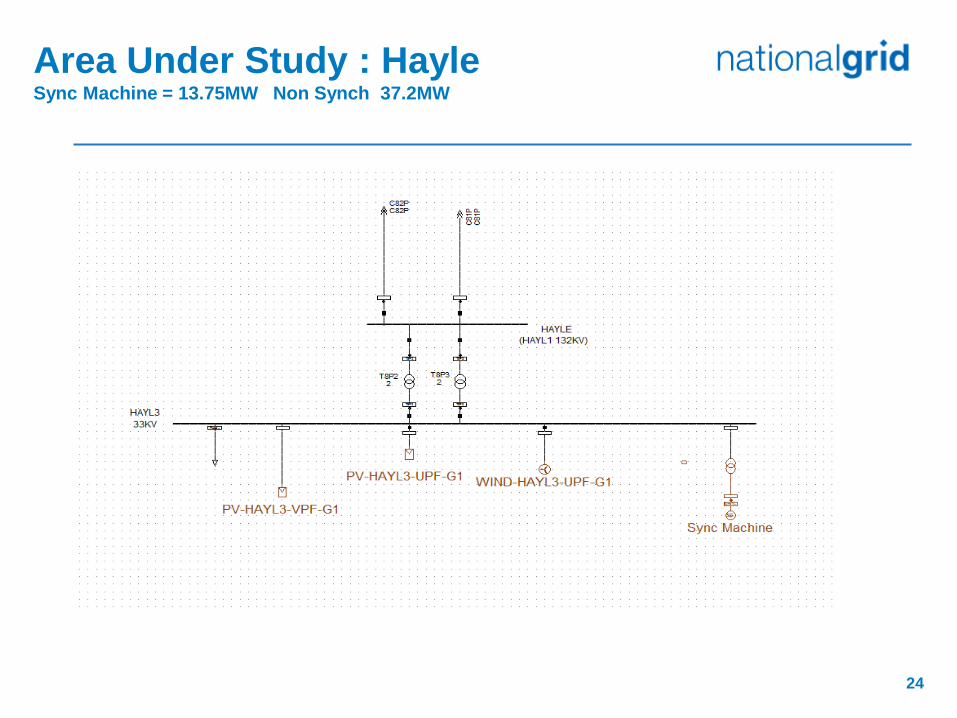
Area Under Study : Hayle Sync Machine = 13.75MW Non Synch 37.2MW
25
Multi Machine System Study
Assumption – Embedded Generation
modelled as Negative Demand
Fault Condition: Solid Three phase double circuit fault between
Indian Queens and Taunton substation

26
GB System Study Result Summary
Negative demand
The Voltage at the point of fault at 400kV is zero
A number of busbars have a retained voltage above 10% due to
network interconnection
The minimum voltage at Hayle 33kV busbar during fault is 0.048pu.
Node Name MILE3 EXEC3 HAYL3 INDQ4
Min voltage 0.303 0.467 0.048 0

27
GB System Study Result Summary Embedded Generators - Synchronous Machines

28
GB System Study Result Summary Embedded generation synchronous units
modelled as synchronous machine
The Voltage increases with the capacity of synchronous machines
The Voltage increases with the location of synchronous machines
The Voltage at Hayle 33 kV substation has increased from 0.048pu to
0.23pu( Minimum)
This improvement has cascaded to some of the busbars around the
network
Synchronous Plant with a FRT value of Uret of 30% may trip in this case
(approx 13.25MW at Hayle), further examples below.
Node Name MILE3 EXEC3 HAYL3 INDQ4
Min voltage 0.29 0.46 0.23 0.00

29
GB System Study Result Summary
(Embedded non synchronous Generation
Modelled as Static Generator only)

30
The Voltage at the point of fault is zero
The Voltage at Hayle 33kV Substation has increased from 0.048pu to
0.11pu
PPM’s at Hayle 33kV will trip if there is less than 25MVA plant of plant
running for a Transmission System fault (retained voltage recorded at
0.08pu). Based on studies we expect there to be approx 37.04 MW
running which holds the voltage above 0.11pu (as per above table).
Node Name MILE3 EXEC3 HAYL3 INDQ4
Min voltage 0.31 0.47 0.11 0.00
GB System Study Result Summary
(Embedded non synchronous Generation
Modelled as Static Generator only)
31
GB System Study Result Summary (effect of Embedded non-synchronous Generation
Modelled as a Static Gen with FFCI only)

32
GB System Study Result Summary Retained Voltage for different capacities FFCI

33
GB System Study Result Summary Retained Voltage for different capacities FFCI
With FFCI the delay has a significant effect on the retained voltage
Capacity Initial Voltage Final Voltage
25MVA Group 0.047 0.058
50MVA Group 0.047 0.149

34
GB System Study Result Summary Combination of Synchronous machine with static Gen with PLL

35
GB System Study Result Summary Combination of Synchronous machine with static Gen with PLL

36
GB System Study Result Summary non- synchronous embedded Generator modelled as
VSM only

37
VSM Result Summary
The retained voltage at HAYLE is greater that 0.1pu
Node Name MILE3 EXEC3 HAYL3 INDQ4
Min voltage 0.306 0.468 0.191 0.005

38
GB System Study Result Summary Combination of Synchronous machine , Static Generator
with FFCI and VSM

39
Result Summary Combination of Synchronous machine , Static Gen
with FFCI and VSM
The retained voltage at HAYLE if greater than 0.2pu just after the
fault for a combination of the three technologies
Due to higher synchronous fault infeed the phase shift is slower
and the PLL is better able to support system voltage
Early adoption of VSM helps improve areas of the system with
already high volumes of PLL technology
Node Name MILE3 EXEC3 HAYL3 INDQ4
Min voltage 0.28 0.44 0.21 -0.09 0.00
40
2025 Study case Solar Peak Scenario Transmission System - Minimum Demand
The model Contains small synchronous machines at various
busbars with the rest of the embedded generators are modelled as
static generators. The total embedded generator output( South
West region) is 141MW and 2270MW for synchronous and non
synchronous plant respectively.
The retained Voltage is above 0.1 pu
Below is the embedded generation output matrix on the three
busbars.
Synchronous[MW] Non Synchronous[MW]
Milehouse 21 10
Exeter City 4 86
Hayle 13 46
41
2025 Study case Solar Peak Scenario Transmission System - Minimum Demand
– PLL with FFCI

42
2025 Study Case Solar Peak Scenario Transmission System - Minimum Demand ( Without VSM)
For the 2025 solar peak model the retained voltage is 0.13pu for a
combination of synchronous machines and static generators with Fast
Fault current injection (FFCI)
Node Name MILE3 EXEC3 HAYL3 INDQ4
Min voltage 0.50 0.47 0.13 0.00

43
2025 Study case Solar Peak Scenario
Results With VSM + PLL + Synchronous plant included - Transmission
System - Minimum Demand
Node Name MILE3 EXEC3 HAYL3 INDQ4
Voltage 0.50 0.47 0.19- 0.12 0.00

44
2025 Study case Solar Peak Scenario
Results With VSM + Synchronous plant included - Transmission System -
Minimum Demand
Node Name MILE3 EXEC3 HAYL3 INDQ4
Voltage 0.50 0.47 0.19 0.00

Place your chosen
image here. The four
corners must just
cover the arrow tips.
For covers, the three
pictures should be the
same size and in a
straight line.
RfG – Fast Fault Current Injection
Update – Results / Conclusions

46
High Level Observations (1)
The amount of fault current injected is a function of the volume of
Generation at a specific location
The retained voltage during the period of the fault is a function of
the amount of reactive current injected
The lower the fault infeed, the lower the retained voltage
The fault infeed from Synchronous Generation is superior
compared to Converter based plant
The performance from Converter based plant can be modified
depending upon the control strategy employed
The best performance can be obtained from VSM technology
The poorest when modelled as a Negative Demand
The performance of PLL based converters will be a function of the delay,
response speed and maximum ceiling current (in these studies this was set to
1.5pu)
The performance of the PLL is fundamental to getting the phase relationship
correct which can result in incorrect current injection and delays in performance

47
High Level Observations (2)
If high levels of fast fault current injection are achieved, this helps
maintain the voltage profile across the network. VSM can be seen
to stabilise local retained voltage against a future greater level of
nonsynchronous generation
Volume of Generation is a primary issue in defining the levels of
fast fault current injection required and the retained voltage (Uret)
Any requirement that is proposed needs to be robust over the
range of Transmission System operating conditions (ie max
demand to min demand).
The more generation running (in particular DG - with the wrong
control philosophy) the greater the risk of incorrect behaviour
hence the need for these requirements which creates self
supporting situation.
The reactive current injected by Synchronous plant is fixed and is a
function of the machine parameters.

48
Constraints / Issues (1)
The Transmission System is currently secured to a maximum infrequent infeed loss
of 1800MW. If Embedded Generation is lost above this level, the frequency will not
be secured without holding of additional reserves or operation of the demand
disconnection scheme (initiated at 48.8Hz). Much of the embedded generation
connected at lower voltages does not have operational metering to inform the scale
of the potential maximum loss.
Synchronous Generators driven by reciprocating Diesel / Gas engines are unable to
ride through voltage dips where the retained voltage is below 30%. There is no
known cost effective solution to overcome this issue at the present time. Time frame
for tripping to be discussed.
The best results (highest retained System voltage) for multi machine studies with
high converter penetration were obtained with VSM technology included (see slide –
45)
Based on studies, a Transmission System fault may result in voltage dips at certain
busbars as low as 10% retained voltage even with the VSM from converter based
plant modelled. This will result in tripping of some Embedded Generation; FRT
settings need to balance operational costs with the potential cost of compliance.

49
Options
Option Advantages Disadvantages
Negative
Demand
Do Nothing Not sustainable- higher maximum loss occurs which
cannot easily be tracked or managed.
No fault current supplied – System Operability issues
/ Protection issues
Static
Generator
with PLL
Potentially gives relatively fast response but delays
still exist
Real Converter unlikely to behave in this way
Delayed response
Anti phase PLL – requires tuning
Power System Operational issues
High post fault TOV issues
Do not contribute to System Services
Static
Generator
with FFCI
Higher fault current than options 1 and 2 Do not contribute to System Services (e.g no inertia)
Delayed response will risk voltage dips below defined
voltage against time curve in areas of low
synchronous generation
Little System benefit unless high volumes connect
Still requires manufacturer development of control
strategies – but some experience in GB of doing this
Still has dependencies upon PLL function
VSM Offers many system benefits –over and above other
options (see next slide)
EU may introduce similar requirements in the longer
term
Offers better long term system performance than
other current options
No delay in response
VSM Technology - current driven by Power System
not converter
Unproven technology
Requires manufacturer development
Solution needs storage technology or primary energy
source may need to be curtailed
Development timescales unknown
Potential Power System Stabilser issues

VSM Summary
VSM has been subject to a whole range of simulation work and a
number of papers have been published on this subject (see
references published in earlier GC0048 meetings / actions)
VSM covers a wider range of system events in different scenarios
unlike many other solutions, with a better performance
VSM can be combined with the other solutions, it is not intrusive
with the other technologies, these can work together with VSM
VSM has similar response to Synchronous Machines under
generation loss events, the operator can use the same expertise.
Application, analysis, operation and commercialisation of the
services of VSM are similar to those of Synchronous Machines
50
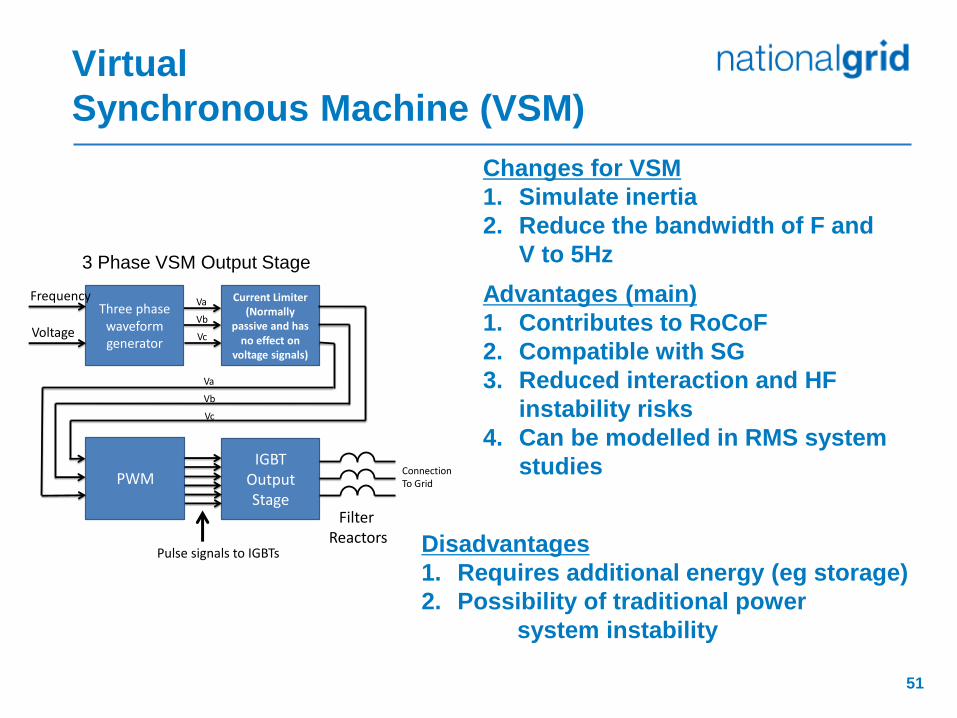
IGBTOutput Stage
Current Limiter(Normally
passive and has no effect on
voltage signals)
Three phase waveform generator
Frequency
PWM
VoltageVb
Va
Vc
Vb
Va
Vc
ConnectionTo Grid
3 Phase VSM Convertor Output Stage
Pulse signals to IGBTs
Filter Reactors
Virtual
Synchronous Machine (VSM)
51
Changes for VSM
1. Simulate inertia
2. Reduce the bandwidth of F and
V to 5Hz
Disadvantages
1. Requires additional energy (eg storage)
2. Possibility of traditional power
system instability
Advantages (main)
1. Contributes to RoCoF
2. Compatible with SG
3. Reduced interaction and HF
instability risks
4. Can be modelled in RMS system
studies
3 Phase VSM Output Stage

52
Summary
From a Transmission System perspective, the VSM functionality or immediate fault
current injection is the preferred option based on the study results in addition to the
wider system benefits – see previous slide. It also helps lift the retained voltage
(Uret) across the system
The EU are already looking at these concepts - a one year study is being initiated
for Type 1 Grid Forming Converters.
There could be additional costs to developers. For battery storage and solar
projects these are considered to be modest, for wind based plant they could be
higher
The dilemma – From a Network Operators perspective VSM functionality is the
preferred solution but it is acknowledged that development time needs to be
factored into this and to meet RfG timescales, a solution must be available by May
2019.
If these timescales cannot be met, then there would still be a requirement for
converter based plant to contribute to reactive current injection. The risk is that it
could result in manufacturers to develop one solution on an interim basis and then
adopt the immediate current injection approach in the longer term which could result
in doubling development costs.

53
High Level Proposals
For fast fault current injection an immediate reactive current injection (VSM type
functionality or otherwise) would be proposed in the longer term - in the shorter term
conventional converters with delays would only be available until 1 Jan 2021?)
Fault Ride Through Voltage against Time Curves
For Type D Power Generating Modules connected at or above 110kV the proposed requirements
(circulated in October) would remain unchanged
For Type D, C and B Power Park Modules connected below 110kV the requirements would
remain as they are
For Type C and D Synchronous Power Generating Modules below 110kV the requirements
would remain unchanged
For Type B Synchronous Power Generating Modules the value of Uret would have to
remain at 0.3 pu as no known technical solution is believed to exist
Synchronous Generators driven by reciprocating engines are limited in size to about
5 MW. Synchronous Generating Units above this size are generally driven by non
reciprocating prime movers and not believed to present a problem. A Band B / C
threshold of 10MW is therefore proposed.
Even with these values and based on the studies run, it is possible that small
volumes of embedded generation could be lost though these are small (based on
the fault at Indian Queens this is limited to about 13MW) even this has low risk due
to the higher volumes of embedded generation running
54
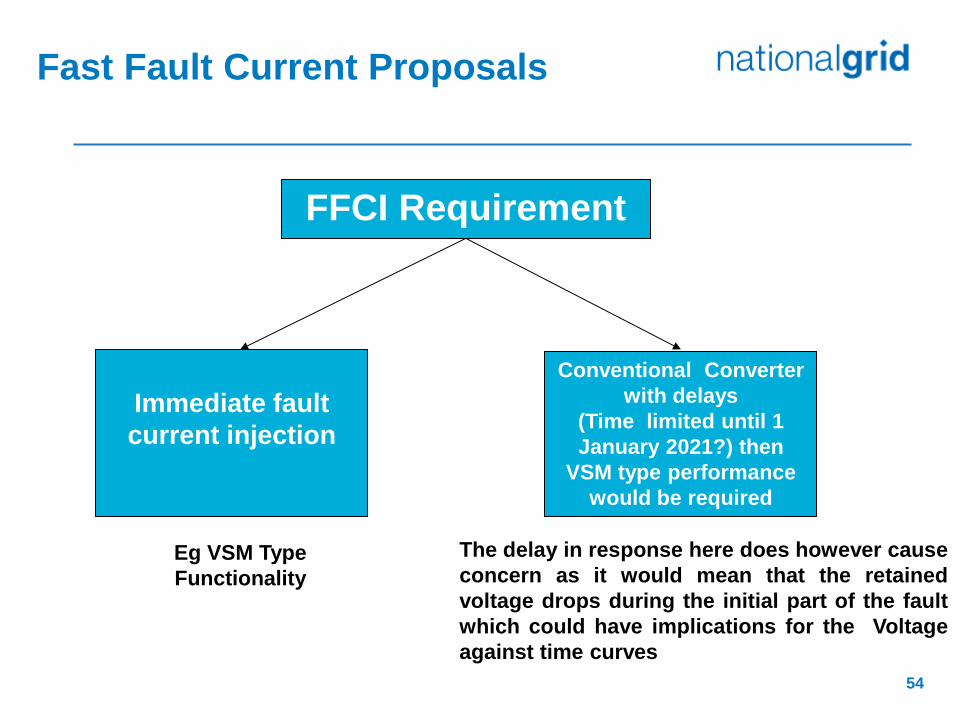
Fast Fault Current Proposals
FFCI Requirement
Immediate fault
current injection
Conventional Converter
with delays
(Time limited until 1
January 2021?) then
VSM type performance
would be required
The delay in response here does however cause
concern as it would mean that the retained
voltage drops during the initial part of the fault
which could have implications for the Voltage
against time curves
Eg VSM Type
Functionality

55
High level proposals for
Immediate Reactive Current Injection
(VSM Type Performance or Equivalent) Requirement Specification
Point of Fast Fault current injection Connection Point of Power Park Module
How and when voltage is to be determined as
well as the end of the voltage deviation
Current supplied as required by the System
The characteristics of the fast fault current,
including the time domain for measuring the
voltage deviation and fast fault current from
which current and voltage may be measured
differently form the method specified in
Article 2
Current supplied as required by the System (Voltage
Source Converter). This type of technology will limit
the current within the capability of the rating of the
converter. This would be proposed to be set to 1.5pu
(assuming the converter is rated to circa 1.3p.u real
power).
The timing and accuracy of the fast fault
current, which may include several stages
during a fault and after its clearance
Current limit needs to be fast to prevent
converter damage
When post fault active power recovery begins
based on a voltage criterion
Active Power to be delivered immediately the fault
has been cleared providing the current limit has been
switched off and system voltage has recovered to
nominal levels.
Maximum allowed time for active power
recovery
Active Power to be delivered immediately the fault
has been cleared providing the current limit has been
switched off and system voltage has recovered to
nominal levels.
Magnitude and accuracy for active power
recovery
Active Power to be restored to 90% of its pre-fault
value. Active Power oscillations shall be acceptable
provided that the total active energy delivered during
the period of the oscillations is at least that which
would have been delivered if the Active Energy was
constant and the oscillations are adequately damped.
56
High Level proposals for
Conventional Converters

57
High level proposals for Conventional
Converters
Requirement Specification
Point of Fast Fault current injection Connection Point of Power Park Module
How and when voltage is to be determined as
well as the end of the voltage deviation
Each time the voltage at the Connection Point
drops below 0.9p.u Blocking Voltage expected to
be set at 0.09 pu
The characteristics of the fast fault current,
including the time domain for measuring the
voltage deviation and fast fault current from
which current and voltage may be measured
differently form the method specified in
Article 2
Each Power Park Module shall be capable of
generating maximum Reactive current during
the period of the fault without exceeding the
transient rating of the Power Park Module.
The PLL needs to be disabled in order to
maintain the same phase reference
The timing and accuracy of the fast fault
current, which may include several stages
during a fault and after its clearance
Power Park Module Facility Owner to provide a
continuous time trace of reactive current
injection before during and after the fault,
which demonstrates an acceptable degree
of injection within the time period 20-60ms –
See previous slide
When post fault active power recovery begins
based on a voltage criterion
Active Power Recovery to commence on fault
clearance (ie voltage above 0.9p.u, but less than
1.05p,u)
Maximum allowed time for active power
recovery
Active Power to be restored within 0.5 seconds
of fault clearance (ie voltage above 0.9p.u)
Magnitude and accuracy for active power
recovery
Active Power to be restored to 90% of its
pre-fault value. Active Power oscillations
shall be acceptable provided that the total
active energy delivered during the period of
the oscillations is at least that which would
have been delivered if the Active Energy
was constant and the oscillations are
adequately damped.

58
Note
Whilst the concepts of immediate reactive current injection are
being proposed in the longer term, the requirements for fast fault
current injection will ultimately be specified in the Grid Code as a
functional performance requirement.
There is no restriction on the equipment used to satisfy these
requirements so long as they can meet the functional performance
proposed Grid Code.
This presentation has suggested the approach going forward. The
consultation will cover the functional performance requirements in
more detail.
Stakeholder discussions are required on these proposals

Place your chosen
image here. The four
corners must just
cover the arrow tips.
For covers, the three
pictures should be the
same size and in a
straight line.
RfG Fault Ride Through
Voltage against Time curves

GB Type D Voltage Against Time Curve
60
Type D Synchronous Power Generating Modules
connected at ≥110kV
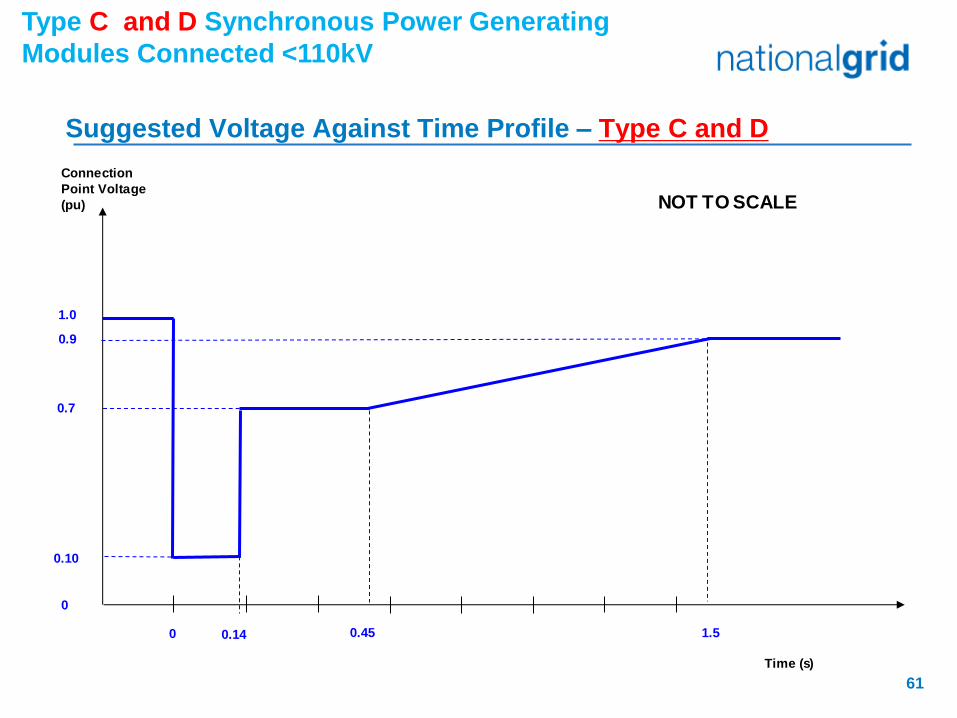
Suggested Voltage Against Time Profile – Type C and D
61
Type C and D Synchronous Power Generating
Modules Connected <110kV
0 1.50.14
0.7
0.9
1.0
Connection
Point Voltage
(pu)
Time (s)
NOT TO SCALE
0
0.45
0.10
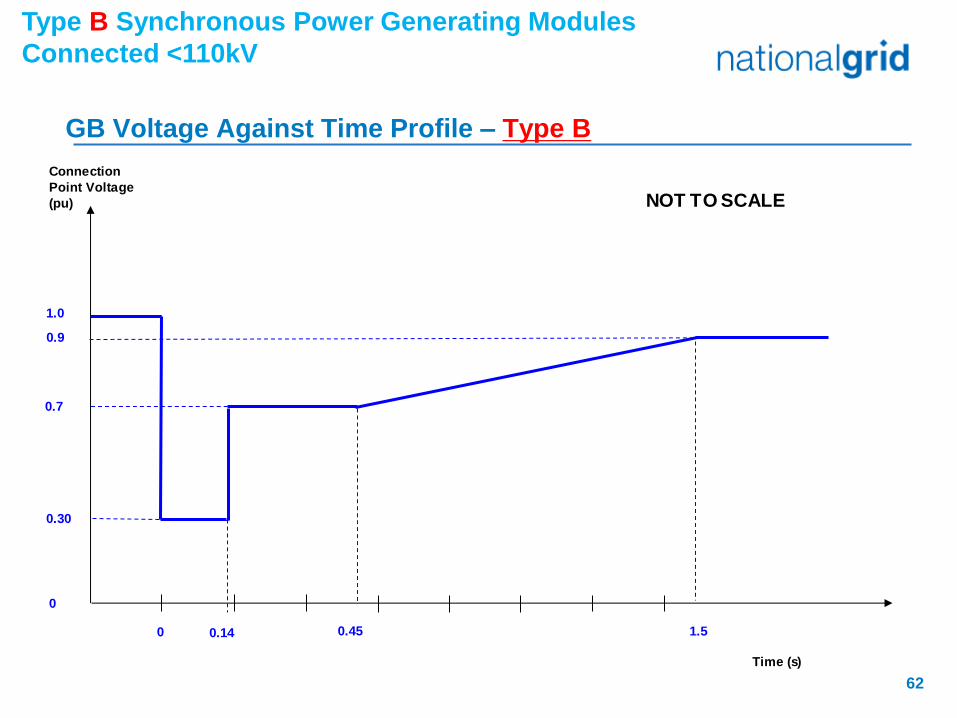
GB Voltage Against Time Profile – Type B
62
Type B Synchronous Power Generating Modules
Connected <110kV
0 1.50.14
0.7
0.9
1.0
Connection
Point Voltage
(pu)
Time (s)
NOT TO SCALE
0
0.45
0.30

GB Voltage Against Time Profile – Type D
Type D Power Park Modules connected ≥110kV
0 0.14
0.85
1.0
Connection
Point Voltage
(pu)
Time (s)
NOT TO SCALE
0
2.2

GB Voltage Against Time Profile - Type B, C and D
Type B, C and D Power Park Modules connected
<110kV
0 0.14
0.85
1.0
Connection
Point Voltage
(pu)
Time (s)
NOT TO SCALE
0
0.10
2.2

65
Summary
Immediate current injection may be considered an unproven option but its overall cost is
considered to be the lowest and offers many other system benefits. The VSM is an example of
such technology – it is not the only option
Time allowed for manufacturers to develop solutions. Conventional Converters with delays can
be used as a short term solution until 1 January 2021? Immediate current injection performance
can be employed at any time but conventional converter performance would only be available
until 1 January 2021 due to concerns over delays and the effect on system performance.
Based on current studies, a Transmission System fault will result in voltage dips at certain
busbars which could be as low as 10% even with the VSM from converter based plant modelled.
The proposed voltage against time curves require a value of Uret = 10% for all Type B, C and D
Plant connected below 110kV (excluding Type B Synchronous).
Embedded Generation losses need to be mitigated for major Transmission System faults. Based
on the study results, the Band B/C threshold in RfG is recommended to be 10MW; It is believed
the potential loss of Embedded Generation including smaller Synchronous machines (up to
10MW) driven by reciprocating engines (with a value of Uret set at 30%) is manageable at these
levels.
Costs are not believed to be excessive for any plant in meeting these Uret values (eg FRT
already applies in SHET Transmission area and Offshore for all plant of 10MW and above)
The EU are looking at these concepts – Type 1 Grid Forming Converter performance

Place your chosen
image here. The four
corners must just
cover the arrow tips.
For covers, the three
pictures should be the
same size and in a
straight line.
RfG – Fast Fault Current Injection:
GB context of case study
Ben Marshall National Grid – System Performance (SO)
April 2017
2
Summary
Voltage dip propagation contour across SW area.
How SW compares to other GB regions
How SCL changes over time in these regions (assuming Tx sources only
supporting).
Conclusions

3
Voltage dip Propagation across SW area
For a fault at Indian Queens
voltage dip below 0.3 up to
Hinkley Point.
Broad equivalent impact for
loss of large machine in
area and simulations as
discussed.
High potential for >
maximum infeed loss

4
SCL regions of GB

5
How SW compares to other areas of GB
Area
GC048 study Future Of Energy documents
SCL studied 2025 (kA)
DG installed 2025 (MW)
DG studied 2025 (MW)
FES2025 max DG output (MW)
FES2025 min DG output (MW)
SOF regional SCL min (kA)
SOF regional SCL 95% confidencemin (kA)
SOF regional SCL 95% confidence max (kA)
SOF regional SCL max (kA)
1 North Scotland N/A N/A N/A 1839.5 1167.6 6.8 11.9 16.5 18.6
2 South Scotland N/A N/A N/A 2941.8 2024.4 9.5 13.1 20 21
3 North East England N/A N/A N/A 1360.6 885.4 10.8 14.4 29.3 34.1
4
North West and West Midlands N/A N/A N/A 3338.1 1990.1 0.7 5.7 21.1 22
5 East Midlands N/A N/A N/A 3540.8 2029.3 2.7 7.1 24.4 28.4
6 North Wales N/A N/A N/A 740.1 594.3 13.3 21.6 36.1 38
7
South Wales and West england N/A N/A N/A 3677.3 2300.5 6.4 9.8 26.2 30.4
8 South West England 16.3 2522.4 2411 3213 1999.7 2.4 7.3 22.1 25.9
9 East England N/A N/A N/A 3934.5 2543.1 9.1 17.4 41.5 45.6
10 Greater London N/A N/A N/A 1716 1104.4 6.2 14.2 32.4 35.7
11 South East England 23.95345696 N/A N/A 2059 1268.2 7.6 15.1 27.9 31.7
6
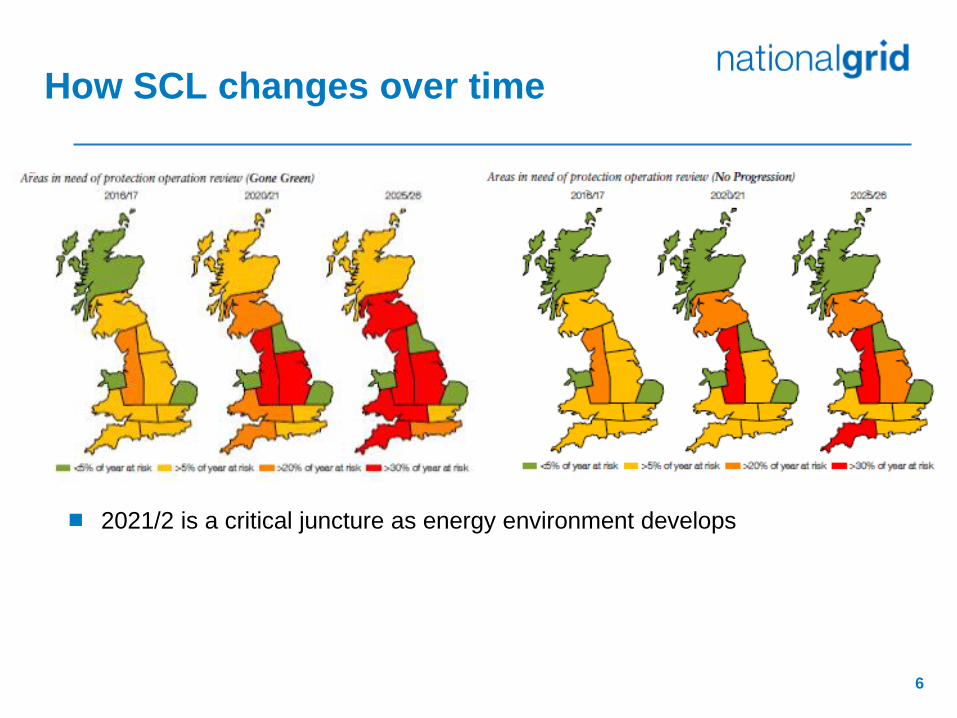
How SCL changes over time
2021/2 is a critical juncture as energy environment develops

7
How DG changes over time

8
Conclusions
The SW case study is a credible illustration of the cascade loss
risk of DG with transmission plant.
The study sits in the middle of the FES range for DG
contribution and optimistically within the range of potential SCL
at the time.
Across GB, the SW is indicative of most areas of GB other
areas except arguably Greater London and North Wales.
The rate of change of SCL is such in these areas that a
response to arrest the displacement effect of transmission
resources and increasing levels of non-synchronous capacity
would need to be fully addressed early in the next decade to
avoid operability challenge with mitigation occurring ahead of
this

Place your chosen
image here. The four
corners must just
cover the arrow tips.
For covers, the three
pictures should be the
same size and in a
straight line.
GC0100 - Fast Fault Current Injection, Fault
Ride Through and Banding
Antony Johnson
July 2017

Summary
Overview - why are Fast Fault Current Injection, Fault
Ride Through and Banding related
Proposals
Fast Fault Current Injection
Fault ride Through
Banding
Conclusions
2

3
Why are Fast Fault Current Injection,
Fault Ride Through and Banding related
The amount of fault current injected is a function of the volume of
Generation at a specific location
The retained voltage during the period of the fault is a function of the
amount of reactive current injected - The lower the fault infeed, the lower
the retained voltage seen across the system
Fault ride performance is the ability of Generation to remain connected
and stable under fault conditions. Its assessment is based on the retained
voltage at the connection point which is directly related to the fault infeed.
All Generation needs to play its part in supporting the System under fault
conditions.
A higher fault current infeed will enable a higher retained voltage to be
specified as part of the fault ride through requirements.
RfG specifies Generators are split into Bands. The fault ride through
requirements are different between Synchronous and Asynchronous Plant
with different parameters permitted between different bands

4
System Voltage profile under fault
conditions – High / Low Synchronous
Generation Background

5
The effect of connecting higher
volumes of Converter based plant without FFCI
The Transmission System is changing - Large directly connected Synchronous
Plant is rapidly being replaced by renewable technologies (eg wind, wave, solar and
storage) – many of which utilise Converter based technologies
Under fault conditions a Synchronous Generator will contribute 5 – 7pu current
Converter based plant has a limited ability to supply fault current, (1 - 1.25pu current
max),
These effects significantly affect the design and operational characteristics of the
System including the ability to maintain resilience and correctly detect and isolate a
fault condition.
At National Grid we want to promote the use of different generation technologies to
ensure they grow whilst ensuring the safe, secure and efficient operation of the
System.
The System Operability Framework (SOF) published over the last few years have
started to show the impacts on the System of high penetrations of converter based
plant
High Converter Penetrations
- Options
6
Solution Estimated Cost RoC
oF
Sync
Tor
que/
Pow
er
(Vol
tage
Sta
bilit
y/R
ef)
Prev
ent
Vol
tage
Col
laps
e
Prev
ent
Sub-
Sync
Osc
. /
SG C
ompi
tabl
e
Hi F
req
Stab
ility
RM
S M
odel
ling
Faul
t Le
vel
Post
Fau
lt O
ver
Vol
ts
Har
mon
ic &
Imba
lanc
e
System
Level
Maturity Notes
Constrain
Asyncronous
Generation
Hgh I Yes Yes Yes Yes Yes Yes Yes Yes Proven
Syncronous
CompensationHigh I Yes Yes Yes Yes Yes Yes Yes Yes Proven
VSM Medium Yes Yes Yes Yes Yes Yes Yes Yes P Modelled
VSM0H Low No Yes Yes No P P P Yes P Modelled
Synthetic Inertia Medium Yes No No P No No No No No Modelled
Other NG Projects Low Yes P Yes No No No P P No Theoretical
Now 2019 2019 Now 2020 Now Now 2025 2025Timescale
(Based on work by SOF team)
These technologies
are or have the
potential to be Grid
Forming / Option 1
Has the potential to
contribute but relies
on the above Solutions
Key
No
Doesn't
Resolve
Issue
P Potential
I Improves
YesResolves
Issue
With current technology/models, the system can become unstable when more than 65% of
generation is Non-Synchronous
For the FES 2Degrees, Consumer Power and Slow Progression scenarios it is currently
forecast, this level could be exceed by 9.2% -21,3% p.a. in 2023/24 and by 24.6% - 31.6%
p.a.in 2026/27.

7
Fast Fault Current Injection – Power
Park Modules and Converter based Plant
In the first quarter of 2017 extensive studies were run to understand the implications
and control functions of converter based plant.
These studies and results were presented to the GC0048 Workgroup in April 2017
available at:-
http://www2.nationalgrid.com/WorkArea/DownloadAsset.aspx?id=8589940887
http://www2.nationalgrid.com/WorkArea/DownloadAsset.aspx?id=8589940886
These studies demonstrated the considerable variation in System behaviour as a
result of changing the Converter control system. The following key conclusions were
drawn from this work
The fault current needs to be injected in phase with the System during the fault otherwise
both Transmission and Distribution performance is de-graded
Higher volumes of Generation connected to the Distribution System have a significant
effect on the performance of the System even for Transmission System faults
If there is no fault current injection from the converter or it is injected out of phase with the
system it places much more onerous requirements on the fault ride through requirements
(Uret).
Before 2021 there is still a reasonable contribution from Synchronous Generation
connected to the System. Post 2021 these levels start to fall away very quickly

8
Proposals for Fast Fault Current Injection
Two Options have been proposed
Option 1 – The Converter controller behaves in the same way as a synchronous machine
(see attached presentation)
Option 2 – Conventional Converter – required to meet a minimum fault current injection
requirement – option available only until 1 January 2021
Option 1 is not new and similar technologies have been employed in the marine
industry for several years in addition to a number of detailed studies
Option 2 has also been employed previously as an option in areas of high converter
penetration
2021 indicates FFCI (Option 1) as essential in studies presented to GC0048 in April
The longer it takes for the technology to be implemented, the more onerous the
requirements on new plant
A European working group are investigating the implications of Grid Forming
Converters

9
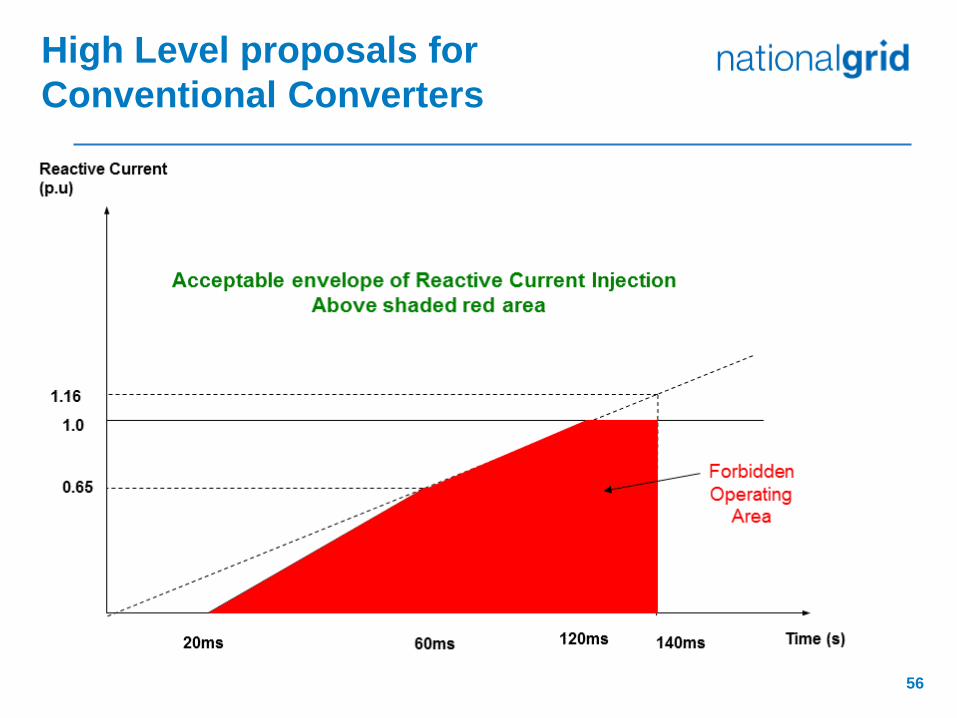
FFCI Option 2
20ms 60ms 120ms 140ms Time(s)
0.65
1.25
1.5
Reactive Current
(pu)
Forbidden
Operating
Area
Acceptable envelope of Reactive Current Injection above
shaded red area
1.0
Fault
Clearance
NOT TO SCALE
Blocking
Permitted

10
FFCI Option 2
20ms 60ms 120ms 140ms Time(s)
0.65
1.25
1.5
Reactive Current
(pu)
Forbidden
Operating
Area Acceptable envelope of Reactive Current Injection above
shaded red area
1.0
Fault
Clearance
NOT TO SCALE
Blocking
Permitted

Fault Ride Through (1)
The retained voltage at the connection point under faulted conditions is a
function of the volume of fast fault current injected at the connection point
For a solid three phase Transmission System fault, zero voltage will be
observed at the point of the fault for the duration of the fault.
For Type D plant connected at 110kV or above, the retained voltage (Uret)
would need to be set at zero volts (a mandated requirement under RfG)
For Type B – D Embedded Plant (excluding Type B Synchronous) system
studies (April 2017 GC0048 meeting) indicate requirements for a retained
voltage (Uret) of 10% if the assumptions on fast fault current injection are
made.
If Fast Fault Current Injection is not delivered in line with the proposals on
slide 8, then the retained voltage (Uret) delivered would need to be reduced
to a value in the order of 5%.
11

Fault Ride Through (2)
For Type B Synchronous Plant, the value of Uret would need to be
set to 30%. This is on the basis that small scale reciprocating plant
(ie reciprocating gas and diesel engines) would struggle to meet a
lower retained voltage for which there is no known technical
solution. It is however recognised that Synchronous Generation is
capable of supply high volumes of reactive current under fault
conditions.
The actual shape of the voltage against time curves have been
documented and discussed at previous GC0048 Workgroup
Meetings – The cost implications of these decisions are covered
later in this presentation
12

GB Type D Voltage Against Time Curve
13
Type D Synchronous Power Generating Modules
connected at ≥110kV
0.25

Voltage Against Time Parameters
14
Voltage parameters [pu] Time parameters [seconds]
Uret 0 tclear 0.14
Uclear 0.25 trec1 0.25
Urec1 0.5 trec2 0.45
Urec2 0.9 trec3 1.5
Type D Synchronous Power Generating Modules
connected at ≥110kV
Table 7.1 – Fault Ride Through Capability of Synchronous Power Generating Modules

Suggested Voltage Against Time Profile – Type C and D
15
Type C and D Synchronous Power Generating
Modules Connected <110kV
0 1.50.14
0.7
0.9
1.0
Connection
Point Voltage
(pu)
Time (s)
NOT TO SCALE
0
0.45
0.10

Voltage Against Time Parameter Ranges
16
Voltage parameters [pu] Time parameters [seconds]
Uret 0.1 tclear 0.14
Uclear 0.7 trec1 0.14
Urec1 0.7 trec2 0.45
Urec2 0.9 trec3 1.5
Type C and D Synchronous Power Generating
Modules Connected <110kV
Table 3.1 – Fault Ride Through Capability of Synchronous Power Generating Modules

GB Voltage Against Time Profile – Type B
17
Type B Synchronous Power Generating Modules
Connected <110kV
0 1.50.14
0.7
0.9
1.0
Connection
Point Voltage
(pu)
Time (s)
NOT TO SCALE
0
0.45
0.30

Voltage Against Time Parameter Ranges
18
Voltage parameters [pu] Time parameters [seconds]
Uret 0.3 tclear 0.14
Uclear 0.7 trec1 0.14
Urec1 0.7 trec2 0.45
Urec2 0.9 trec3 1.5
Type B Synchronous Power Generating Modules
Connected <110kV
Table 3.1 – Fault Ride Through Capability of Synchronous Power Generating Modules

GB Voltage Against Time Profile – Type D
Type D Power Park Modules connected ≥110kV
0 0.14
0.85
1.0
Connection
Point Voltage
(pu)
Time (s)
NOT TO SCALE
0
2.2

Voltage Against Time Parameters
20
Voltage parameters [pu] Time parameters [seconds]
Uret 0 tclear 0.14
Uclear 0 trec1 0.14
Urec1 0 trec2 0.14
Urec2 0.85 trec3 2.2
Table 7.2 – Fault Ride Through Capability of Power Park Modules
Type D Power Park Modules connected ≥110kV
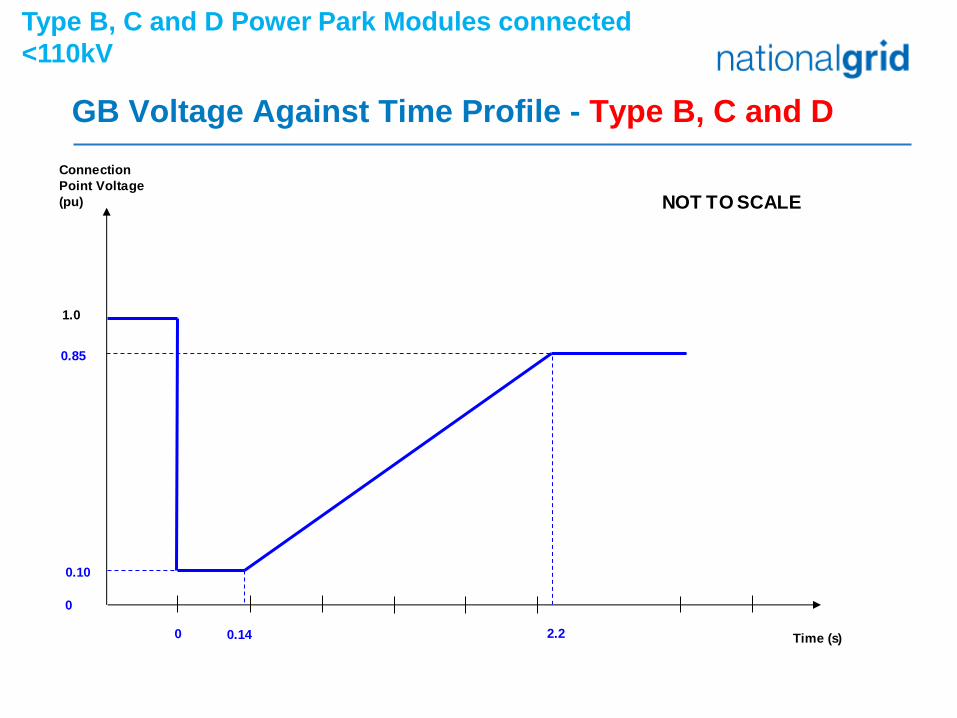
GB Voltage Against Time Profile - Type B, C and D
Type B, C and D Power Park Modules connected
<110kV
0 0.14
0.85
1.0
Connection
Point Voltage
(pu)
Time (s)
NOT TO SCALE
0
0.10
2.2

Voltage Against Time Parameters
22
Voltage parameters [pu] Time parameters [seconds]
Uret 0.1 tclear 0.14
Uclear 0.1 trec1 0.14
Urec1 0.1 trec2 0.14
Urec2 0.85 trec3 2.2
Table 7.2 – Fault Ride Through Capability of Power Park Modules
Type B, C and D Power Park Modules connected <110kV

Banding Introduction
Three banding options (high/mid/low) were discussed during
GC0048
Under RfG, NGET has to propose a set of Banding
Thresholds for the GB Synchronous Area
The banding values have a close relationship with fast fault
current injection and fault ride through requirements
Fast Fault Current Injection and Fault Ride Through
apply to Type B and above.
23

RfG Requirements / Band At A Glance
24
Technical Requirements Type
A
Type
B
Type
C
Type
D
Operation across range of frequencies • • • •
Rate of change of System Frequency (ROCOF) • • • •
Limited Frequency Sensitive Mode Over Frequency
(LFSM-O)
• • • •
Output Power with falling Frequency • • • •
Logic Interface (input port) to cease active power
production
• • • •
Conditions for automatic reconnection • • • •
Operation across range of frequencies • • • •
Ability to reduce Active Power on instruction • • •
Fault Ride Through and Fast Fault Current Injection • • •
Conditions for automatic reconnection following
disconnection
• • •
Protection and Control • • •
Operational Metering • • •
Reactive Capability • • •
Active Power Controlability • •
Frequency Response including LFSM-U • •
Monitoring • •
Robustness • •
System Restoration / Black Start • •
Simulation Models • •
Rates of Change of Active Power • •
Earthing • •
Enhanced Reactive Capability and control • •
Voltage Ranges •
Enhanced Fault Ride Through •
Synchronisation •
Excitation Performance •

National Grid Proposal for GB Banding
25
Band MW Threshold/Connection Voltage
Band A 800W – 0.99MW and connected at or below
110kV
Band B 1MW – 9.99MW and connected at or below
110KV
Band C 10MW – 49.99MW and connected at or below
110kV
Band D 50MW plus or connected at 110kV or above

Banding - Implications
For Fault Ride Through, the value of Uret proposed for
all Type B – D plant connected below 110kV (excluding
Type B Synchronous Plant) has been set to 10%.
This has been based on System Studies and assumes a
minimum fault infeed as per the FFCI proposals
For Type B Synchronous Plant the value of Uret has
been set to 30%. Note that they will be capable of
supplying a reasonable degree of fault current
Guidance from ENTSO-E has indicated that the voltage
against time parameters must be defined for each Band
26
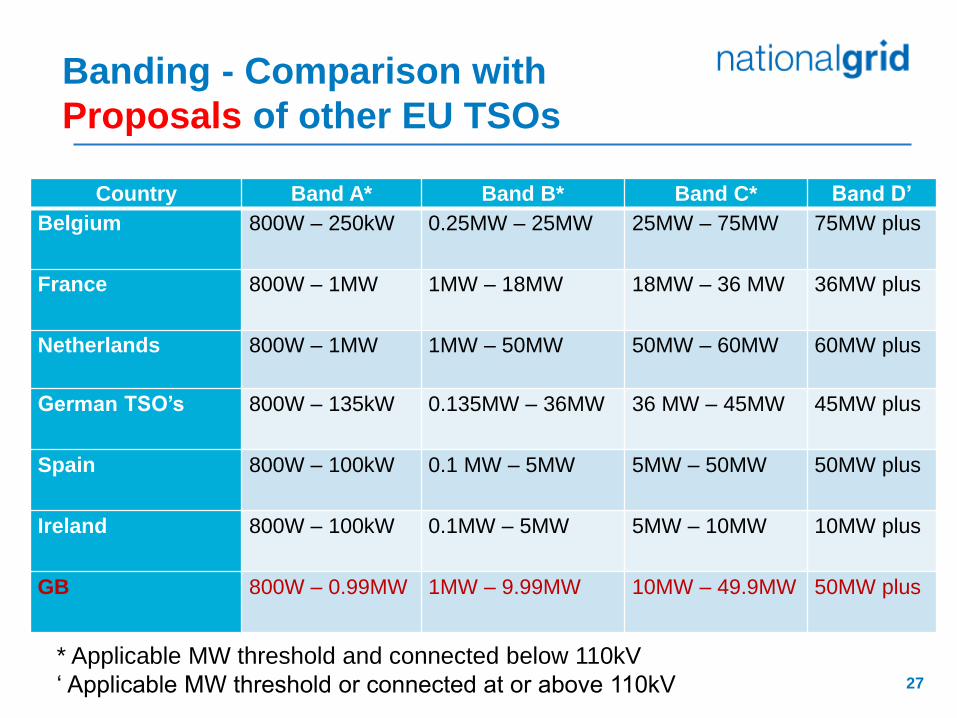
Banding - Comparison with
Proposals of other EU TSOs
27
Country Band A* Band B* Band C* Band D’
Belgium 800W – 250kW 0.25MW – 25MW 25MW – 75MW 75MW plus
France 800W – 1MW 1MW – 18MW 18MW – 36 MW 36MW plus
Netherlands
800W – 1MW 1MW – 50MW 50MW – 60MW 60MW plus
German TSO’s 800W – 135kW 0.135MW – 36MW 36 MW – 45MW 45MW plus
Spain 800W – 100kW 0.1 MW – 5MW 5MW – 50MW 50MW plus
Ireland 800W – 100kW 0.1MW – 5MW 5MW – 10MW 10MW plus
GB 800W – 0.99MW 1MW – 9.99MW 10MW – 49.9MW 50MW plus
* Applicable MW threshold and connected below 110kV
‘ Applicable MW threshold or connected at or above 110kV

Justification for NGET’s GC0100 Proposals
The intention of the EU proposals is based on the principles of non-discrimination
and transparency as well as on the principles of optimisation between the highest
overall efficiency and lowest total cost for all involved parties.
Through Stakeholder engagement we have understood technical limitations in
setting retained voltage at 30% for Band B Synchronous Reciprocating Plant)
If Converter based plant does supply reactive current in line with the FFCI
proposals, the study run in the South West has indicated that approximately 550MW
of Embedded Generation would see voltage drops of below 10% and hence trip.
This would equate to approximately £240million/ annum in additional reserve costs
alone.
Without the assumed level of FFC l, lower values of Uret would be required (0.05pu
rather than 0.1pu) and it would also place more Band B Synchronous generation at
risk from tripping at an estimated cost of £9.2million/annum in reserve costs alone.
The Studies run in the South West are believed to be representative of the wider
System – see next slide
28

29
How the South West compares to
other areas of GB
Area
GC048 study Future Of Energy documents
SCL studied 2025 (kA)
DG installed 2025 (MW)
DG studied 2025 (MW)
FES2025 max DG output (MW)
FES2025 min DG output (MW)
SOF regional SCL min (kA)
SOF regional SCL 95% confidencemin (kA)
SOF regional SCL 95% confidence max (kA)
SOF regional SCL max (kA)
1 North Scotland N/A N/A N/A 1839.5 1167.6 6.8 11.9 16.5 18.6
2 South Scotland N/A N/A N/A 2941.8 2024.4 9.5 13.1 20 21
3 North East England N/A N/A N/A 1360.6 885.4 10.8 14.4 29.3 34.1
4
North West and West Midlands N/A N/A N/A 3338.1 1990.1 0.7 5.7 21.1 22
5 East Midlands N/A N/A N/A 3540.8 2029.3 2.7 7.1 24.4 28.4
6 North Wales N/A N/A N/A 740.1 594.3 13.3 21.6 36.1 38
7
South Wales and West england N/A N/A N/A 3677.3 2300.5 6.4 9.8 26.2 30.4
8 South West England 16.3 2522.4 2411 3213 1999.7 2.4 7.3 22.1 25.9
9 East England N/A N/A N/A 3934.5 2543.1 9.1 17.4 41.5 45.6
10 Greater London N/A N/A N/A 1716 1104.4 6.2 14.2 32.4 35.7
11 South East England 23.95345696 N/A N/A 2059 1268.2 7.6 15.1 27.9 31.7

Justification for NGET’s GC0100 Proposals
Larger Synchronous Generators, eg those derived from steam, gas or
hydro turbines are not believed to suffer from these issues
A questionnaire released to GB Stakeholders in 2016 revealed there
would be no additional significant costs from a technical perspective if the
lower threshold was applied.
RfG enforces a consistent banding requirement across GB. The proposed
Banding applies capabilities currently demonstrated in the North of
Scotland across the whole GB System
The majority of European TSO’s are proposing Banding lower than the
maximum permitted under RfG
The Continental Power System is of the order of 10 times larger than the
GB System
30

Conclusions
FFCI / Fault Ride Through
Based on the study work and analysis completed National Grid
recommend the FFCI issues proposed. It is believed that the
adoption of this option will result in a saving of approximately
£240million / annum in reserve costs alone not including the wider
significant benefits of contribution to synchronising torque, fault
infeed and inertia.
The Fault Ride Through voltage against time curves are
recommended on the basis of minimum system need. These are
based on the assumption of the delivery of FFCI. Without the
proposed level of FFC l, lower values of Uret in FRT would be
required (0.05pu rather than 0.1pu)
These measures would not be retrospective and would apply to
new plant going forward.
31

Conclusions
Banding
National Grid has lodged its proposal for the GB banding (slide 24)
The relationship between FFCI / Fault Ride Through and cost has been demonstrated
Without FFCI as proposed we will need to lower the value of Uret (from 0.1pu to 0.05pu).
There is also a cost of tripping synchronous generation in a higher band (10MW – 50MW)
which would result in reserve costs alone of £9 million / annum.
Following public Stakeholder discussions Uret of 0.3pu for Band B Synchronous Plant is
proposed
The costs to which Generators are exposed for these thresholds was identified to be
negligible following the responses to the Stakeholder questionnaire held in 2016, excluding
market costs (ie BM participation costs).
Parity with European TSO proposals, particularly with regard to cross boarder trade
The proposals would apply the same technical requirements across the whole of GB
A Band B/C Threshold of 10MW would provide a greater proportion of Generation being
capable of contributing to frequency response which drives competition and reduces net
cost
System Operators will need to continue to operate a safe, secure and economic System
against a rapidly changing Generation background
RFG Mandates TSO’s to propose banding thresholds 32

Place your chosen
image here. The four
corners must just
cover the arrow tips.
For covers, the three
pictures should be the
same size and in a
straight line.
Effects of VSM / Option 1 (Grid Forming)
Convertor Control on Penetration Limits of
Non-Synchronous Generation (NSG) in the
GB Power System
Richard Ierna / Andrew Roscoe
Nov 2016 / Jun 2017
From Zero to 100% NSG using a reduced
GB model Mengran Yu
Adam Dyśko
Campbell Booth
Helge Urdal
Jiebei Zhu
Agenda (35 Minutes Total)
Future of the GB Network and Anticipated Issues
Project History and Development of Ideas
Overview of the Models and Techniques Used
Infinite Bus Model
36 Node GB Model
Technical Requirements for Grid Code
Fault Ride Through Work Group GC0048 & GC100
Other Requirements
2

High Convertor Penetration - Options
3
Solution Estimated Cost RoC
oF
Sync
Tor
que/
Pow
er
(Vol
tage
Sta
bilit
y/R
ef)
Prev
ent
Vol
tage
Col
laps
e
Prev
ent
Sub-
Sync
Osc
. /
SG C
ompi
tabl
e
Hi F
req
Stab
ility
RM
S M
odel
ling
Faul
t Le
vel
Post
Fau
lt O
ver
Vol
ts
Har
mon
ic &
Imba
lanc
e
System
Level
Maturity Notes
Constrain
Asyncronous
Generation
Hgh I Yes Yes Yes Yes Yes Yes Yes Yes Proven
Syncronous
CompensationHigh I Yes Yes Yes Yes Yes Yes Yes Yes Proven
VSM Medium Yes Yes Yes Yes Yes Yes Yes Yes P Modelled
VSM0H Low No Yes Yes No P P P Yes P Modelled
Synthetic Inertia Medium Yes No No P No No No No No Modelled
Other NG Projects Low Yes P Yes No No No P P No Theoretical
Now 2019 2019 Now 2020 Now Now 2025 2025Timescale
(Based on work by SOF team)
These technologies
are or have the
potential to be Grid
Forming / Option 1
Has the potential to
contribute but relies
on the above Solutions
Key
No
Doesn't
Resolve
Issue
P Potential
I Improves
YesResolves
Issue
With current technology/models, the system may become unstable when more
than 65% of generation is Non-Synchronous
For the FES 2Degrees, Consumer Power and Slow Progression scenarios, it is currently
forecast this level could be exceeded for 800-1800Hrs p.a. in 2023/24 and for 2100-
2750Hrs p.a.in 2026/27.

2013 Studies – Only 9/26 high NSG scenarios ok
4
NSG
0 Import HVDC 3GW Import HVDC 0 Import HVDC
0 Export HVDC 10GW Export HVDC 10GW Export
HVDC
Load (GW) Load (GW) Load (GW)
40 35 30 40 35 30 40 35 30
Low OK OK OK OK OK OK
Mid OK OK OK
High N/A
36 Node Reduced GB Network for 2030
Exporting HVDC
Importing
HVDC
Double Circuit
Fault & Trip
NSG is 8GW Solar +
Low: 16.0GW Wind
Mid: 20.5GW Wind
High: 28.5GW Wind
Green cells ok in 2013
Grey cells produced HF
instability

2013 Results
5
2013 – Stable Result
2013 – Unstable Result
NSG
0 Import HVDC 3GW Import HVDC 0 Import HVDC
0 Export HVDC 10GW Export HVDC 10GW Export
HVDC
Load (GW) Load (GW) Load (GW)
40 35 30 40 35 30 40 35 30
Low OK OK OK OK OK OK
Mid OK OK OK
High N/A

Step 1 – Add Synthetic Inertia (SEBIR)
6
Anticipated Outcome:
Improves RoCoF
A – Solves the problem
B – Higher % NSG before instability occurs
C – Has no effect
Actual Outcome:
Improves RoCoF
D – Makes the system more unstable in some circumstance
1
1+st
st
1+st F K dP Added to Power
Reference
Transducer
Delay Differentiator
df/dt
Max P
Min P

Step 2 – Implement Virtual
Synchronous Machine Zero Inertia (VSM0H)
7
~
VSM0H
Commonly used in Marine Industry & Micro Grids
Provides stable control & 100% NSG possible
Voltage Source Convertor with no PLL
Droop Frequency and Voltage Control
For 100% Convertor Network with zero inertia, a load step
change results in a frequency change which occurs in one AC
cycle (assuming BOXCAR measurements taken over one
cycle)
MATLAB Model used to evaluate
VSM0H stability limit

IGBTOutput Stage
Current Limiter(Normally
passive and has no effect on
voltage signals)
Three phase waveform generator
Frequency
PWM
VoltageVb
Va
Vc
Vb
Va
Vc
ConnectionTo Grid
3 Phase VSM Convertor Output Stage
Pulse signals to IGBTs
Filter Reactors
Step 3 – Implement Virtual
Synchronous Machine (VSM)
8
Changes for VSM
1. Simulate inertia
2. Reduce the bandwidth of F and
V to 5Hz
Disadvantages
1. Requires additional energy
2. Possibility of traditional power
system instability
Advantages (main)
1. Contributes to RoCoF
2. Compatible with SG
3. Reduced interaction and HF
instability risks
4. Can be modelled in RMS system
studies
3 Phase VSM / VSM0H Output Stage
Both VSM & VSM0H use
similar output stages

Step 4 / 5 – Implement VSC in the
GB Model / Build an Infinite Bus Model
Step 4 – Change some convertors in the 36 node model
to VSC without dynamic controls
Fixed the problem with high frequency instability
However this isn’t really representative as its equivalent
to connecting an infinite bus at multiple point through out
the model
Step 5 – Build a small M/C model and prove it swings /
behaves like a synchronous machine model
This established that it was possible to model a voltage
source convertor which behaved like a synchronous
machine
9

Key Features of the Option 1
Convertor Controller
Similar voltage step response
Without dynamic breaking, swings like SG.
Can it ride through 500ms Distribution Faults?
Provides inertial response to df/dt
Similar frequency sweep characteristic
Provides immediate energy input without needing to
measure changes in volts, power or reactive power
10

Step 6 – Put the VSM model
into the 36 Node Network
Demonstrate Option 1 (VSM / GF):
Stabilises the system
That convertors can temporarily come out of VSM mode
under overload conditions
Network impedances limit the effect of VSM overload
propagating across the network and therefore
Supports RoCoF & LFDD Relays
The above provides Network Operators the potential to
manage the key differences between Option 1 (VSM /
GF) and conventional synchronous machines using
RMS models. 11

2016 Studies – All high NSG scenarios stable
12
NSG
0 Import HVDC 3GW Import HVDC 0 Import HVDC
0 Export HVDC 10GW Export HVDC 10GW Export
HVDC
Load (GW) Load (GW) Load (GW)
40 35 30 40 35 30 40 35 30
Low
1%
60%
10%
25%
69%
10%
25%
80%
1%
54%
1%
60%
10%
68%
1%
48%
1%
15%
53%
1%
60%
Mid
5%
25%
73%
5%
83%
10%
97%
1%
64%
10%
25%
71%
10%
80%
1%
58%
1%
20%
64%
10%
73%
High
15%
97%
20%
30%
103%
N/A 10%
80%
10%
89%
15%
35%
100%
10%
25%
74%
10%
82%
10%
30%
93%
36 Node Reduced GB Network for 2030
Exporting HVDC
Importing
HVDC
Double Circuit
Fault & Trip
NSG is 8GW Solar +
Low: 16.0GW Wind
Mid: 20.5GW Wind
High: 28.5GW Wind
Green cells ok in 2013
All cells now ok with VSM
% of NSG which is VSM
10% VSM for stability
30% VSM for low noise
93% NSG (7%SG)
With VSM all scenarios are
stable & 100% NSG is possible

13
Typical results from 2016 studies
MW
MW
Time (s)
Time (s)
2016 – Stable Noisy Result
2016 – Stable Clean Result
Zone 1 MW
Zone 1 MW
Zone 25 MW & MVAr
Zone 25 MW & MVAr
NSG
0 Import HVDC 3GW Import HVDC 0 Import HVDC
0 Export HVDC 10GW Export HVDC 10GW Export
HVDC
Load (GW) Load (GW) Load (GW)
40 35 30 40 35 30 40 35 30
Low
1%
60%
10%
25%
69%
10%
25%
80%
1%
54%
1%
60%
10%
68%
1%
48%
1%
15%
53%
1%
60%
Mid
5%
25%
73%
5%
83%
10%
97%
1%
64%
10%
25%
71%
10%
80%
1%
58%
1%
20%
64%
10%
73%
High
15%
97%
20%
30%
103%
N/A 10%
80%
10%
89%
15%
35%
100%
10%
25%
74%
10%
82%
10%
30%
93%
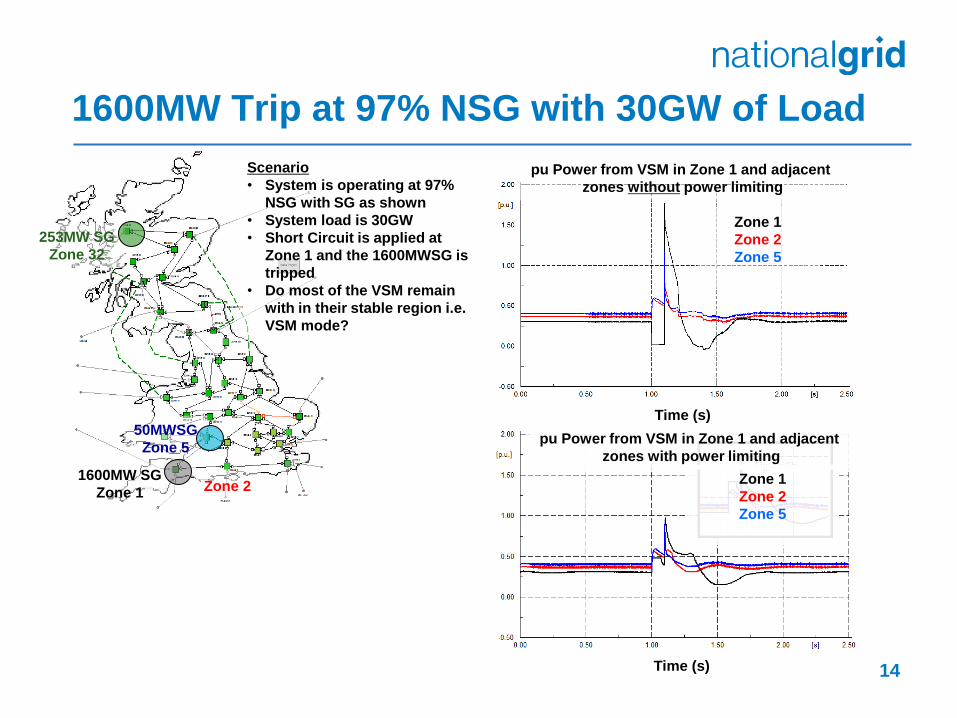
1600MW Trip at 97% NSG with 30GW of Load
14
1600MW SG
Zone 1
50MWSG
Zone 5
Zone 2
253MW SG
Zone 32
Time (s)
Time (s)
Scenario
• System is operating at 97%
NSG with SG as shown
• System load is 30GW
• Short Circuit is applied at
Zone 1 and the 1600MWSG is
tripped
• Do most of the VSM remain
with in their stable region i.e.
VSM mode?
pu Power from VSM in Zone 1 and adjacent
zones without power limiting
Zone 1
Zone 2
Zone 5
pu Power from VSM in Zone 1 and adjacent
zones with power limiting
Zone 1
Zone 2
Zone 5

System Islanding at 93% NSG with 40GW load
15
Scenario
• System is operating at 93% NSG
• System load is 40GW
• Short circuit is applied to AC
interconnection
• Loss of AC interconnection
between exporting Area 1 and
importing Area 2
• Does LFDD work?
pu Power from VSM (all zones) without power limiting
pu Power from VSM (all zones) with power limiting Area
1
Area
2
CC.6.3.7 and CP.A.3.6

Steady State Capability
+0.95 Lead/Lag at 100% Rated Power
Red region applicable to storage and
HVDC only
Many requirements in this region taking
from existing Class 1 requirements
16
+MVAr -MVAr
+MW
-MW (Storage Only)
Extended Capability
Available for 20Secs
Harmonics & Imbalance as GBGC
CC6.1.5, CC6.1.6 & CC6.1.7
1.33pu Rated Power (33% on rated
power > current operating point)
1.5pu current (on rated MW)
+MVAr
+MW
-MVAr
Requirement Proposal for Option 1
(Grid Forming Convertors - Initial Thoughts)
-MW (Storage Only)
Please Note: Values (e.g. 1.33pu) quoted in these or the following slides are based on the preliminary studies
presented here but maybe subject to change if further studies indicate changes are required.

Requirement Proposal for Option 1
(Grid Forming Convertors - Initial Thoughts)
Should behave like a balanced 3ph voltage source behind a constant impedance over
the 5Hz to 1kHz band
Rate of change of frequency should be limited by an equivalent inertia of H=2 to 7s on
rated power
Rapid change to the phase voltages (V), frequency (F) and phase angle in the >5Hz
Band are not permitted whilst the operating point remains within the extended
capability zone
Harmonics and / or unbalanced currents will be as GB Grid Code CC6.1.5, CC6.1.6 and
CC6.1.7. If the levels stated are exceeded they may be reduced by adjusting the wave
shape or phase voltages. The speed at which this occurs may depend on the level.
Dynamic performance requirements similar to those for GB Grid Code Connection
Conditions Appendix 6
17
V
1 or
3ph
Inertia
Simulation X=10% (typ.)
Could be:
Filter X
Local XT
or Software Simulation
Field
Simulation
Speed / Power
Regulator
Voltage / Reactive
Power Regulator
V
F
Step up XT
(N/A to micro
generation)
Point of
Connection U E

Operation Outside Extended Zone
If the extended capability zone is breached the device may rapidly reduce real or
reactive power, volts or current by reducing pulse width, phase angle, frequency,
volts etc. to bring the device back within but not below the extended rating (for
20secs) then normal rating.
It is anticipated that operation within the extended rating would be followed by
operation at less than the previous rating allowing recharging of storage and
cooling of power components and that extended rating would be available again
after this period. Subsequent cycles would be available on a continuous on going
basis provided that on average the device has only operated at full rating.
Fast Fault Current Injection and Fault Ride Through for Convertors is currently
being discussed in Grid Code (GC0048 / GC100) RfG / HVDC Implementation
formal working group and can be followed through that forum.
18
Requirement Proposal for Option 1
(Grid Forming Convertors - Initial Thoughts)

Under GB RfG adoption, it is necessary to augment the existing Grid
Code definition of current injection. EU RfG requirements drive more
robust specification of NSG to address the trends described in the SOF:-
SOF (System Operability Framework – see National Grid website) illustrates extent
of short circuit level decline and its impact upon stability, the ability of generation to
ride through faults and for network protection to operate.
Our studies illustrate the importance of new forms of replacement fault injection to
support proposed fault ride through curves which address the issue today. This can
be delivered by traditional convertor design choices, to ensure current injection is
maximised and not out of phase but relies on a population of Grid Forming
Generation.
However, our studies also illustrate that in order to ensure that across the next 8
years the capability to support fault ride through and voltage against time
performance does not degrade, grid forming capability is required from 1st January
2021 onwards. This is the “FFCI Option 1” requirement - requiring a short term
1.5p.u. capability and an equivalent inertia of at least 2-7MWs/MVA (for 20s)
operating against the principles of VSM as discussed.
19
FFCI Option 1 for RfG implementation

Conclusions
Implementation of VSM requires additional energy
source e.g. storage or operate with headroom
A higher percentage of VSM convertors results in
greater stability and reduces the additional energy /
storage requirement for each VSM
VSM is about power management on a millisecond
timescale – Network operators must ensure enough
resource is dispatched so that the majority of devices
remain in VSM mode
Next Step – Develop VSM to proof of concept
20

References
21
A. Roscoe, M. Yu, R. Ierna, H. Urdal, A. Dyśko, et al., " A VSM (Virtual Synchronous Machine) Convertor
Control Model Suitable for RMS Studies for Resolving System Operator / Owner Challenges " in 15th Wind
Integration Workshop, Vienna, 2016.
R. Ierna, A. Roscoe, M. Yu, H. Urdal, A. Dyśko, et al., "Effects of VSM Convertor Control on Penetration
Limits of Non-Synchronous Generation in the GB Power System," in 15th Wind Integration Workshop,
Vienna, 2016.
H. Urdal, R. Ierna, J. Zhu, C. Ivanov, A. Dahresobh, et al., "System strength considerations in a converter
dominated power system," IET Renewable Power Generation, 2015.
M. Yu, A. J. Roscoe, A. Dyśko, C. D. Booth, R. Ierna, et al., "Instantaneous Penetration Level Limits of Non-
Synchronous Generation in the British Power System," IET Renewable Power Generation, 2016.
M. Yu, A. Dyśko, C. Booth, A. J. Roscoe, J. Zhu, et al., "Investigations of the Constraints relating to
Penetration of Non-Synchronous Generation (NSG) in Future Power Systems," in Protection, Automation &
Control World Conference (PACWorld), Glasgow, UK, 2015.
M. Yu, A. Dysko, A. J. Roscoe, C. Booth, R. Ierna, et al., "Effects of Swing Equation-Based Inertial Response
(SEBIR) Control on Penetration Limits of Non-Synchronous Generation in the GB Power System," in IET
Renewable Power Generation (RPG), Beijing, China, 2015.
M. Yu, A. J. Roscoe, C. Booth, A. Dysko, R. Ierna, et al., "Use of an Inertia-less Virtual Synchronous Machine
within Future Power Networks with High Penetrations of Converters," in 19th Power Systems Computation
Conference (PSCC), Genoa, Italy, 2016.