Embed Size (px)
Citation preview
i
BACKGROUND MUSIC, MOOD, PERSONALITY, WORK
BEHAVIOUR AND PERFORMANCE OF GARMENT
MANUFACTURING FACTORIES AT ATHI RIVER EXPORT
PROCESSING ZONE IN KENYA
VIRGINIA NAMUBI ONYARA
A THESIS SUBMITTED IN PARTIAL FULFILLMENT OF THE
REQUIREMENTS FOR THE AWARD OF DEGREE OF DOCTOR OF
PHILOSOPHY IN BUSINESS ADMINISTRATION, SCHOOL OF BUSINESS,
UNIVERSITY OF NAIROBI
2018
ii
DECLARATION
I declare that this thesis is my original work and has not been submitted to any college,
institution or university other than the University of Nairobi for academic credit.
Signature: ……………………………… Date: ………………………………
Virginia Namubi Onyara
D80/62081/2013
This thesis has been submitted for examination with our approval as the University
Supervisors.
Signature: ……………………………… Date: …………………………………
Prof. Peter K’Obonyo
Department of Business Administration, School of Business
University of Nairobi
Signature: ……………………………… Date: …………………………………
Prof. Martin Ogutu
Department of Business Administration, School of Business
University of Nairobi

iii
DEDICATION
I dedicate this work to my dear husband Dr. Geoffrey Chemwa and my loving children
Cecilia, Seth and Bradley, for their love, encouragement and for giving me a reason to
work hard in my studies to the end. I also dedicate this great work to my late father,
Onyara Asuru and my loving mother, Agatha Onyara, for their prayers and support; my
brothers Asuru, Erukan and Okoba for believing with me that everything is possible in
Christ Jesus and my sisters Khainja, Amusolo, Nambuya, Ashepet, Kukucha, Ajilong and
the late Amukode for being there when I needed each one of them or any of their
children.

iv
ACKNOWLEDGEMENT
I am highly grateful to the Almighty God for His favour and blessings that continue to
overflow in my life, and because of Him I made it against all odds. With great pleasure I
would like to acknowledge the support, assistance and contributions made by my
supervisors, Prof. Peter K’Obonyo and Prof. Martin Ogutu of the University of Nairobi,
School of Business from the conception stage of this study to its finality. I drew wisdom
from Prof. K’Obonyo’s wise counsel; he stung my mind with creative ideas when I got
stuck several times and held my feeble arms through to the end. I am also grateful to
Prof. Ogutu for his ideas, inspiration and assurance that all shall be well. Indeed, the two
Professors stood with me through thick and thin, making it possible for me to complete
my thesis as scheduled. I also remember and appreciate the late Prof. Nzuve for his
guidance during the early stages of the proposal development.
I would also like to acknowledge the entire Doctoral Coordination Office at the School of
Business for the support accorded to me. I would like to specifically thank Prof. Yabs,
Dr. Okiro and Dr. Musyoki for their contribution during my departmental, open forum
and doctoral presentations. I also acknowledge my colleague, Dr. Medina Twalib, and
others for their support and encouragement. A lot of gratitude also goes to the EPZ, Athi
River Management for allowing me to carry out my studies in their factories. My
appreciation also goes to my colleagues at the Multimedia University of Kenya and
specifically the Printing Press and the Research and Innovation department.
Last but not least, I acknowledge with gratitude the unwavering support I received and
continue to receive from my husband, Dr. Chemwa, and my children: Cecilia, Seth and
Bradley; my mother, Agatha; my mother-in-law, Grace; my father-in-law, Hezron and
my sisters and brothers for their moral support and prayers. To every single person who
stood with me, you are greatly appreciated.

v
TABLE OF CONTENT
DECLARATION.................................................................................................................... ii
DEDICATION....................................................................................................................... iii
ACKNOWLEDGEMENT .................................................................................................... iv
LIST OF TABLES ................................................................................................................. x
LIST OF FIGURES ............................................................................................................ xiii
ABBREVIATIONS AND ACRONYMS ........................................................................... xiv
DEFINITION OF TERMS.................................................................................................. xv
ABSTRACT ......................................................................................................................... xvi
CHAPTER ONE: INTRODUCTION .................................................................................. 1
1.1 Background of the Study ................................................................................................... 1
1.1.1 Background Music ................................................................................................. 3
1.1.2 The Concept of Mood .............................................................................................. 4
1.1.3 The Concept of Personality .................................................................................... 5
1.1.4 Work Behaviour ..................................................................................................... 7
1.1.5 Employee Performance .......................................................................................... 8
1.1.6 Tailoring Firms at the Athi River Export Processing Zone, Kenya ....................... 9
1.1.7. Tailors at the Factories in Athi River Export Processing Zone, Kenya ............... 10
1.2 Research Problem ............................................................................................................ 11
1.3 Research Objectives ......................................................................................................... 15
1.3.1 General Objective .................................................................................................. 15
1.3.2 Specific Objectives ................................................................................................ 15
1.4 Value of the Study ........................................................................................................... 16
CHAPTER TWO: LITERATURE REVIEW ................................................................... 17
2.1 Introduction ...................................................................................................................... 17
2.2 Theoretical Foundation .................................................................................................... 17
2.2.1 Structural Evocation Theory ................................................................................ 17
2.2.2 Eysenck’s Personality Theory.............................................................................. 18
2.2.3 The Theory of Planned Behaviour ......................................................................... 19
2.2.4 James–Lange Theory of Emotion .......................................................................... 20
2.3 Background Music and Employee Performance .............................................................. 21
vi
2.4 Background Music, Mood and Employee Performance .................................................. 22
2.5 Background Music, Personality and Employee Performance .......................................... 23
2.6 Background Music, Work Behaviour and Employee Performance ................................. 25
2.7 Background Music, Mood, Personality, Work Behaviour, and Employee
Performance ..................................................................................................................... 26
2.8 Summary of Gaps in Knowledge ..................................................................................... 30
2.9 Conceptual Framework .................................................................................................... 34
2.10 Research Hypotheses .................................................................................................... 35
CHAPTER THREE: RESEARCH METHODOLOGY .................................................. 36
3.1 Introduction ...................................................................................................................... 36
3.2 Research Philosophy ........................................................................................................ 36
3.3 Research Design............................................................................................................... 37
3.4 Population of the Study ................................................................................................... 38
3.5 Sample Design ................................................................................................................. 39
3.6 Data Collection ................................................................................................................ 39
3.6.1 Background Music ............................................................................................... 40
3.6.2 Mood of the Respondents .................................................................................... 40
3.6.3 Personality of Participants ................................................................................... 42
3.6.4 Employee Work Behaviour .................................................................................. 43
3.6.5 Employee Performance ........................................................................................ 44
3.6.6 Experimental Procedures ....................................................................................... 45
3.7 Diagnostic Tests ............................................................................................................... 48
3.7.1 Test of Validity ...................................................................................................... 48
3.7.2 Test of Reliability .................................................................................................. 49
3.7.3 Test of Multicolinearity ......................................................................................... 49
3.7.4 Test of Heteroscedasticity ..................................................................................... 50
3.7.5 Test of Linearity .................................................................................................... 50
3.7.6 Test of Normality................................................................................................... 50
3.8 Measures of Variables...................................................................................................... 51
3.9 Data Analysis ................................................................................................................... 53
vii
CHAPTER FOUR: PRELIMINARY DATA ANALYSIS AND FINDINGS ................ 57
4.1 Introduction ...................................................................................................................... 57
4.2 Descriptive Statistics ........................................................................................................ 57
4.2.1 Response Rate........................................................................................................ 57
4.2.2 Preferred Background Music Survey .................................................................... 59
4.2.3 Mood of the Respondents ...................................................................................... 64
4.2.4 Personality of the Respondents .............................................................................. 69
4.2.5 Work Behaviour .................................................................................................... 70
4.2.6 Employee Performance .......................................................................................... 78
4.3 General Information of the Respondents ......................................................................... 80
4.3.1 Age of the Respondents ......................................................................................... 80
4.3.2 Gender of the Respondents .................................................................................... 81
4.3.3 Number of Years Worked at EPZ Factory ............................................................ 83
4.3.4 Enjoyment of Work ............................................................................................... 83
4.3.5 Health Breaks at Work .......................................................................................... 84
4.3.6 Relationship with Colleagues .............................................................................. 85
4.3.7 Relationship with Supervisor ............................................................................... 86
4.3.8 Productivity of the Respondents .......................................................................... 86
4.3.9 Listening to Music ............................................................................................... 87
4.3.10 Type of Music Preferred ................................................................................. 88
4.3.11 Reason for Listening to Music ........................................................................ 89
4.3.12 Listening to Music at Work ............................................................................ 90
4.3.13 Advice to Management on Listening to Music ............................................... 91
4.4 Test of Validity ................................................................................................................ 92
4.5 Test of Reliability ............................................................................................................ 92
4.6 Diagnostic Tests on the Study Variables ......................................................................... 93
4.6.1 Test of Multicollinearity ........................................................................................ 93
4.6.2 Test of Heteroscedasticity ..................................................................................... 94
4.6.3 Test of Linearity ................................................................................................... 94
4.6.4 Test of Normality ................................................................................................. 95
viii
CHAPTER FIVE: TEST OF HYPOTHESES, RESULTS AND DISCUSSION ........... 98
5.1 Introduction ...................................................................................................................... 98
5.2 Comparative Analysis of Performance of the Three Factories ........................................ 98
5.3 Test of Hypotheses ......................................................................................................... 100
5.3.1 Background Music and Employee Performance ................................................. 101
5.3.2 Employee’s Mood Mediates the Relationship between Background Music
and Employee Performance ............................................................................... 103
5.3.3 The Effect of Personality on the Relationship between Background Music
and Employee Performance ............................................................................... 113
5.3.4 The Influence of Work Behaviour on the Relationship between Background
Music and Employee Performance .................................................................... 120
5.3.5 The Joint Effect of Background Music, Employee Mood, Work Behaviour
and Personality on Employee Performance ....................................................... 126
5.4 Discussion of the Research Findings ............................................................................. 128
5.4.1 The Effect of Background Music on Employee Performance ........................... 129
5.4.2 Background Music, Employees Mood and Employee Performance ................... 132
5.4.3 Background Music, Personality, and Employee Performance ............................ 134
5.4.4 Background Music, Work Behaviour and Employee Performance .................... 136
5.4.5 Joint Effect of Background Music, Mood, Work Behaviour and Personality on
Employee Performance ...................................................................................... 137
CHAPTER SIX: SUMMARY, CONCLUSION AND RECOMMENDATIONS ........ 138
6.1 Introduction .................................................................................................................... 138
6.2 Summary of the Findings ............................................................................................... 138
6.2.1 Background Music and Employee Performance ................................................. 138
6.2.2 Background Music, Employee Mood, and Employee Performance ................... 140
6.2.3 Background Music, Personality, and Employee Performance ............................ 140
6.2.4 Background Music, Work Behaviour and Employee Performance ................... 141
6.2.5 Joint Effect of Background Music, Mood, Personality and Work Behaviour
on Employee Performance ................................................................................. 141
6.2.6 Summary of Objectives, Hypotheses and the Findings ....................................... 141
6.3 Conclusion ..................................................................................................................... 143

ix
6.3.1 Effect of Background Music on Employee Performance .................................... 143
6.3.2 The Role of Employees’ Mood In the Relationship between Background
Music and Employee Performance .................................................................... 144
6.3.3 Effect of Personality on the Relationship between Background Music and
Employee Performance ...................................................................................... 144
6.3.4 Influence of Work Behaviour on the Relationship between Background
Music and Employee Performance .................................................................... 145
6.3.5 Joint Effect of Background Music, Mood, Work Behaviour and Personality
on Employee Performance ................................................................................. 145
6.4 Recommendations .......................................................................................................... 146
6.4.1 Installation of Background Music Infrastructure in Factories ............................. 146
6.4.2 Familiarity With and Preference of Background Music ...................................... 146
6.5 Contribution to Knowledge, Practice and Policy ........................................................... 147
6.5.1 Contribution to Knowledge and Theory ............................................................. 147
6.5.2 Contribution to Practice ....................................................................................... 149
6.5.3 Contribution to Policy ......................................................................................... 149
6.6 Limitation of the Study .................................................................................................. 149
6.7 Areas for Further Research ............................................................................................ 150
REFERENCES ................................................................................................................... 153
APPENDICES .................................................................................................................... 160
Appendix 1: Rentfrow and Gosling Preferred Music Checklist ......................................... 160
Appendix 2: Eysenck Personality Inventory (EPI) .............................................................. 161
Appendix 3: Observation Data Sheet ................................................................................... 164
Appendix 4: Research Administered Questionnaire ............................................................ 165
Appendix 5: List of EPZ Garment factories ........................................................................ 168
Appendix 6: Communication with EPZA ............................................................................ 170
Appendix 7: Sample Size Table ........................................................................................... 171
Appendix 8: Data on mood per respondent per day ............................................................ 173
Appendix 9: Data on Work Behaviour ................................................................................ 181
Appendix 10: Factory Data Study Variables ....................................................................... 205

x
LIST OF TABLES
Table 2.1: Type of Background Music and Related Tasks .................................................... 29
Table 2.2: Summary of Gaps in Knowledge .......................................................................... 31
Table 3.1: Operationalisation of Variables ............................................................................ 52
Table 3.2: Data Statistical Analysis Specification ................................................................. 54
Table 4.1: Response Rate ....................................................................................................... 58
Table 4.2: Reflective and Complex Music ............................................................................ 59
Table 4.3: Intense and Rebellious Music ............................................................................... 60
Table 4.4: Upbeat and Conventional Music .......................................................................... 61
Table 4.5: Energetic and Rhythmic Music ............................................................................ 63
Table 4.6: Participants’ Mood in Factory One....................................................................... 65
Table 4.7: Participant’s Mood in Factory Two ...................................................................... 67
Table 4.8: Participant’s Mood in Factory Three .................................................................... 68
Table 4.9: Distribution of The Respondents by Personality Types ....................................... 69
Table 4.10: Work Behaviour in Factory One ......................................................................... 71
Table 4.11 Work Behaviour in Factory Two ......................................................................... 73
Table 4.12: Work Behaviour in Factory Three ...................................................................... 75
Table 4.13: Work Behaviour of Participants in Each Factory ............................................... 76
Table 4.14: Work Behaviour of Participants Per Factory ...................................................... 78
Table 4.15: Employee Performance ....................................................................................... 79
Table 4.16: Age of the Respondents ...................................................................................... 81
Table 4.17: Distribution of Respondents by Gender ............................................................. 82
Table 4.18: Number of Years Worked at the EPZ Factory .................................................... 83
Table 4.19: Work Enjoyment ................................................................................................. 84
Table 4.20: Having Health Breaks at Work ........................................................................... 84
Table 4.21: Relationship with Colleagues ............................................................................. 85
Table 4.22: Relationship with Supervisor .............................................................................. 86
Table 4.23: Productivity of the Respondents ......................................................................... 87
Table 4.24: Love Listening to Music ..................................................................................... 87
Table 4.25: Type of Music Preferred ..................................................................................... 88
Table 4.26: Reason for Listening to Music ............................................................................ 89
xi
Table 4.27: Listening to Music at Work ................................................................................ 90
Table 4.28: Advice to Management on Listening to Music................................................... 91
Table 4.29: Test of Reliability ............................................................................................... 92
Table 4.30: Test of Multicollinearity ..................................................................................... 93
Table 4.31: Test of Heteroscedasticity................................................................................... 94
Table 4.32: Results of the Test of Normality of the data in respect of each Variable ........... 95
Table 4.33: Results of KS-SW Test for Normality ................................................................ 97
Table 5.1: T-test Results for Mean Performance Differences Between Factories ................ 99
Table 5.2: Model Summary of the Findings on the Effect of Background Music on
Employee Performance ......................................................................................... 102
Table 5.3: Regression Results for the Effect of Background Music on Employee
Performance .......................................................................................................... 105
Table 5.4: Results of Regression Analysis for the Effect of Background Music on
Employee Mood .................................................................................................... 107
Table 5.5: Results of Regression Analysis for the effect of Mood on Employee
Performance .......................................................................................................... 109
Table 5.6: Results of Multiple Regression Analysis for the Effect of Background Music
and Mood on Employee Performance................................................................... 111
Table 5.7: Results of Regression Analysis on the Relationship Between Background
Music and Employee Performance ....................................................................... 114
Table 5.8: Result of Regression Analysis for the Effect of Background Music and
Employee Personality on Employee Performance ................................................ 116
Table 5.9 Results of Regression Analysis for Moderating Effect of Personality on the
Relationship Between Background Music and Employee Performance .............. 118
Table 5.10: Results of Regression Analysis for the Effect of Background Music on
Employee Performance ......................................................................................... 121
Table 5.11: Results of the Regression Analysis for the Effect of Employee Work
Behaviour on the Relationship between Background Music and Employee
Performance .......................................................................................................... 123
Table 5.12: Results of Regression Analysis for Moderating Effect of Work Behaviour on
the Relationship between Background Music and Employee Performance ......... 125

xii
Table 5.13: Multiple Regression Results Depicting Joint Effect of Background Music,
Mood, Work Behaviour and Personality on Employee Performance ................... 127
Table 6.1: Table Summary of Findings ............................................................................... 142
xiii
LIST OF FIGURES
Figure 2.1: Conceptual Framework ....................................................................................... 34
Figure 3.1: The Circumplex Model of Affect.. ...................................................................... 41
Figure 3.2: Personality Quadrant ......................................................................................... 43

xiv
ABBREVIATIONS AND ACRONYMS
AGOA Africa Growth and Opportunity Act
EPZ Export Processing Zone
EPZA Export Processing Zone Authority
HR Human Resource
HRM Human Resources Management
K-S Kolmogorov Smirnov
TPB Theory of Planned Behaviour
US United States of America
VAT Value Added Tax
xv
OPERATIONAL DEFINITION OF TERMS
Background music Music that is passively listened to while the listener is performing
a primary duty
Mood Participants internal state of feeling when listening to music
Personality Traits that determine ones affective and cognitive domains that
eventually affect how they perform duties and how they generally
behave.
Work behaviour Participants behaviour at work
Work Performance Quality and quantity of work produced by the employees
Preferred Music Music type desired by the participant

xvi
ABSTRACT The general objective of this study was to determine the role of background music, mood,
personality, work behaviour and performance of tailoring workers at the EPZ in Athi River,
Kenya. The specific objectives were to establish the effect of background music on employee
performance, determine whether employee’s mood mediates the relationship between
background music and employee performance, establish the effect of personality on the
relationship between background music and employee performance, establish the influence
of work behaviour on the relationship between background music and employee performance
and to establish whether the joint effect of background music, mood, work behaviour and
personality on employee performance is greater than the effect of background music on
employee performance. The study was based on the fact that there is little known knowledge
about the effects of listening to background music in a factory set-up. It was anchored on
structural evocation theory, Eysenck personality theory, theory of planned behaviour and
James-Lange theory of emotions. It study adopted the positivist approach in conducting
research since it operationalises concepts like background music, personality, work behaviour
and employee performance to enable the use of quantitative data to test the research
hypotheses drawn from the conceptual framework. The study was conducted in a natural
work setup. The design was a field experiment. The study population was the 3 garment
factories at the EPZ, Athi River. The study used systematic sampling design to come up with
a representative sample. From a population of 4500, 357 estimated sample size was used for
the study. 357 were divided by 3 to get a total of 119 tailors per factory. A systematic
sampling procedure was used to obtain 119 tailors from each factory. This was done by
listing all the 119 respondents for each factory and selecting every 12th. In the first factory,
music was played throughout the day while in the second factory music was played on and
off and in the third factory it was not played at all. The purpose of the variation was to assess
the effect music has on performance at different times of the day. Diagnostic tests done
included tests of validity, reliability, multicollinearity, heteroscedasticity, linearity and
normality. The results were consistent with the assumptions of regression analysis. A
descriptive analysis of the study shows that background music, mood, personality and work
behaviour had an effect on performance of tailoring workers. T test done indicated that mean
performance for factory 1 and 2 was significantly different from that of factory 3. Linear
regression analysis done for hypothesis 1 indicated that the relationship between background
music and employee performance was moderately strong for factory 1 (R=0.503) and weak
for factory 2 (R = 0.146). Path Analysis proposed by Baron and Kenny was used for H2,
results indicated that mood mediated the relationship between background music and
employee performance (R2 = 0.562 for factory 1 and R2 =0.108 for factory 2). Three step
regression analysis was used to analyse H3 and H4. Results indicated that personality
moderated the relationship between background music and performance (R2 = 0.576 for
factory 1 and R2=0.119 for factory 2) while work behavior did not moderate the relationship
between background music and employee performance (R2 =0.314 for factory 1 and R2=0.0.1
for factory 2). The joint effect of all the predictor variables was greater than the individual
effect of background music on employee performance. Multiple regression analysis for H5
indicate R =0.753 and R2 =0.567 for factory one and R =0.384 and R2=0.148 for factory two.
The study therefore concludes that the effect of background music on employee performance
is not direst but is through employee mood and that, that relationship is moderated by
personality

1
CHAPTER ONE
INTRODUCTION
1.1 Background of the Study
Creating a good working environment for employees is primarily the responsibility of the
Human Resource (HR) department. For example, workers in a tailoring factory who tend
to do repetitive tasks have set targets of how many pieces in terms of quality and quantity
an employee should produce per day. In such factories where high quality products are
expected from the worker and the targets have been set, the HR department needs to
ensure that employees are energized, motivated, relaxed and given relevant support to be
able to perform beyond the expectations of the organisation. Research (Lesiuk, 2005) has
shown that background music can be used as a managerial tool to increase productivity of
employees.
Human beings have always worked; similarly human beings have always made music.
Human activities are characterised by music; restaurants, banks, supermarkets, hospitals
and even offices play music to accompany their daily activities. Researches on different
uses of music in life have been done. For example, Chamorro-Premuzic (2014), in his
analysis of uses of music, believes that background music has three functions: to enhance
performance of tasks, to influence the type of mood in individuals and to boost their
thinking ability. This position is supported by Shek and Schubert (2009), North and
Hargreaves (1999) and Lesiuk (2005) who have also demonstrated that background
music is a significant factor in determining how employees perform their duties at work.

2
When a person is employed to work in an organisation, they carry with them their
personalities, intelligence, skills, attitude and other traits which eventually affect their
productivity, creativity and performance. Competition for talent in the job market,
marketplace needs, gender balance and the changing work environment requires varied
workforce (Gordon, 2002) to be able to perform and compete with relevant competitors
in the market. Introverted and extraverted individuals will always be in any organisation.
The structural evocation theory emphasizes that if the structural dynamics of the music
affecting the sensorium is related to the dominant psychodynamic expressive structure,
the two will marry and this union will allow music to affect emotions directly (Taylor, I
and Parpete F., 1958). Eysenck (1958), in his description of the personality theory,
suggests that mind stimulation maximal in an introvert and extravert is vastly different
from each other (Furnham and Bradley, 1997). Introverts require a minimum amount of
stimulation, while extraverts are in need of stimulation. According to this theory, an
individual having relatively low stimulation levels will perform best in environments
having minimal stimulation whereas those with high thresholds of stimulation will
require more stimulated environments for optimum performance.
Theory of Planned Behaviour (TPB) is a theory which envisages deliberate behaviour; it
shows that behaviour depends on both incentive and skill (Ajzen, 2002). The theory of
planned behaviour also holds that attitude can also predict behaviour. Another theory
relevant for this study is Emotions Theory by James-Lange, which states that emotions
may be termed as outcomes of physiology-based reactions brought about by the external
environment (Cannon, 1987). The theory holds that the emotions experienced by an
3
individual are directly proportional to the external forces that cause them. The theory thus
suggests that the change in the body physiology is primary and the brain reaction through
the nervous system is what will cause emotions to be experienced.
According to Ireri (2012), Export Processing Zone tailoring workers are young people
between the ages of 25-30 with lower academic qualification. Most of the workers
possess high school certificates only, and 6.8% of the tailoring workforce is composed of
graduates. Her study also shows that there is a very high turnover among workers. The
high turnover is usually necessitated by working conditions at the factories. This current
study was done at the EPZ factories among tailoring workers. The age bracket at the
factories was appropriate for the study because the variance in age at the EPZ factories is
not wide and there is availability of enough samples for the current study, EPZ wa also
appropriate because of the availability of enough sample for the study.This study is
important to the Kenyan economy since the study findings if adopted can help Kenyan
workers especially those in factory set ups to increase their productivity.
1.1.1 Background Music
Music has been defined differently by different scholars. According to Dorrell (2005),
music is a sound that we enjoy hearing. Music is perceived differently by different
people; what is music to some people, may be noise to others, and so people have
different music preferences. There are different genres of music that have developed over
the years. Popular genres include classical music, popular (pop) music, traditional music
or folk music, hip hop, jazz, country music, rhythm and blues, and rock music. Different
people have categorised music differently. In this study, music was categorised using

4
Rentfrow and Gosling's (2003) preference of music using four aspects that include: those
which reflect an individual’s personality such as jazz, classical and blues, those which are
intense and having a rebellious attribute such as rock music and heavy metal, those which
are conventional such as pop, country and soundtracks, and finally those full of energy
and rhythm such as soul, electronic and rap music.
Background music is music played with the intention of being heard but not keenly
listened to (Griffin, 2006). It does not require organised or analytical listening. In this
study, background music is defined as music which is to be listened to passively while
the listener is performing a primary duty. Here, music accompanies the work that the
listener is engaged in. For this type of listening to be effective, the music must be
pleasing to the listener and the volume must not be invasive but controlled to enable the
listener to concentrate on the primary task (Griffin, 2006).
1.1.2 The Concept of Mood
Mood is generally referred to as an internal state of feeling. It is also a mental or
emotional state (Miles, 2005). Music and mood are meticulously related, and can be used
as a tool to enhance ones productivity. Mood can have an effect on decision making,
perception, emotional and physical well-being of an individual. Psychologists have
established that music an effects on the brain’s neurons which produce serotonin, an
important chemical that affects ones temperament. Boothby (2013) says music improves
mood and boosts overall happiness of people which increases productivity. Exposure to
long periods of stress and negativity may lead to health complications such as ulcerations,
migraines, cardiac diseases and diabetic conditions (Andrea, 2013).
5
An awful mood can thwart an employee’s work performance and lead to poor judgment
that can eventually have an effect on an organisations performance. In contrast, a good
mood can improve creativity and problem solving. By encouraging music listening at
work, a firm may able to influence the individuals’ emotions and moods. If a person is
satisfied at work, they will have reduced levels of stress. This study defines mood as a
participant’s internal state of feeling when listening to music that can lead to their arousal
or distraction as they perform their duties.
1.1.3 The Concept of Personality
Personality is the active trait inside an individual psychological structures that determine
one’s exclusive adjustment to his/her surrounding. The greatest and mostly used
determinants of personality are based on the Five Factor Model (McCrae and Allik,
2002). This model asserts that individuals temperament varies on five broad personality
dimensions. (McCrae and John, 1992; Matthews et. al., 2009). These dimensions include
Openness to experience, agreeableness, conscientiousness, extraversion, and neuroticism.
Personality traits are important in determining both one’s affective and cognitive domains
which affect how they perform their duties or how they generally behave (Moynihan and
Peterson, 2001). An individual’s personality may not only be due to the environmental
effect, but also hereditary characteristics (Ivancevich, Konospake, and Matteson, 2011).
Hereditary characteristics are termed as those character traits which an individual obtains
from their parents and are mainly transmitted through the genes. Heredity influences the
sex of an individual, which in turn affects the personality of both women and men. The
6
ways individuals respond to the environment also defines their personality. It affects
individuals from birth and continues almost to death.
Personality may be broadly classified into two temperament categories, namely
introvert/extravert and neuroticism/stability (Eysenck, 1958). Extraversion is referred to
as being outgoing, high spirited, enthusiastic, talkative and full of energy (Eysenck,
1958). The extraverts are often in need of external stimulation so as to perform best.
Eysenck asserts that individuals vary on the stimulation levels required, and their
productivity diminishes significantly when they become less aroused or stimulation is
below the threshold levels. Based on Eysenck's Theory, the extraverts will only attain
optimal performance when they are aroused and will tend to be bored when under no
stimulation, while introverts are naturally aroused and hence will require a quiet
environment.
On the other hand, emotional instability, also known as neuroticism, is best characterised
by negative attributes such as being depressed and anxious. This is mainly brought about
by increased activities of the sympathetic nervous system which is responsible for the
fight and flight reflex response. Such people have low stimulation threshold levels and
tend to have difficulties in expressing most of their emotions which leads them to
experience the negative effects such as being nervous or easily upset.
However, the emotionally stable individuals have their thresholds of activation at
relatively high levels. They also have good control over their emotions hence are only
prone to negative effects by very stressing conditions while remaining collected and
calm. This study used Eysenck’s two biologically-based categories of temperament:

7
extravert/introvert and neuroticism/stability. Eysenck developed an Eysenck’s Personality
Inventory (EPI) that measures the personality traits of an individual. EPI measures the
two independent scopes of personality, introversion/extraversion and
neuroticism/stability. EPI was used to identify the personality types of the participants.
1.1.4 Work Behaviour
Work behaviour is one’s behaviour at work. It is usually more official than other types of
human behaviour (Alexa, 2010). Job situations require that people behave in certain ways
to be able to achieve the objectives of the organisation. Work behaviour varies from
profession to profession as some professions are far more casual than others. Some of the
behaviour related to work that people tend to show include: compliance with attendance,
punctuality, interacting with colleagues and supervisors courteously, seeking assistance,
using good judgment, displaying initiative, integrity, accepting changes and constructive
criticism, good manners and habits, good personal appearance and hygiene, positive
attitude, being courteous and friendly, and displaying good use and care of materials and
equipment.
This study focused on two observable work behaviour traits based on Melissa Cooper’s
article in the Houston Chronicle on examples on employees’ good behaviour. These
behaviours included participants’ ability to have a positive attitude, and their ability to
meet deadlines (Houston Chronicle, n.d.). Workers who portray positive attitude are
usually ready, available and willing to get the job done and done well; they feel
appreciated, seek out quality work to remain busy and productive and eagerly desire to go
above and beyond their normal duty. Those who aspire to meet deadlines are well
organised, responsible and maintain a clean and organised work space.
8
1.1.5 Employee Performance
Viswesvaran and Ones (2000) define work performance by how well the employees are
able to achieve the set organisational goals and targets considering their actions, attitude
and behaviours in the activities the employees engage in. Work performance is directly
linked to the task performance, which refers to the competency and completeness in
undertaking various duties or obligations which are geared towards promoting the overall
progression of the organisation. It may be attained by the implementation of certain
technological requirements or by providing the required resources (Juslin and Västfjäll,
2008).
Anderson (2001) postulates that ability tends to be more efficient in the prediction of the
task performance as compared to the individual’s personality traits. Job performance is
termed as the degree to which the employees are able to accomplish their delegated duties
and roles as per their job descriptions. This may be measured through different
approaches such as the quality and quantity of work done, the efficiency and speed in
undertaking the job and the accuracy of the employee during the entire work process.
Anything that takes one’s attention away from the work being performed can be a
distraction. Distraction originates from unforeseen stimuli, which can be movements,
visual disturbances, temperature extremities and increased noise levels. This may also be
caused by technicalities such as system and services failures for example equipment or
machine faultiness. Hence the normal task routines tend to be impaired either directly or
indirectly (Anderson 2001). However, what would be distracting to some people may be
considered by other people to be a concentration incentive. As such, some people may
9
have higher concentration levels in the presence of background music while others tend
to prefer a quiet and relaxed environment.
The degree by which distractions affect how certain aspects perform, also lies on other
determinants like the ability of an individual to concentrate at work, their motivations and
how effective their coping strategies are at the work environment. For any organisation to
experience a competitive advantage over the other players in the market, the work
environment is important. A good working environment ensures minimal health
problems, and an ergogenic atmosphere for work. The welfare of both employees and
employers has gained increased importance in the recent past. In particular, the lack of
conducive working environments, stress, work load and lack of employee satisfaction are
among the leading problems in most firms. Therefore, it is important that a work
environment allows a relaxed atmosphere to aid productivity (Mawson, 2002). The
current study looked at performance in terms of quantity and quality of work produced by
factory workers who were under a similar working environment but had varying
background conditions.
1.1.6 Tailoring Firms at the Athi River Export Processing Zone, Kenya
In the early1980s, textile was the best manufacturing industry in Kenya both in terms of
size and employment. The industry employed over 200,000 farming households that
supplied cotton and about 30% of the labour force in the manufacturing sector (EPZA,
2005). The industry started to decline in the mid-1980s due to dumping of foreign second
hand clothes, commonly known as Mitumba, in the local market and eventually collapsed
in the 1990s. Since 2000, the African Growth and Opportunity Act (AGOA) programme

10
and the government of Kenya have supported the industry and as a result the textile and
apparel organisations in the Kenya have produced a great variety of textile products for
the local market and export.
The first EPZ program was established in Kenya in 1990. It was aimed at providing
investment opportunities which are attractive mainly for the export-oriented businesses
while operating within the designated areas/zones (EPZA, 2013). This was planned to
assist the economy through improved productive capital investment, creation of jobs,
technology transfer, and development of linkages and diversified exports. The scheme
provides numerous incentives which target at luring more business to operate and be
sustainable enough. In Kenya, there are six EPZ centres located in strategic locations.
They comprise of Nairobi (Athi River Zone), Mombasa, Kilifi, Malindi, Voi and
Kimwarer in Rift Valley region (EPZA, 2013). All these factories are managed by the
EPZ Authority (EPZA).
1.1.7. Tailors at the Factories in Athi River Export Processing Zone, Kenya
The study population is composed of the tailoring workers at the EPZ, Athi River. This
zone is one of the largest export processing zones in the country. The factories there
produce high quality goods that meet the international standards. Currently, there are
twenty two (22) garments/apparel firms at the Athi River EPZ as shown in Appendix 5.
The three factories sampled for this study are licensed to manufacture knitted garments.
The population of the workers in these factories is majorly composed of young and
middle aged people between the ages of 20 - 40. All the garments produced are exported

11
to the US under AGOA which allows its member countries to export certain goods to the
US without taxes being paid.
The sampled factories have a population of 1500 tailors each. They produce garments on
mass production basis. In those factories, work is divided into; assembly section, cutting
section, distribution section, stitching section, quality checking section, pressing area,
printing area and packaging area. At the assembly area, materials are assembled and
arranged, then moved to the cutting section. Here, materials are only cut according to
what is to be made/sewn, and then moved to stitching, then to the quality check, where
the quality of the garment is assessed before it goes to pressing area and packaging, ready
for shipment to the US market.
In the three sampled factories, all managerial and other work-related activities including
payment of tailors wages is similar. This study introduced background music within a
work set-up where workers are of different personality types and react differently to the
same stimulus under similar circumstances so as to examine the influence background
music will have on their performance.
1.2 Research Problem
The number of people listening to background music at work has been witnessed to
increase in the recent past. It is not unusual to enter an office or factory and find people
wearing headphones and listening to their selected music. People store music in their
digital gadgets and play them at their convenience. This has made it easy for people to
access music whenever it is required. People have made music and enjoyed listening to
music; similarly people have always worked unless disable. The increasing presence of

12
music at places of work raises questions about the benefits music has to man as he works.
Though it’s a normal practice to many, reasons for the liking of music at work are not
clear. Specifically, the studies conducted in the area have shown inconsistency on the
exact influence that music has on work performance (Furnham, 1981).
Individuals come to work with different inherent abilities and acquire other behaviours
during their interaction with peers at the work place (Ivancevich, et.al., 2011). These
abilities and behaviours affect how background music affects their work performance.
While strides have been made in the study area, these studies are not an all encompassing
explanation to the studies in this area. More empirical studies need to be done to come up
with theories and models of how background music affects the performance of workers
doing repetitive tasks in a factory.
People working at a factory set-up have different work behaviours and different
personality traits. All these diverse traits culminate into a normal work environment.
Human beings behave differently even under similar circumstances, for example,
introverts and extraverts will respond differently to the same stimulus because they are
different (Rentfrow and Gosling, 2003). Uhlbrock (1961) as cited by Furnham (1981)
established that most workers in the factories had a high preference to music being played
at work as opposed to there being none. A factory work environment is a diverse one
with people of different genders, academic backgrounds, culture, age and preferences.
This current study was done at the EPZ Athi River because the location has workers from
diverse background, who possess different personality types and so chances of getting
desired were results were very high.
13
Although music is said to enhance work performance (Watson, 2014), it is not clear
which type of music appeals to both introverts and extraverts doing tailoring work. There
are few studies done on work performance in tailoring factories where routine work is
done. For example, Padmasiri and Dhammika (2014) did a study on the impact of music
listening on work productivity in a garment factory and established a significant effect.
They used what they called relaxation music to gauge its impact on work performance in
a garment factory. This relaxation music, negatively impacted on the performance of the
workers, and they concluded that relaxation music is not good for work. There has not
been any research known by the researcher so far done to examine the effects of
background music on tailoring workers’ performance in Kenya.
Oldham et. al. (1995) did an empirical study on Listening to music during work, the
experiment was to determine the relationship between an individual audio headsets use
and employee work reactions. The study had 256 full time office employees from 32 job
titles who were provided with personal stereo headsets. Participants carried out jobs with
varying levels of complexity. They were encouraged to listen to music as often as
possible. Those who were given headphones performed significantly better at their job
compared to those who did not use personal headsets during the music intervention
weeks. There was an interaction effect between task complex and music listening and
employees with the simplest jobs benefited most from music as opposed to employees
with more complex jobs. The music listening technology used then is outdated for
today’s workplace. Most work places are open offices/workstations and it is considered
rude to wear headsets as you attend to clients.

14
Various studies (Furnham and Bradley, 1997; Ladinig and Schellenberg, 2012; Rentfrow
and Gosling, 2003; Lesiuk, 2005; DeNora, 2000; Haake 2006) have demonstrated that
music is a significant factor in determining how people operate. It sets the mood of the
workers, enhances their work performance, motivates them and creates an ambient
atmosphere for work to be done. Researchers however agree that studies in this area are
still at the embryonic stage and more research should be done (Shek and Schubert, 2009;
North and Hargreaves, 2008). In studies done, there seems to be no application of the
available theories which may be adopted as a framework in explaining how employee
work performance is affected by music.
There is an increasing number of empirical studies on the background music-listening
practices on work performance and environment, though there is scarce information on
the effects of listening to background music in a factory set-up where workers do
repetitive tasks and have set targets of production per day. Research by Shek and
Schubert (2009) and North and Hargreaves (2008) reveals that music has brought benefits
to people, they concluded that the research on the effects of music at the work place is yet
to be fully explored.
Lesiuk (2005) did a study on quality of work, time and task affect and found out that
music increases workers’ positive affect and improves their mood. Though her study
yielded positive results, it is not representative of all work environments and so cannot be
duplicated to other work settings. Her study was done in a modern day workplace set-up
and was restricted to software engineers only. For this reason, this research sought to
answer the question, what is the role of background music, mood, personality, and work
15
behaviour in the performance of the tailoring workers at the Export Processing Zone in
Athi, Kenya?
1.3 Research Objectives
Objectives of the study comprise of one general objective and specific objectives.
1.3.1 General Objective
The general objective of this study was to determine the role of background music, mood,
personality and work behaviour in the performance of tailoring workers at the EPZ in
Athi River.
1.3.2 Specific Objectives
i. To establish the effect of background music on employee performance.
ii. To determine whether employees’ mood mediates the relationship between
background music and employee performance.
iii. To establish the effect of personality on the relationship between background
music and employee performance.
iv. To establish the influence of work behaviour on the relationship between
background music and employee performance.
v. To establish whether the difference between the joint effect of background music,
mood, work behaviour and personality on employee performance is greater than
the effect of background music alone on employee performance.
16
1.4 Value of the Study
It is expected that outcomes resulting from this paper will help organisation’s better equip
themselves with knowledge about the relationship between background music and work
productivity of employees working in a tailoring factory doing repetitive work.
The study will help Human Resource Policy makers to realise that listening to music is
no longer an individual issue but a strong managerial tool that if best used can yield high
performance and improve on productivity of the workers. This will assist them in
distinguishing between music that aids performance and music that distracts one from
working properly in a garment factory context.
Employees or factory workers will also benefit from this study because they will each
understand why some music types interfere with their performance and other types of
music aid their performance so that they can concentrate on that which will be helpful in
aiding their performance at work. They will be able to personally analyse what is good
music for them and what is noise so that they can choose from a wide array of genres the
music that best works for them.
The findings of this study will trigger other research works in the field by proposing new
ideas, concepts and theories of how music affects and can be used to enhance
performance in other fields of work. More study work is required to further understand
the relationship existing between background music and employee perfromance.
17
CHAPTER TWO
LITERATURE REVIEW
2.1 Introduction
This chapter presents the review of pertinent literature. It presents theoretical
foundations, interrogates the links among the variables of interest, summarises existing
gaps in knowledge, the conceptual framework and research hypotheses.
2.2 Theoretical Foundation
Theoretical foundation is the basis of conducting research in an area. They are a related
set of principles that can be brought to bear as a basis for making predictions and
providing explanations for a variety of phenomena (Spector, 2008).This study is
anchored on structural evocation theory, eysenck personality theory, theory of planned
behaviour and James-Lange theory of emotions.
2.2.1 Structural Evocation Theory
The structural evocation theory highlights that if the structural undercurrents of the music
affecting the sensorium is connected to the main psychodynamic expressive structure, the
two will marry and this union will allow music to affect emotions directly (Taylor, I and
Parpete F., 1958) which will then affect behaviour. It states that structural characteristics
of music such as tempo and rhythm are the musical affective components. These musical
affective components affect emotions directly allowing people to behave and elicit
emotions in a certain way depending with the type of music they are listening to.
Music cannot be separated from its perceptual, symbolic and personal processes. Personal
processes in music help in the understanding of how music induces and modifies human
18
behaviour, this means that musical experiences and activity emerge from this personal
processes. These personal processes in an individual are the outward emotional and
physiological expressions. Emotional expressions evoked during music listening may
include happiness, sadness, joy, elation etc while the physiological expressions may
include simple or complex movements involved in music listening like toe tapping and
dancing.
2.2.2 Eysenck’s Personality Theory
Eysenck’s Personality Theory was proposed by Eysenck in 1958. According to the
theory, the cortical arousal threshold of introverts and that of extraverts is vastly different
from each other. There is a difference between introverts and extraverts in their
sensitivity of their arousal mechanisms and the thresholds at which cortical mechanisms
inhibit arousal. The extravert is carefree, easy going, aggressive and loses his temper
quickly, enjoys excitement, are impulsive and spontaneous while the introvert, on the
other hand, is aloof and inhibited (Kline, 1981).
Eysenck’s Personality Theory predicts damaging effects of music on employee work
performance for introverts. This is because introverts have a lower optimum stimulation
threshold and therefore require least amounts of stimulation (Furnham and Bradley,
1997). Introverts are constantly over-aroused and nervous and therefore require quietness
and calmness to bring them to an optimum level of work performance. Persistent
stimulation forms result in their arousal being surpassed thus the excitation is inhibited
(Furnham, et.al., 1999).

19
On the contrary, extraverts will look out for excitation because their optimum stimulation
threshold is higher. Extraverts are identified by being very social, talking a lot, having a
high positive influence and an increased stimulation need. Extraverts, based on Eysenck's
Personality Theory, have low arousal levels, they get bored easily in the absence of an
external stimulant and thus require outside stimulations to move them towards an optimal
altitude of performance at work.
2.2.3 The Theory of Planned Behaviour
The Theory of Planned Behaviour (TPB) started as the Theory of Reasoned Action in
1980 by Ajzen and Fishbein to predict an individual's intent to behave in a certain way at
a specific duration and in a specific situation. Afterwards, behaviour was noticed not to
be fully intentional and controlled. This led to the inclusion of the behaviour control
perception. According to the theory, intention predicts best ones behavior where,
intention refers to representing the readiness of a person to undertake a certain behaviour
(Azjen, 2002).
TPB predicts intentional behaviour; it states that behaviour depends on both motivation
and ability. Based on the theory, the behaviour of humans is led by three types of beliefs:
belief concerning consequence of the behaviour, belief about the normative expectation
of others, and belief about the presence of a factor that may facilitate or impede
performance of the behaviour. The TPB holds that a particular attitude on behaviour at
hand may be used in behaviour prediction. Besides attitudes, belief about how people will
view the behaviour in question will also envisage behaviour (Azjen, 2002).

20
TPB however, does not have an explanation for other unpredictable factors of
behavioural intention and motivation, such as fright, danger, emotional state or past
experience. It does not take into consideration the environmental or economic factors that
may affect the intention of a person to undertake behaviour. It presumes that behaviour is
the consequence of a linear decision-making process, and does not consider that
behaviour can be modified over time.
2.2.4 James–Lange Theory of Emotion
James (1884) and Lange (1887) as cited by Cannon (1987) independently proposed the
James-Lange Theory of Emotion. The theory holds that emotions come about as
physiology-based outcomes to external events. As such, the emotions are directly
proportional to the external physiological ranges of arousal. The physiological reactions
that people may experience such as bradycardia, cardiac arrhythmias, hypertension and
mouth dryness are mainly brought about by the sympathetic nervous system, which in
turn influences the emotions experienced as per this theory.
According to this theory, observing an external impetus leads to a physical response, that
is, emotional response will depend on how those physical responses are construed and
concluded. The physiological responses should be necessary to truly experience emotion.
However, neuroscientists and experimental psychologists argue that even those people
with muscle paralysis and lack responsiveness feel emotions such as happiness, anxiety,
and fury (Cherry, 2017). Again, external happenings do not always lead to similar
stimulus every time. A person may have exact same physiological response to a stimulus

21
yet experience an entirely different emotion. Factors like ones mental state, environment,
reactions of other people may play a role in the resulting emotional response.
But for this theory to adequately describe emotion, different physiological responses for
every emotion must be defined (Barrett, 2012). Barrett (2012) shows that experience of
emotion is modulated by both physiological feedback and other information rather than
consisting exclusively of bodily changes. People do not always show emotions using the
same behaviours, some may withdraw when annoyed, or fight out of fright. She asserts
that emotion is more complex than a mere physical feeling.
2.3 Background Music and Employee Performance
A study by Hilliard and Tolin (1979) as cited by Mcdonald (2013) observed whether
there existed any stimulations due to the background music and its influence on work
performance. The study established that companies having familiar background music
had a higher employee performance as opposed to those which did not have. This concurs
with the study by Etaugh and Michals (cited by Hilliard and Tolin, 1979) who proposed
that undergraduates preferred to study in the presence of background music as it was
perceived to improve their performance (Mcdonald, 2013).
On the other hand, a literature review undertaken by Uhrbrock (cited by Furnham and
Bradley, 1997) reviewed findings on influence of music on performance in industries.
The study found no support for the claim that productivity was increased by background
music. In fact, it established that a small percentage of participants, 1-10%, did not like
listening to music at work, music affected the overall quality of work negatively and that
the music in the background only increased productivity of the employees who had easy

22
and repetitive tasks. Researchers have studied the effects of background music played
during many different tasks, for instance driving (Dibben and Williamson, 2007). The
relationship between music, the driver, and the automobile was studied by Oblad (2000)
who presumed that more than just an attraction, individuals have specific expectations
when they play music in the car.
2.4 Background Music, Mood and Employee Performance
Music is present in all human cultures. It is associated with relaxation and emotion
regulation. Reasons for using music vary amongst individuals; some use it for enjoyment
and entertainment, while others to influence their mood and emotions (Sloboda, 2005).
The empirical studies conducted have revealed that the most important purpose of music
listening is that of mood regulating (DeNora, 2010; North and Hargreaves, 1999).
Haake (2011) found that self-selected music inspired, relaxed and improved the mood of
her participants. Shek and Schubert (2009) reported that people listen to music on their
portable music player to block out noise and avoid interruptions from their colleagues at
work. Hence, background music has two main roles as pertaining to work activities
(Haake, 2011). This includes managing disruptions as a way of managing work-related
stress and having control over the environment through portable devices and the internet
(North and Hargreaves, 1999).
Lesiuk (2005), in her article the effect of music listening on work performance, mentions
that when music listening in the work environment is encouraged by project directors and
the workers are acquiescent to music listening, then music listening will certainly have a
positive effect. Music can evoke powerful emotional reactions in people. It arouses

23
emotions, and these emotions are experienced as pleasurable by individuals (DeNora,
2010; Juslin and Laukka, 2003) which in turn creates an enjoyable workplace.
Background music is listened to so that the listener can change or release emotions, can
enjoy, be comforted, or even relieve stress (Juslin and Västfjäll, 2008) as well as for
relaxation purposes or as a background accompaniment to everyday activities (Furnham,
1981; Sloboda, 2005).
Sonos, who is a speaker manufacturer, conducted a study on the relationship between
music and mood (Titlow, 2016). The study revealed a general improvement in positive
feelings and activity upon playing the background music. The study further found that
background music made the daily activities and routines more enjoyable. (Titlow, 2016).
Majority of the people in the study indicated that music helped them accomplish their
tasks easily, while some stated that it made the food taste better. This concurs with the
studies conducted by North and Hargreaves (2008) and Dibben and Williamson (2007)
who showed that individuals responded differently based on the music they listened to.
2.5 Background Music, Personality and Employee Performance
Empirical studies that have been conducted on the impact of music on daily life have
indicated that music may be used for impression management particularly in the young
individuals (North and Hargreaves, 2008). To some music, helps them to gain a sense of
uniqueness and gain inclusion in various groups. There is also evidence of individual
differences in music preferences for vocal vs. instrumental music, fast vs. slow music,
and loud vs. soft music (Rentfrow and Gosling, 2006).

24
Introverts and extraverts use music differently; In a study by Daoussis and McKelvie
(1986) as cited by Chamorro-Premuzic (2014) it was shown that, even though extravert
participants worked under musical backgrounds twice as much compared to introverts,
both introverts and extraverts played the music softly. Both groups were given a reading
recall test in which they were instructed to spend 10 minutes reading 2 passages (of about
900 words) with a view to answering specific questions immediately afterwards. Half of
each group did the task in silence and half in the presence of rock and roll music played
at low volume. While there was no difference in the scores of extraverts, introverts
performances were as predicted, significantly poorer in the presence than in the absence
of music.
Studies conducted have also revealed that background music interferes with the cognitive
ability of introverts (Furnham and Bradley, 1997; Furnham and Strbac, 2002). This may
be attributed to the fact that introverts have a lesser ability to store information for future
references. Furnham and Bradley (1997) indicate that although the level of immediate
recall is not different between the introverts and the extraverts, performance is marginally
lowered among the introverts. Neurotics are characterised by being anxious, uptight, and
nervous, and are emotionally unstable and have low self-esteem (Delsing et. al., 2008).
Along with increased anxiety, people who are high in neuroticism have greater activity in
the brain areas that control the autonomic nervous system, which controls the body’s
alarm system. Psychotics are aggressive, antisocial and egocentric, manipulative and
unsympathetic, and can be very creative with how they view the world and people around
them (Delsing et. al., 2008).

25
2.6 Background Music, Work Behaviour and Employee Performance
Music has the capacity to subconsciously or consciously synchronise the movements of
the listener to rhythms or simple body part movements, for example toe tapping or head
nodding or dancing (Juslin and Västfjäll, 2008). These movements involve complex
coordinations of cortical and sub-cortical somatosensory motor brain networks (Zatorre,
et.al., 2007). Background music therefore allows for flexibility of the listeners at work,
which aids in work performance.
People who enjoy a certain genre of music always have other attributes in common (Mas-
Herrero et. al., 2013). Either they are of the same gender, same age group, similar
academic qualification or background socialisation. In a work set-up, it is obvious that
individuals will socialise. Having something in common to share with colleagues at work
is important because it assists in bonding and socialisation processes. This makes work
places an enjoyable place to be. Music liking is perceived to describe and express a
person’s identity (North and Hargreaves, 1999) such that when people socialise they use
music preferences to know each other (Rentfrow and Gosling, 2006).
Several studies have been done among athletes during exercise. Some studies
(Karageorghis et al., 2009) suggest that when an exerciser consciously moves in time
with a musical beat, music provides him with ergogenic and psychological benefits in
repetitive endurance activities. For example, during treadmill walking, music improves
time one takes to be fatigued by 15% compared to motivationally neutral and control
conditions. Other finding suggest that synchronous music may increase rhythmicity of
26
movement, resulting in an efficiency gain that is associated with lower relative oxygen
uptake (Terry and Karageorghis, 2010). In steady-state aerobic exercise, motivational
music has also been shown to improve affective states by up to 15%.
Similarly, listening to music can be an effective dissociation strategy, reducing
perceptions of effort and fatigue by up to 12%. Research evidence demonstrates that
music has consistent and measurable effects on the behaviour and psychological states of
male and female exercise participants. Music can also positively influence performance
by improving endurance and/or exercise intensity. When music is selected according to
its motivational qualities, the positive impact on performance, for example, increases
endurance, and psychological states like enhanced affect are even greater, which has
important implications for exercise adherence.
2.7 Background Music, Mood, Personality, Work Behaviour, and Employee
Performance
A study was done by Kniffin (2016) on how background music influences behaviour at
work; the study showed that people who listen to happy background music are more
likely to cooperate regardless of their age, gender or academic major than those who
listen to unhappy music. Happy music makes people happy and happy people are more
cooperative. This study also found that happy music was linked to increased cooperation,
whether or not it boosted participants’ mood.
Eysenck (1981) postulated that background music has the capacity to stimulate the brain.
However, the effect tends to be negative to introverts. This is because introverts have a
lower optimum stimulation threshold and therefore require least amounts of stimulation
27
(Furnham and Bradley, 1997) to perform a task. On the contrary, extraverts require
external stimulation to bring them up to an optimal performance (MacDonald, 2013).
Empirical studies conducted on music also reveal that people are drawn to different
music genres having certain connotations which they relate with. This may include love,
toughness, rebellious and complications (Rentfrow, et.al., 2011). Rentfrow and Gosling
(2003) observed specific alterations in liking for 14 broad music types in three samples.
Outcomes from all the three studies showed four music-preference aspects that were
categorized as reflective and complex (comprising classical, jazz, folk and blues), intense
and rebellious (rock, alternative, heavy metal), Upbeat & conventional (country, pop,
soundtracks, religious), energetic and rhythmic (rap, soul, electronica).
The reflective and complex group is extraverted. The group also has very high self-
esteem (Rentfrow and Gosling, 2003). The intense and rebellious group has gentle,
creative, introverted, and low self-esteemed people. As for upbeat and conventional,
people have a habit of exhibiting extraversion, emotional stability, and high self-esteem
traits. Lastly, the energetic and rhythmic group exhibits high self-esteem, extraversion
and assertiveness (Rentfrow and Gosling, 2003).
Familiar music may evoke meaning to some people, which eventually affects their
productivity. Ladinig and Schellenberg (2012) examined liking for excerpts of unfamiliar
music and rated the emotional responses of their participants based on the intensity,
happiness and sadness of the participants. They found that those participants who had
high introversion values tended to like sad sounding music.

28
An experiment was done by Mindlab International in which 26 participants were given a
series of different tasks for five days in a row including spell-checking, equation solving,
mathematical word problems, data entry and abstract reasoning. The workers completed
these tasks while listening to one of four music genres or no music at all, to see which
had the greatest effect on accuracy and speed of correct responses (Watson, 2014). The
study found that participants made the most mistakes when not listening to any music at
all. The study concluded that there are specific genres that people love to listen to while
doing certain tasks.
This study found that workers were better at solving mathematical problems when
listening to classical music, which improved accuracy by 12% compared to listening to
no music at all. Classical music was the second best genre for general accuracy and spell-
checking. Participants listening to pop music completed data entry tasks 58% faster than
when listening to no music at all. Pop music was also found to be the best music genre
for spell-checking quickly, and, alongside dance music, produced the fastest overall
performance for getting work done; it cut mistakes by 14%, compared to not listening to
music.
Ambient music led to the highest level of accuracy for respondents completing tasks
involving equations. Dance music resulted in the highest overall accuracy and fastest
performance across a range of work tasks. Participants listening to dance music produced
more accurate results in spell-checking, solving equations and tackling tricky
mathematical word problems, increased proofreading speed by 20% and were able to
complete abstract reasoning tasks more quickly (Watson, 2014).

29
The study, however, did not consider participants’ individual differences at work. People
perceive music differently at different times of the day. The researcher in the above study
limited their study to four genres only. Music has varied genres; limiting participants to
four genres may not be a representative of the real situation. Exposing employees to
varied types of music could probably give a different observation. People of different age
groups respond to music differently, and varying music from all ages would possibly
provide different results. Table 2.1 gives a summary of types of music and their related
tasks as per the Mindlab study.
Table 2.1: Type of Background Music and Related Tasks
S/No Music Type Task
1. Classical
Music
Better at solving mathematical problems
Best for general accuracy and spell-checking
2. Pop Music Best for spell-checking quickly
Best for getting work done
3. Ambient
Music Best for completing tasks involving equation
4. Dance Music Best for overall accuracy in spell-checking, solving
equations and tackling tricky mathematical word problems.
Increases proofreading speed
Improves abstract reasoning
Source: A synthesis from the literature review

30
2.8 Summary of Gaps in Knowledge
Several studies have been done so far by scholars who used different methodologies in
their research. This study has carefully looked at the methodologies that some of the
studies employed, identified the knowledge gap in those studies and suggested favourable
data collection methods to be used to achieve desired results. Table 2.2 shows a summary
of gaps in knowledge.

31
Table 2.2: Summary of Gaps in Knowledge
S/No Study Methodology Findings Knowledge Gap Focus of Current Study
1 Listening during
work Quasi-
Experimental
Relationship Between
Personal stereo
headsets use and
Employee Work
Responses.
(Oldham et. al. 1995)
256 office employees
from 32 different
departments were
given personal music
headsets. They did
different jobs that had
different levels of
complexity. They
listened to music
oftenlyas they worked
Those who were given headsets
performed significantly better
compared to those without
headsets during the study. There
was a positive effect between task
complex and music listening
The music listening
technology (i.e. the use of
headsets) used then is
outdated for today’s
workplace. Most work
places are open
offices/workstations and it
is considered rude to wear
headsets as you attend to
clients.
The study addressed the use
of technological listening
devices by installing a
central music control point
with speakers channeled to
specific strategic points for
all participants to hear and
also to regulate music
2 Quality of work, time
and Task Affect.
(Lesiuk 2005)
Studied 56 software
engineers for five
weeks, she took a
daily music listening
record of the subjects.
Music listening increased the
software engineers positive affect
and improved their mood at work
Though her study was done
in a modern-day work
environment, it was limited
to software engineers. Job
and work dynamics are
different.
Asking participants to work
without music for part of the
study could be unnatural for
some individuals which may
also affect performance.
The current study was done
in a natural work setting of
the participants. Music was
manipulated at intervals
without participants realising
the change of genres and the
silence thereof. This was
geared towards having the
study done in a more natural
work set-up.
32
3 Liking Unfamiliar
Music:
Effects of Felt
Emotion and
Individual
Differences.
(Ladinig and
Schellenberg 2012)
They examined liking
for excerpts of
unfamiliar music taken
from a wide variety of
genres.
Liking music that evoked sadness
tended to be stronger among
participants who scored (a) high
in introversion (b) high in
openness-to-experience, which is
characterised by curiosity.
It is not clear whether
preferences and emotional
reactions to music are
predictive of long-term
music preferences for
genres.
The current study observed
positive and negative
responses to music and
included personality, work
behaviour, type of work,
time of day and general
work performance.
4 The Effect of Music
Preference on
Complex Task
Performance
(Mcdonald, Jordan
2013)
34 college students
from a small,
Christian, liberal arts
university were
sampled then
separated into two
groups.
The results revealed a significant
interaction effect between level of
extraversion and music condition.
The computers in front of
the participants playing the
music selections displayed
flashy advertisements that
may have been an added
distractor during the testing
conditions.
Due to the age of the
machines, the Internet
connection capabilities
sometimes failed.
The use of a computer as a
music listening device may
act as a distractor.
The current study
concentrated on audio music
without any visual media.
.
33
Source: A synthesis from the literature review
5 The Effect of Music
Listening on Work
Performance: A Case
Study of Sri Lanka
(Padmasiri and
Dhammika 2014)
All the workers in a
garment factory were
sampled. A random
sample of 50 machine
operators out of 64
done. Data was purely
primary and was
collected by the use of
a questionnaire which
had five point Likert
scale. Music played
was categorised as
music for relaxation.
Data was analysed
using Regression
Analysis
They found a significant effect of
music listening on work
performance. Work performance
decreases after music listening
because the researchers used
music for relaxation. This is
considered not good for a work
environment according to this
research.
The researchers used what
they termed as relaxation
music. This music
according to them is not
suitable for work
Researchers also used few
music tracks in their data
collection. This according to
them affected their results.
A work environment has
varied people with different
personality so minimizing
the music into a few types
could affect the findings.
A study of different genres
was done by the researcher.
A pilot study was carried out
prior to the study to
determine the type of music
preferred by workers. These
preferred varied music types
were then used during the
study
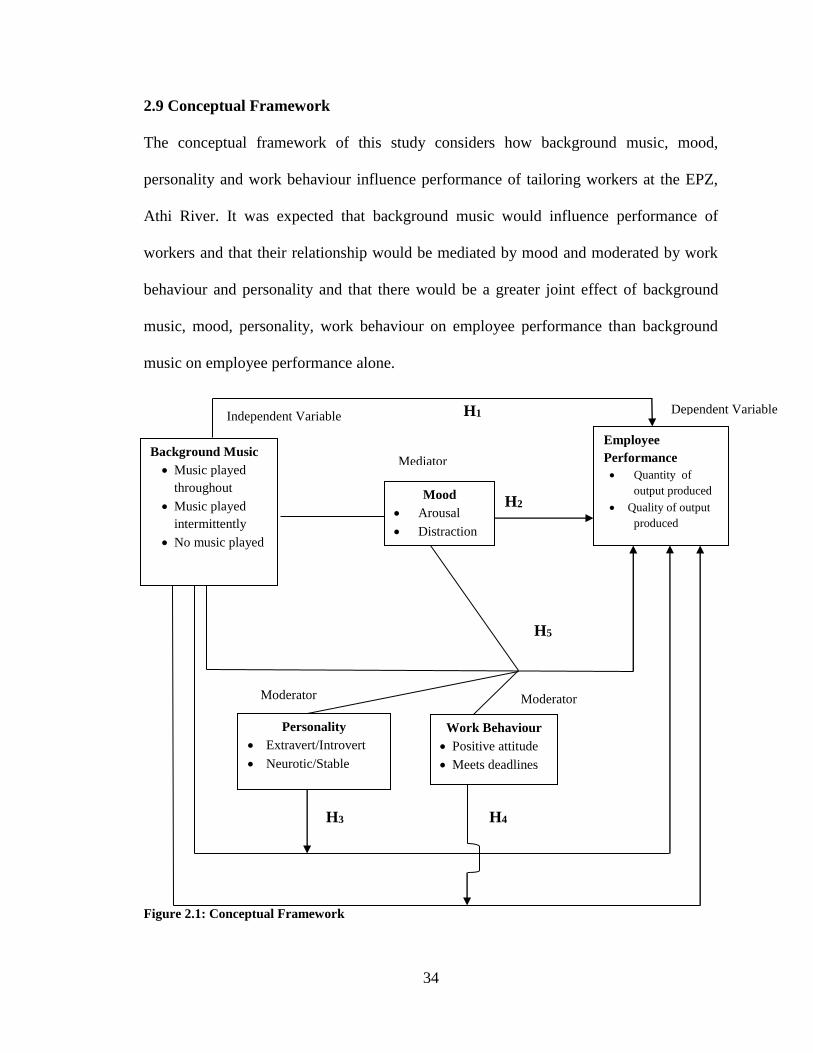
34
2.9 Conceptual Framework
The conceptual framework of this study considers how background music, mood,
personality and work behaviour influence performance of tailoring workers at the EPZ,
Athi River. It was expected that background music would influence performance of
workers and that their relationship would be mediated by mood and moderated by work
behaviour and personality and that there would be a greater joint effect of background
music, mood, personality, work behaviour on employee performance than background
music on employee performance alone.
Figure 2.1: Conceptual Framework
Mediator
H1
H4 H3
H2
H5
H5
Employee
Performance
Quantity of
output produced
Quality of output
produced
Background Music
Music played
throughout
Music played
intermittently
No music played
Personality
Extravert/Introvert
Neurotic/Stable
Work Behaviour
Positive attitude
Meets deadlines
Mood
Arousal
Distraction
Independent Variable Dependent Variable
Moderator
Moderator

35
The results of the study as conceptualized were expected to show that background music
(independent variable) had a causal relationship with employee performance (dependent
variable) and that, that relationship would be mediated by mood, moderated by
personality and work behaviour, and that the joint effect of background music, mood,
personality and work behavior would be greater on employee performance than the effect
of background music on employee performance alone.
2.10 Research Hypotheses
H1 There is a relationship between background music and employee performance.
H2 The relationship between background music and employee performance is
mediated by mood.
H3 The relationship between background music and employee performance is
moderated by personality.
H4 The relationship between background music and employee performance is
moderated by employee work behaviour.
H5 The joint effect of background music, mood, work behaviour, and personality is
greater than the effect of background music alone on employee performance.

36
CHAPTER THREE
RESEARCH METHODOLOGY
3.1 Introduction
This chapter highlights methodological details for the study. These methodological
details include: Research philosophy, research design, target population, sample design,
sample size, data collection techniques, measures of variables, diagnostic tests and data
analysis.
3.2 Research Philosophy
There are several philosophical paradigms used by researchers. The two main
philosophical traditions that guide research in social sciences are positivism and social
phenomenology (Saunders, et. al., 2007). Phenomenological paradigm is viewed as
qualitative while positivism is quantitative. Positivism is grounded on the notion that
science is the singlemost way to learn the truth. It adheres to the view that only truthful
knowledge gained through observation including measurement can be trusted. Here, the
role of the researcher is restricted to collection of data and interpretation in an impartial
way. Cooper and Schindler (2006) say that positivism takes a quantitative approach based
on real facts, objectivity, neutrality, measurement and validity of results.
Positivists emphasize that the observer is independent from the observed. They also argue
that knowledge about reality can only be discovered through self-observation and
measurement. The current study adopted the positivist approach in conducting research
since it operationalises concepts like background music, personality, work behaviour and

37
employee performance to enable the use of quantitative data to test the research
hypotheses drawn from the conceptual framework.
3.3 Research Design
The study was conducted in a natural setting comprising garment tailoring factories. For
this reason, the design of this study was field experiment. A field experiment applies
scientific ways to experimentally observe an intervention in the real world rather than in
the laboratory. Field experiments, like laboratory tests divides subjects into treatment and
control groups and compare results between these groups (Humphreys, M and Weinsten
J., 2009). This design was considered appropriate because it did not change behaviour of
the study subjects. The study had a control group and two treatment groups. The two
treatment groups were included to assess the effect of music on employee performance
when music was played fully or intermittently and when it was not played.
The factory set up at the EPZ, Athi River was a convenient site for investigating the
effect of background music on work performance of factory workers doing repetitive
tasks. This was borne from a visit to the factories. It was observed that the design of the
buildings at the factory allows for music pipes, wires and speakers for output and a
control room for playing music. Work stations are on ground floor while offices/rooms
are upstairs, from which observation of the respondents was done without them realising
that someone was watching their activities. This greatly reduced the impact of the
researcher's presence in the immediate environment and hence eliminated potential
source of bias.
Although the unit of analysis was EPZ garment factories, data on mood, personality, and
work behaviour was collected from tailors who participated in the study. The effect of

38
background music on mood, personality and work behaviour was observed individually
because listening and appreciating music is perceived differently. It was also importatnt
to observe performance of different tailors at different points of the production chain
because that is what made the difference in the performance of different factories.
3.4 Population of the Study
There are 22 garment factories at the EPZ, Athi River (EPZA 2016). The researcher
wrote to all the 22 garment factories at the EPZ explaining the study and asking for
permission to conduct the study there. This was followed by a visit by the researcher to
personally explain and respond to any questions by the respective managements of the
factories. However, only three factories which happen to be under the same management
responded positively.
All the three factories had 1500 tailors each working from 8am- 4:30pm with lunch break
between 1:00pm and 2:00pm. There was therefore 4500 tailors distributed equally in the
three factories. A preliminary interview with the General Manager of the factories
revealed that the tailors were between the ages of 20 - 40 years; the factories have a
similar set-up of work stations, communication channels, hiring procedures, wages
payment, safety measures, disciplinary procedures and other human resources related
aspects. Thus the three factories were matched in every respect except with regard to
background music. The unit of analysis was the factory. Th three factories were
conveniently selected for the study because they were willing to participate in the study
and had similar workplace characteristics.

39
3.5 Sample Design
The study used systematic sample procedure to draw up a representative sample. Xu
(1999), suggests that a population of 4500 requires a sample size of 357 at 95%
confidence level and 0.5 margin of error (Xu’s sample estimate table is available in
appendix 7). Each of the 3 factories has 1500 tailors. 357 estimated sample size from the
three factories was used for the study. This 357 was divided by 3 (The number of
factories) to get a total of 119 tailors per factory. A systematic sampling procedure was
then used to obtain 119 tailors from each factory. This was done by listing all the 119
respondents for each factory and selecting every 12th person.
3.6 Data Collection
Being a field experiment, the study relied on primary data. Since all the factories were
similar in design, operations and management of the factory, it did not matter which
factory became a control or a treatment group. The researcher randomly picked factory
one and two and used them as treatment groups while factory three became the control
group. In factory one, music was played throughout the working time, while in the
second factory music was played intermittently, (on and off). In the third factory music
was not played at all. The purpose of the variation was to assess the changes in employee
performance when exposed to music and when not exposed to music. The research
instruments consitituted of; Rentfrow and Gosling (2003) preferred music checklist,
Eysenck’s Personality Inventory, observation checklist and the researcher administered
questionnaire.
Data was collected on background music, mood of the participants, personality of the
participants, their work behaviour and performance. Since the factory was the unit of

40
analysis it was importatnt to observe performance of different tailors at different points of
the production chain because that is what made the difference in the performance of
different factories.
3.6.1 Background Music
Data on preferred background music was collected using Rentfrow and Gosling (2003)
preferred music checklist to determine the type of music participants prefer. That was the
music that was played during the study. Participants were given a checklist that had
music genres specified and they were required to tick the box which corresponded to the
background music they preferred. After selecting the preferred music, they returned the
filled forms to the researcher who then analysed them and used the music preferred by
the majority in the study. Preferred music was categorised into four: reflective and
complex music, intense and rebellious music, upbeat and conventional music and
energetic and rhythmic music. The Rentfrow and Gosling preferred music checklist was
applied in factory one and two. Factory one and two were treatment groups, while factory
three was a control group.
3.6.2 Mood of the Subjects
Mood of participants was measured using the circumplex model of affect adapted from
Russell (1980). This model arranges emotions on a two-dimensional grid, with one axis
moving from pleasantness to unpleasantness, also called valence, and the other axis
moving from activation to deactivation, also called arousal. Depending on how positive,
elated, energetic one feels or vice versa, a dot is placed on an appropriate part of the grid
to record current participant’s mood. The circumplex model was adapted and modified to
suit the design of this study. Numbers 1 representing negative mood and 2 representing
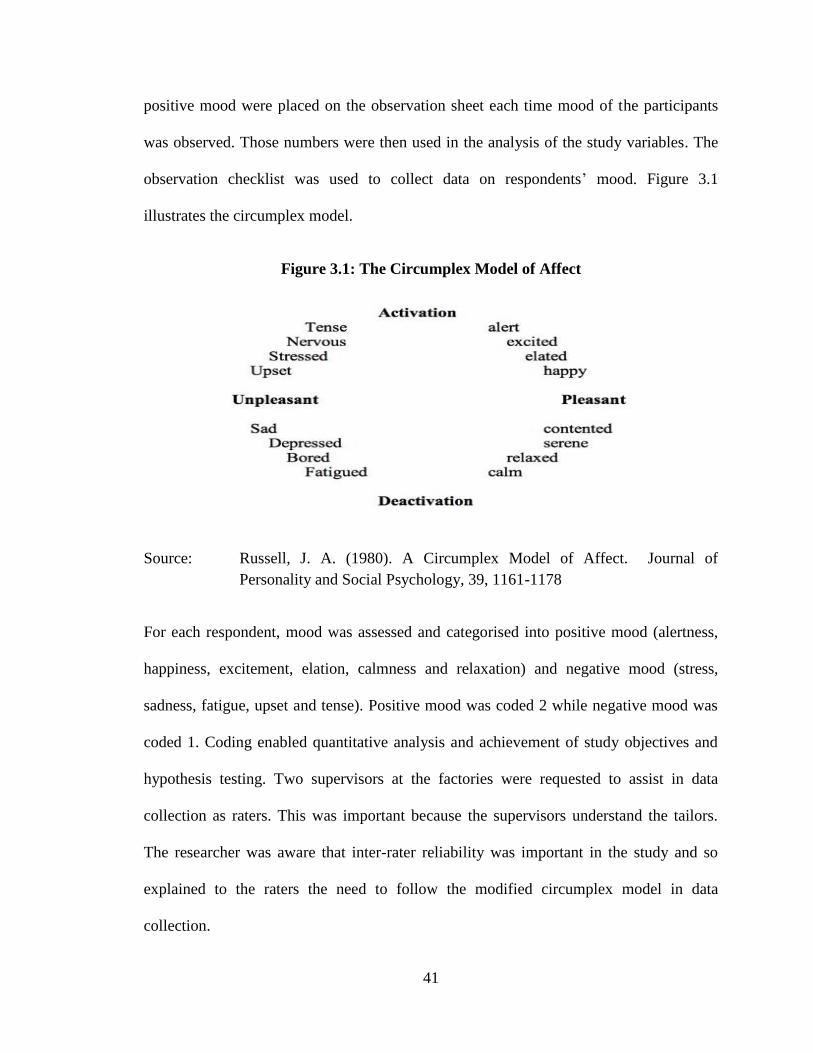
41
positive mood were placed on the observation sheet each time mood of the participants
was observed. Those numbers were then used in the analysis of the study variables. The
observation checklist was used to collect data on respondents’ mood. Figure 3.1
illustrates the circumplex model.
Figure 3.1: The Circumplex Model of Affect
Source: Russell, J. A. (1980). A Circumplex Model of Affect. Journal of
Personality and Social Psychology, 39, 1161-1178
For each respondent, mood was assessed and categorised into positive mood (alertness,
happiness, excitement, elation, calmness and relaxation) and negative mood (stress,
sadness, fatigue, upset and tense). Positive mood was coded 2 while negative mood was
coded 1. Coding enabled quantitative analysis and achievement of study objectives and
hypothesis testing. Two supervisors at the factories were requested to assist in data
collection as raters. This was important because the supervisors understand the tailors.
The researcher was aware that inter-rater reliability was important in the study and so
explained to the raters the need to follow the modified circumplex model in data
collection.

42
3.6.3 Personality of the Subjects
Eysenck’s Personality Inventory (EPI) was used to gather data on personality traits of the
participants. EPI measures two pervasive, independent dimensions of personality,
Extraversion-Introversion and Neuroticism-Stability, which account for most of the
variance in the personality domain (EPI tool is in Appendix 2). Each form contains 57
Yes-No items with no repetition of items. The inclusion of a falsification scale provides
for the detection of response distortion. The traits measured are Extraversion-Introversion
and Neuroticism-Stability which has 3 scores. The ‘lie score’ is out of 9. It measures
how socially desirable the participant wants to be in answering the questions.
Those who score 5 or more on the lie score scale are considered liars who make
themselves look good and are not being totally honest in their responses. The ‘E score’ is
out of 24 and measures how much of an extravert/introvert the participants are. The ‘N
score’ is out of 24 and measures how neurotic/stable one is.
After the participants filled in the EPI form, the data was then fed into EPI computer
programme which generated personality traits of each participant. Figure 3.2 shows the
personality quadrant used by Eysenck.
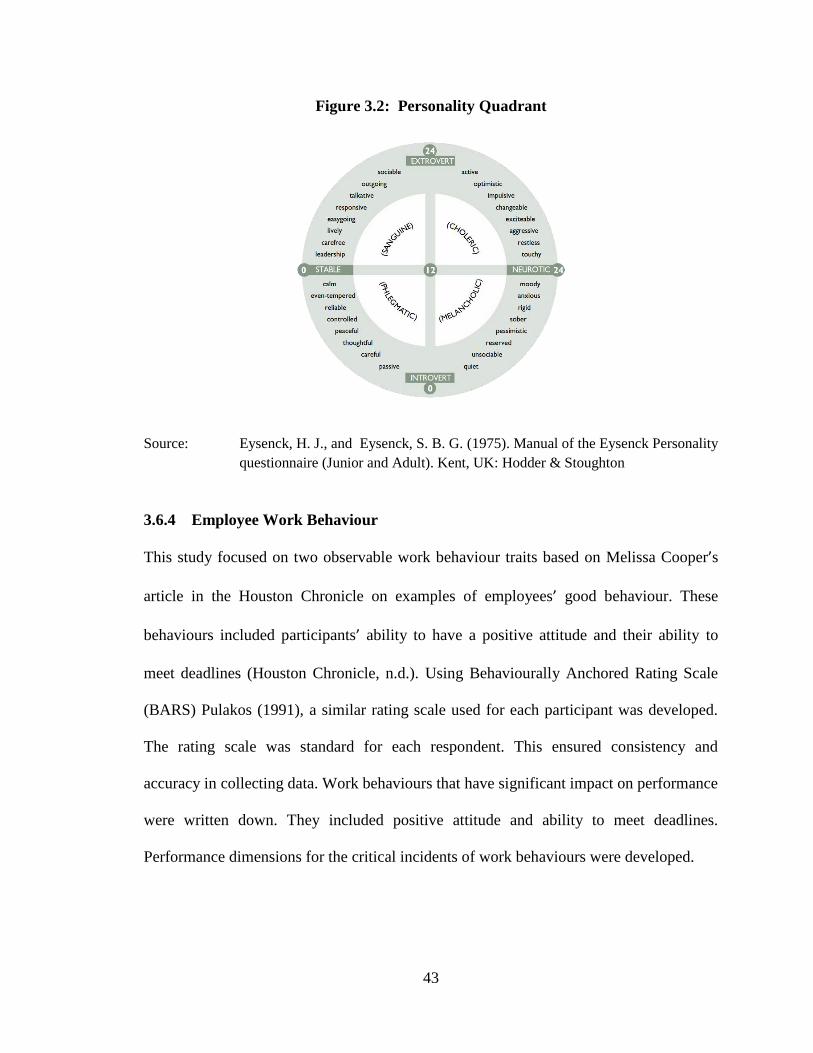
43
Figure 3.2: Personality Quadrant
Source: Eysenck, H. J., and Eysenck, S. B. G. (1975). Manual of the Eysenck Personality
questionnaire (Junior and Adult). Kent, UK: Hodder & Stoughton
3.6.4 Employee Work Behaviour
This study focused on two observable work behaviour traits based on Melissa Cooper’s
article in the Houston Chronicle on examples of employees’ good behaviour. These
behaviours included participants’ ability to have a positive attitude and their ability to
meet deadlines (Houston Chronicle, n.d.). Using Behaviourally Anchored Rating Scale
(BARS) Pulakos (1991), a similar rating scale used for each participant was developed.
The rating scale was standard for each respondent. This ensured consistency and
accuracy in collecting data. Work behaviours that have significant impact on performance
were written down. They included positive attitude and ability to meet deadlines.
Performance dimensions for the critical incidents of work behaviours were developed.

44
The researcher sought the help of the two supervisors at the factory who assisted in
observing the behaviour of the participants and rated them as required. The raters
grouped behaviours in different dimension sets, then each dimension was defined, for
example workers who portray positive attitude are usually ready, available and willing to
get the job done and done well; they feel appreciated, seek out quality work to remain
busy and productive and eagerly desire to go above and beyond their normal duty, while
those who aspire to meet deadlines are well organised, responsible and maintain clean
and organised work spaces. These acted as behavioural anchors that were used to
measure work behaviour. Work behaviour was observed in three weeks and findings
recorded in the observation data sheet developed by the researcher (see appendix 4). For
each observable behaviour numbers 1 and 2 were used to code negative and positive
behaviour respectively that were later used in the regression analysis.
3.6.5 Employee Performance
An observation data sheet was used to record information on the number of garments
produced. Employee performance was measured by the quantity and quality of garments
produced by tailors at the EPZ, Athi River in Kenya. Minimum performance was
predetermined by the supervisors and in all the three factories, tailors had a set target of
700 garments to be produced during the three weeks study period. Employee
performance observed was recorded as it were. The information on number of garments
produced was obtained from the computers attached to the machines. Each machine had
the ability to record the number of garments that had been successfully made and passed
on to the next line of production. Tailors in all the three factories had a target of 700
pieces of clothes per day. This was the researcher’s daily recorded output on the
45
observation data sheet that was later used during the analysis. Due to quality checks in
every stage of production process in all the three factories, there was no record of rejected
garments at the end of the production line.
3.6.6 Experimental Procedures
The first week of the data collection period was for the pilot study. Research tools were
thus pretested before the collection of actual data. Pretesting was done in an EPZ factory
at Athi River. The participants involved in the pilot study were tailors in the factories
selected for the study but were not part of the sampled participants to be involved in the
final study. The sample size for the pilot study was 10% of the study target population.
This was in line with Saunders et. al, (2007) recommendation that a sample size of at
least 10% of the target population is adequate. The target population for the study was
357 respondents. Thus, the 10% of the population was 36 respondents.
The researcher administered the questionnaire; the Eysenck personality inventory and
preferred music check list to the 36 respondents. The data collection instruments were
tested for validity and reliability. Music was played to the respondents and number of
units produced recorded. Work behaviour was observed and recorded as 1 for negative
work behaviour and 2 for positive work behaviour, and the results obtained analysed for
reliability and validity. The results of the pilot study were used to measure whether there
was consistency in responses or not and also whether the research tools were valid or not.
The pilot study results indicated that the data collection tools were reliable and valid.
Phase one took one week and included a physical observation of respondent’s regular
work behaviour and work performance in terms of output or number and quality of
garments produced in a day. Phase two also lasted one week. Here, respondents in factory
46
one and two identified the music they love to listen to using Rentfrow and Gosling
preferred music checklist. Different types of music were played, from which the listeners
selected the ones they prefer. Respondents filled a form/checklist showing their preferred
music. Results from the checklist were used to compile preferred music by the
participants that were later used for the study.
In the third phase, the data collection tools were administered. Respondents were
observed for a period of three weeks to ascertain their actual work behaviour when their
preferred music was played and when it was not played. In factory one, music was on
throughout, while in factory two, music was on and off (e.g. Music was played in the
morning, and off in the afternoon, or off in the morning and on in the afternoon for a
period of four weeks) at intervals to ascertain their response to music and their resultant
work behaviour, mood and performance. In the third factory, the work behaviour of
respondents was observed and their performance measured. Here, an observation data
sheet was used to collect required data on presence or absence of background music
played, time of day, mood, work behaviour and performance. Data recorded in the
observation sheet was later used in the analysis of data and to explain the findings of the
study since these were real time observations and in case of discrepancies from the other
tools administered it would be easier to refer from what was actually observed.
Eysenck’s Personality Inventory was used to gather information about personality traits
of the participants. Eysenck’s Personality Inventory consisted of 57 questions as
suggested by Eysenck and Eysenck (1975). EPI was administered to all the 119
respondents from all the three factories. The questions consisted of yes or no questions.

47
The results of each participant were then keyed in the Eysenck Personality Inventory
computer programme to come up with personality types of each individual. The
responses from the participants were fed into a computer application programme which
then produced personality traits per individual participant. All stable and unstable
extraverts were grouped together and measured as 2 on an interval scale; similarly all
stable and unstable introverts were grouped together and measured as 1 on the interval
scale.
Work behaviour was assessed for all the respondents working in the three factories. The
researcher assessed and recorded the observed work behaviour of the respondents for
three weeks and summarised the tailor’s behaviour as per Melissa Coopers observable
work behaviours. Work behaviour was categorised into positive attitude and ability to
meet deadlines. For positive attitude, the researcher looked out for being ready, available
and willing to get the job done, while for ability to meet deadlines the researcher looked
out for being organised, responsible and clean.
Employee performance observed was recorded as it were. The information on number of
garments produced was obtained from the computers attached to the machines. Each
machine has the ability to record the number of garments that have successfully been
made and passed on to the next line of production. Tailors in all the three factories had a
target of 700 pieces of clothes per day. This was recorded in the observation data sheet
that was later used during the analysis. Due to quality checks in every stage of production
in all the three factories, there was no record of rejected garments at the end of the
production line.

48
The final phase was 3 weeks long, in the first 2 weeks, the researcher administered
questionnaire to the workers to get information on their exposure to background music
and how they think background music affects them. The last week’s main activity was to
conduct interview to debrief the respondents and detect those among the participants that
would have guessed the research hypotheses so that they can be excluded from final data
analysis. The experimental procedures used in this study closely related to those by
Watson (2014) who examined listening to music as an improvement to accuracy at work
and Pasick (2014) who developed a guide to listening to music at work. An earlier study
by Oldham et. al., (1995) and another one by Lesiuk (2005) adopted related experimental
procedures and achieved findings comparable to those of this study.
3.7 Diagnostic Tests
This section focuses on the tests of validity, reliability, multicollinearity,
heteroscedasticity, linearity and normality.
3.7.1 Test of Validity
Validity relates to ability of the instrument to measure the construct as purported. It refers
to how well an instrument measures what it is designed to measure (Cooper and
Schindler, 2003). The data collection tools were subjected to face and content validity
tests. For face validity, experienced researchers including the researcher’s two
supervisors and her colleagues were requested by the researcher to confirm that the study
items would obtain data that meets researcher’s objectives, while for content validity,
data collection instruments were pretested on a sample of tailoring workers and thereafter
modifications made for clarity, meaning and relevance.

49
3.7.2 Test of Reliability
Reliability is the extent to which results are free from error, or the degree to which a
research instrument yields consistent results (Cooper and Schindler, 2003). To ensure
stable and consistent results, the researcher carried out a pilot study to make sure that the
tools for data collection can be relied upon to give information that is accurate. The pilot
study confirmed that the data collection tools could be relied upon. Cronbach’s Alpha
coefficient was used to measure internal consistency. George and Mallery (2003)
suggested the following thresholds: Alpha > 0.9 is Excellent, > 0.8 is Good, > 0.7 is
Acceptable, > 0.6 is Questionable, > 0.5 is Poor. This study adopted 0.7 as an acceptable
lower limit.
To ensure inter rater reliability, the researcher made sure that the raters involved were
supervisors who worked with the tailors daily and knew them. A detailed requirement of
what was expected when rating the participants was also availed to the raters in collecting
qualitative data. Qualitative data heavily depended on the rater’s ability and experience
with the participants.
3.7.3 Test of Multicolinearity
Multicollinearity is a state of very high inter-correlations or inter-associations among the
predictor variables (Lani, 2010). It is therefore a type of disturbance in the data, and if
present, the statistical inferences made about the data may not be reliable. In the presence
of high multicollinearity, the confidence intervals of the coefficients tend to become very
wide and the statistics tend to be very small. Multicollinearity was detected by variance
inflation factor (VIF). VIF measure how much the variance of the estimated regression
coefficients are inflated as compared to when the predictor variables are not linearly
50
related. If the VIF value lies between 1-10 then there is no multicollinearity, but if the
value is <1 or >10 then there is multicollinearity.
3.7.4 Test of Heteroscedasticity
This refers to a phenomenon where data violates a statistical assumption (Rosopa et, al.,
2013). Heteroscedasticity is the violation of homoscedasticity. Ordinary Least-Squares
(OLS) seek to reduce residuals and produce the smallest possible standard errors. OLS
assumes that the variance of the error term in the independent variables is constant
(homoscedastic). The Breusch-Pagan/Cook-Weisberg test method of detecting
heteroscedasticity in linear models was used. This test is designed to detect any linear
form of heteroscedasticity.
3.7.5 Test of Linearity
Linearity test aims to determine if the relationship between independent variable and
dependent variable is linear or not. If the value of the relationship deviates > 0.05 then the
relationship between the independent variable and dependent variable will be linear, and
if the value is < 0.05 then the relationship between the independent variable and the
dependent variable is not linear. Linearity was fixed by removing outliers (Mason and
Perreault, 1991).
3.7.6 Test of Normality
Normality test was intended to determine the distribution of the data for each variable
that were used in the research. The Kolmogorov-Smirnov test (KS-test) determines if two
datasets differ significantly. To determine whether data for each variable was normally

51
distributed, the Kurtosis and Skewness and Kolmogorov-Smirnov and Shapiro-Wilk test
(KS-WS) was carried out.
3.8 Measures of Variables
Operationalisation is the measurement of phenomena that is not directly measurable but
whose existence is indicated by other phenomena. Table 3.1 shows the operationalisation
of variables in this study.

52
Table 3.1: Operationalisation of Variables
No Variable Operational
def.
Indicators Measurement tool
1 Independent
Background
Music
Type of
music/ time of
day Background Music
Intermittent background music
No background music
Rhythm/Motion/Calmness Appendix 1: Rentfrow
and Gosling Preferred
Music Checklist
Appendix 3: Observation
Data Sheet
2 Intervening
Mood
Arousal
Distraction
Expression/Emotions
Arousal (alertness, happiness,
excitement, elation, calmness and
relaxation)
Distraction (stress, sadness, fatigue,
upset, tense)
Appendix 5: Observation
Data Sheet
Appendix 4: Researcher
Administered
Questionnaire 3 Moderating
Personality
Extraversion/
Introversion
Sociable, fun-loving, affectionate,
outgoing, assertive, seeks excitement
(opposite is introversion)
Appendix 2: Eysenck’s
Personality Inventory
Neuroticism/S
tability
Nervous/Upset (Opposite is stability)
4 Moderating
Work
Behaviour
Positive
attitude
Readily available
Willing to get the job done
Goes beyond normal duty to have
work done
Appendix 3: Observation
Data Sheet
Meets
deadlines Organised
Responsible
Maintains clean organised workplace
5 Dependent
Work
Performance
Quantity of
work
No. of units produced Appendix 3: Observation
Data Sheet
Appendix 5: Researcher
Administered
Questionnaire
Quality of
work
No. of units accepted
No. of units rejected
Source: Author, Current study
The sampled factories have a population of 1500 tailors each. They produce garments on
mass production basis. In those factories, work is divided into; assembly section, cutting
section, distribution section, stitching section, quality checking section, pressing area,
printing area and packaging area. At the assembly area, materials are assembled and

53
arranged, then moved to the cutting section. Here, materials are only cut according to
what is to be made/sewn, and then moved to stitching, then to the quality check, where
the quality of the garment is assessed before it goes to pressing area and packaging, ready
for shipment to the US market.
3.9 Data Analysis
Descriptive statistics such as means, standard deviations, frequencies and percentages
were used to summarise the data and show preliminary indication of what to expect in
test of hypotheses. Comparative analysis were done to compare and establish whether
there was a significant difference in performance in the three factories.
After establishing that there was a difference in performance in the three factories, linear
regression analysis was used to now establish the effect of background music on
employee performance. Then the four step regression analysis suggested by Kenny and
Baron (1986) was used to determine the role of employees mood in the relationship
between background music and employee performance, three steps Stepwise Regression
Analysis by Kenny and Baron (1986) was used to establish the role of personality in the
relationship between background music and employee performance, three steps stepwise
regression analysis by Kenny and Baron (1986) was used again to establish the role of
work behaviour in the relationship between background music and employee
performance, and lastly multiple regression analysis was used to establish the joint effect
of background music, mood, work behaviour and personality on employee performance.
The details are presented in table 3.2.
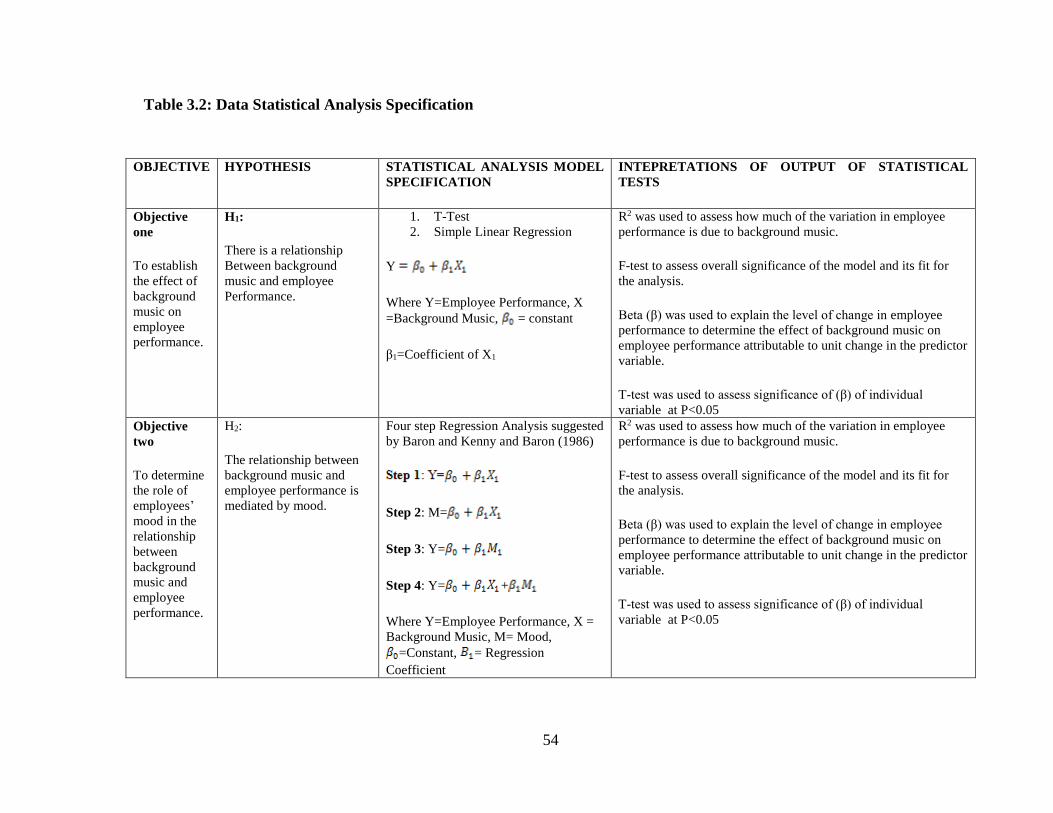
54
Table 3.2: Data Statistical Analysis Specification
OBJECTIVE
HYPOTHESIS STATISTICAL ANALYSIS MODEL
SPECIFICATION
INTEPRETATIONS OF OUTPUT OF STATISTICAL
TESTS
Objective
one
To establish
the effect of
background
music on
employee
performance.
H1:
There is a relationship
Between background
music and employee
Performance.
1. T-Test
2. Simple Linear Regression
Y
Where Y=Employee Performance, X
=Background Music, = constant
β1=Coefficient of X1
R2 was used to assess how much of the variation in employee
performance is due to background music.
F-test to assess overall significance of the model and its fit for
the analysis.
Beta (β) was used to explain the level of change in employee
performance to determine the effect of background music on
employee performance attributable to unit change in the predictor
variable.
T-test was used to assess significance of (β) of individual
variable at P<0.05
Objective
two
To determine
the role of
employees’
mood in the
relationship
between
background
music and
employee
performance.
H2:
The relationship between
background music and
employee performance is
mediated by mood.
Four step Regression Analysis suggested
by Baron and Kenny and Baron (1986)
Step 2: M=
Step 3: Y=
Step 4: Y= +
Where Y=Employee Performance, X =
Background Music, M= Mood,
=Constant, = Regression
Coefficient
R2 was used to assess how much of the variation in employee
performance is due to background music.
F-test to assess overall significance of the model and its fit for
the analysis.
Beta (β) was used to explain the level of change in employee
performance to determine the effect of background music on
employee performance attributable to unit change in the predictor
variable.
T-test was used to assess significance of (β) of individual
variable at P<0.05
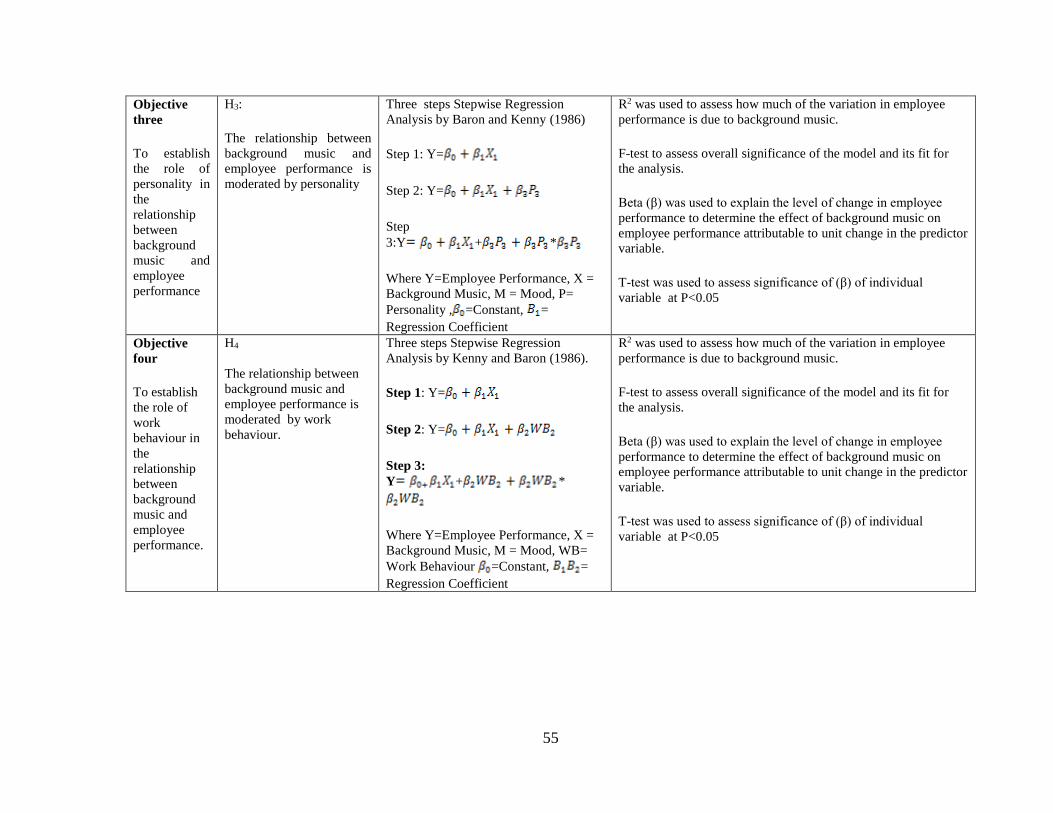
55
Objective
three
To establish
the role of
personality in
the
relationship
between
background
music and
employee
performance
H3:
The relationship between
background music and
employee performance is
moderated by personality
Three steps Stepwise Regression
Analysis by Baron and Kenny (1986)
Step 1: Y=
Step 2: Y=
Step
3:Y + *
Where Y=Employee Performance, X =
Background Music, M = Mood, P=
Personality , =Constant, =
Regression Coefficient
R2 was used to assess how much of the variation in employee
performance is due to background music.
F-test to assess overall significance of the model and its fit for
the analysis.
Beta (β) was used to explain the level of change in employee
performance to determine the effect of background music on
employee performance attributable to unit change in the predictor
variable.
T-test was used to assess significance of (β) of individual
variable at P<0.05
Objective
four
To establish
the role of
work
behaviour in
the
relationship
between
background
music and
employee
performance.
H4
The relationship between
background music and
employee performance is
moderated by work
behaviour.
Three steps Stepwise Regression
Analysis by Kenny and Baron (1986).
Step 1: Y=
Step 2: Y=
Step 3:
Y + *
Where Y=Employee Performance, X =
Background Music, M = Mood, WB=
Work Behaviour =Constant, =
Regression Coefficient
R2 was used to assess how much of the variation in employee
performance is due to background music.
F-test to assess overall significance of the model and its fit for
the analysis.
Beta (β) was used to explain the level of change in employee
performance to determine the effect of background music on
employee performance attributable to unit change in the predictor
variable.
T-test was used to assess significance of (β) of individual
variable at P<0.05

56
Objective
five
To establish
the Joint
effect of
background
music, mood,
work
behavior
personality,
on employee
performance
H5:
The joint effect of
background music, mood,
work behaviour and
personality is greater than
their individual effects
on employee performance
Multiple Regression Analysis
Y=f(BM,M,WB,P)
Y=
R2was used to assess how much of the variation in employee
performance is due to background music.
F-test to assess overall significance of the model and its fit for
the analysis.
Beta (β) was used to explain the level of change in employee
performance to determine the effect of background music on
employee performance attributable to unit change in the predictor
variable.
T-test was used to assess significance of (β) of individual
variable at P<0.05

57
CHAPTER FOUR
PRELIMINARY DATA ANALYSIS AND FINDINGS
4.1 Introduction
This chapter presents research descriptive analysis, findings and discussions. The chapter
consists of descriptive statistics and diagnostic tests on study variables.
4.2 Descriptive Statistics
Descriptive statistics comprise survey response rate, demographic profiles of the EPZ
tailoring workers and the respondents who took part in the study. Percentages, means,
standard deviations and Cronbach’s Alpha coefficient correlations are computed and
presented. These descriptive statistics formed the basis for hypothesis testing and
conclusion.
4.2.1 Response Rate
The study targeted 357 respondents of which 119 were from each of the three factories.
The findings are presented in Table 4.1. The overall response rate was 82%. Preferred
music checklist had a 100% response rate for factory one, 81.5% for factory two and
100% for factory three. Eysenck Personality Inventory had a response rate of 81.5% for
factory one, 67% for factory two and 63% for factory three. Observation checklist had a
response rate of 100% for all the three factories. Researcher administered questionnaire
had a response rate of 92.4% for factory one, 84% for factory two and 78% for factory
three. The response rate was considered satisfactory for all the factories.
To enable assessment of the effect of background music on performance of tailoring
employees’ performance, preferred music checklist per respondent was coded as follows:

58
1 = reflective and complex music, 2 = intense and rebellious music, 3 = upbeat and
conventional music and 4 = energetic and rhythmic music. Under each of the four
categories of preferred music checklist, there were various subcategories. Reflective and
Complex Music (1) had the following subcategories which were coded as in the brackets:
Folks (1.1), Classical (1.2), Blues (1.3) and Jazz (1.4). Intense and Rebellious Music (2)
had the categories: Reggae (2.1), Hip hop (2.2), Heavy Metal (2.3), Ragga (2.4) and Rock
(2.5). Upbeat and Conventional Music (3) had categories: Religious (3.1), Country (3.2)
and Pop (3.3). Energetic and Rhythmic Music (4) had categories Salsa (4.1), Soul (4.2),
Dance Hall (4.3), Calypso (4.4), Rhumba (4.5) and Rap (4.6).
Table 4.1: Response Rate
Factory Research Instrument Population Response
Response
Percentage
Factory One Preferred Music Checklist 119 119 100%
Eysenck’s Personality Inventory 119 97 81.5%
Observation Checklist 119 119 100%
Researcher Administered
Questionnaire 119 110 92.4%
Factory Two Preferred Music Checklist 119 83 81.5%
Eysenck Personality Inventory 119 97 67%
Observation Checklist 119 119 100%
Researcher Administered
Questionnaire 119 100 84%
Factory Three Preferred Music Checklist 119 119 100%
Eysenck Personality Inventory 119 75 63%
Observation Checklist 119 119 100%
Researcher Administered
Questionnaire 119 93 78%
Overall Average Response Rate
82%
Source: Author, Current study

59
4.2.2 Preferred Background Music Survey
The study sought to determine the type of background music that the respondents
preferred. Here, respondents identified the music they love to listen to using Rentfrow
and Gosling (2003). Respondents filled a form/checklist showing their preferred music.
Results from the checklist were used to compile preferred music by the participants that
were later used in the study. The categories included; Reflective and complex
(comprising classical, jazz, folk and blues), intense and rebellious (rock, alternative,
heavy metal), upbeat and conventional (country, pop, soundtracks, religious) and
energetic and rhythmic (rap, soul, electronica).
The findings for the reflective and complex music are presented in Table 4.2.
Table 4.2: Reflective and Complex Music
Reflective and Complex
Music
Expected
no. of
respondents Frequency Percent
Average
Response
Rate
Classical 100 28%
Jazz 168 47%
Blues 1 0.3%
No preferred music under
this category
88 25%
Total 357 357 100 100%
Source: Author, Current study
The findings presented in Table 4.2 indicate that majority of the respondents at 47%
preferred jazz, 28% classical, 25% preferred no music under reflective and complex
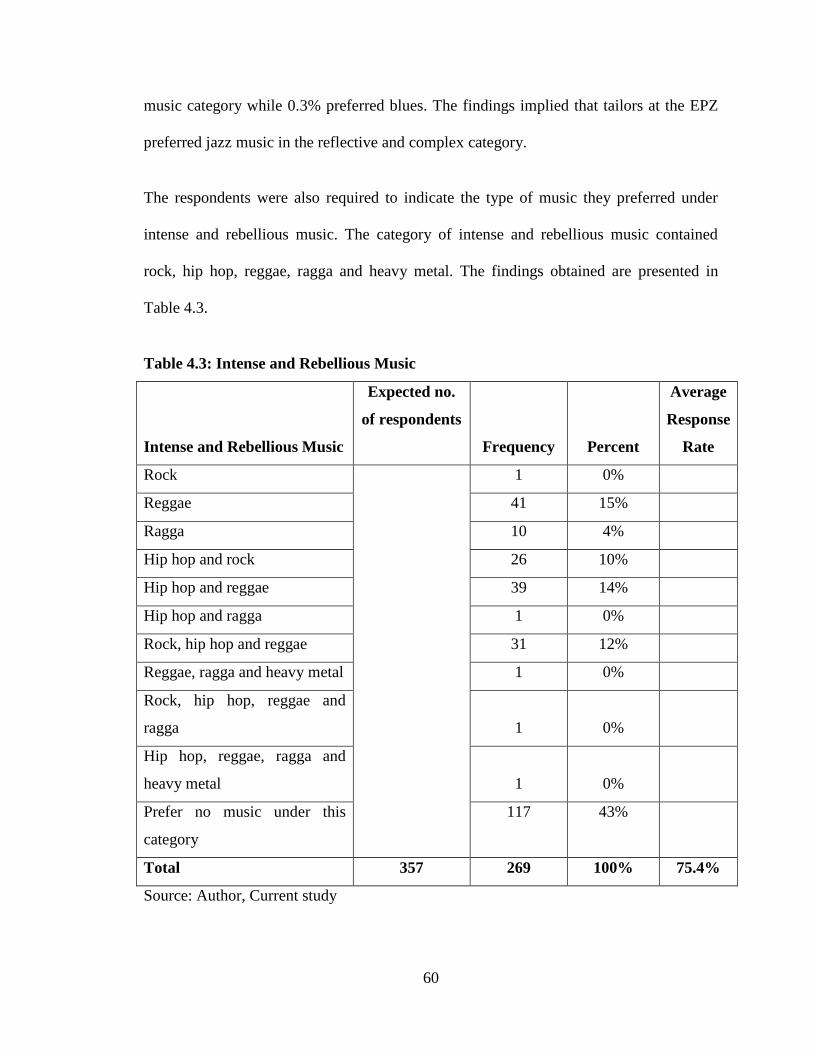
60
music category while 0.3% preferred blues. The findings implied that tailors at the EPZ
preferred jazz music in the reflective and complex category.
The respondents were also required to indicate the type of music they preferred under
intense and rebellious music. The category of intense and rebellious music contained
rock, hip hop, reggae, ragga and heavy metal. The findings obtained are presented in
Table 4.3.
Table 4.3: Intense and Rebellious Music
Intense and Rebellious Music
Expected no.
of respondents
Frequency Percent
Average
Response
Rate
Rock 1 0%
Reggae 41 15%
Ragga 10 4%
Hip hop and rock 26 10%
Hip hop and reggae 39 14%
Hip hop and ragga 1 0%
Rock, hip hop and reggae 31 12%
Reggae, ragga and heavy metal 1 0%
Rock, hip hop, reggae and
ragga 1 0%
Hip hop, reggae, ragga and
heavy metal 1 0%
Prefer no music under this
category
117 43%
Total 357 269 100% 75.4%
Source: Author, Current study

61
Majority of the respondents at 43% did not prefer any type of intense and rebellious
music, 15% preferred reggae music, 14% preferred hip-hop and reggae music, 12%
preferred rock, hip-hop and reggae. Less than one percent of the respondents preferred a
combination of hip-hop and ragga, reggae; ragga and heavy metal; rock, hip hop, reggae
and ragga and hip-hop; reggae, ragga and heavy metal. The findings imply that tailors at
the EPZ preferred less of intense and rebellious music. A substantial percentage of the
respondents also preferred a combination of various types of intense and rebellious
music.
The respondents were also required to indicate the type of music they prefer under the
category of upbeat and conventional music. This category contained religious, country
and pop music. The findings obtained are presented in Table 4.4.
Table 4.4: Upbeat and Conventional Music
Upbeat and Conventional
Music
Expected
no. of
respondents Frequency Percent
Average
Response Rate
None 18 7%
Religious 80 30%
Country and religious 60 22%
Religious and pop 38 14%
Country, religious and pop 73 27%
Total 357 269 100% 75.4%
Source: Author, Current study
The findings presented in Table 4.4 indicated that most of the respondent at 30%
preferred religious music, 27% preferred country, religious and pop music, 22% preferred
62
country and religious, 14% preferred religious and pop and 7% preferred none of the
upbeat and conventional music. The findings implied that the EPZ tailors preferred more
of religious music since up to 93% preferred religious music combined with other types
of music. While probing them further on which type of religious music they preferred,
respondents said they preferred East African gospel music. East African gospel music
relates to their needs, it is mostly in the language they understand hence it speaks directly
to their needs.
Language preferred in music was Kiswahili and other East African local languages. This
study to some extent supports Dorrell's (2005) definition of music which says music is a
sound that we enjoy hearing. From Dorrell’s definition it is evident that there are sounds
that some people enjoy hearing while there are other sounds that are not enjoyed by other
people. What will sound as music to one person may be noise to another because there
are different types of music and people perceive music in differing forms. This study also
supports Jäncke and Sandmann (2010) who suggest that if background music is positively
related to employee performance, then playing upbeat and conventional music would
have better results than all the other categories. This category was the most preferred by
the tailors at the EPZ. Religious gospel music was then played most of the time during
the study.
In the study, participants were also required to indicate whether they preferred energetic
and rhythmic music. The category of energetic and rhythmic music included rap, soul,
salsa, calypso, rhumba and dance hall. The findings are presented in Table 4.5.

63
Table 4.5: Energetic and Rhythmic Music
Energetic and
Rhythmic Music
Expected
no. of
respondents Frequency Percent
Average
Response
Rate
None 152 57%
Rap 1 0%
Rhumba 76 28%
Rap and soul 1 0%
Rap and rhumba 18 7%
Soul and rhumba 21 8%
Total 357 269 100% 75.4%
Source: Author, Current study
The findings presented in Table 4.5 indicated that majority of the respondents at 57% did
not prefer any music under energetic and rhythmic music category, 28% rhumba, 0%
preferred rap music, rap and soul, 8% soul and rhumba while 7% preferred rap and
rhumba. The findings implied that employees did not prefer energetic and rhythmic
music.
Majority of the respondents preferred upbeat and conventional music, mostly religious
music. According to Rentfrow and Gosling, people who prefer upbeat and conventional
music are extraverted, emotional stable and have high self-esteem (Rentfrow and
Gosling, 2003). This was followed by reflective and complex music where most
respondents preferred jazz music. However, in the interview guide where they were to list
music they love listening to, none of the participants listed jazz. This was also evident
when participants showed displeasure when jazz was played in the background saying it
interfered with their movement at work. The least preferred music was energetic and
rhythmic music which included rap, soul, salsa, calypso, rhumba and dance hall.
64
Music and life are inseparable. Scheirer (2000) posits that music is one of the most
striking activities that separate humans from animals. Music plays a role in rituals of birth
and puberty, at marriage and death, in initiations, and in rituals of livelihood for example
hunting, farming, gathering, etc. Notably, music play a significant role in work
productivity, from the above findings, it is important to consider that people’s music or
folk music plays an important role in their activities. Music that is understood in
language, in context, and content speaks to the inner feelings or state of a person and aids
productivity. This study confidently posits that Familiar background music aids an
employee’s performance.
4.2.3 Mood of the Respondents
The mood of the respondents was gauged through observation. The measurement of
mood was based on the level of the EPZ worker’s arousal or distraction shown by the
expressions and emotions portrayed by the respondents. Mood was then categorised into
positive (arousal) or negative (distracter) mood. The following indicators were used to
measure positive mood: happiness, elation, excitement, alertness, calmness and being
relaxed. For negative mood, the researcher looked out for visible signs of sadness,
fatigue, stress, being tense and upset. Positive mood (happiness, elation, excitement,
alertness, calmness and being relaxed) was coded as 2, while negative mood (sadness,
fatigue, stress, being tense and upset) was coded as 1. Participants’ mood was observed
as per the above categorisation and recorded (See appendix 8). From the data, an analysis
of each factory was done as presented in tables 4.6, 4.7, and 4.8.

65
4.2.3.1 Factory One
In factory one, where music was played throughout employee’s mood was observed and
recorded. The results are presented in Table 4.6
Table 4.6: Participants’ Mood in Factory One
FACTORY 1: Music Played
Day 1
Freque
ncy
%
Day 2
Frequ
ency
%
Day 3
Frequ
ency
%
Day 4
Frequ
ency
%
Day 5
Frequen
cy
% Mean
%
Morning:
negative
mood
43 39 30 25.2 33 27.7 32 26.9 25 21 27.97
Morning:
positive
mood
76 63.9 89 74.8 86 78.2 87 73.1 94 78.99 73.79
Afternoon
: negative
mood
50 42 41 34.5 30 25.2 18 15.1
3
19 15.97 26.9
Afternoon
: positive
mood
69 57.98 78 65.6 89 74.8 101 84.9 100 84.03 73.44
Source: Author, Current study
In factory one where music was played throughout the study, on day one of the study, the
mood of the tailors involved in the study did not have huge disparity compared to day
five of the study as shown in Table 4.6. In day one for example, the difference between
positive and negative mood was not so elaborate. There were 43 recordings of negative
mood in the morning and 50 of the same in the afternoon and 76 recordings of positive
mood in the morning on the same day and 69 of the same in the afternoon. In day two,
three and four negative mood declined (30, 33 and 32 in the morning and 41, 30 and 18 in
the afternoon).
Positive mood recordings increased and stabilised at 89, 86 and 87 in the morning and 78,
89 and 101 in the afternoon for day two, three and four. In day two and three, positive

66
mood of the participants was enhanced, while negative mood started declining. In day
four and five, there was a sharp decline in negative mood especially in the afternoon and
an increase in positive mood since only 25 participants had a negative mood in the
morning and 21 participants in the afternoon. On day five, 94 participants in the morning
and 100 participants in the afternoon had positive mood. This was surprising because
being a Friday, their energy levels were expected to be low yet in this case, their energy
levels were still high; they were elated and portrayed feelings of happiness.
On the average, positive mood of participants increased from 63.9% in day one to
78.99% in day five in the morning, and from 57.98% in day one to 84% in day five in the
afternoon. Generally, in factory one, talking was less among workers and respondents
mostly talked when enquiring about something; the tailors were more relaxed and happy
and were willing to take up new assignments. Majority of the tailors were calm and alert.
4.2.3.2 Factory Two
Music was played intermittently in factory two. Tailors’ mood was observed and
recorded whether or not there was music. The results are presented in Table 4.7.
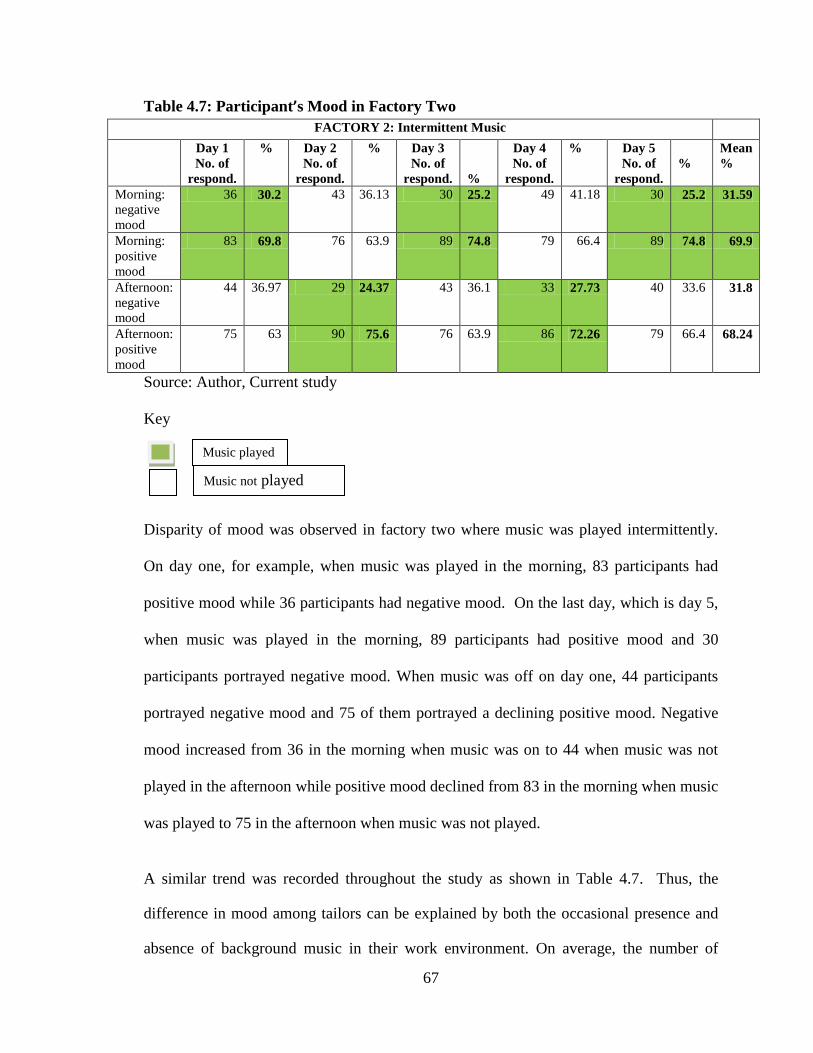
67
Table 4.7: Participant’s Mood in Factory Two
FACTORY 2: Intermittent Music
Day 1
No. of
respond.
% Day 2
No. of
respond.
% Day 3
No. of
respond.
%
Day 4
No. of
respond.
%
Day 5
No. of
respond.
%
Mean
%
Morning:
negative
mood
36 30.2 43 36.13 30 25.2 49 41.18 30 25.2 31.59
Morning:
positive
mood
83 69.8 76 63.9 89 74.8 79 66.4 89 74.8 69.9
Afternoon:
negative
mood
44 36.97 29 24.37 43 36.1 33 27.73 40 33.6 31.8
Afternoon:
positive
mood
75 63 90 75.6 76 63.9 86 72.26 79 66.4 68.24
Source: Author, Current study
Key
Disparity of mood was observed in factory two where music was played intermittently.
On day one, for example, when music was played in the morning, 83 participants had
positive mood while 36 participants had negative mood. On the last day, which is day 5,
when music was played in the morning, 89 participants had positive mood and 30
participants portrayed negative mood. When music was off on day one, 44 participants
portrayed negative mood and 75 of them portrayed a declining positive mood. Negative
mood increased from 36 in the morning when music was on to 44 when music was not
played in the afternoon while positive mood declined from 83 in the morning when music
was played to 75 in the afternoon when music was not played.
A similar trend was recorded throughout the study as shown in Table 4.7. Thus, the
difference in mood among tailors can be explained by both the occasional presence and
absence of background music in their work environment. On average, the number of
Music played
Music not played
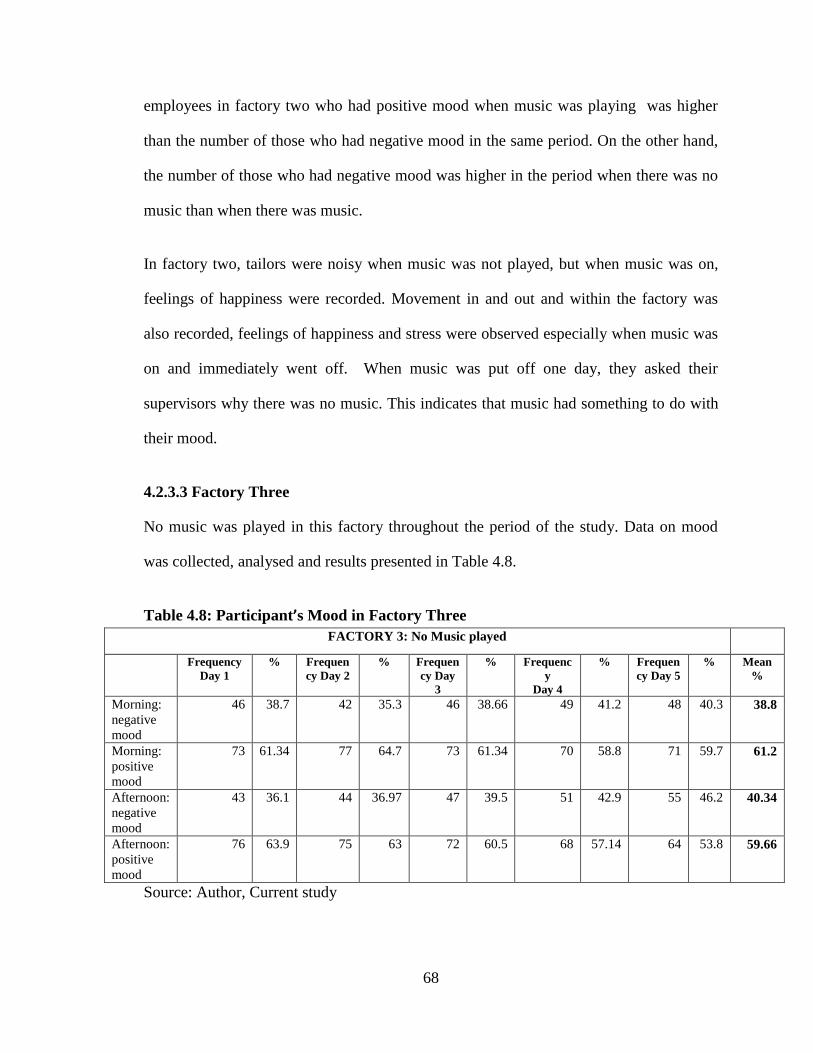
68
employees in factory two who had positive mood when music was playing was higher
than the number of those who had negative mood in the same period. On the other hand,
the number of those who had negative mood was higher in the period when there was no
music than when there was music.
In factory two, tailors were noisy when music was not played, but when music was on,
feelings of happiness were recorded. Movement in and out and within the factory was
also recorded, feelings of happiness and stress were observed especially when music was
on and immediately went off. When music was put off one day, they asked their
supervisors why there was no music. This indicates that music had something to do with
their mood.
4.2.3.3 Factory Three
No music was played in this factory throughout the period of the study. Data on mood
was collected, analysed and results presented in Table 4.8.
Table 4.8: Participant’s Mood in Factory Three
FACTORY 3: No Music played
Frequency
Day 1
% Frequen
cy Day 2
% Frequen
cy Day
3
% Frequenc
y
Day 4
% Frequen
cy Day 5
% Mean
%
Morning:
negative
mood
46 38.7 42 35.3 46 38.66 49 41.2 48 40.3 38.8
Morning:
positive
mood
73 61.34 77 64.7 73 61.34 70 58.8 71 59.7 61.2
Afternoon:
negative
mood
43 36.1 44 36.97 47 39.5 51 42.9 55 46.2 40.34
Afternoon:
positive
mood
76 63.9 75 63 72 60.5 68 57.14 64 53.8 59.66
Source: Author, Current study

69
In factory three where music was not played at all, change in the mood of the participants
for morning and afternoon did not have a huge disparity. Positive mood observed ranged
between 64 participants and 77 participants across all the days while negative mood
ranged from 42 participants to 55 participants for all the 5 days. Tailors, especially in the
afternoon, looked bored, stressed, tired and noisy, and there was too much movement in
and out of the factory and within. Positive mood recorded in this factory was alertness;
majority of the tailors were alert while doing their assignments. From the study findings,
it is evident that background music played a key role in boosting the mood of the
respondent. Overall, positive mood had a mean of 61.2% in the morning and 59.66% in
the afternoon, while negative mood had a mean of 38.8% in the morning and 40.34% in
the afternoon.
4.2.4 Personality of the Respondents
To determine personality types of the tailors, Eysenck’s Personality Inventory (EPI) was
administered to the participants. The results were used to classify the respondents into
unstable extravert, unstable introvert, stable extravert and stable introvert. The results of
the personality test are presented in Table 4.9.
Table 4.9: Distribution of The Respondents by Personality Types
Personality
Expected
no. of
respondents Frequency Percent
Average
Response Rate
Unstable
Extravert
62 23%
Unstable Introvert 22 8%
Stable Extravert 138 51%
Stable Introvert 47 17%
Total 357 269 100% 75.35%
Source: Author, Current study
70
The findings presented in Table 4.9 indicate that majority of the respondents at 51% were
stable extraverts, 23% were unstable extraverts, and 17% were stable introverts while 8%
were unstable introverts. Majority of tailors at 74% were extraverts, this means they need
external stimulation to bring them up to an optimal level of performance. Thus
background music acted as an external stimulant that enabled them to reach a higher level
of performance. Most of them were stable extraverts (51%), implying that they had low
activation thresholds and needed external stimulation.
4.2.5 Work Behaviour
Respondents were observed for a period of three weeks to ascertain their actual behavior
when their preferred music is played and when it is not played. Observation data sheet
was used to record the participants work behaviour. Recording was done daily (see
appendix 9) and later a summary of behaviour was undertaken to come up with
information on how the tailors generally behaved. In factory one, music was on
throughout while in factory two, music was played at regular intervals i.e. on and off. For
example, music was played in factory 2 in the morning, and off in the afternoon, and off
in the morning and on in the afternoon for a period of three weeks at intervals to ascertain
the tailor’s response to music and their resultant work behavior and performance.
Music was not played in the third factory. The third factory acted as a control group
where data collected was compared with the data from the other two factories so as to
ascertain whether there was any difference in performance that could be attributed to
background music. Information on the tailor’s work behavior was recorded by the
researcher and two assistants in a daily log for the 3 week period during which data was
collected. The summaries are in Tables 4.10, 4.11, and 4.12
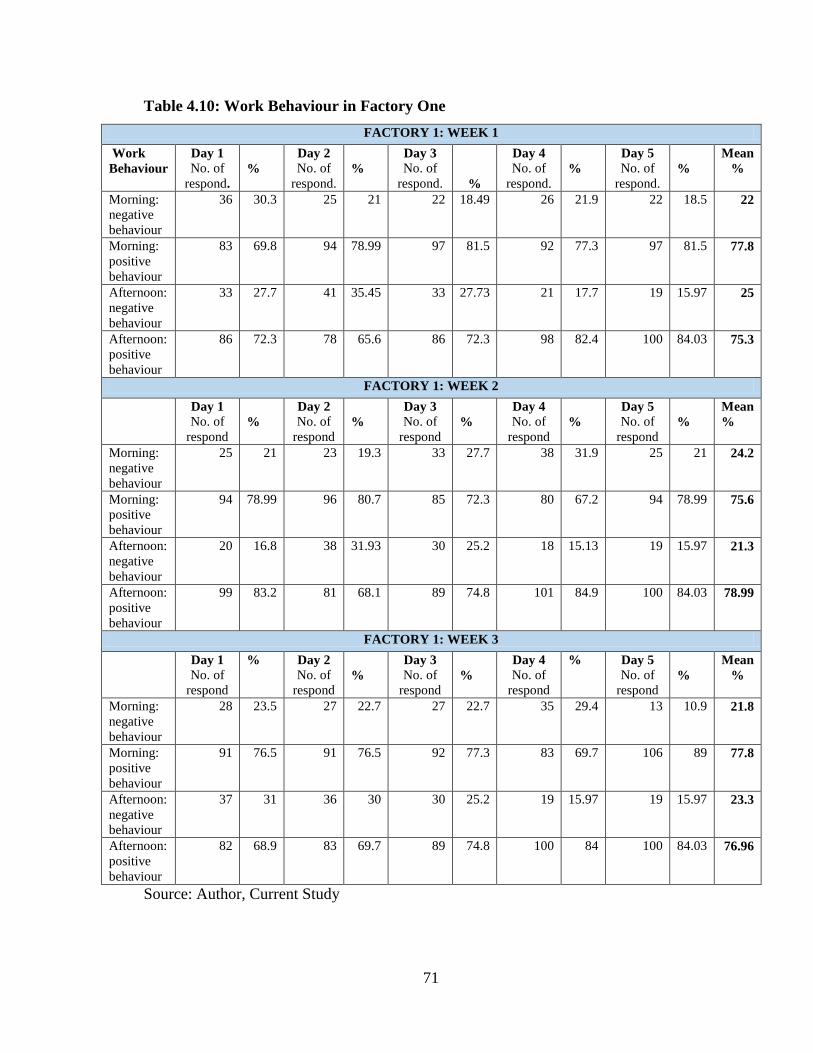
71
Table 4.10: Work Behaviour in Factory One
FACTORY 1: WEEK 1
Work
Behaviour
Day 1
No. of
respond.
%
Day 2
No. of
respond.
%
Day 3
No. of
respond.
%
Day 4
No. of
respond.
%
Day 5
No. of
respond.
%
Mean
%
Morning:
negative
behaviour
36 30.3 25 21 22 18.49 26 21.9 22 18.5 22
Morning:
positive
behaviour
83 69.8 94 78.99 97 81.5 92 77.3 97 81.5 77.8
Afternoon:
negative
behaviour
33 27.7 41 35.45 33 27.73 21 17.7 19 15.97 25
Afternoon:
positive
behaviour
86 72.3 78 65.6 86 72.3 98 82.4 100 84.03 75.3
FACTORY 1: WEEK 2
Day 1
No. of
respond
%
Day 2
No. of
respond
%
Day 3
No. of
respond
%
Day 4
No. of
respond
%
Day 5
No. of
respond
%
Mean
%
Morning:
negative
behaviour
25 21 23 19.3 33 27.7 38 31.9 25 21 24.2
Morning:
positive
behaviour
94 78.99 96 80.7 85 72.3 80 67.2 94 78.99 75.6
Afternoon:
negative
behaviour
20 16.8 38 31.93 30 25.2 18 15.13 19 15.97 21.3
Afternoon:
positive
behaviour
99 83.2 81 68.1 89 74.8 101 84.9 100 84.03 78.99
FACTORY 1: WEEK 3
Day 1
No. of
respond
%
Day 2
No. of
respond
%
Day 3
No. of
respond
%
Day 4
No. of
respond
%
Day 5
No. of
respond
%
Mean
%
Morning:
negative
behaviour
28 23.5 27 22.7 27 22.7 35 29.4 13 10.9 21.8
Morning:
positive
behaviour
91 76.5 91 76.5 92 77.3 83 69.7 106 89 77.8
Afternoon:
negative
behaviour
37 31 36 30 30 25.2 19 15.97 19 15.97 23.3
Afternoon:
positive
behaviour
82 68.9 83 69.7 89 74.8 100 84 100 84.03 76.96
Source: Author, Current Study

72
In this factory, negative behaviour dropped from 30.3% in week one, day one in the
morning to 10.9% in week three, day five, in the morning while positive behaviour
increased from 69% on day one, week one in the morning to 89% on week three day five
in the morning. For factory one, work behaviour of the tailors kept improving. There was
less of negative work behaviour and positive work behaviour improved. Movement was
reduced and talking was less. There was improved concentration and resilience among
the tailors. The tailors were more relaxed and energized, were more flexible and focused
than before, and were cheerful, swift, and agile. This positive work behaviour led to
improved employee performance.
In factory one for example, where music was played all through employee performance
increased. This shows that background music contributed to positive behaviour of the
tailors in the factory which eventually led to an increase in performance of the tailors at
the factory.
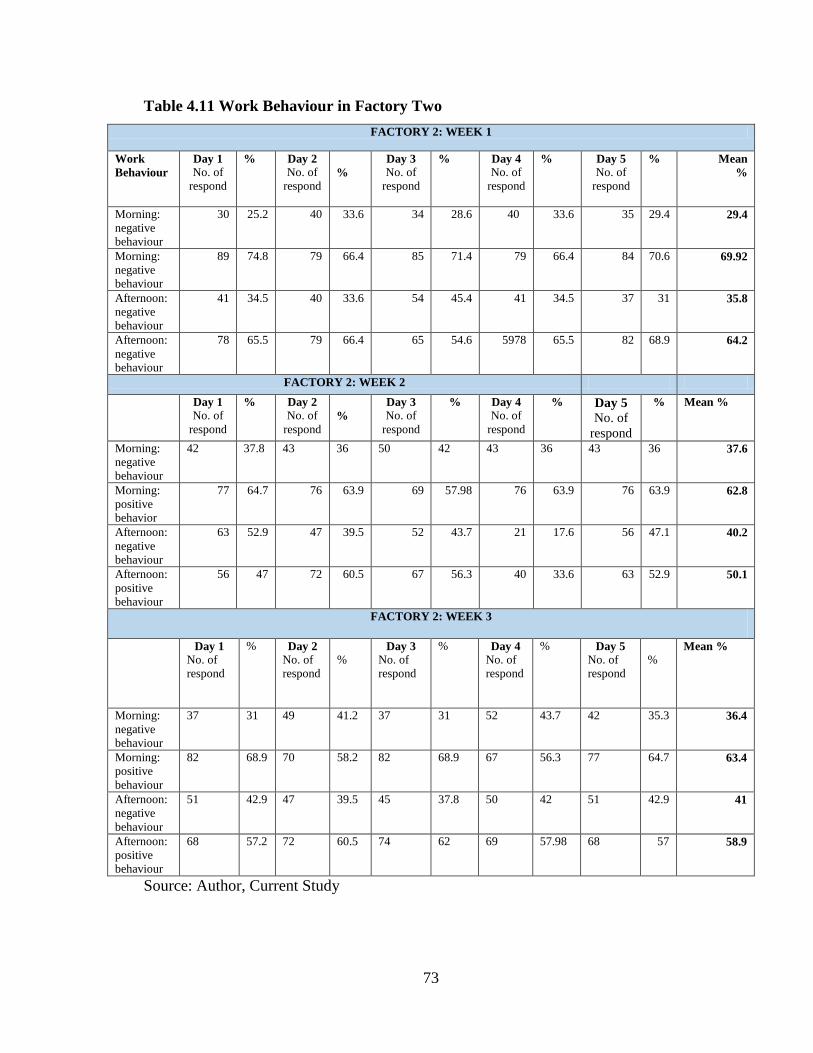
73
Table 4.11 Work Behaviour in Factory Two
FACTORY 2: WEEK 1
Work
Behaviour
Day 1
No. of
respond
%
Day 2
No. of
respond
%
Day 3
No. of
respond
%
Day 4
No. of
respond
%
Day 5
No. of
respond
%
Mean
%
Morning:
negative
behaviour
30 25.2 40 33.6 34 28.6 40 33.6 35 29.4 29.4
Morning:
negative
behaviour
89 74.8 79 66.4 85 71.4 79 66.4 84 70.6 69.92
Afternoon:
negative
behaviour
41 34.5 40 33.6 54 45.4 41 34.5 37 31 35.8
Afternoon:
negative
behaviour
78 65.5 79 66.4 65 54.6 5978 65.5 82 68.9 64.2
FACTORY 2: WEEK 2
Day 1
No. of
respond
%
Day 2
No. of
respond
%
Day 3
No. of
respond
% Day 4
No. of
respond
% Day 5
No. of
respond
% Mean %
Morning:
negative
behaviour
42 37.8 43 36 50 42 43 36 43 36 37.6
Morning:
positive
behavior
77 64.7 76 63.9 69 57.98 76 63.9 76 63.9 62.8
Afternoon:
negative
behaviour
63 52.9 47 39.5 52 43.7 21 17.6 56 47.1 40.2
Afternoon:
positive
behaviour
56 47 72 60.5 67 56.3 40 33.6 63 52.9 50.1
FACTORY 2: WEEK 3
Day 1
No. of
respond
%
Day 2
No. of
respond
%
Day 3
No. of
respond
%
Day 4
No. of
respond
%
Day 5
No. of
respond
%
Mean %
Morning:
negative
behaviour
37 31 49 41.2 37 31 52 43.7 42 35.3 36.4
Morning:
positive
behaviour
82 68.9 70 58.2 82 68.9 67 56.3 77 64.7 63.4
Afternoon:
negative
behaviour
51 42.9 47 39.5 45 37.8 50 42 51 42.9 41
Afternoon:
positive
behaviour
68 57.2 72 60.5 74 62 69 57.98 68 57 58.9
Source: Author, Current Study
74
Data on employee’s work behaviour in factory two where music was played
intermittently is presented in Table 4.11. In this factory, majority of workers took time to
finish a task, were very tired at the end of the day, were ready and willing to work thus
meeting daily targets, noise was recorded, movement in and out of the factory was
observed, organised work spaces were recorded, tailors were punctual, and when music
was put off one day, they asked their supervisors why there was no music. When music
was off, there were mixed feelings and behaviours elicited from the tailors. In some
instances, there were cases of indiscipline reported such as quarrelling.
In factory three where there was no background music played, there were organised
tailoring tables, noise was recorded, cases of indiscipline were reported, most were
punctual to work, a few cases of lateness also reported, too much movement in and out of
the factory and within, were ready for new tasks, high levels of concentration on task at
hand and met deadlines/targets set. Results of factory three are presented in Table 4.12.
In factory three, the mean of positive behaviour was between 58.8% and 51.7% while
negative behaviour was between 48.7% and 41.2%. Table 4.13 shows a summary of the
participant’s positive and negative behaviour as observed during the research period.
There was no major difference in work behaviour observed for tailors in factory three.

75
Table 4.12: Work Behaviour in Factory Three
FACTORY 3: Week 1
Work
Behaviour
Day 1
No. of respond
%
Day 2
No. of respond
%
Day 3
No. of respond
%
Day 4
No. of respond
%
Day 5
No. of respond
% Mean
%
Morning:
negative
behaviour
52 43.7 53 44.5 51 42.9 45 37.8 45 37.8 41.3
Morning:
positive
behaviour
67 56.3 66 55.5 68 57.1 74 62.2 74 62.2 58.7
Afternoon:
negative
behaviour
53 44.5 53 44.5 61 51.3 56 47 57 47.9 47
Afternoon:
positive
behaviour
66 55.5 66 55.5 58 48.7 63 52.9 62 52.1 52.9
FACTORY 3: Week 2
Day 1
No. of
respon
d
%
Day 2
No. of
respon
d
%
Day 3
No. of
respond
%
Day 4
No. of
respond
%
Day 5
No. of
respond
%
Mean %
Morning:
negative
behaviour
55 46.2 45 37.8 55 46.2 45 37.8 45 37.8 41.2
Morning:
positive
behaviour
64 53.8 74 62.2 64 53.8 74 62.2 74 62.2 58.8
Afternoon:
negative
behaviour
62 52 53 44.5 61 51.3 56 47.6 57 47.9 48.7
Afternoon:
positive
behaviour
57 47.9 66 55.5 58 48.7 63 52.9 62 52 51.4
FACTORY 3: Week 3
Day 1
No. of
respon
d
%
Day 2
No. of
respon
d
%
Day 3
No. of
respond
%
Day 4
No. of
respond
%
Day 5
No. of
respond
%
Me
an
%
Morning:
negative
behaviour
61 51.3 57 47.9 55 46.2 56 47 58 48.7 48.2
Morning:
positive
behaviour
58 48.7 62 52 64 53.8 63 52.9 61 51.3
51.7
Afternoon:
negative
behaviour
55 46.2 53 44.5 59 49.6 51 42.9 67 56.3 47.8
Afternoon:
positive
behaviour
64 53.8 66 55.5 60 50.4 68 57 52 43.7 52.1
Source: Author, Current Study
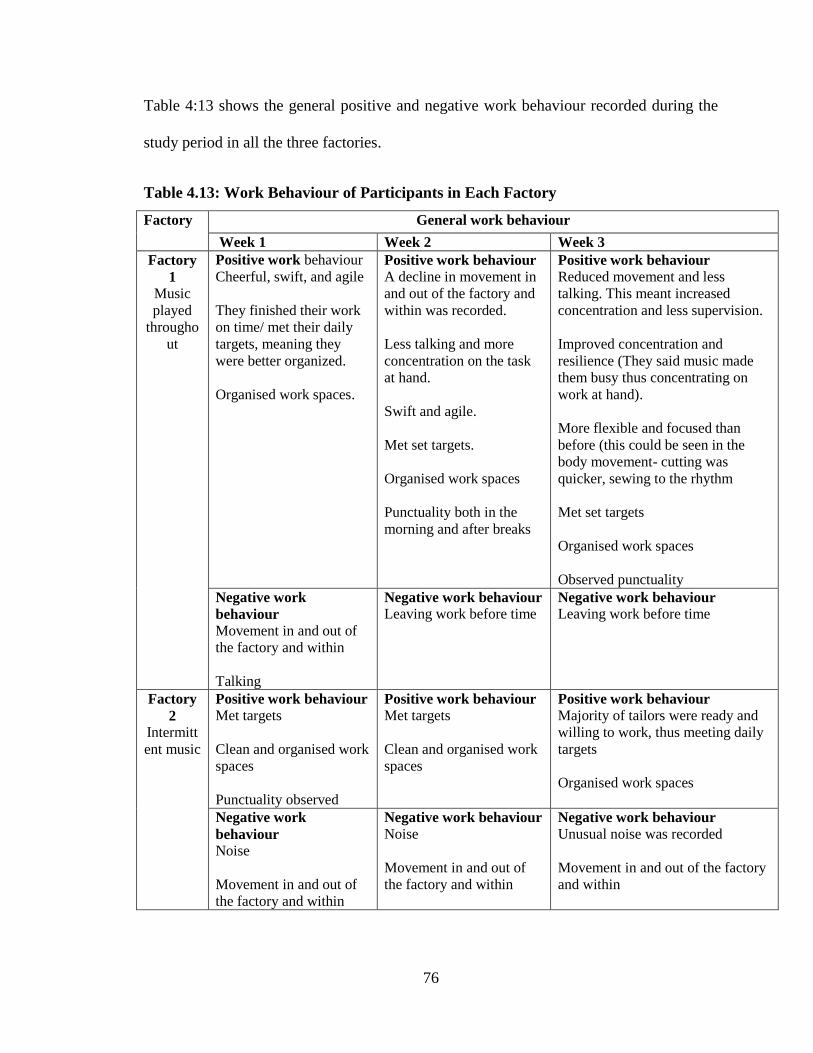
76
Table 4:13 shows the general positive and negative work behaviour recorded during the
study period in all the three factories.
Table 4.13: Work Behaviour of Participants in Each Factory
Factory General work behaviour
Week 1 Week 2 Week 3
Factory
1
Music
played
througho
ut
Positive work behaviour
Cheerful, swift, and agile
They finished their work
on time/ met their daily
targets, meaning they
were better organized.
Organised work spaces.
Positive work behaviour
A decline in movement in
and out of the factory and
within was recorded.
Less talking and more
concentration on the task
at hand.
Swift and agile.
Met set targets.
Organised work spaces
Punctuality both in the
morning and after breaks
Positive work behaviour
Reduced movement and less
talking. This meant increased
concentration and less supervision.
Improved concentration and
resilience (They said music made
them busy thus concentrating on
work at hand).
More flexible and focused than
before (this could be seen in the
body movement- cutting was
quicker, sewing to the rhythm
Met set targets
Organised work spaces
Observed punctuality
Negative work
behaviour
Movement in and out of
the factory and within
Talking
Negative work behaviour
Leaving work before time Negative work behaviour
Leaving work before time
Factory
2
Intermitt
ent music
Positive work behaviour
Met targets
Clean and organised work
spaces
Punctuality observed
Positive work behaviour
Met targets
Clean and organised work
spaces
Positive work behaviour
Majority of tailors were ready and
willing to work, thus meeting daily
targets
Organised work spaces
Negative work
behaviour
Noise
Movement in and out of
the factory and within
Negative work behaviour
Noise
Movement in and out of
the factory and within
Negative work behaviour
Unusual noise was recorded
Movement in and out of the factory
and within
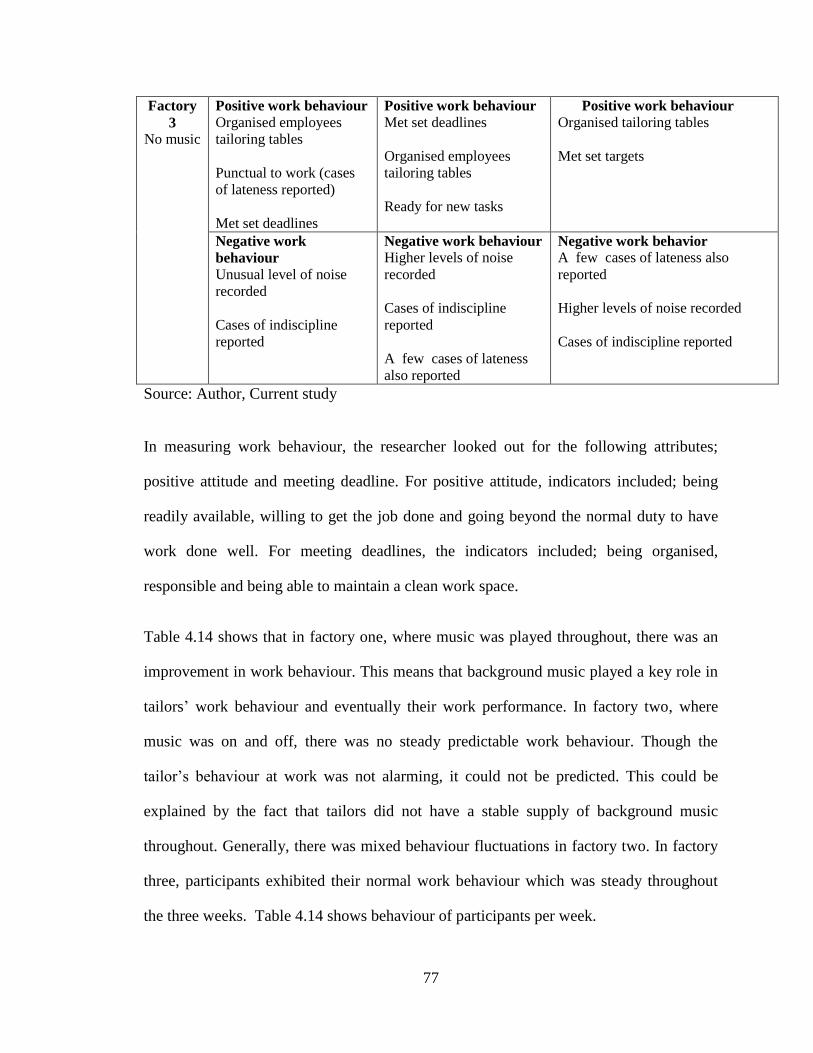
77
Factory
3
No music
Positive work behaviour
Organised employees
tailoring tables
Punctual to work (cases
of lateness reported)
Met set deadlines
Positive work behaviour
Met set deadlines
Organised employees
tailoring tables
Ready for new tasks
Positive work behaviour
Organised tailoring tables
Met set targets
Negative work
behaviour
Unusual level of noise
recorded
Cases of indiscipline
reported
Negative work behaviour
Higher levels of noise
recorded
Cases of indiscipline
reported
A few cases of lateness
also reported
Negative work behavior
A few cases of lateness also
reported
Higher levels of noise recorded
Cases of indiscipline reported
Source: Author, Current study
In measuring work behaviour, the researcher looked out for the following attributes;
positive attitude and meeting deadline. For positive attitude, indicators included; being
readily available, willing to get the job done and going beyond the normal duty to have
work done well. For meeting deadlines, the indicators included; being organised,
responsible and being able to maintain a clean work space.
Table 4.14 shows that in factory one, where music was played throughout, there was an
improvement in work behaviour. This means that background music played a key role in
tailors’ work behaviour and eventually their work performance. In factory two, where
music was on and off, there was no steady predictable work behaviour. Though the
tailor’s behaviour at work was not alarming, it could not be predicted. This could be
explained by the fact that tailors did not have a stable supply of background music
throughout. Generally, there was mixed behaviour fluctuations in factory two. In factory
three, participants exhibited their normal work behaviour which was steady throughout
the three weeks. Table 4.14 shows behaviour of participants per week.

78
Table 4.14: Work Behaviour of Participants Per Factory
WK A. Positive Attitude
1. Readily Available
F1 (%) F2 (%) F3 (%) Work behaviour observed
1 80 82 80 Here, behaviour included being available when
required by either colleagues or supervisors
(Agility/swiftness/punctuality. 2 86 86 81
3 93 84 82
2. Willing to get job done
1 91 82 84 Here, attributes observed included
concentration and focus on work at hand
(Concentration/resilience/focus). 2 91 86 83
3 93 86 82
3. Going beyond normal duty to have work done
1 87 78 78 Here, researcher looked out for
sportsmanship/teamwork and initiatives e.g.
being able to help one another in case of
slowed process(Flexibility/teamwork).
2 90 86 79
3 93 84 77
B. Meets Deadlines
1. Organised
1 93 87 86 Here, the researcher looked out for organised
tools of trade, orderliness, preparedness and
how controlled participants were. 2 94 89 84
3 97 87 86
2. Responsible
1 90 89 86 Here, the researcher looked out for participants
ability to be accountable, liable/answerable 2 91 87 88
3 94 90 86
3. Clean Workspace
1 91 90 83 Here, the researcher looked out for clean work
space. Tailors generally have a lot of things on
their working area (Scissors, tape measure,
blade, chalk, pieces of cloth, thread etc.) The
tailors were expected to have clean work
space, materials and equipment were arranged
and only used when required.
2 92 89 82
3 93 88 84
Source: Author, Current study
4.2.6 Employee Performance
Respondents were observed for a period of four weeks. In factory one, music was played
throughout while in factory two music was on and off (e.g. Music was played in the
morning, and off in the afternoon, and off in the morning and on in the afternoon for a
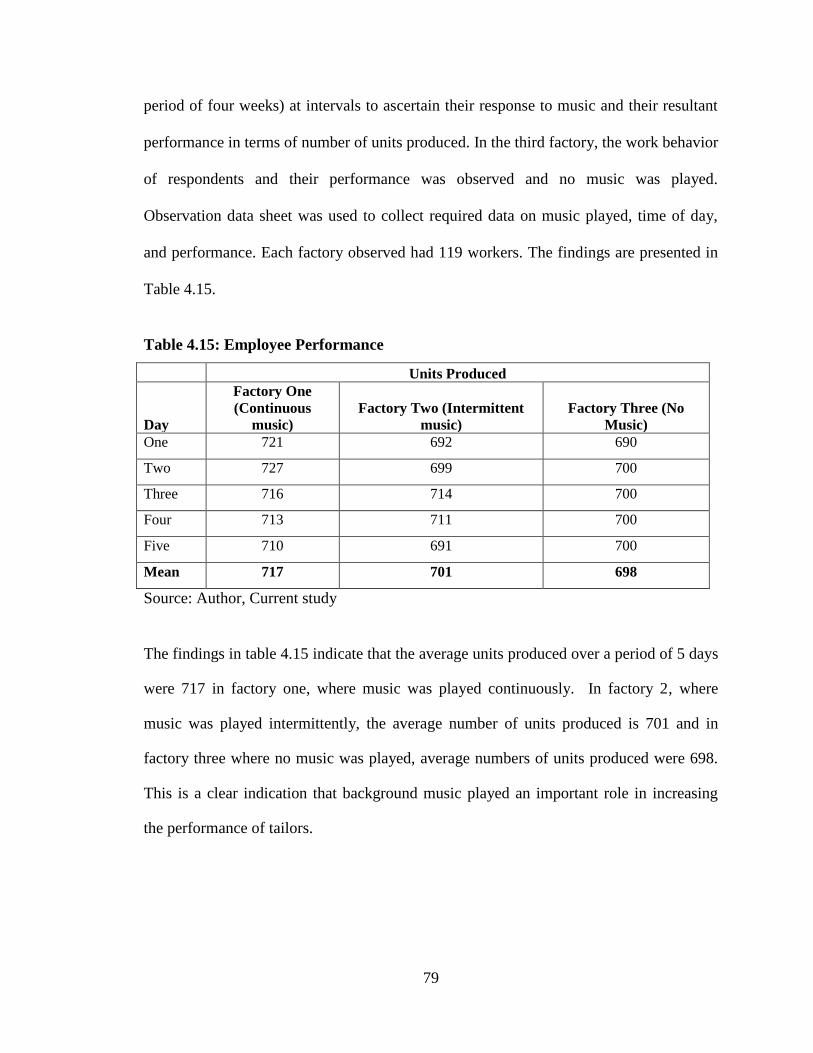
79
period of four weeks) at intervals to ascertain their response to music and their resultant
performance in terms of number of units produced. In the third factory, the work behavior
of respondents and their performance was observed and no music was played.
Observation data sheet was used to collect required data on music played, time of day,
and performance. Each factory observed had 119 workers. The findings are presented in
Table 4.15.
Table 4.15: Employee Performance
Units Produced
Day
Factory One
(Continuous
music) Factory Two (Intermittent
music) Factory Three (No
Music) One 721 692 690
Two 727 699 700
Three 716 714 700
Four 713 711 700
Five 710 691 700
Mean 717 701 698
Source: Author, Current study
The findings in table 4.15 indicate that the average units produced over a period of 5 days
were 717 in factory one, where music was played continuously. In factory 2, where
music was played intermittently, the average number of units produced is 701 and in
factory three where no music was played, average numbers of units produced were 698.
This is a clear indication that background music played an important role in increasing
the performance of tailors.

80
In factory one, day one for example, tailors produced 717 garments that were packaged
for shipment to the US market compared to 692 in factory two and 690 in factory three.
The difference could be attributed to preferred background music being played in factory
one, while in factory two, the tailors did not meet the target and this could be due to the
confusion brought about by music being on and off. As much as this study cannot
authoritatively explain the results in factory three reasons could range from anticipation
to lack of external stimulation.
4.3 General Information on the Respondents
An analysis of the researcher administered questionnaire was also done by the researcher
for a period of two weeks. The researcher administered questionnaire consisted of
background information on the respondents and study variables. After it was
administered, an interview was done to debrief the respondents and detect those among
the participants that had guessed the research hypotheses in order to exclude them from
final data analysis.
4.3.1 Age of the Respondents
The study sought to determine the age of the respondents. It was important to determine
the age of respondents because research has shown that different groups prefer different
types of music. According to Lamere (2014), music is distinctive for a particular
demographic. The findings are presented in Table 4.16.
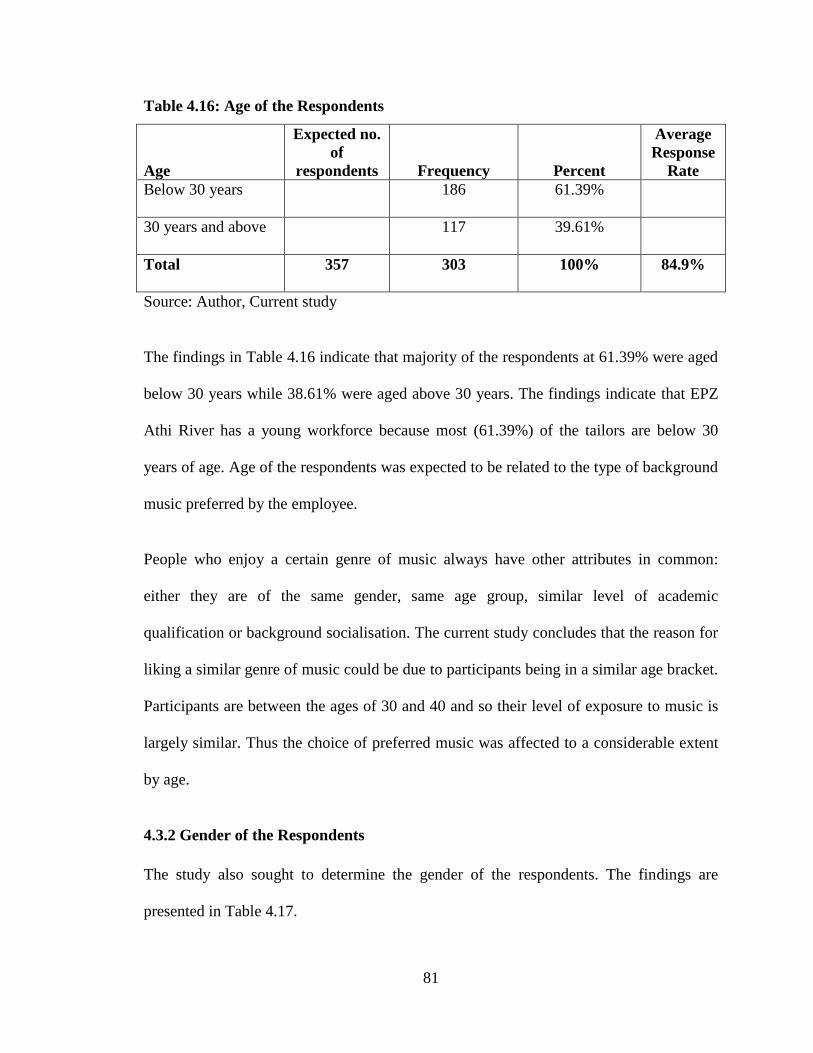
81
Table 4.16: Age of the Respondents
Age
Expected no.
of
respondents Frequency Percent
Average
Response
Rate
Below 30 years 186 61.39%
30 years and above 117 39.61%
Total 357 303 100% 84.9%
Source: Author, Current study
The findings in Table 4.16 indicate that majority of the respondents at 61.39% were aged
below 30 years while 38.61% were aged above 30 years. The findings indicate that EPZ
Athi River has a young workforce because most (61.39%) of the tailors are below 30
years of age. Age of the respondents was expected to be related to the type of background
music preferred by the employee.
People who enjoy a certain genre of music always have other attributes in common:
either they are of the same gender, same age group, similar level of academic
qualification or background socialisation. The current study concludes that the reason for
liking a similar genre of music could be due to participants being in a similar age bracket.
Participants are between the ages of 30 and 40 and so their level of exposure to music is
largely similar. Thus the choice of preferred music was affected to a considerable extent
by age.
4.3.2 Gender of the Respondents
The study also sought to determine the gender of the respondents. The findings are
presented in Table 4.17.
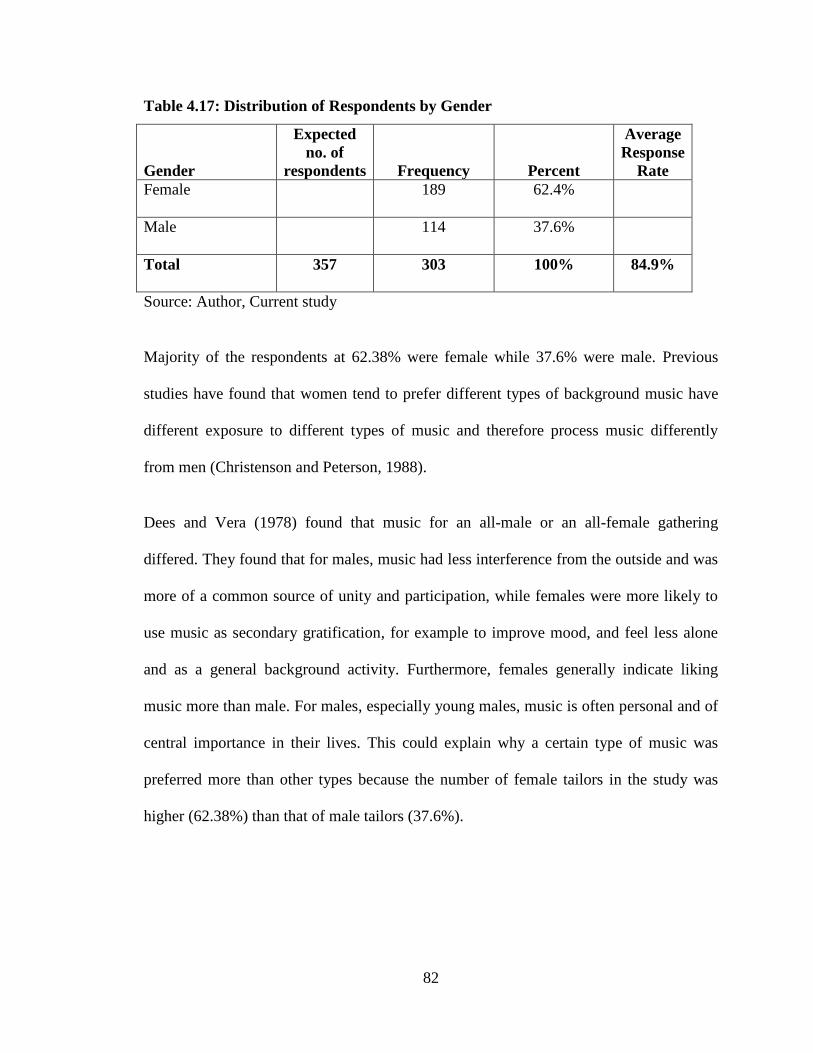
82
Table 4.17: Distribution of Respondents by Gender
Gender
Expected
no. of
respondents Frequency Percent
Average
Response
Rate
Female 189 62.4%
Male 114 37.6%
Total 357 303 100% 84.9%
Source: Author, Current study
Majority of the respondents at 62.38% were female while 37.6% were male. Previous
studies have found that women tend to prefer different types of background music have
different exposure to different types of music and therefore process music differently
from men (Christenson and Peterson, 1988).
Dees and Vera (1978) found that music for an all-male or an all-female gathering
differed. They found that for males, music had less interference from the outside and was
more of a common source of unity and participation, while females were more likely to
use music as secondary gratification, for example to improve mood, and feel less alone
and as a general background activity. Furthermore, females generally indicate liking
music more than male. For males, especially young males, music is often personal and of
central importance in their lives. This could explain why a certain type of music was
preferred more than other types because the number of female tailors in the study was
higher (62.38%) than that of male tailors (37.6%).
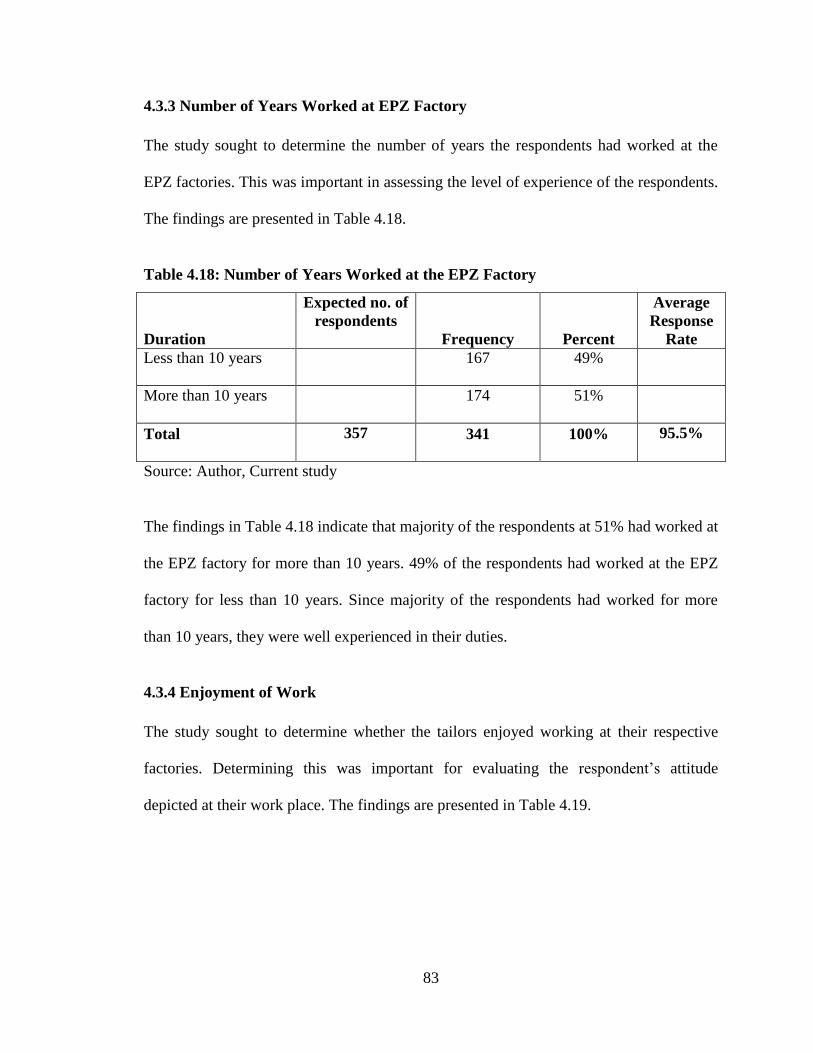
83
4.3.3 Number of Years Worked at EPZ Factory
The study sought to determine the number of years the respondents had worked at the
EPZ factories. This was important in assessing the level of experience of the respondents.
The findings are presented in Table 4.18.
Table 4.18: Number of Years Worked at the EPZ Factory
Duration
Expected no. of
respondents
Frequency Percent
Average
Response
Rate
Less than 10 years 167 49%
More than 10 years 174 51%
Total 357 341 100% 95.5%
Source: Author, Current study
The findings in Table 4.18 indicate that majority of the respondents at 51% had worked at
the EPZ factory for more than 10 years. 49% of the respondents had worked at the EPZ
factory for less than 10 years. Since majority of the respondents had worked for more
than 10 years, they were well experienced in their duties.
4.3.4 Enjoyment of Work
The study sought to determine whether the tailors enjoyed working at their respective
factories. Determining this was important for evaluating the respondent’s attitude
depicted at their work place. The findings are presented in Table 4.19.

84
Table 4.19: Work Enjoyment
Enjoying work
Expected
no. of
respondents Frequency Percent
Average
Response
Rate
Enjoy 288 95%
Don’t enjoy 15 5%
Total 357 303 100% 84.9%
Source: Author, Current study
The findings presented in Table 4.19 indicate that 95% of the respondents enjoyed work
while 5% did not enjoy work. This implied that the staff at EPZ had the right attitude for
the job and therefore it would be possible to achieve higher productivity by adoption of
work related incentives like background music.
4.3.5 Health Breaks at Work
The study sought to determine whether the respondents had health breaks. The findings
are presented in Table 4.20.
Table 4.20: Having Health Breaks at Work
Status
Expected
no. of
respondents Frequency Percent
Average
Response
Rate
Have health breaks 276 91%
Don't have health
breaks
27 9%
Total 357 303 100% 84.9%
Source: Author, Current study
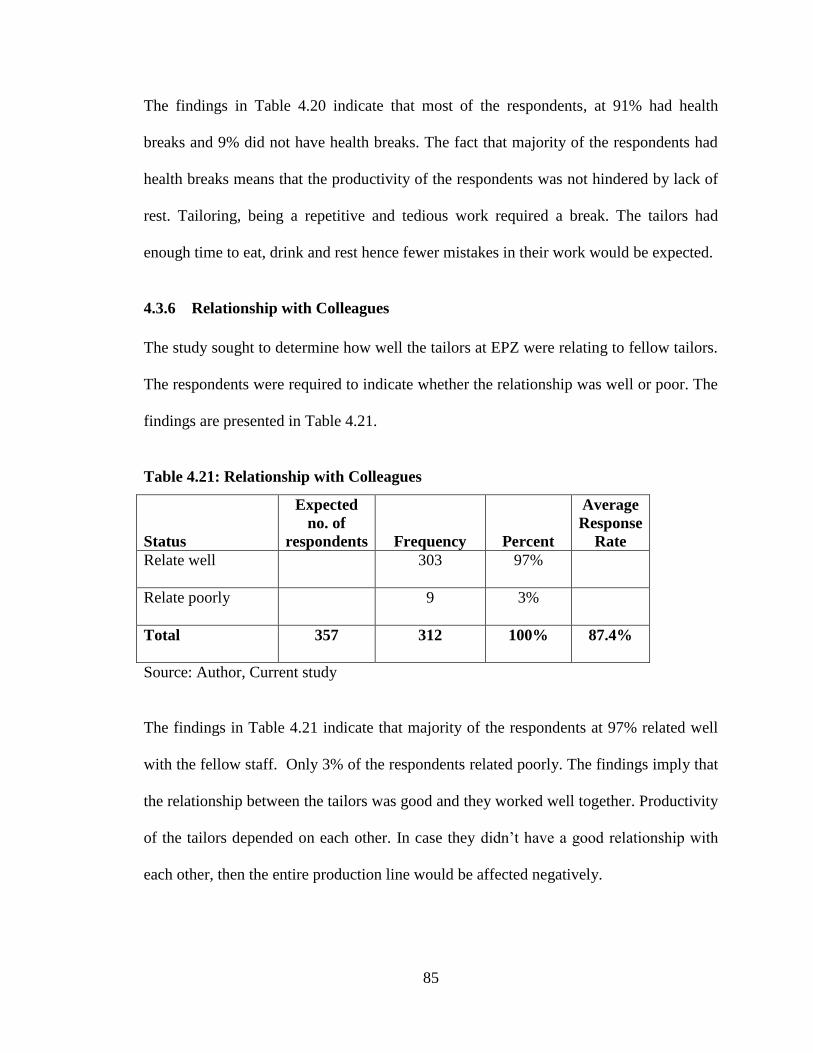
85
The findings in Table 4.20 indicate that most of the respondents, at 91% had health
breaks and 9% did not have health breaks. The fact that majority of the respondents had
health breaks means that the productivity of the respondents was not hindered by lack of
rest. Tailoring, being a repetitive and tedious work required a break. The tailors had
enough time to eat, drink and rest hence fewer mistakes in their work would be expected.
4.3.6 Relationship with Colleagues
The study sought to determine how well the tailors at EPZ were relating to fellow tailors.
The respondents were required to indicate whether the relationship was well or poor. The
findings are presented in Table 4.21.
Table 4.21: Relationship with Colleagues
Status
Expected
no. of
respondents Frequency Percent
Average
Response
Rate
Relate well 303 97%
Relate poorly 9 3%
Total 357 312 100% 87.4%
Source: Author, Current study
The findings in Table 4.21 indicate that majority of the respondents at 97% related well
with the fellow staff. Only 3% of the respondents related poorly. The findings imply that
the relationship between the tailors was good and they worked well together. Productivity
of the tailors depended on each other. In case they didn’t have a good relationship with
each other, then the entire production line would be affected negatively.

86
4.3.7 Relationship with Supervisor
The study also sought to determine how well the respondents related with the supervisors.
The findings are presented in Table 4.22.
Table 4.22: Relationship with Supervisor
Status
Expected
no. of
respondents Frequency Percent
Average
Response
Rate
Relate well 288 95%
Relate poorly 15 5%
Total 357 303 100% 84.9%
Source: Author, Current study
As shown in Table 4.22 majority of the respondents at 95% relate well with the
supervisors while 5% related poorly. The fact that majority of the respondents related
well implied that the supervisors and tailors had a good working relationship. Good
supervisor-tailor relationship is crucial in ensuring productivity.
4.3.8 Productivity of the Respondents
To determine the staff perception of their productivity, the respondents were required to
rate their productivity as excellent, good, fair or bad. The findings are presented in Table
4.23.

87
Table 4.23: Productivity of the Respondents
Status
Expected no. of
respondents Frequency Percent
Average
Response Rate
Excellent
174 57%
Good
111 37%
Fair
18 6%
Bad 0 0%
Total 357 303 100% 84.9%
Source: Author, Current study
The findings in Table 4.23 indicate that majority of the respondents at 57% rated their
productivity as excellent, 37% as good, 6% fair and 0% as bad. The respondents
perceived their performance positively. Positive attitude is necessary in achieving higher
productivity.
4.3.9 Listening to Music
The study sought to determine whether the respondents loved listening to music by
responding yes or no. The findings are presented in Table 4.24.
Table 4.24: Love Listening to Music
Status
Expected no of
respondents
Frequency Percent
Average
Response
Rate
Love listening to music
300 99%
Don't love listening to
music
3 1%
Total 357 303 100% 84.9%
Source: Author, Current study

88
The findings in Table 4.24 indicate that majority of the respondents (99%) loved listening
to music while 1% did not love listening to music. Since the majority of the respondents
preferred listening to music, it was expected that background music would have a
positive effect on their work performance. Background music improves work
performance by either reducing feelings of fatigue or increasing work capacity (North
and Hargreaves, 1998). This could explain why majority of respondents love to listen to
music at work and why their music preference was upbeat and conventional music.
4.3.10 Type of Music Preferred
The study required those who had indicated that they loved listening to music to indicate
the type of music they preferred. The findings are presented in Table 4.25.
Table 4.25: Type of Music Preferred
Music Preferred
Expected
no. of
respondents Frequency Percent
Average
Response
Rate
Any 6 2%
Cool music 3 1%
E.A. Music 9 3%
Gospel music 168 58%
Old school 9 3%
Reggae 30 10%
Rhumba 18 6%
Rhumba and benga 12 4%
RnB 3 1%
Rock 12 4%
Roots 3 1%
Soul, dancehall, bongo, gospel 3 1%
Trap 18 6%
Grand Total 357 297 100% 83.2%
Source: Author, Current study
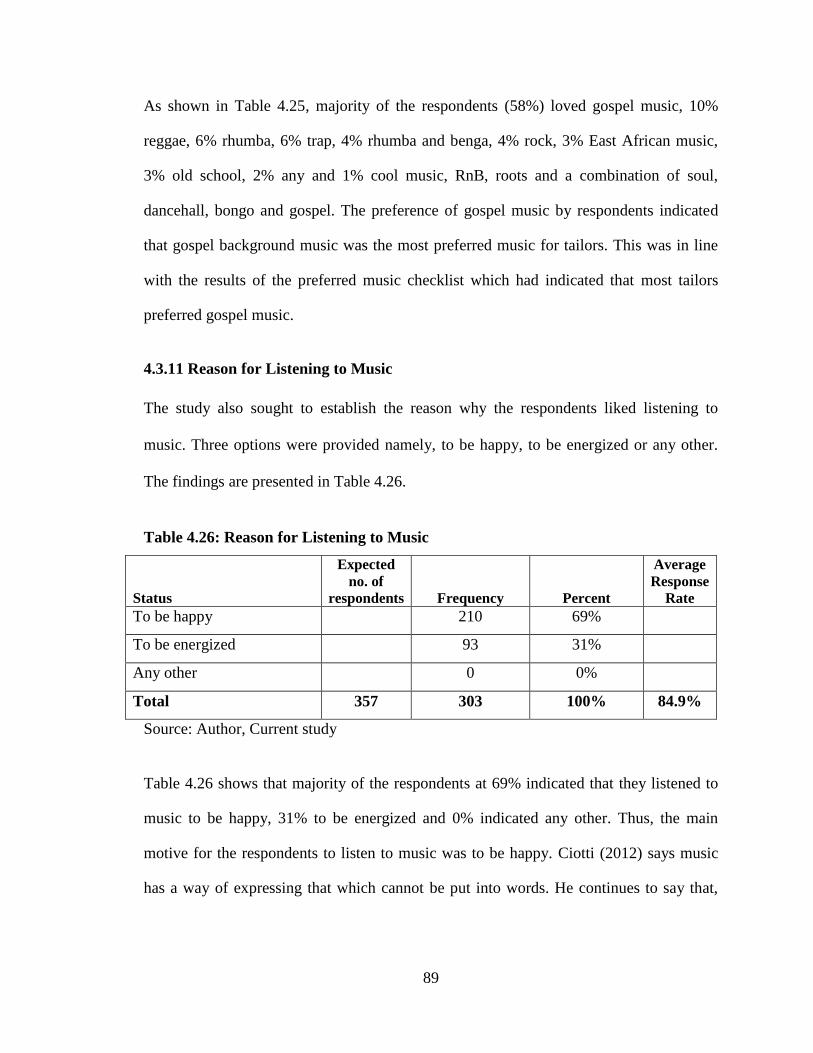
89
As shown in Table 4.25, majority of the respondents (58%) loved gospel music, 10%
reggae, 6% rhumba, 6% trap, 4% rhumba and benga, 4% rock, 3% East African music,
3% old school, 2% any and 1% cool music, RnB, roots and a combination of soul,
dancehall, bongo and gospel. The preference of gospel music by respondents indicated
that gospel background music was the most preferred music for tailors. This was in line
with the results of the preferred music checklist which had indicated that most tailors
preferred gospel music.
4.3.11 Reason for Listening to Music
The study also sought to establish the reason why the respondents liked listening to
music. Three options were provided namely, to be happy, to be energized or any other.
The findings are presented in Table 4.26.
Table 4.26: Reason for Listening to Music
Status
Expected
no. of
respondents Frequency Percent
Average
Response
Rate
To be happy 210 69%
To be energized 93 31%
Any other 0 0%
Total 357 303 100% 84.9%
Source: Author, Current study
Table 4.26 shows that majority of the respondents at 69% indicated that they listened to
music to be happy, 31% to be energized and 0% indicated any other. Thus, the main
motive for the respondents to listen to music was to be happy. Ciotti (2012) says music
has a way of expressing that which cannot be put into words. He continues to say that,
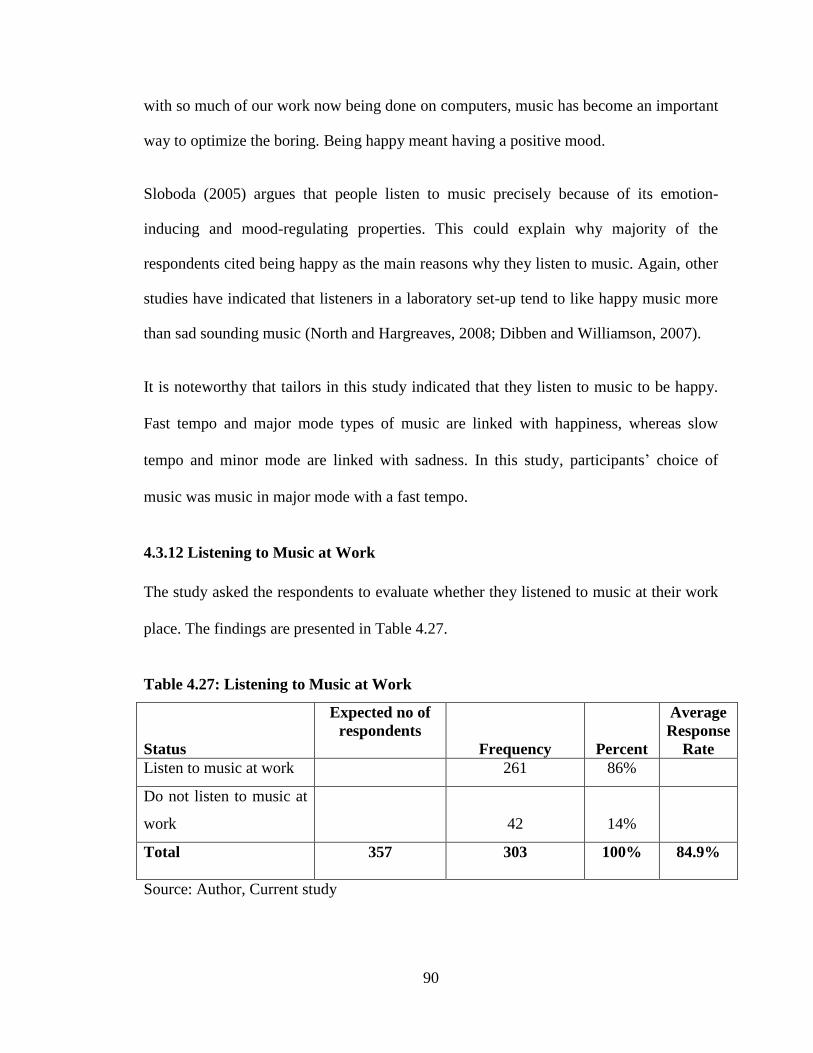
90
with so much of our work now being done on computers, music has become an important
way to optimize the boring. Being happy meant having a positive mood.
Sloboda (2005) argues that people listen to music precisely because of its emotion-
inducing and mood-regulating properties. This could explain why majority of the
respondents cited being happy as the main reasons why they listen to music. Again, other
studies have indicated that listeners in a laboratory set-up tend to like happy music more
than sad sounding music (North and Hargreaves, 2008; Dibben and Williamson, 2007).
It is noteworthy that tailors in this study indicated that they listen to music to be happy.
Fast tempo and major mode types of music are linked with happiness, whereas slow
tempo and minor mode are linked with sadness. In this study, participants’ choice of
music was music in major mode with a fast tempo.
4.3.12 Listening to Music at Work
The study asked the respondents to evaluate whether they listened to music at their work
place. The findings are presented in Table 4.27.
Table 4.27: Listening to Music at Work
Status
Expected no of
respondents
Frequency Percent
Average
Response
Rate
Listen to music at work 261 86%
Do not listen to music at
work
42 14%
Total 357 303 100% 84.9%
Source: Author, Current study

91
As indicated in Table 4.27, majority of the respondents (86%) listened to music at work
while 14% did not listen to music while at work. Individuals are able to choose or select
music on their own and listen to the music without distracting others using headphones.
Technological advances in digital music systems have made listening to music available
and affordable. Good music, agood listening device and good work environment will
cumulatively contribute to an enjoyable experience at work. This digital music can cause
danger if the music selected is not appropriate for the task at hand.
4.3.13 Advice to Management on Listening to Music
The respondents were also asked to advise the management of the factory on whether to
play or not to play background music. The findings are presented in Table 4.28.
Table 4.28: Advice to Management on Listening to Music
Advice to Management
on Listening to Music
Expected
no. of
respondents Frequency Percent
Average
Response
Rate
Don’t play music 0 0%
Play music 303 100%
Total 357 303 100% 84.9%
Source: Author, Current study
The findings in Table 4.28 indicate that 100% of the respondents would advise the
management to play background music while at work. Work at the EPZ is repetitive and
tedious, majority of tailors at 74% were extraverts, and this shows why they would advise
management to play background music. They are generally under-aroused and would
need external stimulation to bring them to an optimal level of arousal.

92
4.4 Test of Validity
The data collection tools were subjected to face and content validity tests. For face
validity, experienced researchers were requested by the researcher to confirm that the
study items would obtain data that would meet researcher’s objectives. Their comments
were used to adjust data collection instruments. To test for content validity of the data
collection instruments, the data collection instruments were pretested on a pilot study
sample of tailoring workers and thereafter modification made on the questionnaire to
ensure clarity and relevance of various measurement variables.
4.5 Test of Reliability
To ensure stable and consistent results, the researcher carried out a pilot study to make
sure that the tools for data collection were reliable and thus would obtain information that
was accurate. This study considered 0.7 as an acceptable lower limit using Cronbach’s
Alpha coefficient. The findings are presented in Table 4.29.
Table 4.29: Test of Reliability
Variable Cronbach Alpha Number of items
Background Music 0.793 4
Mood 0.881 4
Work Behaviour 0.848 5
Personality 0.792 57
Work Performance 0.937 10
Source: Author, Current study

93
Findings in Table 4:29 indicate that background Music had a Cronbach Alpha coefficient
of 0.793, mood 0.881, work behaviour 0.848, personality 0.792 and work performance
0.937. All the variables had measures with Cronbach Alpha coefficient greater than 0.7,
which indicate that all measures were reliable.
4.6 Diagnostic Tests on the Study Variables
Diagnostic tests done were multicollinearity, heteroscedasticity, linearity and normality.
This was important in testing whether the assumptions of the least of squares method
using linear regression were not violated and that the findings of regression model were
accurate.
4.6.1 Test of Multicollinearity
Multicollinearity was detected by variance inflation factor (VIF) and degree of tolerance.
The findings are presented in Table 4.30.
Table 4.30: Test of Multicollinearity
Variable Tolerance VIF
Background Music 0.94 1.064
Mood 0.896 1.117
Work behaviour 0.926 1.08
Personality 0.994 1.006
Source: Author, Current study
Background music had a tolerance degree of 0.94 and VIF of 1.064. Mood had a
tolerance degree of 0.896 and VIF of 1.117. Work behaviour had a tolerance of 0.926 and
VIF of 1.08 while personality had a tolerance of 0.994 and VIF of 1.006. Notably, all

94
variables had VIF less than 10 and tolerance degree of greater than 0.1 and hence
multicollinearity did not exist.
4.6.2 Test of Heteroscedasticity
When the variance of the dependent variable varies across the data, then
heteroscedasticity is said to exist. Heteroscedasticity complicates analysis because many
methods in regression analysis are based on an assumption of equal variances. On the
other hand, homoscedasticity implies a situation in which the variance of the dependent
variable is the same across the data. The Breusch-Pagan/Cook-Weisberg test method of
detecting heteroscedasticity in linear models was used. The findings are presented in
Table 4.31.
Table 4.31: Test of Heteroscedasticity
H0 Variables Chi square Prop>Chi square
Constant variance Background music, mood,
Personality, work behaviour
0.721 0.8291
The study obtained a Chi square of 0.721 and probability of 0.8291 which has greater
than > 0.05. These results imply constant variance and hence, heteroscedasticity problem
did not exist.
4.6.3 Test of Linearity
This test is intended to determine if the relationship between independent variable and
dependent variable is linear or not. If the value of the relationship is greater than 0.05
then the relationship between the independent variable and the dependent variable is
linear and if the value is less than 0.05 then the relationship between independent variable
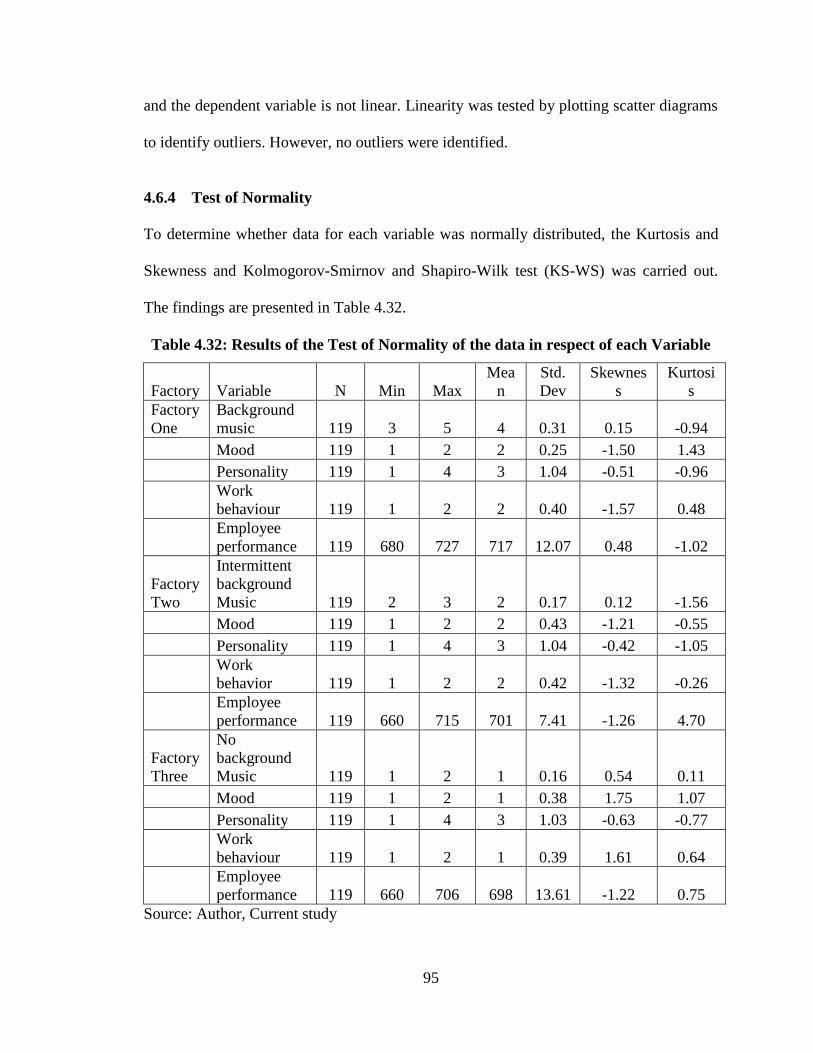
95
and the dependent variable is not linear. Linearity was tested by plotting scatter diagrams
to identify outliers. However, no outliers were identified.
4.6.4 Test of Normality
To determine whether data for each variable was normally distributed, the Kurtosis and
Skewness and Kolmogorov-Smirnov and Shapiro-Wilk test (KS-WS) was carried out.
The findings are presented in Table 4.32.
Table 4.32: Results of the Test of Normality of the data in respect of each Variable
Factory Variable N Min Max
Mea
n
Std.
Dev
Skewnes
s
Kurtosi
s
Factory
One
Background
music 119 3 5 4 0.31 0.15 -0.94
Mood 119 1 2 2 0.25 -1.50 1.43
Personality 119 1 4 3 1.04 -0.51 -0.96
Work
behaviour 119 1 2 2 0.40 -1.57 0.48
Employee
performance 119 680 727 717 12.07 0.48 -1.02
Factory
Two
Intermittent
background
Music 119 2 3 2 0.17 0.12 -1.56
Mood 119 1 2 2 0.43 -1.21 -0.55
Personality 119 1 4 3 1.04 -0.42 -1.05
Work
behavior 119 1 2 2 0.42 -1.32 -0.26
Employee
performance 119 660 715 701 7.41 -1.26 4.70
Factory
Three
No
background
Music 119 1 2 1 0.16 0.54 0.11
Mood 119 1 2 1 0.38 1.75 1.07
Personality 119 1 4 3 1.03 -0.63 -0.77
Work
behaviour 119 1 2 1 0.39 1.61 0.64
Employee
performance 119 660 706 698 13.61 -1.22 0.75
Source: Author, Current study
96
For factory one, background music had a skewness statistic of 0.15 and kurtosis of -0.94.
Mood had a skewness of -1.5 and kurtosis of 1.43. Personality had a skewness statistic of
-0.51 and kurtosis of 0.96. Work behaviour had a skewness of -1.57 and kurtosis of 0.48.
Employee performance had a skewness of 0.48 and kurtosis of -1.02. For factory two,
background music had a skewness statistic of 0.12 and kurtosis of -1.56. Mood had a
skewness of -1.21 and kurtosis of -0.55. Personality had a skewness statistic of -0.42 and
kurtosis of -1.05. Work behaviour had a skewness of -1.32 and kurtosis of -0.26.
Employee performance had a skewness of -1.26 and kurtosis of 4.70.
For factory three, where there was no background music, background music had a
skewness statistic of 0.54 and kurtosis of 0.11. Mood had a skewness of 1.75 and kurtosis
of 1.07. Personality had a skewness statistic of -0.63 and kurtosis of -0.77. Work
behaviour had a skewness of 1.61 and kurtosis of 0.64. Employee performance had a
skewness of -1.22 and kurtosis of 0.75. Notably, for all the variables, skewness degree
and kurtosis were with -2 and +2 range and hence the data for all the variables were
normally distributed. Further, normality of the variables was also confirmed by use of
Kolmogorov-Smirnov Shapiro-Wilk test (KS-WS). The findings are presented in Table
4.33.

97
Table 4.33: Results of KS-SW Test for Normality
Test Personality Mood
Background
Music
Employee
performance
Work
behaviour
Kolmogorov-
Smirnova 0.326 0.263 0.455 0.41 0.423
Sig. 0.000 0.000 0.000 0.000 0.000
Shapiro-Wilk 0.802 0.823 0.559 0.614 0.435
Sig. 0.000 0.000 0.000 0.000 0.000
Df 225 225 225 225 225
a. Lilliefors Significance Correction
Source: Author, Current study
P value for Kolmogorov-Smirnov test for data on personality was 0.000 which was less
than 0.05, suggesting that data on personality was normally distributed. The same applied
to mood and background music. Personality was 0.000<0.05, mood was 0.000<0.05,
background music was 0.000<0.05, employee performance was 0.000<0.05, and work
behaviour was 0.000<0.05. The Shapiro-Wilk test for personality was P = 0.000<0.05,
mood was 0.000<0.05, background music was 0.000<0.05, employee performance was
0.000<0.05, and work behaviour was 0.000<0.05.
98
CHAPTER FIVE
TEST OF HYPOTHESES, RESULTS AND DISCUSSION
5.1 Introduction
This chapter presents tests of hypotheses, results and discussions. Results were obtained
for each hypothesis from T-tests and regression analyses. Discussion of research findings
and summary of hypothesis and findings are also presented.
5.2 Comparative Analysis of Performance of the Three Factories
The preliminary discussion with the factories management revealed that, on average,
there had been minimal difference in the performance of the three factories both in terms
of quality and quantity of the garments produced. The researcher also learnt that the
factories were similar in terms of management (same management policies, procedures,
regulations, physical space, work layout, number of tailors and their age distribution,
average length of service, level of education and the general work climate).
With the foregoing background information, the researcher was confident that
background music would be the only major difference in the work environment of the
three factories during the study. Thus, any significant difference between the
performance of the factories would be attributed to differences in the work environment
due to music which varied from continuous in factory one, intermittent in factory two to
nil in factory three. In light of the above, it was important to ascertain if the average
performance in the three factories differed significantly in line with the status of
background in each of the three factories.

99
Based on prior studies, performance was expected to be highest in factory one, followed
by factory two and three in that order. The difference between mean performance of
factory one and factory three and between factory two and three were tested using t –
statistics. Performance mean for each factory was computed by adding output for each of
the five days and dividing the sum by 5. This gave the mean performance per day for
each factory. T test was used to determine if mean performance for factory one was
significantly different from mean performance for factory three. The same procedure was
used to test for the difference between average performance in factory two and three.
Table 5.1 presents the results of the T test for the difference between mean performance
in factory one and factory three.
Table 5.1: T-test Results for Mean Performance Differences Between Factories
Factory Average Performance t df p-value
Factory one 717.4 5.37 4 .000
Factory three 698.0
Factory two 701.4 0.66 4 .269
Factory three 698.0
Source: Author, Current study
As shown in the table, t-test for the difference between mean performance for the factory
one and two was significant (t=5.37, P≤ 0.05), suggesting that tailors in factory one
outperformed their counterparts in factory three by a significant margin. Since, as
explained earlier, the only notable difference in the work environment of the two
factories was background music, the only plausible cause of the performance difference
is background music (played continuously in factory one and not at all in factory three)
100
From table 5.1 the t-test results for performance of factory two relative to factory three
shows a much wider margin of difference (t = 0.66, P≤ 0.05). This result is insignificant,
implying that intermittent music played in factory two was not as effective as continuous
music played in factory one. It would appear that the gains from intermittent background
music were undone by rather dismal performance in the period when the music was not
played. This is confirmed by the detailed daily analysis of performance throughout the
duration of the study.
After establishing that there was a difference in employee performance in the three
factories, factory three where music was not played was not included in the regression
analysis because background music, which is the independent variable in the study was
absent.
5.3 Test of Hypotheses
Regression analysis was used to achieve the study objectives. The general objective of
this study was to determine the role of background music, mood, personality and work
behaviour in the relationship between background music and performance of tailoring
workers at the EPZ in Athi River.
Five hypotheses corresponding to the five objectives were developed. The hypotheses
comprised: there is a relationship between background music and employee performance;
the relationship between background music and employee performance is mediated by
mood; the relationship between background music and employee performance is
moderated by personality; the relationship between background music and employee

101
performance is moderated by work behaviour and that there is a joint effect of
background music, mood, work behaviour and personality on employee performance.
5.3.1 Background Music and Employee Performance
Objective one was intended to establish the effect of background music on employee
performance. The following hypothesis was developed to address this objective:
H1: There is a relationship between background music and employee
performance
The hypothesis was tested using simple linear regression analysis with employee
performance as the dependent variable and background music as the independent
variable. The results are presented in Table 5.2.
As shown in Table 5.2, relationship between background music and employee
performance in factory one where music was played continuously is moderately strong (r
= 0. 530). The positive correlation coefficient implies that background music has a
positive effect on employee performance. In factory two, where music was played
intermittently, the relationship between background music and employee performance is
weak (r = 0. 146). These results indicate a relationship between background music and
employee performance.
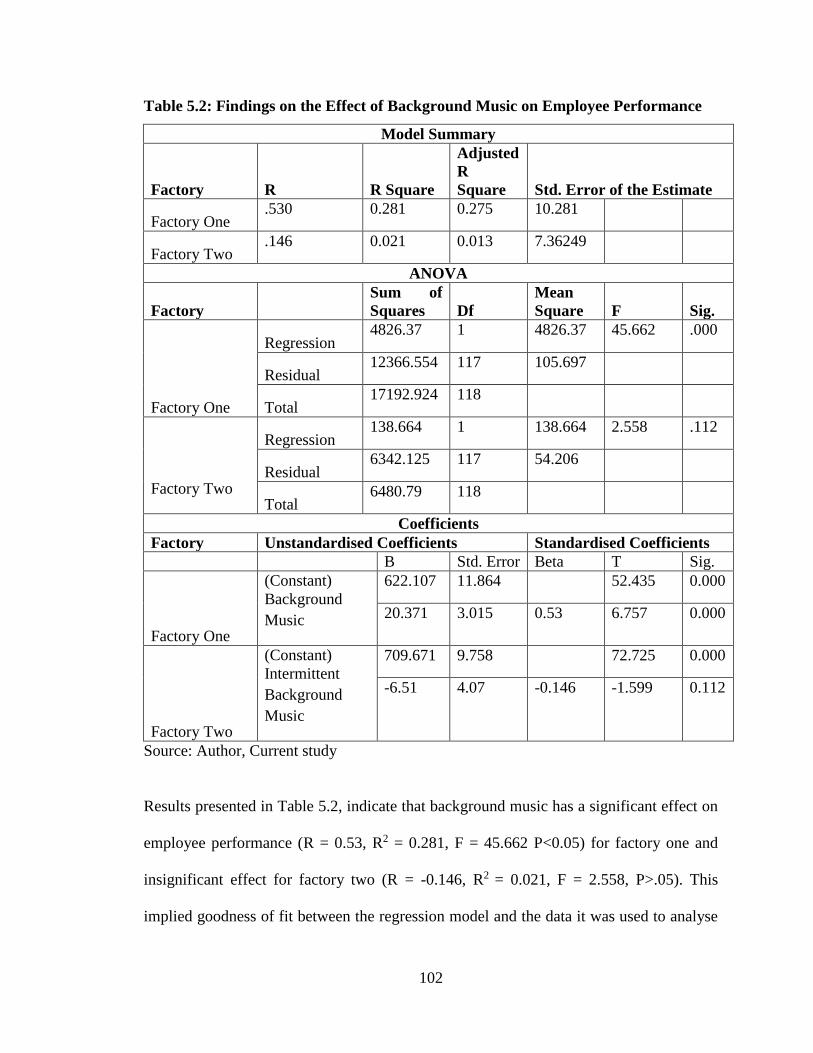
102
Table 5.2: Findings on the Effect of Background Music on Employee Performance
Model Summary
Factory R R Square
Adjusted
R
Square Std. Error of the Estimate
Factory One .530 0.281 0.275 10.281
Factory Two
.146 0.021 0.013 7.36249
ANOVA
Factory
Sum of
Squares Df
Mean
Square F Sig.
Factory One
Regression 4826.37 1 4826.37 45.662 .000
Residual 12366.554 117 105.697
Total 17192.924 118
Factory Two
Regression 138.664 1 138.664 2.558 .112
Residual 6342.125 117 54.206
Total 6480.79 118
Coefficients
Factory Unstandardised Coefficients Standardised Coefficients
B Std. Error Beta T Sig.
Factory One
(Constant)
Background
Music
622.107 11.864 52.435 0.000
20.371 3.015 0.53 6.757 0.000
Factory Two
(Constant)
Intermittent
Background
Music
709.671 9.758 72.725 0.000
-6.51 4.07 -0.146 -1.599 0.112
Source: Author, Current study
Results presented in Table 5.2, indicate that background music has a significant effect on
employee performance (R = 0.53, R2 = 0.281, F = 45.662 P<0.05) for factory one and
insignificant effect for factory two (R = -0.146, R2 = 0.021, F = 2.558, P>.05). This
implied goodness of fit between the regression model and the data it was used to analyse

103
for factory one. The results also indicate that for factory one, 28.1% of variance in
employee performance was caused by background music, while in factory two only 2.1%
of variance in employee performance was caused by background music. Therefore,
background music had a positive effect on work performance in factory one where music
was played continuously. The goodness of fit of the model reduced from factory one to
factory two (intermittent music).
The beta coefficients for the effect of background music on employee performance are
also shown in Table 5.2. Background music had a significant beta coefficient of 20.371
(t=6.757, P<0.05) for factory one and -6.51 (t=-1.599, P>0.05) for factory two. Based on
these findings, the hypothesis that there is a relationship between background music and
performance of tailors at the EPZ was confirmed for factory one. Based on this finding,
regression equations for the two factories can be fitted as follows:
Factory one: Y= 622.107 + 20.371X1 + ε where Y is employee performance, X1 is the
background music and ε is the error term.
Factory two: Y= 709.671 + -6.51X1 + ε where Y is employee performance, X1 is the
background music and ε is the error term.
5.3.2 Employee’s Mood Mediates the Relationship between Background Music
and Employee Performance
The second objective was to establish whether employees’ mood mediates the
relationship between background music and employee performance. The following
hypothesis was developed to address this objective:
104
H2 Relationship between background music and employee performance is
mediated by employee’s mood
The hypothesis was tested by using path analysis proposed by Baron and Kenny (2016).
Simple linear regression was used in step one, two and three. In step one, the criterion
and predictor variables were employee performance and background music respectively.
In step two, the criterion variable was employee mood while the predictor variable was
background music. In step three, employee performance and employee mood constituted
the criterion and predictor variable respectively.
Multiple linear regression analysis was used in step four where employee performance
was regressed on background music and employee mood. Mediation by employee mood
in the relationship between background music and employee performance can either be
full, partial or none (zero). Full mediation occurs when the statistical tests in all the first
three steps are significant and in addition, results in step four show a main significant
effect for employee mood (a mediator) and insignificant main effect for background
music (independent variable).
Partial mediation is inferred when all or any of the results in the first three steps are
significant or when in step four, the effect of background music (independent variable) on
employee performance is not significant in the presence of employees’ mood (mediator)
but the value of the effect is above zero. The results of hypothesis two are presented in
Table 5.3, 5.4 and 5.5.
+ ε Where is background music, Y is employee
performance and is constant and is the coefficient of , ε is error term
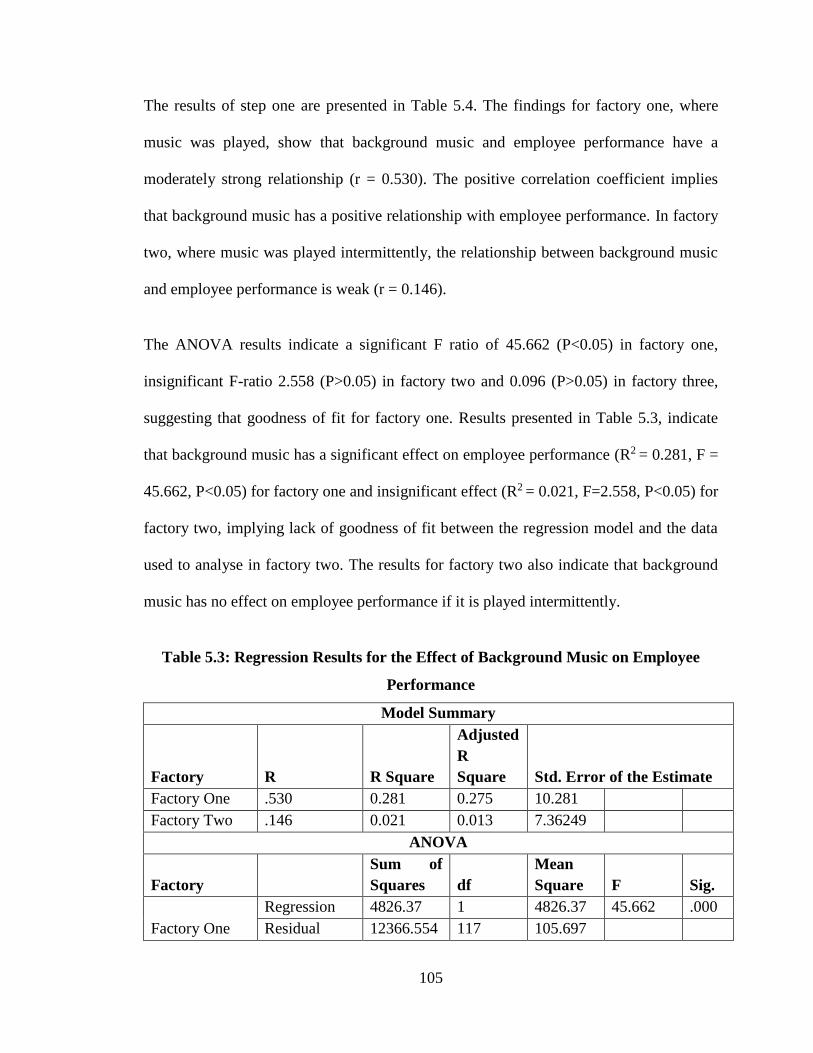
105
The results of step one are presented in Table 5.4. The findings for factory one, where
music was played, show that background music and employee performance have a
moderately strong relationship (r = 0.530). The positive correlation coefficient implies
that background music has a positive relationship with employee performance. In factory
two, where music was played intermittently, the relationship between background music
and employee performance is weak (r = 0.146).
The ANOVA results indicate a significant F ratio of 45.662 (P<0.05) in factory one,
insignificant F-ratio 2.558 (P>0.05) in factory two and 0.096 (P>0.05) in factory three,
suggesting that goodness of fit for factory one. Results presented in Table 5.3, indicate
that background music has a significant effect on employee performance (R2 = 0.281, F =
45.662, P<0.05) for factory one and insignificant effect (R2 = 0.021, F=2.558, P<0.05) for
factory two, implying lack of goodness of fit between the regression model and the data
used to analyse in factory two. The results for factory two also indicate that background
music has no effect on employee performance if it is played intermittently.
Table 5.3: Regression Results for the Effect of Background Music on Employee
Performance
Model Summary
Factory R R Square
Adjusted
R
Square Std. Error of the Estimate
Factory One .530 0.281 0.275 10.281
Factory Two .146 0.021 0.013 7.36249
ANOVA
Factory
Sum of
Squares df
Mean
Square F Sig.
Factory One
Regression 4826.37 1 4826.37 45.662 .000
Residual 12366.554 117 105.697

106
Total 17192.924 118
Factory Two
Regression 138.664 1 138.664 2.558 .112
Residual 6342.125 117 54.206
Total 6480.79 118
Coefficients
Unstandardised Coefficients Standardised Coefficients
B Std. Error Beta T Sig.
Factory One
(Constant) 622.107 11.864 52.435 0.000
Background
Music
20.371 3.015 0.53 6.757 0.000
Factory Two
(Constant) 709.671 9.758 72.725 0.000
Intermittent
Background
Music
-6.51 4.07 -0.146 -1.599 0.112
Source: Author, Current study
The results also indicate that for factory one 28.1% of variance in employee performance
was caused by background music. Therefore, background music had a positive effect on
work performance in factory one. Results presented in Table 5.3, indicate that
background music has a significant effect on employee performance (R2 = 0.281, F=
45.662, P<0.05) for factory one and insignificant effect (R2 = 0.021, F=2.558, P<0.05) for
factory two, implying lack of goodness of fit between the regression model and the data it
was used to analyse in factory two. Further, background music had a beta coefficient of
20.371 for factory one which was statistically significant (t = 6.757, P<0.05), and -6.51
for factory two (t = -1.599, P>0.05). These findings imply that one unit of positive
change in background music resulted in 28.1% change in employee output in factory one
and 2.1% in factory two.
Using these results, the predictive model for the two factories can be constituted as
follows:
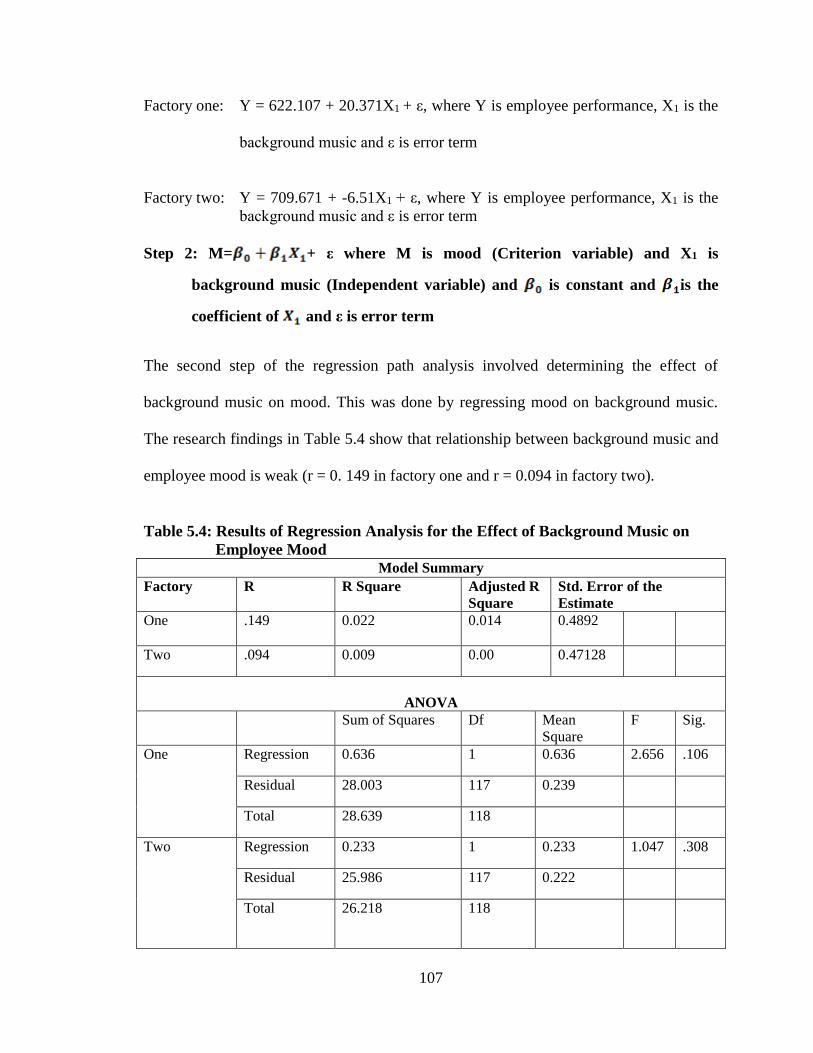
107
Factory one: Y = 622.107 + 20.371X1 + ε, where Y is employee performance, X1 is the
background music and ε is error term
Factory two: Y = 709.671 + -6.51X1 + ε, where Y is employee performance, X1 is the
background music and ε is error term
Step 2: M= + ε where M is mood (Criterion variable) and X1 is
background music (Independent variable) and is constant and is the
coefficient of and ε is error term
The second step of the regression path analysis involved determining the effect of
background music on mood. This was done by regressing mood on background music.
The research findings in Table 5.4 show that relationship between background music and
employee mood is weak (r = 0. 149 in factory one and r = 0.094 in factory two).
Table 5.4: Results of Regression Analysis for the Effect of Background Music on
Employee Mood
Model Summary
Factory R R Square Adjusted R
Square
Std. Error of the
Estimate
One
.149 0.022 0.014 0.4892
Two .094 0.009 0.00 0.47128
ANOVA
Sum of Squares Df Mean
Square
F Sig.
One Regression 0.636 1 0.636 2.656 .106
Residual 28.003 117 0.239
Total 28.639 118
Two Regression 0.233 1 0.233 1.047 .308
Residual 25.986 117 0.222
Total 26.218
118
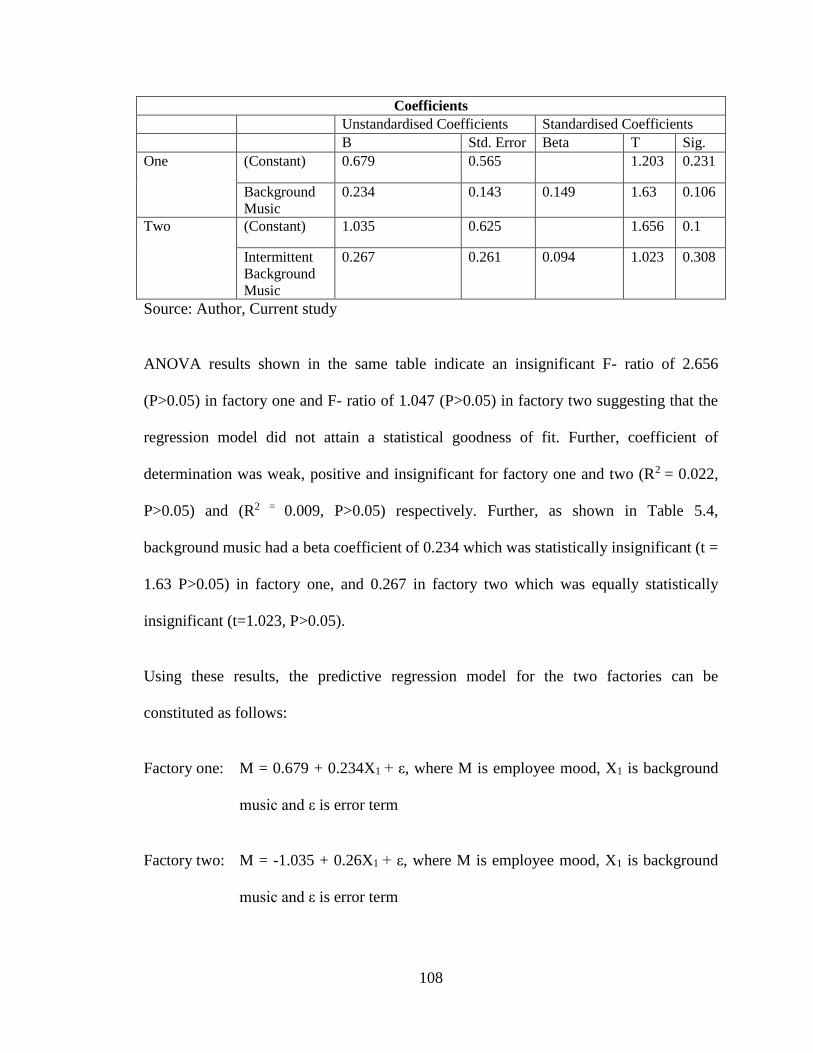
108
Coefficients
Unstandardised Coefficients Standardised Coefficients
B Std. Error Beta T Sig.
One (Constant) 0.679 0.565 1.203 0.231
Background
Music
0.234 0.143 0.149 1.63 0.106
Two (Constant) 1.035 0.625 1.656 0.1
Intermittent
Background
Music
0.267 0.261 0.094 1.023 0.308
Source: Author, Current study
ANOVA results shown in the same table indicate an insignificant F- ratio of 2.656
(P>0.05) in factory one and F- ratio of 1.047 (P>0.05) in factory two suggesting that the
regression model did not attain a statistical goodness of fit. Further, coefficient of
determination was weak, positive and insignificant for factory one and two (R2 = 0.022,
P>0.05) and (R2 = 0.009, P>0.05) respectively. Further, as shown in Table 5.4,
background music had a beta coefficient of 0.234 which was statistically insignificant (t =
1.63 P>0.05) in factory one, and 0.267 in factory two which was equally statistically
insignificant (t=1.023, P>0.05).
Using these results, the predictive regression model for the two factories can be
constituted as follows:
Factory one: M = 0.679 + 0.234X1 + ε, where M is employee mood, X1 is background
music and ε is error term
Factory two: M = -1.035 + 0.26X1 + ε, where M is employee mood, X1 is background
music and ε is error term
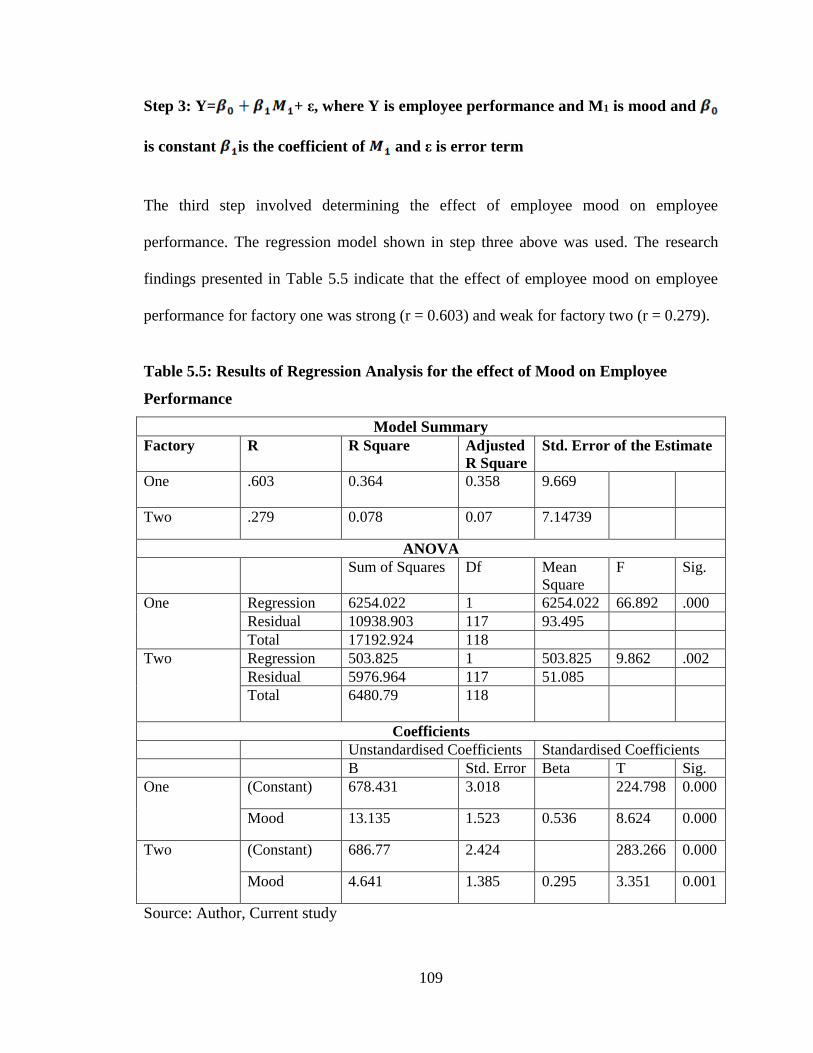
109
Step 3: Y= + ε, where Y is employee performance and M1 is mood and
is constant is the coefficient of and ε is error term
The third step involved determining the effect of employee mood on employee
performance. The regression model shown in step three above was used. The research
findings presented in Table 5.5 indicate that the effect of employee mood on employee
performance for factory one was strong (r = 0.603) and weak for factory two (r = 0.279).
Table 5.5: Results of Regression Analysis for the effect of Mood on Employee
Performance
Model Summary
Factory R R Square Adjusted
R Square
Std. Error of the Estimate
One
.603 0.364 0.358 9.669
Two .279 0.078 0.07 7.14739
ANOVA
Sum of Squares Df Mean
Square
F Sig.
One Regression 6254.022 1 6254.022 66.892 .000
Residual 10938.903 117 93.495
Total 17192.924 118
Two Regression 503.825 1 503.825 9.862 .002
Residual 5976.964 117 51.085
Total 6480.79 118
Coefficients
Unstandardised Coefficients Standardised Coefficients
B Std. Error Beta T Sig.
One (Constant) 678.431 3.018 224.798 0.000
Mood 13.135 1.523 0.536 8.624 0.000
Two (Constant) 686.77 2.424 283.266 0.000
Mood 4.641 1.385 0.295 3.351 0.001
Source: Author, Current study
110
ANOVA results presented in Table 5.5 indicate a significant F-ratio of 66.892 (P<0.05)
for factory one and 9.862 (P<0.05) for factory two suggesting that the regression model
used attained a statistical goodness of fit. Thus the use of the regression model was
justified. Further, employee mood had a significant beta coefficient of 14.778 (t = 8.179,
P<0.05) and 4.384 (t = 3.14, P<0.05) in factory one and two respectively. These findings
indicate that increase in employee performance differed in the two factories apparently
due to the difference in the level of employee positive mood.
Using these results, the predictive model is constituted as follows:
Factory 1: Y = 678.431 + 14.778X1 + ε, where Y is employee performance, X1 is
background music and ε is error term
Factory 2: Y = 686.77 + 4.384X1 + ε, where Y is employee performance, X1 is
background music and ε is error term
Step 4: Y= + + ε where Y is employee performance, is
background Music, is mood is constant, is the coefficient of and
ε is error term
Multiple regression analysis was used in step four as shown above, where employee
performance was regressed on background music and employee mood. The research
findings in Table 5.6 indicate that the relationship between mood and background music
and employee performance was positive and strong (r=0.749) and (r=0.328) in respect of
factory one and two respectively.
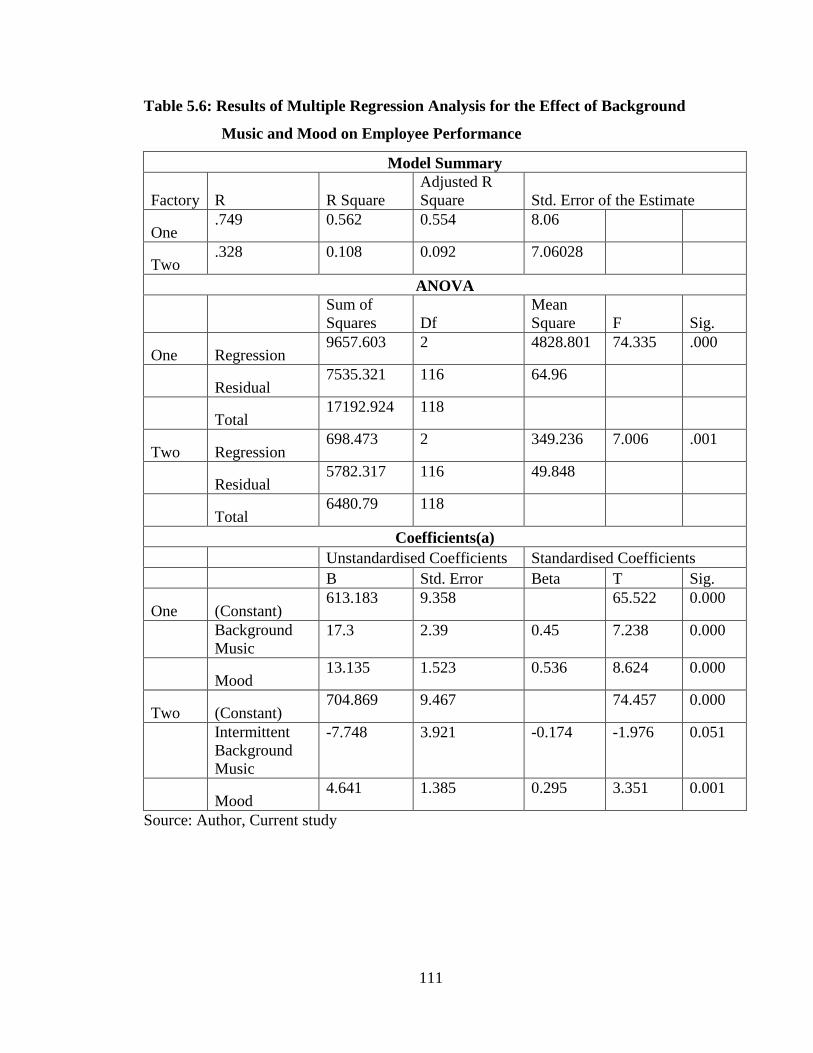
111
Table 5.6: Results of Multiple Regression Analysis for the Effect of Background
Music and Mood on Employee Performance
Model Summary
Factory R R Square
Adjusted R
Square Std. Error of the Estimate
One .749 0.562 0.554 8.06
Two
.328 0.108 0.092 7.06028
ANOVA
Sum of
Squares Df
Mean
Square F Sig.
One Regression 9657.603 2 4828.801 74.335 .000
Residual 7535.321 116 64.96
Total 17192.924 118
Two Regression 698.473 2 349.236 7.006 .001
Residual 5782.317 116 49.848
Total 6480.79 118
Coefficients(a)
Unstandardised Coefficients Standardised Coefficients
B Std. Error Beta T Sig.
One (Constant) 613.183 9.358 65.522 0.000
Background
Music
17.3 2.39 0.45 7.238 0.000
Mood 13.135 1.523 0.536 8.624 0.000
Two (Constant) 704.869 9.467 74.457 0.000
Intermittent
Background
Music
-7.748 3.921 -0.174 -1.976 0.051
Mood 4.641 1.385 0.295 3.351 0.001
Source: Author, Current study

112
In factory one where music was played (r = 0.749) and in factory two where music was
intermittently played (r = 0.328). The positive correlation coefficients imply that
employee performance increased in tandem with background music.
ANOVA results presented in Table 5.6 above show a significant F-ratio of 74.335
(P<0.05) for factory one and 7.006, (P<0.05) for factory two. This is evidence that the
regression model attained a statistical goodness of fit. Thus, use of regression model was
justified. Further, background music and employee mood have a significant effect on
employee performance (r = 0.749, R2= 0.562) for factory one and (r = 0.328, R2 = 0.108)
for factory two. The R2 value of 0.562 implies that background music and employee
mood jointly explain 56.2% of variation in employee performance in factory one where
music was played throughout the time. The positive correlation coefficient and significant
R2 imply that both background music and employee mood had a strong positive
relationship with employee performance. The fact that background music and employee
mood accounted for only 56.2% of variation in employee performance suggests that the
remaining 43.8% of change in employee performance is accounted for by unknown
factors not included in the study.
Further, results show that employee mood and background music had a beta coefficient
of 13.135 and 17.3 in factory one and 4.641 and -7.748 in factory two. These findings
imply that preferred background music enhanced the mood of participants which
impacted positively in the performance of the tailors. From these results the predictive
model is constituted as follows:

113
Factory 1: Y = 613.183 + 17.3X1 + 13.135M + ε, where Y is employee performance,
X1 is background music, M is employee mood, and ε is error term
Factory 2: Y = 704.869 + -7.748X1 + 4.641M + ε, where Y is employee performance,
X1 is background music, M is employee mood, and ε is error term
5.3.3 The Effect of Personality on the Relationship between Background Music
and Employee Performance
To establish the effect of personality on the relationship between background music and
employee performance, the following hypothesis was formulated and tested using
stepwise regression analysis.
H3 Relationship between background music and employee performance is
moderated by employee’s personality
This hypothesis was tested in three steps. In step one, the criterion and predictor variables
were employee performance and background music respectively. In step two, the
criterion variable was employee performance while the predictor variables were
background music and employee’s personality. In step three, multiple regression analysis
was used. Employee performance was regressed on background music, employee
personality and the interaction term (background music*employee personality).
Step 1: Y= + ε, where Y is employee performance, X1 is background
music and is constant and is the coefficient of , ε is error term
This model produced the results presented in Table 5.7. As shown, the relationship
between background music and employee performance is moderately strong in factory

114
one (r = 0.530) and weak in factory two (r = 0.146). The positive correlation coefficient
implies that background music has a positive effect on employee performance. The R2
value of 0.281 in factory one implies that background music explains 28.1% of the
variation in employee performance, and in factory two 2.1% increase in employee
performance is explained by background music.
Table 5.7: Results of Regression Analysis of the effect of Background Music on
Employee Performance
Model Summary
Factory R R Square
Adjusted
R Square Std. Error of the Estimate
Factory One .530 0.281 0.275 10.281
Factory Two
.146 0.021 0.013 7.36249
ANOVA
Factory
Sum of
Squares df
Mean
Square F Sig.
Factory One
Regression 4826.37 1 4826.37 45.662 .000
Residual 12366.554 117 105.697
Total 17192.924 118
Factory Two
Regression 138.664 1 138.664 2.558 .112
Residual 6342.125 117 54.206
Total 6480.79 118
Total 22025.933 118
Coefficients
Unstandardised Coefficients Standardised Coefficients
B Std. Error Beta T Sig.
Factory One
(Constant) 622.107 11.864 52.435 0.000
Background
Music
20.371 3.015 0.53 6.757 0.000
Factory Two
(Constant) 709.671 9.758 72.725 0.000
Intermittent
Background
Music
-6.51 4.07 -0.146 -1.599 0.112
Source: Author, Current study

115
ANOVA results indicate a significant F- ratio of 45.662 (P<0.05) in factory one and
2.558 (P>0.05) in factory two, suggesting that the regression model attained a statistical
goodness of fit for factory one. Thus the use of the regression model was appropriate.
Further, background music had a beta coefficient of 20.371 which was statistically
significant (t = 6.757, P<0.05) in factory one and -6.51, (t = -1.599 P>0.05) in factory
two, which was not significant (P<0.05) suggesting that a unit change in background
music led to increase in employee performance by 28.1% in factory one. Regression
coefficient for factory two was not significant.
Based on these results, the predictive model can be constituted as follows:
Factory 1: Y = 622.107 + 20.371X1 + ε, where Y is employee performance, X1 is the
background music and ε is error term
Factory 2: Y = 709.671 + -6.51X1 + ε, where Y is employee performance, X1 is the
background music and ε is error term
Step 2: Y= + ε Where P3 is personality and X1 background music
and is constant and is the coefficient of and is the coefficient of
, ε is error term
Step two of the regression analysis tested the effect of employee personality and
background music on employee performance. Thus, employee performance was
regressed on background music and employee personality. From the findings presented in
Table 5.8, background music and employee personality had a moderately strong
relationship in factory one (r = 0.542) and (r = 0.204) for factory two. Together,
background music and employee personality accounted for 29.4% (R2= 0.294) of

116
variance in employee performance for factory one, where music was played throughout.
In factory two, background music and personality accounted for less than 0.5% in
employee performance. Therefore, employee personality moderated the effect of
background music on employee performance.
Table 5.8: Result of Regression Analysis for the Effect of Background Music and
Employee Personality on Employee Performance
Model Summary
Factory R R Square
Adjusted R
Square Std. Error of the Estimate
One .542 0.294 0.282 10.231
Two .204 0.042 0.025 7.31694
ANOVA
Sum of
Squares Df
Mean
Square F Sig.
One Regression 5050.128 2 2525.064 24.122 .000
Residual 12142.796 116 104.679
Total 17192.924 118
Two Regression 270.431 2 135.215 2.526 .084
Residual 6210.359 116 53.538
Total 6480.79 118
Coefficients
Unstandardised Coefficients Standardised Coefficients
B Std. Error Beta T Sig.
One (Constant) 619.515 11.939 51.888 0.000
Background Music 20.147 3.004 0.524 6.707 0.000
Personality 1.324 0.906 0.114 1.462 0.146
Two (Constant) 706.748 9.875 71.568 0.000
Intermittent
Background Music
-6.383 4.046 -0.143 -1.578 0.117
Personality 1.012 0.645 0.143 1.569 0.119
Source: Author, Current study
117
The ANOVA results indicate an F-ratio of 24.122 (P<0.05) in factory one and
insignificant F-ratio of 2.526 (P>0.05) in factory two, suggesting that the regression
model attained a statistical goodness of fit. Thus the use of the regression model was
appropriate.
As shown in Table 5.8, personality had a beta coefficient of 1.324 (t = -1.462, P>0.05) in
factory one and 1.012 (t = -1.569, P>0.05) in factory two, suggesting that employee’s
personality does not affect the relationship between background music and employee
performance. Using these results, the predictive model can be substituted as follows:
Factory 1: Y = 619.515 + 20.147X1 + ε, where Y is employee performance, X1 is the
background music and ε is error term
Factory 2: Y = 706.748 + -6.383X1 + ε, where Y is employee performance, X1 is the
background music and ε is error term
Step 3: Y= + ε where P is personality and X is
background music, is the interaction term between background
music and personality, is the constant and is the coefficient of and
is the coefficient of the interaction term, ε is error term
The third step of the regression analysis involved incorporating the interaction term in the
regression equation presented above. The research findings in Table 5.9 show that
relationship among background music, employee personality and employee performance
is strong (r = 0.759) in factory one and weak in factory two (r =0.346).
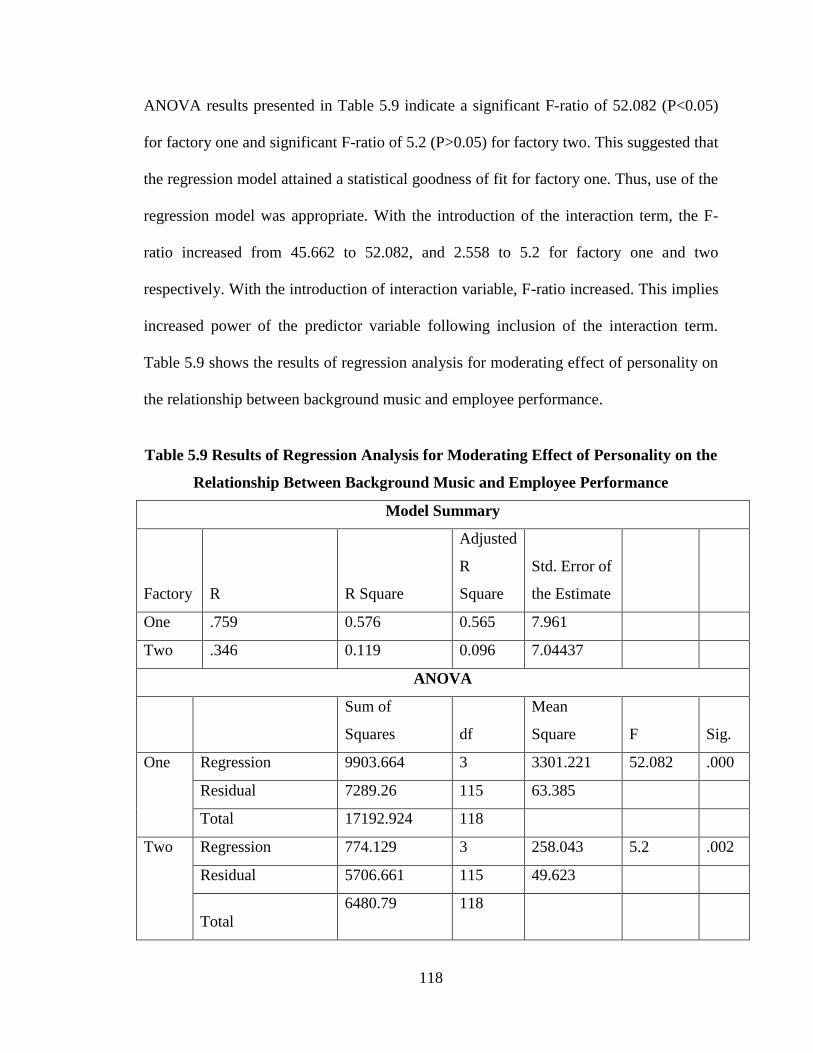
118
ANOVA results presented in Table 5.9 indicate a significant F-ratio of 52.082 (P<0.05)
for factory one and significant F-ratio of 5.2 (P>0.05) for factory two. This suggested that
the regression model attained a statistical goodness of fit for factory one. Thus, use of the
regression model was appropriate. With the introduction of the interaction term, the F-
ratio increased from 45.662 to 52.082, and 2.558 to 5.2 for factory one and two
respectively. With the introduction of interaction variable, F-ratio increased. This implies
increased power of the predictor variable following inclusion of the interaction term.
Table 5.9 shows the results of regression analysis for moderating effect of personality on
the relationship between background music and employee performance.
Table 5.9 Results of Regression Analysis for Moderating Effect of Personality on the
Relationship Between Background Music and Employee Performance
Model Summary
Factory R R Square
Adjusted
R
Square
Std. Error of
the Estimate
One .759 0.576 0.565 7.961
Two .346 0.119 0.096 7.04437
ANOVA
Sum of
Squares df
Mean
Square F Sig.
One Regression 9903.664 3 3301.221 52.082 .000
Residual 7289.26 115 63.385
Total 17192.924 118
Two Regression 774.129 3 258.043 5.2 .002
Residual 5706.661 115 49.623
Total
6480.79 118

119
Coefficients
Unstandardised
Coefficients
Standardised Coefficients
B
Std.
Error Beta T Sig.
One
(Constant) 634.227 9.442 67.174 0.000
Background Music 11.37 2.544 0.296 4.47 0.000
Personality 0.723 0.708 0.062 1.021 0.310
Interaction
(Music*Personality)
3.388 0.387 0.582 8.751 0.000
Two
(Constant) 710.773 9.591 74.109 0.000
Intermittent
Background Music
-10.91 4.146 -0.245 -2.631 0.010
Personality 0.753 0.626 0.106 1.204 0.231
Interaction
(Music*Personality)
1.865 0.585 0.299 3.186 0.002
Source: Author, Current study
Further, Table 5.9 indicates that background music for factory one had R2 = 0.576 and R2
= 0.119 for factory two and a beta coefficient of 11.37 which was statistically significant
(t = 4.47, p<0.05), personality had an insignificant coefficient 0.723 (t = 1.021, p> 0.05)
while the interaction term had a significant beta coefficient (beta = 3.388, t = 8.751,
p<0.05). Factory two had a significant coefficient for background music, personality and
the interaction term. These findings imply that employee personality does moderate the
relationship between background music and employee performance. Thus the hypothesis
(H3) that relationship between background music and employee performance is
moderated by employee personality is therefore supported.

120
5.3.4 The Influence of Work Behaviour on the Relationship between Background
Music and Employee Performance
A three stage stepwise regression analysis by Baron and Kenny (1986) was used to
establish the effect of work behaviour on the relationship between background music and
employee performance. The following hypothesis was developed to address this
objective:
H4: The relationship between background music and employee performance is
moderated by employee work behaviour
This hypothesis was tested in three steps: In step one, the criterion and predictor variables
were employee performance and background music respectively. In step two, the
criterion variable was employee performance while employees work behaviour and
background music were predictor variables. In step three, multiple regression analysis
was used where employee performance was regressed on background music, employee
work behaviour and the interaction term.
Step 1: Y = + ε where Y is employee performance X1 is background
music, and ε is error term
The research findings in Table 5.10 indicate that the relationship between background
music and employee performance was moderately strong in factory one (r = 0.530) and
weak in factory two (r = 0.146). The positive correlation coefficient in factory one and
two imply that background music has a positive relationship with employee performance.

121
Table 5.10: Results of Regression Analysis for the Effect of Background Music on
Employee Performance
Model Summary
Factory R R Square
Adjusted
R
Square Std. Error of the Estimate
Factory One .530 0.281 0.275 10.281
Factory Two .146 0.021 0.013 7.36249
ANOVA
Factory
Sum of
Squares df
Mean
Square F Sig.
Factory One
Regression 4826.37 1 4826.37 45.662 .000
Residual 12366.554 117 105.697
Total 17192.924 118
Factory Two
Regression 138.664 1 138.664 2.558 .112
Residual 6342.125 117 54.206
Total 6480.79 118
Coefficients
Unstandardised Coefficients Standardised Coefficients
B Std. Error Beta T Sig.
Factory One
(Constant) 622.107 11.864 52.435 0.000
Background
Music
20.371 3.015 0.53 6.757 0.000
Factory Two
(Constant) 709.671 9.758 72.725 0.000
Intermittent
Background
Music
-6.51 4.07 -0.146 -1.599 0.112
Source: Author, Current study
ANOVA results presented in Table 5.10 indicate a significant F-ratio of 45.662 (p<0.05)
for factory one and 2.558 for factory two, suggesting that the regression model attained a
statistical goodness of fit. Thus, use of regression model was justified.

122
Step 2: Y = + ε, where WB3 is work behavior X1 background
music, Y is employee performance and ε is error term
Step two of the stepwise regression analysis was meant to determine the effect of work
behaviour and background music as independent variables on employee performance.
Thus, employee performance was regressed on background music and work behaviour
simultaneously. Table 5.11 presents results of regression analysis for the effect of
background music and work behaviour on employee performance.
From the findings in Table 5.11, background music and employee work behaviour had a
moderately strong relationship with employee performance for factory one (r = 0.548)
and a weak relationship for factory two (r = 0.307). This is a marginal increase in
prediction power with the introduction of the work behaviour from r = 0.530 (factory
one) and r = 0.146 (factory two). Together background music and employee work
behaviour accounted for 30% (R2 = 0.3) of variance in employee performance in factory
one where music was played throughout. Therefore, employee work behaviour did not
moderate the relationship between background music on employee performance.
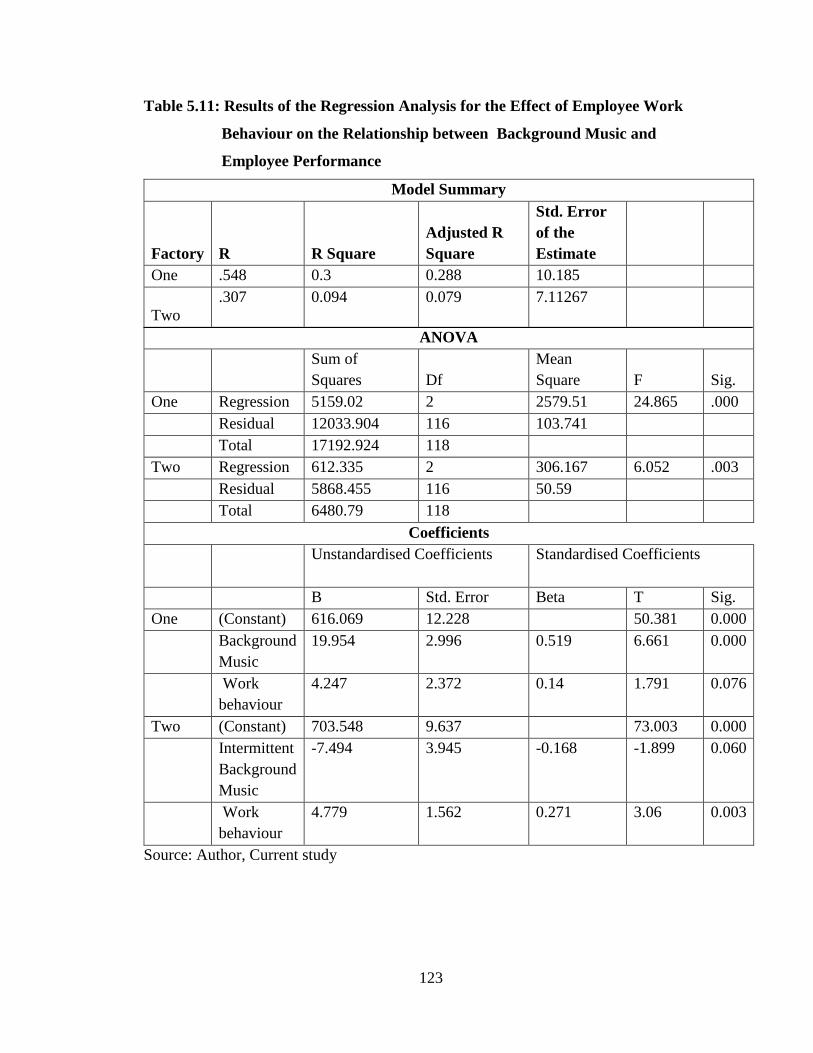
123
Table 5.11: Results of the Regression Analysis for the Effect of Employee Work
Behaviour on the Relationship between Background Music and
Employee Performance
Model Summary
Factory R R Square
Adjusted R
Square
Std. Error
of the
Estimate
One .548 0.3 0.288 10.185
Two
.307 0.094 0.079 7.11267
ANOVA
Sum of
Squares Df
Mean
Square F Sig.
One Regression 5159.02 2 2579.51 24.865 .000
Residual 12033.904 116 103.741
Total 17192.924 118
Two Regression 612.335 2 306.167 6.052 .003
Residual 5868.455 116 50.59
Total 6480.79 118
Coefficients
Unstandardised Coefficients
Standardised Coefficients
B Std. Error Beta T Sig.
One (Constant) 616.069 12.228 50.381 0.000
Background
Music
19.954 2.996 0.519 6.661 0.000
Work
behaviour
4.247 2.372 0.14 1.791 0.076
Two (Constant) 703.548 9.637 73.003 0.000
Intermittent
Background
Music
-7.494 3.945 -0.168 -1.899 0.060
Work
behaviour
4.779 1.562 0.271 3.06 0.003
Source: Author, Current study
124
Step 3: Y= + ε, Where WB is work
behaviour, X is background music, is the interaction term
between background music and work behaviour, is the constant is the
coefficient of , is the coefficient of the interaction term, and ε is error
term
The third step of the regression analysis involved incorporating the interaction term in the
regression equation. The research findings in Table 5.12 show the effect of background
music, employee work behaviour and interaction term on employee performance.
Table 5.12 further indicate that 31.4% (R2 = 0.314, p<0.05) of change in employee
performance is caused by the predictor variables namely; background music and
employee work behaviour. The results presented in Table 5.12 show correlation
coefficients for the effect of work behaviour on the relationship between background
music on employee performance were 0.561 and 0.317 for factory one and factory two
respectively.

125
Table 5.12: Results of Regression Analysis for Moderating Effect of Work
Behaviour on the Relationship between Background Music and Employee
Performance Model Summary
Factory R R Square
Adjusted R
Square
Std. Error of
the Estimate
One .561 0.314 0.297 10.124
Two .317 0.1 0.077 7.1198
ANOVA
Sum of Squares Df Mean Square F Sig.
One
Regression 5406.78 3 1802.26 17.585 .000
Residual 11786.144 115 102.488
Total 17192.924 118
Two
Regression 651.265 3 217.088 4.283 .007
Residual 5829.525 115 50.692
Total 6480.79 118
Coefficients
Unstandardised
Coefficients
Standardised
Coefficients
One
B Std. Error Beta t Sig.
(Constant) 617.113 12.173 50.697 0.000
Background
Music
18.883 3.056 0.491 6.178 0.000
Work behaviour 3.973 2.364 0.131 1.681 0.096
Interaction
(Music*Work
Behaviour)
0.355 0.228 0.124 1.555 0.123
Two
(Constant) 703.891 9.655 72.906 0.000
Intermittent
Background
Music
-7.948 3.983 -0.179 -1.995 0.048
Work behaviour 4.369 1.632 0.248 2.676 0.009
Interaction
(Music*Work
Behaviour)
0.238 0.271 0.082 0.876 0.383
Source: Author, Current study

126
With the introduction of the interaction term, the strength of relationship between
background music and work behaviour changes to 0.561 for factory one and 0.317 for
factory two from r = 0.530 and r = 0.146 respectively. This implies that the relationship
increased. In factory one, background music had a significant coefficient (β = 0.491
p<.05), work behaviour had insignificant beta coefficient (β = 0.131, p>.05) and
interaction term (β = 0.124, p>.05). For factory two, the coefficient was not significant.
Thus, work behaviour did not have a moderating effect on the relationship between
background music and employee performance. Based on this finding, the hypothesis (H4)
that the relationship between background music and employee performance is moderated
by employee behaviour was not supported.
5.3.5 The Joint Effect of Background Music, Employee Mood, Work Behaviour
and Personality on Employee Performance
The general objective of this study was to determine the effect of background music,
mood, personality and work behaviour on the performance of tailoring workers at the
EPZ in Athi River. To achieve this objective, the following hypothesis was developed:
The joint effect of background music, mood, employee personality and work behaviour is
greater than the effect of background music on employee performance. Multiple linear
regression model was used to test this hypothesis. The results are presented in Table 5.13.
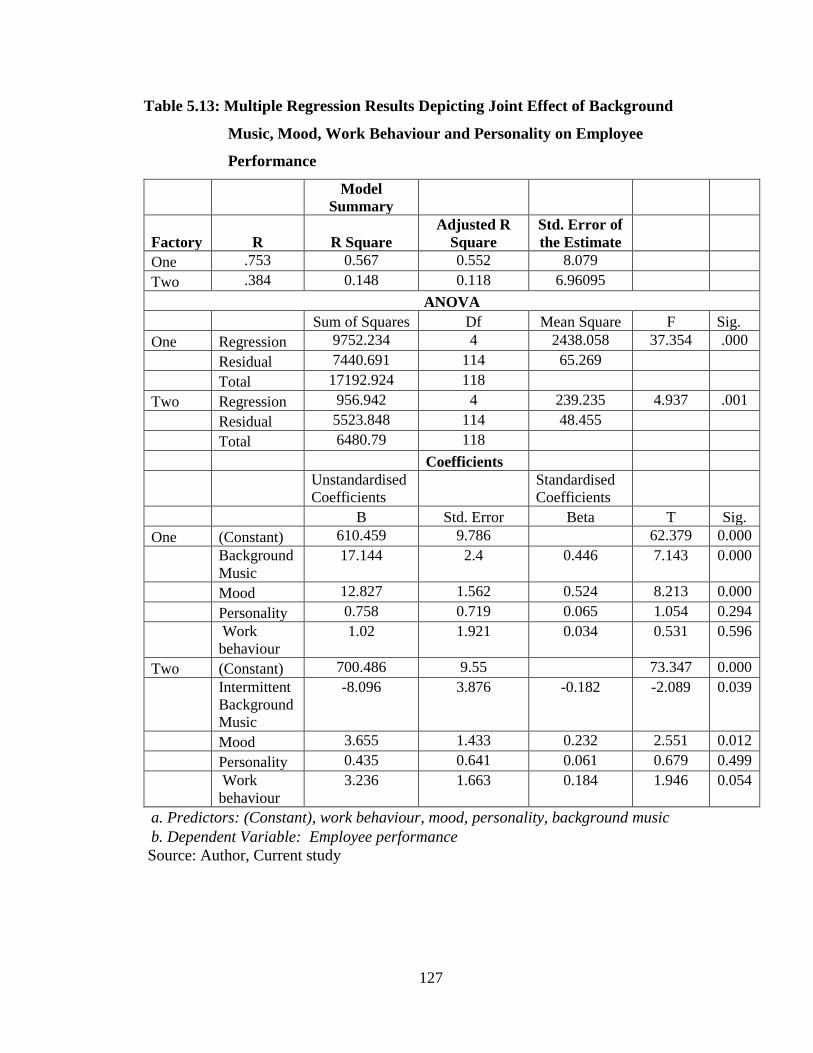
127
Table 5.13: Multiple Regression Results Depicting Joint Effect of Background
Music, Mood, Work Behaviour and Personality on Employee
Performance
Model
Summary
Factory R R Square
Adjusted R
Square
Std. Error of
the Estimate
One .753 0.567 0.552 8.079
Two .384 0.148 0.118 6.96095
ANOVA
Sum of Squares Df Mean Square F Sig.
One Regression 9752.234 4 2438.058 37.354 .000
Residual 7440.691 114 65.269
Total 17192.924 118
Two Regression 956.942 4 239.235 4.937 .001
Residual 5523.848 114 48.455
Total 6480.79 118
Coefficients
Unstandardised
Coefficients
Standardised
Coefficients
B Std. Error Beta T Sig.
One (Constant) 610.459 9.786 62.379 0.000
Background
Music
17.144 2.4 0.446 7.143 0.000
Mood 12.827 1.562 0.524 8.213 0.000
Personality 0.758 0.719 0.065 1.054 0.294
Work
behaviour
1.02 1.921 0.034 0.531 0.596
Two (Constant) 700.486 9.55 73.347 0.000
Intermittent
Background
Music
-8.096 3.876 -0.182 -2.089 0.039
Mood 3.655 1.433 0.232 2.551 0.012
Personality 0.435 0.641 0.061 0.679 0.499
Work
behaviour
3.236 1.663 0.184 1.946 0.054
a. Predictors: (Constant), work behaviour, mood, personality, background music
b. Dependent Variable: Employee performance
Source: Author, Current study
128
As shown in Table 5.13, the joint effect of background music, employee personality,
employee mood and work behaviour on employee performance is strong for factory one
(r = 0.753) and weak for factory two (r = 0.384). The positive correlation coefficient of
correlation implies that background music has a positive effect on employee
performance. Jointly, background music, employee personality, employee mood and
work behaviour account for 56.7% of variation in employee performance (R2 = 0.567) for
factory one and 14.8% factory two (R2 = 0.148).
Jointly, background music, employee personality, employee mood and work behaviour
have significant effect on employee performance (F = 37.354, P<0.05) for factory one,
and (F = 4.937, P<0.05) for factory two, implying goodness of fit between the regression
model and data it was used to analyse. Background music had a significant coefficient for
factory one and two. Employee mood also has a significant coefficient for factories one
and two. Work behaviour had insignificant coefficient in all factories. Personality had
insignificant coefficient in the two factories. Hence in predicting employee performance,
the most important variables to consider are background music and employee’s mood.
Employee personality and work behaviour play an important role as moderators of the
relationship between background music and employee performance.
5.4 Discussion of the Research Findings
This study had five objectives and five hypotheses. The discussion revolves around the
research findings, particularly from the tests of the hypotheses. Various statistical
techniques were used to test the hypotheses. They comprise simple linear regression, path

129
analysis proposed by Baron and Kenny (1986), stepwise regression analysis and multiple
regression analysis. The discussion is structured along the research objectives.
5.4.1 The Effect of Background Music on Employee Performance
T-test was done to compare if the mean of employee’s performance for the three factories
in the study were statistically different from each other. Mean performance of factory
three, where music was not played, was compared to that of factory one, where music
was continuously played. The mean performance of factory one is recorded at 717
garments while that of factory three is 698 garments. This means that background music
has a significant impact on the performance of employees in factory one compared to
those in factory three where music was not played.
Similarly, the study compared the mean performance of factory two and factory three.
The mean performance for factory 2 is 701 garments while that of factory three is 698
garments. This means that intermittent background music had a positive relationship with
employee performance though not significant. This means that intermittent background
music does not have a significance effect on employee performance. Compared with
factory one, where background music was played throughout and performance increased
significantly, background music in factory two had a positive relationship which was not
significant with employee performance.
To establish the effect of background music on employee performance, simple linear
regression was used. The study obtained a correlation coefficient of 0.530 in factory one
and 0.146 in factory two. The positive correlation coefficient implies that background

130
music has a positive relationship with employee performance. The relationship between
background music and employee performance in factory one where music was played
continuously is moderately strong (r = 0. 530). The positive correlation coefficient
implies that background music has a positive effect on employee performance. In factory
two, where music was played intermittently, the relationship between background music
and employee performance is weak (r = 0.146). These results indicate that there is a
relationship between background music and employee performance.
Background music had a significant effect on employee performance (R = 0.53, R2 =
0.281, F = 45.662 P<0.05) for factory one and insignificant effect for factory two (R = -
0.146, R2 = 0.021, F = 2.558, P>.05). Background music had a significant beta coefficient
of 20.371 (t = 6.757, P<0.05) for factory one and -6.51 (t = -1.599, P>0.05) for factory
two. Based on these findings the study can confirm that there is a relationship between
background music and performance of tailors at the EPZ in Athi River. In factory one
where preferred background music was played continuously, tailors spent more time
working, they experienced less fatigue, they were cheerful, swift, and agile. All this
contributed to positive work performance in terms of quality and quantity of garments
they produced.
During the study, the weather in the afternoon was generally hot thus draining energy
levels of tailors. This might have affected concentration and focus. When interviewed,
participants in this study agreed that background music helped them focus on the task at
hand, were more alert and experienced less fatigue which helped them work more hours
131
beyond their normal duty, finished their scheduled work on time and had more time left
to organise their work space for the next task. They were always ready for the next
assignment regardless of the hot weather.
Another study by Watson (2014) on how listening to music improves accuracy at work
concluded that there are specific genres that people love to listen to while doing certain
tasks. A study by Oldham et al. (1995) on headset use by employees in a retail
organisation-office and its effects on mood, performance, turnover intentions, job
satisfaction and other work responses and another one by Lesiuk (2005) on music
listening via personal stereo or headset use in computer programmers and the effects on
quality of work, time on task and affect suggest that self-selected music listening
generally increases work performance as well as positive affect in office-based
environment. This study also supports a study by Pasick (2014) which showed that
factory workers performed at a higher level when upbeat happy tunes were played in the
background and also supports another one by North and Hargreaves (2008) who also
found that listeners in a laboratory set-up loved happy music.
Kiger (1989) considers music in fast tempo, major mode and with lyrics to be high
information load music and says that this kind of music may negatively affect
performance. This study found that music with lyrics did not affect tailoring workers
negatively, and that the more familiar they were with a particular type of music, the more
they enjoyed it thus increasing their performance. Familiar music which they love
communicates to their emotions, giving meaning to their thoughts and feelings.
132
The findings compared with those of Anyanwu (2014) who did a study in a dissection
laboratory among dental and medical students to measure the impact of stress associated
with dissection experience. Over 90% of participants expressed the desire to incorporate
background music because it is a useful tool that could be used to enhance learning
conditions. He noted that background music relaxes and improves alertness, reduces
noise levels, creates a calm and enabling environment, optimizes time and keeps energy
levels high.
5.4.2 Background Music, Employees Mood and Employee Performance
To establish whether employees’ mood mediates the relationship between background
music and employee performance, path analysis proposed by Baron and Kenny (1986)
which involved use of simple and multiple linear regression was used. With the
introduction of the mood, the coefficient of correlation changes from 0.530 in factory one
and , 0.146 in factory two to 0.749 and 0.328 respectively. Further, with introduction of
mood in the regression equation relationship between background music and employee
performance, F-statistic increased from 45.662 to 74.335 for factory one and 2.558 to
7.006 for factory two.
The research findings indicate that the relationship between mood and background music
and employee performance was positive and strong (r = 0.749) and (r = 0.328) in respect
of factory one and two respectively. Background music and employee mood have a
significant effect on employee performance (r = 0.749, R2 = 0.562) for factory one and (r
= 0.328, R2 = 0.108) for factory two. The R2 value of 0.562 implies that, background
133
music and employee mood jointly explain 56.2% of variation in employee performance
in factory one where music was played throughout. The positive correlation coefficient
and significant R2 imply that both background music and employee mood had a strong
positive relationship with employee performance. The fact that background music and
employee mood accounted for only 56.2% of variation in employee performance suggests
that the remaining 43.8% of change in employee performance is accounted for by
unknown factors not included in the study.
The increase in F-statistic indicated the importance of the contribution of mood to the
strength of the relationship between background music and employee performance which
improved tremendously with introduction of mood. In factory one and two, employee
mood had a beta coefficient of 13.135 and 4.641 respectively. The positive coefficient
indicates that background music and mood had a positive effect on employee
performance. The p-values for the coefficients relating to factory one and two were less
than 0.05, indicating that the coefficients are significant and can be used to predict
performance using the assessed levels of employee mood and background music.
Other empirical studies conducted have revealed that the most important purpose of
music listening could be that of mood regulating (DeNora, 2010; North and Hargreaves,
1999). Haake (2011) observes that background music has two main roles as pertains to
work activities. This includes managing disruptions as a way of managing work-related
stress and having control over the environment. Sonos, who is a speaker manufacturer,
conducted a study on the relationship between music and mood (Titlow, 2016). The study
134
revealed an improvement in positive feelings and activity upon playing the background
music. The study further found that background music made the daily activities and
routines more enjoyable. Majority of the people in the study indicated that music helped
them accomplish their tasks easily, while some stated that the food tasted well with music
in the background. This study confirms that background music enhances mood which
eventually affects work performance positively.
5.4.3 Background Music, Personality, and Employee Performance
To establish the effect of personality on the relationship between background music and
employee performance, stepwise regression analysis was used. With introduction of
personality in the relationship between background music and employee performance, the
correlation coefficient for the relationship between background music and performance
changed marginally. F ratio was insignificant indicating an insignificant contribution of
personality to the relationship between background music and employee performance.
Background music for factory one had a beta coefficient of 11.37 which was statistically
significant (t = 4.47, p<0.05), personality had an insignificant coefficient 0.723 (t =
1.021, p> 0.05) while the interaction term had a significant beta coefficient (beta = 3.388,
t = 8.751, p<0.05). Factory two had a significant coefficient for background music,
personality and the interaction term. These findings imply that employee personality does
moderate the relationship between background music and employee performance. Thus
the hypothesis (H3) that relationship between background music and employee
performance is moderated by employee personality is therefore supported.

135
When personality was included in the regression equation, the model was still significant
as shown by the p-value of P ˂ 0.05. However, F-statistic declined, implying a reduction
in predictive power of the model as a result of introduction of the personality as a
mediating variable. The effect of personality on employee performance had an
insignificant coefficient across all factories.
With introduction of the interaction term, the relationship between background music and
employee performance strengthened with F-ratio increasing from 45.662 to 52.082 in
factory one where there was background music, and 2.558 to 5.2 in factory two where
background music was intermittently played. With the introduction of the interaction
term, the strength of the relationship increased suggesting that personality has moderating
effect on the relationship between background music and employee performance. These
findings imply that personality has significant moderating effect on the relationship
between background music and employee performance. This could be due to the fact that
most of the tailors were extraverts and that they responded positively to the introduction
of background music as an external stimulus in their work environment.
Rentfrow and Gosling, (2003) observed that extraverts use music to increase their
arousal, especially when doing monotonous tasks. From this study, it is evident that most
tailors at the EPZ Athi River are extraverts; this means that background music played
during the study in factory one and intermittently in factory two may have played a key
role in increasing their arousal at work.

136
5.4.4 Background Music, Work Behaviour and Employee Performance
The study also sought to establish the moderating effect of work behaviour on the
relationship between background music and employee performance. Thus, employee
performance was regressed on background music and work behaviour. From the findings,
background music and employee work behaviour had a strong relationship in factory one
and moderate relationship in factory two.
With the introduction of interaction term, the strength of relationship between
background music and work behaviour changed to 0.561 for factory one and 0.317 for
factory two from r = 0 .530 and r = 0.146 respectively. This implies that the relationship
increased. In factory one, background music had a significant coefficient (β = 0.491
p<.05), work behaviour had an insignificant beta coefficient (β =0.131, p>.05) and
interaction term (β = 0.124, p>.05). For factory two, the coefficient was not significant.
Thus, work behaviour had moderating effect on the relationship between background
music and employee performance in factory one only.
Work behaviour had positive coefficients which was also statistically significant for
factory one only. For factory two, work behaviour had no significant effect. Findings of
this study indicate that the relationship between background music and employee
performance as moderated by work behaviour was weak. With the introduction of the
interaction term, the strength of the relationship reduced marginally in both factories. The
interaction term also had insignificant beta coefficient. These findings implied that work
behaviour had an insignificant moderating effect on the relationship between background
music and employee performance.

137
5.4.5 Joint Effect of Background Music, Mood, Work Behaviour and Personality
on Employee Performance
This study was to determine the role of background music, employee mood, personality
and work behaviour in employee performance of tailoring workers at the EPZ in Athi
River. It found that the joint effect of background music, employee personality, employee
mood and work behaviour on employee performance is strong for factory one (r = 0.753)
and weak for factory two (r = 0.384). The positive correlation coefficient of correlation
implies that background music has positive effect on employee performance. Jointly,
background music, employee personality, employee mood and work behaviour account
for 56.7% of variation in employee performance (R2 = 0.567) for factory one and 14.8%
in factory two (R2 = 0.148).
Jointly, background music, employee personality, employee mood and work behaviour
have significant effect on employee performance (F = 37.354, P<0.05) for factory one,
and (F = 4.937, P<0.05) for factory two. ANOVA results indicated a p-value of 0.000
(p<0.05) for factory one and two which implied that background music, mood,
personality and work behaviour had significant strong effect on employee performance in
those factories. The positive impact resulting from background music, mood, personality
and work behaviour are statistically significant for factories one and two.

138
CHAPTER SIX
SUMMARY, CONCLUSION AND RECOMMENDATIONS
6.1 Introduction
This chapter summarises the research findings, gives a conclusion and highlights its
contribution of the study to knowledge, practice and policy, the implications of the
findings, limitations of the study and makes recommendations for further studies.
6.2 Summary of the Findings
This section gives a summary of the research findings. The summaries are anchored on
the research objectives.
6.2.1 Background Music and Employee Performance
The study sought to establish the effect of background music on employee performance.
It was found that background music had a significant positive effect on employee
performance. The test achieved a correlation coefficient of .530 in factory one and .146 in
factory two. The difference in the strength of the correlation coefficients between factory
one (strong) and factory two (the weak) can be explained by the degree to which
background music is present in the work environment, which is either played throughout
the working time or played intermittently.
In factory one where preferred background music was played continuously, workers
reported spending more time working. From their submissions, the respondents
experienced less fatigue; they were cheerful, swift and agile. All these behaviours at work
contributed to positive work performance in terms of quality and quantity of garments
139
they produced. Participants in this study agreed that background music helped them to
focus on their task at hand, were more alert and experienced less fatigue which helped
them to work for more hours beyond their normal duty, finished their scheduled work on
time and had time left to organise their work space for the next task. They were always
ready for the next assignment regardless of the hot weather.
In factory two where music was played intermittently, the tailors exhibited confusing
behaviours. One afternoon when music was not played, they paused and asked for music
to be played, portraying feelings of confusion. When music was played, tailors were
agile, happy and focused in the activities they were undertaking. But when music
stopped, silence could be felt immediately followed by murmuring, talking and
movement. This was a clear indication that the absence of background music had an
effect on their work environment. T-test results showed significant differences between
performance of factory one and three and factory two and three. In both cases, the mean
score for factory one and factory two are higher than the mean performance of factory
three.
Background music had a significant effect on employee performance (R = 0.53, R2 =
0.281, F = 45.662 P<0.05) for factory one and insignificant effect for factory two (R = -
0.146, R2 = 0.021, F = 2.558, P>.05). Further, background music had a significant beta
coefficient of 20.371 (t = 6.757, P<0.05) for factory one and -6.51 (t = -1.599, P>0.05)
for factory two. These findings confirm that there is a positive relationship between
background music and performance of tailors at the EPZ.

140
6.2.2 Background Music, Employee Mood, and Employee Performance
As explained in chapter five, in the absence of employee mood (mediator), background
music had a significant effect on employee performance. Similarly, employee mood had a
significant effect of employee performance in the absence of background music. As
expected, the effect of background music on employee performance was not significant
in the presence of employee mood. This is a confirmation that employee mood fully
mediated relationship between background music and employee performance in both
factory one (where music was played throughout) and factory two (where music was
played intermittently). Mediation is inferred when the effect of independent variable on
the dependent variable is significant in the absence of mediator but is insignificant in the
presence of a mediator
6.2.3 Background Music, Personality, and Employee Performance
This current study found that personality had a significant effect on the relationship
between background music and employee performance. With introduction of personality
in the regression equation containing background music, the correlation coefficient for
the relationship between background music and performance changed marginally.
To determine the moderating effect of personality on the relationship between
background music and employee performance, interaction between background music
and personality was tested. The values of R, R2 and Beta showed that the moderation
effect was significant at P <0.05 in factory one and two.

141
6.2.4 Background Music, Work Behaviour and Employee Performance
It was found that work behaviour had insignificant influence on the relationship between
background music and employee performance. That is, when employee performance was
regressed on the interaction between background music and work behaviour
simultaneously, the results were insignificant in both factory one and two with (R2=
0.314) for factory one and (R2 = 0.1) for factory two.
6.2.5 Joint Effect of Background Music, Mood, Personality and Work Behaviour
on Employee Performance
The general objective of this study was to determine the role of background music, mood,
personality and work behaviour in performance of tailoring workers at the EPZ in Athi
River, Kenya. The study found that background music, mood, personality and work
behaviour had a positive and significant effect on employee performance of tailoring
workers at the EPZ in Athi River. The coefficients of correlation obtained by the study
were .753 for factory one and .384 for factory two. R2 and Beta were both significant for
factories one (R2= 0.567 and factory two (R2 0.148)
6.2.6 Summary of Objectives, Hypotheses and the Findings
The summary of the study objectives, hypotheses and outcomes of the tests of hypotheses
results are presented in Table 6.1
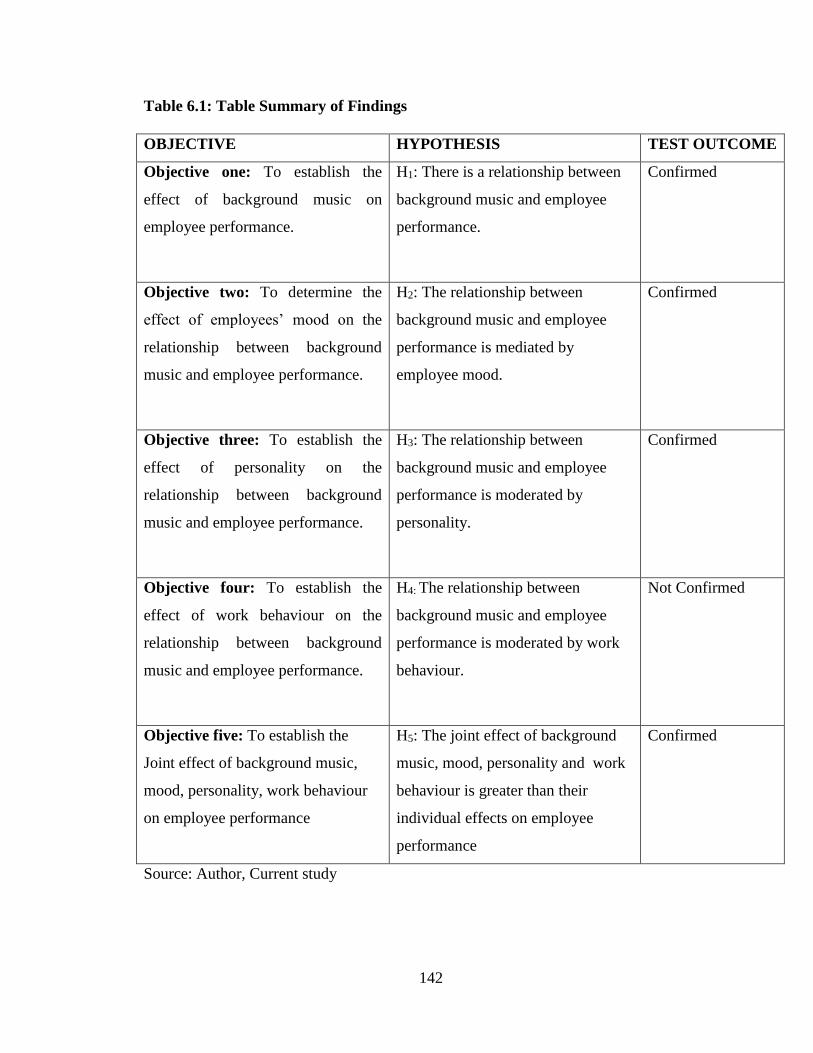
142
Table 6.1: Table Summary of Findings
Source: Author, Current study
OBJECTIVE HYPOTHESIS TEST OUTCOME
Objective one: To establish the
effect of background music on
employee performance.
H1: There is a relationship between
background music and employee
performance.
Confirmed
Objective two: To determine the
effect of employees’ mood on the
relationship between background
music and employee performance.
H2: The relationship between
background music and employee
performance is mediated by
employee mood.
Confirmed
Objective three: To establish the
effect of personality on the
relationship between background
music and employee performance.
H3: The relationship between
background music and employee
performance is moderated by
personality.
Confirmed
Objective four: To establish the
effect of work behaviour on the
relationship between background
music and employee performance.
H4: The relationship between
background music and employee
performance is moderated by work
behaviour.
Not Confirmed
Objective five: To establish the
Joint effect of background music,
mood, personality, work behaviour
on employee performance
H5: The joint effect of background
music, mood, personality and work
behaviour is greater than their
individual effects on employee
performance
Confirmed
143
6.3 Conclusion
This section highlights the conclusions drawn from the research findings. The
conclusions are anchored on the objectives.
6.3.1 Effect of Background Music on Employee Performance
The study concludes that background music has a positive effect on employee
performance. Background music plays the role of companionship or accompaniment to
tailoring workers who do repetitive tasks. It is also evident that background music locks
out other noises at work and helps them to concentrate on their work especially in an
open work environment; talking and movement are tremendously reduced with
background music playing in the work environment. More specifically, this research
concludes that for music to be effective, it should match the listener’s socio-cultural
background and age group, i.e. background music should reflect familiarity and
preferences, it should be functional for the activity in that the rhythm should approximate
motor patterns involved, the volume should not be loud that is, it should be controlled.
In the current study, a conclusion made is that if tailors are given a chance to determine
what music should be played based on their preferences and familiarity, then background
music becomes a powerful management tool not only for increasing efficiency of the
workforce but also for boosting their mental and emotional state.
144
6.3.2 The Role of Employees’ Mood In the Relationship between Background
Music and Employee Performance
It was found that employee mood significantly mediates the relationship between
background music and employee performance. It is apparent from the current research
that background music at work raises the listener’s mood, which in turn impacts
employee’s performance positively. It can therefore be concluded that employees who
listened to music experienced positive change in mood and hence change in performance.
In factory two where background music was played intermittently, it was found that
participant’s mood depended on presence or absence of background music which in turn
caused fluctuation in employee performance. In conclusion therefore background music
impacts employees by influencing their mood.
6.3.3 Effect of Personality on the Relationship between Background Music and
Employee Performance
It is concluded in this study that the influence of background music on employee
performance is either enhanced or decreased by the personality of employees.
Specifically, the relationship depends on whether the employee is an introvert or
extravert. Extraverts perform better in work environment with background music than do
introverts.

145
6.3.4 Influence of Work Behaviour on the Relationship between Background
Music and Employee Performance
This study concludes that the influence of background music on employee performance is
either enhanced or decreased by employee work behaviour. Employees who listened to
background music had a positive attitude towards work and strived to meet deadlines,
which increased their performance in terms of garments made. In factory two where
background music was played intermittently, the influence of work behaviour on the
relationship between background music and employee performance fluctuated depending
on whether music was played or not. It is therefore concluded that continuous
background music is necessary for consistent positive effect of work behaviour on the
relationship between background music and employee performance.
6.3.5 Joint Effect of Background Music, Mood, Work Behaviour and Personality
on Employee Performance
It is concluded that background music, employee mood, employee work behaviour and
personality together produce greater positive change in employee performance than when
they are considered individually. This therefore means that the combined force of the four
predictor variables has a greater effect on employee performance than each predictor
variable alone.

146
6.4 Recommendations
The following recommendations are made based on the results of the study.
6.4.1 Installation of Background Music Infrastructure in Factories
Based on the findings of hypothesis one, it is recommended that management of
factories at the EPZ considers installing popular employees preferred and familiar
background music at the places of work to enhance productivity. The management should
however, note that background music should not be so loud to invade the auditory space
of the employees but should be controlled and only play the accompaniment part in their
working and auditory space.
It was further found that background music, mood, personality and work behaviour have
a positive and significant effect on employee performance of tailoring workers at the EPZ
in Athi River. It is therefore recommended that the management of the factories consider
adoption of background music in work places as a tool for improving employee
performance.
6.4.2 Familiarity With and Preference of Background Music
Based on the findings of hypothesis two of the study that mood mediated the relationship
between background music and employee performance, it is recommended that
employees be given a chance to decide the kind of background music to listen to. This
will enable them to identify with the music, which will have positive effect on their mood
and consequently their performance.
147
6.5 Contribution to Knowledge, Theory, Practice and Policy
This section outlines the major contributions of the current study to knowledge, theory
practice and policy.
6.5.1 Contribution to Knowledge and Theory
This study was based on structural evocation theory, Eysenck’s personality theory, theory
of planned behavior and the James-Lange’s theory of emotions. The structural evocation
theory asserts that if the structural dynamics of the music affecting the sensorium is
similar to the prevalent psychodynamic emotional structure, the two will unite and this
fusion will allow music to affect emotions directly. Participants in the study elicited
behaviour and emotions depending on whether there was presence or absence of
background music. Their choice of religious music also played a key role in determining
their behaviour, emotions and probable work performance. This study therefore supports
the theory of structural evocation.
Eysenck personality theory proposes that the arousal thresholds of introverts and that of
extraverts are different from each other and that optimum thresholds for both extraverts
and introverts are also different. Extraverts require external stimulation to reach optimum
arousal because their optimum arousal threshold is higher. They are carefree, easy going,
aggressive, lose their temper easily, enjoy excitement, and are impulsive and
spontaneous. Most of the participants in the extant study were extraverts. Extraverts need
external stimulation to perform to their optimum, when preferred and familiar
background music was introduced in factory one and two, performance increased largely

148
because of the presence of a fairly large contingent of extraverts. This study therefore
confirms the validity of the proposition of the Eysenck personality theory that extraverts
work well in the presence of an external stimulation which in this case was the
background music. This study therefore supports Eysenck Personality Theory.
Theory of planned behaviour (TPB) predicts intentional behaviour; it states that
behaviour depends on both motivation and ability. Participant’s behaviour when
background music was played changed tremendously. This was evident especially in
factory two where music was played intermittently. When music was not played in the
said factory, tailors asked for music but also when music was played they were calm and
relaxed, but when music was not played they were jittery. This study supports prediction
by TPB that behaviour depends on motivation and ability.
The study also supports arguments of James-Lange’s theory of emotions which states that
emotions are results of physiological reactions to external events. Employees at EPZ that
participated in the study were aroused by background music (external factor) which
affected their emotions. It was observed that these emotional changes, which in this study
were represented by mood, led to an increase in employee performance. The participants
in factory one, for example, where music was played throughout, were calm and relaxed
all the time. The findings of the study indicate that 67% of the observed tailors had a
positive mood. In this factory, talking was minimised compared to the other factories;
they mostly talked when enquiring about something. In addition they were more relaxed
and happy and were willing to take up new assignments. These findings support the
149
assumptions of TPB that individuals have the ability to exert self-control. This behaviour
control is possible when behavioural intentions are influenced by the attitude about the
likelihood that the behaviour will have the expected outcome.
6.5.2 Contribution to Practice
This study contributes immensely to work environment practices. Although it is common
practice to find people listening to music in their places of work using their portable
equipment, there was no known empirical research done to show which type of
background music is best suited for tailors in a garment factory, particularly in Kenya.
6.5.3 Contribution to Policy
This study shows that background music is not frivolous, but rather is a strong
managerial tool that can be used to yield high performance and improve productivity of
the workers. Thus, makers of policy on work environment, should realise that there are
varied types of music and not all types of music are good for work. In this study for
example, tailors who were majorly extraverts preferred upbeat and conventional music
and reflective and complex background music. Upbeat and conventional music and
reflective and complex background music, according to Rentfrow and Gosling (2003), is
mostly preferred by extraverts. This music may not be preferred by introverts and may
therefore cause them to perform dismally.
6.6 Limitation of the Study
The method used to collect data on mood and work behaviour of the participants largely
depended on the rater’s skill and experience in dealing with the tailors. Both mood and

150
work behaviour are not easy to rate. Though the researcher requested two supervisors to
assist in collection of data, there might have been issues of bias in the information
gathered by the rater. Since they already knew the research objectives, they might have
leaned towards achieving the objectives of the study, and hence might have introduced
bias in the study unintentionally.
Also, since background music was manipoulated differently in the two treatment groups,
the repondents may have unintentionally suspected the objective of the study and leaned
towards achieving them
6.7 Areas for Further Research
This was a study of tailoring workers who are between the ages of 20-40 years. In factory
one, background music was played throughout, and in factory two background music was
intermittently played, while in the third factory there was no music played. Tailors were
basically doing similar duties; they were of the same age group with almost similar
academic qualifications and socioeconomic background. Future research could address
the relationship between listening to music in a natural work context setting, testing
listeners from varied age groups, with different musical background preferences, doing
different tasks, at different times of the day to find out whether they have different
impacts on performance.
Research done in this area has attempted to examine the relationship between background
music, employee performance and emotional responses that occur as a consequence of
employees listening to background music. More studies recognising the effect of
151
personality or individual differences on diverse work environments for different
personality types are required to further understand its importance in the work setting. In
the current study, most of the tailors at the factories were extraverts, and from other
studies, extraverts love external stimulation brought about by music listening. Another
study looking at the effects on either extraverts or introverts alone doing similar jobs but
in different work settings needs to be done to find out the response from the different
personality types, besides extraverts.
Music genres have ill-defined categories, not all pieces of music fit into a single genre.
Many artists and pieces of music are cross multiple genres, so genre categories do not
apply equally well to every piece of music. This study categorised music into four major
categories as suggested by Rentfrow and Gosling to try and get the best results,
acknowledging the fact that there are different genres which are interrelated/interwoven
in nature. Unlike western music which can easily be grouped into categories based on
different genres, African music is difficult to categorise because most music combines
different elements of different genres in one piece.
This study recommends that future studies should come up with defined categories of
music that can be used in similar studies. In the current study for example, most of the
participants preferred local East African gospel music. East African gospel music has
similar elements of music, within that type of music are different types of gospel music
that need further categorisation .

152
Future researchers could also test the effect of background music on employee
performance in situations where the experimental group is treated to preferred music
while the control group is treated to background music that they do not prefer.
In the current study, since majority of the respondents were extraverts, future research
should consider an environment that has majority of respondents who are introverts to
find out if they have a similar response to background music and how this affects work
performance.
153
REFERENCES
Anderson, N. (2001). Handbook of Industrial, Work & Organizational Psychology:
Volume 1: Personnel Psychology. SAGE.
Anderson, S. A., & Fuller, G. B. (2010). Effect of Music on Reading Comprehension of
Junior High School Students. School Psychology Quarterly, 25(3), 178–187.
Azjen, I. (2002). Perceived Behavioral Control, Self Efficacy, Locus of Control and
Theory of Planned Behavior. Retrieved from
http://www.ingentaselect.com/rpsv/cw/bell/00219029/contp1.htm
Boothby, S. (2013). How Music Affects Our Moods. Retrieved July 30, 2016, from
http://www.healthline.com/health-news/mental-listening-to-music-lifts-or-
reinforces-mood-051713
Borman, W. C., & Motowidlo, S. J. (1997). Task Performance and Contextual
Performance: The Meaning for Personnel Selection Research. Human
Performance, 10, 99-109
Broadbent, D. (1958). Perception and Communication. Oxford: Pergamon.
Carlberg, C., (2016). Regression Analysis Microsoft Excel. Pearson Education
Cassidy, G., & MacDonald, R. A. R. (2007). The Effect of Background Music and
Background Noise on the Task Performance of Introverts and Extraverts.
Psychology of Music, 35(3), 517–537.
Chamorro-Premuzic, T. (2014). Personality and Individual Differences (3rd Edition).
New York: John Wiley & Sons.
Ciotti, G. (2012). How Music Affects Your Productivity. Retrieved March 31, 2015, from
http://www.sparringmind.com/music-productivity/
Dees, D. R. and Vera, H. (1978). Sound Tracking Everyday Life: The Use of Music in
Redefining Situations. Sociological Inquiry, 48: 133–141.
154
Delsing, M., Ter Bogt, T., Engels, R., & Meeus, W. (2008). Adolescents Music
Preferences and Personality Characteristics. John Wiley &Sons Ltd.
DeNora, T. (2010). Music in Everyday Life. Retrieved March 30, 2015, from
http://www.cambridge.org/us/academic/subjects/sociology/sociology-
generalinterest/music-everyday-life
Dibben, N., & Williamson, V. J. (2007). An Exploratory Survey of In-Vehicle Music
Listening. Psychology of Music, 35(4), 571–589.
http://doi.org/10.1177/0305735607079725
Dobbs, S., Furnham, A., & McClelland, A. (2011). The Effect of Background Music and
Noise on the Cognitive Test Performance of Introverts and Extraverts. Applied
Cognitive Psychology, 25(2), 307–313.
Dorrell, P. (2005). What is Music?: Solving a Scientific Mystery. United Kingdom:
Lulu.com.
Eysenck, H. J. (1958). A Short Questionnaire for the Measurement of Two Dimensions
of Personality. Journal of Applied Psychology, 42(1), 14-17.
Eysenck, H. J., & Eysenck, S. B. G. (1975). Manual of the Eysenck Personality
Questionnaire (Junior and Adult). Kent, UK: Hodder & Stoughton
Furnham, A. (1981). Personality and Activity Preference. British Journal of Social
Psychology, 20(1), 57–68.
Furnham, A., & Bradley, A. (1997). Music While You Work: The Differential
Distraction of Background Music on the Cognitive Test Performance of Introverts
and Extraverts. Applied Cognitive Psychology, 11(5), 445–455.

155
Furnham, A., & Strbac, L. (2002). Music is as Distracting as Noise: The Differential
Distraction of Background Music and Noise on the Cognitive Test Performance
of Introverts and Extraverts. Ergonomics, 45(3), 203–217.
Furnham, A., Trew, S., & Sneade, I. (1999). The Distracting Effects of Vocal and
Instrumental Music on the Cognitive Test Performance of Introverts and
Extraverts. Personality and Individual Differences, 27(2), 381–392.
Gordon, J. R. (2002). Organizational Behavior: A Diagnostic Approach. Retrieved March
28,2015,from
http://catalogue.pearsoned.co.uk/catalog/academic/product/0,1144,0130328472,0
0.html
Griffin, M. (2006). Background Music and the Learning Environment: Borrowing from
other Disciplines. Retrieved from http://eric.ed.gov/?id=ED498430
Grunewald, Marta. (1953) A Physiological Aspect of Experiencing Music. Amer. J.
Psychother
Haake, A. B. (2011). Individual Music Listening in Workplace Settings: An Exploratory
Survey of Offices in the UK. Musicae Scientiae, 15(1), 107–129.
Ireri, L. M., (2013). Effects of Trade Union Activities on Employee's Welfare: A Case of
EPZ Tailors and Textile Workers Union (TTWU) Affiliated Companies in Athi
River, Masters Dissertation, KU
Ivancevich, J. M., Konospake, R. C., & Matteson, M. T. (2011). Organisational Behavior
and Management (9th ed.). New York: McGraw Hill.
Jäncke, L., & Sandmann, P. (2010). Music Listening While You Learn: No Influence of
Background Music on Verbal Learning. Behavioral and Brain Functions : BBF,
6, 3.
156
Juslin, P. N., & Laukka, P. (2003). Communication of Emotions in Vocal Expression and
Music Performance: Different Channels, Same Code? Psychological Bulletin,
129(5), 770–814.
Juslin, P. N., & Västfjäll, D. (2008). Emotional Responses to Music: The Need to
Consider Underlying Mechanisms. The Behavioral and Brain Sciences, 31(5),
559-575-621.
Karageorghis, C. I., Mouzourides, D. A., Priest, D.-L., Sasso, T. A., Morrish, D. J., &
Walley, C. J. (2009). Psychophysical and Ergogenic Effects of Synchronous
Music During Treadmill Walking. Journal of Sport & Exercise Psychology,
31(1), 18–36.
Kiger, D. M. (1989). Effects of Music Information Load on a Reading Comprehension
Task. Perceptual and Motor Skills, 69(2), 531–534.
Leanza, F. (2010). Jazz, Then and Now (First Edition). The Educational Publisher.
Lesiuk, T. (2005). The Effect of Music Listening on Work Performance. Psychology of
Music, 33(2), 173–191.
Lester, D. (1995). Theories of Personality: A Systems Approach. Taylor & Francis.
MacDonald, J. (2013). The Effect of Music Preference on Complex Task Performance.
Global Tides, 7(1).
McCown, W., Keiser, R., Mulhearn, S., & Williamson, D. (1997). The Role of
Personality and Gender in Preference for Exaggerated Bass in Music. Personality
and Individual Differences, 23(4), 543–547.
Mas-Herrero, E., Marco-Pallares, J., Lorenzo-Seva, U., Zatorre, R. J., & Rodriguez-
Fornells, A. (2013). Individual Differences in Music Reward Experiences. Music
Perception: An Interdisciplinary Journal, 31(2), 118–138.

157
Matthews, G., Deary, I. J., & Whiteman, M. C. (2009). Personality Traits (3 edition).
Cambridge, UK; New York: Cambridge University Press.
Mawson A. (2002). The Workplace and its Impact on Productivity, Advanced Workplace
Associates, London, 4.Publication No. 8, http://www.occupier.org.
Melissa C., (N.D.) Examples of Employees Good Behaviour. Houston Chronicles
McCrae, R. R., & Allik, I. (2002). The Five-Factor Model of Personality Across
Cultures. Springer Science & Business Media.
McCrae, R. R., & John, O. P. (1992). An Introduction to the Five-Factor Model and Its
Applications. Journal of Personality, 60(2), 175–215.
Moynihan, L.M. and Peterson, R.S. (2001). 'A Contingent Configuration Approach to
Understanding the Role of Personality in Organisational Groups', Research in
Organisational Research, 23, pp327-78
North, A. C., & Hargreaves, D. J. (1999). Music and Driving Game Performance.
Scandinavian Journal of Psychology, 40(4), 285–292.
North, A. C., & Hargreaves, D. J. (2008). The Social and Applied Psychology of Music.
New York: Oxford University Press.
Nzewi, M.(1980). Folk music in Nigeria: A Communion, African Music, 6(1), 621.
Oblad, C. (2000). On Music-About the Car as a Concert Hall. Proceedings of the 6th
International Conference on Music, Perception and Cognition 5th -10th August.
Keele University, Keele.
Oldham, G. R., Cummings, A., Mischel, L. J., Schmidtke, J. M., & Zhou, J. (1995).
Listen While you Work? Quasi-Experimental Relations between Personal-Stereo

158
Headset Use and Employee Work Responses. Journal of Applied Psychology,
80(5), 547–564.
Pasick A. (2014). Better than Whistling: The Complete Guide to Listening to Music at
Work. Quartz
Pulakos, E. D. (1991). Behavioral Performance Measures: The Handbook for Managers
and Human Resource Professionals. New York: Lexington Books
Rentfrow, P. J., Goldberg, L. R., & Levitin, D. J. (2011). The Structure of Musical
Preferences: A Five-Factor Model. Journal of Personality and Social Psychology,
100(6), 1139–1157.
Rentfrow, P. J., & Gosling, S. D. (2006). Message in a Ballad: The Role of Music
Preferences in Interpersonal Perception. Psychological Science, 17(3), 236–242.
Rentfrow, P. J., & Gosling, S.D. (2003). The Do Re Mi’s of Everyday Life: The
Structure and Personality Correlates of Music Preferences. University of Texas,
Austin, 84 (No. 6), 1236–1256.
Russell, J. A. (1980). A Circumplex Model of Affect. Journal of Personality and Social
Psychology, 39, 1161-1178.
Schellenberg, E. G., Corrigall, K. A., Ladinig, O., & Huron, D. (2012). Changing the
Tune: Listeners Like Music that Expresses a Contrasting Emotion. Frontiers in
Psychology, 3.
Shek, V., & Schubert, E. (2009). Background Music at Work: A Literature Review and
Some Hypothesis. In Proceedings of The Second International Conference on
Music Communication Science, 3-4 December 2009. Sydney, Australia:
University of New South Wales.

159
Sloboda, J. (2005). Exploring the Musical Mind: Cognition, Emotion, Ability, Function.
Oxford University Press.
Taylor I.A., & Parpete F (1958). Current Theory and Research in the Effects of Music on
Human Behaviour . The journal of Aesthetics and Art Criticism vol17 no. 2 pp
251-258
Terry, P., & Karageorghis, C. I. (2010). Inside Sport Psychology. Retrieved, from
http://www.humankinetics.com/products/all-products/the-inside-sport-psychology
Titlow, J.P., (2016). Reinventing Music: How Music Changes Behaviour at Home. Fast
Company
Viswesvaran, C., & Ones, D. S. (2000). Perspective on Models of Job Performance.
International Journal of Secletion and Assessment, 8(4).
Watson, P. (2014). Study: Listening to Music Improves Accuracy at Work. Retrieved
from http://au.askmen.com/news/power_money/study-listening-to-music-
improves-accuracy-at-work.html
Wilson, S. (2003). The Effect of Music on Perceived Atmosphere and Purchase
Intentions in a Restaurant. Psychology of Music, 31(1), 93–112.
Zatorre, R. J., Chen, J. L., & Penhune, V. B. (2007). When the Brain Plays Music:
Auditory-Motor Interactions in Music Perception and Production. Nature
Reviews. Neuroscience, 8(7), 547–558.
Zuckerman, M., (1991). Problems in Behavioural Science: Psychology of Personality.
Cambridge University Press
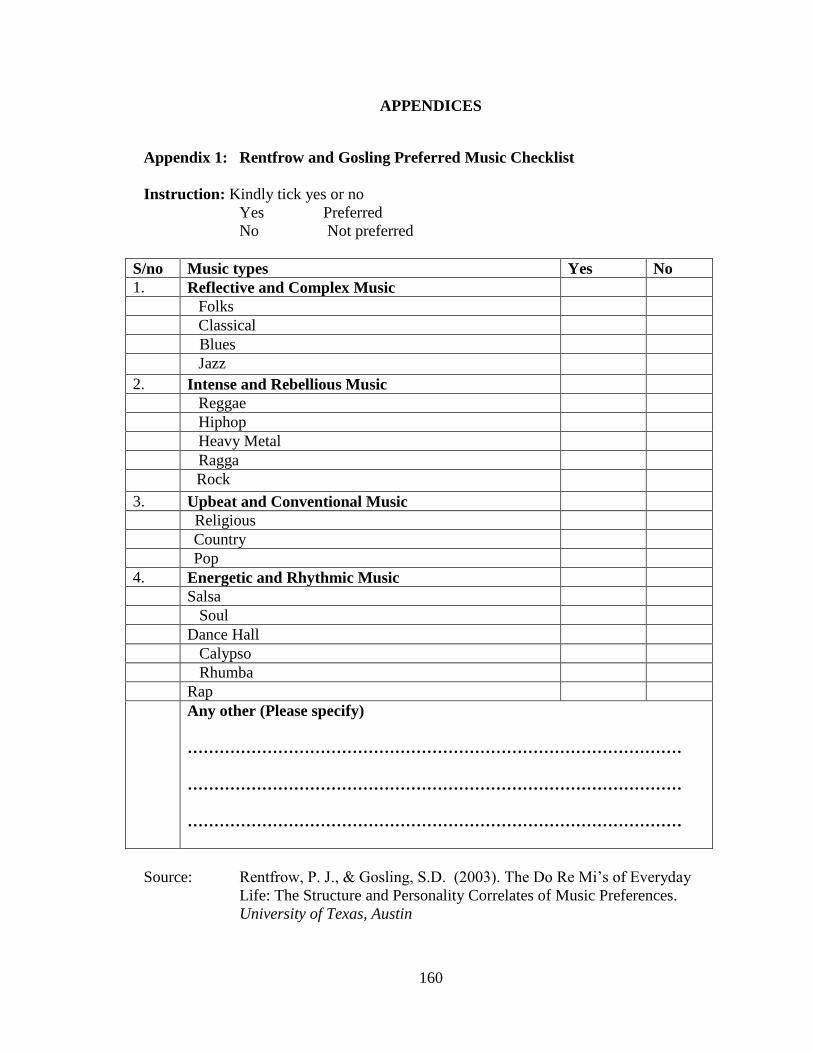
160
APPENDICES
Appendix 1: Rentfrow and Gosling Preferred Music Checklist
Instruction: Kindly tick yes or no
Yes Preferred
No Not preferred
S/no Music types Yes No
1. Reflective and Complex Music
Folks
Classical
Blues
Jazz
2. Intense and Rebellious Music
Reggae
Hiphop
Heavy Metal
Ragga
Rock
3. Upbeat and Conventional Music
Religious
Country
Pop
4. Energetic and Rhythmic Music
Salsa
Soul
Dance Hall
Calypso
Rhumba
Rap
Any other (Please specify)
…………………………………………………………………………………
…………………………………………………………………………………
…………………………………………………………………………………
Source: Rentfrow, P. J., & Gosling, S.D. (2003). The Do Re Mi’s of Everyday
Life: The Structure and Personality Correlates of Music Preferences.
University of Texas, Austin

161
Appendix 2: Eysenck Personality Inventory (EPI)
Instructions: There is no right or wrong answers; this is simply to measure
personality type of the participants
No. Question YES NO
1 I long for excitement
2 I need friends to cheer me up
3 I am carefree?
4 I find it very hard to take no for an answer
5 I stop to think things over before doing anything
6 I always keep my promise
7 My moods fluctuate
8 I say things quickly without stopping to think
9 I feel just miserable for no good reason
10 I can do anything for a dare
11 I do feel shy when talking to an attractive stranger
12 I do things on the spur of the moment
13 Once in a while I lose my temper and get angry
14 I often worry about things I should have done or said
15 I prefer reading to meeting people
16 My feelings are easily hurt
17 I like going out a lot
18 I occasionally have thoughts and ideas I would not like other
people to know about
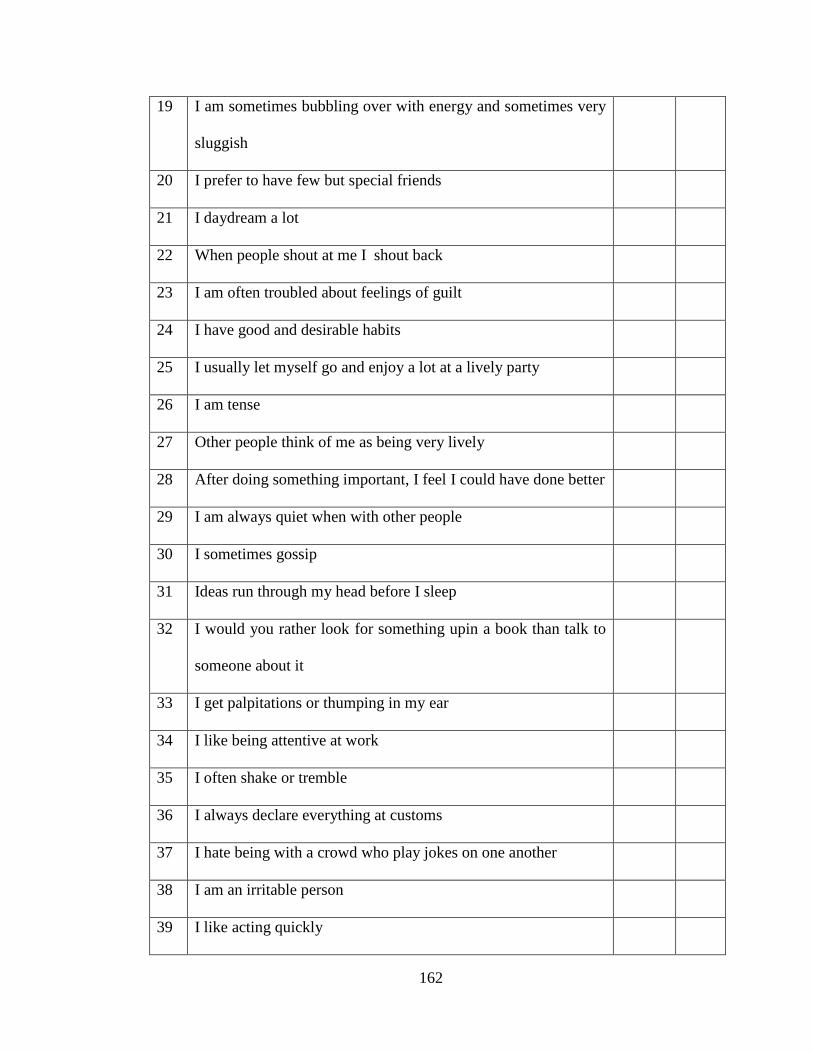
162
19 I am sometimes bubbling over with energy and sometimes very
sluggish
20 I prefer to have few but special friends
21 I daydream a lot
22 When people shout at me I shout back
23 I am often troubled about feelings of guilt
24 I have good and desirable habits
25 I usually let myself go and enjoy a lot at a lively party
26 I am tense
27 Other people think of me as being very lively
28 After doing something important, I feel I could have done better
29 I am always quiet when with other people
30 I sometimes gossip
31 Ideas run through my head before I sleep
32 I would you rather look for something upin a book than talk to
someone about it
33 I get palpitations or thumping in my ear
34 I like being attentive at work
35 I often shake or tremble
36 I always declare everything at customs
37 I hate being with a crowd who play jokes on one another
38 I am an irritable person
39 I like acting quickly

163
40 I worry a lot about awful things
41 I am slow
42 I have never been late to work or appointment
43 I have many nightmares
44 I like talking to people so much including strangers
45 I am troubled by aches and pains
46 I don’t like seeing people most of the time
47 I am nervous
48 There are people I don’t like
49 I am fairly self-confident
50 I am easily hurt when people find fault with me or my work
51 I find it hard to really enjoy myself at a lively party
52 I am troubled by inferiority
53 I can bring life in a dull party
54 I sometimes talk about things I know nothing about
55 I worry about my health
56 I like playing pranks on others
57 I suffer from sleeplessness
Source: Eysenck, H. J., & Eysenck, S. B. G. (1975). Manual of the Eysenck
Personality Questionnaire (Junior and Adult). Kent, UK: Hodder &
Stoughton

164
Appendix 3: Observation Data Sheet
Factory Name: ………………………………………
Date ………………………………………….
Time of Day : ……………………………………….
No. of respondents being observed……………………
Music
No music
Genre played …………
WORK BEHAVIOR EMPLOYEE PERFORMANCE
Start
time
End
time
Positive
attitude
Meets
deadline
Mood No of units
produced
No of units
Accepted
No of units
rejected
9am 10am
10am 11am
1am 12noo
n
2pm 3pm
3pm 4pm
General Remarks………………………………………………………………………………
………………..………………………………………………………………………………….
Other behavior noted that may have affected performance……………………………………
……………………………………………………………………………………………………
……………………………………………………………………………………………………
Source: Author, Current study

165
Appendix 4: Research Administered Questionnaire
To note: This is a voluntary exercise. Respondents can choose to withdraw at `any time
of the exercise. However, for the sake of completeness it is desirable that all respondents
stay on to the end.
1. How old are you? Below 30 years [ ] Above 30 years[ ]
2. What is your gender? Female[ ] Male [ ]
3. How long have you worked in this factory? Less than 10 years [ ]More than 10 [ ]
4. Do you enjoy your work? Yes [ ] No[ ]
5. Do you have breaks at work (Health break) Yes [ ] No[ ]
6. How do you relate with your colleagues? Well [ ] Poorly[ ]
7. How do you relate with your supervisor? Well [ ] Poorly [ ]
8. How would you rate your productivity? Excellent [ ] Good [ ] Fair [ ] Bad [ ]
9. Do you love listening to music? Yes [ ] No [ ]
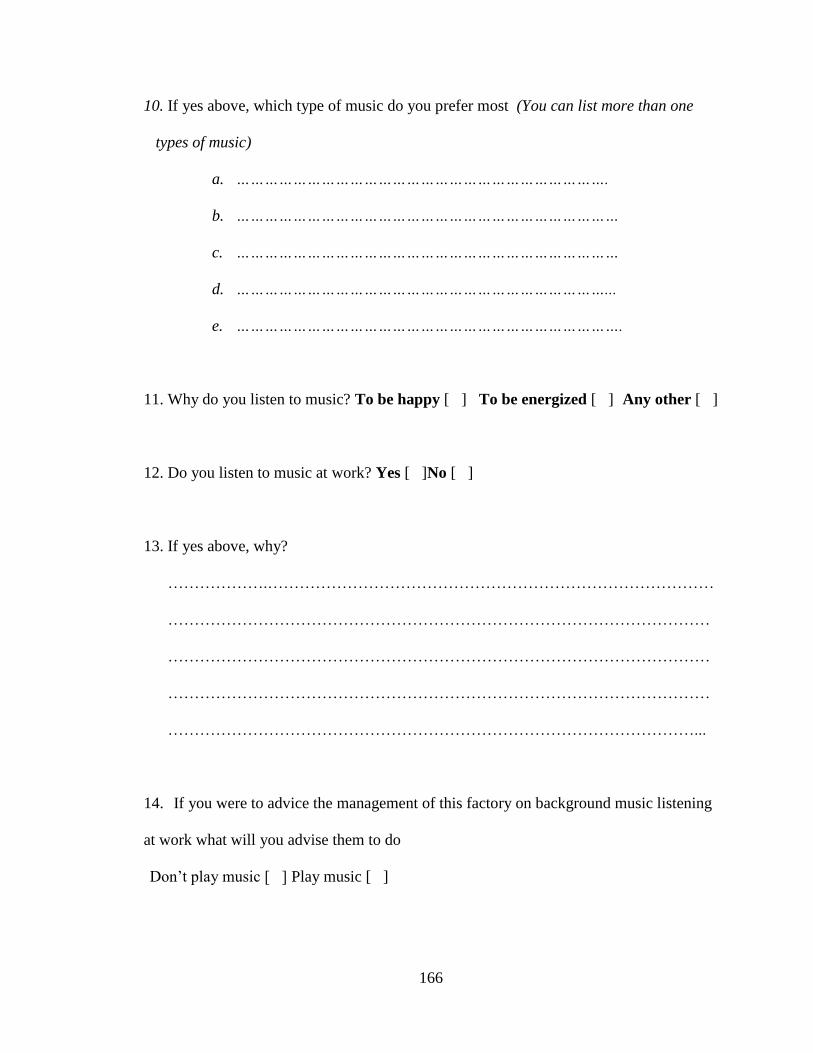
166
10. If yes above, which type of music do you prefer most (You can list more than one
types of music)
a. …………………………………………………………………….
b. ………………………………………………………………………
c. ………………………………………………………………………
d. ……………………………………………………………………...
e. ……………………………………………………………………….
11. Why do you listen to music? To be happy [ ] To be energized [ ] Any other [ ]
12. Do you listen to music at work? Yes [ ]No [ ]
13. If yes above, why?
……………….…………………………………………………………………………
…………………………………………………………………………………………
…………………………………………………………………………………………
…………………………………………………………………………………………
………………………………………………………………………………………...
14. If you were to advice the management of this factory on background music listening
at work what will you advise them to do
Don’t play music [ ] Play music [ ]
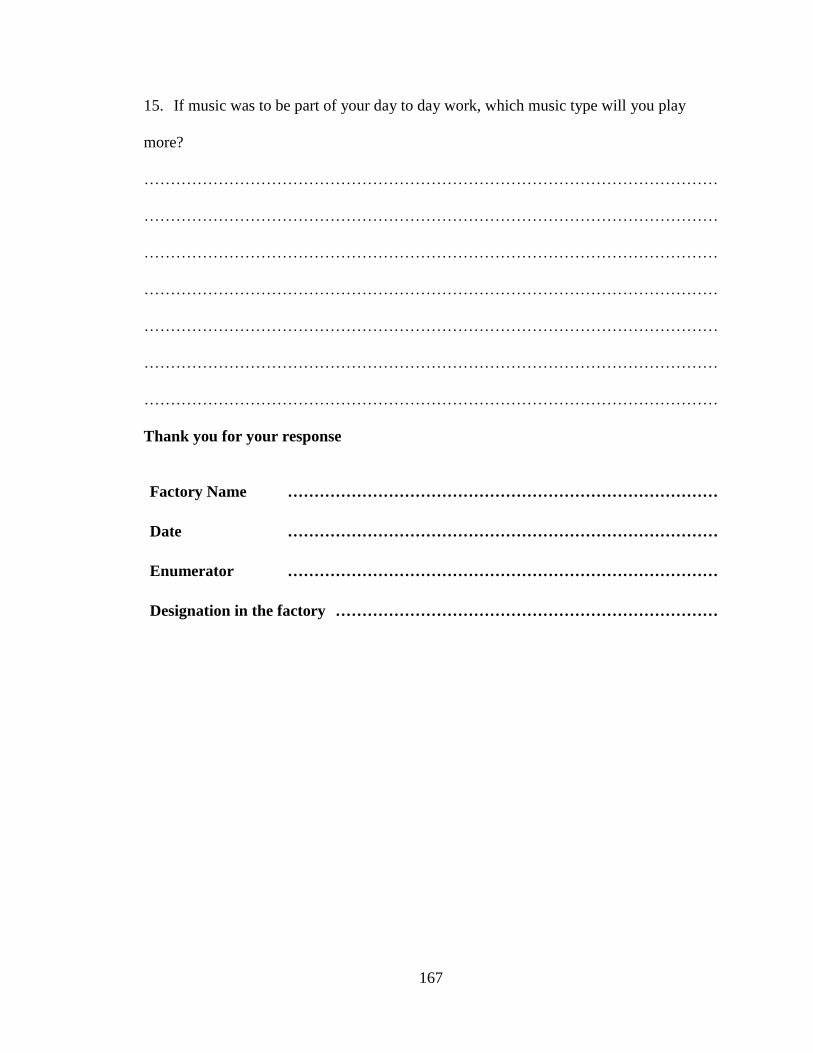
167
15. If music was to be part of your day to day work, which music type will you play
more?
………………………………………………………………………………………………
………………………………………………………………………………………………
………………………………………………………………………………………………
………………………………………………………………………………………………
………………………………………………………………………………………………
………………………………………………………………………………………………
………………………………………………………………………………………………
Thank you for your response
Factory Name ………………………………………………………………………
Date ………………………………………………………………………
Enumerator ………………………………………………………………………
Designation in the factory ………………………………………………………………

168
Appendix 5: List of EPZ Garment factories
Company
Name Contacts Location Activity
1. Africa Apparel
EPZ Ltd. P. O. Box 1443 -
00100 Nairobi
Sunflag Runyenjes
Rd, Nairobi Manufacturing – Garments
2. Alltex EPZ
Ltd. P. O. Box 30500 -
00100 , Nairobi Athi River EPZ
Manufacturing –Woven &
Knitted Garments
3. Ashton Apparel
EPZ Ltd, P. O. Box 43371 -
80100, Mombasa
Mombasa
Manufacturing – Garments
4. Balaji EPZ Ltd
P.O.Box1716 –
00621, Village
Market, Nairobi
Balaji EPZ Ruaraka Manufacturing - Garments
5. Brilliant
Garments EPZ
Ltd
P.O. Box 87337 -
08100, Mombasa
Talab EPZ -
Mtwapa Manufacturing- Garments
6. \ Global
Apparels (K)
EPZ Ltd
P. O. Box 322
00204 Athi River
Athi River EPZ -
Manufacturing – Garments
7. Hantex
Garments EPZ
Ltd
P.O. Box 87789 -
80100, Mazeras
Mazeras EPZ -
Mombasa
Manufacturing- Garments
8. Kapric
Apparels EPZ
Ltd
P. O. Box 81579,
Mombasa Changamwe-
Mombasa Manufacturing – Garments
9. Kikoy Mall
EPZ Ltd.,
P.O. Box 57892-
00200,Nairobi Athi River EPZ Manufacturing- Kikoy towels,
Bags, and bath robes
10. Longyun
Garments
Kenya EPZ Ltd
P.O.Box 93351 –
80100, Nairobi
Talab - Mombasa Manufacturing- Garments
11. Mahalakshimi
Garments
Kenya (EPZ)
Ltd
P.O.Box 504 -
00204 , Athi River
Athi River EPZ Manufacturing – Garments /
apparel
12. Mega Apparels
EPZ Ltd P.O.Box 81034 – Mombasa Manufacturing - Garments

169
Source: EPZA March 2016
80100, Mombasa
13. Mega
Garments EPZ
Ltd
P.O.Box81034 –
80100, Mombasa MJP EPZ -
Mombasa Manufacturing -Garments
14. Mombasa
Apparels EPZ
Ltd
P.O.Box 92348
(80102), Mombasa
Emirates EPZ -
Mombasa
Manufacturing- Garments
15. New Wide
Garments (K)
EPZ Ltd
P.O. Box 504 -
00204, Athi River
Transfleet – Athi
River Zone Manufacturing–Knit Garments
16. Royal
Garments EPZ
Ltd
P.O. Box 1409 –
00606,Sarit Centre
Nairobi
Athi River EPZ
Manufacturing - Garments
17. Simba
Apparels (EPZ)
Ltd
P. O. Box 81579,
Mombasa
Mombasa Manufacturing – Garments/
Apparel
18. Soko EPZ Ltd P.O.Box 775 –
80300, Voi
Wild Life Works
EPZ - Voi
Manufacturing – Woven and
knitted women’s Jackets,
Dresses, Skirts and Trousers
19. Suman Shakti
EPZ Ltd
P.O.Box 126 –
00621, Village
Market Nairobi
Balaji EPZ - Baba
Dogo Ruaraka
Nairobi
Manufacturing- Garments for
Ladies, men and children
20. Tailormade
Jeanswear
(EPZ) Ltd
P.O.Box 636 –
00242,Kitengela
Athi River EPZ Manufacturing – Denim Jeans
21. United Aryan
EPZ Ltd P.O. Box 126 -
00621 Village
Market, Nairobi
Balaji EPZ -
Ruaraka, Nairobi
Manufacturing – Garments;
Men, boys, toddlers denim
pants
22. Wild Life
Works EPZ Ltd P. O. Box 310 -
80300, Voi Wildlife Works
EPZ – Maungu,
Voi
Manufacturing – Garments
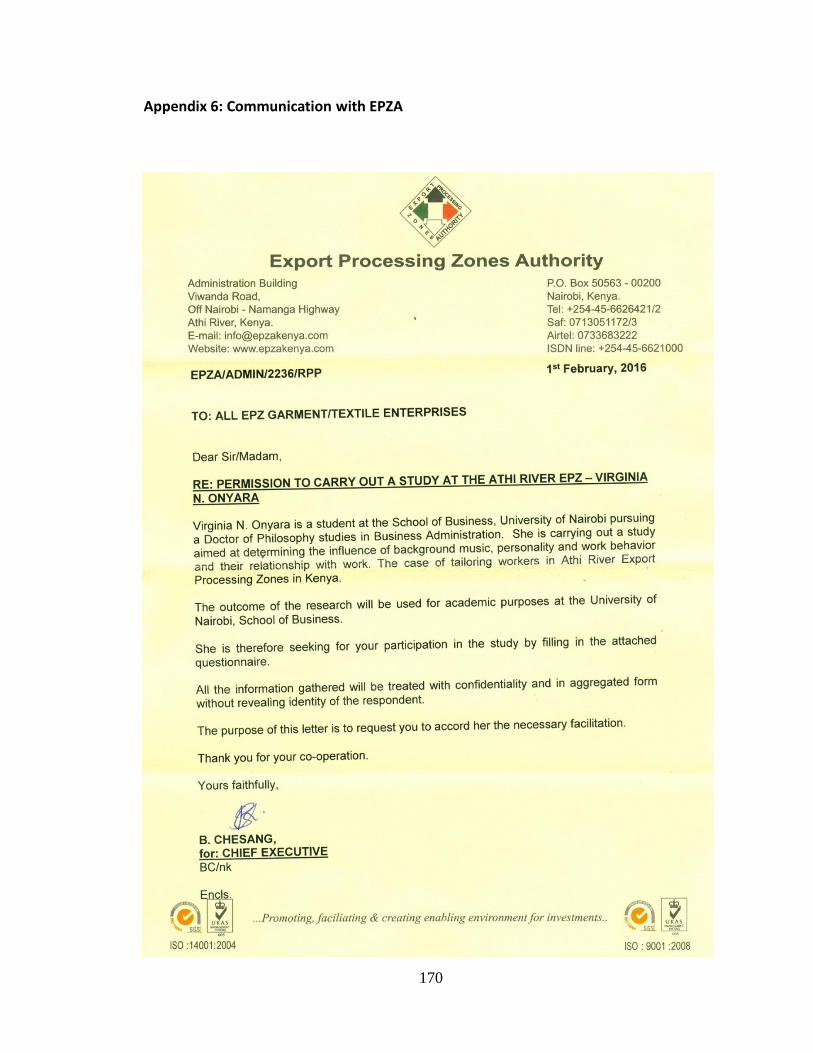
170
Appendix 6: Communication with EPZA

171
Appendix 7: Sample Size Table
Source: Xu, Gang (1999) Estimating Sample Size for a Descriptive Study in
Quantitative Research. Quirk’s Marketing Research Review
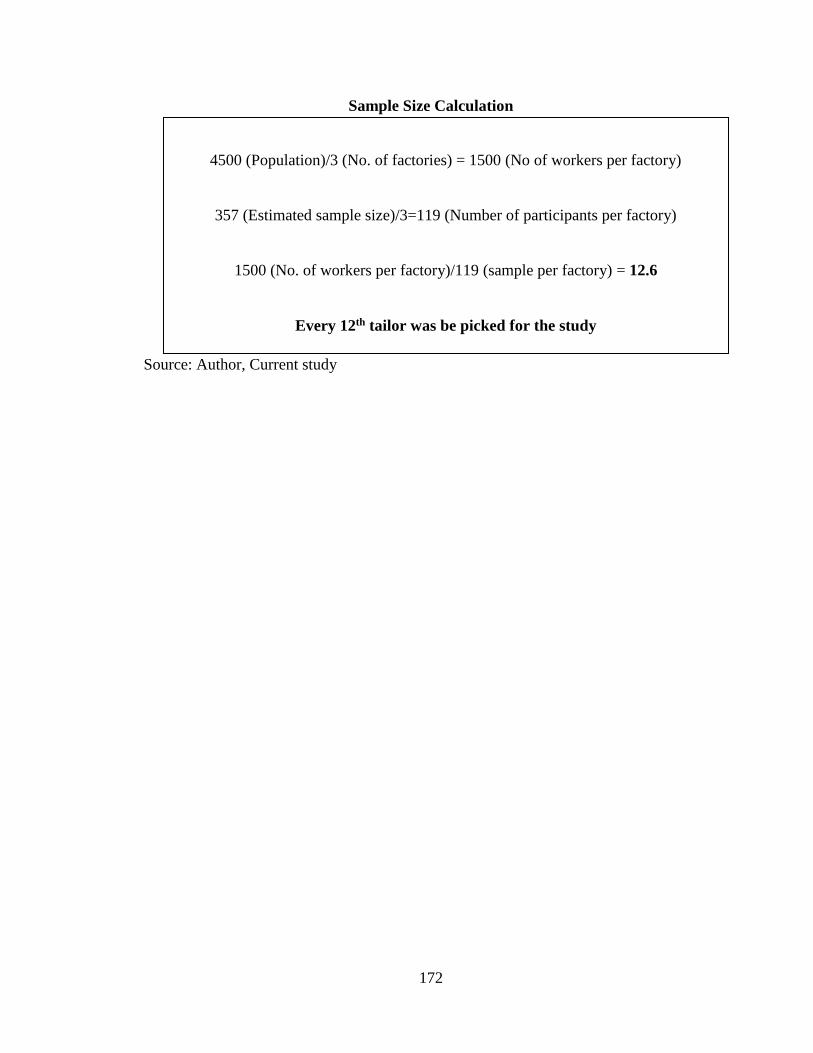
172
Sample Size Calculation
Source: Author, Current study
4500 (Population)/3 (No. of factories) = 1500 (No of workers per factory)
357 (Estimated sample size)/3=119 (Number of participants per factory)
1500 (No. of workers per factory)/119 (sample per factory) = 12.6
Every 12th tailor was be picked for the study

173
Appendix 8: Data on mood per respondent per day
Factory Resp Mood/ Emotions elicited
Day 1 Day 2 Day 3 Day 4 Day 5
Morn. A/noon Morn. A/noon Morn. A/noon Morn. A/noon Morn. A/noon
Factory
1
1 1 1 2 1 2 2 2 2 2 2
2 1 2 2 2 2 2 2 2 2 2
3 2 1 1 2 2 2 2 2 2 2
4 2 1 2 2 2 2 1 2 1 2
5 2 1 2 1 2 2 2 2 2 2
6 1 2 2 1 1 2 2 2 2 1
7 2 2 2 1 2 2 2 2 2 2
8 2 1 1 2 2 1 1 2 2 2
9 2 2 2 2 2 2 1 2 2 2
10 1 2 2 1 1 2 2 2 2 1
11 1 2 2 2 2 2 2 2 2 2
12 1 1 1 2 2 2 2 2 2 2
13 2 1 2 2 2 2 1 2 2 2
14 1 1 2 1 2 1 2 2 2 2
15 2 1 2 1 1 2 2 1 2 1
16 1 1 2 1 2 2 2 2 2 2
17 2 1 1 2 2 1 1 2 2 2
18 2 1 2 2 2 2 1 2 1 2
19 2 1 2 1 1 2 2 2 2 2
20 2 2 2 2 1 2 2 1 2 2
21 2 2 1 2 2 2 2 2 2 1
22 2 1 1 2 2 2 1 2 1 2
23 2 2 2 2 2 1 2 2 2 2
24 1 2 2 2 1 2 2 2 2 1
25 1 2 2 1 2 2 2 2 2 2
26 2 2 1 2 2 1 1 2 2 2
27 2 2 2 2 2 2 1 2 2 2
28 2 1 2 1 1 2 2 1 2 2
29 1 2 2 2 1 2 2 2 2 2
30 1 1 2 2 2 1 2 2 2 2
31 2 2 1 2 2 2 1 2 1 2
32 2 1 2 1 2 2 2 2 2 2
33 2 1 1 2 1 2 2 2 2 2
34 1 2 2 2 2 2 2 2 2 2
35 2 2 1 2 2 1 1 2 2 2
36 2 1 2 2 2 2 1 2 2 2

174
37 2 2 2 1 2 2 2 2 2 2
38 1 2 2 2 2 2 2 2 2 2
39 1 2 1 2 2 1 2 2 2 2
40 2 1 1 2 2 2 1 2 1 2
41 2 1 2 2 2 2 2 2 2 2
42 2 1 2 2 1 2 2 2 2 2
43 1 2 2 1 2 2 2 2 2 2
44 2 2 2 2 2 1 1 2 1 2
45 2 1 2 2 2 2 1 2 2 2
46 2 2 2 1 1 2 2 2 2 2
47 1 2 2 2 2 2 2 1 2 2
48 1 2 1 2 2 1 2 2 2 2
49 1 1 1 2 2 2 1 2 1 2
50 2 1 2 1 2 1 2 2 2 2
51 2 1 2 2 1 2 2 1 2 2
52 1 2 2 2 2 2 2 2 2 2
53 2 2 1 2 2 1 1 2 1 2
54 2 1 2 2 2 2 1 2 2 2
55 2 2 2 1 2 2 1 2 2
56 1 2 2 2 1 2 2 2 2 1
57 1 2 1 2 2 2 2 2 2 2
58 2 2 1 2 2 1 1 2 1 2
59 1 1 2 2 2 2 2 2 2 2
60 2 1 2 1 1 2 2 1 2 1
61 1 2 2 1 2 2 2 2 2 2
62 2 2 2 2 1 1 2 1 2
63 2 1 2 2 2 2 1 2 2 2
64 2 2 2 1 1 2 2 1 2 1
65 1 2 2 2 1 2 2 2 2 2
66 1 2 2 2 2 1 2 2 2 1
67 2 1 1 2 2 2 1 2 1 2
68 1 1 2 1 2 2 2 2 2 2
69 2 1 2 2 1 2 2 2 2 2
70 1 2 2 1 2 2 2 2 2 2
71 2 2 1 2 2 1 1 2 2 2
72 2 1 2 2 2 2 1 2 1 2
73 2 2 2 1 2 2 1 1 2 1
74 1 2 2 2 1 2 2 2 2 1
75 1 2 2 2 2 2 2, 1 2 2
76 2 1 1 2 2 1 1 2 1 2
77 2 2 2 1 2 1 2 2 2 2
175
78 2 1 2 1 1 2 2 1 2 2
79 1 2 2 1 2 2 2 2 2 2
80 2 2 2 2 2 1 1 2 1 2
81 2 1 2 2 2 2 1 2 2 2
82 2 2 2 1 1 2 2 1 2 1
83 2 2 2 2 1 2 2 2 2 2
84 2 1 1 2 2 1 2 2 2 2
85 2 1 2 1 2 2 1 2 1 2
86 1 2 2 2 2 2 2 2 2 2
87 2 2 2 1 1 2 2 1 2 1
88 2 1 2 1 2 2 2 2 2 2
89 2 2 2 2 2 1 1 2 1 2
90 1 2 2 2 2 2 1 2 1 2
91 1 2 2 1 1 2 2 2 2 2
92 2 1 2 2 1 2 2 2 2 1
93 2 1 1 2 2 2 2 2 2 2
94 2 2 1 2 2 1 1 2 2 2
95 1 2 2 1 2 1 2 2 2 2
96 2 2 2 1 1 2 2 1 2 1
97 2 1 2 2 2 2 2 2 2 2
98 2 2 1 2 2 1 1 2 1 2
99 1 2 2 2 2 2 1 2 1 2
100 1 2 2 1 1 2 2 1 2 2
101 2 1 2 2 1 1 2 2 2 2
102 2 1 1 2 2 2 2 2 2 2
103 2 2 1 2 2 2 1 2 1 2
104 1 2 2 1 2 2 2 2 2 1
105 2 2 2 1 1 2 2 1 2 2
106 2 1 2 1 2 2 2 2 1 2
107 2 2 1 2 2 1 2 2 2 2
108 1 2 2 2 2 2 1 2 1 1
109 1 2 2 1 1 2 2 1 2 2
110 2 2 2 2 1 2 2 2 2 2
111 2 1 2 2 2 1 2 2 2 2
112 2 1 1 2 2 1 1 2 1 2
113 1 2 2 1 2 1 2 2 2 2
114 2 2 2 2 1 2 2 1 2 1
115 2 1 2 1 2 2 2 2 2 2
116 2 2 1 2 2 1 1 2 1 1
117 1 2 2 2 2 2 2 2 1 2
118 1 2 2 1 1 2 2 2 2 2
176
119 2 1 2 2 1 2 2 2 2 2
Factory
2
1 1 1 2 1 1 1 2 1 2 1
2 1 2 2 1 1 2 2 1 2 1
3 2 1 1 2 2 1 1 2 1 2
4 2 1 2 2 2 1 2 2 2 2
5 2 1 1 2 2 1 2 2 2 2
6 1 2 2 1 1 2 2 1 2 1
7 2 2 1 2 2 2 2 2 2 2
8 2 1 1 2 2 1 1 2 1 2
9 2 2 2 2 2 2 2 2 2 2
10 2 1 1 1 1 2 2 1 2 1
11 1 2 1 1 1 2 2 1 2 1
12 1 1 1 1 1 1 1 1 1 1
13 2 1 2 2 2 1 2 2 2 2
14 1 1 2 1 1 1 2 1 2 1
15 2 1 2 2 2 1 2 2 2 2
16 1 1 2 1 1 1 2 1 2 1
17 2 1 1 2 2 1 1 2 1 2
18 2 1 2 2 2 1 2 2 2 2
19 2 1 2 2 2 1 2 2 2 2
20 2 2 2 2 2 2 2 2 2 2
21 2 2 1 2 2 2 1 2 1 2
22 2 1 1 2 2 1 1 2 1 2
23 2 2 2 2 2 2 2 2 2 2
24 1 2 1 1 1 2 2 1 2 1
25 1 2 2 1 1 2 2 1 2 1
26 2 2 1 2 2 2 1 2 1 2
27 2 2 2 2 2 2 2 2 2 2
28 2 1 2 2 2 1 2 2 2 2
29 1 2 2 1 1 2 2 1 2 1
30 1 1 2 1 1 1 2 1 2 1
31 2 2 1 2 2 2 1 2 1 2
32 2 1 2 2 2 1 2 2 2 2
33 2 1 1 2 2 1 1 2 1 2
34 1 2 2 1 1 2 2 1 2 1
35 2 2 1 2 2 2 1 2 1 2
36 2 1 2 2 2 1 2 2 2 2
37 2 2 2 2 2 2 2 2 2 2
38 1 2 2 1 1 2 2 1 2 1
39 2 2 1 1 1 2 1 1 1 1
40 2 1 1 2 2 1 1 2 1 2

177
41 2 1 2 2 2 1 2 2 2 2
42 2 1 2 2 2 1 2 2 2 2
43 1 2 2 1 1 2 2 1 2 1
44 2 2 2 2 2 2 2 2 2 2
45 2 1 2 2 2 1 2 2 2 2
46 2 2 2 2 2 2 2 2 2 2
47 1 2 2 1 1 2 2 1 2 1
48 2 2 1 1 2 2 1 1 1 1
49 1 1 1 1 2 1 1 1 1 1
50 2 1 2 2 2 1 2 2 2 2
51 2 1 1 2 2 1 2 2 2 2
52 1 2 2 1 1 2 2 1 2 1
53 2 2 1 2 2 2 1 2 1 2
54 2 1 2 2 2 1 2 2 2 2
55 2 2 2 2 2 2 2 2 2 2
56 2 2 2 1 1 2 2 1 2 1
57 1 2 1 1 2 2 1 1 1 1
58 2 2 1 2 2 2 1 2 1 2
59 1 1 2 1 1 1 2 1 2 1
60 2 1 2 2 2 1 2 2 2 2
61 1 2 2 1 1 2 2 1 2 1
62 2 2 2 2 2 2 2 2
63 2 1 2 2 2 1 2 2 2 2
64 2 2 2 2 2 2 2 2 2 2
65 2 2 2 1 1 2 2 1 2 1
66 1 2 2 1 1 2 2 1 2 1
67 2 1 1 2 2 1 1 2 1 2
68 1 1 2 1 2 1 2 1 2 1
69 2 1 2 2 2 1 2 2 2 2
70 1 2 2 1 1 2 2 1 2 1
71 2 2 1 2 2 2 1 1 1 2
72 2 1 2 2 2 1 2 2 2 2
73 2 2 2 2 2 2 2 2 2 2
74 1 2 2 1 1 2 2 1 1 1
75 1 2 2 1 2 2 2 1 2 1
76 2 1 1 2 2 1 1 2 1 2
77 2 2 2 2 2 2 2 1 1 2
78 2 1 1 2 2 1 2 2 1 2
79 1 2 2 1 1 2 2 1 2 1
80 2 2 1 2 2 2 2 2 2 2
81 2 1 2 2 2 1 2 1 2 2
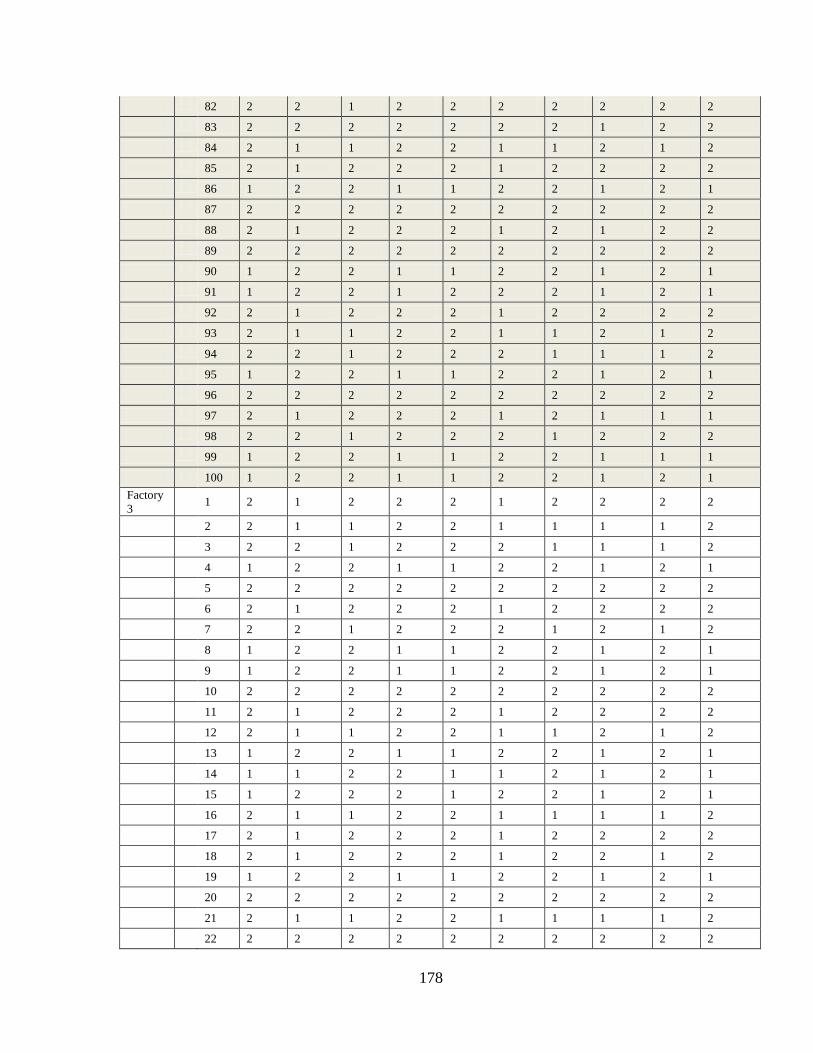
178
82 2 2 1 2 2 2 2 2 2 2
83 2 2 2 2 2 2 2 1 2 2
84 2 1 1 2 2 1 1 2 1 2
85 2 1 2 2 2 1 2 2 2 2
86 1 2 2 1 1 2 2 1 2 1
87 2 2 2 2 2 2 2 2 2 2
88 2 1 2 2 2 1 2 1 2 2
89 2 2 2 2 2 2 2 2 2 2
90 1 2 2 1 1 2 2 1 2 1
91 1 2 2 1 2 2 2 1 2 1
92 2 1 2 2 2 1 2 2 2 2
93 2 1 1 2 2 1 1 2 1 2
94 2 2 1 2 2 2 1 1 1 2
95 1 2 2 1 1 2 2 1 2 1
96 2 2 2 2 2 2 2 2 2 2
97 2 1 2 2 2 1 2 1 1 1
98 2 2 1 2 2 2 1 2 2 2
99 1 2 2 1 1 2 2 1 1 1
100 1 2 2 1 1 2 2 1 2 1
Factory
3
1 2 1 2 2 2 1 2 2 2 2
2 2 1 1 2 2 1 1 1 1 2
3 2 2 1 2 2 2 1 1 1 2
4 1 2 2 1 1 2 2 1 2 1
5 2 2 2 2 2 2 2 2 2 2
6 2 1 2 2 2 1 2 2 2 2
7 2 2 1 2 2 2 1 2 1 2
8 1 2 2 1 1 2 2 1 2 1
9 1 2 2 1 1 2 2 1 2 1
10 2 2 2 2 2 2 2 2 2 2
11 2 1 2 2 2 1 2 2 2 2
12 2 1 1 2 2 1 1 2 1 2
13 1 2 2 1 1 2 2 1 2 1
14 1 1 2 2 1 1 2 1 2 1
15 1 2 2 2 1 2 2 1 2 1
16 2 1 1 2 2 1 1 1 1 2
17 2 1 2 2 2 1 2 2 2 2
18 2 1 2 2 2 1 2 2 1 2
19 1 2 2 1 1 2 2 1 2 1
20 2 2 2 2 2 2 2 2 2 2
21 2 1 1 2 2 1 1 1 1 2
22 2 2 2 2 2 2 2 2 2 2

179
23 1 2 2 1 1 2 2 1 2 1
24 1 2 2 1 1 2 2 1 2 1
25 1 1 1 1 1 1 1 1 1 1
26 2 1 2 2 2 2 2 2 2 2
27 1 1 2 1 1 1 1 1 2 1
28 2 1 2 2 2 1 2 2 2 2
29 1 1 2 1 1 2 2 1 2 1
30 2 2 1 2 2 1 1 2 1 2
31 2 1 2 2 2 1 2 1 2 2
32 2 1 2 2 2 1 2 1 2 2
33 2 2 2 2 2 2 2 2 2 1
34 2 2 1 2 2 2 1 1 1 1
35 2 1 1 2 2 1 1 2 1 2
36 2 2 2 2 2 2 2 2 2 2
37 1 2 2 1 1 2 2 1 2 1
38 1 2 2 1 1 2 2 1 2 1
39 2 2 1 2 2 2 1 2 1 2
40 2 2 2 2 2 2 2 2 2 2
41 2 1 2 2 2 1 2 2 2 2
42 1 2 2 1 1 2 2 1 2 1
43 1 1 2 1 1 1 2 1 2 1
44 2 2 1 2 2 2 1 2 1 2
45 2 1 2 2 2 1 2 1 2 2
46 2 1 1 2 2 1 1 2 1 2
47 1 2 2 1 1 2 2 1 2 1
48 2 2 1 2 2 2 1 2 1 2
49 2 1 2 2 2 1 2 2 2 2
50 2 2 2 2 2 2 2 2 2 2
51 1 2 2 1 1 2 2 1 2 1
52 1 2 1 1 1 2 1 1 1 1
53 2 1 1 2 2 1 1 2 1 2
54 2 1 2 2 2 1 2 2 2 2
55 2 1 2 2 2 1 2 2 2 2
56 1 2 2 1 1 2 2 1 2 1
57 2 2 2 2 2 2 2 2 2 2
58 2 1 2 2 2 1 2 2 2 2
59 2 2 2 2 2 2 2 2 2 2
60 1 2 2 1 1 2 2 1 2 1
61 1 2 1 1 1 2 1 1 1 1
62 1 1 1 1 1 1 1 1 1 1
63 2 1 2 2 2 1 2 2 2 2

180
64 2 1 2 2 2 1 2 2 2 1
65 1 2 2 1 1 2 2 1 2 1
66 2 2 1 2 2 2 1 2 1 2
67 2 1 2 2 2 1 2 2 2 1
68 2 2 2 2 2 2 2 2 2 2
69 1 2 2 1 1 2 2 1 2 1
70 1 2 1 1 1 2 1 1 1 1
71 2 2 1 2 2 2 1 2 1 2
72 1 1 2 1 1 1 2 1 2 1
73 2 1 2 2 2 1 2 2 2 2
74 1 2 2 1 1 2 2 1 2 1
75 2 2 2 2 2 2 1 2
76 2 1 2 2 2 1 2 1 2 2
77 2 2 2 2 2 2 2 2 2 2
78 1 2 2 1 1 2 2 1 2 1
79 1 2 2 1 1 2 2 1 2 1
80 2 1 1 2 2 1 1 2 1 2
81 1 1 2 1 1 1 2 1 2 1
82 2 1 2 2 2 1 2 2 2 2
83 1 2 2 1 1 2 2 1 2 1
84 2 2 1 2 2 2 1 2 1 2
85 2 1 2 2 2 1 2 2 2 2
86 2 2 2 2 2 2 2 2 2 2
87 1 2 2 1 1 2 2 1 2 1
88 1 2 2 1 1 2 2 1 2 1
89 2 1 1 2 2 1 1 2 1 2
90 2 2 2 2 2 2 2 1 2 1
91 2 1 2 2 2 1 2 2 2 2
92 1 2 2 1 1 2 1 1 2 1
93 2 2 1 2 2 2 2 1 1 1
94 2 1 1 2 2 1 1 1 1 1
95 2 2 2 2 2 2 2 2 2 1
96 2 2 2 2 2 2 1 1 2 2
97 2 1 1 2 2 1 1 2 1 2
98 2 1 2 2 2 1 2 1 2 1
99 1 2 2 1 1 2 2 1 2 1
100 2 2 2 2 2 2 2 2 2 2
Source: Author, Current study

181
Appendix 9: Data on Work Behaviour
Factory Respo. Work Behaviour: Week 1
Day 1 Day 2 Day 3 Day 4 Day 5
Morn
ing
Aftern
oon
Morni
ng
After
noon
Morn
ing
After
noon
Morni
ng,
After
noon
Morni
ng, Afternoon
Factory
1 1 1 2 1 1 2 2 2 2 2 2
2 1 2 2 2 2 2 2 2 2 2
3 2 2 1 2 2 2 2 2 2 2
4 2 2 1 2 2 2 2 2 1 2
5 2 1 2 1 2 2 2 2 2 2
6 1 2 1 1 2 2 2 2 2 1
7 2 2 2 1 2 2 2 2 2 2
8 2 1 2 2 2 1 2 2 2 2
9 2 2 2 2 2 2 1 2 2 2
10 1 2 2 1 1 2 2 1 2 1
11 2 2 2 2 2 2 2 2 2 2
12 1 2 1 2 2 2 2 2 2 2
13 2 2 2 2 2 2 2 2 2 2
14 2 2 2 1 2 1 2 2 2 2
15 2 2 2 1 1 2 2 1 2 1
16 2 2 2 1 2 2 2 2 2 2
17 2 1 2 2 2 1 1 2 2 2
18 2 1 2 2 2 2 2 2 1 2
19 2 1 2 1 1 2 2 2 2 2
20 2 2 2 2 2 2 2 1 2 2
21 2 2 1 2 2 2 2 2 2 1
22 2 1 1 2 2 2 1 2 1 2
23 2 2 2 2 2 1 2 2 2 2
24 1 2 2 2 2 2 2 1 2 1
25 1 2 2 1 2 2 2 2 2 2
26 2 2 1 2 2 1 2 2 2 2
27 2 2 2 2 2 2 2 1 2 2
28 2 1 2 1 1 2 2 1 2 2
29 1 2 2 2 1 2 2 2 2 2
30 2 1 2 2 2 1 2 2 2 2
31 2 2 1 2 2 2 1 2 1 2
32 2 1 2 1 2 2 2 2 2 2
33 2 1 1 2 2 2 2 2 2 2
34 1 2 2 2 2 2 2 2 2 2
35 2 2 1 2 2 1 2 2 2 2
36 2 1 2 2 2 2 2 2 2 2

182
37 2 2 2 1 2 2 2 2 2 2
38 1 2 2 2 2 2 2 2 2 2
39 1 2 1 2 2 1 2 2 2 2
40 2 1 2 2 2 2 2 2 1 2
41 2 2 2 2 2 2 2 2 2 2
42 2 1 2 2 1 2 2 2 2 2
43 1 2 2 1 2 2 2 2 2 2
44 2 2 2 2 2 1 1 2 1 2
45 2 1 2 2 2 2 2 2 2 2
46 2 2 2 1 2 2 2 2 2 2
47 2 2 2 2 2 2 2 1 2 2
48 1 2 1 2 2 1 2 2 2 2
49 1 1 2 2 2 2 1 2 1 2
50 2 2 2 1 2 1 2 1 2 2
51 2 1 2 2 1 2 2 1 2 2
52 1 2 2 2 2 2 2 2 2 2
53 2 2 1 2 2 1 1 2 1 2
54 2 1 2 2 2 2 1 2 2 2
55 2 2 2 1 2 2 2 1 2 2
56 1 2 2 2 1 2 2 2 2 1
57 1 2 1 2 2 2 2 2 2 2
58 2 2 1 2 2 1 1 2 1 2
59 1 1 2 2 2 2 2 2 2 2
60 2 2 2 1 2 2 2 1 2 1
61 1 2 2 1 2 2 2 2 2 2
62 2 2 2 2 2 1 1 2 1 2
63 2 1 2 2 2 2 1 2 2 2
64 2 2 2 1 2 2 2 1 2 1
65 2 2 2 2 2 2 2 2 2 2
66 1 2 2 2 2 1 2 2 2 1
67 2 2 1 2 2 2 1 2 1 2
68 1 1 2 1 2 2 2 2 2 2
69 2 1 2 2 1 2 2 2 2 2
70 1 2 2 1 2 2 2 2 2 2
71 2 2 2 2 2 1 1 2 2 2
72 2 1 2 2 2 2 1 2 1 2
73 2 2 2 1 2 2 1 1 2 1
74 1 2 2 2 1 2 2 2 2 1
75 1 2 2 2 2 2 2, 1 2 2
76 2 2 1 2 2 1 1 2 1 2
77 2 2 2 1 2 1 2 2 2 2
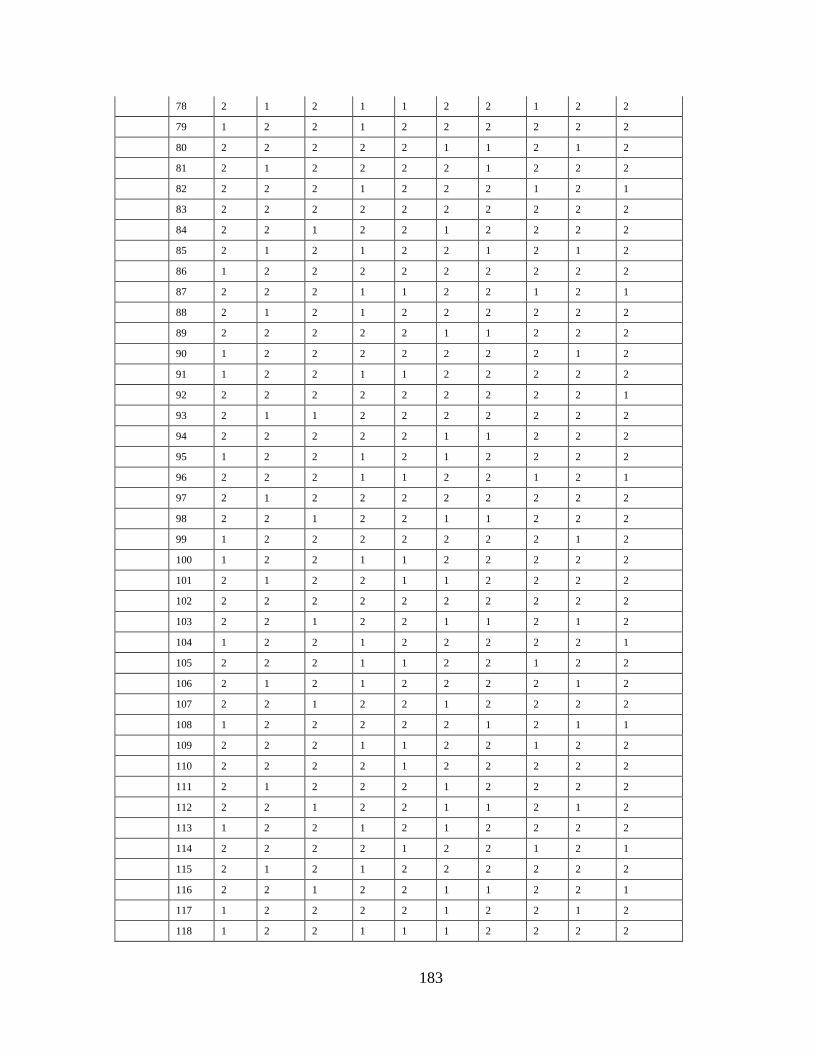
183
78 2 1 2 1 1 2 2 1 2 2
79 1 2 2 1 2 2 2 2 2 2
80 2 2 2 2 2 1 1 2 1 2
81 2 1 2 2 2 2 1 2 2 2
82 2 2 2 1 2 2 2 1 2 1
83 2 2 2 2 2 2 2 2 2 2
84 2 2 1 2 2 1 2 2 2 2
85 2 1 2 1 2 2 1 2 1 2
86 1 2 2 2 2 2 2 2 2 2
87 2 2 2 1 1 2 2 1 2 1
88 2 1 2 1 2 2 2 2 2 2
89 2 2 2 2 2 1 1 2 2 2
90 1 2 2 2 2 2 2 2 1 2
91 1 2 2 1 1 2 2 2 2 2
92 2 2 2 2 2 2 2 2 2 1
93 2 1 1 2 2 2 2 2 2 2
94 2 2 2 2 2 1 1 2 2 2
95 1 2 2 1 2 1 2 2 2 2
96 2 2 2 1 1 2 2 1 2 1
97 2 1 2 2 2 2 2 2 2 2
98 2 2 1 2 2 1 1 2 2 2
99 1 2 2 2 2 2 2 2 1 2
100 1 2 2 1 1 2 2 2 2 2
101 2 1 2 2 1 1 2 2 2 2
102 2 2 2 2 2 2 2 2 2 2
103 2 2 1 2 2 1 1 2 1 2
104 1 2 2 1 2 2 2 2 2 1
105 2 2 2 1 1 2 2 1 2 2
106 2 1 2 1 2 2 2 2 1 2
107 2 2 1 2 2 1 2 2 2 2
108 1 2 2 2 2 2 1 2 1 1
109 2 2 2 1 1 2 2 1 2 2
110 2 2 2 2 1 2 2 2 2 2
111 2 1 2 2 2 1 2 2 2 2
112 2 2 1 2 2 1 1 2 1 2
113 1 2 2 1 2 1 2 2 2 2
114 2 2 2 2 1 2 2 1 2 1
115 2 1 2 1 2 2 2 2 2 2
116 2 2 1 2 2 1 1 2 2 1
117 1 2 2 2 2 1 2 2 1 2
118 1 2 2 1 1 1 2 2 2 2
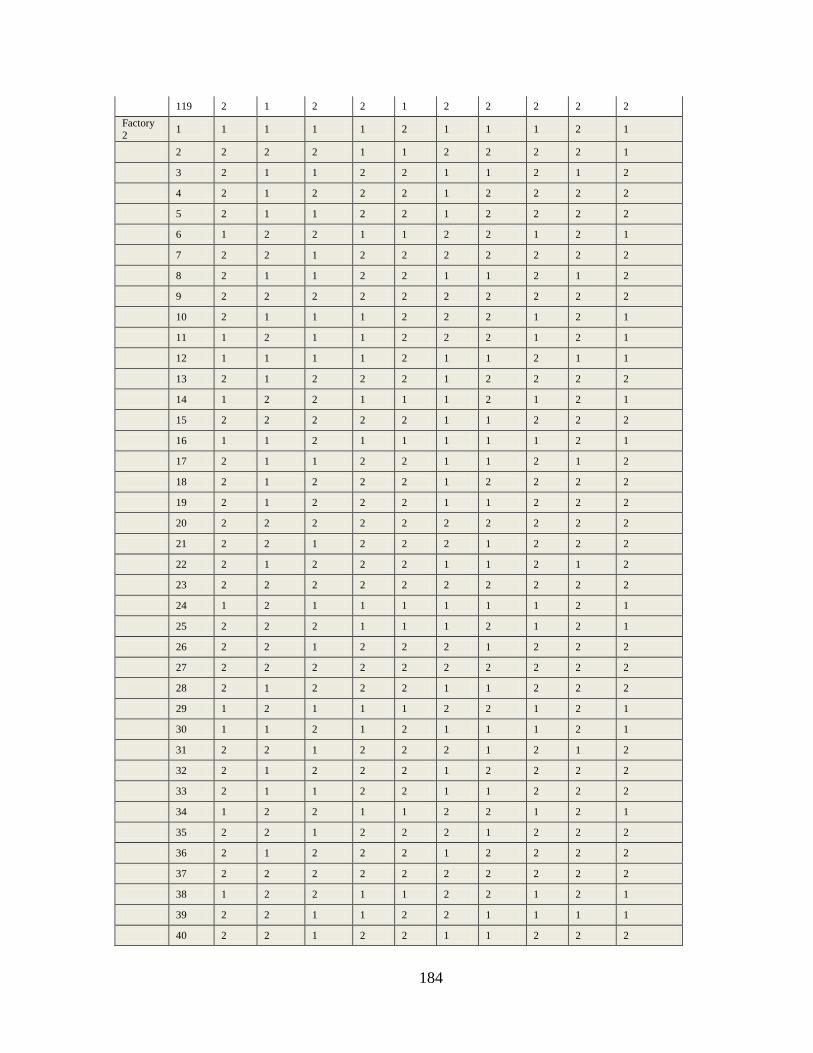
184
119 2 1 2 2 1 2 2 2 2 2
Factory
2 1 1 1 1 1 2 1 1 1 2 1
2 2 2 2 1 1 2 2 2 2 1
3 2 1 1 2 2 1 1 2 1 2
4 2 1 2 2 2 1 2 2 2 2
5 2 1 1 2 2 1 2 2 2 2
6 1 2 2 1 1 2 2 1 2 1
7 2 2 1 2 2 2 2 2 2 2
8 2 1 1 2 2 1 1 2 1 2
9 2 2 2 2 2 2 2 2 2 2
10 2 1 1 1 2 2 2 1 2 1
11 1 2 1 1 2 2 2 1 2 1
12 1 1 1 1 2 1 1 2 1 1
13 2 1 2 2 2 1 2 2 2 2
14 1 2 2 1 1 1 2 1 2 1
15 2 2 2 2 2 1 1 2 2 2
16 1 1 2 1 1 1 1 1 2 1
17 2 1 1 2 2 1 1 2 1 2
18 2 1 2 2 2 1 2 2 2 2
19 2 1 2 2 2 1 1 2 2 2
20 2 2 2 2 2 2 2 2 2 2
21 2 2 1 2 2 2 1 2 2 2
22 2 1 2 2 2 1 1 2 1 2
23 2 2 2 2 2 2 2 2 2 2
24 1 2 1 1 1 1 1 1 2 1
25 2 2 2 1 1 1 2 1 2 1
26 2 2 1 2 2 2 1 2 2 2
27 2 2 2 2 2 2 2 2 2 2
28 2 1 2 2 2 1 1 2 2 2
29 1 2 1 1 1 2 2 1 2 1
30 1 1 2 1 2 1 1 1 2 1
31 2 2 1 2 2 2 1 2 1 2
32 2 1 2 2 2 1 2 2 2 2
33 2 1 1 2 2 1 1 2 2 2
34 1 2 2 1 1 2 2 1 2 1
35 2 2 1 2 2 2 1 2 2 2
36 2 1 2 2 2 1 2 2 2 2
37 2 2 2 2 2 2 2 2 2 2
38 1 2 2 1 1 2 2 1 2 1
39 2 2 1 1 2 2 1 1 1 1
40 2 2 1 2 2 1 1 2 2 2

185
41 2 2 2 2 2 1 2 2 2 2
42 2 1 2 2 2 1 2 2 2 2
43 1 2 2 1 1 2 2 1 2 1
44 2 2 2 2 2 2 1 2 2 2
45 2 1 1 2 2 1 1 2 2 2
46 2 2 2 2 2 2 2 2 2 2
47 1 2 2 1 1 1 1 1 2 1
48 2 2 1 1 2 2 1 1 2 1
49 1 1 1 1 2 1 1 1 1 1
50 2 1 2 2 2 1 2 2 2 2
51 2 1 1 2 2 1 2 2 2 2
52 2 2 2 1 1 2 2 1 2 1
53 2 2 1 2 2 2 1 2 1 2
54 2 1 2 2 2 1 2 2 2 2
55 2 1 2 2 2 2 2 2 2 2
56 2 1 1 1 1 1 2 1 2 1
57 1 1 1 1 2 1 1 1 1 1
58 2 2 1 2 2 2 1 2 2 2
59 2 2 2 1 1 1 2 1 2 1
60 2 1 2 2 2 1 2 2 2 2
61 1 2 2 1 1 2 2 1 2 1
62 2 2 2 2 2 2 2 2 2 2
63 2 1 2 2 2 1 1 2 2 2
64 2 2 2 2 2 2 1 2 2 2
65 2 2 2 1 1 2 1 1 2 1
66 1 2 2 1 1 2 2 1 2 1
67 2 2 1 2 2 1 1 2 1 2
68 1 1 2 1 2 1 2 1 2 1
69 2 1 2 2 2 1 2 2 2 2
70 1 2 2 1 1 1 2 1 2 1
71 2 2 1 2 2 2 1 1 1 2
72 2 1 2 2 2 1 2 2 2 2
73 2 2 2 2 2 2 2 2 2 2
74 1 2 2 1 1 2 2 1 2 1
75 1 2 2 1 2 2 2 1 2 1
76 2 1 1 2 2 1 1 2 1 2
77 2 2 2 2 2 2 2 1 2 2
78 2 1 1 2 2 1 2 2 2 2
79 1 2 2 1 1 1 2 1 2 1
80 2 2 1 2 2 2 2 2 2 2
81 2 1 2 2 2 1 2 1 2 2
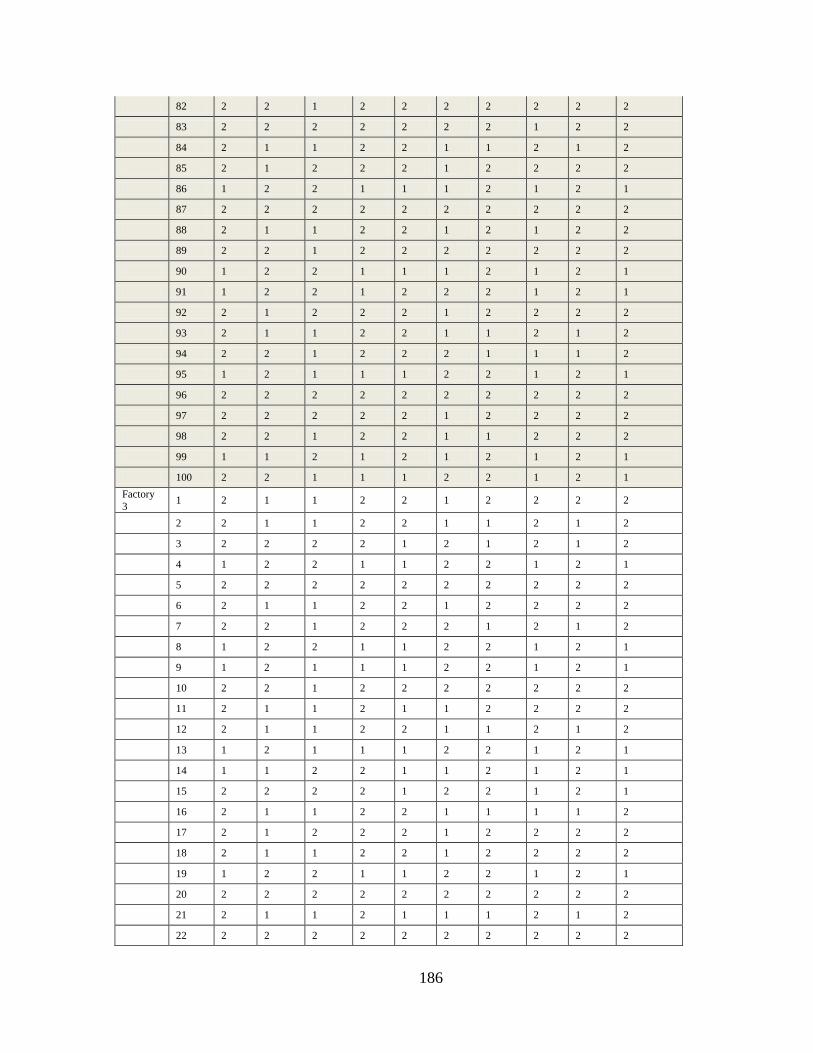
186
82 2 2 1 2 2 2 2 2 2 2
83 2 2 2 2 2 2 2 1 2 2
84 2 1 1 2 2 1 1 2 1 2
85 2 1 2 2 2 1 2 2 2 2
86 1 2 2 1 1 1 2 1 2 1
87 2 2 2 2 2 2 2 2 2 2
88 2 1 1 2 2 1 2 1 2 2
89 2 2 1 2 2 2 2 2 2 2
90 1 2 2 1 1 1 2 1 2 1
91 1 2 2 1 2 2 2 1 2 1
92 2 1 2 2 2 1 2 2 2 2
93 2 1 1 2 2 1 1 2 1 2
94 2 2 1 2 2 2 1 1 1 2
95 1 2 1 1 1 2 2 1 2 1
96 2 2 2 2 2 2 2 2 2 2
97 2 2 2 2 2 1 2 2 2 2
98 2 2 1 2 2 1 1 2 2 2
99 1 1 2 1 2 1 2 1 2 1
100 2 2 1 1 1 2 2 1 2 1
Factory
3 1 2 1 1 2 2 1 2 2 2 2
2 2 1 1 2 2 1 1 2 1 2
3 2 2 2 2 1 2 1 2 1 2
4 1 2 2 1 1 2 2 1 2 1
5 2 2 2 2 2 2 2 2 2 2
6 2 1 1 2 2 1 2 2 2 2
7 2 2 1 2 2 2 1 2 1 2
8 1 2 2 1 1 2 2 1 2 1
9 1 2 1 1 1 2 2 1 2 1
10 2 2 1 2 2 2 2 2 2 2
11 2 1 1 2 1 1 2 2 2 2
12 2 1 1 2 2 1 1 2 1 2
13 1 2 1 1 1 2 2 1 2 1
14 1 1 2 2 1 1 2 1 2 1
15 2 2 2 2 1 2 2 1 2 1
16 2 1 1 2 2 1 1 1 1 2
17 2 1 2 2 2 1 2 2 2 2
18 2 1 1 2 2 1 2 2 2 2
19 1 2 2 1 1 2 2 1 2 1
20 2 2 2 2 2 2 2 2 2 2
21 2 1 1 2 1 1 1 2 1 2
22 2 2 2 2 2 2 2 2 2 2

187
23 1 2 2 1 1 2 2 1 2 1
24 1 2 1 1 1 2 2 1 2 1
25 1 1 1 1 1 1 1 1 1 1
26 2 1 2 2 2 2 2 2 2 2
27 1 1 2 1 1 1 2 1 2 1
28 2 1 1 2 2 1 2 2 2 2
29 1 1 2 1 1 2 2 1 2 1
30 2 2 1 2 2 1 1 2 1 2
31 2 1 2 2 2 1 2 2 2 2
32 2 1 1 2 2 1 2 2 2 2
33 2 2 2 2 1 2 2 2 2 1
34 2 2 1 2 2 2 1 2 1 1
35 2 1 1 2 2 1 1 2 1 2
36 2 2 2 2 2 2 2 2 2 2
37 1 1 1 1 1 2 2 1 2 1
38 1 2 2 1 1 2 2 1 2 1
39 2 1 1 2 2 2 1 2 1 2
40 2 2 1 2 2 2 2 2 2 2
41 2 1 1 2 2 1 2 2 2 2
42 1 2 2 1 1 2 2 1 2 1
43 1 1 2 1 1 1 2 1 2 1
44 2 2 1 2 2 2 1 2 1 2
45 2 2 2 2 2 1 2 2 2 2
46 2 2 1 2 1 1 1 2 1 2
47 1 2 2 1 1 2 2 1 2 1
48 2 2 1 2 2 2 1 2 1 2
49 2 1 2 2 2 1 2 2 2 2
50 2 2 2 2 2 2 2 2 2 2
51 1 1 2 1 1 2 2 1 2 1
52 1 2 1 1 1 2 1 1 1 1
53 2 1 1 2 2 1 1 2 1 2
54 2 2 1 2 2 1 2 2 2 2
55 2 1 2 2 2 1 2 2 2 2
56 1 2 2 1 1 2 2 1 2 1
57 2 2 1 2 2 2 2 2 2 2
58 2 1 2 2 2 1 2 2 2 2
59 2 2 1 2 2 2 2 2 2 2
60 2 2 2 1 1 2 2 1 2 1
61 1 1 1 1 1 2 1 1 1 1
62 1 2 1 1 1 1 1 1 1 1
63 2 1 1 2 2 1 2 2 2 2
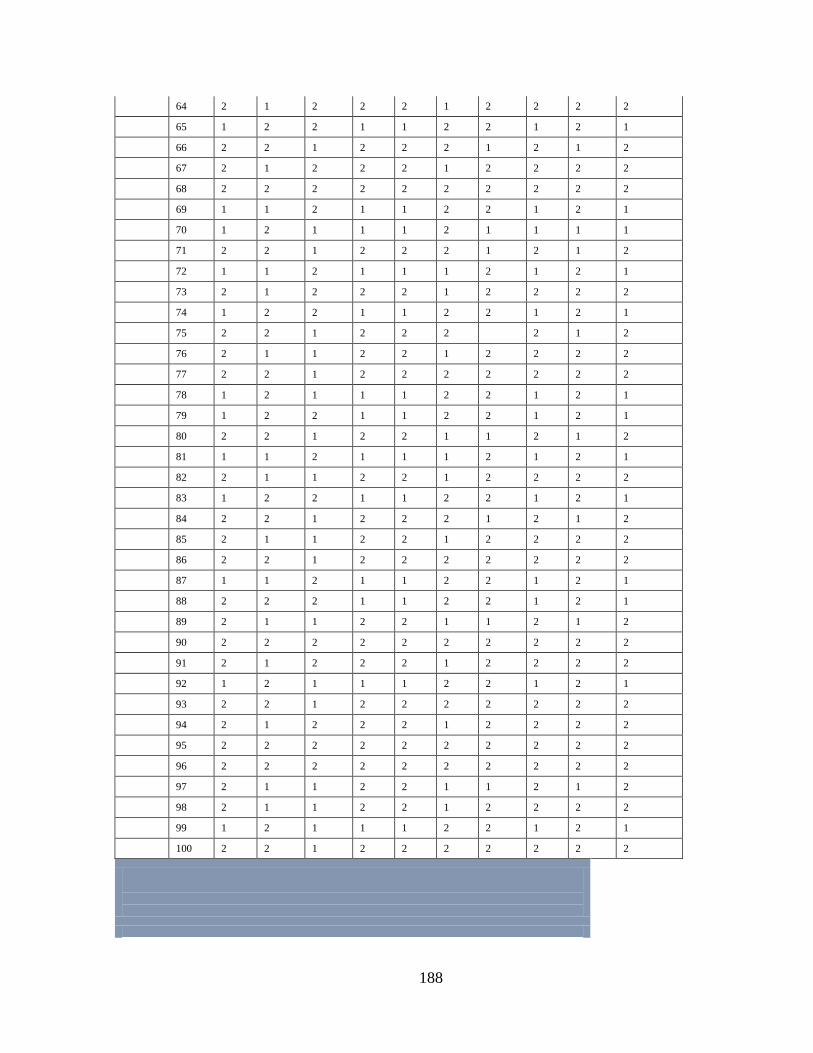
188
64 2 1 2 2 2 1 2 2 2 2
65 1 2 2 1 1 2 2 1 2 1
66 2 2 1 2 2 2 1 2 1 2
67 2 1 2 2 2 1 2 2 2 2
68 2 2 2 2 2 2 2 2 2 2
69 1 1 2 1 1 2 2 1 2 1
70 1 2 1 1 1 2 1 1 1 1
71 2 2 1 2 2 2 1 2 1 2
72 1 1 2 1 1 1 2 1 2 1
73 2 1 2 2 2 1 2 2 2 2
74 1 2 2 1 1 2 2 1 2 1
75 2 2 1 2 2 2 2 1 2
76 2 1 1 2 2 1 2 2 2 2
77 2 2 1 2 2 2 2 2 2 2
78 1 2 1 1 1 2 2 1 2 1
79 1 2 2 1 1 2 2 1 2 1
80 2 2 1 2 2 1 1 2 1 2
81 1 1 2 1 1 1 2 1 2 1
82 2 1 1 2 2 1 2 2 2 2
83 1 2 2 1 1 2 2 1 2 1
84 2 2 1 2 2 2 1 2 1 2
85 2 1 1 2 2 1 2 2 2 2
86 2 2 1 2 2 2 2 2 2 2
87 1 1 2 1 1 2 2 1 2 1
88 2 2 2 1 1 2 2 1 2 1
89 2 1 1 2 2 1 1 2 1 2
90 2 2 2 2 2 2 2 2 2 2
91 2 1 2 2 2 1 2 2 2 2
92 1 2 1 1 1 2 2 1 2 1
93 2 2 1 2 2 2 2 2 2 2
94 2 1 2 2 2 1 2 2 2 2
95 2 2 2 2 2 2 2 2 2 2
96 2 2 2 2 2 2 2 2 2 2
97 2 1 1 2 2 1 1 2 1 2
98 2 1 1 2 2 1 2 2 2 2
99 1 2 1 1 1 2 2 1 2 1
100 2 2 1 2 2 2 2 2 2 2

189
Factory Respo. Work Behaviour: Week 2
Day 1 Day 2 Day 3 Day 4 Day 5
Morn
ing
Aftern
oon
Morni
ng,
After
noon
Morn
ing
After
noon
Morni
ng,
Aftern
oon
Mornin
g,
Afterno
on
Factory
1 1 2 1 2 2 2 2 2 2 2 2
2 2 2 2 2 2 2 2 2 2 2
3 2 1 1 2 2 2 2 2 2 2
4 2 1 2 2 2 2 1 2 1 2
5 2 1 2 1 2 2 2 2 2 2
6 1 2 2 2 1 2 2 2 2 1
7 2 2 2 2 2 2 2 2 2 2
8 2 1 1 2 2 1 1 2 2 2
9 2 2 2 2 2 2 1 2 2 2
10 1 2 2 1 1 2 2 2 2 1
11 2 2 2 2 2 2 2 2 2 2
12 2 2 2 2 2 2 2 2 2 2
13 2 2 2 2 2 2 1 2 2 2
14 2 2 2 1 2 1 2 2 2 2
15 2 2 2 1 1 2 2 1 2 1
16 2 2 2 1 2 2 2 2 2 2
17 2 2 1 2 2 1 1 2 2 2
18 2 2 2 2 2 2 1 2 1 2
19 2 1 2 1 1 2 2 2 2 2
20 2 2 2 2 1 2 2 1 2 2
21 2 2 2 2 2 2 2 2 2 1
22 2 1 1 2 2 2 1 2 1 2
23 2 2 2 2 2 1 2 2 2 2
24 2 2 2 2 1 2 2 2 2 1
25 1 2 2 1 2 2 2 2 2 2
26 2 2 1 2 2 1 1 2 2 2
27 2 2 2 2 2 2 1 2 2 2
28 2 2 2 1 1 2 2 1 2 2
29 1 2 2 2 1 2 2 2 2 2
30 2 2 2 2 2 1 2 2 2 2
31 2 2 1 2 2 2 1 2 1 2
32 2 2 2 1 2 2 2 2 2 2
33 2 2 1 2 1 2 2 2 2 2
34 2 2 2 2 2 2 2 2 2 2
35 2 2 1 2 2 1 1 2 2 2
36 2 2 2 2 2 2 1 2 2 2
37 2 2 2 1 2 2 2 2 2 2
38 1 2 2 2 2 2 2 2 2 2

190
39 1 2 1 2 2 1 2 2 2 2
40 2 2 2 2 2 2 1 2 1 2
41 2 2 2 2 2 2 2 2 2 2
42 2 2 2 2 1 2 2 2 2 2
43 2 2 2 1 2 2 2 2 2 2
44 2 2 2 2 2 1 1 2 1 2
45 2 1 2 2 2 2 1 2 2 2
46 2 2 2 1 1 2 2 2 2 2
47 1 2 2 2 2 2 2 1 2 2
48 1 2 1 2 2 1 2 2 2 2
49 1 1 1 2 2 2 1 2 1 2
50 2 2 2 1 2 1 2 2 2 2
51 2 2 2 2 1 2 2 1 2 2
52 1 2 2 2 2 2 2 2 2 2
53 2 2 1 2 2 1 1 2 1 2
54 2 1 2 2 2 2 1 2 2 2
55 2 2 2 1 2 2 1 2 2
56 1 2 2 2 1 2 2 2 2 1
57 1 2 1 2 2 2 2 2 2 2
58 2 2 2 2 2 1 1 2 1 2
59 1 2 2 2 2 2 2 2 2 2
60 2 1 2 1 1 2 2 1 2 1
61 1 2 2 1 2 2 2 2 2 2
62 2 2 2 2 2 1 1 2 1 2
63 2 1 2 2 2 2 1 2 2 2
64 2 2 2 1 1 2 2 1 2 1
65 1 2 2 2 1 2 2 2 2 2
66 2 2 2 2 2 1 2 2 2 1
67 2 2 1 2 2 2 1 2 1 2
68 1 2 2 1 2 2 2 2 2 2
69 2 2 2 2 1 2 2 2 2 2
70 2 2 2 1 2 2 2 2 2 2
71 2 2 2 2 2 1 1 2 2 2
72 2 1 2 2 2 2 1 2 1 2
73 2 2 2 1 2 2 1 1 2 1
74 1 2 2 2 1 2 2 2 2 1
75 2 2 2 2 2 2 2, 1 2 2
76 2 1 2 2 2 1 1 2 1 2
77 2 2 2 1 2 1 2 2 2 2
78 2 2 2 1 1 2 2 1 2 2
79 1 2 2 1 2 2 2 2 2 2
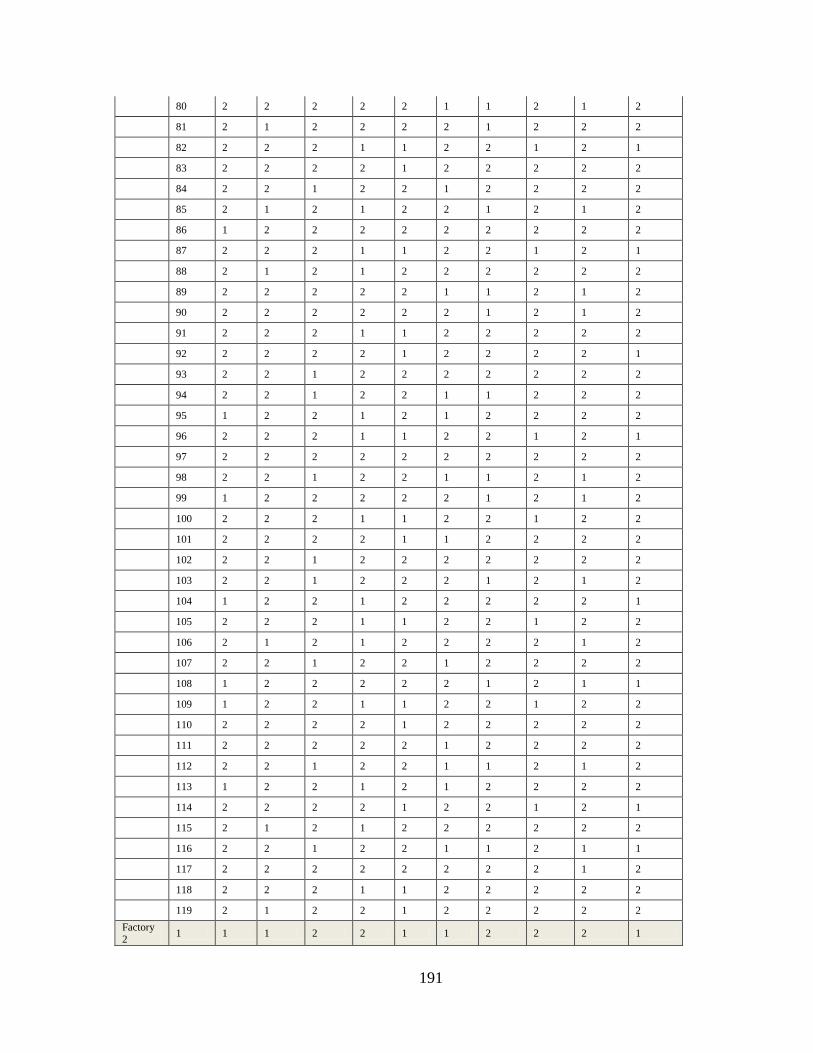
191
80 2 2 2 2 2 1 1 2 1 2
81 2 1 2 2 2 2 1 2 2 2
82 2 2 2 1 1 2 2 1 2 1
83 2 2 2 2 1 2 2 2 2 2
84 2 2 1 2 2 1 2 2 2 2
85 2 1 2 1 2 2 1 2 1 2
86 1 2 2 2 2 2 2 2 2 2
87 2 2 2 1 1 2 2 1 2 1
88 2 1 2 1 2 2 2 2 2 2
89 2 2 2 2 2 1 1 2 1 2
90 2 2 2 2 2 2 1 2 1 2
91 2 2 2 1 1 2 2 2 2 2
92 2 2 2 2 1 2 2 2 2 1
93 2 2 1 2 2 2 2 2 2 2
94 2 2 1 2 2 1 1 2 2 2
95 1 2 2 1 2 1 2 2 2 2
96 2 2 2 1 1 2 2 1 2 1
97 2 2 2 2 2 2 2 2 2 2
98 2 2 1 2 2 1 1 2 1 2
99 1 2 2 2 2 2 1 2 1 2
100 2 2 2 1 1 2 2 1 2 2
101 2 2 2 2 1 1 2 2 2 2
102 2 2 1 2 2 2 2 2 2 2
103 2 2 1 2 2 2 1 2 1 2
104 1 2 2 1 2 2 2 2 2 1
105 2 2 2 1 1 2 2 1 2 2
106 2 1 2 1 2 2 2 2 1 2
107 2 2 1 2 2 1 2 2 2 2
108 1 2 2 2 2 2 1 2 1 1
109 1 2 2 1 1 2 2 1 2 2
110 2 2 2 2 1 2 2 2 2 2
111 2 2 2 2 2 1 2 2 2 2
112 2 2 1 2 2 1 1 2 1 2
113 1 2 2 1 2 1 2 2 2 2
114 2 2 2 2 1 2 2 1 2 1
115 2 1 2 1 2 2 2 2 2 2
116 2 2 1 2 2 1 1 2 1 1
117 2 2 2 2 2 2 2 2 1 2
118 2 2 2 1 1 2 2 2 2 2
119 2 1 2 2 1 2 2 2 2 2
Factory 2
1 1 1 2 2 1 1 2 2 2 1

192
2 1 2 2 2 1 2 2 1 2 1
3 2 1 1 2 2 1 1 2 1 2
4 2 1 2 2 2 1 2 2 2 2
5 2 1 1 2 2 1 2 2 2 2
6 1 2 2 1 1 2 2 1 2 1
7 2 2 1 2 2 2 2 2 2 2
8 2 1 1 2 2 1 1 2 1 2
9 2 2 2 2 2 2 2 2 2 2
10 2 1 1 1 1 2 2 2 2 1
11 1 2 1 2 1 2 2 2 2 1
12 1 1 1 2 1 1 1 2 1 1
13 2 1 2 2 2 1 2 2 2 2
14 1 1 2 1 1 1 2 1 2 1
15 2 1 2 2 2 1 2 2 2 2
16 1 1 2 1 1 1 2 1 2 1
17 2 1 1 2 2 1 1 2 1 2
18 2 1 2 2 2 1 2 2 2 2
19 2 1 2 2 2 1 2 2 2 2
20 2 2 2 2 2 2 2 2 2 2
21 2 2 1 2 2 2 1 2 1 2
22 2 1 1 2 2 1 1 2 1 2
23 2 2 2 2 2 2 2 2 2 2
24 1 2 1 1 1 2 2 2 2 1
25 1 2 2 1 1 2 2 1 2 1
26 2 2 1 2 2 2 1 2 1 2
27 2 2 2 2 2 2 2 2 2 2
28 2 1 2 2 2 1 2 2 2 2
29 1 2 2 2 1 2 2 1 2 1
30 1 1 2 2 1 1 2 2 2 1
31 2 2 1 2 2 2 1 2 1 2
32 2 1 2 2 2 1 2 2 2 2
33 2 1 1 2 2 1 1 2 1 2
34 1 2 2 1 1 2 2 2 2 1
35 2 2 1 2 2 2 1 2 1 2
36 2 1 2 2 2 1 2 2 2 2
37 2 2 2 2 2 2 2 2 2 2
38 1 2 2 1 1 2 2 1 2 1
39 2 2 1 1 1 2 1 2 1 1
40 2 1 1 2 2 1 1 2 1 2
41 2 1 2 2 2 1 2 2 2 2
42 2 1 2 2 2 1 2 2 2 2

193
43 1 2 2 1 1 2 2 1 2 1
44 2 2 2 2 2 2 2 2 2 2
45 2 1 2 2 2 1 2 2 2 2
46 2 2 2 2 2 2 2 2 2 2
47 1 2 2 1 1 2 2 2 2 1
48 2 2 1 2 2 2 1 2 1 1
49 1 1 1 1 2 1 1 1 1 1
50 2 1 2 2 2 1 2 2 2 2
51 2 1 1 2 2 1 2 2 2 2
52 1 2 2 1 1 2 2 1 2 1
53 2 2 1 2 2 2 1 2 1 2
54 2 1 2 2 2 1 2 2 2 2
55 2 2 2 2 2 2 2 2 2 2
56 2 2 2 1 1 2 2 2 2 1
57 1 2 1 1 2 2 1 2 1 1
58 2 2 1 2 2 2 1 2 1 2
59 1 1 2 1 1 1 2 2 2 1
60 2 1 2 2 2 1 2 2 2 2
61 1 2 2 1 1 2 2 1 2 1
62 2 2 2 2 2 2 2 2
63 2 1 2 2 2 1 2 2 2 2
64 2 2 2 2 2 2 2 2 2 2
65 2 2 2 1 1 2 2 2 2 1
66 1 2 2 1 1 2 2 1 2 1
67 2 1 1 2 2 1 1 2 1 2
68 1 1 2 1 2 1 2 1 2 1
69 2 1 2 2 2 1 2 2 2 2
70 1 2 2 1 1 2 2 2 2 1
71 2 2 1 2 2 2 1 1 1 2
72 2 1 2 2 2 1 2 2 2 2
73 2 2 2 2 2 2 2 2 2 2
74 1 2 2 1 1 2 2 2 2 1
75 1 2 2 1 2 2 2 2 2 1
76 2 1 1 2 2 1 1 2 1 2
77 2 2 2 2 2 2 2 1 2 2
78 2 1 1 2 2 1 2 2 2 2
79 1 2 2 2 1 2 2 1 2 1
80 2 2 1 2 2 2 2 2 2 2
81 2 1 2 2 2 1 2 2 2 2
82 2 2 1 2 2 2 2 2 2 2
83 2 2 2 2 2 2 2 1 2 2

194
84 2 1 1 2 2 1 1 2 1 2
85 2 1 2 2 2 1 2 2 2 2
86 1 2 2 1 1 2 2 2 2 1
87 2 2 2 2 2 2 2 2 2 2
88 2 1 2 2 2 1 2 1 2 2
89 2 2 2 2 2 2 2 2 2 2
90 1 2 2 2 1 2 2 1 2 1
91 1 2 2 1 2 2 2 2 2 1
92 2 1 2 2 2 1 2 2 2 2
93 2 1 1 2 2 1 1 2 1 2
94 2 2 1 2 2 2 1 1 1 2
95 1 2 2 1 1 2 2 2 2 1
96 2 2 2 2 2 2 2 2 2 2
97 2 1 2 2 2 1 2 2 2 2
98 2 2 1 2 2 2 1 2 2 2
99 1 2 2 1 1 2 2 2 2 1
100 1 2 2 1 1 2 2 1 2 1
Factory 3
1 2 1 2 2 2 1 2 2 2 2
2 2 1 1 2 2 1 1 2 1 2
3 2 2 1 2 2 2 1 2 1 2
4 1 2 2 1 1 2 2 1 2 1
5 2 2 2 2 2 2 2 2 2 2
6 2 1 2 2 2 1 2 2 2 2
7 2 2 1 2 2 2 1 2 1 2
8 1 2 2 1 1 2 2 1 2 1
9 1 2 2 1 1 2 2 1 2 1
10 2 2 2 2 2 2 2 2 2 2
11 2 1 2 2 2 1 2 2 2 2
12 2 1 1 2 2 1 1 2 1 2
13 1 2 2 1 1 2 2 1 2 1
14 1 1 2 2 1 1 2 1 2 1
15 1 2 2 2 1 2 2 1 2 1
16 2 1 1 2 2 1 1 1 1 2
17 2 1 2 2 2 1 2 2 2 2
18 2 1 2 2 2 1 2 2 2 2
19 1 2 2 1 1 2 2 1 2 1
20 2 2 2 2 2 2 2 2 2 2
21 2 1 1 2 2 1 1 2 1 2
22 2 2 2 2 2 2 2 2 2 2
23 1 2 2 1 1 2 2 1 2 1
24 1 2 2 1 1 2 2 1 2 1
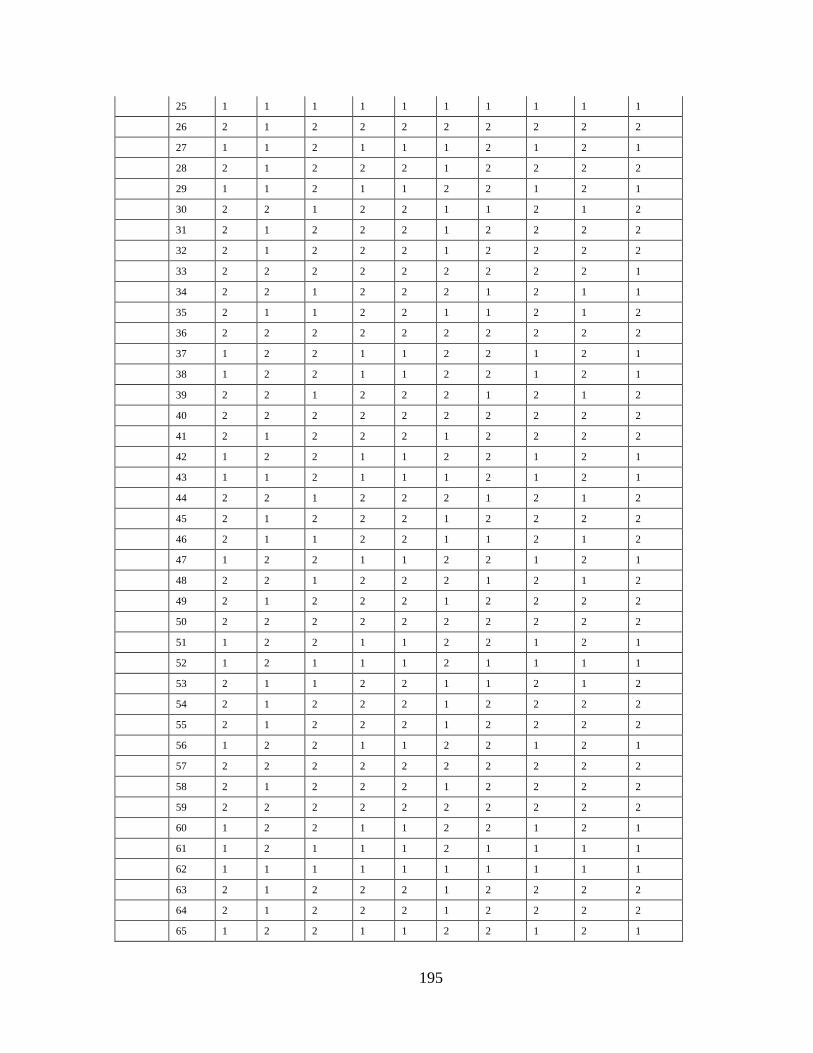
195
25 1 1 1 1 1 1 1 1 1 1
26 2 1 2 2 2 2 2 2 2 2
27 1 1 2 1 1 1 2 1 2 1
28 2 1 2 2 2 1 2 2 2 2
29 1 1 2 1 1 2 2 1 2 1
30 2 2 1 2 2 1 1 2 1 2
31 2 1 2 2 2 1 2 2 2 2
32 2 1 2 2 2 1 2 2 2 2
33 2 2 2 2 2 2 2 2 2 1
34 2 2 1 2 2 2 1 2 1 1
35 2 1 1 2 2 1 1 2 1 2
36 2 2 2 2 2 2 2 2 2 2
37 1 2 2 1 1 2 2 1 2 1
38 1 2 2 1 1 2 2 1 2 1
39 2 2 1 2 2 2 1 2 1 2
40 2 2 2 2 2 2 2 2 2 2
41 2 1 2 2 2 1 2 2 2 2
42 1 2 2 1 1 2 2 1 2 1
43 1 1 2 1 1 1 2 1 2 1
44 2 2 1 2 2 2 1 2 1 2
45 2 1 2 2 2 1 2 2 2 2
46 2 1 1 2 2 1 1 2 1 2
47 1 2 2 1 1 2 2 1 2 1
48 2 2 1 2 2 2 1 2 1 2
49 2 1 2 2 2 1 2 2 2 2
50 2 2 2 2 2 2 2 2 2 2
51 1 2 2 1 1 2 2 1 2 1
52 1 2 1 1 1 2 1 1 1 1
53 2 1 1 2 2 1 1 2 1 2
54 2 1 2 2 2 1 2 2 2 2
55 2 1 2 2 2 1 2 2 2 2
56 1 2 2 1 1 2 2 1 2 1
57 2 2 2 2 2 2 2 2 2 2
58 2 1 2 2 2 1 2 2 2 2
59 2 2 2 2 2 2 2 2 2 2
60 1 2 2 1 1 2 2 1 2 1
61 1 2 1 1 1 2 1 1 1 1
62 1 1 1 1 1 1 1 1 1 1
63 2 1 2 2 2 1 2 2 2 2
64 2 1 2 2 2 1 2 2 2 2
65 1 2 2 1 1 2 2 1 2 1
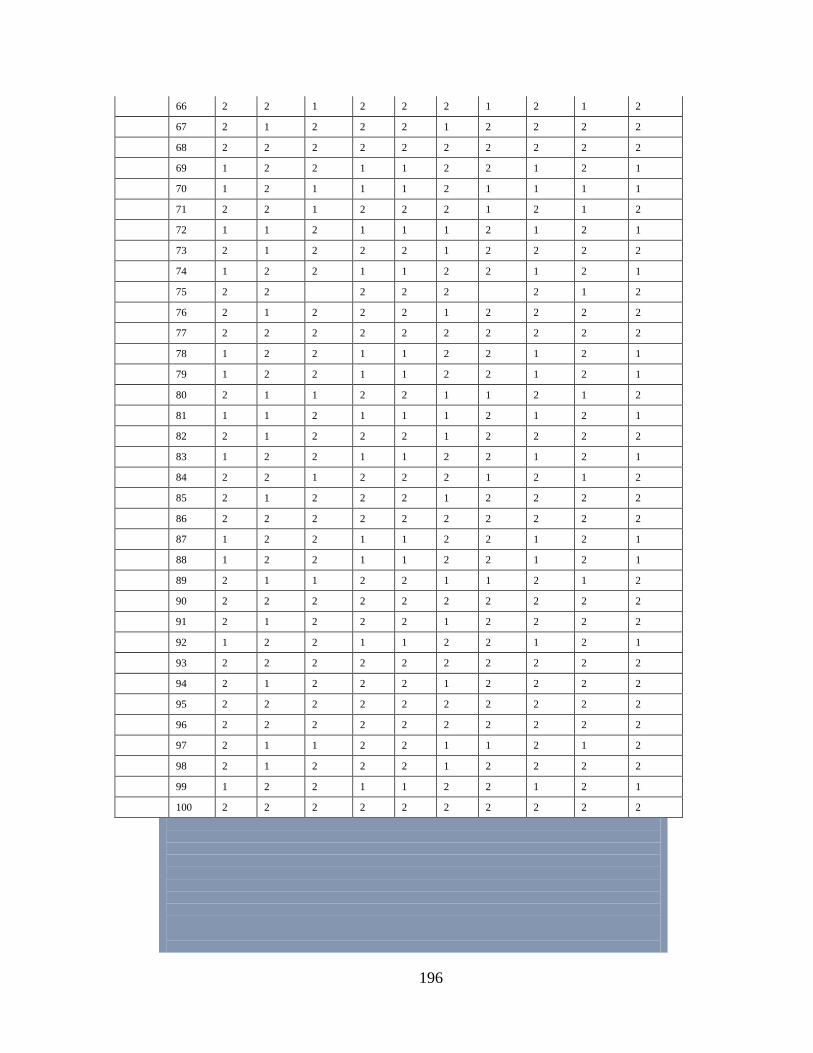
196
66 2 2 1 2 2 2 1 2 1 2
67 2 1 2 2 2 1 2 2 2 2
68 2 2 2 2 2 2 2 2 2 2
69 1 2 2 1 1 2 2 1 2 1
70 1 2 1 1 1 2 1 1 1 1
71 2 2 1 2 2 2 1 2 1 2
72 1 1 2 1 1 1 2 1 2 1
73 2 1 2 2 2 1 2 2 2 2
74 1 2 2 1 1 2 2 1 2 1
75 2 2 2 2 2 2 1 2
76 2 1 2 2 2 1 2 2 2 2
77 2 2 2 2 2 2 2 2 2 2
78 1 2 2 1 1 2 2 1 2 1
79 1 2 2 1 1 2 2 1 2 1
80 2 1 1 2 2 1 1 2 1 2
81 1 1 2 1 1 1 2 1 2 1
82 2 1 2 2 2 1 2 2 2 2
83 1 2 2 1 1 2 2 1 2 1
84 2 2 1 2 2 2 1 2 1 2
85 2 1 2 2 2 1 2 2 2 2
86 2 2 2 2 2 2 2 2 2 2
87 1 2 2 1 1 2 2 1 2 1
88 1 2 2 1 1 2 2 1 2 1
89 2 1 1 2 2 1 1 2 1 2
90 2 2 2 2 2 2 2 2 2 2
91 2 1 2 2 2 1 2 2 2 2
92 1 2 2 1 1 2 2 1 2 1
93 2 2 2 2 2 2 2 2 2 2
94 2 1 2 2 2 1 2 2 2 2
95 2 2 2 2 2 2 2 2 2 2
96 2 2 2 2 2 2 2 2 2 2
97 2 1 1 2 2 1 1 2 1 2
98 2 1 2 2 2 1 2 2 2 2
99 1 2 2 1 1 2 2 1 2 1
100 2 2 2 2 2 2 2 2 2 2

197
Week three
Factor
y Respo. Work Behaviour
0
Day 1 Day 2 Day 3 Day 4 Day 5
Morn
ing
Aftern
oon
Morni
ng,
After
noon
Morn
ing
After
noon
Morn
ing,
Afterno
on
Mornin
g,
Afterno
on
Factory
1 1 2 1 2 2 2 2 2 2 2 2
2 2 2 2 2 2 2 2 2 2 2
3 2 1 2 2 2 2 2 2 2 2
4 2 2 2 2 2 2 2 2 2 2
5 2 1 2 1 2 2 2 2 2 2
6 1 2 2 2 1 2 1 1 2 1
7 2 2 2 2 2 2 2 2 2 2
8 2 1 1 2 2 1 2 2 2 2
9 2 2 2 2 2 2 1 2 2 2
10 2 2 2 1 1 2 2 2 2 2
11 2 2 2 2 2 2 2 2 2 2
12 1 2 1 2 2 2 2 2 2 2
13 2 1 2 2 2 2 1 2 2 2
14 1 1 2 2 2 1 2 2 2 2
15 2 2 2 2 1 2 2 1 2 1
16 1 1 2 1 2 2 2 2 2 2
17 2 2 2 2 2 1 1 2 2 2
18 2 2 2 2 2 2 2 2 1 2
19 2 1 2 1 1 2 1 2 2 2
20 2 2 2 2 1 2 2 1 2 2
21 2 2 1 2 2 2 2 2 2 2
22 2 1 1 2 2 2 1 2 2 2
23 2 2 2 2 2 1 2 2 2 2
24 1 2 2 2 2 2 2 2 2 2
25 1 2 2 1 2 2 2 2 2 2
26 2 2 1 2 2 1 2 2 2 1
27 2 2 2 2 2 2 1 2 2 2
28 2 1 2 1 2 2 2 1 2 1
29 2 2 2 2 2 2 2 2 2 2
30 2 2 2 2 2 1 2 2 2 2
31 2 2 1 2 2 2 1 2 1 2
32 2 1 2 1 2 2 2 2 2 2
33 2 1 1 2 1 2 2 2 2 2
34 1 2 2 2 2 2 2 2 2 2
35 2 2 1 2 2 1 2 2 2 2

198
36 2 1 2 2 2 2 1 2 2 2
37 2 2 2 1 2 2 2 2 2 2
38 1 2 2 2 2 2 2 2 2 2
39 1 2 1 2 2 1 2 2 2 2
40 2 2 1 2 2 2 1 2 1 2
41 2 1 2 2 2 2 2 2 2 2
42 2 1 2 2 1 2 2 2 2 2
43 1 2 2 1 2 2 2 2 2 2
44 2 2 2 2 2 1 1 2 2 2
45 2 1 2 2 2 2 2 2 2 2
46 2 2 2 1 1 2 2 2 2 2
47 1 2 2 2 2 2 2 1 2 2
48 1 2 1 2 2 1 2 2 2 2
49 2 1 1 2 2 2 1 2 1 2
50 2 2 2 1 2 1 2 2 2 2
51 2 1 2 2 2 2 2 1 2 2
52 1 2 2 2 2 2 2 2 2 2
53 2 2 1 2 2 1 2 2 2 2
54 2 1 2 2 2 2 1 2 2 2
55 2 2 2 1 2 2 2 1 2 2
56 1 2 2 2 1 2 2 2 2 1
57 2 2 1 2 2 2 2 2 2 2
58 2 2 1 2 2 1 1 2 2 2
59 1 1 2 2 2 2 2 2 2 2
60 2 1 2 1 1 2 2 1 2 1
61 1 2 2 1 2 2 2 2 2 2
62 2 2 2 2 1 1 2 1 2
63 2 1 2 2 2 2 1 2 2 2
64 2 2 2 1 2 2 2 1 2 1
65 2 2 2 2 2 2 2 2 2 2
66 1 2 2 2 2 1 2 2 2 1
67 2 1 1 2 2 2 1 2 1 2
68 1 2 2 1 2 2 2 2 2 2
69 2 1 2 2 1 2 2 2 2 2
70 1 2 2 1 2 2 2 2 2 2
71 2 2 1 2 2 1 1 2 2 2
72 2 1 2 2 2 2 1 2 1 2
73 2 2 2 1 2 2 1 1 2 1
74 1 2 2 2 1 2 2 2 2 1
75 1 2 2 2 2 2 2, 1 2 2
76 2 2 1 2 2 1 1 2 2 2

199
77 2 2 2 1 2 1 2 2 2 2
78 2 1 2 1 1 2 2 1 2 2
79 1 2 2 1 2 2 2 2 2 2
80 2 2 2 2 2 1 1 2 2 2
81 2 1 2 2 2 2 1 2 2 2
82 2 2 2 1 1 2 2 1 2 1
83 2 2 2 2 1 2 2 2 2 2
84 2 1 1 2 2 1 2 2 2 2
85 2 1 2 1 2 2 1 2 1 2
86 1 2 2 2 2 2 2 2 2 2
87 2 2 2 1 1 2 2 1 2 2
88 2 1 2 1 2 2 2 2 2 2
89 2 2 2 2 2 1 1 2 2 2
90 1 2 2 2 2 2 1 2 2 2
91 2 2 2 1 1 2 2 2 2 2
92 2 1 2 2 1 2 2 2 2 1
93 2 2 1 2 2 2 2 2 2 2
94 2 2 1 2 2 1 1 2 2 2
95 1 2 2 1 2 1 2 2 2 2
96 2 2 2 1 1 2 2 1 2 2
97 2 1 2 2 2 2 2 2 2 2
98 2 2 1 2 2 1 1 2 1 2
99 1 2 2 2 2 2 1 2 2 2
100 2 2 2 1 1 2 2 1 2 2
101 2 1 2 2 1 1 2 2 2 2
102 2 1 1 2 2 2 2 2 2 2
103 2 2 1 2 2 2 1 2 1 2
104 2 2 2 1 2 2 2 2 2 2
105 2 2 2 1 1 2 2 1 2 2
106 2 1 2 1 2 2 2 2 1 2
107 2 2 1 2 2 1 2 2 2 2
108 1 2 2 2 2 2 1 2 1 1
109 2 2 2 1 1 2 2 1 2 2
110 2 2 2 2 1 2 2 2 2 2
111 2 2 2 2 2 1 2 2 2 2
112 2 2 1 2 2 1 1 2 2 2
113 1 2 2 1 2 1 2 2 2 2
114 2 2 2 2 1 2 2 1 2 1
115 2 1 2 1 2 2 2 2 2 2
116 2 2 1 2 2 1 1 2 2 1
117 2 2 2 2 2 2 1 2 1 2
200
118 2 2 2 1 1 2 1 2 2 2
119 2 1 2 2 1 2 2 2 2 2
Factory
2 1 1 1 2 1 2 1 2 2 2 1
2 2 2 1 2 1 2 1 1 2 1
3 2 1 1 2 2 1 1 2 1 2
4 2 2 2 2 2 1 2 2 2 2
5 2 1 1 2 2 1 1 2 2 2
6 2 2 2 1 1 2 2 1 2 1
7 2 2 1 2 2 2 2 2 2 2
8 2 1 1 2 2 1 1 2 1 1
9 2 2 2 2 2 2 2 2 2 1
10 2 1 1 1 2 2 1 2 2 1
11 1 2 1 2 2 2 2 2 2 1
12 2 1 1 1 2 1 1 1 1 1
13 2 2 2 2 2 1 2 2 2 2
14 2 1 2 1 1 1 2 1 2 1
15 2 1 1 2 2 1 1 2 2 2
16 1 1 2 1 1 1 1 2 2 1
17 2 1 1 2 2 1 1 2 1 2
18 2 1 2 2 2 1 2 2 2 2
19 2 1 2 2 2 1 2 2 2 2
20 2 2 2 2 2 2 2 2 2 2
21 2 2 1 2 2 2 1 2 1 2
22 2 1 1 2 2 1 1 2 1 1
23 2 2 2 2 2 2 1 2 2 2
24 1 1 1 1 1 1 1 2 2 1
25 2 2 2 2 1 1 2 2 2 1
26 2 2 1 2 2 2 1 2 1 2
27 2 2 2 2 2 2 2 2 2 2
28 2 1 2 2 2 1 2 2 2 2
29 1 2 2 1 1 2 1 1 2 1
30 2 1 2 2 1 1 2 1 2 1
31 2 2 1 2 2 2 1 2 1 2
32 2 1 2 2 2 1 2 2 2 1
33 2 1 1 2 2 1 1 2 1 2
34 1 2 2 1 1 2 2 1 2 1
35 2 1 1 2 2 2 1 2 1 2
36 2 1 2 2 2 1 2 2 2 2
37 2 1 2 2 2 2 1 2 2 2
38 1 1 2 1 1 2 2 1 2 1
39 2 2 1 1 1 2 1 2 1 1
201
40 2 1 1 2 2 1 1 2 1 2
41 2 1 2 2 2 1 2 2 2 2
42 2 1 2 2 2 1 2 2 2 2
43 1 2 2 1 1 2 2 1 2 1
44 2 2 1 2 2 2 2 2 2 2
45 2 1 2 2 2 1 2 2 2 2
46 2 2 2 2 2 2 2 2 2 2
47 1 2 2 1 1 2 2 1 2 1
48 2 2 1 2 2 2 1 2 1 1
49 2 1 1 1 2 1 1 1 1 1
50 2 1 2 2 2 1 2 2 2 2
51 2 1 1 2 2 1 2 2 2 2
52 1 2 2 1 1 2 2 1 2 1
53 2 1 1 2 2 2 1 2 1 2
54 2 2 2 2 2 1 2 2 2 2
55 2 2 2 2 2 2 2 2 2 2
56 2 2 2 1 1 2 2 1 2 1
57 1 2 1 2 2 2 1 2 1 1
58 2 2 1 2 2 2 1 2 1 2
59 2 1 2 1 1 1 2 1 2 1
60 2 1 2 2 2 1 2 2 2 2
61 1 2 2 1 1 2 2 1 2 1
62 2 2 1 2 2 2 2 2 2 2
63 2 1 2 2 2 1 2 2 2 2
64 2 2 2 2 2 2 2 2 2 2
65 2 2 2 1 1 2 2 1 2 1
66 1 2 2 2 1 2 2 1 2 1
67 2 1 1 2 2 1 1 2 1 2
68 2 1 2 1 2 1 2 2 2 1
69 2 1 2 2 2 1 2 2 2 2
70 1 2 2 1 1 2 2 1 2 1
71 2 2 1 2 2 2 1 1 1 2
72 2 1 2 2 2 1 2 2 2 2
73 2 1 2 2 2 2 2 2 2 2
74 2 2 2 2 1 2 2 1 2 1
75 2 2 2 1 2 2 2 2 2 1
76 2 1 1 2 2 1 1 2 1 2
77 2 2 2 2 2 2 2 2 2 2
78 2 1 1 2 2 1 2 2 2 2
79 1 2 2 1 1 2 2 1 2 1
80 2 2 1 2 2 2 2 2 2 2

202
81 2 1 2 2 2 1 2 1 2 2
82 2 2 1 2 2 2 2 2 2 2
83 2 2 2 2 2 2 2 1 2 2
84 2 1 1 2 2 1 1 2 1 2
85 2 1 2 2 2 1 2 2 2 2
86 1 2 2 1 1 2 2 1 2 1
87 2 2 2 2 2 2 2 2 2 2
88 2 1 2 2 2 1 2 1 2 2
89 2 2 1 2 2 2 2 2 2 2
90 1 1 1 1 1 2 2 1 2 1
91 2 2 2 1 2 2 2 1 2 1
92 2 1 2 2 2 1 2 2 2 2
93 2 1 1 2 2 1 1 2 1 2
94 2 1 1 2 2 2 1 1 1 2
95 1 2 2 1 1 2 2 1 2 1
96 2 2 2 2 2 2 2 2 2 2
97 2 1 2 2 2 1 2 2 2 2
98 2 2 1 2 2 2 1 2 2 2
99 2 1 2 2 1 2 2 1 2 1
100 2 1 2 2 1 2 2 1 2 1
Factory
3 1 2 1 2 2 2 1 2 2 2 1
2 1 1 1 2 2 1 1 1 1 1
3 2 2 1 2 2 2 1 2 1 2
4 1 2 2 1 1 2 2 1 2 1
5 2 2 2 2 2 2 2 2 2 2
6 2 1 1 2 2 1 2 2 2 1
7 1 2 1 2 2 2 1 2 1 2
8 1 2 2 1 1 2 2 1 2 1
9 1 2 2 1 1 2 2 1 1 1
10 2 2 1 2 2 2 2 2 1 1
11 1 1 2 2 2 1 2 2 2 2
12 2 1 1 2 2 1 1 2 1 2
13 1 2 2 1 1 2 2 1 2 1
14 1 1 2 2 1 1 2 1 2 1
15 1 2 2 2 1 2 2 1 2 1
16 2 1 1 2 2 1 1 1 1 2
17 2 1 2 2 2 1 1 2 2 2
18 2 1 2 2 2 1 1 2 1 2
19 1 2 2 1 1 2 2 1 1 1
20 2 2 2 2 2 2 2 2 2 1
21 2 1 1 2 2 1 1 2 1 2

203
22 2 2 2 2 2 2 2 1 2 2
23 1 2 2 1 1 2 2 1 2 1
24 1 2 2 1 1 2 1 1 1 1
25 1 1 1 1 1 1 1 1 1 1
26 2 1 2 2 2 2 2 2 1 2
27 1 1 1 1 1 2 1 1 1 1
28 2 1 2 2 2 1 2 2 2 2
29 1 1 2 1 1 2 2 1 2 1
30 2 2 1 2 2 1 1 2 1 2
31 2 1 2 2 2 2 2 2 1 2
32 2 1 2 2 2 1 2 2 2 2
33 2 2 2 2 2 2 1 2 2 1
34 1 2 1 2 2 2 1 2 1 1
35 2 1 1 2 2 1 1 2 1 1
36 1 2 2 2 2 2 1 2 2 2
37 1 2 2 1 1 2 2 1 1 1
38 1 2 1 1 1 2 2 1 2 1
39 2 2 1 2 2 2 1 2 1 2
40 2 2 2 2 2 2 1 1 2 2
41 2 1 2 2 2 1 1 2 1 2
42 1 2 1 1 1 2 2 1 2 1
43 1 1 2 1 1 1 2 1 2 1
44 2 2 1 2 2 2 1 2 1 1
45 2 1 2 2 2 1 2 2 2 2
46 2 1 1 2 2 1 1 2 1 2
47 1 2 2 1 1 2 2 1 2 1
48 2 2 1 2 2 2 1 2 1 2
49 2 1 2 2 2 1 2 2 2 2
50 2 2 2 2 2 2 1 2 2 2
51 1 2 2 1 1 2 2 1 1 1
52 1 2 1 1 1 2 1 1 1 1
53 2 1 1 2 2 1 1 2 1 2
54 2 1 1 2 2 1 2 2 2 2
55 1 1 1 2 2 1 2 2 2 2
56 1 2 2 1 1 2 2 1 2 1
57 2 2 2 2 2 2 1 2 1 2
58 2 1 2 2 2 1 2 2 1 2
59 2 2 2 2 2 2 2 2 2 1
60 1 1 2 1 1 2 1 1 2 1
61 1 2 1 1 1 2 1 1 1 1
62 1 1 1 1 1 1 1 1 1 1

204
63 2 1 2 2 2 1 2 2 2 2
64 2 1 2 2 2 1 1 2 2 2
65 1 2 2 1 1 2 2 1 2 1
66 2 2 1 2 2 2 1 2 1 2
67 2 1 2 2 2 1 2 2 2 2
68 2 2 2 2 2 2 2 2 2 2
69 1 1 2 1 1 2 1 1 2 1
70 1 2 1 1 1 2 1 1 1 1
71 2 2 1 2 2 2 1 2 1 2
72 1 1 2 1 1 1 2 1 2 1
73 2 1 2 2 2 1 2 2 2 2
74 1 2 2 1 1 2 2 1 2 1
75 2 2 1 2 2 2 1 2 1 2
76 2 1 2 2 2 1 2 2 2 2
77 2 2 2 2 2 2 2 2 2 2
78 1 2 2 1 1 2 1 1 2 1
79 1 2 2 1 1 2 1 1 2 1
80 2 1 1 2 2 1 1 2 1 2
81 1 1 1 1 1 1 2 1 2 1
82 2 1 2 2 2 1 2 2 2 2
83 1 2 2 1 1 2 2 1 2 1
84 2 2 1 2 2 2 1 2 1 2
85 2 1 2 2 2 1 1 2 2 2
86 2 2 2 2 2 2 1 2 2 2
87 1 2 2 1 1 2 2 1 2 1
88 1 2 2 1 1 2 2 1 2 1
89 2 1 1 2 2 1 1 2 1 2
90 2 2 1 2 2 2 1 2 2 2
91 2 1 2 2 2 1 2 2 2 2
92 1 2 2 1 1 2 2 1 2 1
93 2 2 1 2 2 2 2 2 2 2
94 2 1 1 2 2 1 2 2 2 2
95 2 2 1 2 2 2 1 2 2 2
96 2 2 2 2 2 2 1 1 2 2
97 2 1 1 2 2 1 1 1 1 1
98 2 1 2 2 2 1 2 2 2 1
99 1 2 2 1 1 2 2 1 2 1
100 2 2 2 2 2 2 1 2 2 2

205
Appendix 10: Factory Data Study Variables
Factory One
No
Backgroun
d Music Mood
Personalit
y
Work
behaviour
Employee
performanc
e
Interaction
(Music*Personality
)
Interaction
(Music*Wor
k Behaviour)
1 4.06 2 3 2 717 8.12 12.18
2 4.06 2 4 2 717 8.12 16.24
3 4.32 2 1 2 716 8.64 4.32
4 4.27 2 4 2 717 8.54 17.08
5 3.68 2 3 2 690 7.36 11.04
6 4.32 2 3 2 716 8.64 12.96
7 4.27 2 3 2 710 8.54 12.81
8 3.68 1 4 1 690 3.68 14.72
9 4.32 2 1 2 716 8.64 4.32
10 4.27 1 1 1 690 4.27 4.27
11 3.90 1 3 1 695 3.9 11.7
12 3.90 1 3 1 695 3.9 11.7
13 3.63 2 3 1 715 7.26 10.89
14 3.63 2 1 2 717 7.26 3.63
15 4.21 1 2 1 700 4.21 8.42
16 4.21 2 2 1 705 8.42 8.42
17 3.90 1 3 1 690 3.9 11.7
18 4.16 2 3 2 708 8.32 12.48
19 3.90 1 3 2 690 3.9 11.7
20 4.21 2 4 2 724 8.42 16.84
21 3.58 2 1 2 715 7.16 3.58
22 3.58 1 1 2 690 3.58 3.58
23 4.06 1 3 2 680 4.06 12.18
24 3.68 1 3 2 690 3.68 11.04
25 3.58 1 3 2 690 3.58 10.74
26 4.21 2 3 2 724 8.42 12.63
27 3.58 2 4 2 700 7.16 14.32
28 3.58 2 1 2 700 7.16 3.58
29 4.06 1 1 1 690 4.06 4.06
30 3.58 2 3 2 700 7.16 10.74
31 3.58 2 3 1 700 7.16 10.74
32 4.53 2 4 2 725 9.06 18.12
33 4.53 2 1 2 715 9.06 4.53
34 4.00 2 4 2 710 8.00 16
35 4.00 1 3 2 695 4.00 12
36 4.00 1 4 2 695 4.00 16
37 3.84 2 1 2 705 7.68 3.84

206
38 3.84 2 4 2 705 7.68 15.36
39 3.31 1 3 2 685 3.31 9.93
40 3.95 1 4 2 699 3.95 15.8
41 3.31 1 1 2 685 3.31 3.31
42 3.79 2 4 2 717 7.58 15.16
43 3.84 2 3 2 700 7.68 11.52
44 3.68 1 3 2 690 3.68 11.04
45 3.58 2 3 2 700 7.16 10.74
46 4.21 2 4 2 716 8.42 16.84
47 3.58 2 1 2 700 7.16 3.58
48 3.58 1 1 2 700 3.58 3.58
49 4.06 2 3 2 716 8.12 12.18
50 3.58 2 3 2 700 7.16 10.74
51 3.58 2 3 2 700 7.16 10.74
52 4.53 2 1 2 717 9.06 4.53
53 4.53 2 2 2 720 9.06 9.06
54 4.00 2 2 2 710 8 8
55 4.00 2 3 2 695 8 12
56 4.00 1 3 2 690 4 12
57 3.84 1 3 2 705 3.84 11.52
58 3.90 2 3 2 695 7.8 11.7
59 3.63 1 3 2 690 3.63 10.89
60 3.63 1 3 2 700 3.63 10.89
61 4.21 2 4 2 690 8.42 16.84
62 4.21 1 1 2 700 4.21 4.21
63 3.68 1 1 2 690 3.68 3.68
64 4.32 1 3 2 690 4.32 12.96
65 4.27 2 3 2 727 8.54 12.81
66 3.68 2 3 2 690 7.36 11.04
67 4.32 2 1 2 700 8.64 4.32
68 4.27 2 2 2 715 8.54 8.54
69 3.90 2 2 2 717 7.8 7.8
70 4.32 2 3 2 716 8.64 12.96
71 4.27 1 3 2 690 4.27 12.81
72 3.68 1 3 2 690 3.68 11.04
73 4.32 2 3 2 721 8.64 12.96
74 4.27 1 1 2 690 4.27 4.27
75 3.68 1 3 2 690 3.68 11.04
76 4.32 2 3 2 716 8.64 12.96
77 4.27 1 3 2 690 4.27 12.81
78 3.90 2 4 2 715 7.8 15.6

207
79 3.90 1 1 2 695 3.9 3.9
80 3.63 1 3 2 690 3.63 10.89
81 3.63 2 3 2 715 7.26 10.89
82 4.21 2 3 2 705 8.42 12.63
83 4.21 2 4 1 705 8.42 16.84
84 3.90 2 1 2 700 7.8 3.9
85 4.16 1 1 1 690 4.16 4.16
86 3.90 1 3 1 700 3.9 11.7
87 4.21 1 3 1 724 4.21 12.63
88 3.58 2 3 1 700 7.16 10.74
89 3.58 2 1 2 700 7.16 3.58
90 4.06 1 2 1 690 4.06 8.12
91 3.68 1 2 1 690 3.68 7.36
92 3.58 1 3 1 690 3.58 10.74
93 4.21 2 3 2 724 8.42 12.63
94 3.58 1 3 2 690 3.58 10.74
95 3.58 1 4 2 690 3.58 14.32
96 4.06 1 1 2 690 4.06 4.06
97 3.58 1 1 2 690 3.58 3.58
98 3.58 1 3 2 690 3.58 10.74
99 4.53 2 3 2 727 9.06 13.59
100 4.53 2 3 2 727 9.06 13.59
101 4.00 1 3 2 695 4 12
102 4.00 1 4 2 695 4 16
103 4.00 1 1 2 695 4 4
104 3.84 2 1 1 695 7.68 3.84
105 3.84 2 3 2 695 7.68 11.52
106 3.31 2 3 1 685 6.62 9.93
107 3.95 2 4 2 699 7.9 15.8
108 3.31 2 1 2 705 6.62 3.31
109 3.79 2 4 2 717 7.58 15.16
110 3.84 2 3 2 701 7.68 11.52
111 3.68 2 4 2 690 7.36 14.72
112 3.58 2 1 2 700 7.16 3.58
113 4.21 2 4 2 721 8.42 16.84
114 3.58 2 3 2 700 7.16 10.74
115 3.58 2 1 1 690 7.16 3.58
116 4.06 1 3 1 716 4.06 12.18
117 3.58 2 3 1 700 7.16 10.74
118 3.58 2 3 2 690 7.16 10.74
119 4.53 2 3 2 716 9.06 13.59
208
Factory Two
No
Background
Music Mood Personality
Work
behaviour
Employee
performance
Interaction
(Music*Personality)
Interaction
(Music*Work
Behaviour)
1 2.7 2 1 2 660 5.4 2.7
2 2.4 2 3 2 703 4.8 7.2
3 2.1 1 3 1 690 2.1 6.3
4 2.2 1 3 2 715 2.2 6.6
5 2.6 1 1 2 690 2.6 2.6
6 2.4 1 2 1 695 2.4 4.8
7 2.4 1 2 2 690 2.4 4.8
8 2.4 2 3 2 690 4.8 7.2
9 2.4 2 3 2 705 4.8 7.2
10 2.4 2 3 1 690 4.8 7.2
11 2.5 1 1 1 690 2.5 2.5
12 2.4 1 3 1 690 2.4 7.2
13 2.4 1 4 1 690 2.4 9.6
14 2.4 1 1 1 670 2.4 2.4
15 2.4 1 4 1 690 2.4 9.6
16 2.4 1 3 1 690 2.4 7.2
17 2.4 1 3 2 690 2.4 7.2
18 2.4 1 3 2 700 2.4 7.2
19 2.3 1 4 2 690 2.3 9.2
20 2.3 1 1 2 690 2.3 2.3
21 2.3 1 1 2 695 2.3 2.3
22 2.3 1 3 2 695 2.3 6.9
23 2.3 1 3 2 695 2.3 6.9
24 2.3 1 3 2 695 2.3 6.9
25 2.3 2 1 1 701 4.6 2.3
26 2.3 2 2 1 695 4.6 4.6
27 2.3 2 2 2 695 4.6 4.6
28 2.3 2 3 2 700 4.6 6.9
29 2.3 2 3 2 700 4.6 6.9
30 2.3 2 3 2 700 4.6 6.9
31 2.3 2 4 2 700 4.6 9.2
32 2.3 2 1 2 700 4.6 2.3
33 2.3 2 1 2 695 4.6 2.3
34 2.3 2 3 2 704 4.6 6.9
35 2.3 2 3 2 701 4.6 6.9
36 2.3 2 3 2 701 4.6 6.9
37 2.3 2 3 2 705 4.6 6.9
38 2.5 2 4 2 690 5 10
209
39 2.6 1 1 2 690 2.6 2.6
40 2.6 1 1 2 695 2.6 2.6
41 2.6 1 3 2 695 2.6 7.8
42 2.6 2 3 2 695 5.2 7.8
43 2.6 2 4 2 695 5.2 10.4
44 2.6 2 1 2 704 5.2 2.6
45 2.6 2 4 2 695 5.2 10.4
46 2.6 2 3 2 695 5.2 7.8
47 2.6 2 4 2 695 5.2 10.4
48 2.6 2 1 2 695 5.2 2.6
49 2.6 2 4 2 695 5.2 10.4
50 2.6 2 3 2 695 5.2 7.8
51 2.6 2 4 2 700 5.2 10.4
52 2.6 2 1 2 695 5.2 2.6
53 2.6 2 4 2 704 5.2 10.4
54 2.6 2 3 2 701 5.2 7.8
55 2.6 2 3 1 701 5.2 7.8
56 2.6 2 3 2 705 5.2 7.8
57 2.6 2 4 2 703 5.2 10.4
58 2.6 2 1 1 690 5.2 2.6
59 2.6 2 1 1 690 5.2 2.6
60 2.6 2 3 2 705 5.2 7.8
61 2.6 2 3 2 690 5.2 7.8
62 2.6 2 3 2 690 5.2 7.8
63 2.6 2 1 1 690 5.2 2.6
64 2.6 2 2 2 690 5.2 5.2
65 2.6 2 2 2 690 5.2 5.2
66 2.6 2 3 2 690 5.2 7.8
67 2.6 2 3 2 690 5.2 7.8
68 2.6 2 3 2 690 5.2 7.8
69 2.6 2 3 2 690 5.2 7.8
70 2.6 2 3 2 690 5.2 7.8
71 2.6 2 3 2 690 5.2 7.8
72 2.2 2 4 2 695 4.4 8.8
73 2.5 2 1 2 695 5 2.5
74 2.2 2 1 2 695 4.4 2.2
75 2.2 2 3 2 695 4.4 6.6
76 2.2 2 3 2 701 4.4 6.6
77 2.2 2 3 2 695 4.4 6.6
78 2.2 2 1 2 695 4.4 2.2
79 2.2 2 2 2 695 4.4 4.4
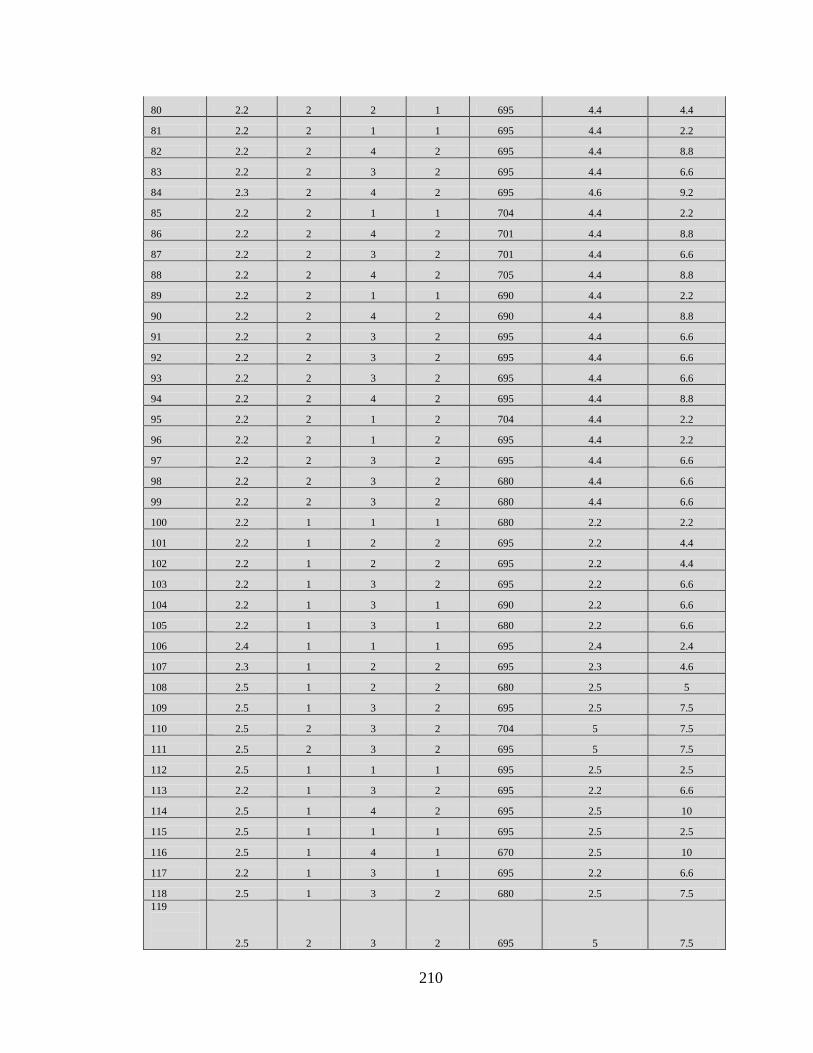
210
80 2.2 2 2 1 695 4.4 4.4
81 2.2 2 1 1 695 4.4 2.2
82 2.2 2 4 2 695 4.4 8.8
83 2.2 2 3 2 695 4.4 6.6
84 2.3 2 4 2 695 4.6 9.2
85 2.2 2 1 1 704 4.4 2.2
86 2.2 2 4 2 701 4.4 8.8
87 2.2 2 3 2 701 4.4 6.6
88 2.2 2 4 2 705 4.4 8.8
89 2.2 2 1 1 690 4.4 2.2
90 2.2 2 4 2 690 4.4 8.8
91 2.2 2 3 2 695 4.4 6.6
92 2.2 2 3 2 695 4.4 6.6
93 2.2 2 3 2 695 4.4 6.6
94 2.2 2 4 2 695 4.4 8.8
95 2.2 2 1 2 704 4.4 2.2
96 2.2 2 1 2 695 4.4 2.2
97 2.2 2 3 2 695 4.4 6.6
98 2.2 2 3 2 680 4.4 6.6
99 2.2 2 3 2 680 4.4 6.6
100 2.2 1 1 1 680 2.2 2.2
101 2.2 1 2 2 695 2.2 4.4
102 2.2 1 2 2 695 2.2 4.4
103 2.2 1 3 2 695 2.2 6.6
104 2.2 1 3 1 690 2.2 6.6
105 2.2 1 3 1 680 2.2 6.6
106 2.4 1 1 1 695 2.4 2.4
107 2.3 1 2 2 695 2.3 4.6
108 2.5 1 2 2 680 2.5 5
109 2.5 1 3 2 695 2.5 7.5
110 2.5 2 3 2 704 5 7.5
111 2.5 2 3 2 695 5 7.5
112 2.5 1 1 1 695 2.5 2.5
113 2.2 1 3 2 695 2.2 6.6
114 2.5 1 4 2 695 2.5 10
115 2.5 1 1 1 695 2.5 2.5
116 2.5 1 4 1 670 2.5 10
117 2.2 1 3 1 695 2.2 6.6
118 2.5 1 3 2 680 2.5 7.5
119
2.5 2 3 2 695 5 7.5
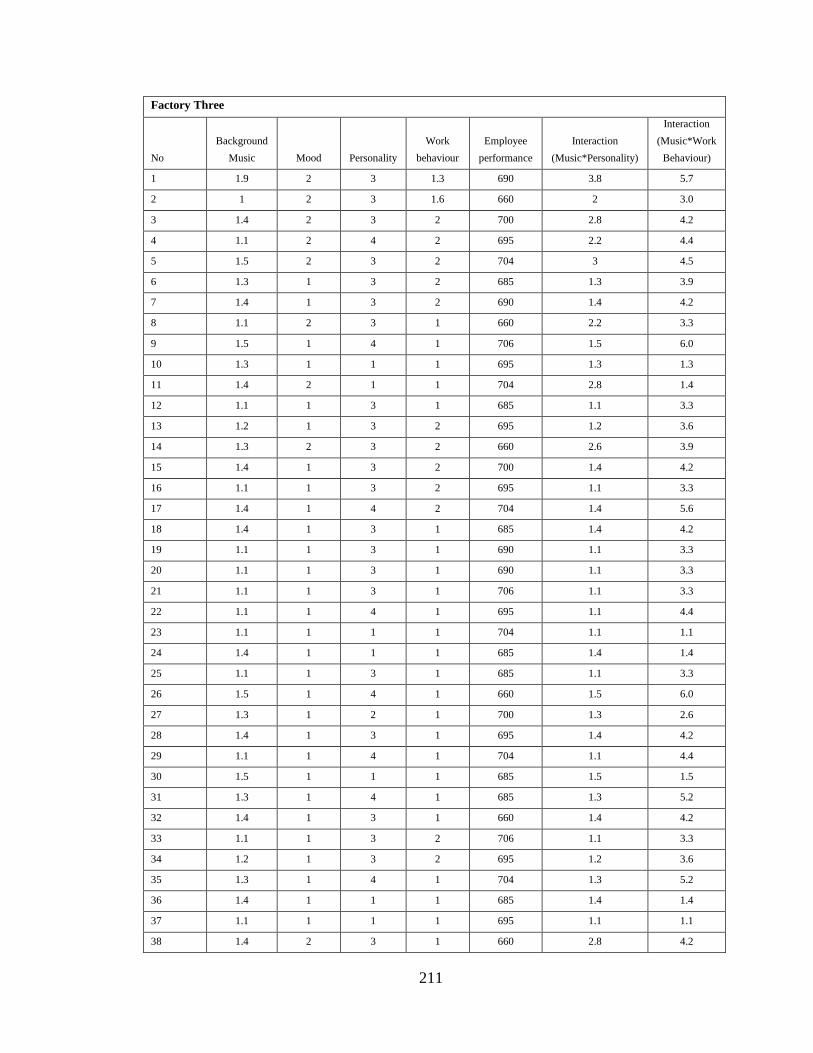
211
Factory Three
No
Background
Music Mood Personality
Work
behaviour
Employee
performance
Interaction
(Music*Personality)
Interaction
(Music*Work
Behaviour)
1 1.9 2 3 1.3 690 3.8 5.7
2 1 2 3 1.6 660 2 3.0
3 1.4 2 3 2 700 2.8 4.2
4 1.1 2 4 2 695 2.2 4.4
5 1.5 2 3 2 704 3 4.5
6 1.3 1 3 2 685 1.3 3.9
7 1.4 1 3 2 690 1.4 4.2
8 1.1 2 3 1 660 2.2 3.3
9 1.5 1 4 1 706 1.5 6.0
10 1.3 1 1 1 695 1.3 1.3
11 1.4 2 1 1 704 2.8 1.4
12 1.1 1 3 1 685 1.1 3.3
13 1.2 1 3 2 695 1.2 3.6
14 1.3 2 3 2 660 2.6 3.9
15 1.4 1 3 2 700 1.4 4.2
16 1.1 1 3 2 695 1.1 3.3
17 1.4 1 4 2 704 1.4 5.6
18 1.4 1 3 1 685 1.4 4.2
19 1.1 1 3 1 690 1.1 3.3
20 1.1 1 3 1 690 1.1 3.3
21 1.1 1 3 1 706 1.1 3.3
22 1.1 1 4 1 695 1.1 4.4
23 1.1 1 1 1 704 1.1 1.1
24 1.4 1 1 1 685 1.4 1.4
25 1.1 1 3 1 685 1.1 3.3
26 1.5 1 4 1 660 1.5 6.0
27 1.3 1 2 1 700 1.3 2.6
28 1.4 1 3 1 695 1.4 4.2
29 1.1 1 4 1 704 1.1 4.4
30 1.5 1 1 1 685 1.5 1.5
31 1.3 1 4 1 685 1.3 5.2
32 1.4 1 3 1 660 1.4 4.2
33 1.1 1 3 2 706 1.1 3.3
34 1.2 1 3 2 695 1.2 3.6
35 1.3 1 4 1 704 1.3 5.2
36 1.4 1 1 1 685 1.4 1.4
37 1.1 1 1 1 695 1.1 1.1
38 1.4 2 3 1 660 2.8 4.2

212
39 1.4 1 3 1 700 1.4 4.2
40 1.1 1 3 1 695 1.1 3.3
41 1.1 1 1 1 704 1.1 1.1
42 1.1 1 2 1 685 1.1 2.2
43 1.1 1 2 1 685 1.1 2.2
44 1.1 1 3 1 685 1.1 3.3
45 1.4 1 3 1 706 1.4 4.2
46 1.1 1 3 1 695 1.1 3.3
47 1.5 1 4 2 704 1.5 6.0
48 1.3 1 1 2 685 1.3 1.3
49 1.4 1 1 1 690 1.4 1.4
50 1.1 1 3 1 660 1.1 3.3
51 1.5 1 3 1 700 1.5 4.5
52 1.3 1 3 1 695 1.3 3.9
53 1.4 1 3 1 704 1.4 4.2
54 1.1 1 4 1 685 1.1 4.4
55 1.2 1 1 1 690 1.2 1.2
56 1.3 1 1 2 660 1.3 1.3
57 1.4 1 3 1 706 1.4 4.2
58 1.1 1 3 1 695 1.1 3.3
59 1.4 1 4 1 701 1.4 5.6
60 1.4 1 1 1 685 1.4 1.4
61 1.1 2 4 1 695 2.2 4.4
62 1.1 2 3 1 660 2.2 3.3
63 1.1 1 4 1 700 1.1 4.4
64 1.1 1 1 1 695 1.1 1.1
65 1.1 1 4 1 704 1.1 4.4
66 1.4 1 3 1 685 1.4 4.2
67 1.1 1 3 2 690 1.1 3.3
68 1.5 1 3 1 690 1.5 4.5
69 1.3 2 3 1 706 2.6 3.9
70 1.4 1 4 1 695 1.4 5.6
71 1.1 2 1 1 704 2.2 1.1
72 1.5 2 1 1 685 3 1.5
73 1.3 1 3 1 690 1.3 3.9
74 1.4 1 3 1 660 1.4 4.2
75 1.1 2 3 1 700 2.2 3.3
76 1.2 1 3 1 695 1.2 3.6
77 1.3 1 3 1 704 1.3 3.9
78 1.4 1 4 1 685 1.4 5.6
79 1.1 1 3 1 690 1.1 3.3
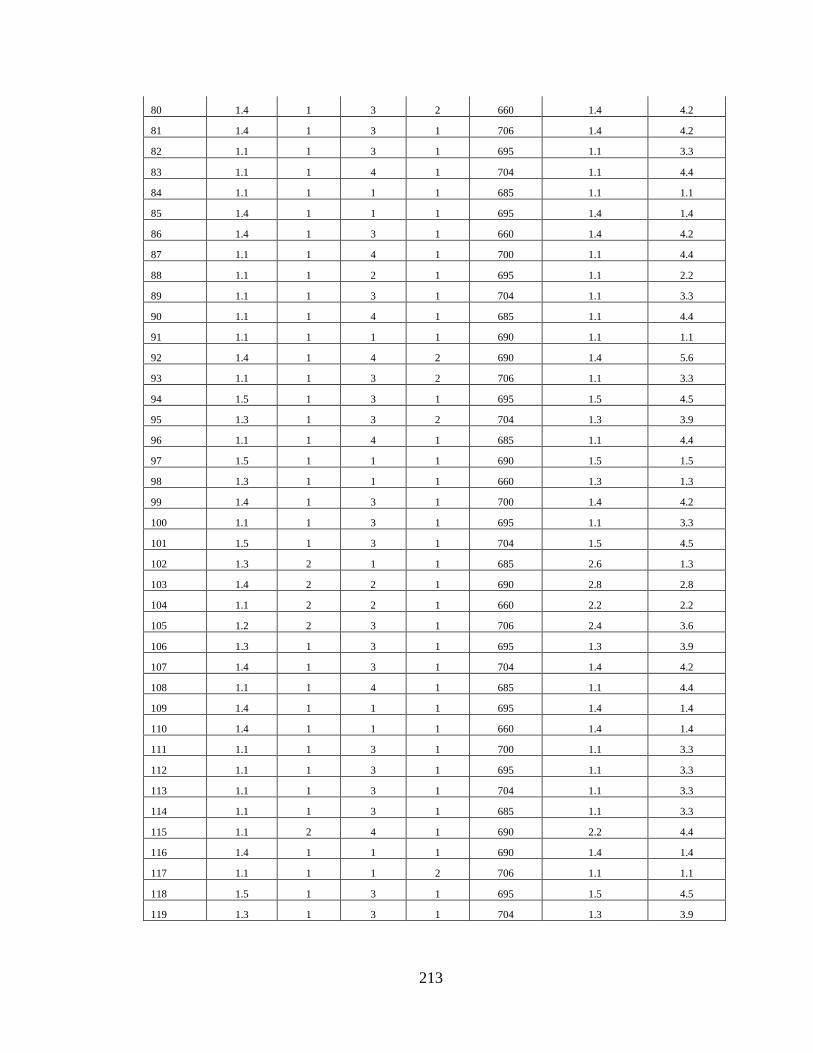
213
80 1.4 1 3 2 660 1.4 4.2
81 1.4 1 3 1 706 1.4 4.2
82 1.1 1 3 1 695 1.1 3.3
83 1.1 1 4 1 704 1.1 4.4
84 1.1 1 1 1 685 1.1 1.1
85 1.4 1 1 1 695 1.4 1.4
86 1.4 1 3 1 660 1.4 4.2
87 1.1 1 4 1 700 1.1 4.4
88 1.1 1 2 1 695 1.1 2.2
89 1.1 1 3 1 704 1.1 3.3
90 1.1 1 4 1 685 1.1 4.4
91 1.1 1 1 1 690 1.1 1.1
92 1.4 1 4 2 690 1.4 5.6
93 1.1 1 3 2 706 1.1 3.3
94 1.5 1 3 1 695 1.5 4.5
95 1.3 1 3 2 704 1.3 3.9
96 1.1 1 4 1 685 1.1 4.4
97 1.5 1 1 1 690 1.5 1.5
98 1.3 1 1 1 660 1.3 1.3
99 1.4 1 3 1 700 1.4 4.2
100 1.1 1 3 1 695 1.1 3.3
101 1.5 1 3 1 704 1.5 4.5
102 1.3 2 1 1 685 2.6 1.3
103 1.4 2 2 1 690 2.8 2.8
104 1.1 2 2 1 660 2.2 2.2
105 1.2 2 3 1 706 2.4 3.6
106 1.3 1 3 1 695 1.3 3.9
107 1.4 1 3 1 704 1.4 4.2
108 1.1 1 4 1 685 1.1 4.4
109 1.4 1 1 1 695 1.4 1.4
110 1.4 1 1 1 660 1.4 1.4
111 1.1 1 3 1 700 1.1 3.3
112 1.1 1 3 1 695 1.1 3.3
113 1.1 1 3 1 704 1.1 3.3
114 1.1 1 3 1 685 1.1 3.3
115 1.1 2 4 1 690 2.2 4.4
116 1.4 1 1 1 690 1.4 1.4
117 1.1 1 1 2 706 1.1 1.1
118 1.5 1 3 1 695 1.5 4.5
119 1.3 1 3 1 704 1.3 3.9

214


![Buyer Behaviour Personality FINAL WORK[1]](https://img.pdfslide.us/doc/110x75/5571ff8249795991699d6b16/buyer-behaviour-personality-final-work1.jpg)