Embed Size (px)
Citation preview

BACKGROUNDGEOLOGY OF THE SAN
JUAN BASIN
D E C I S I O N - M A K E R SF I E L D C O N F E R E N C E 2 0 0 2
S a n J u a n B a s i n
C H A P T E R O N E

NEW MEXICO’S ENERGY,PRESENT AND
FUTURE
Policy, Production, Economics,and the Environment
D E C I S I O N - M A K E R S F I E L D C O N F E R E N C E 2 0 0 2
New Mexico Bureau of Geology and Mineral ResourcesA Division of New Mexico Institute of Mining and Technology
2002
Brian S. Brister and L. Greer Price, Editors
This electronic document is part of a larger work that can be obtained from The New Mexico Bureau of Geology
http://geoinfo.nmt.edu/publications/decisionmakers
or call: [505] 835-5410
SAN JUAN BASIN
B A C K G R O U N D G E O L O G Y
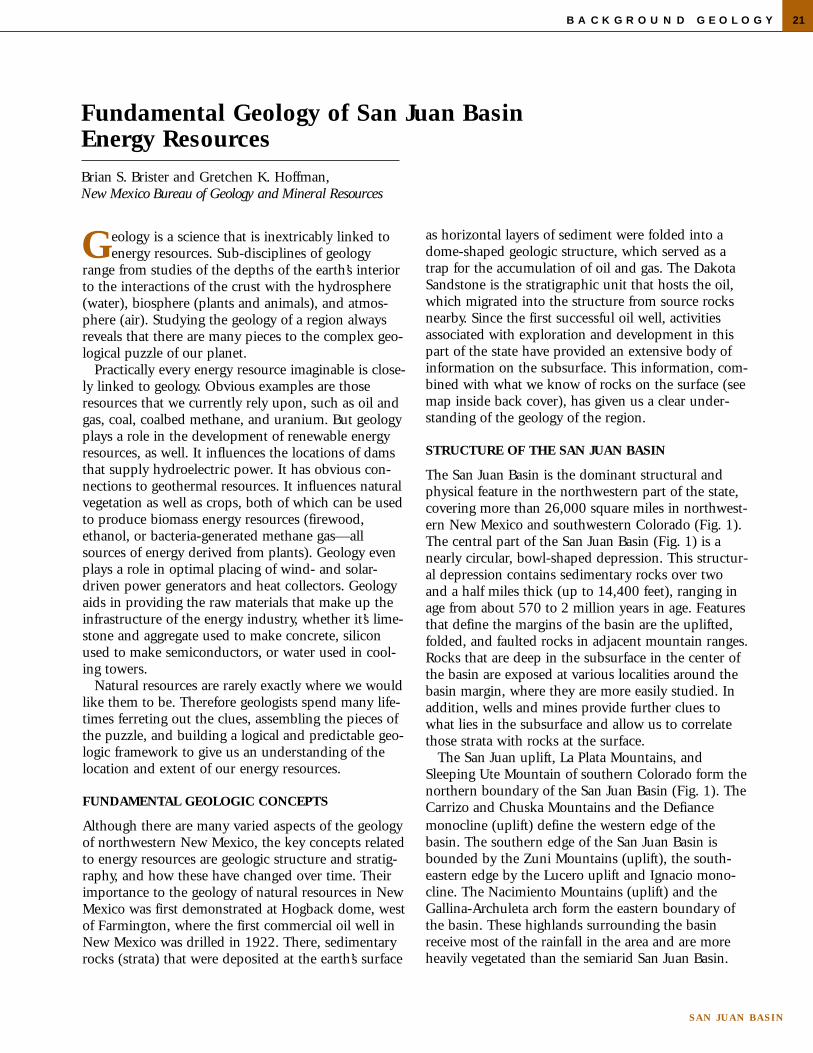
Geology is a science that is inextricably linked toenergy resources. Sub-disciplines of geology
range from studies of the depths of the earth’s interiorto the interactions of the crust with the hydrosphere(water), biosphere (plants and animals), and atmos-phere (air). Studying the geology of a region alwaysreveals that there are many pieces to the complex geo-logical puzzle of our planet.
Practically every energy resource imaginable is close-ly linked to geology. Obvious examples are thoseresources that we currently rely upon, such as oil andgas, coal, coalbed methane, and uranium. But geologyplays a role in the development of renewable energyresources, as well. It influences the locations of damsthat supply hydroelectric power. It has obvious con-nections to geothermal resources. It influences naturalvegetation as well as crops, both of which can be usedto produce biomass energy resources (firewood,ethanol, or bacteria-generated methane gas—allsources of energy derived from plants). Geology evenplays a role in optimal placing of wind- and solar-driven power generators and heat collectors. Geologyaids in providing the raw materials that make up theinfrastructure of the energy industry, whether it’s lime-stone and aggregate used to make concrete, siliconused to make semiconductors, or water used in cool-ing towers.
Natural resources are rarely exactly where we wouldlike them to be. Therefore geologists spend many life-times ferreting out the clues, assembling the pieces ofthe puzzle, and building a logical and predictable geo-logic framework to give us an understanding of thelocation and extent of our energy resources.
FUNDAMENTAL GEOLOGIC CONCEPTS
Although there are many varied aspects of the geologyof northwestern New Mexico, the key concepts relatedto energy resources are geologic structure and stratig-raphy, and how these have changed over time. Theirimportance to the geology of natural resources in NewMexico was first demonstrated at Hogback dome, westof Farmington, where the first commercial oil well inNew Mexico was drilled in 1922. There, sedimentaryrocks (strata) that were deposited at the earth’s surface
as horizontal layers of sediment were folded into adome-shaped geologic structure, which served as atrap for the accumulation of oil and gas. The DakotaSandstone is the stratigraphic unit that hosts the oil,which migrated into the structure from source rocksnearby. Since the first successful oil well, activitiesassociated with exploration and development in thispart of the state have provided an extensive body ofinformation on the subsurface. This information, com-bined with what we know of rocks on the surface (seemap inside back cover), has given us a clear under-standing of the geology of the region.
STRUCTURE OF THE SAN JUAN BASIN
The San Juan Basin is the dominant structural andphysical feature in the northwestern part of the state,covering more than 26,000 square miles in northwest-ern New Mexico and southwestern Colorado (Fig. 1).The central part of the San Juan Basin (Fig. 1) is anearly circular, bowl-shaped depression. This structur-al depression contains sedimentary rocks over twoand a half miles thick (up to 14,400 feet), ranging inage from about 570 to 2 million years in age. Featuresthat define the margins of the basin are the uplifted,folded, and faulted rocks in adjacent mountain ranges.Rocks that are deep in the subsurface in the center ofthe basin are exposed at various localities around thebasin margin, where they are more easily studied. Inaddition, wells and mines provide further clues towhat lies in the subsurface and allow us to correlatethose strata with rocks at the surface.
The San Juan uplift, La Plata Mountains, andSleeping Ute Mountain of southern Colorado form thenorthern boundary of the San Juan Basin (Fig. 1). TheCarrizo and Chuska Mountains and the Defiancemonocline (uplift) define the western edge of thebasin. The southern edge of the San Juan Basin isbounded by the Zuni Mountains (uplift), the south-eastern edge by the Lucero uplift and Ignacio mono-cline. The Nacimiento Mountains (uplift) and theGallina-Archuleta arch form the eastern boundary ofthe basin. These highlands surrounding the basinreceive most of the rainfall in the area and are moreheavily vegetated than the semiarid San Juan Basin.
21
Fundamental Geology of San Juan BasinEnergy Resources
Brian S. Brister and Gretchen K. Hoffman,New Mexico Bureau of Geology and Mineral Resources

C H A P T E R O N E
DECISION-MAKERS FIELD GUIDE 2002
22
FIGURE 1 Structural features of the San Juan Basin andadjacent areas. From Craigg, 2001.
FIGURE 2 Diagrammatic east-west cross section of San JuanBasin, from Craigg, 2001 (p. 8, comb. of section A and B).
The central basin is defined on the west, north, andeast sides by the Hogback monocline, whose rocks dipsteeply into the basin. Hogback dome, where the firstcommercial oil well in New Mexico was drilled, is asmall structure that’s part of the western Hogbackmonocline. The southern edge is defined by the Chacoslope, a gently dipping platform with about 2,500 feetof structural relief above the central basin.
The terrain within the basin consists of mesas,canyons, and valleys eroded from nearly flat-lying sed-imentary rock units deposited during the UpperCretaceous and Tertiary (about 95 to 2 million yearsago). The San Juan Basin, and many of the smallerstructural details such as the mountains and hogbacksthat define the basin boundary, began to form about65 million years ago.
The close relationship between energy resources andgeologic structure in northwestern New Mexico is evi-dent throughout the region. Coal and uranium havebeen mined on the western and southern flanks of theSan Juan Basin, where these deposits exist at or nearthe surface. Major reservoirs of natural gas and oil are
found within the central part of the San Juan Basin.Oil and gas have also been produced in lesser quanti-ties from the Chaco slope and Four Corners platformregions.
SAN JUAN BASIN STRATIGRAPHY
Stratigraphy is the study of the layers of rock in theearth’s crust, from the types of rocks and their thick-nesses, to depositional environments and time of dep-osition (see inside back cover). The sedimentary strataof the San Juan Basin dip inward from the highlandstoward the trough-like center of the basin. Older sedi-mentary rocks are exposed around the edge of thebasin and are successively overlain by younger stratatoward the center of the basin, similar to a set of nest-ed bowls (Figs. 2, 3).
The Precambrian rocks are the oldest rocks (about1,500 to 1,750 million years old). They are consideredto be the basement rocks of the region because theyunderlie all of the sedimentary rocks within the basin.They are exposed at the surface in a few localities inuplifts along the basin margin, including theNacimiento Mountains, the Zuni uplift, and the SanJuan uplift in Colorado. Granite and quartzite arecommon Precambrian rock types in those regions.
Most of the sedimentary rocks in the San Juan Basinwere deposited from the Pennsylvanian throughTertiary periods (from about 330 to 2 million yearsago; Figs. 2,3). During this time the basin wentthrough many cycles of marine (sea), coastal, and non-marine (land or freshwater) types of deposition. These

SAN JUAN BASIN
B A C K G R O U N D G E O L O G Y
sandstones of the Jurassic Morrison Formation weredeposited throughout the basin during the Jurassic(about 145 million years ago). The Morrison is one ofseveral well-known uranium-bearing rock units in themining districts along the southern flank of the basin.A period of non-deposition and erosion followed theLate Jurassic, and no sediments are preserved from theearliest Cretaceous in the San Juan Basin.
By the Late Cretaceous (about 95 to 65 million yearsago) the western U.S. was dissected by a large interiorseaway (Fig. 4). The northwest-to-southeast-trendingshoreline of the sea in northwest New Mexico migrat-ed back and forth (northeastward and southwestward)across the basin for some 30 million years, depositingabout 6,500 ft of marine, coastal plain, and nonma-rine sediments. The marine deposits consist of sand-stone, shale, and a few thin limestone beds; thecoastal plain deposits include sandstone, mudstone,and coal; and nonmarine deposits include mudstone,sandstone, and conglomerate.
The Late Cretaceous formations in the San JuanBasin, from the oldest unit (the Dakota Sandstone) tothe youngest (the Kirtland Shale), are summarized inFigure 5. There is a recurring pattern in the type of
23
cycles are reflected in the characteristics of the rocksin the basin. Like the Precambrian basement,Pennsylvanian and Permian formations (about 330 to240 million years in age) are exposed in those upliftsaround the edge of the basin, most notably the Zuniuplift east of Gallup. These Paleozoic rocks are marinein origin, composed predominantly of limestone,shale, sandstone, and gypsum. Paleozoic rocks hostseveral significant oil and gas fields west of the SanJuan Basin and are fractured ground-water aquifers inthe Zuni uplift region. Rarely are these rocks reachedby drilling in the deeper part of the San Juan Basin,because they are found only at great depth.
Overlying these Paleozoic rocks are Triassic rocks(about 240 million years old). The Triassic was a timeof nonmarine deposition, mainly by rivers and streamsflowing into the region from the southeast. Triassicrocks include sandstone, siltstone, and mudstone ofthe Chinle Group and the Rock Point Formation.About 170 million years ago the area was covered bywindblown sand dunes, preserved today in theJurassic Entrada Sandstone. The Entrada is an excel-lent oil reservoir in several fields that line up in anorthwestern trend along the Chaco slope. Stream-laid
FIGURE 3 Diagrammatic southwest-northeast cross section of SanJuan Basin, from Craigg, 2001 (p.12).

C H A P T E R O N E
DECISION-MAKERS FIELD GUIDE 2002
sediments that were deposited during the LateCretaceous. The movement of the shoreline back andforth across the basin shifted the depositional environ-ment from nonmarine to marine, and back to nonma-rine, until the end of the Cretaceous, when the seawayretreated from the basin and nonmarine depositsdominated the area. Figure 6 is a snapshot in time ofthe Four Corners region when the swamps and coastalplain environments prevailed. These deposits todayare preserved in the Crevasse Canyon Formation, animportant coal-bearing unit.
The Cretaceous stratigraphy of the San Juan Basinmakes it one of New Mexico’s crown jewels, as far asenergy resources are concerned. Many of the LateCretaceous sandstones are oil and gas reservoirs(Figure 5, and page 152). Marine shales are sourcerocks for gas and oil. Coal beds are both source andreservoir for coalbed methane. The combination ofthick Cretaceous source rocks and a large area ofreservoir rocks makes the San Juan one of the mostimportant gas-producing basins in the U.S. today. Thecoal deposits from the Cretaceous near-shore peatswamps are the source of coal and coalbed methane.The most notable is the Fruitland Formation, which iscurrently the world’s most prolific coalbed-methanefield. It is also the source of mined coal supplied tothe Four Corners and San Juan power plants west ofFarmington.
24
FIGURE 5 Late Cretaceous formations of the San Juan Basin.
FIGURE 4 Paleogeographic map of North America duringCretaceous time. Map courtesy of Ron Blakey.
Youngest Formation Rock type Depositional environment Resources(major rock listed first)
Kirtland Shale Interbedded shale, Coastal to alluvial plainsandstone
Fruitland Formation Interbedded shale, Coastal plain Coal, coalbed sandstone and coal methane
Pictured Cliffs Sandstone Sandstone Marine, beach Oil, gas, water
Lewis Shale Shale, thin limestones Offshore marine Gas
Cliff House Sandstone Sandstone Marine, beach Oil, gas, water
Menefee Formation Interbedded shale, Coastal plain Coal, coalbed sandstone and coal methane, gas
Point Lookout Sandstone Sandstone Marine, beach Oil, gas, water
Crevasse Canyon Formation Interbedded shale, Coastal plain Coalsandstone and coal
Gallup Sandstone Sandstone, a few shales Marine to coastal deposit Oil, gas, waterand coals
Mancos Shale Shale, thin sandstones Offshore marine Oil
Dakota Sandstone Sandstone, a few shales Coastal plain to Oil, gas, waterOldest and coals a marine shoreline

SAN JUAN BASIN
B A C K G R O U N D G E O L O G Y
much to be gained from further research. Mined ener-gy reserves such as fossil fuels and uranium are oftenshort-lived and must be continually replaced as they areconsumed. Replacement is not an easy task; the easy-to-find reserves are generally the ones we’ve alreadyfound and produced. Thus, we now search for the sub-tle, and often smaller, deposits and reservoirs. Our abil-ity to find them, and to develop them, is closely tied toour willingness and ability to better understand thegeology of this important part of New Mexico.
25
From the end of the Cretaceous through the Tertiary(about 65 to 2 million years ago) the San Juan Basinwas dominated by nonmarine deposition in streamchannels, floodplains, lakes, and windblown sands.Volcanic activity to the north and southwest of thebasin had some influence on the type of sedimentsbeing deposited within the basin. Tertiary rocksinclude sandstone, shale, and conglomerate. Tertiaryrocks support the foundation of the dam at NavajoLake on the San Juan River east of Bloomfield, wherehydroelectric power is generated. Although Tertiaryrocks have long been known to be aquifers in thenortheast part of the San Juan Basin, only in the pastdecade has significant natural gas development inTertiary rocks begun west of Dulce on the JicarillaApache Reservation.
GEOLOGY AND ENERGY RESOURCES
Science is built upon a foundation of cumulativeknowledge. Each successive geologic investigationcontributes another piece of the puzzle of the how,where, and why of understanding natural resources.The fundamental concepts of geologic structure andstratigraphy are continually being refined. After 80years of energy-related exploration, development, andgeologic research in the San Juan Basin, there is still
FIGURE 6 Snap shot of paleogeography of the Four Cornersregion during Late Cretaceous. Map courtesy of Ron Blakey.

C H A P T E R O N E
DECISION-MAKERS FIELD GUIDE 2002
26
Badlands are intricately dissected, water-carved topo-graphic features characterized by a very fine
drainage network with high numbers of small rills andchannels, and rounded narrow ridges with short steepslopes between the drainages. Badlands develop onsloping surfaces with little or no vegetative cover, erod-ing poorly consolidated clays, silts, and minor amountsof sandstone, fossil soils (including coal), and less com-mon soluble minerals such as gypsum or salts. The termwas first applied to an area in South Dakota, which wascalled mauvaises terres by the early French fur traders.The French and English terms not only imply that bad-lands are bad ground, they also imply sparse vegeta-tion—not good for agriculture. The Spanish term mal-pais may be translated as badland, but the term isapplied to fresh, jagged lava, which not only are impos-sible for agriculture, they are difficult to cross on horse-back. Badlands in the western United States are com-mon and locally charming features of the naturallandscape. Over time, badlands are cyclically exposed,eroded, and buried in response to environmental condi-tions including shifts in climate, changes in local vegeta-tion, and changes in stream levels and sediment supply.Ironically, mankind has created some badlands that “livedown” to their connotative names, in areas that did nothave badlands before (Perth-Amboy, New Jersey, andProvidence Canyon State Conservation Park, Georgia, toname two). Understanding how natural badlands arecreated, function, and heal has important applicationsto land management practices (including mine reclama-tion).
Badlands are abundant in northwestern New Mexico,forming 30–40% of the area. They are interspersed withmore vegetated stream valleys, rolling uplands, mesas,sandstone canyons, covered sandy slopes, and wind-blown sand dunes. Their formation requires:
• extensive exposures of easily erodible mudstone• abrupt elevational changes between stream val-leys and valley margins• sparse vegetation• a semiarid climate with a large annual range inprecipitation intensities, durations, and amounts.The San Juan Basin has extensive exposures of gently
sloping, poorly consolidated mudstones that protrudeabove the valleys of many streams. Most of the mud-stones have clays that swell up and are very sticky andslippery when wet, shrink and curl when they dry, and
are easily transported by water and wind. These mud-stones yield very few nutrients when weathered to formsoil and are rapidly eroded before most vegetation caneke out an existence. Some of the most extensive bad-lands are developed in coal-bearing rocks (the Menefeeand Fruitland-Kirtland Formations), but mudstonesdominate the geologic column at many levels through-out the San Juan Basin. These mudstones range in agefrom 285 million years to less than half a million years.Because average annual precipitation ranges from only 6inches near Newcomb to 16 inches near theContinental Divide at Regina, vegetation tends to besparse, ranging from grassland and sagebrush steppe topiñon-juniper woodland, depending upon elevationand soil type. The vegetation does not cover 100% ofthe ground in most places. Traditional land use, partic-ularly intensive grazing, has reduced grass cover andincreased pathways for concentrated runoff in localareas, initiating exhumation or extending badlands intopreviously covered areas.
Badlands form when runoff picks up and carries awayoverlying deposits and uncovers mudstone beneath.Mudstone is less permeable than overlying sandydeposits, and runoff increases as more mudstone isexposed. Strong winds may also remove overlyingmaterial. If the gradient for runoff is steep downslope,the sediments are carried to much lower elevationsaway from the incipient badland. The initial badlandmay be small, and may be buried again by local sheet-wash processes or by windblown sand. Otherwise, thebadland may expand upslope and along the sides of thedrainage. The increased runoff may also connect to larg-er gullies downslope and help expand badland areasdownhill.Over time, steep-sided badland exposuresmigrate up tributary valleys developed in mudrocks.Erosion progresses into upland areas that were formerlystabilized by a cap of alluvial deposits and windblownsand with good grass cover. As sediment is moved fromthe tops and slopes of individual features to the base ofthe slope and beyond, the features get progressivelysmaller while similar features evolve at ever-lower eleva-tions. Regardless of size, common badland shapes arecreated and maintained by a series of natural processes:
• the dry crumbling, raveling, and blowing ofweathered mud• the flow of rain as sheetwash across the roundedhilltop
Badlands in the San Juan Basin
David W. Love, New Mexico Bureau of Geology and Mineral Resources

SAN JUAN BASIN
B A C K G R O U N D G E O L O G Y
• the swell and downslope creep of saturated clays• the accelerated flow and erosive force of rain andmudflows on steeper slopes• the alluvial apron of particles shed from the hillas the flow of water loses velocity
Water that soaks into the weathered mudstone may dis-solve chemical constituents, which then help dispersethe clay and move it along a downward gradient andaway from the hill. Removal of clay particles and dis-solved constituents opens passageways or even smallcaves. These collapse into funnel-shaped areas knownas “soil pipes.” Water and sediment passing through thepipes come out of the pipes at the base of the slopesand form small alluvial fans. When dry, the alluvial fansmay be reworked into windblown sand dunes or sandsheets. Such deposits are highly permeable and mayreduce surface runoff.
Some human-disturbed lands resemble natural bad-lands. Human-disturbed lands range from obviousmine-spoil piles and road dugways to more subtle arealchanges in vegetation and changes in the rates of natu-ral processes. Those disturbances that resemble naturalbadlands may need human reclamation, a task that isoverseen by environmental-protection legislation, regu-lation, and legal adjudication. The goals of reclamationcommonly are:
• to return the land to be near its “original” condi-tion both in terms of contours of the landscape andits previous vegetation• to restore natural function of the landscape sothat wildlife may benefit • to increase production of vegetation, preferablyfor animal forage• to reduce sediment production and transport ofsediments offsite• to improve the chemical quality of both surfacewater and ground water.
The Coal Surface Mining Law sets performance standardsconcerning topsoil, topdressing, hydrologic balance, sta-bilization of rills and gullies, alluvial valley floors, primefarm land, use of explosives, coal recovery, disposal ofspoil, coal processing, dams and embankments, steepslopes, backfilling and grading, air resource protection,protection of fish, wildlife, and related environmental val-ues, revegetation, subsidence control, roads and othertransportation, how to cease operations, and post-miningland use. These performance standards are set nationallybut applied locally, a worrisome task considering the lowrainfall and nutrient-poor soils in northwestern NewMexico compared to other parts of the United States.Historically, low vegetation cover and high sedimentyields across the local pre-mining landscape already fail
to meet reclamation standards required nationwide.An understanding of the ways in which badlands
evolve helps us understand the complex processesshaping all of the landscape. Land managers canimprove local long- and short-term reclamation bystudying the “performance” of the natural (or least-dis-turbed) landscape—uplands, badlands, alluvial bottom-lands, and windblown sand dunes—with an eye onboth existing standards and the natural processesinvolved. Armed with this understanding, they cansolve specific problems of reclamation—optimizinglong-term water retention and revegetation, for exam-ple, or minimizing sediment production and/or therelease of soluble chemical compounds. The most valu-able lessons we’ve learned from studies of naturallyoccurring badlands include the following:
• Badlands illustrate the fastest changing, least sta-ble, most dynamic end of a range in natural ratesand processes in the landscape, in contrast to themore stable parts of the same landscape (such asthe sand-covered uplands)• Internal and external environmental influencesmay alter the flux of materials and energy flowthrough the natural system• Badlands demonstrate the importance of thresh-olds for change when the landscape is subjected tovariable magnitudes and frequencies of environ-mental influences, such as rainfall or grazing pres-sure• Badlands reflect the cyclic lowering of landscapesand landforms from higher, larger, and older levelsto lower, smaller, and modern levels.• Badlands and shapes of individual features inbadlands may look the same, even though materialis slowly being removed from the slopes and addedto the valleys below• Changes in one part of a system may have conse-quences in adjacent parts of the system • In a regulatory environment one must considerthe larger picture: How may human endeavors fit inwith the natural processes that affect the develop-ment of landscape?
ADDITIONAL READINGFairbridge, R. W., 1968, The encyclopedia of geomorphology: New York,
Reinhold Book Corporation, 1295 pp.Julyan, R., 1996, The place names of New Mexico: Albuquerque,
University of New Mexico Press, 385 pp.Wells, S. G., Love, D. W., and Gardner, T. W., eds., 1983, Chaco Canyon
Country: American Geomorphological Field Group Guidebook, 1983Conference, Northwestern New Mexico, 253 pp.
27

C H A P T E R O N E
DECISION-MAKERS FIELD GUIDE 2002
28
Illustrations by Leo O. Gabaldon
COMMON EROSIONAL FEATURES

SAN JUAN BASIN
B A C K G R O U N D G E O L O G Y 29
Anthropologists use the phrase“name magic” to describe the
tendency of people to think thatthey can understand or controlsomething merely by naming it. Itwas a rage in geologic and geo-graphic disciplines in the late nine-teenth century. Early explorers,mappers, and geologists namedhundreds of geographic featuresand rocks, using new or locallyused exotic names, thereby bestow-ing some impression of enhancedunderstanding of the feature underscrutiny—and some enhanced sta-tus upon the namer.
But does naming a lumpy ero-sional feature a “hoodoo” or a“yardang” help our understandingof how it formed any more than ifwe had crawled around it and madecareful observations? What if suchterms bring with them negativeconnotations—such as “badlands”or “gully”? As we all know, termsare seldom neutral in their connota-tions. Today, in extreme cases,names are deliberately changed toconform to current standards ofpolitical correctness.
Names tell us something aboutour past and ourselves. Namesapplied to features in northwesternNew Mexico serve several purposes.Some are descriptive and serve asplace names: Standing Rock, TheHogback, Waterflow, Angel Peak.Some are for fun: Beechatuda Draw,Santa Lulu. Some generic termshave both popular and technicaldefinitions: mesa, butte, badland,pedestal rock. The landscape ofnorthwestern New Mexico is de-scribed using names for features ofvarious sizes. Erosional featuresrooted in bedrock range from largeto small (see illustrations on facingpage). These features are a result of“differential erosion.” Some rock
• concretions and fragments ofconcretions (rounded or oblongobjects formed by concentratedchemical precipitation ofcements in preexisting rocks) • red dog and clinker (red orbrown baked, partially melted,and/or silicified mudstonesadjacent to burned-out coalseams) • fossil fragments such as sili-cified wood, bones, teeth,shells, fish scales, and other fos-sils• reworked older clasts (suchas pebbles from bedrock forma-tions). Features of sediment accumu-lation Oddly enough, fewerspecific terms have been coinedfor features or forms that arebuilt up by sediment accumula-tion. Perhaps ambitious namersare unimpressed with the subtlefeatures developed on areas oflesser topographic relief (“fea-ture challenged”). Instead, thefeatures commonly are taggedwith descriptive phrases:• modern low-gradient wash-es with adjacent floodplainalluvium • upland surfaces covered withold alluvium, sand sheets, andeolian dunes• intermediate slopes withalluvial aprons • alluvial fans; bajadas • terraces • sand sheets, sand dunes,climbing and falling dunes, rimdunes, barchan dunes, parabol-ic dunes, distended parabolicarms of dunes; longitudinaldunes, star dunes, coppicedunes • landslides, slumps, debrisflow lobes, debris runout fans.
units resist erosion better than oth-ers. Well-cemented sandstone, lime-stone, and/or lava resist weatheringand erosion better than mudstones.Mudstones interbedded with thesemore resistant rocks are more easilyeroded and transported away down-stream, leaving the more resistantrocks high on the landscape. Thevolcanic neck of Ship Rock, theplumbing system for a 25-million-year-old volcano, sticks up 1,700feet above the surrounding country-side because the surrounding mud-rocks have been removed by differ-ential erosion. Surficial depositsmay also resist erosion—soils devel-oped with calcium carbonate hori-zons (caliche) may be difficult toerode. Windblown sand may be sopermeable that the small amountsof precipitation that do fall soak inbefore they have a chance to runoff. Gravel deposits may be moredifficult to erode than sand or mudand therefore are left behind as ter-races along streams. Uncommonly,some deposits are protected fromerosion by their proximity to resist-ant rocks (“bedrock defended”).Erosional products The fragmentalproducts of weathering and erosionare moved away from the underly-ing bedrock, travel downslope, andultimately come to rest in newdeposits. The most common ero-sional products seen in badlandsand in stream channels in north-western New Mexico are:
• loose grains of sand, silt,and clay• textures that range from vel-vety smooth surfaces to pop-corn-like crusts to flat mud-cracked plates on weathered,clay-rich slopes• slabs or blocks of cementedsandstones, siltstones, orlimestones
All Features Great and Small

C H A P T E R O N E
DECISION-MAKERS FIELD GUIDE 2002
30
Uranium is a hard, dense, metallic silver-gray ele-ment with an atomic number of 92 and an atom-
ic weight of 238.02891. It is ductile, malleable, and apoor conductor of electricity. Uranium was discoveredin 1789 by Martin Klaproth in Germany and wasnamed after the planet Uranus. There are three natu-rally occurring radioactive isotopes (U-234, U-235,and U-238); U-238 is the most abundant.Most of the uranium produced in the world is used innuclear power plants to generate electricity. A minoramount of uranium is used in a variety of additionalapplications, including components in nuclearweapons, as X-ray targets for production of high-ener-gy X-rays, photographic toner, and in analytical chem-istry applications. Depleted uranium is used in metalform in yacht keels, as counterweights, armor piercingammunition, and as radiation shielding, as it is 1.7times denser than lead. Uranium also provides pleas-ing yellow and green colors in glassware and ceramics,a use that dates back to the early 1900s.
Nuclear power is important to New Mexico and theUnited States. Nuclear power plants operate the sameway that fossil fuel-fired plants do, with one majordifference: nuclear energy supplies the heat requiredto make steam that generates the power plant. Nuclearpower plants account for 19.8% of all electricity gen-erated in the United States (Fig. 1). This generatedelectricity comes from 66 nuclear power plants com-posed of 104 commercial nuclear reactors licensed tooperate in the U.S. in 2001.
Although New Mexico does not generate electricityfrom nuclear power in the state, the Public ServiceCompany of New Mexico (PNM) owns 10.2% of thePalo Verde nuclear power plant in Maricopa County,Arizona. PNM sells the generated electricity from PaloVerde to its customers in New Mexico. In 1999 theaverage cost of electricity generated by nuclear powerplants was 0.52 cents/kilowatt hour, compared to 1.56cents/kilowatt hour for electricity generated by fossilfuel-fired steam plants. Most of the electricity generat-ed from plants in New Mexico comes from coal-firedplants (Fig. 2), and New Mexico sells surplus electrici-ty to other states.
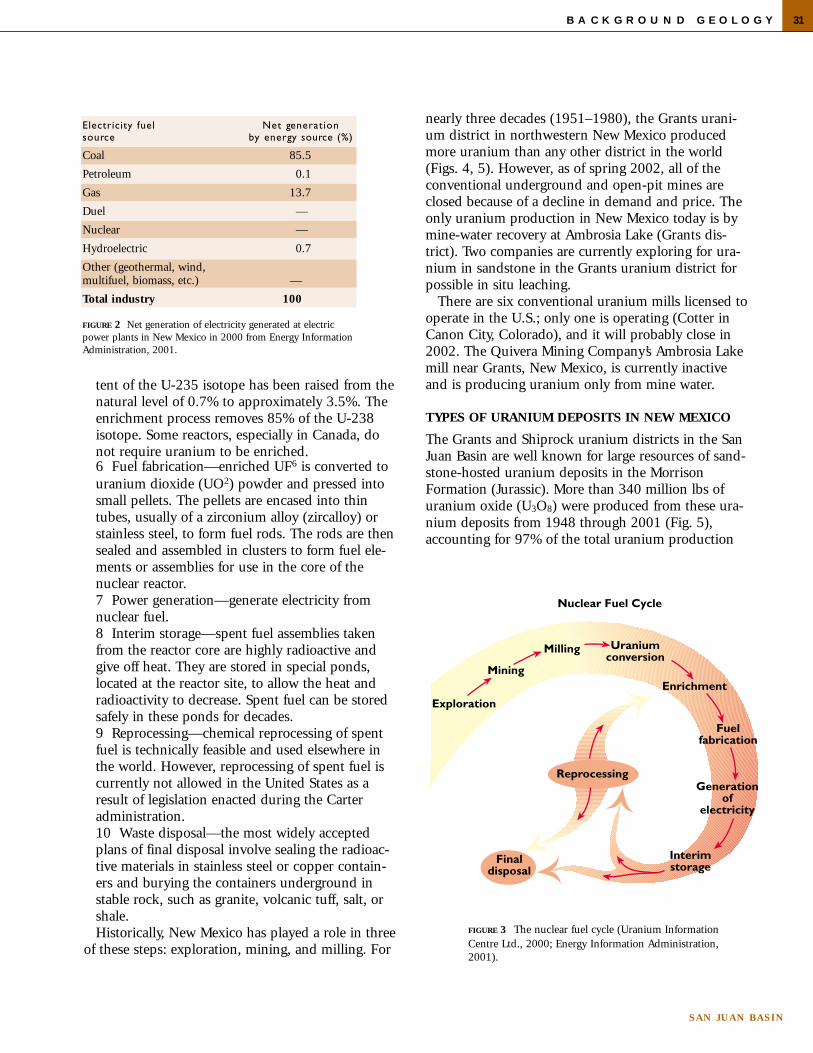
NUCLEAR FUEL CYCLE
The first step in understanding the importance of ura-nium and nuclear power to New Mexico is to under-stand the nuclear fuel cycle. The nuclear fuel cycleconsists of ten steps (Fig. 3):
1 Exploration—using geologic data to discover aneconomic deposit of uranium.2 Mining—extracting uranium ore from the ground.3 Milling—removing and concentrating the urani-um into a more concentrated product (“yellowcake” or uranium oxide, U3O8).4 Uranium conversion— uranium oxide concen-trate is converted into the gas uranium hexafluo-ride (UF6).5 Enrichment—most nuclear power reactorsrequire enriched uranium fuel in which the con-
Uranium in New Mexico
Virginia T. McLemore, New Mexico Bureau of Geology and Mineral Resources
FIGURE 1 Net generation and industry capability of electricitygenerated by fuel in the United States in 2000 (from Energy
Information Administration, 2001).
5
Electricity fuel Net generation Net generation Industry Industry Fuel Costssource by fuel source by fuel source c apability by c apability by (dollars per
(billion (%) fuel source fuel source mill ion Btu)kilowatt hours) (meg awatts) (%)
Coal 1,968 51.8 315,249 38.9 1.2
Petroleum 109 2.9 39,253 4.8 4.45
Gas 612 16.1 97,632 12.1 4.3
Nuclear 754 19.8 97,557 12.0
Hydroelectric 273 7.2 99,068 12.2
Other (geothermal, 84 2.2 162,866 20.0wind, multifuel,biomass, ect.)
Total industry 3,800 100 811,625 100
SAN JUAN BASIN
B A C K G R O U N D G E O L O G Y 31
tent of the U-235 isotope has been raised from thenatural level of 0.7% to approximately 3.5%. Theenrichment process removes 85% of the U-238isotope. Some reactors, especially in Canada, donot require uranium to be enriched.6 Fuel fabrication—enriched UF6 is converted touranium dioxide (UO2) powder and pressed intosmall pellets. The pellets are encased into thintubes, usually of a zirconium alloy (zircalloy) orstainless steel, to form fuel rods. The rods are thensealed and assembled in clusters to form fuel ele-ments or assemblies for use in the core of thenuclear reactor.7 Power generation—generate electricity fromnuclear fuel.8 Interim storage—spent fuel assemblies takenfrom the reactor core are highly radioactive andgive off heat. They are stored in special ponds,located at the reactor site, to allow the heat andradioactivity to decrease. Spent fuel can be storedsafely in these ponds for decades.9 Reprocessing—chemical reprocessing of spentfuel is technically feasible and used elsewhere inthe world. However, reprocessing of spent fuel iscurrently not allowed in the United States as aresult of legislation enacted during the Carteradministration.10 Waste disposal—the most widely acceptedplans of final disposal involve sealing the radioac-tive materials in stainless steel or copper contain-ers and burying the containers underground instable rock, such as granite, volcanic tuff, salt, orshale.Historically, New Mexico has played a role in three
of these steps: exploration, mining, and milling. For
nearly three decades (1951–1980), the Grants urani-um district in northwestern New Mexico producedmore uranium than any other district in the world(Figs. 4, 5). However, as of spring 2002, all of theconventional underground and open-pit mines areclosed because of a decline in demand and price. Theonly uranium production in New Mexico today is bymine-water recovery at Ambrosia Lake (Grants dis-trict). Two companies are currently exploring for ura-nium in sandstone in the Grants uranium district forpossible in situ leaching.
There are six conventional uranium mills licensed tooperate in the U.S.; only one is operating (Cotter inCanon City, Colorado), and it will probably close in2002. The Quivera Mining Company’s Ambrosia Lakemill near Grants, New Mexico, is currently inactiveand is producing uranium only from mine water.
TYPES OF URANIUM DEPOSITS IN NEW MEXICO
The Grants and Shiprock uranium districts in the SanJuan Basin are well known for large resources of sand-stone-hosted uranium deposits in the MorrisonFormation (Jurassic). More than 340 million lbs ofuranium oxide (U3O8) were produced from these ura-nium deposits from 1948 through 2001 (Fig. 5),accounting for 97% of the total uranium production
FIGURE 3 The nuclear fuel cycle (Uranium InformationCentre Ltd., 2000; Energy Information Administration,2001).
FIGURE 2 Net generation of electricity generated at electricpower plants in New Mexico in 2000 from Energy InformationAdministration, 2001.
Electricity fuel Net generationsource by energy source (%)
Coal 85.5
Petroleum 0.1
Gas 13.7
Duel —
Nuclear —
Hydroelectric 0.7
Other (geothermal, wind,multifuel, biomass, etc.) —
Total industry 100

C H A P T E R O N E
DECISION-MAKERS FIELD GUIDE 2002
32
FIGURE 4 Uranium potential in the San Juan Basin, New Mexico(from McLemore and Chenoweth, 1989).

SAN JUAN BASIN
B A C K G R O U N D G E O L O G Y 33
FIGURE 5 Uranium production in New Mexico (McLemore andChenoweth, 1989; production from 1988-2000 estimated by theauthor). 1Approximate numbers rounded to the nearest 1,000 lbs.
Total U.S. production from McLemore and Chenoweth (1989) andEnergy Information Administration (2001).
Type of deposit P roduction Period of P roduction per total in(lbs U3O8) p roduction (yrs) New Mexico (%)
Primary, redistributed, remnant 332,107,0001 1951–1989 95.4sandstone uranium deposits(Morrison Formation, Grants district)
Mine-water recovery 8,317,788 1963–2000 2.4
Tabular sandstone uranium deposits 493,510 1948–1982 0.1(Morrison Formation, Shiprock district)
Other Morrison sandstone uranium deposits 991 1955–1959 —
Other sandstone uranium deposits 468,680 1952–1970 0.1
Limestone uranium deposits (Todilto Formation) 6,671,798 1950–1985 1.9
Other sedimentary rocks with uranium deposits 34,889 1952–1970 —
Vein-type uranium deposits 226,162 1953–1966 —
Igneous and metamorphic rocks with 69 1954–1956 —uranium deposits
Total in New Mexico 348,321,0001 1948–2000 100
Total in United States 922,870,0001 1947–2000 37.8 of total U.S.
in New Mexico and 37.8% of the total uranium pro-duction in the United States. New Mexico ranks sec-ond in uranium reserves in the U.S., with reserves of15 million short tons of ore at 0.277% U3O8 (84 mil-lion lbs U3O8) at $30/lb (Fig. 6). The Department ofEnergy classifies uranium reserves into forward costcategories of $30 and $50 per lb. Forward costs areoperating and capital costs (in current dollars) that arestill to be incurred to produce uranium from estimat-ed reserves. All of New Mexico’s uranium reserves in2002 are in the Morrison Formation in the San JuanBasin,
Uranium ore bodies are found mostly in theWestwater Canyon, Brushy Basin, and JackpileSandstone Members of the Morrison Formation.Typically, the ore bodies are lenticular, tabular massesof complex uranium and organic compounds thatform roughly parallel trends; fine- to medium-grainedbarren sandstone lie between the ore bodies.
Nearly 6.7 million lbs of uranium oxide (U3O8)have been produced from uranium deposits in lime-stone beds of the Todilto Member of the WanakahFormation (Jurassic). Uranium deposits in the Todiltolimestone are similar to primary sandstone-hosteduranium deposits; they are tabular, irregular in shape,and occur in trends. Most deposits contain less than20,000 tons of ore averaging 0.2-0.5% U3O8, althougha few deposits were larger. Uranium is found only in a
few limestones in the world, but, of these, the depositsin the Todilto limestone are the largest and most pro-ductive. However, uranium has not been producedfrom the Todilto Member since 1981, and it is unlikelythat any additional production will occur in the nearfuture.
Other uranium deposits in New Mexico are hostedby other sedimentary rocks or are in fractured-con-trolled veins or in igneous or metamorphic rocks.Production from these deposits has been insignificant(Fig. 5) and it is unlikely that any production willoccur from them in the near future.
FUTURE POTENTIAL
The potential for uranium production from NewMexico in the near future is dependent upon interna-tional demand for uranium, primarily for fuel fornuclear power plants. Currently, nuclear weapons fromthe former U.S.S.R. and the U.S. are being convertedinto nuclear fuel for nuclear power plants, reducingthe demand for raw uranium. In addition, higher-grade, lower-cost uranium deposits in Canada andAustralia are sufficient to meet current internationaldemands. Thus, it is unlikely that conventional under-ground mining of uranium in New Mexico will beprofitable in the near future. However, mine-waterrecovery and in situ leaching of the sandstone-hosteduranium deposits in the Grants uranium district are

C H A P T E R O N E
DECISION-MAKERS FIELD GUIDE 2002
34
FIGURE 6 Uranium reserves by forward-cost category by state, 2000(Energy Information Administration, 2001). The DOE classifies ura-nium reserves into forward cost categories of $30 and $50 per lb.
Forward costs are operating and capital costs (in current dollars)that are still to be incurred to produce uranium from estimatedreserves.
Sta te ore $30 per lb U 3O8 ore $50 per lb U 3O8
(million tons) grade (million lbs) (million tons) grade (million lbs)(% U3O8) (% U3O8)
New Mexico 15 0.277 84 102 0.166 341
Wyoming 42 0.129 110 240 0.077 370
Arizona, Colorado, Utah 7 0.288 41 42 0.138 115
Texas 4 0.079 7 19 0.064 24
Other 7 0.202 29 25 0.107 54
Total 76 0.178 271 428 0.106 904
likely to continue as the demand and price of uraniumincrease in the next decade.
Only one company in New Mexico, Quivira MiningCo. owned by Rio Algom Ltd. (successor to KerrMcGee Corporation), produced uranium in 1989-2001, from waters recovered from inactive under-ground operations at Ambrosia Lake (mine-waterrecovery). Hydro Resources Inc. has put its plans onhold to mine uranium by in situ leaching atChurchrock until the uranium price increases.Reserves at Churchrock are estimated as 15 million lbsof U3O8. NZU Inc. also is planning to mine atCrownpoint by in situ leaching. Rio Grande ResourcesCo. is maintaining the closed facilities at the floodedMt. Taylor underground mine, in Cibola County,where primary sandstone-hosted uranium depositswere mined as late as 1989. In late 1997 AnacondaUranium acquired the La Jara Mesa uranium depositin Cibola County from Homestake Mining Co. Thisprimary sandstone-hosted uranium deposit, discov-ered in the late 1980s in the Morrison Formation,contains approximately 8 million lbs of 0.25% U3O8.Future development of these reserves and resourceswill depend upon an increase in price for uraniumand the lowering of production costs.
ACKNOWLEDGMENTS
This work is part of ongoing research of mineralresources in New Mexico and adjacent areas currentlyunderway at the New Mexico Bureau of Geology andMineral Resources.
REFERENCES
Energy Information Administration, 2001, Web site: U.S. Department ofEnergy, http://www.eia.doe.gov/ (accessed on October 25, 2001).
McLemore, V. T., and Chenoweth, W. L., 1989, Uranium resources in NewMexico: New Mexico Bureau of Mines and Minerals Resources, ResourceMap 18, 36 pp.
Uranium Information Centre Ltd., 2000, The nuclear fuel cycle andAustralia’s role in it: http://www.uic.com.au/nfc.htm (accessed onNovember 19, 2001).
Web Elements, 2001, Uranium: http://www.webelements.com/webele-ments/elements/text/U/key.html (accessed on December 21, 2001).
SAN JUAN BASIN
B A C K G R O U N D G E O L O G Y 35
The San Juan Basin is classified as an arid region:most of the area receives less than 10 inches of
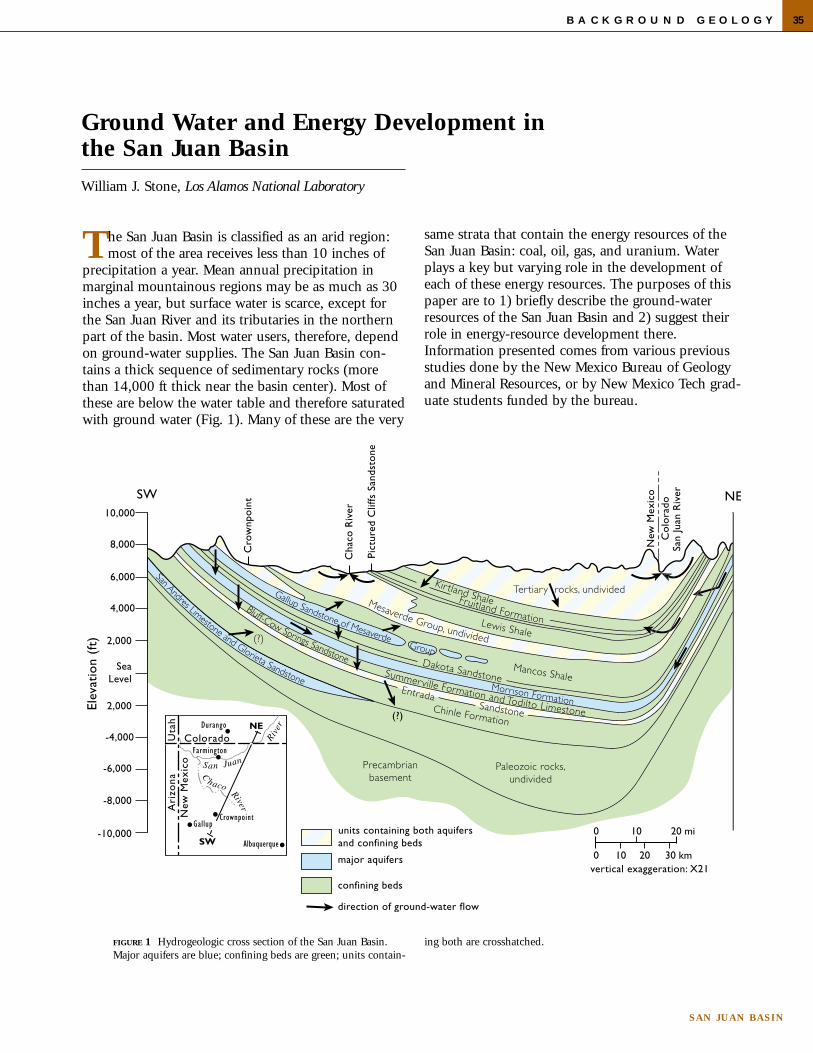
precipitation a year. Mean annual precipitation inmarginal mountainous regions may be as much as 30inches a year, but surface water is scarce, except forthe San Juan River and its tributaries in the northernpart of the basin. Most water users, therefore, dependon ground-water supplies. The San Juan Basin con-tains a thick sequence of sedimentary rocks (morethan 14,000 ft thick near the basin center). Most ofthese are below the water table and therefore saturatedwith ground water (Fig. 1). Many of these are the very
same strata that contain the energy resources of theSan Juan Basin: coal, oil, gas, and uranium. Waterplays a key but varying role in the development ofeach of these energy resources. The purposes of thispaper are to 1) briefly describe the ground-waterresources of the San Juan Basin and 2) suggest theirrole in energy-resource development there.Information presented comes from various previousstudies done by the New Mexico Bureau of Geologyand Mineral Resources, or by New Mexico Tech grad-uate students funded by the bureau.
Ground Water and Energy Development inthe San Juan Basin
William J. Stone, Los Alamos National Laboratory
FIGURE 1 Hydrogeologic cross section of the San Juan Basin.Major aquifers are blue; confining beds are green; units contain-
ing both are crosshatched.

C H A P T E R O N E
DECISION-MAKERS FIELD GUIDE 2002
36
WHERE AND HOW DOES THE GROUND WATEROCCUR?
Ground-water occurrence may be described in threeways: the rock unit containing the ground water, thepressure condition under which the water exists, anddepth to the ground water. Most of the useableground water exists in rocks with open space betweengrains, rather than in fractures. The specific rock unitsyielding useful quantities of water to wells (aquifers)vary with location. In the northeastern part of thebasin, sandstones of Tertiary age are the best targetsfor ground water. In the western and southern parts ofthe basin, the most successful wells tap Mesozoicsandstones. Only along the northern flank of the ZuniMountains, east of Gallup, New Mexico, are produc-tive wells completed in fractured rock (Permian lime-stone).
Most of the ground water in the San Juan Basinexists under confined (artesian) or semi-confinedhydrologic conditions: under pressure, prevented fromseeking its own level by an overlying rock unit of lowpermeability (aquitard). In the Mesozoic rocks of thisregion, the artesian sandstone aquifers are interbeddedwith shales that behave as low-permeability, confiningaquitards. The Triassic mudrock sequence is theaquitard for the Permian limestone. By contrast,ground water in the alluvium along streams and in theshallow Tertiary sandstone aquifers is generallyunconfined: the water is not under pressure, not over-lain by an aquitard, and is open to the atmospherethrough pores in overlying permeable rocks.
The depth to ground water varies from place toplace, because of the slope of the water table and dipof the strata. The depth to water in unconfinedaquifers is the depth to the top of saturation or theregional water table, which varies from less than 100ft to several hundred feet, depending on the aquifer inquestion and the overlying topography. In the case ofconfined aquifers, there are two different depths towater: one before it is penetrated by a well, and oneafter penetration has occurred. Before well construc-tion, the depth to water is the same as the depth tothe top of the confined or artesian aquifer. Depths tothe top of a specific confined aquifer also varythroughout the basin due to the dip of the strata.Depth to the Tertiary sandstones (for example, OjoAlamo Sandstone) varies from less than 100 ft to asmuch as 4,000 ft; depth to the deepest sandstoneaquifer widely used (Westwater Canyon SandstoneMember of the Morrison Formation) varies from lessthan 100 ft to nearly 9,000 ft.
After a confined aquifer is penetrated by a well,water rises above the top of the aquifer. The level towhich it rises is called the potentiometric surface.Each artesian aquifer in the basin has its own poten-tiometric surface. The depth or elevation of this sur-face also varies across the basin, depending upon thedip of the strata and the pressure of the confinedground water.
WHICH WAY DOES THE GROUND WATER FLOW?
In the San Juan Basin, as elsewhere, ground waterflows from higher elevation recharge areas (moun-tains), located around the basin margin, toward lowerelevation discharge areas (rivers). Northwest of thecontinental divide, ground water flows toward the SanJuan River or Little Colorado River. Southeast of thedivide, it flows toward the Rio Grande.
HOW FAST DOES THE GROUND WATER MOVE?
The rate of water movement in an aquifer depends onits hydraulic properties (porosity and permeability)and the hydraulic gradient (steepness of the watertable or potentiometric surface). Thus, the rate ofmovement varies from aquifer to aquifer. Ground-water modeling has suggested rates for totalground-water inflow and outflow in the basin. Theserates are 20 cubic feet per second (ft3/s) or approxi-mately 9,000 gallons per minute (gpm) for theTertiary sandstones and 40 ft3/s or approximately18,000 gpm for the Cretaceous and Jurassic sand-stones.
HOW GOOD IS THE WATER?
Water is of good quality near basin-margin rechargeareas, but deteriorates with distance along its flowpath as it dissolves minerals. A general measure ofwater quality is salinity. This is commonly evaluatedby specific conductance, a measure of a water’s abilityto conduct electricity. Values are reported in thestrange unit of microSiemens/centimeter (uS/cm). Thelower the number, the better is the water quality.Values of less than 1,000 uS/cm generally indicatepotable water. Values for valley-fill alluvium are gener-ally less than 1,000 uS/cm in headwater areas andgreater than 4,000 uS/cm in downstream reaches, dueto discharge of deeper water from bedrock. Specificconductance of water from sandstone aquifers rangesfrom less than 500 uS/cm near outcrop to almost60,000 uS/cm at depth.
Bicarbonate content is relatively high in waters hav-
SAN JUAN BASIN
B A C K G R O U N D G E O L O G Y 37
ing specific conductance values of as high as 1,000uS/cm. Sodium, sulfate, and chloride are major dis-solved components in ground water having specificconductance values of as high as 4,000 uS/cm
HOW MUCH GROUND WATER IS THERE?
Ground water in most of the region is very old.Studies at the Navajo mine showed the long-termground-water recharge rate to be very low (0.02 inch-es/yr). Pumping of aquifers far exceeds this rechargerate and thus results in the depletion of ground-waterresources that cannot be replaced in the foreseeablefuture. It has been estimated that as much as 2 millionacre-feet of slightly saline ground water (having lessthan 2,000 milligrams per liter of total dissolvedsolids) could be produced from the confined aquifersin the San Juan Basin with a water-level decline of 500ft. Although that is a lot of untapped water, it is toosalty for many uses and installing wells that couldhandle the anticipated 500-ft drop in water levelwould be very expensive.
WHAT ARE THE IMPLICATIONS FOR ENERGYDEVELOPMENT?
Water is an important component in the developmentof the basin’s energy resources. Both water quantityand quality issues must be considered. Is there a suffi-cient supply of good-quality water for developmentneeds? Does development impact local or regionalwater quantity and quality? The answers vary fromresource to resource.
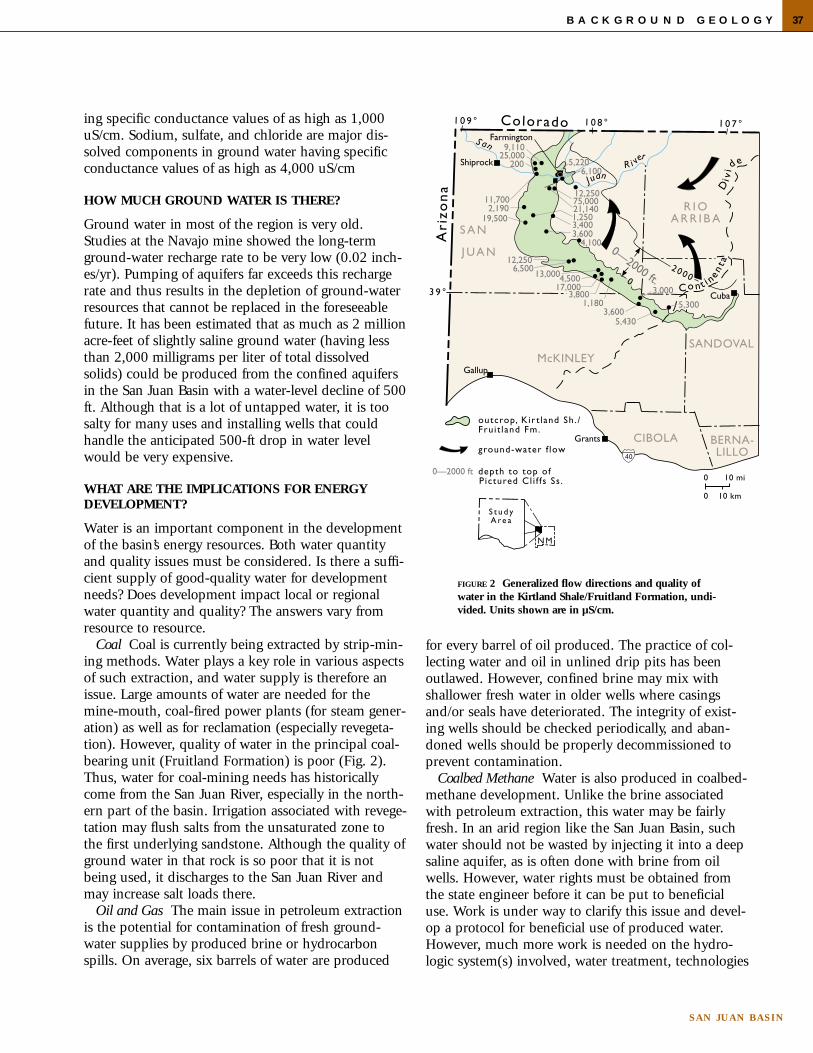
Coal Coal is currently being extracted by strip-min-ing methods. Water plays a key role in various aspectsof such extraction, and water supply is therefore anissue. Large amounts of water are needed for themine-mouth, coal-fired power plants (for steam gener-ation) as well as for reclamation (especially revegeta-tion). However, quality of water in the principal coal-bearing unit (Fruitland Formation) is poor (Fig. 2).Thus, water for coal-mining needs has historicallycome from the San Juan River, especially in the north-ern part of the basin. Irrigation associated with revege-tation may flush salts from the unsaturated zone tothe first underlying sandstone. Although the quality ofground water in that rock is so poor that it is notbeing used, it discharges to the San Juan River andmay increase salt loads there.
Oil and Gas The main issue in petroleum extractionis the potential for contamination of fresh ground-water supplies by produced brine or hydrocarbonspills. On average, six barrels of water are produced
for every barrel of oil produced. The practice of col-lecting water and oil in unlined drip pits has beenoutlawed. However, confined brine may mix withshallower fresh water in older wells where casingsand/or seals have deteriorated. The integrity of exist-ing wells should be checked periodically, and aban-doned wells should be properly decommissioned toprevent contamination.
Coalbed Methane Water is also produced in coalbed-methane development. Unlike the brine associatedwith petroleum extraction, this water may be fairlyfresh. In an arid region like the San Juan Basin, suchwater should not be wasted by injecting it into a deepsaline aquifer, as is often done with brine from oilwells. However, water rights must be obtained fromthe state engineer before it can be put to beneficialuse. Work is under way to clarify this issue and devel-op a protocol for beneficial use of produced water.However, much more work is needed on the hydro-logic system(s) involved, water treatment, technologies
FIGURE 2 Generalized flow directions and quality ofwater in the Kirtland Shale/Fruitland Formation, undi-vided. Units shown are in µS/cm.

C H A P T E R O N E
DECISION-MAKERS FIELD GUIDE 2002
38
for reducing the quantities produced and markets forbeneficial use.
Uranium Underground mining of uranium wasonce intense in the Grants mineral belt. Water supplywas not an issue, as the large volumes withdrawn indewatering (the process of pumping water out of themine) from the major uranium-bearing unit (MorrisonFormation) were of good quality and readily metwater needs. Some of the freshest water in the basin isassociated with the Morrison Formation (Fig. 3).However, both water quantity and quality wereimpacted in places. Ground-water modeling showedthat had dewatering continued, water-level declineswould have been felt all the way to the San Juan Riverby the year 2000. Dewatering also lowered artesianpressures such that vertical gradients were locallyreversed (became downward instead of upward), per-mitting poor-quality water in one Cretaceous sand-stone to flow downward into the underlying Jurassicsandstone aquifer containing good-quality water.Although that mining activity has ceased, sizablereserves of uranium remain in the ground. Such
water-quantity impacts will recur should uraniumprices warrant renewed underground mining.However, current interest centers on in situ extraction.The Navajo Nation and environmental groups are stillprotesting the feasibility of such mining, in view of thepotential impact on ground-water quality.
SUMMARY
Ground water and energy development are intimatelyrelated in the San Juan Basin. As a result, there is bothgood news and bad news.
• The good news:1 Ground water is associated with the same rocksas the energy resources, so there may be a readysupply.2 Studies have shown that there are largeamounts of water of moderate quality in variousaquifers, at various depths, in various locations. • The bad news:1 Ground water is associated with the same rocksas the energy resources, so it is vulnerable toquantity and quality impacts.2 Water demands are increasing among the majornon-industrial water users, including Indian reser-vations, municipalities, irrigators, and ranchers.3 As demands of these users along the San JuanRiver and its tributaries grow beyond their presentsurface-water supplies, they will have to look toground-water sources for additional water.4 At that point, energy developers in the SanJuan Basin will be in direct competition forground water with other users.Thoughtful regional planning and frequent environ-
mental surveillance will be essential for sound man-agement and protection of ground water in this multi-ple water-use area. Successful energy development willbe compatible with regional water-use goals.
ADDITIONAL READING
Stone, W. J., 1999, Hydrogeology in practice—a guide to characterizingground-water systems: Prentice Hall, Upper Saddle River, New Jersey,248 pp.
Stone, W. J., 2001, Our water resources—an overview for New Mexicans:New Mexico Bureau of Mines and Mineral Resources, Information Series1, 37 pp.
FIGURE 3 Generalized flow direction and quality of waterin the Morrison Formation.

OILAND NATURAL GAS
ENERGYD E C I S I O N - M A K E R S
F I E L D C O N F E R E N C E 2 0 0 2S a n J u a n B a s i n
C H A P T E R T W O

SAN JUAN BASIN
O I L & N A T U R A L G A S E N E R G Y 41
OIL AND GAS SOURCE ROCKS
Oil and natural gas originate in petroleum sourcerocks. Source rocks are sedimentary rocks that formedfrom sediments deposited in very quiet water, usuallyin swamps on land or in deep marine settings. Theserocks are composed of very small mineral fragments.In between the mineral fragments are the remains oforganic material (usually algae), small wood frag-ments, or pieces of the soft parts of land plants (Fig.2). When these fine grained sediments are buried byyounger, overlying sediments, the increasing heat andpressure resulting from burial turns the soft sedimentsinto hard layers of rock. If further burial ensues, thentemperatures continue to increase. When tempera-tures of organic-rich sedimentary rocks exceed 120° C(250° F), the organic remains within the rocks beginto be “cooked,” and oil and natural gas are expelled. It
Reservoir rock (sandsto
ne)
We will pass through a number of oil and naturalgas fields during this field conference. The oil
and gas that are produced from these fields reside inporous and permeable rocks (reservoirs) in whichthese liquids have collected and accumulated through-out the vast expanse of geologic time. Oil and gasfields are geological features that result from the coin-cident occurrence of four types of geologic features (1)oil and gas source rocks, (2) reservoir beds, (3) sealingbeds, and (4) traps. Each of these features, and therole it plays in the origin and accumulation of oil andgas, is illustrated below (Fig. 1).
takes millions of years for these source rocks to beburied deep enough to attain these maturation tem-peratures. It takes many more millions of years to gen-erate commercial accumulations of oil and natural gas,and for these accumulations to migrate into adjacentreservoir rocks.
The Origin of Oil and Gas
Ron Broadhead, New Mexico Bureau of Geology and Mineral Resources
FIGURE 1 Natural accumulation of oil and gas.
FIGURE 2 Microscopic image of a source rock with mineralgrains (lighter colored material) and organic matter whichis mostly algae remains (brown to black and yellow col-ored material). The source rock will usually act as a seal.
If the organic materials within the source rock aremostly wood fragments, then the primary hydrocar-bon generated upon maturation is natural gas. If theorganic materials are mostly algae or the soft parts ofland plants, then both oil and natural gas are formed.By the time the source rock is buried deep enough toreach temperatures above 150o C (300o F), the organicremains have produced most of the oil they are able toproduce. Above these temperatures, any oil remainingin the source rock or trapped in adjacent reservoirswill be broken down into natural gas. So, gas can begenerated in two ways: it can be generated directlyfrom woody organic matter in the source rocks, or itcan be derived by thermal breakdown of previouslygenerated oils at high temperatures.

C H A P T E R T W O
DECISION-MAKERS FIELD GUIDE 2002
42 O I L & N A T U R A L G A S E N E R G Y
ral gas is 0.12 g/cm3), they rise upward through thewater-saturated pore spaces until they meet a barrierof impermeable rock (Fig. 2)—a seal. Seals generallyare very fine grained rocks with no pore spaces orpore spaces that are too small to permit the entry offluids.
OIL AND GAS TRAPS
Once in the reservoir rock, the oil and natural gascontinue to migrate through the pore spaces until allfurther movement is blocked by the physical arrange-ment of the reservoir rock and one or more seals. Thisarrangement of the reservoir and seals is called a trap(Fig. 1).
There are two main types of traps: structural andstratigraphic (Figs. 4–5). Structural traps are formedwhen the reservoir rock and overlying seal aredeformed by folding or faulting. Usually this deforma-tion takes place tens of millions of years after deposi-tion of the sediments that serve as seals and reservoirrocks. The oil and gas migrate upward through thereservoir and accumulate in the highest part of thestructure (Fig. 4). If both oil and gas are present, thegas will form a layer (within the pore spaces) thatrests above a layer of oil, because natural gas is lessdense than the oil. The layer of oil will, in turn, restupon the water-saturated part of the reservoir.
Stratigraphic traps (Fig. 5) are formed when thereservoir rock is deposited as a discontinuous layer.Seals are deposited beside and on top of the reservoir.A common example of this type of trap, of whichthere are many examples in the San Juan Basin, is acoastal barrier island, formed of an elongate lens of
OIL AND GAS RESERVOIR ROCKS
Oil and gas reservoir rocks are porous and permeable.They contain interconnected passageways of micro-scopic pores or holes between the mineral grains ofthe rock (Fig. 3). When oil and gas are naturallyexpelled from source rocks, they migrate into adjacentreservoir rocks.
FIGURE 3 Microscopic image of a sandstone reservoir rock.The pore spaces (blue) may be occupied by oil, gas, orwater.
FIGURE 4 Folded strata that form a structural trap.
FIGURE 5 A discontinuous layer of sandstone that forms astratigraphic trap.
Once oil and gas enter the reservoir rock, they arerelatively free to move. Most reservoir rocks are initial-ly saturated with saline ground water. Saline groundwater has a density of more than 1.0 g/cm3. Becauseoil and gas are less dense than the ground water (thedensity of oil is 0.82–0.93 g/cm3; the density of natu-
SAN JUAN BASIN
O I L & N A T U R A L G A S E N E R G Y 43
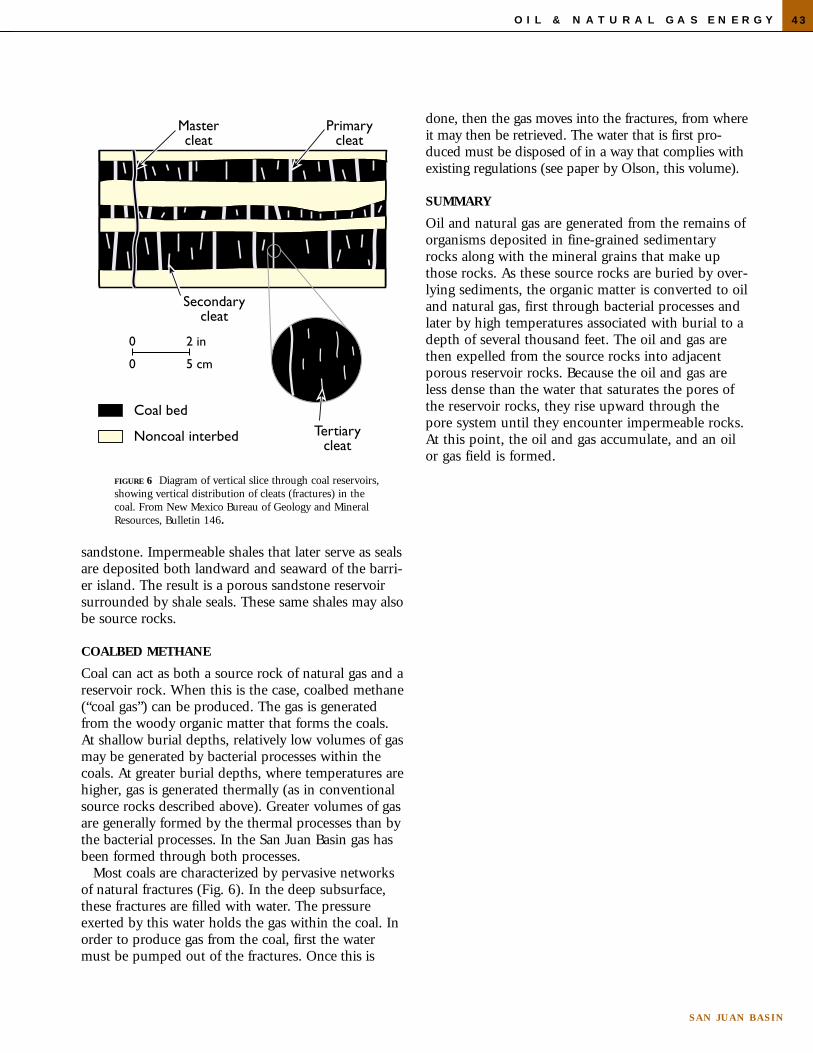
FIGURE 6 Diagram of vertical slice through coal reservoirs,showing vertical distribution of cleats (fractures) in thecoal. From New Mexico Bureau of Geology and MineralResources, Bulletin 146.
sandstone. Impermeable shales that later serve as sealsare deposited both landward and seaward of the barri-er island. The result is a porous sandstone reservoirsurrounded by shale seals. These same shales may alsobe source rocks.
COALBED METHANE
Coal can act as both a source rock of natural gas and areservoir rock. When this is the case, coalbed methane(“coal gas”) can be produced. The gas is generatedfrom the woody organic matter that forms the coals.At shallow burial depths, relatively low volumes of gasmay be generated by bacterial processes within thecoals. At greater burial depths, where temperatures arehigher, gas is generated thermally (as in conventionalsource rocks described above). Greater volumes of gasare generally formed by the thermal processes than bythe bacterial processes. In the San Juan Basin gas hasbeen formed through both processes.
Most coals are characterized by pervasive networksof natural fractures (Fig. 6). In the deep subsurface,these fractures are filled with water. The pressureexerted by this water holds the gas within the coal. Inorder to produce gas from the coal, first the watermust be pumped out of the fractures. Once this is
done, then the gas moves into the fractures, from whereit may then be retrieved. The water that is first pro-duced must be disposed of in a way that complies withexisting regulations (see paper by Olson, this volume).
SUMMARY
Oil and natural gas are generated from the remains oforganisms deposited in fine-grained sedimentaryrocks along with the mineral grains that make upthose rocks. As these source rocks are buried by over-lying sediments, the organic matter is converted to oiland natural gas, first through bacterial processes andlater by high temperatures associated with burial to adepth of several thousand feet. The oil and gas arethen expelled from the source rocks into adjacentporous reservoir rocks. Because the oil and gas areless dense than the water that saturates the pores ofthe reservoir rocks, they rise upward through thepore system until they encounter impermeable rocks.At this point, the oil and gas accumulate, and an oilor gas field is formed.

C H A P T E R T W O
DECISION-MAKERS FIELD GUIDE 2002
44
Since the early 1920s New Mexicans have enjoyedthe benefits of a thriving petroleum (oil and natu-
ral gas) industry that today provides thousands of jobsand hundreds of millions of dollars in state revenues.However, relatively few citizens of the state have abasic understanding of, or appreciation for, the basicelements of petroleum production, processing, trans-portation, and distribution systems required for aviable industry. The “nuts and bolts” referred to hereare the infrastructure and processes required for theindustry to accomplish its job of delivering an endproduct to the consumer market. It is important tounderstand that all of the components of the produc-tion-through-distribution cycle are necessary in orderfor the industry to function and provide the fuels andproducts upon which we rely.
Petroleum industry infrastructure varies significantlydepending upon the raw materials produced and theneeds of the end user. Production in the San JuanBasin is dominated by natural gas, although crude oilis also produced. Production in the Permian Basin ofsoutheastern New Mexico is dominated by crude oil,but natural gas production is also significant (seepaper by Laird Graeser in this volume). End con-sumers are found all over the Southwest, withCalifornia being an important market, particularly fornatural gas. This article will focus on infrastructure inthe San Juan Basin, but common to the “oil patch” ingeneral.
WHAT ARE OIL AND NATURAL GAS?
Natural gas and crude oil naturally reside in under-ground reservoirs. Crude oil, typically liquid at sur-face temperature and pressure, is a complex mix ofhydrocarbon molecules (molecules that containhydrogen and carbon) and non-hydrocarbon mole-cules. Crude oil in the reservoir often contains lighthydrocarbons in solution that bubble out of the oil asnatural gas at the surface (sometimes called “casing-head gas”). San Juan Basin oil reservoirs tend to havea significant amount of associated gas. In fact, todaythe gas from these wells is more volumetrically andeconomically significant than the oil. Oil-producingreservoirs in the San Juan Basin are limited to the
flanks of the basin, whereas basin-center reservoirs aregas productive. Both crude oil and natural gas must berefined to yield the varied fuels and petrochemicalsthat we consume.
Gas in its natural state is somewhat different fromthe natural gas we consume, and it may or may not beassociated with oil. As produced at the wellhead, nat-ural gas is a mixture of light hydrocarbons includingmethane, ethane, propane, and butane. It also maycontain variable amounts of nitrogen, carbon dioxide,hydrogen sulfide, and perhaps traces of other gaseslike helium. Condensate (a.k.a. “drip gas”) is a lightoil byproduct of cooling natural gas as it rises to thesurface in the well. More than half of the natural gasproduced in the San Juan Basin is from coalbedmethane (CBM). CBM is a simpler mix of methaneand carbon dioxide. Gas that is transported in majorinterstate pipelines and sold as burner-tip fuel forheating is almost all methane, with a heating value of1,000 BTU per mmcf, where BTU stands for BritishThermal Units and mmcf stands for million cubic feetof gas. This “standard” gas is what we rely upon asconsumers. In order to produce standard gas, non-methane hydrocarbons (that increase BTU value), andnon-hydrocarbons (that decrease BTU value) must beremoved from the gas stream.
UPSTREAM AND DOWNSTREAM
The terms “upstream” and “downstream” are often heard,but what do they mean? Upstream operations are thosethat involve extracting crude oil or natural gas from a nat-ural underground reservoir and delivering it to a pointnear the well site, such as an oil tank or gas meter. Fromhere it is sold by independent producers to refiners orpipeline companies who may or may not be the ultimatemarketers of the product. Downstream operations arethose that include gathering, transporting, and processingof the oil or natural gas and distributing the final prod-ucts, including standard natural gas and refined productslike gasoline. A variety of processes and equipment arerequired in the upstream and downstream industries.Each step of the production-to-distribution cycle tends tocreate added value and employs skilled workers in well-paying New Mexico-based jobs.
The “Nuts and Bolts” of New Mexico’s Oil and Gas Industry
Brian S. Brister, New Mexico Bureau of Geology and Mineral Resources

SAN JUAN BASIN
O I L & N A T U R A L G A S E N E R G Y 45
UPSTREAM INFRASTRUCTURE
Although many companies continue to explore fornew reservoirs, New Mexico is generally considered tobe a “mature” petroleum province, in that a largenumber of reservoirs have been found and developedto full production potential. For this reason, there isextensive upstream infrastructure in the producingNew Mexico counties. At one time these producingfields were the assets of major integrated oil compa-nies, but today these fields have been largely divestedto smaller independent producers, many of whom areheadquartered here in New Mexico. Associated withthese fields are the easily recognized pumpjacks andtank batteries (row of tanks) that dot our landscape.But there is more there than meets the eye. Figure 1illustrates typical upstream equipment associated withindividual or small clusters of wells.
Below the surface of the ground at each well, there aremiles of steel alloy well casing designed to withstand the
heat and pressure encountered in the undergroundenvironment, carefully treated to withstand a corrosiveenvironment and remain functional through the pre-dicted life of the field. Two or more casing strings areinstalled in each well, cemented into the drill hole inorder to prevent contamination of fresh water andmixing of fluids between porous formations. Withinthe production casing is a string of production tubing,which conveys reservoir fluids to the surface. Wheregas is produced, the gas flows under its own pressureup the tubing. In wells where liquids are produced, adownhole pump, driven by the pumpjack at the sur-face alternately raising and lowering a single string ofinterconnected solid rods, acts as a plunger to lift theliquid to the surface.
At the surface the wellhead caps the casing and tubingand directs the produced fluids toward temporary stor-age. Wellheads on gas wells, commonly called“Christmas trees,” typically stand tall in order to provide
FIGURE 1 Upstream infrastructure of oil and naturalgas production.

C H A P T E R T W O
DECISION-MAKERS FIELD GUIDE 2002
46
working room for servicing the high-pressured well.After leaving the wellhead, the fluids will go to a sepa-rator in order to separate gas from oil and/or waterthat is sometimes produced from the well with thegas. Once separated, the oil flows to an above-groundstorage tank, the water flows to a water tank, and gasflows through a meter and into a pipeline. If water isproduced, there may be equipment nearby to pump itback into the reservoir to maintain reservoir pressureor the water may be trucked or piped to an approvedsubsurface-disposal facility.
DOWNSTREAM INFRASTRUCTURE
Downstream infrastructure includes a complex net-work of transportation, processing and refining, stor-age, delivery, and sales networks that span the conti-nent.
In the San Juan Basin, oil is typically collected at ornear the well site from the tank battery and trucked toa pipeline terminal, although some 20% is truckeddirectly to the refinery. Some larger fields may deliveroil directly to a pipeline. Either way, much of thecrude oil arrives at a refinery (for example, the GiantIndustries, Inc. Bloomfield refinery) via pipelinewhere it is then temporarily stored in above-ground
tanks in a tank farm. The largest tanks may hold sev-eral million gallons.
The refinery processes the oil to create familiar endproducts such as gasoline, diesel, jet fuel, kerosene,lubricating oil, asphalt, and petrochemical feedstocks.Processes such as distillation and catalysis essentially“crack” the complex and heavy hydrocarbon mole-cules in the oil to create the various products. Thereforming process creates desirable molecules follow-ing cracking, generally to increase octane of the gaso-line fraction. Unwanted parts of the crude oil, such assulfur, are removed in the scrubbing process.
The primary product of most refineries is trans-portation fuel, which is stored at the refinery tankfarm awaiting shipment via product pipeline or trucktransport to tank farms at distribution terminals nearlarger cities. These terminals are the hub for trucktransportation to retail outlets.
Due to the low dollar value per volume of naturalgas, trucking is not a viable option for transporting it;it must therefore be transported by pipeline. Theprocesses and related infrastructure for gas productioncan be summarized in key components shown inFigure 2. Gas is compressible; as it is stuffed into asmaller space, its pressure rises. On the other hand, aspressure is reduced, it expands. This useful property
FIGURE 2 Downstream natural gas infrastructure.

SAN JUAN BASIN
O I L & N A T U R A L G A S E N E R G Y 47
provides the mechanism for gas to flow from onepoint to another (from high to low pressure) throughthe pipeline system. San Juan Basin gas wells producerelatively low-pressure gas that must undergo severalstages of compression (pressure increase) upon leavingthe well site gas meter. A gathering system of pipelinestransports the gas to a central hub, where the gas iscompressed before entering the next pipeline stage.
At strategic points along the pipeline system, butgenerally before it enters an interstate pipeline, the gasis processed at a gas plant (such as the Williams FieldServices gas plant at Lybrook, New Mexico) to sepa-rate certain natural components from the standardquality “residue” gas desirable for interstate transportand distribution. The chemical characteristics of thegas produced at the well determine the processing thatwill take place. For example, if the natural gas is rela-tively high in carbon dioxide, as is typical for coalbedmethane, an extraction facility uses an exothermic(heating) chemical reaction to extract the offendingcomponent. In this example, not only is the BTUvalue of the gas upgraded, but a corrosive componentis removed, thus protecting the integrity of the inter-state pipeline. Natural gas produced from convention-al (non-coalbed methane) reservoirs tends to be richin ethane, butane, and propane. These hydrocarbonsare extracted through a cryogenic (cooling) process.Butane and propane are the components of LPG orliquefied petroleum gas (which stays liquid whilepressurized) used as a natural gas substitute in areasnot served by the natural gas pipeline system.
Once standard natural gas enters the interstatetransportation pipeline system, it may move throughseveral hubs. Along the way, gas may be temporarilystored at strategic places in underground salt cavernsor old gas fields in order to meet seasons of peakdemand. Gas is eventually delivered to a utility, whichthen delivers the gas through a distribution pipelinenetwork to the consumer. Typically, natural gaschanges ownership multiple times along the gathering,transportation, and distribution system.
WHAT DOES THE FUTURE HOLD?
The role of new and evolving technologies shouldnever be discounted. We are ever more creative inimproving the efficiency of our fossil fuel energy infra-structure. Such efficiencies are designed to extractmore value from the raw material. Automation, safetyimprovements, and improved environmental compli-ance are on the forefront of engineering research. Inthe future the uses of oil and natural gas will likelychange. A new trend is the increasing use of low-emis-sion natural gas turbines to generate electricity duringpeak demand. Natural gas-based fuel cells poweringportable electric motors may one day replace the gaso-line-fueled internal combustion engine as the trans-portation engine of choice. Future improvements inprocesses and minimization of environmental impactswill ensure that New Mexico’s home-grown oil and gasindustry will continue to provide responsibly for theneeds of New Mexico and the Southwest for manydecades to come.

C H A P T E R T W O
DECISION-MAKERS FIELD GUIDE 2002
48
It has been said, “if you live in New Mexico, you’re inthe oil and gas business.” This “old saw” has tradi-
tionally been undeniably true, and is, to this day, moretrue than generally held. The “oil patch” extends overfour counties in the northwest part of the state, fourcounties in the southeast, and portions of four othercounties elsewhere in the state (Fig. 1). The impacts ofthe industry on air and water quality, the environment,state and local revenues, and the overall state economyare pervasive. The values of crude oil and natural gasproduction are strongly linked to state-wide employ-ment and the gross state product. Direct and indirectlinks simultaneously can be demonstrated with respectto state and local revenues – primarily gross receipts taxrevenue. However, the purpose of this paper is to pres-ent a survey, not a detailed econometric analysis ofthese linkages.
PRODUCTION VOLUMES AND VALUES
price caused a relatively strong change in gas value.The production response for the San Juan andPermian Basins is revealing (Fig.3). It is apparent thatthe production response in the San Juan—with itscurrent emphasis on the exploration and productionof coal seam gas—is very different than in thePermian. In neither basin, however, is the productionresponse clearly dependent on price.
A similar interpretation can be posited for crude oilproduction and volume. Before the first oil embargo of
The Oil and Gas Industry in New Mexico—An Economic Perspective
Laird Graeser, Independent Tax Consultant
FIGURE 1 The oil patch in New Mexico (by county).
Note that over a long period of time, there does notappear to be a predictable relationship between gasprice and gas volume (Fig. 2a). The lagging pricechange ten years after changes in volume is clearlyspurious and not causal. On the other hand, plottinggas value (volume times price) in logarithmic termsshows that gas price drives the total value of gas, asshould be expected (Fig. 2b). The other thing to noteis that this strong link between gas value and gas pricechanged dramatically in 1972, at the time of the firstoil embargo. At that time, strong increases in gas pricewere accompanied by decreases in gas volume, withcorresponding modest increases in total value.Earlier—before about 1955—small changes in gas
FIGURE 2A New Mexico gas production volume and gasprice over time.
FIGURE 2B New Mexico gas production value and gasprice over time.
1972–73, oil volumes were moderately responsive tochanges in oil price (Fig. 4). After a decade-long re-equi-libration, oil volumes from the early 1980s to the pres-ent became quite responsive to price changes.
San Juan Basin Permian Basin Other(northwest NM) (southeast NM)
McKinley (gas & oil) Chaves (gas & oil) Colfax (gas)
San Juan (gas & oil) Eddy (gas & oil) Harding (CO2)
Sandoval (gas & oil) Lea (gas & oil) Quay (CO2)
Rio Arriba (gas & oil) Roosevelt (gas & oil) Union (CO2)

SAN JUAN BASIN
O I L & N A T U R A L G A S E N E R G Y 49
STATE AND LOCAL TAX REVENUE
Energy in its various forms—crude oil, refined gaso-line, natural gas, and electricity—has been a dispro-portionate candidate for taxation. Currently, there aresix taxes imposed directly on oil and gas extractionand processing (Fig. 5):
1 Oil and Gas Severance Tax2 Conservation (and Reclamation) Tax3 Emergency School Tax4 Oil and Gas Ad Valorem Production Tax5 Natural Gas Processors Tax6 Oil and Gas Ad Valorem Equipment Tax
Unfortunately, because of the complexity of deduc-tions and rates, it is difficult to determine an effectivetax rate on sales or production value without a greatdeal of work and assumptions about price. Some ofthe taxes historically have been specific excises, basedon volume, not value. Other taxes are based on salesvalue, but these allow significant deductions fromsales value to determine production (wellhead) value.The two ad valorem property taxes have a complicat-ed rate structure dependent upon location of produc-tion. Further complicating the calculation is the recentproliferation of contingent tax rates and economicdevelopment incentives expressed in rates and base.The details of the taxes are discussed below.
In addition to the taxes enumerated here, oil andgas well servicing and well drilling are consideredconstruction services and subject to the gross receiptstax. In addition, multi-state and multinational corpo-rations produce and market most of New Mexico’s oiland gas. These corporations pay corporate income taxto New Mexico on apportioned net profit.
1 OIL AND GAS SEVERANCE TAX
A severance tax is imposed on all oil, natural gas orliquid hydrocarbons, and on carbon dioxide severedfrom the ground and sold. The tax is based on salesvalue. The tax rate is 3.75% of the sales price at ornear the wellhead on oil, carbon dioxide, other liquidhydrocarbons, and natural gas. An “enhanced oilrecovery” tax rate of 1.875% is applied to oil pro-duced from new wells using qualified enhanced-recovery methods. Before January 1, 1994, only car-bon dioxide projects qualified. Thereafter anysecondary or tertiary method could be used. Thelower rate applies to production for the first five orseven years after bringing the enhanced project intoproduction.
FIGURE 3 New Mexico gas production by basin.
FIGURE 4A New Mexico oil production value and oilprice over time.
FIGURE 4B New Mexico oil production value and oilprice over time.
In 1995 a 50% credit was authorized for projectsapproved by the Oil Conservation Division thatrestore non-producing wells to production, or thatincrease the production from currently producingwells. Originally, qualification for the credit required a

C H A P T E R T W O
DECISION-MAKERS FIELD GUIDE 2002
50
well to have been shut in for a specific two-year peri-od. In 1999 the credit was extended to any well shutin for a period of two years beginning on or after1/1/93.
In 1995 an “intergovernmental oil and gas tax cred-it” was enacted to ameliorate dual taxation of oil andgas production on Indian lands. The credit is againststate production taxes for taxes paid to Indian tribeson production from new wells drilled on Indian landafter June 30, 1995. The credit amount is the smallerof 75% of the Indian production taxes or 75% of thestate production tax.
In 1999 several severance tax incentives were provid-ed to oil and gas producers hard hit by a severe oilprice slump. The Marginal Wells Conditional TaxReduction provides either a 50% or a 25% reduction inboth oil and gas severance tax and oil and gas emer-gency school tax to stripper wells when prices are low.Stripper wells are oil wells that have been certified bythe Oil Conservation Division to have produced lessthan 10 barrels per day in the previous calendar yearand natural gas wells certified to have produced lessthan 60 mcf per day in the previous calendar year.
Special price-contingent oil and gas severance taxrates were also enacted in 1999. When prices are at orbelow $15 per barrel for oil or $1.15 per mcf of natu-
ral gas, the oil and gas severance tax rate is 1.875%. A2.8125% rate applies when prices are more than $15but not more than $18 per barrel for oil or more than$1.15 but not more than $1.35 per mcf for natural gas.
The severance tax is distributed to the state sever-ance tax bonding fund, with any excess after meetingseverance tax bonding fund obligations being distrib-uted to the severance tax permanent fund.
2 OIL AND GAS CONSERVATION TAX
A conservation tax is levied on the sale of all oil, natu-ral gas, liquid hydrocarbons, carbon dioxide, urani-um, coal, and geothermal energy severed from the soilof the state. The measure of the tax is 0.18% or 0.19%of the taxable value of products (sales price lessdeductions for state, federal, and Indian royalties),depending on the balance in the oil and gas reclama-tion fund. If the balance in that fund is over $1 mil-lion, the lower rate goes into effect. Tax is due on the25th day of the second month after the close of themonth in which the taxable event took place. SinceJuly 1991 a monthly advance payment of conservationtax has been required from high-volume producers.Proceeds from the tax are distributed to the state gen-eral fund and the oil and gas reclamation fund.
FIGURE 5 Oil and gas tax collections. Source: Taxation andRevenue Department records provided by Tax Research and
Statistics Office.
Fiscal year 1996 1997 1998 1999 2000 2001 est.
OIL:
Volume (million Bbls) 74.69 74.05 72.43 66.32 67.72 71.04Value ($) $1,338.30 $1,571.30 $1,148.20 $832.40 $1,648.30 $1,390.70 Derived price ($/Bbl) $17.92 $21.22 $15.85 $12.55 $24.34 $19.58
NATURAL GAS:
Volume (Bcf) 1,506 1,575 1,619 1,606 1,628 1,623Value ($) $2,133 $3,350 $3,349 $2,737 $4,142 $6,255Derived price ($/mcf) $1.42 $2.13 $2.07 $1.70 $2.54 $3.85
TAX COLLECTIONS (in million $):Oil & gas:
O & g severance tax $105.91 $153.34 $152.15 $106.36 $165.13 $315.58 Conservation tax (o & g only) $5.05 $7.47 $8.04 $5.44 $8.68 $16.46 Emergency school tax $102.22 $151.36 $153.68 $107.85 $169.51 $329.03 Ad valorem:
O & G production tax $1.79 $3.04 $2.83 $2.01 $3.41 $6.54 General obligation bond
fundCounty treasurers $26.25 $39.40 $38.55 $27.62 $45.52 $83.82
Natural gas processors tax $24.57 $13.89 $12.84 $11.28 $12.26 $12.11 O & g equipment tax
General obligation bond fund $0.38 $0.41 $0.51 $0.60 $0.46 $0.58 County treasurers $5.50 $5.00 $7.20 $8.02 $6.09 $7.26

SAN JUAN BASIN
O I L & N A T U R A L G A S E N E R G Y 51
3 OIL AND GAS EMERGENCY SCHOOL TAX
An emergency school tax is imposed for the privilegeof engaging in the business of severing oil, natural gasor liquid hydrocarbons, and carbon dioxide from NewMexico soil. A 3.15% rate is imposed on the net tax-able value of the products listed, with the exception ofnatural gas, which is taxed at 4%. Net taxable value isdefined as the actual price received for products at theproduction unit, less federal, state, or Indian royaltiesand the cost of transporting oil or gas to the first placeof market. Tax payments are due on the 25th day ofthe second month after the close of the month inwhich the taxable event took place. A monthlyadvance payment equal to the average monthly pay-ment made in the previous year is required from high-volume producers. The school tax is distributed to thestate general fund each month.
In 1999 a non-refundable one-time drilling credit of$15,000 was made available for the first 600 newcrude oil or natural gas wells drilled between January1, 1999, and June 30, 2000. The Marginal WellsConditional Tax Reduction, also enacted in 1999, pro-vides either a 50% or a 25% reduction in both oil andgas severance tax and oil and gas emergency schooltax to stripper wells when prices are low.
Special price-contingent oil and gas emergencyschool tax rates were enacted in 1999. When pricesare at or below $15 per barrel for oil or $1.15 per mcfof natural gas, oil and gas emergency school tax ratesare 1.58% and 2%, respectively. When prices are morethan $15 but not more than $18 per barrel for oil ormore than $1.15 but not more than $1.35 per mcf fornatural gas, oil and gas emergency school tax rates are2.36% and 3%, respectively.
4 OIL AND GAS AD VALOREM PRODUCTION TAX
An ad valorem tax is levied monthly on the sale of alloil, natural gas, liquid hydrocarbons, and carbondioxide severed from the soil of the state. The ad val-orem tax is based on the assessed value of products.The tax rate is the property tax rate for the taxing dis-trict in which products are severed. This rate changesannually, effective each September 1. Assessed value isequivalent to 50% of market value less royalties. Thetax is due on the 25th day of the second month afterthe close of the month in which the taxable eventtook place. A monthly advance payment of ad val-orem tax is required from high-volume producers.The ad valorem tax is distributed monthly to theapplicable property tax beneficiaries, primarily coun-ties and school districts.
5 NATURAL GAS PROCESSOR’S TAX
A natural gas processor’s privilege tax is levied onprocessors based on the value of products processed.Before July 1, 1998, the tax rate was 0.45% of thevalue of the products processed. In 1998 landmarklegislation, the tax was totally revamped, with taximposition being shifted entirely to the processingplants. Tax is measured by the heating content of nat-ural gas at the plant’s inlet, measured in million BritishThermal Units (mmbtu). The rate is set initially at$.0065 per mmbtu but will be adjusted every July 1.The adjustment factor is equal to the average value ofnatural gas produced in New Mexico the precedingcalendar year divided by $1.33. The rate startingJanuary 1, 1999, will be similarly adjusted. Newdeductions are added for gas legally flared or lostthrough plant malfunction. Deductions for the valueof products sold to any federal or New Mexico gov-ernmental unit or any non-profit hospital, religious, orcharitable organization when such products are usedin the conduct of their regular functions wererepealed.
The natural gas processor’s tax is due within 25 daysfollowing the end of each calendar month in whichsales occurred. A monthly advance payment of proces-sor’s tax is required from high-volume producers.Revenue is distributed to the state general fund.
6 OIL AND GAS AD VALOREM EQUIPMENT TAX
An ad valorem tax is levied annually on assessed valueof equipment used at each production unit. Assessedvalue is equivalent to 9% of the previous calendar yearsales value of the product of each production unit.The tax rate is the certified property tax rate for thetaxing district in which products are severed.
The Taxation and Revenue Department is requiredto prepare a tax statement on or before October 15.Payment is due on November 30. The productionequipment tax is distributed to property tax benefici-aries, primarily counties and school districts.
IMPACT OF OIL AND GAS PRODUCTION ON THESTATE’S ECONOMY
Roughly 6% of New Mexico’s Gross State Product(GSP) is attributable to production of oil and gas inthe state. Oil and gas production contributes anunusually large amount to Gross State Product with aminimal contribution to value added from wages andsalaries (and proprietorship profit). For the averageindustry, 39% of production value is used to pay
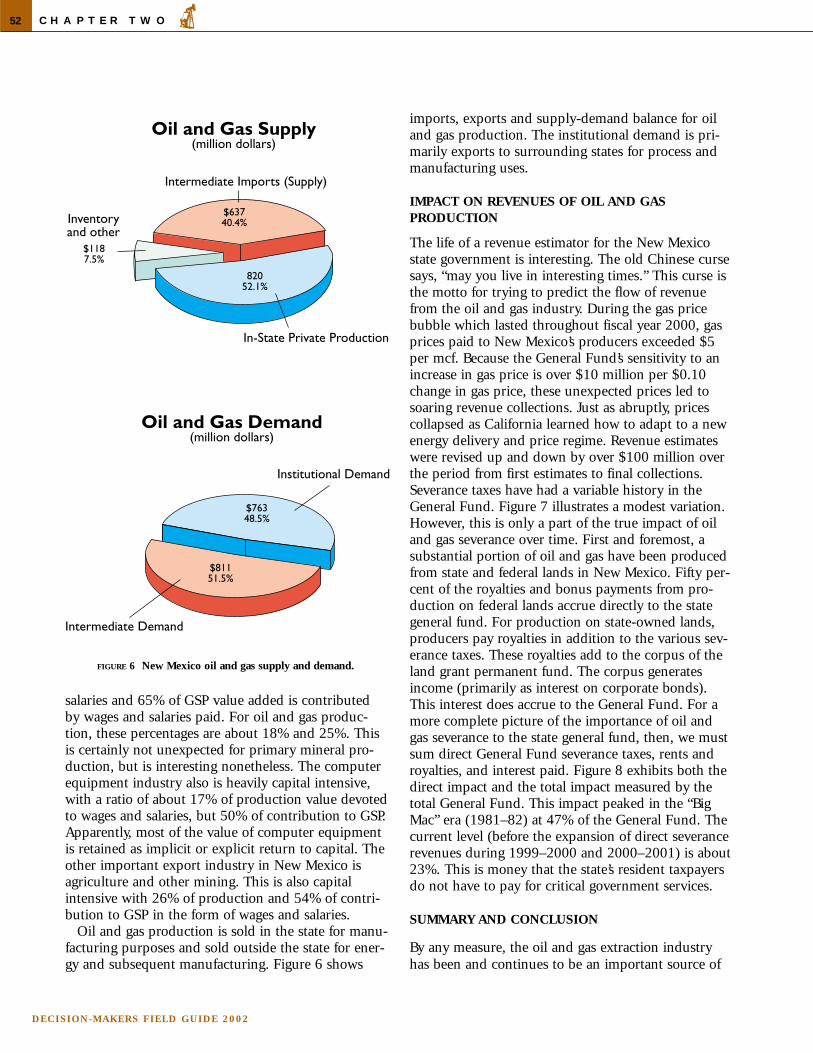
C H A P T E R T W O
DECISION-MAKERS FIELD GUIDE 2002
52
imports, exports and supply-demand balance for oiland gas production. The institutional demand is pri-marily exports to surrounding states for process andmanufacturing uses.
IMPACT ON REVENUES OF OIL AND GASPRODUCTION
The life of a revenue estimator for the New Mexicostate government is interesting. The old Chinese cursesays, “may you live in interesting times.” This curse isthe motto for trying to predict the flow of revenuefrom the oil and gas industry. During the gas pricebubble which lasted throughout fiscal year 2000, gasprices paid to New Mexico’s producers exceeded $5per mcf. Because the General Fund’s sensitivity to anincrease in gas price is over $10 million per $0.10change in gas price, these unexpected prices led tosoaring revenue collections. Just as abruptly, pricescollapsed as California learned how to adapt to a newenergy delivery and price regime. Revenue estimateswere revised up and down by over $100 million overthe period from first estimates to final collections.Severance taxes have had a variable history in theGeneral Fund. Figure 7 illustrates a modest variation.However, this is only a part of the true impact of oiland gas severance over time. First and foremost, asubstantial portion of oil and gas have been producedfrom state and federal lands in New Mexico. Fifty per-cent of the royalties and bonus payments from pro-duction on federal lands accrue directly to the stategeneral fund. For production on state-owned lands,producers pay royalties in addition to the various sev-erance taxes. These royalties add to the corpus of theland grant permanent fund. The corpus generatesincome (primarily as interest on corporate bonds).This interest does accrue to the General Fund. For amore complete picture of the importance of oil andgas severance to the state general fund, then, we mustsum direct General Fund severance taxes, rents androyalties, and interest paid. Figure 8 exhibits both thedirect impact and the total impact measured by thetotal General Fund. This impact peaked in the “BigMac” era (1981–82) at 47% of the General Fund. Thecurrent level (before the expansion of direct severancerevenues during 1999–2000 and 2000–2001) is about23%. This is money that the state’s resident taxpayersdo not have to pay for critical government services.
SUMMARY AND CONCLUSION
By any measure, the oil and gas extraction industryhas been and continues to be an important source of
FIGURE 6 New Mexico oil and gas supply and demand.
salaries and 65% of GSP value added is contributedby wages and salaries paid. For oil and gas produc-tion, these percentages are about 18% and 25%. Thisis certainly not unexpected for primary mineral pro-duction, but is interesting nonetheless. The computerequipment industry also is heavily capital intensive,with a ratio of about 17% of production value devotedto wages and salaries, but 50% of contribution to GSP.Apparently, most of the value of computer equipmentis retained as implicit or explicit return to capital. Theother important export industry in New Mexico isagriculture and other mining. This is also capitalintensive with 26% of production and 54% of contri-bution to GSP in the form of wages and salaries.
Oil and gas production is sold in the state for manu-facturing purposes and sold outside the state for ener-gy and subsequent manufacturing. Figure 6 shows

SAN JUAN BASIN
O I L & N A T U R A L G A S E N E R G Y 53
revenues to state and local governments; an importantsource of employment, although for a declining num-ber of workers; and a generator of production value
model of energy deregulation, power will be producedin New Mexico with a combination of improved coalburning, base load generating plants and peak load gas
turbine plants located close to thesource of natural gas. With eithervariant, New Mexico’s place in theenergy production future of thewestern United States is assured.However, state policymakers mustconstantly check that tax, environ-mental, and employment laws andregulations to not unduly dampenthe apparently bright future for thestate.
A number of sources of informa-tion have been tapped for thisreport. In some cases, the data areold and at least partially defective.At minimum, the state should investwhatever money is required to haveaccess to the best, most timely, andaccurate data and analysis available.New Mexico’s energy future is not socertain that the state can afford totake its eye off the ball.
FIGURE 8 General Fund Revenues—severance taxes,rents and royalties, interest by amount and percent of allgeneral fund revenues.
helping to sustain New Mexico’s economy. There con-tinues to be a great deal of validity to the phrase thatopened this paper, “if you live in New Mexico, you’rein the oil and gas business.” The industry is still prettyhealthy and will continue to prosper, no matter whatthe energy future of the United States. Under a balka-nized model of energy deregulation, each of the west-ern states will license a number of high-efficiency nat-ural gas turbines. The operators of these newgenerating plants will buy all the natural gas the statecan produce. New fields are ready to come on line andproduce for years to come. Under an energy-province
FIGURE 7 General Fund Revenues—severance taxes byamount and percent of all general fund revenues.
C H A P T E R T W O
DECISION-MAKERS FIELD GUIDE 2002
54
The Oil Conservation Division (OCD) is the onlystate regulatory agency other than the New
Mexico Environment Department (NMED) thatadministers several wide-ranging water quality protec-tion programs. Some of these programs were devel-oped and remain separate from the state’s WaterQuality Act, which, until the advent of various federalprograms, controlled other discharges to groundwater. Among the discharges regulated by OCD aresurface and underground disposal of water and wastesproduced concurrently with oil, natural gas, and car-bon dioxide; waste drilling fluids and muds; andwastes at crude oil recovery facilities, oil field servicecompanies, refineries, and natural gas plants and com-pressor stations. Many of these activities are regulatedunder the New Mexico Oil and Gas Act, whichauthorizes the OCD to set requirements for properdrilling, completion, plugging, and abandonment ofwells. Additional authority is granted OCD under theNew Mexico Geothermal Resources Act, and underadministrative delegation as a constituent agency ofthe Water Quality Control Commission under theNew Mexico Water Quality Act. Below is a summaryof the impact of these legislative acts.
OIL AND GAS ACT
When the New Mexico Oil and Gas Act created theOil Conservation Commission in 1935, it authorizedrulemaking for prevention of waste and to protect cor-relative rights, but it did not specifically address fresh-water protection. However, the original act did requirethat dry or abandoned wells be plugged in such a wayas to confine fluids to their existing zones. Underthese and other provisions of the statute, the OCDadopted rules regarding drilling, casing, cementing,and abandonment of wells. These activities by them-selves provide some freshwater protection.
In 1961 the Oil and Gas Act was amended to allowthe OCD to make rules protecting freshwater from thedisposal of drilling and production waters. Under the1961 amendments, the state engineer designateswhich water is to be protected. Currently, protection isafforded all surface and groundwater having 10,000mg/l or less total dissolved solids (TDS), and all sur-face water having over 10,000 mg/l TDS that impactsprotectable ground water.
Under the Oil and Gas Act, statewide regulationscan be adopted after notice and hearing. Rules specificto a particular practice, operator, or geographic areamay also be issued as the OCD orders. When an orderis approved for a specific operator, it serves as a per-mit. Using one or the other of these methods, OCDadministers requirements for underground injection ofproduced waters and nonhazardous production fluids,for surface disposal of such fluids, and for disposal ofnon-recoverable waste oils and sludges from oil pro-duction and treating plants.
WATER QUALITY ACT
The New Mexico Water Quality Act provides thestatutory authority to OCD for environmental regula-tion of downstream facilities such as refineries, naturalgas plants and compressor stations, crude oil pumpstations, and oil field service companies. Discharges togroundwater at these facilities are controlled underWater Quality Control Commission (WQCC) regula-tions. As a constituent agency of the WQCC, OCD hasbeen delegated authority to administer the regulationsat these facilities and at geothermal operations. Statewater quality regulations at other non-oil field facili-ties are administered by the New Mexico EnvironmentDepartment.
The New Mexico Water Quality Act specifically pro-hibits the WQCC from exercising concurrent jurisdic-
Environmental Regulation of the Oil and GasIndustry in New Mexico
William C. Olson, Oil Conservation DivisionEnergy, Minerals, and Natural Resources Department
Act Number Year passed Year amendedNew Mexico Water Quality Act 74-6-l through 74-6-17, NMSA 1978 1967 1978
New Mexico Oil and Gas Act 70-2-1 through 70-2-38, NMSA 1978 1935 1978
Geothermal Resources Act 71-5-1 through 71-5-24, NMSA 1978 1975 1978

SAN JUAN BASIN
O I L & N A T U R A L G A S E N E R G Y 55
tion over oil and gas production activities that maycause water pollution and are regulated by the OCDthrough the Oil and Gas Act. The delegation to OCDof WQCC authority effectively eliminates this conflict,because the same staff administer both sets of regula-tions, applying whichever is applicable to the regulat-ed facility.
GEOTHERMAL RESOURCES ACT
Regulations adopted under the Geothermal ResourcesAct (71-5-1 through 71-5-24, NMSA 1978) are similarto those of the Oil and Gas Act. Its provisions controldrilling, casing, and cementing of geothermal wells.Production volume of geothermal fluids is also regu-lated so that the geothermal reservoirs will not bedepleted or unfairly appropriated by a particular user.The act and its regulations specify that activities beconducted in a manner such that human health andthe environment are afforded maximum reasonableprotection, and that disposal of produced waters be insuch a manner so as not to constitute a hazard to use-able surface or underground waters.
Unlike the Oil and Gas Act, the GeothermalResource Act has a clause allowing concurrent juris-diction with other state regulatory agencies. Thismeans that WQCC regulations are also applicable.Again, these responsibilities have been delegated tothe OCD; in practice only storage and disposal ofgeothermal fluids is currently being regulated via dis-charge permits. Other operational aspects (drilling andproduction) are covered through permits issued underthe Geothermal Resources Act.
IMPLEMENTATION
Environmental activities are implemented by the OilConservation Division’s Santa Fe office and four dis-trict offices. In addition to matters related to oil andgas production, the Santa Fe office staff process,approve, or set hearings on applications for (1) surfacedisposal or underground injection of salt water, (2)water flooding used in secondary oil recovery or pres-sure maintenance, and (3) surface treatment and dis-posal facilities. The above activities, with the excep-tion of surface disposal and waste oil recovery/treatingplant applications, are performed by OCD’s petroleumengineers. Those exceptions are reviewed by OCDEnvironmental Bureau staff. OCD EnvironmentalBureau staff also provide valuable input and guidancein the application process, especially with regard topossible impacts on groundwater from production andunderground injection.
The OCD Environmental Bureau, formed in 1984,performs water protection activities not carried outunder other OCD programs. These activities includepermitting of oil refineries, natural gas plants andcompressor stations, oil field service companies, brineproduction wells, and any other oil field-related dis-charges to ground water. Bureau staff also performinspections and sample at these facilities, investigategroundwater contamination, sample groundwater atdomestic wells and other locations suspected of hav-ing contamination, and supervise groundwatercleanup and remedial actions. The EnvironmentalBureau coordinates OCD environmental programs andresponds to information requests from industry, feder-al and state agencies, and the public. TheEnvironmental Bureau researches, writes, and propos-es additional regulations for freshwater protection tothe Oil Conservation Commission, and the bureauprepares and updates guidelines to assist industry incomplying with regulatory requirements. TheEnvironmental Bureau performs these activities with astaff of seven: two hydrologists, a petroleum engineer,a chemical engineer, an environmental engineer, andtwo geologists.
Daily activities performed by OCD district staff pro-vide protection for freshwater from field productionactivities. All permits to drill, complete, work-over,and plug oil, gas, and injection wells are reviewed andapproved by district staff, including a district geolo-gist. The review ensures proper casing and cementingprograms. Field inspectors witness required cementingand testing of production and injection wells andrespond to complaints of possible rule violations.Field inspectors also collect water samples, supervisecleanup of minor spills and leaks, and provide firstresponse to oil and gas related environmental prob-lems.
ENVIRONMENTAL CONCERNS
The state of New Mexico is heavily dependent ongroundwater as a public resource. Approximately 90%of New Mexico’s population depends on groundwateraquifers as a source of domestic water. Consequently,the OCD Environmental Bureau has concentrated itsefforts on preventing the contamination of freshwaterby oil and gas operations, and resolving groundwatercontamination that results from oil field practices.
New Mexico’s reliance on groundwater makes theenforcement of OCD and WQCC rules and regula-tions an important activity. The costs to the public forloss of freshwater resources, and to industry for reme-

C H A P T E R T W O
DECISION-MAKERS FIELD GUIDE 2002
56
diation of contaminated groundwater, are large.Whereas the costs to industry for preventative meas-ures are not negligible, they are a fraction of thoseincurred in the remediation of contaminated ground-water. The OCD currently has discharge permits formore than 350 oil field facilities, 55 of which haveactive ongoing groundwater remediation projects.Roughly 90% of the cases are the result of disposalpractices that are no longer allowed under currentrules and regulations, such as the use of unlined pitsfor waste disposal. The remaining 10% of these casescan be attributed to leaks and spills during oil and gasproduction operations. Notably, there have been nocases of groundwater contamination from a disposalactivity permitted under the discharge permit pro-gram.
Most of OCD’s efforts are in the area of preventinggroundwater contamination, partly because of the costeffectiveness of this prevention and partly because ofthe need to protect groundwater for future uses.Preventative measures are implemented through theenforcement of regulations and rules requiring dis-charge plans and permits for oil field productionactivities, gas plants, compressor stations, refineries,crude oil pump stations, and other major potentialcontaminant sources. The goal of the permitting sys-tem is to work cooperatively with industry to keepgroundwater contaminants contained, and to providefor early detection and prompt remediation of leaksand spills.
All injection wells, refineries, oil field disposal facili-ties, gas plants, and most mainline compressor sta-tions have approved discharge plans or other opera-tional permits. The OCD is also bringing smaller scalepotential contamination sources under the dischargepermit system, including those at field gas compressorstations, crude oil pump stations, and oil field servicecompanies. Refinery and gas plant permitting is diffi-cult and time consuming, due to the age of severalfacilities and to documented pre-existing contamina-tion at most operating and abandoned sites.Permitting has been facilitated by coordinating reme-diation activities with other agencies, and by separat-ing issues of past contamination and associated reme-dial actions from current groundwater protectiondisposal requirements within the discharge plan.
Groundwater protection measures are also imple-mented by review and revision of OCD rules relatedto disposal of produced water and other oil fieldwastes, as necessary. The first groundwater protectionrules were issued in the early 1960s, when the New
Mexico Oil Conservation Commission banned (withsome exceptions) disposal of produced water inunlined pits in areas of southeastern New Mexico withprotectable fresh waters. Before 1986 no restrictionson direct discharge of oil field-produced water orrelated wastes existed in the San Juan Basin, due bothto the lack of known cases of groundwater contamina-tion, and to the quality of water produced in thebasin. Current OCD rules prohibit discharges tounlined pits in areas vulnerable to groundwater con-tamination in the San Juan Basin.
SUMMARY
The Oil Conservation Division has an ongoing fresh-water protection program staffed by persons knowl-edgeable in several engineering and scientific special-ties needed for proper implementation of theprogram. The division is cognizant of potential con-tamination due to oil and gas activities, and enforcesand revises state rules as necessary to protect thisresource. The OCD will continue to review existingdisposal practices and regulations over time and pro-pose regulatory modifications to protect the state’sgroundwater resources. Current and upcoming issuesthat the OCD is working on include changes in thehydrogen sulfide rules for protection of public health,drafting of rules for on-site waste management, per-mitting of all production pits, and a study of aginginfrastructure.
Proper staffing is always crucial for successful pro-grams, and OCD, like other agencies, has found thatthe demands for services by industry and the publicare sometimes in conflict with budgetary constraintsbrought on by the general economic situation of theoil and gas industry and of the state. Since it adminis-ters many state oil field regulatory programs, OCD isable to tailor and implement these programs in such away as to provide maximum effectiveness with avail-able staff, and with a minimum of bureaucraticrequirements.

SAN JUAN BASIN
O I L & N A T U R A L G A S E N E R G Y 57
The San Juan Basin is one of the most strategic gas-producing basins in the U.S. because of its annual
volume of production and the market it supplies. NewMexico is the third largest natural gas-producing statein the United States. The San Juan Basin contributesapproximately 68% of the natural gas produced annu-ally in the state of New Mexico, or 1.048 trillion cubicfeet. In addition, 3.2 million barrels of oil have beenproduced to date from the basin. The value of thesecommodities in 1999 was $2.46 billion dollars. Theprimary market is the southwestern U.S. The San JuanBasin is California’s largest single source of natural gas.With the sixth largest economy in the world,California looks to natural gas to fuel its growing needfor electric power generation.
Natural gas will continue to be a dominant source ofenergy and income for the state of New Mexico for theforeseeable future. Figure 1 illustrates the total naturalgas reserves by state and region as of January 1, 2000.New Mexico has the third highest reserve base of 15.5trillion cubic feet (Tcf) of gas, of which roughly 80%(12.4 Tcf) is in the San Juan Basin. Reserve revisionsin 1999 added 462 billion cubic feet to the state’sresource.
San Juan Basin gas- and oil-producing reservoirs arewell defined by the 20,000 wells that have beendrilled in this basin. The potential for expansion ofpool boundaries is limited; therefore the main empha-sis in development is infill drilling (increasing thedensity of wells) in existing gas reservoirs to increaserecovery. Infill drilling is necessary in low-permeabili-ty reservoirs where the current spacing between wellsis insufficient to efficiently drain the reservoir.
HISTORICAL DEVELOPMENT OF OIL AND GAS INNEW MEXICO
Initial development in the region began in the early1920s. Early oil discoveries in the Paradox Formationand Dakota Sandstone (Fig. 2) on the western flank ofthe basin were prolific. Natural gas discoveries in theFarmington Sandstone, the Pictured Cliffs Sandstone,and the Mesaverde Group began in the late 1920s.However, there was little development until the late1940s and early 1950s, because of the lack of market
demand. In the late 1940s the Dakota Sandstone wasdeveloped as a “deep” major gas reservoir. In 1951 ElPaso Natural Gas Company completed an interstatepipeline supplying gas to California markets and thusspurred rapid development, particularly of thePictured Cliffs and Mesaverde reservoirs. These playscan be categorized as unconventional, because of theirlow permeability and corresponding low productivitywithout stimulation treatments, which increase reser-voir productivity by improving fluid flow properties.Stimulation has evolved from early completions wherenitroglycerin bombs were dropped into wells, to mod-ern hydraulic fracturing technology.
By the middle to late 1970s, stimulation techniquesand market improvements had progressed to such adegree that the New Mexico Oil ConservationDivision ruled in favor of infill drilling the BlancoMesaverde pool (1975) and Basin Dakota pool (1979)to 160-acre per well spacing. This resulted in a slightincrease in production (Fig. 3). Weak market demandduring the 1980s, however, resulted in no significantdevelopment. The erratic production history reflectsthe repetitive shutting-in of wells during periods ofsub-economic gas prices.
The Fruitland Formation coalbed-methane play in1989 had a significant impact on gas production inthe San Juan Basin. The daily production rate doubledto 3 billion cubic feet with the successful completionof Fruitland coal wells (Fig. 3). At the same time, bothpipeline capacity and market demand were sufficientto sell this additional gas.
In the last several years, reduced well spacing hasbeen considered economically viable. The BlancoMesaverde pool was approved in 1998 for 80-acrespacing, and the Basin Dakota pool is currently beingpilot tested for feasibility of producing at 80-acrespacing. This will capture additional reserves notavailable in 160-acre spaced development and willimprove deliverability from the pools.
The current production rate from the San Juan Basinis approximately 3.0 billion cubic feet per day.Roughly half of this production comes from theFruitland coalbed-methane pool. Fruitland productionhas reached a peak and is beginning to exhibit signs
Foreseeable Development of San JuanBasin Oil and Gas Reservoirs
Thomas W. Engler, New Mexico Institute of Mining and Technology

C H A P T E R T W O
DECISION-MAKERS FIELD GUIDE 2002
58
FIGURE 1 Dry gas proved reserves and production by area(1999). Source: EIA, Office of Oil and Gas. Natural gas pro-
duction by state in trillion cubic feet (1999).

SAN JUAN BASIN
O I L & N A T U R A L G A S E N E R G Y 59
FIGURE 2 Generalized stratigraphy and predicted foreseeabledevelopment of the San Juan Basin, New Mexico.
E r a Sys tem Formation P roduction 20-year predictedd evelopment (no. of wells)
San Jose Formation Gas
Nacimiento Formation Gas 100
Ojo Alamo Sandstone Gas
Kirtland Shale Gas/oil 0Farmington Sandstone
Fruitland Formation Gas 3140
Pictured Cliffs Sandstone Gas 1432
Lewis Shale Gas 4697
Cliff House Sandstone GasMenefee Formation GasPoint Lookout Formation Gas
Upper Mancos Shale/Tocito Sandstone Gas/oil 300Gallup Sandstone/Carlile Shale Gas/oilGreenhorn LimestoneGraneros Shale
Dakota Sandstone Gas/oil 6846
Morrison Formation
Wanakah FormationTodilto Limestone
Entrada Sandstone Oil 80
Chinle Formation
Cutler Formation
Honaker Trail FormationParadox Formation Gas? 20Pinkerton Trail Formation
Molas Formation
Leadville Limestone
Elbert Formation
Ignacio Quartzite
P RECAMBRIAN
CEN
OZ
OIC
ME
SOZ
OIC
Mes
aver
de
Gro
up
Man
cos
Shal
e
TRIASS IC
PALE
OZ
OIC
Her
mos
aF
orm
atio
n
PERMIAN
CAMBRIAN
M I S S I S-S I PP IAN
D E VONIAN
JUR
ASS
ICC
RE
TAC
EO
US
PE
NN
SY
L-V
AN
IAN
TE
RTIA
RY

C H A P T E R T W O
DECISION-MAKERS FIELD GUIDE 2002
60
of declining; therefore, alternative sources of gas needto be found to make up the loss. The other major pro-ducing reservoirs contribute 0.75 (Mesaverde), 0.35(Dakota), and 0.25 (Pictured Cliffs) billion cubic feetper day. Further development of the Mesaverde andDakota reservoirs will yield the best short-term poten-tial for increasing gas recovery and thus maintainingthe deliverability out of the basin.
This change in focus from coal to other formationsreflects the historical trend in development. Duringthe early 1990s the Fruitland coal dominated thedevelopment with approximately 75% of the totalactivity. This rapid development has declined, and theMesaverde Group has recently become the major tar-get of activity.
ment. The methods used to make this determinationconsisted of a review of reservoir characteristics andhistorical production, predictive engineering produc-tion modeling, and presentation of data and conclu-sions in multiple formats including a report, databas-es, and GIS-based map displays (Engler et al., 2001).
For the major producing reservoirs, two approacheswere used to predict development potential. The firstwas a survey of companies operating in the San JuanBasin, obtaining their perspective on future develop-ment based on current reservoir management prac-tices. The second approach applied engineering tech-niques developed by the New Mexico Institute ofMining and Technology to predict optimal infilldrilling in naturally fractured, low-permeability gasreservoirs of the basin.
The study predicted 16,615 totalavailable subsurface completions inthe New Mexico part of the SanJuan Basin over the next twentyyears. (A completion is defined asthe means to effectively communi-cate the wellbore with the reservoirand successfully obtain hydrocar-bons.) These results are subject tothree assumptions: (1) sufficient andexpanding natural gas take-awaycapacity of the pipeline system outof the basin, (2) well abandonmentrate increases of 5% per year, and(3) minimal impact of future explo-ration. Figure 2 (last column) showsthe results by reservoir and includesboth major and minor producingreservoirs, and anticipated emergingand exploratory plays.
A significant reduction in thisnumber of completions will occur as a result ofopportunities for commingling and dual completionof wells. Commingling is an allowed practice of com-bining gas flow from two distinct reservoirs in thesame wellbore. Similarly, dual completion producesgas from two distinct reservoirs in the same wellbore;however, the gas streams are not mixed until each canbe gauged. With an estimated 25% decrease in well-bores, the total number of locations of surface distur-bance becomes 12,461. In other words, multiple com-pletions would reduce the number of locations to bebuilt. This rate equates to an average of 623 wells peryear and is consistent with current activity (approxi-mately 640 wells per year average for 1999 and 2000
FORESEEABLE DEVELOPMENT
In 2001 New Mexico Tech completed a study for theU.S. Bureau of Land Management to estimate foresee-able development in the basin over the next twentyyears. The focus was to determine future reservoirdevelopment (drilling and completion of new wellsand recompletion of old wells) reasonably supportedby geological and engineering evidence, and to esti-mate the associated surface impact of such develop-
FIGURE 3 Total gas production (million cubic feet per day)from the New Mexico portion of the San Juan Basin andthe contribution of the Fruitland Coal to this total.

SAN JUAN BASIN
O I L & N A T U R A L G A S E N E R G Y 61
combined). This rate assumes continuation of a favor-able regulatory environment that supports this level ofdevelopment.
A location density map (number of wells per 36-square-mile township; Fig. 4) illustrates the anticipat-ed distribution of the total number of completions(12,461) after commingling or dual completing. Thetrend of highest predicted activity is approximatelynorthwest to southeast and parallels the trend of theMesaverde and Dakota plays. Federal lands compriseapproximately 80% of the leasehold of the San JuanBasin. Consequently, the total number of locations(12,461) affecting federal lands must be reduced pro-portionately to 9,970. There will also be a need foradditional surface facilities, including pipelines, com-pressors, and processing facilities to recover the gasefficiently and transport it to market.
The role that evolving technology will likely playcannot be over emphasized. We anticipate new andimproved drilling and completion technologies—improved techniques to drill directional and horizon-tal wells, for instance. This would result in increasedgas recovery and a reduction in surface disturbance.Improved completion technologies might includeadvances in stimulation design, equipment, processes,
FIGURE 4 Distribution map of the average number of totallocations (all reservoirs) per square mile averaged overtownship areas.
and materials. Historically, the evolution of stimula-tion has played a key role in development and wellefficiency. Continued advances are anticipated and willbenefit both existing and new wells, and may promotethe commingling of zones, thereby reducing the num-ber of wells to be drilled.
CONCLUSIONS
Significant gas resources are available in the San JuanBasin for years to come, but recovery of these reserveswill require additional development, primarily in theform of infill drilling. Approximately ten thousandwells will be drilled on federally managed lands in thenext twenty years, based on the New Mexico Techstudy. This analysis was confirmed by an industry sur-vey, administered by New Mexico Tech and completedconcurrently with the geologic and engineering study.The San Juan Basin gas supply is important to theU.S. and to the overall economic health of NewMexico. Industry’s continued success in providinglarge quantities of readily available gas, at a reasonableprice, is directly related to decisions made by govern-mental entities. The challenge is to balance oil and gasdevelopment with land use issues and environmentalconcerns.
RESOURCES
Engler, T. W., Brister, B. S., Chen, H. and Teufel, L. W., 2001, Oiland gas resource development for San Juan Basin, New Mexico:A 20-year, Reasonable Foreseeable Development (RFD) scenariosupporting the resource management plan for the FarmingtonField Office, Bureau of Land Management (contact the fieldoffice for a copy of the CD-ROM).
Whitehead, N.H., III, 1993, San Juan Basin [SJ] Plays—Overview:in Atlas of Major Rocky Mountain Gas Reservoirs: New MexicoBureau of Mines and Mineral Resources, Socorro, NM.
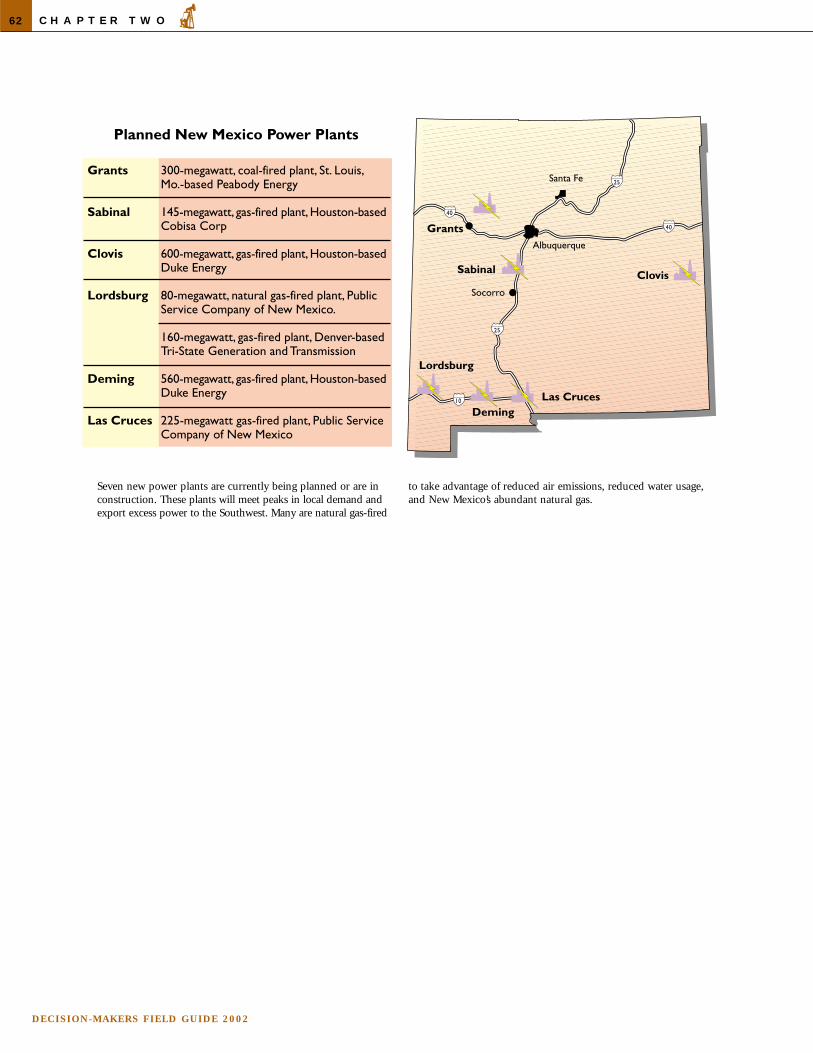
C H A P T E R T W O
DECISION-MAKERS FIELD GUIDE 2002
62
Seven new power plants are currently being planned or are inconstruction. These plants will meet peaks in local demand andexport excess power to the Southwest. Many are natural gas-fired
to take advantage of reduced air emissions, reduced water usage,and New Mexico’s abundant natural gas.


![Geology Hydrocarb Habitat Arab Basin[1]](https://img.pdfslide.us/doc/110x75/54120bd77bef0ab5058b4621/geology-hydrocarb-habitat-arab-basin1.jpg)
