Embed Size (px)
Citation preview
Background Flow Model of Hall Thruster Neutral Ingestion
Jason D. Frieman,∗ Thomas M. Liu,† and Mitchell L. R. Walker‡
Georgia Institute of Technology, Atlanta, Georgia 30332
DOI: 10.2514/1.B36269
The particle-based coupling between background gas flows in vacuum test facilities and neutral ingestion into Hall
effect thrusters is investigated. An analytical model of the facility background flow environment is developed to
accommodate facilities with different geometries and pump placements, as well as compute the ingested flow rate of
background neutrals into a given Hall effect thruster. The ingested flow rates computed by the model are shown to
predict previous empirical datasets taken using the 5 kW P5, the 6 kW H6, and the 1.5 kW SPT-100 Hall effect
thrusters in different test facilities to within the experimental uncertainty. When compared to predictions generated
assuming ingestion by the random flux of neutral particles, the ingested flow rates computed by the background flow
model are shown to be 40 to 70% closer to the empirical measurements without requiring any semiempirical inputs.
It is also shown that the neutral ingestion at a fixed facility pressure can vary by as much as 91%, suggesting that
background pressure magnitude is an insufficient parameter for fully describing neutral ingestion effects. These
results indicate that the developed analytical background flow model is an effective predictive tool for computing
neutral ingestion into Hall effect thrusters.
Nomenclature
Aexit = thruster exit plane area, m2
FS� = mass flow rate crossing surface Smoving in the positivedirection, kg∕s
k = Boltzmann’s constant, J∕Km = molecular mass of the background neutral, kg_m = net mass flow rate of gas, kg∕s_mb = net mass flow rate of bleed gas, mg∕s_ming = ingestion mass flow rate of the background neutrals,
kg∕sn = number density, m−3
nb = background neutral number density, m−3
np = number of active cryopumpsnS = number density of particles crossing surface S, m−3
nS� = total number density of particles crossing surface Smoving in the positive direction, m−3
nS�i = number density of particles of population i crossingsurface S moving in the positive direction, m−3
nS−i = number density of particles of population i crossingsurface S moving in the negative direction, m−3
S = surface area, m2
Sc = chamber cross-sectional area, m2
Spd = total surface area of downstream pump surfaces, m2
Spe = total surface area of end dome pump surfaces, m2
Spu = total surface area of upstream pump surfaces, m2
sd = ratio of total surface area of the downstream pumpsurfaces to the chamber cross-sectional area
se = ratio of total surface area of the end dome pump surfacesto the chamber cross-sectional area
su = ratio of total surface area of the upstream pump surfacesto the chamber cross-sectional area
T = gas temperature, KTb = temperature of the background neutrals, KTi = temperature of particles of population i, KTp = temperature of the pump surface, KTw = temperature of the chamber wall, KVi = thermal-diffusive velocity of particles of population
i, m∕sVs = thermal-diffusive velocity of particles crossing surface
S, m∕sα = pump sticking coefficientΦ = ingestion flux due to random motion of background
neutrals, m−2 ⋅ s
I. Introduction
T HE high specific impulse, thrust efficiency, and thrust densityprovided by Hall effect thrusters (HETs) make them an
appealing choice for use as the primary propulsion system on boardincreasing numbers of near-Earth satellite missions. In addition to thepropellant mass savings offered by these performance attributes,developments in in-space power and the growing Western flightheritage portfolio of HETs have also increasingly made them primecandidates for more ambitious deep space missions [1–3].The interest in these devices has caused a corresponding increase
in the quantity of HET research and testing at numerous vacuumfacilities. Despite the physical similarities among the HETs operatedand characterized at each of these facilities, the wide range of facilitygeometries, sizes, materials, and pumping capacities makes itdifficult for researchers to compare datasets without the inclusion offacility-dependent corrections [4]. It is therefore necessary to developan understanding of how to quantify ground-based vacuum facilityeffects on measured HET operation, thrust performance, and plumecharacterization so that facility-dependent testing artifacts can becorrected for and a facility-independent understanding of HETperformance can be achieved.Existing investigations focused on HET facility effects primarily
focus on the impact of facility backpressure on plume properties anddevice performance. Previous studies have shown that increases infacility pressure result in artificial increases in device thrust andefficiency [5–21]. This observed performance augmentation hasbeen attributed to the ingestion of background neutrals present inthe vacuum facility [5–21]. In this process, background neutrals areentrained by the HET and used as propellant; thus, these neutralsare subsequently ionized and accelerated upon being ingested, butthey are not accounted for as part of the anode flow rate directlysupplied to theHET [5–21]. Inmany of these previous investigations,the entrainment of background neutrals is treated as the result of therandom flux of these neutrals across the exit plane of the thruster
Received 23March 2016; revision received 16 October 2016; accepted forpublication 31 October 2016; published online 30 January 2017. Copyright© 2016 by Jason David Frieman. Published by the American Institute ofAeronautics and Astronautics, Inc., with permission. All requests forcopying and permission to reprint should be submitted to CCC atwww.copyright.com; employ the ISSN 0748-4658 (print) or 1533-3876(online) to initiate your request. See also AIAA Rights and Permissionswww.aiaa.org/randp.
*Graduate Research Assistant, Aerospace Engineering, High-PowerElectric Propulsion Laboratory; [email protected]. Student MemberAIAA.
†Research Engineer II, Aerospace Engineering, High-Power ElectricPropulsion Laboratory; [email protected]. Member AIAA.
‡Associate Professor, Aerospace Engineering, High-Power ElectricPropulsion Laboratory; [email protected]. Associate FellowAIAA.
1087
JOURNAL OF PROPULSION AND POWER
Vol. 33, No. 5, September–October 2017
Dow
nloa
ded
by G
EO
RG
IA I
NST
OF
TE
CH
NO
LO
GY
on
Sept
embe
r 2,
201
7 | h
ttp://
arc.
aiaa
.org
| D
OI:
10.
2514
/1.B
3626
9

(hereafter referred to as the thermal model) [8,9,13,15,17,21]. In the
thermal model, the corresponding ingestion flux of backgroundparticles Φ can be expressed as a function of Boltzmann’s constant
k as well as the number density nb, temperature Tb, and molecular
mass m of the background neutrals using the following equation[8,9,13–15,21]:
Φ � 1
4nb
��������������������8kTb∕πm
p(1)
The corresponding ingested mass flow rate of neutrals into the
HET _ming can then be found as the multiplicative product of the
ingestion flux from Eq. (1), the molecular mass of the backgroundgas, and the thruster exit plane area Aexit, as shown in Eq. (2) [13,21]:
_ming � ΦmAexit (2)
The thermal model has been successfully applied to explain trends
observed in early empirical measurements of the SPT-100 HET andwas used to generate the recommendation that all HETs be tested at a
facility pressure below 5.0 × 10⁻⁵ Torr in order to keep backgroundneutral ingestion below the threshold required to generate reliablepredictions of in-orbit performance [13,17]. However, subsequent
investigations with different HETs in different facilities have shown
that the results generated by the thermal model underpredict theempirically observed changes in discharge current (for cases of
constant anode mass flow rate), required anode flow rate (for cases
in which the discharge current was held constant), or thrust [8,9,14–16,21]. Specifically, previous studies have shown that the
ingestion mass flow rates predicted by the thermal model are 2–14
times too small to account for empirical observations [14,16,21].These underpredictions have prompted proposals replacing the exit
plane area in Eq. (2) with a larger effective ingestion area to account
for ionization of background neutrals in regions of the near-fieldplume where the electron temperature is still high enough to ionize
neutral gas [11,14,15]. This approach has been disputed due to itsreliance on the assumption that neutrals ingested across a reference
surface in the plume are ionized equivalently to neutrals supplied
through the HET gas distributor [6,15]. Furthermore, althoughsuccessfully applied to data taken with the 6 kW H6 in the large
vacuum test facility (LVTF) at the University of Michigan, this
approach has not yet been shown to be broadly applicable acrossmultiple devices and facilities [6,15]. Overall, these shortcomings
prevent an accurate determination of HET flow ingestion, and thus
hinder the ability to accurately gauge changes in HET operatingcharacteristics as a function of ingestion flow rate [8,9,14–16,21].In addition to the aforementioned shortcomings, the thermalmodel
assumes that all motion of background neutrals is random in nature.However, previous work modeling the rarefied background flow
inside a HET test facility found that the background neutrals couldnot be treated simply as a static gas field with only thermal velocitycomponents [22–24]. Instead, it was found that an organizedbackground flowfield existed within the test facility during HEToperation and that bulk axial velocities of over 100 m∕s wereachieved by the background neutrals [22,23]. These models weresuccessfully used to replicate the empirically observed spatialpressure distribution within the LVTF as well as the VF-5 vacuumfacility at NASA John H. Glenn Research Center; however, onlylimited attempts have been made to apply these concepts to assesshow the bulk flow of background neutrals could impact HETingestion as well as explain previously acquired HET facilityeffects data.This paper uses the bulk background flow modeling concepts first
proposed by Cai et al. in order to predict the ingestion of backgroundneutrals by a HET [22]. The original model of the LVTF created bythese researchers is further developed in order to accommodatefacilities with different physical geometries and pump placements aswell as directly compute the expected ingested mass flow rate ofbackground neutrals by a given HET. The predictions of thisexpanded model are then compared to previous empirical datasetscollected with three different thrusters in two different vacuum testfacilities in order to evaluate the ability of the model to successfullypredict empirical data. Finally, the background flowmodel is used toassess the impact of facility pump configuration and the pressuremodulation technique on neutral ingestion mass flow rate. Thisincludes a sensitivity analysis focused on determining how themodelpredictions are affected by the assumptions used to develop it(e.g., the temperatures of the chamber wall and pump surfaces, thepump sticking coefficient, etc.). It is important to note that, forcompleteness, the preceding introduction cites previously referencedresults from existing publications (both archival and nonarchival) onHET facility effects and neutral ingestion.
II. Background Flow Model
A. Overview of HET Vacuum Test Facilities
Figure 1a shows a schematic of a typical vacuum test facility usedfor HET testing. These test facilities are usually stainless-steelcylindrical vacuum chambers measuring 4 m or more in length and2 m or more in diameter, equipped with cryopumps in order toachieve andmaintain operating pressures on the order of 10−5 Torr orless [6,22,25–27]. The cryopumps operate by cooling a plate or seriesof plates to an operating temperature of approximately 15 K usinggaseous helium [22]. When incident particles strike the pumpsurface, a fraction of the particles is condensed onto to the pumpsurface while the remaining particles reflect with a thermal speedcharacterized by the pump surface temperature [22]. The probabilitythat incident particles are condensed on the pump surface is known asthe sticking coefficientα, with the probability that an incident particle
Fig. 1 A typical HET test facility a) schematic and b) background flow model representation.
1088 FRIEMAN, LIU, ANDWALKER
Dow
nloa
ded
by G
EO
RG
IA I
NST
OF
TE
CH
NO
LO
GY
on
Sept
embe
r 2,
201
7 | h
ttp://
arc.
aiaa
.org
| D
OI:
10.
2514
/1.B
3626
9
reflects off the pump expressed as 1 − α [22]. Thus, the stickingcoefficient is a metric of pump performance and quantifies howeffectively the pumps act as sinks of neutral particles from thebackground flowfield [22]. The number and location of thesepumps vary between different facilities, as does the facilitygeometry [6,22,28].In operation, a HET is mounted inside the vacuum facility to a test
stand typically located at one end of the facility. A low-density plasmaflow (i.e., the HET plume) is then exhausted from the thruster in theaxial direction toward the downstream end of the facility. Althoughsome of the emitted ions and electrons recombine before strikingthe downstream facility surfaces, the ion–electron recombinationmean free path is generally longer than the characteristic axialfacility dimensions; thus, most of these charged particles strike thedownstream facility surfaces, recombine, and reflect as neutrals with athermal speed characterized by the chamber wall temperature[22,25,28]. Upon reflection, these neutrals are then able to traverse thevacuum facility until they strike and are condensed on one of thecryopumps. This motion of neutrals through the vacuum facility isknown as the background neutral flow and is the focus of this model.
B. Assumptions and Basic Relations
1. Assumptions
To model the flow environment described previously, severalsimplifying assumptions were made. These assumptions, as well asthe corresponding justifications underlying them, are detailed below.The first set of assumptions concerns the background flow
environment. First, it is assumed that the background flow in the testfacility is in the freemolecular regime. Previouswork has shown that,becauseHET test facilities typically operate at pressures of 10−5 Torrof xenon (Xe) or below, the Knudsen number in these facilities is oforder unity [22]. This is well within the range considered to becharacteristic of a free molecular flow environment [29]. It is alsoassumed that the background flow is one-dimensional along thethrust axis of the HET. This assumption is consistent with previousstudies into background neutral flows, which have yielded goodagreement with more complex numerical simulations and empiricalmeasurements [22,30]. The accuracy of the one-dimensional (1-D)assumption is further examined in Sec. IV.E. Finally, it is assumedthat the background flow is in thermodynamic equilibrium. Thisimplies all variables that impact the background flow (i.e., thetemperatures of the chamber wall and pump surfaces as well as theanode mass flow rate) are in steady state. This restricts the model topredictions of time-averaged ingestion flow rates. This restriction isappropriate for this model because the focus is on replicatingempirical results acquired on the timescale of seconds to minutes(i.e., measurements of average discharge current and thrust) and noton the oscillation characteristics of HETs that occur at characteristicfrequencies on the order of 20 kHz [31].The next set of assumptions pertains to the vacuum test facility.
Within the model, the chamber wall temperature and pump surfacetemperature are assumed to be constant and equal to 300 and 15 K,respectively. For this work, the term “pump surface temperature”refers to the temperature of the helium cryosail and not thetemperature of any liquid-nitrogen-cooled shrouds. The assumedpump surface temperature is consistent with reported empiricalmeasurements inHET test facilities [26]. Furthermore, all cryopumpsare assumed to have a constant sticking coefficient of 0.4. It isimportant to note that typical values for the sticking coefficient ofnoble gases on bare cryogenic panels are typically within a range of0.6–0.8 [32]. However, because the pumps installed in many HETtest facilities are surrounded by liquid-nitrogen-cooled louveredshrouds, the effective sticking coefficient for these pumps can belower than the values achieved for a bare cryosurface; the assumedsticking coefficient of 0.4 is in agreement with previous analyticaland empirical studies of cryosurfaces with louvered shrouds [22,26].The sensitivity of the model to these assumptions is assessed inSec. IV.D.The final set of assumptions concerns the behavior of the
individual particles composing theHET plume and background flow.
First, it is assumed that neutrals fully accommodate to the surfacesthey strike and reflect specularly. Previous analysis has shown thatthe differences in results generated between diffuse and specularreflection assumptions are small; thus, the impact of this assumptionis expected to be minor [30]. Next, it is assumed that all particlesinjected into the HET anode travel unimpeded to the downstreamfacility surfaces, thermalize, and reflect. Thus, the downstreamfacility surfaces are considered as a source of neutral xenon enteringthe chamber at the thruster anodemass flow rate, through the chambercross-sectional surface area, and at the wall temperature. Thisassumption is consistent with previous work into background flowmodeling in HET test facilities [22]. It is furthermore supported byempirical measurements of the velocity distributions within HETplumes; these measurements show that both ions and neutralsexhausted by the HET have large axial velocity components in thedirection of the downstream chamber surfaces [33]. Further empiricalevidence indicates that the majority of the ions are unlikely toundergo a recombination collision before reaching the downstreamfacility surfaces [28]. Thus, the most likely pathway for theseparticles to begin traveling back toward the thruster is by reflectionfrom the downstream facility surfaces. It is nevertheless important tonote that this assumption does not capture two processes present infacilities with downstream pumping surfaces. First, it does notcapture the loss of unionized propellant exhausted by the HET due tocontact with pump surfaces during the initial transit from the HET tothe downstream facility surfaces. Second, it does not capture theeffective reduction in chamber area caused by the shadowing of thesedownstream surfaces by the cryopumps. Fortunately, these processeshave offsetting effects on the number density. Specifically, the firstprocess reduces the effective inflow number density, whereas thesecond increases it.Finally, it is assumed that the HET plume flow collisionally
scatters background flow neutrals traveling toward the HET exitplane. The only collisions that are considered are the elastic collisionsbetween the background neutrals and the unionized propellantexhausted by the HET. The collisional cross sections are computedusing models employed in previous HET plume models [34]. Tocompute the cross sections, it is assumed that the neutral density at theexit planes of all HETs is approximately 1 × 10¹⁸ m−3; this estimateis taken from previous empirical measurements using the 1.5 kWSPT-100 and 5 kW P5 HETs, both of which are used as points ofcomparison for this work [34,35]. The neutral density is furthermoreassumed to follow an inverse-square dependency; this variation isderived by modeling the neutral density as the isotropic emissions ofa rarefied flow from a disk with a diameter equal to the thruster exitarea, and is commonly applied in HET plume models [7]. Thevelocity of plume neutrals is taken to be approximately 200 m∕s,which is consistent with previous empirical measurements [33]. It isimportant to note that the large relative velocity (i.e., greater than20;000 m∕s) between the ions exhausted by the HET and thebackground neutral flows results in an elastic collisional cross sectionmore than an order of magnitude smaller than the computed crosssection for the elastic collisions between the background neutrals andthe unionized propellant exhausted by the HET; thus, this ion-neutralcollision process is ignored for this work.
2. Basic Relations
Before the background flow model can be mathematicallydeveloped, a few basic relations regarding the flow of rarefied gas inequilibriummust be presented. The net mass flow rate _m of a rarefiedgas across a surface in one direction for a one-dimensional flow isgiven by Eq. (3):
_m � mnSS���������������������������8kT�∕�πm�
p∕4 � mnS�S
���������������������������2kT�∕�πm�
p(3)
where S is the area of the surface, T is the temperature of the particlescrossing the surface, nS� is the number density of particles crossingsurface Smoving in the positive direction (which is equal to half thetotal number density of particles at the surface because there are onlytwo potential directions ofmotion), and all other variables retain their
FRIEMAN, LIU, ANDWALKER 1089
Dow
nloa
ded
by G
EO
RG
IA I
NST
OF
TE
CH
NO
LO
GY
on
Sept
embe
r 2,
201
7 | h
ttp://
arc.
aiaa
.org
| D
OI:
10.
2514
/1.B
3626
9

meaning from previous equations [22]. The situation described by
Eq. (3) is illustrated in Fig. 2.For convenience, the simplified thermal-diffusive velocity termVs
from Eq. (3) will be defined as shown in Eq. (4):
VS ����������������������������2kT�∕�πm�
p(4)
Finally, from the law of mass conservation and Eq. (3), the number
of particles of incoming temperature T1 reflected from a surface at a
different temperature T2 is given by Eq. (5) [22]:
n1������T1
p� n2
������T2
p(5)
InEq. (5),n1 is the number density of the incoming particles andn2is the number density of the reflected particles.
C. Model Development
Using the assumptions from Sec. II.B.1, the typical HET test
facility shown in Fig. 1a is transformed into the 1-D background
flow model shown in Fig. 1b. To help correlate the model to the test
facility, identical reference surfaces are drawn on both the
schematic of the HET chamber shown in Fig. 1a and the model
representation in Fig. 1b. These reference surfaces demarcate the
different chamber regions of interest: the downstreamwall region is
located between surfaces A and C, the downstream pump region
is located between surfaces C and D, the upstream pump region is
located between surfaces D and E, and the end dome pump region
is located between surfaces E and B. For this work, the dividing line
between the upstream and downstream regions is the HET exit
plane. In other words, all pumps located downstream of the HET
exit plane and not on the end domes of the vacuum test facility are
considered to be in the downstream pump region, whereas those
located upstream of the HETexit plane and not on the end domes of
the vacuum test facility are considered to be in the upstream pump
region. As shown in Fig. 1b, because the model is one-dimensional,
the number density of particles (and the corresponding flux)
crossing each of these surfaces can be further decomposed into
an upstream (i.e., positive) and a downstream (i.e., negative)
component.The analytical model needed to compute the ingestion flow rate
due to the background neutral flow is built from the identified
assumptions, basic relations, and modeling domain. To arrive at
this final solution, expressions for the flux and number density of
background neutrals crossing each of the surfaces in both
directions need to be obtained. These expressions can then be
combined into a system of equations that can be solved for the
ingestion number density nD� and mass flow rate FD�. The model
will be presented region by region in order to explicitly show the
unique aspects associated with each type of region. Furthermore,
the resulting equations will compose a toolkit that can readily
be applied to build a model of any facility geometry or pump
configuration.
1. Pump Regions
Themodel development starts by examining the flow environment
in the upstream and downstream pump regions. There are threepotential outcomes for background particles that enter a pump region:1) The particles can proceed unimpeded through the region and
exit at the temperature with which they entered.2) The particles can strike a pump and condense, which removes
them from the flow.3) The particles can strike a pump and reflect at the pump
temperature.These outcomes are shown in Fig. 3.Thus, the flow rate of particles of population i exiting the pump
region FD�ican be written as follows [22]:
FD�i� mScnC�i
Vi −mSpdnC�i
Vi
� �1 − α�nC�iSpd
mVp
�������������Ti∕Tp
q(6)
Note that Eq. (6) is written using the flux across surface D in the
positive direction as an example exit surface from a pump region.In Eq. (6), Sc is the chamber cross-sectional area, Spd
is the total
surface area of cryopumps located in the relevant pump region(for this example, it would be the downstream pump region), nc�i
is
the number density of particles of population i entering the pumpregion (that, for this example, would be the number density of
particles of population i crossing surface C in the positive direction),Vi is the thermal-diffusive speed characterized by the temperature of
particles of population i (Ti), Vp is the thermal-diffusive speedcharacterized by the pump surface temperature Tp, and all other
terms retain their meanings from previous expressions.Each of the summation terms in Eq. (6) represents one of the
possible outcomes discussed previously. The first term representsparticles that traversed the pump region unimpeded; the second term
represents the particles that struck a pump surface and condensed; andthe third term represents the fraction of particles that struck a pump
surface but did not condense, and instead reflected at a thermal-diffusive speed characterized by the pump surface temperature.
Finally, it is important to note that Eq. (6) is also written for a singlepopulation of particles. If additional populations are entering the pump
region, thenEq. (6) will be applied to each population and the total exitflow rate will be equal to the sum of the exit flow rates for each
population. Such a situation could arise for adjacent pump regions(i.e., the upstreamanddownstreampump regions for a chamber similar
to the one shown in Fig. 1a) because, after traversing the first pumpregion, the flux entering the second pump region would be composed
of a population of particles at the original entry temperature andanother at pump surface temperature made up of those particles that
struck but were not trapped by a pump in the first pump region.The number density of particles of population i exiting the pump
region nD�ican similarly be written as follows [22]:
nD�i� �1 − sd�nC�i
� �1 − α�nC�isd
�������������Ti∕Tp
q(7)
In Eq. (7), sd is the ratio of pump surface area to facility cross-
sectional area in the region of interest, and all other terms retaintheir meaning from previous expressions. The first term of Eq. (7)
Fig. 2 One-dimensional motion of a rarefied gas.
Fig. 3 Three potential outcomes for particles in pump regions.
1090 FRIEMAN, LIU, ANDWALKER
Dow
nloa
ded
by G
EO
RG
IA I
NST
OF
TE
CH
NO
LO
GY
on
Sept
embe
r 2,
201
7 | h
ttp://
arc.
aiaa
.org
| D
OI:
10.
2514
/1.B
3626
9

represents the number density of particles that proceeded unimpeded
through the pump region, whereas the second is the number density
of those that reflected from a pump and are nowmoving at a thermal-
diffusive speed characterized by the pump surface temperature. As
with Eq. (6), Eq. (7) is written for a single population of particles, and
the total exit number density would be equal to the sum of the number
densities for each population.
2. Wall Regions
The next class of regions to consider includes wall regions without
end dome pumps. Such a region is shown between surfaces C and A
in Fig. 1b. All particles entering this region strike the facility walls,
thermally accommodate to the facility wall, and then reflect with a
thermal-diffusive speed characterized by the facility wall temper-
ature. This process is shown in Fig. 4.The resulting exit flow rate can be expressed as follows [22]:
FC�i� mScnA−i
Vw
��������������Ti∕Tw
p(8)
The corresponding exit number density is as follows [22]:
nC�i� nC−i
��������������Ti∕Tw
p(9)
In Eqs. (8) and (9),Vw is the thermal-diffusive speed characterized
by the temperature of the chamber wall Tw and all other variables
retain their meaning from previous expressions. As with Eqs. (6) and
(7), both Eqs. (8) and (9) must be applied to all populations present,
and the total mass flow rates and number densities will be the sum of
the contributions of all populations and any source terms.
3. End Dome Pump Regions
The final type of facility region is an end dome pump region. Such
a region is shown between surfaces E and B in Fig. 1b. Particles
entering this region can either 1) strike and thermally accommodate
to the facility wall then reflect with a thermal-diffusive speed
characterized by the facility wall temperature; 2) strike an end dome
pump and condense; or 3) strike and thermally accommodate to an
end dome pump, and then reflect with a thermal-diffusive velocity
characterized by the pump surface temperature. These outcomes are
illustrated in Fig. 5.Thus, the number density of particles of population i exiting the
end dome pump region nE−ican be written as follows:
nE−i� �1 − se�nE�i
��������������Ti∕Tw
p� �1 − α�nE�i
se
�������������Ti∕Tp
q(10)
In Eq. (10), se is the ratio of pump surface area to facility cross-sectional area in the end dome pump region, and all other terms retaintheir meaning from previous expressions. The first term of Eq. (10)represents the number density of particles that strike the facility walland are reflected with a thermal-diffusive speed characterized by thefacility wall temperature, whereas the second term is the numberdensity of reflected particles from a pump that are now movingat a thermal-diffusive speed characterized by the pump surfacetemperature.
4. Final Expressions
Application of Eqs. (7), (9), and (10) to each of the referencesurfaces shown in Fig. 1b results in a system of equations the can besolved simultaneously for the directional number densities crossingeach surface. This system is shown for the positive directionalnumber densities in Eqs. (11–13). A similar system can be developedfor the negative number densities crossing each surface:
nD� � �1 − sd�nC� � �1 − α�sdnC����������������Tw∕Tp
q(11)
nE� � nB� � �1 − su��1 − sd�nC� � �su�1 − sd�� �1 − su�sd � su�1 − α�sd��1 − α�nC�
���������������Tw∕Tp
q(12)
nC� � nA� � nin − nC��αsd − 1�2�αse − 1��αsu − 1�2 (13)
Because the HET exit plane is located just upstream of surface D,the parameter of interest for HET neutral ingestion is the mass flowrate of particles crossing surface D in the upstream directionFD�. The solution for this parameter is shown in Eqs. (14) and (15):
nC� � nin1� �αsd − 1�2�αse − 1��αsu − 1�2 (14)
FD� � mScnC�Vw −mSpdnC�Vw
� �1 − α�nC�SpdmVp
���������������Tw∕Tp
q(15)
nin � _ma;p
Sc(16)
In Eqs. (11–15), su is the ratio of pump surface area-to-facilitycross-sectional area in the upstream pump region, and all other termsretain their meaning from previous expressions. In Eq. (14), nin is theinput number density due to the HETanode flow computed as per theassumption regarding plume flow reflection in Sec. II.B.1. For clarity,this parameter is shown expressed as a function of the anode particleflow rate _ma;p and the chamber cross-sectional area in Eq. (16).Because the HET exit plane occupies only a small fraction of thecross-sectional area of surface D, computing the actual ingestedmassflow rate due to the background neutral flow requires the mass flowrate computed in Eq. (15) to be scaled by the ratio of the HET exitplane area to the cross-sectional area of the facility. This scalingensures that only those particles that are on a trajectory to enter theHET channel are counted as part of the ingested mass flow rate.Although developed for the chamber shown in Fig. 1a, Eq. (14) can
readily bemodified to accommodate chambers of different geometricsizes and pump configurations by appropriatelymodifying the valuesof se, su, and sd. For example, the result for a facility with no enddome pumps would be equal to Eq. (14) evaluated with se set to zero.Similarly, thrusters of different sizes or operating conditions can beaccommodated by appropriately adjusting the exit area in the scalingmentioned previously and the source term in Eq. (14).As an initial test case, the aforementioned approach was applied in
order to generate the form of Eq. (14) relevant to a facility withupstream pumps only. Such a facility matches the original modeldeveloped for the LVTF byCai et al. [22]. By setting both se and sd to
Fig. 4 Illustration of outcome for particles in wall regions.
Fig. 5 Three potential outcomes for particles in end dome pumpregions.
FRIEMAN, LIU, ANDWALKER 1091
Dow
nloa
ded
by G
EO
RG
IA I
NST
OF
TE
CH
NO
LO
GY
on
Sept
embe
r 2,
201
7 | h
ttp://
arc.
aiaa
.org
| D
OI:
10.
2514
/1.B
3626
9
zero (i.e., by removing the downstream and end dome pumps fromthe model), the empirically validated expression developed by Caiet al. is indeed recovered [22]. As an additional test case, thebackground flow model was used to compute the number density ofparticles crossing surface D in the positive direction, assuming thatboth sd and αwere equal to one. This situation represents the limitingcase of finding the number density remaining after a rarefied flowpasses into a region occupied entirely by a pump surface onto whichall incident particles condense. As expected, the model predicts thatno particles would exit this region. These two test cases confirmboth the accuracy of the math underlying the model and theaforementioned approach in expanding the background flow modelto accommodate a wider variety of facility configurations.Now that the final expressions of the model are developed, it is
important to revisit the physical processes captured by Eqs. (14) and(15) and how these processes might explain the empirically observedenhancement in background neutral ingestion relative to thepredictions of the thermal model. As described in detail in Sec. II.A,the physical process captured by this model is the reflection of thelow-density plasma flow (as neutrals) from the downstream facilitysurfaces and their subsequent axial motion back toward the HET.This reflected motion is caused by the finite axial dimensions andpumping speed of the facility and represents a bulkmotion toward theHET exit plane that could result in an additional or enhancedingestion flux into the HET beyond that captured by the randommotions of the thermal model. It is this additional flux (of the flowreflected off the downstream facility surfaces) that is captured byEq. (15) and the concomitant enhancement of local number densitythat is captured by Eq. (14). Specifically, the velocity terms inEq. (15) represent the bulk axial velocity of neutrals toward the HETexit plane due to reflection off of the facility surfaces.It is furthermore important to note that this reflective process is not
unique toHETs, but it is widely applicable to any directional flowof alow-density plasma in a finitevessel including the plume produced bygridded ion engines during ground testing. However, unlike in HETs(which have open channel exit areas in which ions are created),neutral ingestion into gridded ion engines is conductance limited bythe grid apertures [7]. Thus, the bulk background flow is not able tofreely stream into the ion engine discharge chamber and contribute tothe plasma generation in this region. This significantly limits theimpact of the bulk background flowon the ingestion characteristics ofgridded ion engines and suggests the thermal model is sufficient forcorrecting the data acquired from these devices, despite the modelapproximations [7].
5. Comparisons to Existing Background Flow Models
Although the model developed in the preceding sections follows asimilar approach to that taken byCai et al., it differs from this originalmodel in several important ways [22,30,36]. First, all modelsdeveloped by Cai et al. have only a single pump region with a singletype of pump (i.e., either end dome pumps exposed to the flow ononly one side or upstream/downstream pumps exposed to the flow ontwo sides) [22,30,36]. Because of this, in those models, all particlesenter the pump region with a uniform velocity characterized by thetemperature of the facility walls [22,30,36]. In contrast, the modeldeveloped in this work allows for the possibility of several adjoiningpump regions of different types, and thus the entrance of particles ofseveral different populations with several different velocities intothese regions. The ability to model adjoining pump regions and thecorresponding discussion of how to account for these differentpopulations is thus unique to this model and represents an increase incomplexity over the original models developed by Cai et al.[22,30,36]. In addition, none of the original 1-D flowmodels createdby Cai et al. accounted for the collisional scattering processesassociated with the interaction of the background flow with the HETplume [22,30,36]. These processes are accounted for in this work asdescribed in Sec. II.B.1. It is important to note that many of theadditional complexities accounted for in this model are alsoaccounted for in the more complex direct simulation Monte Carlo(DSMC) models of the background flow environment in ground testfacilities developed by Yim and Burt [23] and Nakayama and
Nakamura [24]. However, in contrast to these DSMC models, theproposed 1-D model is much simpler to implement and customize tofit a given thruster and facility combination. To compare the twoapproaches (and therefore preliminarily assess the viability of theemployed simpler approach), the background flow model is used tocompute the weighted average speed of neutrals crossing surface D(i.e., those neutrals nearest the HET). These computations show amost probable speed of approximately 100 m∕s, which is in goodagreement with the velocity distribution functions generated by themore complex DSMC codes [23].The final difference between themodel developed in this work and
those previously developed lies in the application of the modelresults. The models developed by Cai et al. [22,30,36], Yim and Burt[23], and Nakayama and Nakamura [24] were all used to create mapsof the spatial neutral pressure distribution within ground testfacilities. Although these results also indicated the presence of a bulkbackground flow of neutrals toward the thruster, to date, none of thesemodels have been applied to compute the resultant ingestion massflow rate into the HET due to this bulk motion, nor have they beenused to replicate existing empirical datasets quantifying thesensitivity of HETs to background pressure.
III. Comparisons to Empirical Data
To validate the applicability of the background flow modelingapproach for predicting neutral particle ingestion byHETs, themodeldeveloped previously was used to compute the ingested mass flowrates for situations identical to several published experimental workson HET facility effects. These results were then compared againstthe empirical measurements of ingestion flow rate as well as thepredictions of the thermal model.When comparing the results of the background flow model to
empirical measurements, it is assumed that background neutralsparticles ingested by the HET are ionized equivalently to neutralssupplied by the gas distributor. This simple ingestion approachis similar to that taken in many previous works on facility effects andis consistent with the approach taken in all of the works used forcomparison [8,9,14–16,21]. Furthermore, as mentioned previously,only neutral particles that cross the HET exit plane and enter thedischarge channel are counted as part of the ingestedmass flow rate inthe background flow model. Because the mass flow in this region ofthe channel is free molecular, these neutral particles are free to travelinto the ionization zone of the HET, and are thus subject to collisionswith the high-temperature electrons within this zone, as are theneutrals supplied by the gas distributor [14].
A. P5 HET in the LVTF
The first data used for model validation were collected using theP5 HET in the LVTF at the University of Michigan. The P5 is alaboratory-model Hall thruster developed jointly by the U.S. AirForce Research Laboratory (AFRL) and the University of Michigan[21]. The P5 has a nominal operating power of 5 kW [21]. The LVTFis a stainless-steel clad vacuum chambermeasuring 9m in length and6 m in diameter, and it is equipped with seven cryopumps locatedupstream of the HET test station for a combined total upstream pumpsurface area of 7.26 m2 [8,21,22].The first dataset used for validation was acquired by Hofer et al. [8].
In this work, the anodemass flow rate supplied to the P5 was varied inorder to maintain a constant discharge current as the number of activepumps in the LVTF was varied from four to seven [8]. The authorsnoted that higher anode mass flow rates were required to achieve agiven discharge current at lower facility pressures and attributed theresultant change in the required anode mass flow rate to a decrease inneutral ingestion [8]. For instance, approximately 10 mg∕s of anodeflowwas required, on average, to achieve a discharge current of 10A inthe four-pump configuration; whereas 10.21 mg∕s of anode flow wasrequired, on average, in order to achieve the same discharge current inthe seven pump configuration [8]. Thus, the change in the ingestedmass flow rate between the two conditions could be approximated as0.21 mg∕s. The background flow model was similarly used tocompute the difference in ingestion flow rate for the P5 in the LVTF as
1092 FRIEMAN, LIU, ANDWALKER
Dow
nloa
ded
by G
EO
RG
IA I
NST
OF
TE
CH
NO
LO
GY
on
Sept
embe
r 2,
201
7 | h
ttp://
arc.
aiaa
.org
| D
OI:
10.
2514
/1.B
3626
9
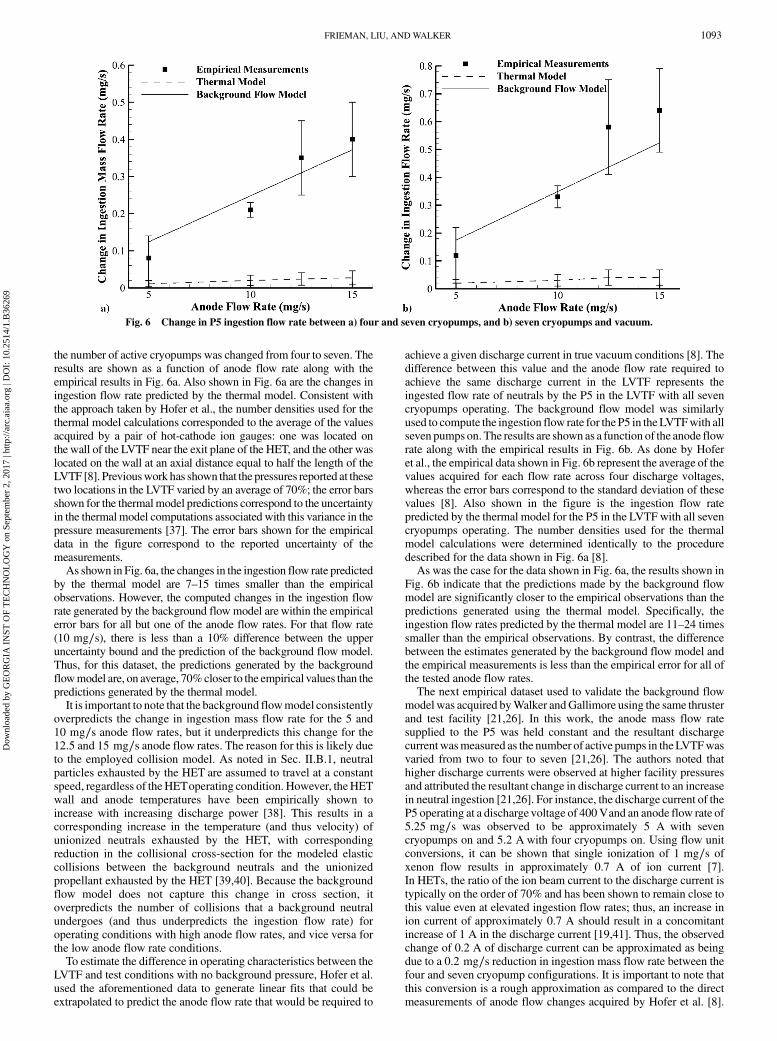
the number of active cryopumps was changed from four to seven. Theresults are shown as a function of anode flow rate along with theempirical results in Fig. 6a. Also shown in Fig. 6a are the changes iningestion flow rate predicted by the thermal model. Consistent withthe approach taken by Hofer et al., the number densities used for thethermal model calculations corresponded to the average of the valuesacquired by a pair of hot-cathode ion gauges: one was located onthe wall of the LVTF near the exit plane of the HET, and the other waslocated on the wall at an axial distance equal to half the length of theLVTF [8]. Previouswork has shown that the pressures reported at thesetwo locations in the LVTF varied by an average of 70%; the error barsshown for the thermalmodel predictions correspond to the uncertaintyin the thermal model computations associated with this variance in thepressure measurements [37]. The error bars shown for the empiricaldata in the figure correspond to the reported uncertainty of themeasurements.As shown in Fig. 6a, the changes in the ingestion flow rate predicted
by the thermal model are 7–15 times smaller than the empiricalobservations. However, the computed changes in the ingestion flowrate generated by the background flow model are within the empiricalerror bars for all but one of the anode flow rates. For that flow rate(10 mg∕s), there is less than a 10% difference between the upperuncertainty bound and the prediction of the background flow model.Thus, for this dataset, the predictions generated by the backgroundflowmodel are, on average, 70%closer to the empirical values than thepredictions generated by the thermal model.It is important to note that the background flowmodel consistently
overpredicts the change in ingestion mass flow rate for the 5 and10 mg∕s anode flow rates, but it underpredicts this change for the12.5 and 15 mg∕s anode flow rates. The reason for this is likely dueto the employed collision model. As noted in Sec. II.B.1, neutralparticles exhausted by the HET are assumed to travel at a constantspeed, regardless of theHEToperating condition. However, theHETwall and anode temperatures have been empirically shown toincrease with increasing discharge power [38]. This results in acorresponding increase in the temperature (and thus velocity) ofunionized neutrals exhausted by the HET, with correspondingreduction in the collisional cross-section for the modeled elasticcollisions between the background neutrals and the unionizedpropellant exhausted by the HET [39,40]. Because the backgroundflow model does not capture this change in cross section, itoverpredicts the number of collisions that a background neutralundergoes (and thus underpredicts the ingestion flow rate) foroperating conditions with high anode flow rates, and vice versa forthe low anode flow rate conditions.To estimate the difference in operating characteristics between the
LVTF and test conditions with no background pressure, Hofer et al.used the aforementioned data to generate linear fits that could beextrapolated to predict the anode flow rate that would be required to
achieve a given discharge current in true vacuum conditions [8]. Thedifference between this value and the anode flow rate required toachieve the same discharge current in the LVTF represents theingested flow rate of neutrals by the P5 in the LVTF with all sevencryopumps operating. The background flow model was similarlyused to compute the ingestion flow rate for the P5 in theLVTFwith allseven pumps on. The results are shown as a function of the anode flowrate along with the empirical results in Fig. 6b. As done by Hoferet al., the empirical data shown in Fig. 6b represent the average of thevalues acquired for each flow rate across four discharge voltages,whereas the error bars correspond to the standard deviation of thesevalues [8]. Also shown in the figure is the ingestion flow ratepredicted by the thermal model for the P5 in the LVTF with all sevencryopumps operating. The number densities used for the thermalmodel calculations were determined identically to the proceduredescribed for the data shown in Fig. 6a [8].As was the case for the data shown in Fig. 6a, the results shown in
Fig. 6b indicate that the predictions made by the background flowmodel are significantly closer to the empirical observations than thepredictions generated using the thermal model. Specifically, theingestion flow rates predicted by the thermal model are 11–24 timessmaller than the empirical observations. By contrast, the differencebetween the estimates generated by the background flow model andthe empirical measurements is less than the empirical error for all ofthe tested anode flow rates.The next empirical dataset used to validate the background flow
model was acquired byWalker andGallimore using the same thrusterand test facility [21,26]. In this work, the anode mass flow ratesupplied to the P5 was held constant and the resultant dischargecurrentwasmeasured as the number of active pumps in theLVTFwasvaried from two to four to seven [21,26]. The authors noted thathigher discharge currents were observed at higher facility pressuresand attributed the resultant change in discharge current to an increasein neutral ingestion [21,26]. For instance, the discharge current of theP5 operating at a discharge voltage of 400Vand an anode flow rate of5.25 mg∕s was observed to be approximately 5 A with sevencryopumps on and 5.2 A with four cryopumps on. Using flow unitconversions, it can be shown that single ionization of 1 mg∕s ofxenon flow results in approximately 0.7 A of ion current [7].In HETs, the ratio of the ion beam current to the discharge current istypically on the order of 70% and has been shown to remain close tothis value even at elevated ingestion flow rates; thus, an increase inion current of approximately 0.7 A should result in a concomitantincrease of 1 A in the discharge current [19,41]. Thus, the observedchange of 0.2 A of discharge current can be approximated as beingdue to a 0.2 mg∕s reduction in ingestion mass flow rate between thefour and seven cryopump configurations. It is important to note thatthis conversion is a rough approximation as compared to the directmeasurements of anode flow changes acquired by Hofer et al. [8].
Fig. 6 Change in P5 ingestion flow rate between a) four and seven cryopumps, and b) seven cryopumps and vacuum.
FRIEMAN, LIU, ANDWALKER 1093
Dow
nloa
ded
by G
EO
RG
IA I
NST
OF
TE
CH
NO
LO
GY
on
Sept
embe
r 2,
201
7 | h
ttp://
arc.
aiaa
.org
| D
OI:
10.
2514
/1.B
3626
9

To quantify the error associated with this approximation, the averagepercent difference between the P5 discharge current predicted usingthe aforementioned flow rate to discharge current conversion andthose measured empirically was computed for all of the dischargevoltages and flow rates used by Walker and Gallimore [21]. Theaverage percent difference between the estimated and empiricalresults is approximately 1%, which approximates the overall errorassociated with the employed estimation technique.The background flow model was similarly used to compute the
difference in ingestion flow rate for the P5 in the LVTF as the numberof active cryopumps was changed from two to seven. The results areshown as a function of anode flow rate along with the empirical resultsin Fig. 7. Consistent with the approach ofHofer et al. [8], the empiricaldata shown in Fig. 7 represent the average of the values acquired foreach flow rate across four discharge voltages, whereas the error barscorrespond to the standard deviation of these values. Also shown in thefigure are the changes in ingestion flow rate predicted by the thermalmodel. Consistent with the approach taken by Walker and Gallimore,the number densities used for the thermal model calculationscorrespond to the empirical measurements taken using a single hot-cathode ionization gauge located on thewall of the LVTF downstreamof theHET test station [21]. The uncertainty in the computed ingestionflow rates using the thermal model due to the reported 20% pressuremeasurement uncertainty is captured by the line thickness.As shown in Fig. 7, the average percent difference between the
empirical measurements and the predictions of the background flowmodel is 9% as the number of active pumps is increased from two toseven. By comparison, the change in ingestion flow rate predicted bythe thermal model is 14–17 times smaller than the empiricalmeasurements, resulting in an average percent difference of 93%.The accuracy of the background flow model in predicting the
empirical data is comparable to that of the current increment techniqueoriginally proposed by Walker and Gallimore [21]. In this technique,empirically measured changes in discharge current as a function ofpressure are used in order to approximate the neutral ingestion flow rate[21]. However, application of this technique requires measurementsof the operating characteristics of a given thruster across a range offacility backpressures. The comparable accuracy of the predictions ofthe background flowmodel to this empirical technique suggests that themodelmay be implemented in order to obtain these estimates of neutralingestion without needing to perform the empirical mapping. Thus,taken togetherwith thepreviously presented comparisons to theworkofHofer et al. [8], these results indicate that the background flowmodel isable to accurately replicate the empirically observed neutral ingestioncharacteristics of the P5 in the LVTF and offers a 60 to 70%improvement in accuracy over the thermal model [8].
B. H6 in the LVTF
The background flow model was developed without any
considerations of HET-specific characteristics. As such, the model
should be able to maintain the previously observed accuracy when
predicting the ingestion characteristics of another thruster in the same
facility. To evaluate this assertion, the predictions of the background
flowmodelwere compared to another dataset collected byReid using
the H6HET in the LVTF [14,15]. The H6 is a 6 kW laboratory-model
HET developed by the AFRL in collaboration with the NASA Jet
Propulsion Laboratory and the University of Michigan [42]. In this
work, Reid held the anode mass flow rate supplied to the H6 constant
and the resultant discharge current was measured as the pressure in
the LVTFwas varied using a bleed flow of propellant [14,15]. Aswas
the case with the P5, higher discharge currents were observed at
higher facility pressures and attributed to an increase in neutral
ingestion [14,15]. The observed change in discharge current con be
used to estimate the concomitant change in effective anode flow rate
using the method described previously.The background flow model was similarly used to compute the
ingestion flow rate for the H6 in the LVTF as a function of bleed flow
rate for a discharge voltage of 300 V. The results are shown as a
function of the bleed flow rate along with the empirical results in
Fig. 8. The changes in ingestion flow rate predicted by the thermal
model are also shown in Fig. 8. Consistentwith the approach taken by
Reid, the number densities used for the thermal model correspond to
the average values acquired by a pair of ion gauges located on
oppositewalls at an axial distance equal to half the length of theLVTF
[14,15]. Data presented by Reid show that the pressures reported at
these two locations in the LVTF varied by an average of 70%;
the error bars shown for the thermal model predictions correspond to
the uncertainty in the thermal model computations associated with
this variance in the pressuremeasurements [14]. The error bars shown
for the empirical data in the figure correspond to the reported
uncertainty in the measurements [14,15]. The results are reported as
the change in ingestion flow rate relative to the baseline value
obtained for an operating pressure of 1.9 × 10⁻⁵ Torr of Xe, whichcorresponds to a bleed flow of approximately 12 mg∕s. It is
important to note that, during the experiment, the bleed flow orifice
was located beneath the thruster and oriented such that the flow of
propellant impacted the underside of the thrust stand mounting
structure [14]. Due to the one-dimensional nature of the background
flow model, the radial injection of propellant could not be directly
modeled. Instead, the bleed flowwas approximated as another source
entering the chamber as per the assumption regarding plume flow
reflection in Sec. II.B.1.
Fig. 7 Change in P5 ingestion flow rate between two and sevencryopumps.
Fig. 8 Change in H6 ingestion mass flow rate with bleed flow in theLVTF.
1094 FRIEMAN, LIU, ANDWALKER
Dow
nloa
ded
by G
EO
RG
IA I
NST
OF
TE
CH
NO
LO
GY
on
Sept
embe
r 2,
201
7 | h
ttp://
arc.
aiaa
.org
| D
OI:
10.
2514
/1.B
3626
9

As shown in Fig. 8, the values predicted by the thermal flowmodelare, on average, 10 times smaller than the empirical results. Even ifthe empirical measurements are all assumed to be equal to the loweruncertainty bound, the average percent difference between thepredictions of the thermal model and the empirical results is 55%.However, the values predicted by the background flow model are ofthe same order as the empirical measurements and are within theuncertainty of the empirical measurements for the measurementstaken at bleed flow rates of approximately 7.5 and 5 mg∕s. For thefinal measurement, the predictions of the background flowmodel areonly 8% different from the upper uncertainty bound. Thus, thepredictions of the background flow model are approximately 50%closer to the empirical measurements than those generated using thethermal model. These results are identical to those for the 400 Voperating condition also presented in the work by Reid [14,15].The accuracy of the background flow model in predicting the
empirical data is comparable to that of the empiricallyderived techniqueoriginally proposed by Reid [14,15]. In this technique, the effectiveingestion area is assumed to be a hemisphere equal in diameter to thethruster outer diameter; all neutrals that cross this surface are assumed toundergo the same ionization process as the neutrals supplied to theanode [14,15]. However, as noted previously, this assumption has beendisputed by other researchers [6]. The comparable accuracy of thepredictions of the background flow model to this empirical techniquesuggests that the background flowmodel may be implemented in orderto obtain estimates of the neutral ingestion mass flow rate withoutneeding tomake any assumption about ionization in theHETnear-fieldplume.Taken togetherwith thepreviouslypresented comparisons to theP5 in theLVTF, these results indicate that the background flowmodel isable to accurately replicate the empirically observed neutral ingestioncharacteristics of two different thrusters in the LVTF and offers asignificant improvement in accuracy over the thermal model.
C. SPT-100 in Aerospace Corporation Facility
To assess the ability of the model to accurately predict trends indifferent facility types, a final dataset collected by Diamant et al. usingthe SPT-100HETin thevacuum facility at TheAerospaceCorporationwas used formodel validation [6]. The SPT-100 is a flight-model HETdeveloped and built by the Fakel Experimental and Design Bureauwith a nominal operating power of 1.35 kW [6]. The AerospaceCorporation’s vacuum facility is a stainless-steel vacuum chambermeasuring 9.8 m in length and 2.4 m in diameter, and it is equippedwith 10 total cryosurfaces [6]. There are four cryopumps in thedownstream pump region, four 1.2-m-diameter cryotubs in theupstream pump region, and two cryopumps on the upstream end dome[6]. Because the cryopumps used in The Aerospace Corporation’sfacility are the same model as those used in the LVTF, all of thesecryosurfaces are assumed to be similar in terms of sticking coefficientand surface temperature to the cryopumps used in the LVTF.In this work, the anodemass flow rate supplied to the SPT-100was
varied in order tomaintain a constant discharge current as the vacuumfacility pressure was varied via a combination of bleed mass flowaddition and changing the number of active cryopumps [6]. As withthe P5 and H6, the authors noted that higher anode flow rates wererequired to achieve a given discharge current at lower facilitypressures and attributed the resultant change in anode flow rate to adecrease in neutral ingestion [6]. Using these data, the authorsestimated the difference in flow rate between operation at the lowestachievable facility pressure (as measured by an ion gauge internallymounted adjacent to the HET) and vacuum conditions. Based on thisestimate, the authors predicted a total ingestion flow rate of0.03 mg∕s. The background flow model was similarly used tocompute the ingestion flow rate for the SPT-100 in The AerospaceCorporation’s facility with all pumps on and no bleed flow. Thebackground flow model predicted an ingested flow rate ofapproximately 0.02 mg∕s, whereas the thermal model predicted aningestion flow rate of 0.008 mg∕s. The predictions of the backgroundflowmodelwere thus 40%closer to the empirical results than those ofthe thermal model and were computed without needing to obtain anyempirical pressure measurements.
Although the aforementioned datasetwill be explored inmore detailin a later section, these initial results as well as those for the P5 and H6indicate that the background flowmodel is significantlymore accuratethan the thermal model in predicting the ingestion characteristics ofseveral different thrusters tested in different facilities with differentpressure modulation techniques. It is important to note, however, thatexisting empirical evidence suggests that the modeled additionalingestion flow caused by bulk background flows is likely one of thecontributors to the observed enhanced sensitivity of HETs to facilitypressure beyond what would be predicted by the thermal model.Previous work has suggested that factors including spatial shifts innear-field plasma properties and the concomitant effects on electrontransport can also contribute to HEToperational changes as a functionof facility pressure [9].Nevertheless, the ability of the background flowmodel to obtain the predictions detailed in this section withoutempirical measurements, as well as the accuracy of the model acrossthe described range of thruster and facility characteristics, has not, tothe authors’ knowledge, previously been demonstrated with any othermass ingestion or HET facility effects model, and therefore lendscredibility to the background flow modeling approach [5–21].
IV. Model Studies
The background flow model is validated against several empiricaldatasets. In this section, the model is used to explore how parametersthat often vary between different HET test facilities or test campaignsaffect the neutral particle ingestion flow rates experienced by theHET being tested.
A. Pump Placement
The first model parameter to be evaluated will be pump placementwithin the test facility. As noted previously, facilities used for HETtesting come in a wide variety of geometries and sizes [4]. Thesedifferences in geometric properties result in variations betweenfacilities in the pump placement relative to the HET. Evidence of thiscan be seen from the preceding descriptions of the LVTF (inwhich allpumps are located upstream of the HET test station) and TheAerospace Corporation’s facility (in which the pumps are distributedupstream and downstream of the HET test station, as well as on theupstream end dome) [6,21]. Current HET testing standards provideguidance regarding minimum facility pumping speeds and pressuremeasurement locations, but they often do not mention how pumpplacement within the facility can impact the background neutral flowenvironment or the operation of the HET itself [4,27].To determine the impact of pump placement on the neutral
ingestion characteristics of a HET, the background flow model wasused to compare the ingestion flow rates of a given HET in a givenfacility as the pump locations were varied. Specifically, the ingestionflow rate of the P5 in the LVTF was computed for an anode flow rateof 15 mg∕s and a discharge voltage of 300 Vas the number of activecryopumps was increased from 2 to 12. These calculations wererepeated for five different common pump geometries: upstreampumps only, downstream pumps only, distributed pumps with a50∕50% upstream/downstream pump split, distributed pumps with a40∕60% upstream/downstream pump split, and distributed pumpswith a 20∕20∕60% end dome/upstream/downstream pump split. Forconvenience, hereafter, the upstream/downstream splits will beshownwithout the percent signs. The results comparing the first threeconfigurations are shown in Fig. 9a, whereas the results comparingthe different distributed pump distributions are shown in Fig. 9b.As shown in Fig. 9a, the facility configuration with downstream
pumps only has the lowest ingestion flow rate for all values ofactive cryopumps. As compared to the downstream pump-onlyconfiguration, the ingestion mass flow rate is between 3 and 21%higher if the only cryopumps are located upstream of the thruster witha mean percent difference of 12� 7% across all values of activecryopumps. The reported uncertainty represents one standarddeviation of the dataset. Similarly, the ingested flow rate is between 2and 15% higher for the distributed pump configuration with a 50∕50upstream/downstream pump split as compared to the configurationwith downstream pumps with only a mean value of 9� 5%.
FRIEMAN, LIU, ANDWALKER 1095
Dow
nloa
ded
by G
EO
RG
IA I
NST
OF
TE
CH
NO
LO
GY
on
Sept
embe
r 2,
201
7 | h
ttp://
arc.
aiaa
.org
| D
OI:
10.
2514
/1.B
3626
9

As shown in Fig. 9b, the distributed pump configuration withthe lowest ingestion flow rate is that with a 40∕60 upstream/downstream pump split. As compared to the downstream pump-onlyconfiguration shown in Fig. 9a, the distributed pump configurationwith a 40∕60 upstream/downstream pump split has a 2 to 13% higheringestion flow rate with a mean of 7� 4% across all values of activecryopumps. The distributed pump configuration with a 20∕20∕60end dome/upstream/downstream pump split is the worst-performingpump configuration and has an ingestion flow rate that is 13–24%higher than the downstream pump-only configuration with a meanpercent difference of 18� 4%. Although the relative difference iningestion flow rates between the different pump configurations issignificant, overall, the ingestion flow rate for most values of activecryopumps represents less than 5% of the total mass flow ratesupplied to the thruster (i.e., the sum of the anode flow rate and theingestion flow rate). Thus, the overall deviation in total flow suppliedto theHET is less than 1%between the configuration with the highestingestion flow rates (i.e., the 20∕20∕60 end dome/upstream/downstream distributed pump split) and the one with the lowestingestion flow rate (i.e., the downstream pumps only).To understand why there is only a minimal difference in total flow
supplied to the HET as a function of pump placement, the path aningested neutral particle must take through the facility in order to beingested by theHETmust be discussed. As shown in Fig. 1b, the onlyneutrals that can be ingested by theHETare those that cross surfaceDtraveling in the upstream direction. By assuming only 1-D motion,there are then only two paths that a given neutral can take in order tobe ingested. The first (i.e., pathway 1) is where the neutral canreflect off the downstream pump surfaces and travel through thedownstream region to the thruster exit plane without striking, andsticking to, a pump or being collisionally scattered by the HETplume. Neutrals that complete this transit must be on a trajectory tointersect the thruster exit plane in order to be ingested. Neutrals thatfollow a trajectory that lies outside of the thruster exit plane area haveto follow a second pathway (i.e., pathway 2) in order to be ingested.These neutrals must travel through the upstream chamber region,reflect off the upstream chamber surfaces (and/or travel through theupstream end dome pump region), travel in the downstream directionback through the upstream and downstream pump regions, reflect offthe downstream facility surfaces, and then travel back through thedownstream pump region on a trajectory to intersect the thruster exitplane without being pumped or collisionally scattered in order to beingested. Neutrals can repeat this second pathway as many times asneeded until they are either pumped or ingested. Both pathways areillustrated in Fig. 10.It is thus possible to define two components of the ingestion flow:
one each contributed by the two pathways discussed previously. Themagnitude of the first component (i.e., ingestion due to neutrals thattraverse the downstream pump region on an intersecting trajectory
with the HETexit plane) is inversely related to the pump surface areain the downstream pump region. Because, for a given number ofpumps, the downstream-only pump configuration maximizes thedownstream pump area, this component of the ingestion flow rate isthus minimized for this pump configuration. The magnitude of thesecond component (i.e., ingestion due to neutrals that have traversedthe entire facility) is inversely related to the pump surface area inupstream and end dome pump regions. This component is thusmaximized for the downstream-only pump configuration, but it isminimized for the other chamber configurations. As shown by theresults in Fig. 9, these two competing effects largely offset each otherand result in a minimal difference in ingestion flow rate as a functionof pump configuration.A similar analysis regarding the impact of pump placement on the
background flowfield was conducted by Nakayama and Nakamura[24]. In that work, a two-dimensional DSMC codewas used to assessthe sensitivity of the background neutral pressure map to the pumplocation and facility aspect ratio. Themodel developed in this work isunable to provide similar guidance on the facility aspect ratio due tothe assumption of one-dimensional motion. Furthermore, in the citedwork, only the distance between the pumps and the HET wasvaried [24]. Despite these differences, both works suggest thatmaximization of the number of downstream pump surfaces
Fig. 9 Ingestion flow rate comparing a) upstream, downstream, and distributed pumps; and b) different distributed pump configurations.
Fig. 10 Bulk background flow ingestion pathways.
1096 FRIEMAN, LIU, ANDWALKER
Dow
nloa
ded
by G
EO
RG
IA I
NST
OF
TE
CH
NO
LO
GY
on
Sept
embe
r 2,
201
7 | h
ttp://
arc.
aiaa
.org
| D
OI:
10.
2514
/1.B
3626
9
minimizes the number of background neutrals near the thruster exitplane, thus indicating good agreement between the more complex
DSMC approach and the one-dimensional approach appliedhere [24].
B. Pressure Modulation Techniques
As shown by the empirical datasets referenced in Secs. III.A and
III.B, existing empirical investigations into HET facility effectschange the nominal operating pressure in the test facility by somecombination of varying the gas load via the introduction of a bleedflow of propellant and modulating the effective pumping speed bychanging the number of active cryopumps [43]. However, because
the nominal operating pressure in aHET test facility can be expressedas the ratio of the gas load to the effective facility pumping speed,there are many combinations of bleed flow rate and pumping speedthat can yield a given operating pressure [43]. To illustrate this, the
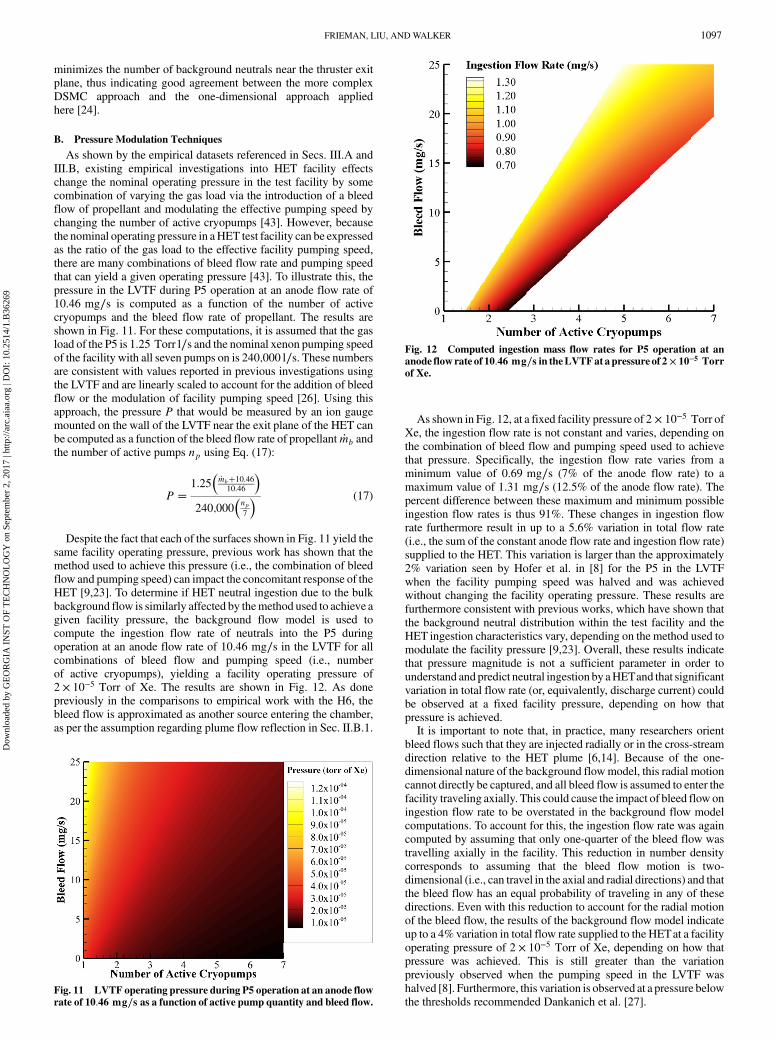
pressure in the LVTF during P5 operation at an anode flow rate of10.46 mg∕s is computed as a function of the number of activecryopumps and the bleed flow rate of propellant. The results areshown in Fig. 11. For these computations, it is assumed that the gasload of the P5 is 1.25 Torr l∕s and the nominal xenon pumping speed
of the facility with all seven pumps on is 240;000 l∕s. These numbersare consistent with values reported in previous investigations usingthe LVTF and are linearly scaled to account for the addition of bleedflow or the modulation of facility pumping speed [26]. Using this
approach, the pressure P that would be measured by an ion gaugemounted on the wall of the LVTF near the exit plane of the HET canbe computed as a function of the bleed flow rate of propellant _mb andthe number of active pumps np using Eq. (17):
P �1.25
�_mb�10.4610.46
�
240;000�np7
� (17)
Despite the fact that each of the surfaces shown in Fig. 11 yield thesame facility operating pressure, previous work has shown that themethod used to achieve this pressure (i.e., the combination of bleedflow and pumping speed) can impact the concomitant response of theHET [9,23]. To determine if HET neutral ingestion due to the bulk
background flow is similarly affected by themethod used to achieve agiven facility pressure, the background flow model is used tocompute the ingestion flow rate of neutrals into the P5 duringoperation at an anode flow rate of 10.46 mg∕s in the LVTF for all
combinations of bleed flow and pumping speed (i.e., numberof active cryopumps), yielding a facility operating pressure of2 × 10−5 Torr of Xe. The results are shown in Fig. 12. As donepreviously in the comparisons to empirical work with the H6, thebleed flow is approximated as another source entering the chamber,
as per the assumption regarding plume flow reflection in Sec. II.B.1.
As shown in Fig. 12, at a fixed facility pressure of 2 × 10⁻⁵ Torr ofXe, the ingestion flow rate is not constant and varies, depending on
the combination of bleed flow and pumping speed used to achievethat pressure. Specifically, the ingestion flow rate varies from a
minimum value of 0.69 mg∕s (7% of the anode flow rate) to a
maximum value of 1.31 mg∕s (12.5% of the anode flow rate). The
percent difference between these maximum and minimum possible
ingestion flow rates is thus 91%. These changes in ingestion flowrate furthermore result in up to a 5.6% variation in total flow rate
(i.e., the sum of the constant anode flow rate and ingestion flow rate)
supplied to the HET. This variation is larger than the approximately
2% variation seen by Hofer et al. in [8] for the P5 in the LVTF
when the facility pumping speed was halved and was achievedwithout changing the facility operating pressure. These results are
furthermore consistent with previous works, which have shown that
the background neutral distribution within the test facility and the
HET ingestion characteristics vary, depending on the method used tomodulate the facility pressure [9,23]. Overall, these results indicate
that pressure magnitude is not a sufficient parameter in order to
understand and predict neutral ingestion by aHETand that significant
variation in total flow rate (or, equivalently, discharge current) could
be observed at a fixed facility pressure, depending on how thatpressure is achieved.It is important to note that, in practice, many researchers orient
bleed flows such that they are injected radially or in the cross-stream
direction relative to the HET plume [6,14]. Because of the one-dimensional nature of the background flowmodel, this radial motion
cannot directly be captured, and all bleed flow is assumed to enter the
facility traveling axially. This could cause the impact of bleed flow on
ingestion flow rate to be overstated in the background flow model
computations. To account for this, the ingestion flow rate was againcomputed by assuming that only one-quarter of the bleed flow was
travelling axially in the facility. This reduction in number density
corresponds to assuming that the bleed flow motion is two-
dimensional (i.e., can travel in the axial and radial directions) and that
the bleed flow has an equal probability of traveling in any of thesedirections. Even with this reduction to account for the radial motion
of the bleed flow, the results of the background flow model indicate
up to a 4% variation in total flow rate supplied to the HETat a facility
operating pressure of 2 × 10⁻⁵ Torr of Xe, depending on how thatpressure was achieved. This is still greater than the variation
previously observed when the pumping speed in the LVTF was
halved [8]. Furthermore, this variation is observed at a pressure below
the thresholds recommended Dankanich et al. [27].Fig. 11 LVTF operating pressure during P5 operation at an anode flowrate of 10.46 mg∕s as a function of active pump quantity and bleed flow.
Fig. 12 Computed ingestion mass flow rates for P5 operation at ananode flow rate of 10.46 mg∕s in theLVTFat a pressure of 2 × 10⁻⁵ Torrof Xe.
FRIEMAN, LIU, ANDWALKER 1097
Dow
nloa
ded
by G
EO
RG
IA I
NST
OF
TE
CH
NO
LO
GY
on
Sept
embe
r 2,
201
7 | h
ttp://
arc.
aiaa
.org
| D
OI:
10.
2514
/1.B
3626
9
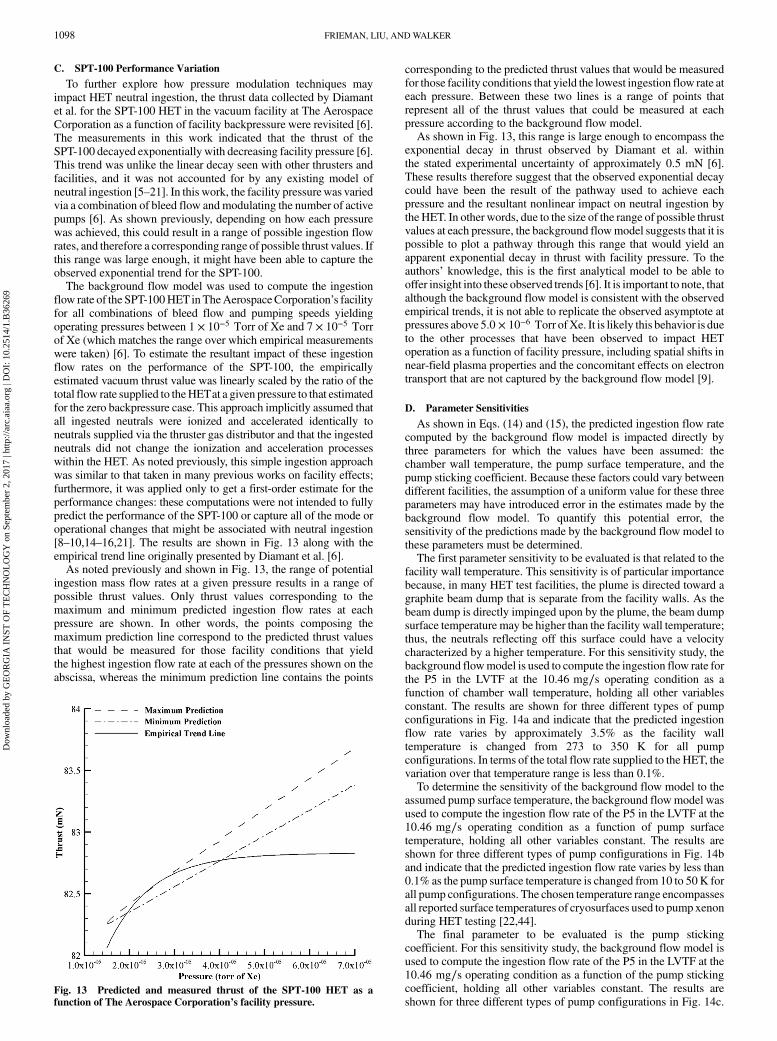
C. SPT-100 Performance Variation
To further explore how pressure modulation techniques mayimpact HET neutral ingestion, the thrust data collected by Diamantet al. for the SPT-100 HET in the vacuum facility at The AerospaceCorporation as a function of facility backpressure were revisited [6].The measurements in this work indicated that the thrust of theSPT-100 decayed exponentially with decreasing facility pressure [6].This trend was unlike the linear decay seen with other thrusters andfacilities, and it was not accounted for by any existing model ofneutral ingestion [5–21]. In this work, the facility pressurewas variedvia a combination of bleed flow andmodulating the number of activepumps [6]. As shown previously, depending on how each pressurewas achieved, this could result in a range of possible ingestion flowrates, and therefore a corresponding range of possible thrust values. Ifthis range was large enough, it might have been able to capture theobserved exponential trend for the SPT-100.The background flow model was used to compute the ingestion
flow rate of the SPT-100HET inTheAerospaceCorporation’s facilityfor all combinations of bleed flow and pumping speeds yieldingoperating pressures between 1 × 10⁻⁵ Torr of Xe and 7 × 10⁻⁵ Torrof Xe (which matches the range over which empirical measurementswere taken) [6]. To estimate the resultant impact of these ingestionflow rates on the performance of the SPT-100, the empiricallyestimated vacuum thrust value was linearly scaled by the ratio of thetotal flow rate supplied to theHETat a given pressure to that estimatedfor the zero backpressure case. This approach implicitly assumed thatall ingested neutrals were ionized and accelerated identically toneutrals supplied via the thruster gas distributor and that the ingestedneutrals did not change the ionization and acceleration processeswithin the HET. As noted previously, this simple ingestion approachwas similar to that taken in many previous works on facility effects;furthermore, it was applied only to get a first-order estimate for theperformance changes: these computations were not intended to fullypredict the performance of the SPT-100 or capture all of the mode oroperational changes that might be associated with neutral ingestion[8–10,14–16,21]. The results are shown in Fig. 13 along with theempirical trend line originally presented by Diamant et al. [6].As noted previously and shown in Fig. 13, the range of potential
ingestion mass flow rates at a given pressure results in a range ofpossible thrust values. Only thrust values corresponding to themaximum and minimum predicted ingestion flow rates at eachpressure are shown. In other words, the points composing themaximum prediction line correspond to the predicted thrust valuesthat would be measured for those facility conditions that yieldthe highest ingestion flow rate at each of the pressures shown on theabscissa, whereas the minimum prediction line contains the points
corresponding to the predicted thrust values that would be measuredfor those facility conditions that yield the lowest ingestion flow rate ateach pressure. Between these two lines is a range of points thatrepresent all of the thrust values that could be measured at eachpressure according to the background flow model.As shown in Fig. 13, this range is large enough to encompass the
exponential decay in thrust observed by Diamant et al. withinthe stated experimental uncertainty of approximately 0.5 mN [6].These results therefore suggest that the observed exponential decaycould have been the result of the pathway used to achieve eachpressure and the resultant nonlinear impact on neutral ingestion bythe HET. In other words, due to the size of the range of possible thrustvalues at each pressure, the background flowmodel suggests that it ispossible to plot a pathway through this range that would yield anapparent exponential decay in thrust with facility pressure. To theauthors’ knowledge, this is the first analytical model to be able tooffer insight into these observed trends [6]. It is important to note, thatalthough the background flow model is consistent with the observedempirical trends, it is not able to replicate the observed asymptote atpressures above 5.0 × 10⁻⁶ Torr ofXe. It is likely this behavior is dueto the other processes that have been observed to impact HEToperation as a function of facility pressure, including spatial shifts innear-field plasma properties and the concomitant effects on electrontransport that are not captured by the background flow model [9].
D. Parameter Sensitivities
As shown in Eqs. (14) and (15), the predicted ingestion flow ratecomputed by the background flow model is impacted directly bythree parameters for which the values have been assumed: thechamber wall temperature, the pump surface temperature, and thepump sticking coefficient. Because these factors could vary betweendifferent facilities, the assumption of a uniform value for these threeparameters may have introduced error in the estimates made by thebackground flow model. To quantify this potential error, thesensitivity of the predictions made by the background flow model tothese parameters must be determined.The first parameter sensitivity to be evaluated is that related to the
facility wall temperature. This sensitivity is of particular importancebecause, in many HET test facilities, the plume is directed toward agraphite beam dump that is separate from the facility walls. As thebeam dump is directly impinged upon by the plume, the beam dumpsurface temperature may be higher than the facility wall temperature;thus, the neutrals reflecting off this surface could have a velocitycharacterized by a higher temperature. For this sensitivity study, thebackground flowmodel is used to compute the ingestion flow rate forthe P5 in the LVTF at the 10.46 mg∕s operating condition as afunction of chamber wall temperature, holding all other variablesconstant. The results are shown for three different types of pumpconfigurations in Fig. 14a and indicate that the predicted ingestionflow rate varies by approximately 3.5% as the facility walltemperature is changed from 273 to 350 K for all pumpconfigurations. In terms of the total flow rate supplied to the HET, thevariation over that temperature range is less than 0.1%.To determine the sensitivity of the background flow model to the
assumed pump surface temperature, the background flowmodel wasused to compute the ingestion flow rate of the P5 in the LVTF at the10.46 mg∕s operating condition as a function of pump surfacetemperature, holding all other variables constant. The results areshown for three different types of pump configurations in Fig. 14band indicate that the predicted ingestion flow rate varies by less than0.1% as the pump surface temperature is changed from 10 to 50K forall pump configurations. The chosen temperature range encompassesall reported surface temperatures of cryosurfaces used to pumpxenonduring HET testing [22,44].The final parameter to be evaluated is the pump sticking
coefficient. For this sensitivity study, the background flow model isused to compute the ingestion flow rate of the P5 in the LVTF at the10.46 mg∕s operating condition as a function of the pump stickingcoefficient, holding all other variables constant. The results areshown for three different types of pump configurations in Fig. 14c.
Fig. 13 Predicted and measured thrust of the SPT-100 HET as afunction of The Aerospace Corporation’s facility pressure.
1098 FRIEMAN, LIU, ANDWALKER
Dow
nloa
ded
by G
EO
RG
IA I
NST
OF
TE
CH
NO
LO
GY
on
Sept
embe
r 2,
201
7 | h
ttp://
arc.
aiaa
.org
| D
OI:
10.
2514
/1.B
3626
9

The observed sensitivity to the pump sticking coefficient is largerthan that observed for either the chamber wall temperature or thepump surface temperature. As the pump sticking coefficient ischanged from 0.3 to 0.8, the HET ingestion flow rate decreases by anaverage of 60% for all pump configurations.This largevariation is expectedbecause thepumpsticking coefficient
determines the effectivenesswithwhich the cryosurfaces removexenonfrom the background flow environment, and thus can have similarinfluence to the addition of extra pumping surfaces. However, becausethe ingestion flow rate represents such a small fraction of total flowsupplied to the HET, the variation in total flow is less than 3%.Furthermore, the assumed sticking coefficient of 0.4 is empiricallydetermined for the LVTF using detailed maps of the neutral densityinside of the facility during HEToperation [22,26]. As the majority ofthe empirical results used for comparison are acquired in the LVTF, it isexpected that the error associatedwith this choice of sticking coefficientis minimal. Therefore, overall, the background flow model showsminimal sensitivity to the assumed empirical parameters.
E. Discussion of the One-Dimensional Flow Assumption
Among the assumptions discussed in Sec. II.B.1, perhaps the mostrestrictive is the assumption of a one-dimensional background flow.Although consistent with the approach taken by Cai et al., it isnonetheless worthwhile to discuss the relevance of this assumptionand resultant impacts on the model, as well as the results it generates[22,30,36]. The first implication of this assumption is that thebackground neutrals are constrained to move only in the axialdirection. To assess the validity of this constraint, it is necessary todiscuss the typical reflection geometry in HET ground test facilities.
In the facilities mentioned as part of this work, the HET plume flow is
directed toward a carbon beam dump composed of several flat
graphite panels [45]. As the HET plume is axially accelerated, the
incident particles reflect off these flat surfaces with a bulk velocity
that is primarily oriented in the axial direction, thus minimizing the
error associated with the one-dimensional flow assumption for the
facilities used in this work [46]. This rationale has been empirically
supported by pressure measurements, which have found minimal
bulk background gas entrainment into radially facing gauges but
significant entrainment into gauges facing axially [23]. This suggests
that the bulk flow of the background gas is primarily in the axial
direction. The impact of nonflat plume reflection geometries on the
validity of the one-dimensional flow assumption is not presently clear
and will be explored in future work.By assuming a one-dimensional flow, all collisions between the
background neutrals and facility sidewalls are also neglected. These
collisions modify the speed distribution of the background neutrals.
As per the assumptions laid out in Sec. II.B.1, upon colliding with
the facility sidewall, an incident neutral will thermalize, and thus be
reflectedwith a speed characterized by the facilitywall temperature.
For incident particles with speeds characterized by another
temperature (i.e., those at pump temperature), these collisions will
then result in a change in velocity and a concomitant change in
number density as per Eq. (5). To assess the error associated with
neglecting this effect, the background flow model was used to
compute the ingestion mass flow rate for the P5 HEToperating in a
facility with 10 pumps located downstream of the HET. The
downstream pump-only configuration is selected because it
maximizes the population of neutrals crossing surface D in the
Fig. 14 Results sensitivity to a) chamber wall temperature, b) pump surface temperature, and c) pump sticking coefficient.
FRIEMAN, LIU, ANDWALKER 1099
Dow
nloa
ded
by G
EO
RG
IA I
NST
OF
TE
CH
NO
LO
GY
on
Sept
embe
r 2,
201
7 | h
ttp://
arc.
aiaa
.org
| D
OI:
10.
2514
/1.B
3626
9

upstream direction with a speed characterized by a temperature otherthan the facility wall temperature, thus representing the worst-caseestimate of the error. The ingestion flow rate is then computed again,assuming all particles not at wall temperature undergo a sidewallcollision before crossing surface D, which again represents theworst-case deviation from the model assumptions. The deviation betweenthis result and the one computed neglecting the sidewall effects differsby less than 1%.
V. Conclusions
This work expanded the background flowmodel first proposed byCai et al. and explored the applicability of this approach to modelingneutral ingestion by HETs [22]. The original model was furtherdeveloped and generalized to describe the background flowenvironment in facilities with any combination of end dome,upstream, and downstream pumps; and analytic expressions weredeveloped for the ingestion flow rate of a HET due to the backgroundneutral flow within the facility. The predictions generated by theseexpressions were compared against empirical data taken with the P5,H6, and SPT-100 HETs in two different facilities and found to matchthe empirical observations to within the experimental uncertainty.These predictions were furthermore shown to be 40 to 70% moreaccurate than those generated using the thermal model mostcommonly used to predict and estimate neutral ingestion by HETs;and they were found equally as accurate as specific semiempiricalmodels developed for the P5 andH6, without requiring any empiricalinputs such as in situ pressure measurements [14,15,21]. Thedemonstrated improvement over the thermal model as well as thedemonstrated accuracy in predicting empirical measurements for avariety of thrusters and facilities is, to the authors’ knowledge, uniqueto the background flow model, thus lending credibility to thismodeling approach and supporting its value as a predictive analyticaltool [5–21].The validated background flow model was used to assess the
impact of parameters that often vary between different test facilitiesand test campaigns on HET neutral ingestion. It was shown thatneutral ingestion could vary by asmuch as 24%, depending onwherethe pumpswere placedwithin a test facility; the lowest ingestion flowrates occurred for facilities with the maximum number of pumpslocated downstream of the HET. The impact of pressure modulationtechniques onHETneutral ingestionwas also investigated, and it wasshown that the ingestion flow rate of a HET could vary by as much as91% at a fixed facility pressure of 2 × 10⁻⁵ Torr of Xe, depending onthe combination of bleed flow and pumping speed used to achievethat pressure. This resulted in a band of possible ingestion flow ratesand performance characteristics at a given pressure that was largeenough to capture the empirically observed exponential decay of thethrust of the SPT-100 with decreasing facility pressure [6]. Thesensitivity of these results to the assumed parameters of chamber walltemperature, pump surface temperature, and pump stickingcoefficient were assessed and shown to be less than 3% of thepredicated total HET flow. Overall, these results indicated thatpressure magnitude is not a sufficient variable for quantifying neutralingestion by a HET, and that other test variables (i.e., pressuremodulation technique)must be specified and held constant in order tofully describe HET ingestion characteristics.
References
[1] Brophy, J. R., Friedman, L., and Culik, F., “Asteroid RetrievalFeasibility,” 2012 IEEE Aerospace Conference, IEEE, Piscataway, NJ,2012, pp. 1–16.doi:10.1109/AERO.2012.6187031
[2] Brophy, J. R., “Advanced Solar Electric Propulsion for PlanetaryDefense andAsteroid ResourceUtilization,” 34th International ElectricPropulsion Conference, Electric Rocket Propulsion Society, IEPCPaper 2015-065, Fairview Park, OH, 2015.
[3] Marchandise, F. R., and Koppel, C. R., “Electric Propulsion for DeepSpace: A Study Case «JUpiter ICy Moon» with EP,” 34th InternationalElectric Propulsion Conference, Electric Rocket Propulsion Society,IEPC Paper 2015-065, Fairview Park, OH, 2015.
[4] Semenkin, A., Kim,V., Gorshkov, O., and Jankovsky, R., “Developmentof Electric Propulsion Standards-Current Status and Further Activity,”27th International Electric Propulsion Conference, Electric RocketPropulsion Society, IEPC Paper 2001-070, Fairview Park, OH, 2001.
[5] Brown, D. L., and Gallimore, A. D., “Evaluation of Plume Divergenceand Facility Effects on Far-Field Faraday Probe Current Density
Profiles,” 31st International Electric Propulsion Conference, Electric
Rocket Propulsion Society, IEPC Paper 2009-030, Fairview Park, OH,
2009.[6] Diamant, K. D., Liang, R., and Corey, R. L., “The Effect of Background
Pressure on SPT-100 Hall Thruster Performance,” 50th AIAA/ASME/
SAE/ASEE Joint Propulsion Conference and Exhibit, AIAA Paper
2014-3710, 2014,
doi:10.2514/6.2014-3710[7] Goebel, D. M., and Katz, I., Fundamentals of Electric Propulsion: Ion
and Hall Thrusters, Wiley, Hoboken, NJ, 2008, pp. 32–34, 325–384,
463–467.[8] Hofer, R. R., Peterson, P. Y., and Gallimore, A. D., “Characterizing
Vacuum Facility Backpressure Effects on the Performance of a Hall
Thruster,” 27th International Electric Propulsion Conference, Electric
Rocket Propulsion Society, IEPC Paper 2001-045, Fairview Park, OH,
2001.[9] Hofer, R. R., and Anderson, J. R., “Finite Pressure Effects in
Magnetically Shielded Hall Thrusters,” 50th AIAA/ASME/SAE/ASEE
Joint Propulsion Conference and Exhibit, AIAA Paper 2014-3709,
2014.
doi:10.2514/6.2014-3709[10] Huang, W., Kamhawi, H., Lobbia, R. B., and Brown, D. L., “Effect of
Background Pressure on the Plasma Oscillation Characteristics of the
HiVHAcHall Thruster,” 50th AIAA/ASME/SAE/ASEE Joint Propulsion
Conference and Exhibit, AIAA Paper 2014-3708, 2014.
doi:10.2514/6.2014-3708[11] Kamhawi, H., Huang, W., Haag, T., and Spektor, R., “Investigation of
the Effects of Facility Background Pressure on the Performance and
Voltage-Current Characteristics of the High Voltage Hall Accelerator,”
50th AIAA/ASME/SAE/ASEE Joint Propulsion Conference and Exhibit,
AIAA Paper 2014-3707, 2014.
doi:10.2514/6.2014-3707[12] Nakles,M. R., and Hargus,W. A., “Background Pressure Effects on Ion
Velocity Distribution Within a Medium-Power Hall Thruster,” Journalof Propulsion and Power, Vol. 27, No. 4, 2011, pp. 737–743.doi:10.2514/1.48027
[13] Randolph, T., Kim,V., Kaufman,H.R., Kozubsky,K., Zhurin,V.V., andDay, M., “Facility Effects on Stationary Plasma Thruster Testing,” 23rdInternational Electric Propulsion Conference, Electric RocketPropulsion Society, IEPC Paper 1993-093, Fairview Park, OH, 1993.
[14] Reid, B. M., “The Influence of Neutral Flow Rate in the Operation ofHall Thrusters,” Ph.D. Dissertation, Aerospace Engineering Dept.,Univ. of Michigan, Ann Arbor, MI, 2009, pp. 306–319.
[15] Reid, B. M., “Empirically-Derived Corrections for Facility Effects inPerformance and Plume Measurements of Hall Thrusters,” 34th
International Electric Propulsion Conference, Electric RocketPropulsion Society, IEPC Paper 2015-362, Fairview Park, OH, 2015.
[16] Tighe, W. G., Spektor, R., Diamant, K., and Kamhawi, H., “Effects ofBackground Pressure on the NASA 173M Hall Current ThrusterPerformance,” 34th International Electric Propulsion Conference,Electric Rocket Propulsion Society, IEPC Paper 2015-152, FairviewPark, OH, 2015.
[17] Byers, D., and Dankanich, J., “A Review of Facility Effects on HallEffect Thrusters,” 31st International Electric Propulsion Conference,Electric Rocket Propulsion Society, IEPC Paper 2009-076, FairviewPark, OH, 2009.
[18] Crofton, M. W., and Pollard, J., “Thrust Augmentation by ChargeExchange,” 49th AIAA/ASME/SAE/ASEE Joint Propulsion Conference
and Exhibit, AIAA Paper 2013-4131, 2013.doi:10.2514/6.2013-4131
[19] Diamant, K., Spektor, R., Beiting, E., Young, J., Curtiss, T., andCorporation, T. A., “The Effects of Background Pressure on HallThruster Operation,” 48th AIAA/ASME/SAE/ASEE Joint Propulsion
Conference and Exhibit, AIAA Paper 2012-3735, 2012.doi:10.2514/6.2012-3735
[20] Huang,W., Kamhawi, H., andHaag, T., “Effect of Background Pressureon the Performance and Plume of the HiVHAc Hall Thruster,” 33rd
International Electric Propulsion Conference, Electric RocketPropulsion Society, IEPC Paper 2013-058, Fairview Park, OH, 2013.
[21] Walker,M. L. R., andGallimore, A.D., “PerformanceCharacteristics ofa Cluster of 5-kW Laboratory Hall Thrusters,” Journal of Propulsion
and Power, Vol. 23, No. 1, 2007, pp. 35–43.doi:10.2514/1.19752
1100 FRIEMAN, LIU, ANDWALKER
Dow
nloa
ded
by G
EO
RG
IA I
NST
OF
TE
CH
NO
LO
GY
on
Sept
embe
r 2,
201
7 | h
ttp://
arc.
aiaa
.org
| D
OI:
10.
2514
/1.B
3626
9
[22] Cai, C., Boyd, I. D., and Sun,Q., “FreeMolecular Background Flow in aVacuum Chamber Equipped with Two-Sided Pumps,” Journal of
Vacuum Science and Technology A: Vacuum, Surfaces, and Films,Vol. 24, No. 1, 2006, pp. 9–19.doi:10.1116/1.2126678
[23] Yim, J., and Burt, J. M., “Characterization of Vacuum FacilityBackground Gas Through Simulation and Considerations for ElectricPropulsion Ground Testing,” 51st AIAA/SAE/ASEE Joint Propulsion
Conference, AIAA Paper 2015-3825, 2015.doi:10.2514/6.2015-3825
[24] Nakayama,Y., andNakamura,M., “Electric Propulsion Propellant Flowwithin Vacuum Chamber,” 34th International Electric Propulsion
Conference, Electric Rocket Propulsion Society, IEPCPaper 2015-360,Fairview Park, OH, 2015.
[25] Frieman, J. D., King, S. T.,Walker,M. L., andKhayms,V., “PreliminaryAssessment of the Role of a Conducting Vacuum Chamber in the HallEffect Thruster Electrical Circuit,” 50th AIAA/ASME/SAE/ASEE Joint
Propulsion Conference and Exhibit, AIAA Paper 2014-3712, 2014.doi:10.2514/6.2014-3712
[26] Walker, M. L. R., “Effects of Facility Backpressure on the PerformanceandPlumeof aHallThruster,”Ph.D.Dissertation,AerospaceEngineeringDept., Univ. of Michigan, Ann Arbor, MI, 2005, pp. 111–155.
[27] Dankanich, J., Walker, M. L. R., Swiatek, M., and Yim, J.,“Recommended Practice for PressureMeasurements and Calculation ofEffective Pumping Speeds During Electric Propulsion Testing,” 33rd
International Electric Propulsion Conference, Electric RocketPropulsion Society, IEPC Paper 2013-358, Fairview Park, OH, 2013.
[28] Frieman, J. D., King, S. T., Walker, M. L. R., Khayms, V., and King, D.,“Role of a Conducting Vacuum Chamber in the Hall Effect ThrusterElectrical Circuit,” Journal of Propulsion and Power, Vol. 30, No. 6,2014, pp. 1471–1479.doi:10.2514/1.B35308
[29] Anderson, J. D., Fundamentals of Aerodynamics, McGraw–HillEducation, New York, 2010, pp. 54–57.
[30] Cai, C., “Theoretical and Numerical Studies of Plume Flows in VacuumChambers,” Ph.D. Dissertation, Aerospace Engineering Dept., Univ. ofMichigan, Ann Arbor, MI, 2005, pp. 22–76.
[31] Choueiri, E. Y., “Plasma Oscillations in Hall Thrusters,” Physics of
Plasmas, Vol. 8, No. 4, 2001, pp. 1411–1426.doi:10.1063/1.1354644
[32] Ketsdever, A. D., “Design Considerations for Cryogenic PumpingArrays in Spacecraft–Thruster Interaction Facilities,” Journal of
Spacecraft and Rockets, Vol. 38, No. 3, 2001, pp. 400–410.doi:10.2514/2.3698
[33] Cedolin, R. J., Hargus, W. A., Storm, P. V., Hanson, R. K., and Cappelli,M. A., “Laser-Induced Fluorescence Study of a Xenon Hall Thruster,”AppliedPhysicsB: Lasers andOptics, Vol. 65,No. 4, 1997, pp. 459–469.doi:10.1007/s003400050297
[34] Boyd, I. D., “A Review of Hall Thruster Plume Modeling,” 38th
Aerospace SciencesMeeting andExhibit, AIAAPaper 2000-0466, 2000.doi:10.2514/6.2000-466
[35] Walker, M. L. R., and Gallimore, A. D., “Neutral Density Map ofHall Thruster Plume Expansion in a Vacuum Chamber,” Review of
Scientific Instruments, Vol. 76, No. 5, 2005, Paper 053509.doi:10.1063/1.1915011
[36] Cai, C., Boyd, I., and Sun, Q., “Rarefied Background Flow ina Vacuum Chamber Equipped with One-Sided Pumps,” Journal of
Thermophysics and Heat Transfer, Vol. 20, No. 3, July 2006,pp. 524–535.doi:10.2514/1.19178
[37] Walker, M., Gallimore, A., Cai, C., and Boyd, I., “Pressure Map of aFacility as a Function of FlowRate to StudyFacility Effects,” 38thAIAA/ASME/SAE/ASEE Joint Propulsion Conference and Exhibit, AIAAPaper 2002-3815, 2002.doi:10.2514/6.2002-3815
[38] Martinez,R., Dao,H.,Walker,M., andTech,G., “PowerDeposition intothe Discharge Channel of a Hall Effect Thruster,” Journal of Propulsionand Power, Vol. 30, No. 1, Jan. 2014, pp. 209–220.doi:10.2514/1.B34897
[39] Boyd, I. D., and Dressler, R. A., “Far Field Modeling of the PlasmaPlume of a Hall thruster,” Journal of Applied Physics, Vol. 92, No. 4,2002, pp. 1764–1774.doi:10.1063/1.1492014
[40] Reid, B. M., and Gallimore, A. D., “Review of Hall Thruster NeutralFlow Dynamics,” 30th International Electric Propulsion Conference,Electric Rocket Propulsion Society, IEPC Paper 2007-038, FairviewPark, OH, 2007.
[41] Hofer, R., “Development and Characterization of High-Efficiency,High-Specific Impulse Xenon Hall Thrusters,” Ph.D. Dissertation,Aerospace EngineeringDept.,Univ. ofMichigan,AnnArbor,MI, 2004,pp. 67–69.
[42] Sekerak,M. J., “PlasmaOscillations andOperationModes inHall EffectThrusters,” Ph.D. Dissertation, Aerospace Engineering Dept., Univ. ofMichigan, Ann Arbor, MI, 2014, pp. 55–58.
[43] Dushman, S., and Lafferty, J. M., Scientific Foundations of Vacuum
Technique, Wiley, New York, 1962, pp. 347–374.[44] Garner, C., Polk, J., Brophy, J., and Goodfellow, K., “Methods for
Cryopumping Xenon,” 32nd Joint Propulsion Conference and Exhibit,AIAA Paper 1996-3206, 1996.doi:10.2514/6.1996-3206
[45] Huang,W., Gallimore, A.D., andHofer, R. R., “Neutral FlowEvolutionin a Six-Kilowatt Hall Thruster,” Journal of Propulsion and Power,Vol. 27, No. 3, May 2011, pp. 553–563.doi:10.2514/1.B34048
[46] Pollard, J. E., and Beiting, E. J., “Ion Energy, Ion Velocity, and ThrustVector Measurements for the SPT-140 Hall Thruster,” Proceedings
of the 3rd International Conference on Spacecraft Propulsion,3AF: Assoc. Aéronautique Astronautique de France, Paris, 2000,pp. 789–796.
J. BlandinoAssociate Editor
FRIEMAN, LIU, ANDWALKER 1101
Dow
nloa
ded
by G
EO
RG
IA I
NST
OF
TE
CH
NO
LO
GY
on
Sept
embe
r 2,
201
7 | h
ttp://
arc.
aiaa
.org
| D
OI:
10.
2514
/1.B
3626
9