Embed Size (px)
Citation preview
EMISSION FACTOR DOCUMENTATION FOR AP-42 SECTION 1.4 NATURAL GAS COMBUSTION
Prepared for:
Office of Air Quality Planning and StandardsU.S. Environmental Protection Agency
Research Triangle Park, NC
Prepared by:
Eastern Research Group1600 Perimeter Park
Morrisville, NC 27560
March 1998

ii
TABLE OF CONTENTS
Section Page 1.0 Introduction . . . . . . . . . . . . . . . . . . . . . . . . . . . . . . . . . . . . . . . . . . . . . . . . . . . . . . . . . . . . . . . . . 1.1
1.1 Reasons For Updating . . . . . . . . . . . . . . . . . . . . . . . . . . . . . . . . . . . . . . . . . . . . . . . . . . 1.11.2 References For Section 1 . . . . . . . . . . . . . . . . . . . . . . . . . . . . . . . . . . . . . . . . . . . . . . . . 1.2
2.0 Literature Search and Screening . . . . . . . . . . . . . . . . . . . . . . . . . . . . . . . . . . . . . . . . . . . . . . . . . 2.12.1 Emission Data Quality Rating System . . . . . . . . . . . . . . . . . . . . . . . . . . . . . . . . . . . . . . 2.12.2 Review of Data Sets . . . . . . . . . . . . . . . . . . . . . . . . . . . . . . . . . . . . . . . . . . . . . . . . . . . . 2.32.3 References For Section 2 . . . . . . . . . . . . . . . . . . . . . . . . . . . . . . . . . . . . . . . . . . . . . . . . 2.7
3.0 AP-42 Section Development . . . . . . . . . . . . . . . . . . . . . . . . . . . . . . . . . . . . . . . . . . . . . . . . . . . . 3.13.1 Revisions to Section Narrative . . . . . . . . . . . . . . . . . . . . . . . . . . . . . . . . . . . . . . . . . . . 3.13.2 Pollutant Emission Factor Development . . . . . . . . . . . . . . . . . . . . . . . . . . . . . . . . . . . . 3.1
3.2.1 Database Design . . . . . . . . . . . . . . . . . . . . . . . . . . . . . . . . . . . . . . . . . . . . . . . . 3.13.2.2 Results of Data Analysis . . . . . . . . . . . . . . . . . . . . . . . . . . . . . . . . . . . . . . . . . . 3.5
3.3 Emission Factor Quality Rating System . . . . . . . . . . . . . . . . . . . . . . . . . . . . . . . . . . . . 3.83.4 Emission Factors . . . . . . . . . . . . . . . . . . . . . . . . . . . . . . . . . . . . . . . . . . . . . . . . . . . . . 3.113.5 Peer Review Process . . . . . . . . . . . . . . . . . . . . . . . . . . . . . . . . . . . . . . . . . . . . . . . . . . 3.113.6 References for Section 3 . . . . . . . . . . . . . . . . . . . . . . . . . . . . . . . . . . . . . . . . . . . . . . . 3.11
4.0 AP-42 Section 1.4 . . . . . . . . . . . . . . . . . . . . . . . . . . . . . . . . . . . . . . . . . . . . . . . . . . . . . . . . . . . . 4.1
Appendix A - Acid Rain Division Data
Appendix B - Reviewer Comments and EPA Responses

iii
TABLES
Page
2.2-1 SUMMARY OF REFERENCES USED IN THE REVISION OF SECTION 1.4 . . . . . . . . . . . 2.43.2-1 SNCR TEST RESULTS FOR WALL-FIRED BOILERS (NOx) . . . . . . . . . . . . . . . . . . . . . . . . 3.93.2-2 SNCR TEST RESULTS FOR TANGENTIAL-FIRED BOILERS (NOx) . . . . . . . . . . . . . . . . 3.103.4-1 SUMMARY OF EMISSION FACTORS FOR AP-42 SECTION 1.4 . . . . . . . . . . . . . . . . . . . 3.13
1.1B01S04.WPD
Emission Factor Documentation for AP-42 Section 1.4 Natural Gas Combustion
1.0 Introduction
The revised AP-42 section described in this report replaces the section published in September1996 as Supplement B to the Fifth Edition. This background report replaces the Emission Factor (EMF)Documentation for AP-42 Section 1.4, Natural Gas Combustion, issued April 1993. The purpose of thisbackground report is to provide technical documentation supporting the Supplement D revisions toAP-42 Section 1.4.
The EPA publishes emission factors in its Compilation of Air Pollutant Emission Factors, EPAPublication No. AP-42 (AP-42). The document has been published since 1972 as the primarycompilation of EPA’s emission factor information. Federal, State and local agencies, consultants, andindustry use the document to identify major contributors of atmospheric pollutants, develop emissioncontrol strategies, determine applicability of permitting programs, and compile emission inventories forambient air impact analyses and State Implementation Plans (SIPs). Volume 1, Stationary Sources ispublished by Emission Factor Inventory Group (EFIG) in EPA’s Office of Air Quality Planning andStandards (OAQPS).
1.1 Reasons For Updating
The Clean Air Act Amendments of 1990 added greatly to the number of air pollution sources forwhich emission factor development was required, and also called for the improvement of existing factors. There are several reasons for updating or revising AP-42 sections and emission factors.
C New Standard. After the proposal of a standard, the EPA reviews the available materialto determine if sufficient information has been gathered to support the development ofemission factors for the industry or process being studied. Oftentimes, the proposal ordevelopment of a new standard for a source or source category will trigger a re-evaluation of emission factors for a particular source. In the proposal of a standard, theproposal team gathers tremendous amounts of data to support the standard, much moredata than is typically gathered for AP-42. The proposal team may compare their newdata with existing information used to develop AP-42 emission factors. If, in thecomparison, the team discovers a deficiency in the existing information, they may turntheir data over to EFIG, who in turn may use the information to improve emissionfactors.
C Outside Requests. The EPA receives requests for better source and emission factorinformation. Requests may come from other Office of Air Quality Planning andStandards (OAQPS) branches, EPA laboratories and regional offices, State agencies,trade associations, special interest groups, or private individuals. The requests may takethe form of directives, letters, oral inquiries, or comments on published emission factors.
C Improvement of the National Inventory. The EPA may determine that a particular sourcecategory is a significant contributor to the National Inventory and that EPA shoulddevelop or improve emission factors.
1.2B01S04.WPD
C New Information. New information will be useful that may have been developedinitially for Emission Standards Division (ESD) background documents involving newsource performance standards (NSPS), national emission standards for hazardous airpollutants (NESHAP), and Control Techniques Guidelines (CTG), and reports by variousEPA laboratories.
C Contractor Expertise. A contractor or consultant may have gained expertise on a sourcecategory during previous work, either for EPA or for other clients, and may warrantconsidering a relatively low-expense update and expansion of available information.
Section 1.4 has been updated to incorporate new available data on this source category. Newinformation has been used to better characterize this source category, develop improved volatile organiccompound (VOC) and particulate matter (PM) emission factors, and update criteria pollutant emissionfactors. In response to the upcoming NESHAP for this source category, an expanded hazardous airpollutant (HAP) emission factor list has also been provided.
This background report consists of four sections. This introduction provides backgroundinformation on AP-42 and documents such as this one that are issued to update sections of AP-42. Section 2 presents the data search and screening steps, discusses the references used to revise AP-42Section 1.4, and defines the emissions data quality rating system. Section 3 discusses overall revisionsto AP-42 Section 1.4, provides details about the database built for storing the available data, presents thecalculations used to calculate emission factors, and defines the emission factor quality rating system. Section 4 presents the proposed revision of the existing AP-42 section as it would appear inSupplement D.
1.2 References For Section 1
1. Procedures For Preparing Emission Factor Documents, Third Revised Draft Version, Office OfAir Quality Planning And Standards, U.S. EPA, Research Triangle Park, NC 27711, November 1996.
2.1B01S04.WPD
2.0 Literature Search and Screening
Data used in this section were obtained from a number of sources within OAQPS and fromoutside organizations. The AP-42 background files were reviewed for information on these sources,demonstrated pollution control technologies, and emissions data. The Factor Information RetrievalSystem (FIRE) was searched for emission data on natural gas-fired combustion sources. The Source TestInformation Retrieval System (STIRS) data set, compiled by EFIG, was reviewed and provided emissionsdata from several sources. The STIRS data set is a collection of emission test reports that have beenscanned and stored on CD-ROM.
In the review of available references, emissions data were accepted if:
C sufficient information about the combustion source and any pollution control deviceswas given.
C the test report identified if the emissions tests were conducted before or after a pollutioncontrol device.
C emission levels were measured by currently accepted test methods.
C emission test results were reported in units which could be converted into the reportingunits selected for this AP-42 section.
C sufficient data existed to characterize operating conditions.
2.1 Emission Data Quality Rating System1
After reviewing the test reports, it should be possible to assign a data quality rating to eachpollutant emission rate for each test series. The individual data quality ratings are not to be confusedwith the overall emission factor ratings. The data quality ratings are an appraisal of the reliability of thebasic emission data that will be used to later develop the factor.
Test data quality is rated A through D, based on the following criteria:
A - Tests are performed by a sound methodology and are reported in enough detail foradequate validation.
B - Tests are performed by a generally sound methodology, but lacking enough detail foradequate validation.
C - Tests are based on an unproven or new methodology, or are lacking a significant amountof background information.
D - Tests are based on a generally unacceptable method, but the method may provide anorder-of-magnitude value for the source.

2.2B01S04.WPD
The quality rating of test data helps identify good data, even when it is not possible to extract afactor representative of a typical source in the category from those data. For example, the data from agiven test may be good enough for a data quality rating of “A,” but the test may be for a unique feedmaterial, or the production specifications may be either more or less stringent than at the typical facility.
In following the general guidelines discussed above, four specific criteria can be considered toevaluate the emission data to ensure that the data are based on a sound methodology, and documentationprovides adequate detail. A test series is initially rated “A through D” in each of the following fourareas.
C Source operation. If the manner in which the source was operated is well documented inthe report, and the source was operating within typical parameters during the test, an Arating should be assigned. If the report stated parameters were typical, but lackeddetailed information, a B rating is assigned. If there is reason to believe operation wasnot typical, a C or D rating is assigned.
C Test method and sampling procedures. In developing ratings, the accuracy of the testmethod as well as the adequacy of the documentation are considered. In general, if acurrent EPA reference test method appropriate for the source was followed, the ratingshould be higher (A or B). If other methods are used, an assessment is made of theirvalidity. If it is judged that the method was likely to be inaccurate or biased, a lowerrating (C or D) is given. A complete report should indicate whether any proceduresdeviated from standard methods and explain any deviations. If deviations were reported,an evaluation is made of whether these were likely to influence the test results.
C Sampling and process data. During testing, many variations can occur without warningand sometimes without being noticed. Such variations can induce wide deviations insampling results. If a large spread between test run results cannot be explained byinformation contained in the site test report or from test reports of other sources, the dataare suspect and are given a lower rating. However, it should be recognized that a processmay have highly variable emissions and a lower rating may not be appropriate solely onthe basis of wide deviations in sampling results.
C Analysis and calculations. Ideally, test reports should contain original raw data sheetsand other QA documentation. If there are data sheets, the nomenclature and equationsused are compared with those specified by EPA to establish equivalency. The depth ofreview of the calculations is dictated by the reviewers’ confidence in the ability andconscientiousness of the tester, based on such factors as consistency of results andcompleteness of other areas of the test report. Reports may indicate that raw data sheetswere available but were not included. If the test report is of high quality based on theother criteria, the quality rating should not be lowered due to a lack of data sheets.
An overall emission data quality rating is developed considering the scores on the four criteria. There is no precise equation for the relative weighting of the factors, because each report presentsdifferent issues, and the rating system needs to provide flexibility to consider the strengths andweaknesses of each test series and reach a judgment on the overall rating. However, the two criteriaconcerning (1) the test method and sampling procedures and (2) the sampling and process data should be

2.3B01S04.WPD
weighted most heavily. If either of these two criteria are assigned a low rating, this low rating should beassigned as the overall data quality rating, no matter how complete the documentation is.
2.2 Review of Data Sets
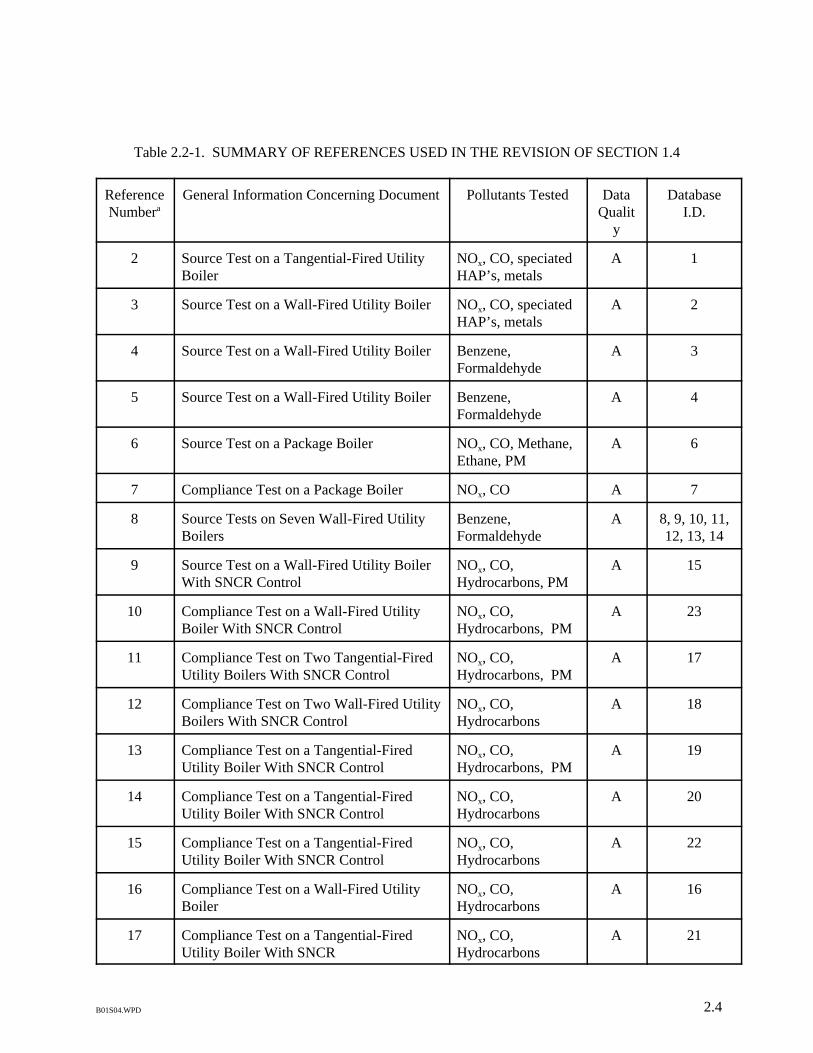
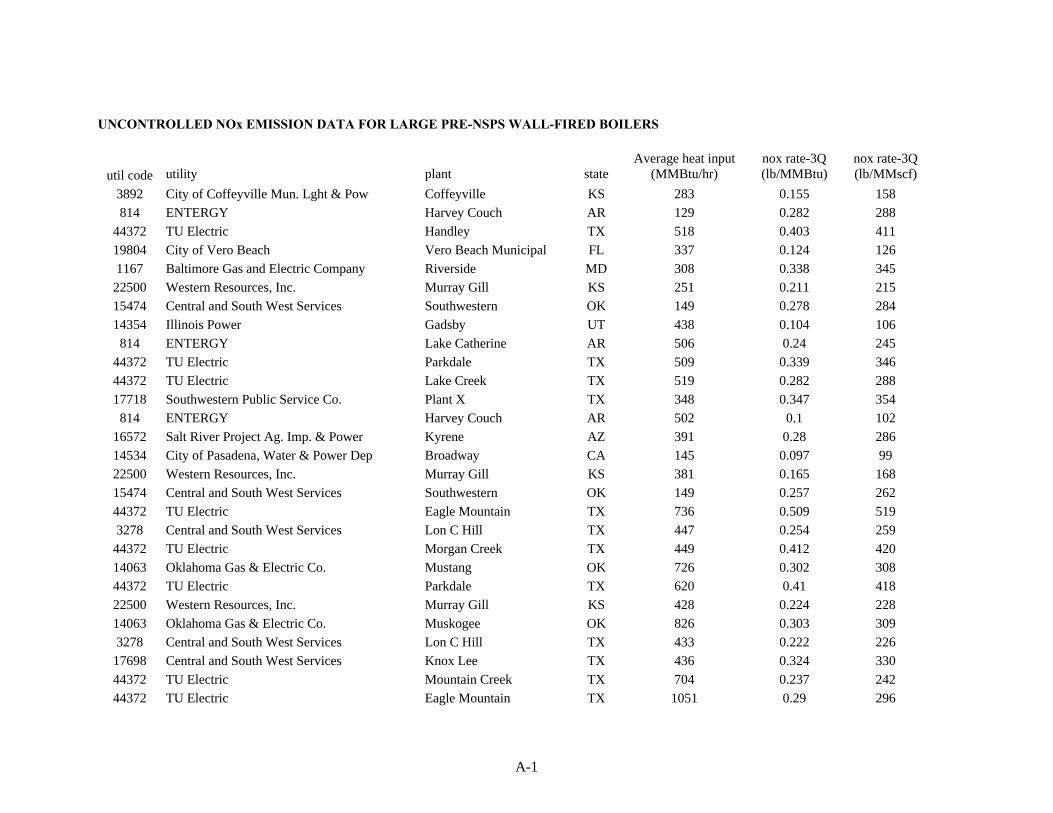
A total of 42 documents were reviewed in the process of developing emission factors for thisrevision to AP-42 Section 1.4, Natural Gas Combustion. A summary review of the references used todevelop emission factors and their associated database identification numbers is presented in Table 2-1,following this section. The majority of the references which were used to revise the emission factors fornatural gas combustion sources were either compliance test reports or summaries of compliance testresults. Seven of the references used in the development of this data were the results of research orspecific information gathering efforts. Furthermore, NOx emission factors for several natural gascombustion sources were developed from an electronic database received from the Acid Rain Division(ARD) of EPA. The data received from the ARD, and the corresponding emission factor averages, arepresented in Appendix A.
References 2 Through 6, 8, and 41
References 2 through 6, reference 8, and reference 41 are the results of several research orspecific information gathering efforts on natural gas-fired boilers. The data extracted from these reportsmake up the vast majority of all the HAP information contained in the revision of AP-42 Section 1.4. Pollutants tested in references 2, 3, and 41 also included speciated polycyclic aromatic hydrocarbons(PAH) and speciated metals. The test results reported in these references were all from emissionmeasurements conducted on tangential- and wall-fired utility boilers. Most of the sources detailed inthese references were uncontrolled, however, some incorporated flue gas recirculation (FGR) for NOx
control. All of the emission test data contained in these references were assigned a rating of A due to thedetailed information provided.
References 7, 9 Through 40, and 43 Through 44
These references were all compliance test results from both utility and industrial boilers firingnatural gas. The majority of these compliance tests focused on NOx and CO emissions, however, severaltests included results of total hydrocarbon (THC), non-methane hydrocarbon (NMHC), methane, andparticulate matter (PM) measurements. Some of the boilers reported in these references were operatedwith low-NOx burners, FGR, or selective non-catalytic reduction (SNCR) for NOx control. All of theemission test data contained in these references were assigned a rating of A due to the detailedinformation provided.
Reference 42
Reference 42 is a NOx emission summary for all national gas-fired utility boilers required tosubmit CEM data to the ARD as required by Title IV of the Clear Air Act Amendments. These datarepresent average NOx emissions from these boilers for the 3rd quarter of 1996. This data set included NOx emissions from 121 wall-fired boilers, 62 tangential-fired boilers, and five wall-fired boilers withlow-NOx burners. The data received from ARD, and the corresponding emission factor averages, arepresented in Appendix A.
2.4B01S04.WPD
Table 2.2-1. SUMMARY OF REFERENCES USED IN THE REVISION OF SECTION 1.4
ReferenceNumbera
General Information Concerning Document Pollutants Tested DataQualit
y
DatabaseI.D.
2 Source Test on a Tangential-Fired UtilityBoiler
NOx, CO, speciatedHAP’s, metals
A 1
3 Source Test on a Wall-Fired Utility Boiler NOx, CO, speciatedHAP’s, metals
A 2
4 Source Test on a Wall-Fired Utility Boiler Benzene,Formaldehyde
A 3
5 Source Test on a Wall-Fired Utility Boiler Benzene,Formaldehyde
A 4
6 Source Test on a Package Boiler NOx, CO, Methane,Ethane, PM
A 6
7 Compliance Test on a Package Boiler NOx, CO A 7
8 Source Tests on Seven Wall-Fired UtilityBoilers
Benzene,Formaldehyde
A 8, 9, 10, 11,12, 13, 14
9 Source Test on a Wall-Fired Utility BoilerWith SNCR Control
NOx, CO,Hydrocarbons, PM
A 15
10 Compliance Test on a Wall-Fired UtilityBoiler With SNCR Control
NOx, CO, Hydrocarbons, PM
A 23
11 Compliance Test on Two Tangential-FiredUtility Boilers With SNCR Control
NOx, CO, Hydrocarbons, PM
A 17
12 Compliance Test on Two Wall-Fired UtilityBoilers With SNCR Control
NOx, CO, Hydrocarbons
A 18
13 Compliance Test on a Tangential-FiredUtility Boiler With SNCR Control
NOx, CO, Hydrocarbons, PM
A 19
14 Compliance Test on a Tangential-FiredUtility Boiler With SNCR Control
NOx, CO, Hydrocarbons
A 20
15 Compliance Test on a Tangential-FiredUtility Boiler With SNCR Control
NOx, CO, Hydrocarbons
A 22
16 Compliance Test on a Wall-Fired UtilityBoiler
NOx, CO, Hydrocarbons
A 16
17 Compliance Test on a Tangential-FiredUtility Boiler With SNCR
NOx, CO, Hydrocarbons
A 21

Table 2.2-1. SUMMARY OF REFERENCES USED IN THE REVISION OF SECTION 1.4(Continued)
ReferenceNumbera
General Information Concerning Document Pollutants Tested DataQualit
y
DatabaseI.D.
2.5B01S04.WPD
18 Compliance Test on a Boiler NOx, CO A 106
19 Compliance Test on a Boiler NOx, CO A 107
20 Compliance Test on a Boiler NOx, CO A 108
21 Compliance Test on Two Boilers NOx, CO A 109
22 Compliance Test on a Boiler NOx, CO,Hydrocarbons
A 110
23 Compliance Test on Two Boilers NOx A 111
24 Compliance Test on a Boiler NOx, CO,Hydrocarbons
A 112
25 Compliance Test on Two Boilers NOx A 113
26 Compliance Test on a Boiler NOx, CO, PM A 114
27 Compliance Test on a Boiler NOx, CO,Hydrocarbons
A 115
28 Compliance Test on a Boiler NOx, CO A 116
29 Compliance Test on a Boiler NOx, CO,Hydrocarbons
A 117
30 Compliance Test on a Boiler NOx A 119
31 Source Test on a Boiler NOx, CO A 120
32 Source Test on a Boiler NOx, CO,Hydrocarbons, PM
A 121
33 Compliance Test on a Boiler NOx A 122
34 Compliance Test on a Boiler NOx A 123
35 Compliance Test on a Boiler NOx, CO A 125
36 Compliance Test on Two Boilers NOx, CO A 126
37 Compliance Test on a Boiler PM A 131
38 Compliance Test on a Boiler NOx, PM A 132
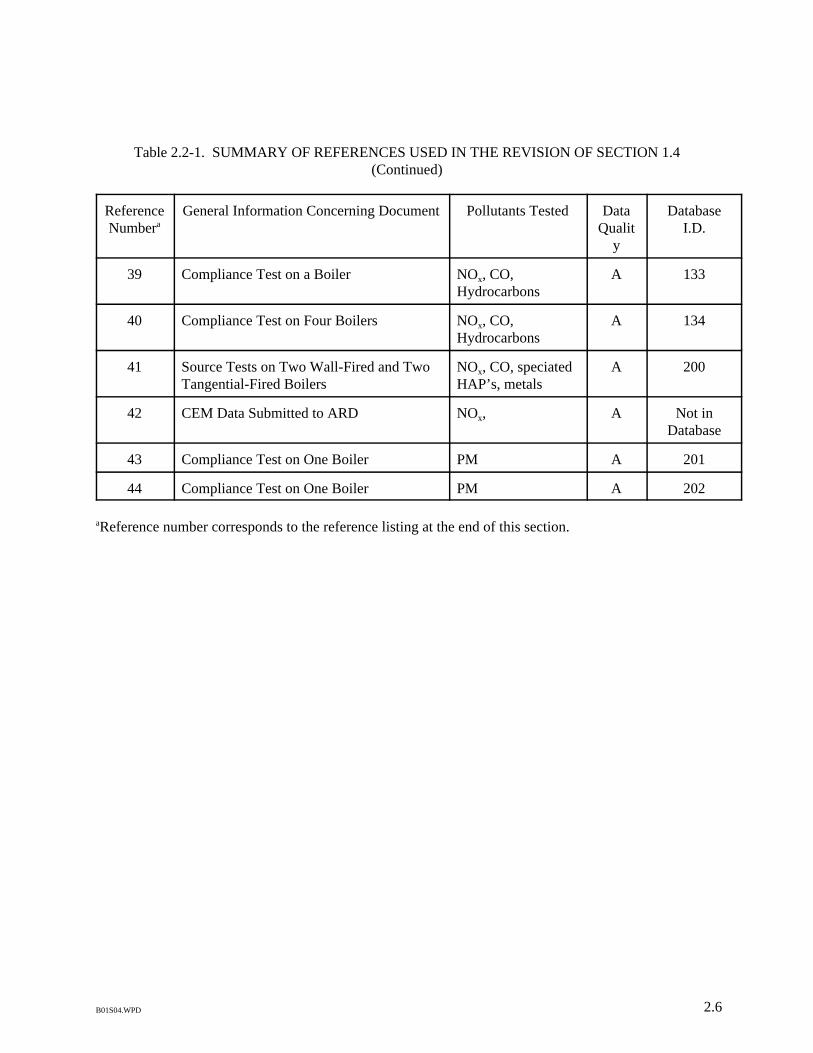
Table 2.2-1. SUMMARY OF REFERENCES USED IN THE REVISION OF SECTION 1.4(Continued)
ReferenceNumbera
General Information Concerning Document Pollutants Tested DataQualit
y
DatabaseI.D.
2.6B01S04.WPD
39 Compliance Test on a Boiler NOx, CO,Hydrocarbons
A 133
40 Compliance Test on Four Boilers NOx, CO,Hydrocarbons
A 134
41 Source Tests on Two Wall-Fired and TwoTangential-Fired Boilers
NOx, CO, speciatedHAP’s, metals
A 200
42 CEM Data Submitted to ARD NOx, A Not inDatabase
43 Compliance Test on One Boiler PM A 201
44 Compliance Test on One Boiler PM A 202
aReference number corresponds to the reference listing at the end of this section.
2.7B01S04.WPD
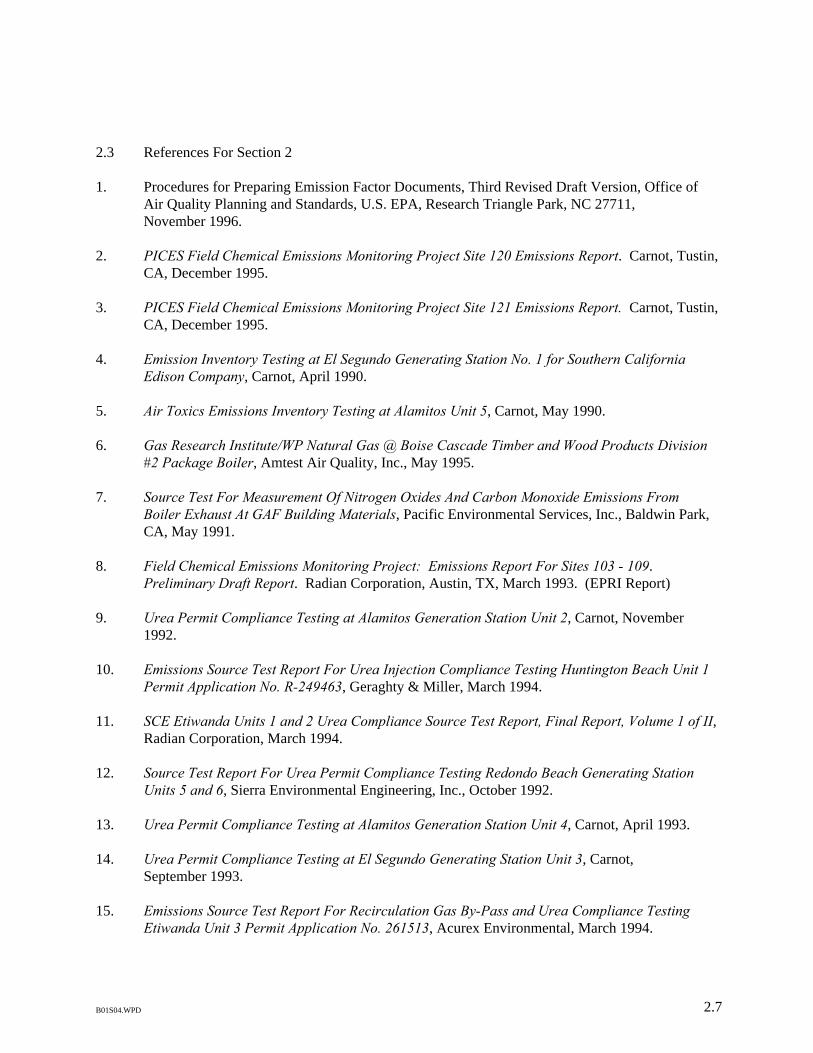
2.3 References For Section 2
1. Procedures for Preparing Emission Factor Documents, Third Revised Draft Version, Office ofAir Quality Planning and Standards, U.S. EPA, Research Triangle Park, NC 27711,November 1996.
2. PICES Field Chemical Emissions Monitoring Project Site 120 Emissions Report. Carnot, Tustin,CA, December 1995.
3. PICES Field Chemical Emissions Monitoring Project Site 121 Emissions Report. Carnot, Tustin,CA, December 1995.
4. Emission Inventory Testing at El Segundo Generating Station No. 1 for Southern CaliforniaEdison Company, Carnot, April 1990.
5. Air Toxics Emissions Inventory Testing at Alamitos Unit 5, Carnot, May 1990.
6. Gas Research Institute/WP Natural Gas @ Boise Cascade Timber and Wood Products Division#2 Package Boiler, Amtest Air Quality, Inc., May 1995.
7. Source Test For Measurement Of Nitrogen Oxides And Carbon Monoxide Emissions FromBoiler Exhaust At GAF Building Materials, Pacific Environmental Services, Inc., Baldwin Park,CA, May 1991.
8. Field Chemical Emissions Monitoring Project: Emissions Report For Sites 103 - 109. Preliminary Draft Report. Radian Corporation, Austin, TX, March 1993. (EPRI Report)
9. Urea Permit Compliance Testing at Alamitos Generation Station Unit 2, Carnot, November1992.
10. Emissions Source Test Report For Urea Injection Compliance Testing Huntington Beach Unit 1Permit Application No. R-249463, Geraghty & Miller, March 1994.
11. SCE Etiwanda Units 1 and 2 Urea Compliance Source Test Report, Final Report, Volume 1 of II,Radian Corporation, March 1994.
12. Source Test Report For Urea Permit Compliance Testing Redondo Beach Generating StationUnits 5 and 6, Sierra Environmental Engineering, Inc., October 1992.
13. Urea Permit Compliance Testing at Alamitos Generation Station Unit 4, Carnot, April 1993.
14. Urea Permit Compliance Testing at El Segundo Generating Station Unit 3, Carnot,September 1993.
15. Emissions Source Test Report For Recirculation Gas By-Pass and Urea Compliance TestingEtiwanda Unit 3 Permit Application No. 261513, Acurex Environmental, March 1994.
2.8B01S04.WPD
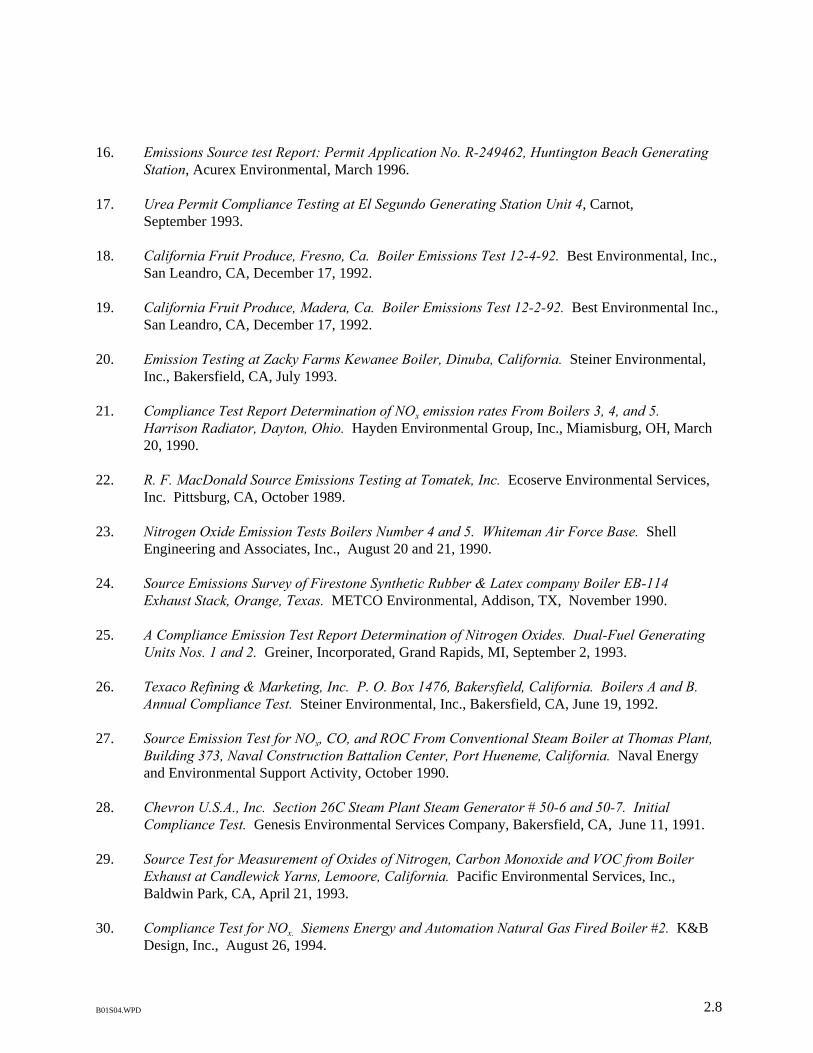
16. Emissions Source test Report: Permit Application No. R-249462, Huntington Beach GeneratingStation, Acurex Environmental, March 1996.
17. Urea Permit Compliance Testing at El Segundo Generating Station Unit 4, Carnot,September 1993.
18. California Fruit Produce, Fresno, Ca. Boiler Emissions Test 12-4-92. Best Environmental, Inc.,San Leandro, CA, December 17, 1992.
19. California Fruit Produce, Madera, Ca. Boiler Emissions Test 12-2-92. Best Environmental Inc.,San Leandro, CA, December 17, 1992.
20. Emission Testing at Zacky Farms Kewanee Boiler, Dinuba, California. Steiner Environmental,Inc., Bakersfield, CA, July 1993.
21. Compliance Test Report Determination of NOx emission rates From Boilers 3, 4, and 5. Harrison Radiator, Dayton, Ohio. Hayden Environmental Group, Inc., Miamisburg, OH, March20, 1990.
22. R. F. MacDonald Source Emissions Testing at Tomatek, Inc. Ecoserve Environmental Services,Inc. Pittsburg, CA, October 1989.
23. Nitrogen Oxide Emission Tests Boilers Number 4 and 5. Whiteman Air Force Base. ShellEngineering and Associates, Inc., August 20 and 21, 1990.
24. Source Emissions Survey of Firestone Synthetic Rubber & Latex company Boiler EB-114Exhaust Stack, Orange, Texas. METCO Environmental, Addison, TX, November 1990.
25. A Compliance Emission Test Report Determination of Nitrogen Oxides. Dual-Fuel GeneratingUnits Nos. 1 and 2. Greiner, Incorporated, Grand Rapids, MI, September 2, 1993.
26. Texaco Refining & Marketing, Inc. P. O. Box 1476, Bakersfield, California. Boilers A and B. Annual Compliance Test. Steiner Environmental, Inc., Bakersfield, CA, June 19, 1992.
27. Source Emission Test for NOx, CO, and ROC From Conventional Steam Boiler at Thomas Plant,Building 373, Naval Construction Battalion Center, Port Hueneme, California. Naval Energyand Environmental Support Activity, October 1990.
28. Chevron U.S.A., Inc. Section 26C Steam Plant Steam Generator # 50-6 and 50-7. InitialCompliance Test. Genesis Environmental Services Company, Bakersfield, CA, June 11, 1991.
29. Source Test for Measurement of Oxides of Nitrogen, Carbon Monoxide and VOC from BoilerExhaust at Candlewick Yarns, Lemoore, California. Pacific Environmental Services, Inc.,Baldwin Park, CA, April 21, 1993.
30. Compliance Test for NOx. Siemens Energy and Automation Natural Gas Fired Boiler #2. K&BDesign, Inc., August 26, 1994.

2.9B01S04.WPD
31. Source Test Report Gibson 7028-01, Gibson Oil and Refining Company, Bakersfield, California.Brown and Caldwell, Pleasant Hill, CA, September 11, 1992.
32. Source Test Report Gibson Oil and Refining Company, Inc. Bakersfield, California. Brown andCaldwell, Emeryville, CA, May 14-17, 1990.
33. Compliance Test Report: Determination of Nitrogen Oxide Emissions, Annapolis HospitalWestland Center Boilers #1, 2, and 3, Oakwood Hospital, Westland Michigan. WW Engineering & Science, Grand Rapids, MI, November 1993.
34. Report on Compliance Testing for General Motors Corporation, Fort Wayne Assembly Plant,Roanoke, Indiana, Clean Air Engineering,
35. Stella Cheese. P. O. Box 1379, Tulare, California. Superior Mohawk Boiler. InitialCompliance Test. Steiner Environmental, Inc., Bakersfield, CA, July 30, 1993.
36. Crystal Geyser Water Company. 1233 East California Avenue. Bakersfield, California. Boiler#1 & 2, Initial Compliance Test. Steiner Environmental, Inc., Bakersfield, CA,February 26, 1993.
37. Results of the Emissions Testing Services at Minnesota Corn Processors. Marshall Minnesota. December 20-21, 1994. Nova Environmental Services, Inc., Chaska, MN, January 31, 1995.
38. Results of the July 27, 1994 Air Emission Compliance Testing of the No. 10 Boiler at the VirginiaPublic Utilities Plant in Virginia, Minnesota. Interpoll Laboratories, Inc., Circle Pines, MN,August 17, 1994.
39. Los Gatos Tomato Products Compliance Emissions Testing. Best Environmental, Inc.,Hayward, CA, April 1991.
40. Gallo Winery Fresno Plant Boilers # 1, 2, 3, & 4 Emissions Compliance Testing. BestEnvironmental, Inc., San Leandro, CA, May 1992.
41. Gas-Fired Boiler and Turbine Air Toxics Summary Report. Prepared by Carnot TechnicalServices, Tustin, CA, For the Gas Research Institute and The Electric Power ResearchInstitute, August 1996.
42. NOx Emission Reporting for Utility Boilers for 3rd Quarter 1996. Acid Rain Division, U.S.EPA.
43. Compliance Particulate Matter Source Emissions Measurement Program: Nebraska PackageBoiler, Kimberly-Clark Corporation, Neenah, WI. Geraghty & Miller, Inc., July 1994.
44. Results of the September 14 and 15, 1994 Air Emission Compliance Tests on the No. 11 Boiler atthe Appleton Paper Plant in Combined Locks, WI. Interpoll Laboratories Inc., October 1994.

3.1B01S04.WPD
3.0 AP-42 Section Development
3.1 Revisions to Section Narrative
The technical discussion in AP-42 Section 1.4 did not need major revisions because nosignificant technological changes in this source category were identified since the last publication. Someof the discussion on NOx and PM formation was revised to better describe emissions from this sourcecategory.
3.2 Pollutant Emission Factor Development
3.2.1 Database Design
The emission data assembled for the development of natural gas combustion emission factorswere stored in a database except for the data received from ARD. A database approach was chosen toeasily access and manipulate the large amount of data collected for this section and to facilitate datatransfer within other concurrent projects at EPA. The design of this database was accomplished inconjunction with the Industrial Combustion Coordinated Rulemaking (ICCR) effort ongoing within theEmission Standards Division (ESD). Data entered under either of these projects were easily transferredbetween databases. Furthermore, the common design of the database will allow for future additions tothe database and simple recalculation of emission factors.
Within the database, data were stored in two tables to reduce repetitive entry of data. Thesetables, and the data fields associated with each table are as follows:
Facilities Table
C Facility nameC LocationC Testing CompanyC Date of TestC Boiler ManufacturerC Boiler Type (wall-fired, tangential-fired, etc.)C Air Supply (forced draft, induced draft, balanced draft etc.)C Capacity (MW)C Load (percent of capacity)C Fuel TypeC Fuel Higher Heating ValueC Heat Input (MMBtu/hr)C Post-combustion Emission ControlsC Application (electrical generation, process steam, etc.)
Test Data Table
C PollutantC Test MethodC Pollutant Concentration (as reported)C Detection Limit

3.2B01S04.WPD
EFscf'(Cppmvd(F(1,020(MW)
(106(385.5)(temperature correction(oxygen correction
EFscf '(Cppmvw(F(1,020(MW)
(106(385.5)((1&Wc )(temperature correction(oxygen correction
EFscf '(CFgf(F(1,020)
(106(453.6)(oxygen correction
C Exhaust Oxygen PercentageC Data RatingC Fuel Exhaust Factor (F-Factor)C Exhaust Flow RateC Fuel Flow RateC Exhaust Moisture FractionC Molecular Weight of Pollutant
The database was programmed to merge the data in the two tables and calculate emission factorsfor the available pollutants in units of pounds of pollutant per million standard cubic feet of fuel burned. To ensure consistent calculation of emission factors, the database was programmed to use the emissionconcentration data and process data taken during the testing period to calculate the emission factors. Emission factors provided in test reports were not used. The EPA concluded that this method ofcalculation would provide the highest quality emission factors. This method of calculating emissionfactors was chosen because different methods of calculation emission factors were used in some of thereferences and in some cases, the method of calculating emission factors was not given. Equations usedto calculate emission factors for this section were dependent on the pollutant concentration units.
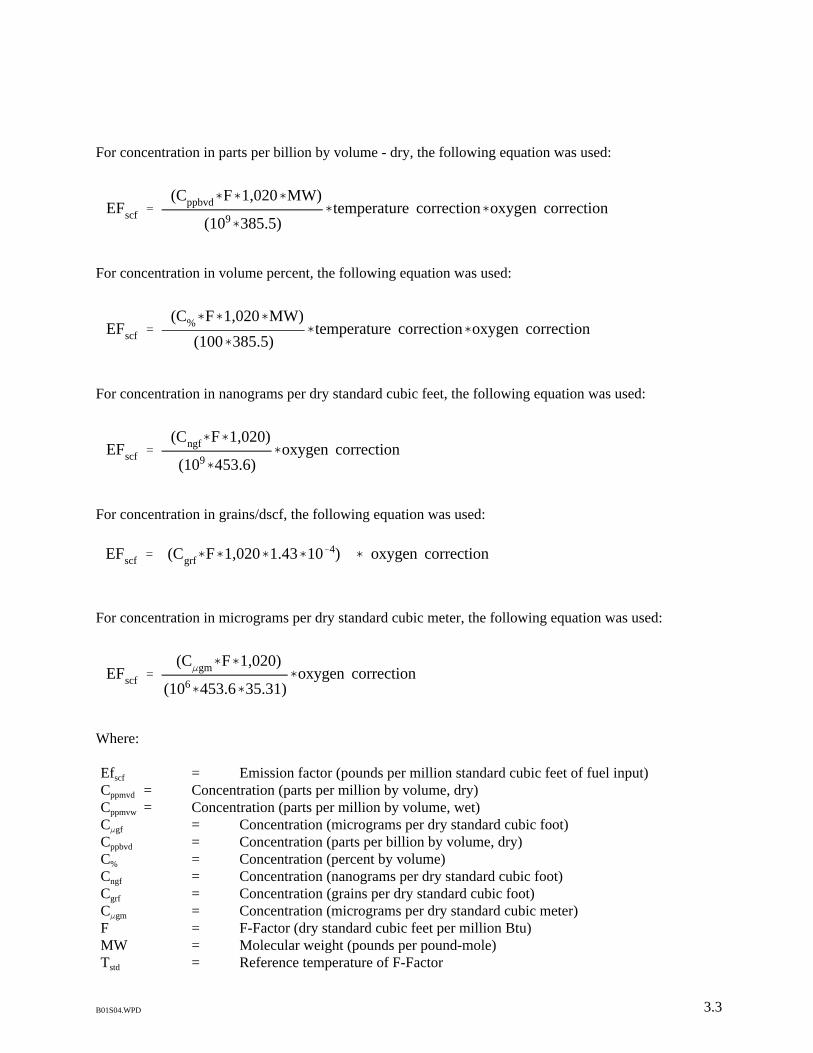
The following equations were used to convert concentration data to the selected emission factorsused in this section.
For concentration in parts per million by volume - dry (ppmvd), the following equation was used:
For concentration in parts per million by volume - wet (ppmvw), the following equation was used:
For concentration in micrograms per dry standard cubic feet, the following equation was used:
3.3B01S04.WPD
EFscf '(Cppbvd(F(1,020(MW)
(109(385.5)(temperature correction(oxygen correction
EFscf '(C%(F(1,020(MW)
(100(385.5)(temperature correction(oxygen correction
EFscf '(Cngf(F(1,020)
(109(453.6)(oxygen correction
EFscf ' (Cgrf(F(1,020(1.43(10&4) ( oxygen correction
EFscf '(CFgm(F(1,020)
(106(453.6(35.31)(oxygen correction
For concentration in parts per billion by volume - dry, the following equation was used:
For concentration in volume percent, the following equation was used:
For concentration in nanograms per dry standard cubic feet, the following equation was used:
For concentration in grains/dscf, the following equation was used:
For concentration in micrograms per dry standard cubic meter, the following equation was used:
Where:
Efscf = Emission factor (pounds per million standard cubic feet of fuel input)Cppmvd = Concentration (parts per million by volume, dry)Cppmvw = Concentration (parts per million by volume, wet)CFgf = Concentration (micrograms per dry standard cubic foot)Cppbvd = Concentration (parts per billion by volume, dry)C% = Concentration (percent by volume)Cngf = Concentration (nanograms per dry standard cubic foot)Cgrf = Concentration (grains per dry standard cubic foot)CFgm = Concentration (micrograms per dry standard cubic meter)F = F-Factor (dry standard cubic feet per million Btu)MW = Molecular weight (pounds per pound-mole)Tstd = Reference temperature of F-Factor

3.4B01S04.WPD
Temperature correctionfor F&Factor
(to 68EF)'
528ER460ERt % Tstd EF
Oxygen correction(to 0% O2)
'20.9
20.9 & %O2
%O2 = Percent of oxygen in exhaust, by volume1,020 = Natural gas heating value (MMBtu per 106 scf)385.5 = Volume occupied by 1 lb-mole of gas at 68OF (standard cubic feet per lb-mole)60 = Conversion factor (minutes per hour)Wc = Water volume fraction in exhaust453.6 = Conversion factor (grams per pound)1.43*10-4 = Conversion factor (pounds per grain)35.31 = Conversion factor (dry standard cubic feet per dry standard cubic meter)
Detection Limits
Test results from several tests of trace organic and metallic compounds reported concentrationsbelow the method detection limits. If a detection limit was provided in the test report, EPA used thatinformation in the development of AP-42 emission factors. To effectively use this data, two methodswere employed. For cases where a portion of the test data for a specific pollutant were below the methoddetection limit but other test data report detection of that compound, then one-half of the detection limitwas averaged with the detected concentrations to calculate of the emission factor for that pollutant. Incases where all of the test data for a specific pollutant reported concentrations below the methoddetection limit, the lowest detection limit was reported for the emission factor for that pollutant, and thatfactor noted as a detection limit. If an emission factor for an individual boiler was developed from adetection limit and the resulting emission factor was higher than the emission factors generated fromdetected concentrations, the emission factor based on a detection limit was removed from the average. The goal of this decision was to prevent an unusually high detection limit from artificially increasing anaverage emission factor. These methods for addressing detection level issues were provided in theProcedures For Preparing Emission Factor Documents.1
Calculation of Average Emission Factors
To provide average emission factors for these sources, the arithmatic average of the emissionfactors from all tests on a specific source type was calculated in the database. For tests that consisted ofmultiple runs, the arithmetic average of the runs was used to develop the emission factor of that test. Individual tests were given equal weight in the calculation of average emission factors for each boilergroup. In the case of NOx data received from ARD, the quarterly average from each boiler was treatedlike an individual test.

3.5B01S04.WPD
Presentation of Data
Due to the size of the database, a printout of all the test data used to generate the boiler emissionfactors in Section 1.4 is not presented. The NOx data provided by the Acid Rain Division is provided inAppendix A. For the remaining data that was stored in the database, EPA is providing an electronic copyof the database on the Technology Transfer Network (TTN). This decision has resulted in a substantialdecrease in paper needed for this background information document and will provide users with a moredetailed background data set for this section. Providing the database to the public will allow anyone touse or augment the database for their individual needs, providing a substantial building block for anyoneinterested in compiling an extensive database on natural gas-fired combustion sources. An electroniccopy of the database in Microsoft Access® format, can be downloaded from the TTN athttp://www.epa.gov/tnn/chief/. In this website, go to AP-42 and follow the main menu options tolocate and download the database file.
3.2.2 Results of Data Analysis
3.2.2.1 Source Category Selection and Data Review
An important step in emission factor development is to determine which emission sources aresimilar enough to be grouped together and represented by a single emission factor. This is accomplishedby investigating what parameters influence emissions and should be used to establish distinct groupswithin the natural gas combustion category. The emission factors for each test contained in the databasewere analyzed to determine appropriate groupings.
NOx Emission Factors
Based on the analysis of available NOx data, this category was separated into four generalgroups: large wall-fired boilers with a heat input greater than 100 MMBtu/hr, small boilers with a heatinput less than 100 MMBtu/hr, tangential-fired boilers, and residential furnaces. These groups werefurther separated into the following subcategories:
C Large Wall-Fired Boilers (>100 MMBtu/hr)
- Uncontrolled (pre-NSPS)- Uncontrolled (post-NSPS)- Controlled-Low-NOx burner- Controlled-Flue Gas Recirculation (FGR)
C Small Boilers (<100 MMBtu/hr)
- Uncontrolled- Controlled-Low-NOx burner- Controlled-Low-NOx burner/FGR
C Tangential-Fired Boilers
- Uncontrolled- Controlled-FGR

3.6B01S04.WPD
C Residential Furnaces
The designation of pre- and post-NSPS refers to boilers that are subject to 40 CFR 60 Subparts Dand Db. Post-NSPS units are boilers with greater than 250 MMBtu/hr of heat input that commencedconstruction, modification, or reconstruction after August 17, 1971, and units with heat input capacitiesbetween 100 and 250 MMBtu/hr that commenced construction, modification, or reconstruction afterJune 19, 1984. Analysis of the NOx data showed that uncontrolled wall-fired boilers subject to the NSPShave considerably lower NOx emissions that those not subject to the NSPS. Such a distinction was notseen in the data for the tangential boilers and therefore they were not further subcategorized.
The NOx emission factors for the following categories were developed from data received fromARD: large wall-fired uncontrolled, large wall-fired controlled-low NOx burners, and tangential-fireduncontrolled. The ARD data were determined to be more representative of these categories than NOx
data taken from compliance and source tests. The ARD data were from all operating utility boilers in theU.S. and averaged continuously over a three-month period. Since most of the data stored in the databasewere from short-term compliance and source tests, and from a much smaller population of boilers, theARD data were used for categories where they were available. The NOx emission factors for theremaining categories, where ARD data were unavailable, were developed from data stored in thedatabase.
The NOx emission factor for residential furnaces is based on test data from 41 sources.2-3 Sinceno new data for NOx from residential furnaces were obtained during this revision, this factor remainsunchanged from the previous version of Section 1.4.
N2O Emission Factors
The emission factors for N2O from large wall-fired boilers is based on test data from five sourcetests conducted at three separate locations.4-5 The N2O factor for the large wall-fired boilers with low-NOx burners is based on two source tests.4-5 Since no new data for N2O were obtained during thisrevision, these factors remain unchanged from the previous version of Section 1.4.
CO Emission Factors
Emission factors for CO were not grouped as extensively as the NOx emission factors. For thewall-fired boiler groups, no clear correlation was observed between boiler type or size and CO emissionlevels. CO emission factors for the wall-fired boilers showed wide scatter and average emission factorsdeveloped for the distinct grouping were not consistent with expected values. The EPA believes thatboiler operation plays a more critical role in determining CO emissions than the boiler type. Therefore,all CO data for wall-fired boilers were averaged to provide a single CO emission factor. For thetangential-fired boilers, CO emission factors showed less scatter and were strongly dependent on boilertype. Therefore, CO emission factors for tangential-fired boilers were grouped under the uncontrolledand controlled-flue gas recirculation categories.
The CO emission factor from residential furnaces is based on test data from 41 sources.2-3 Sinceno new data for CO from residential furnaces were obtained during this revision, this factor remainsunchanged from the previous version of Section 1.4.
3.7B01S04.WPD
VOC = NMHC + Formaldehyde - Ethane
= 8.5 + 0.07 - 3.1
= 5.5 (lb/106 scf)
TOC = NMHC + Formaldehyde + Methane
= 8.5 + 0.07 + 2.3
= 10.9 (lb/106 scf)
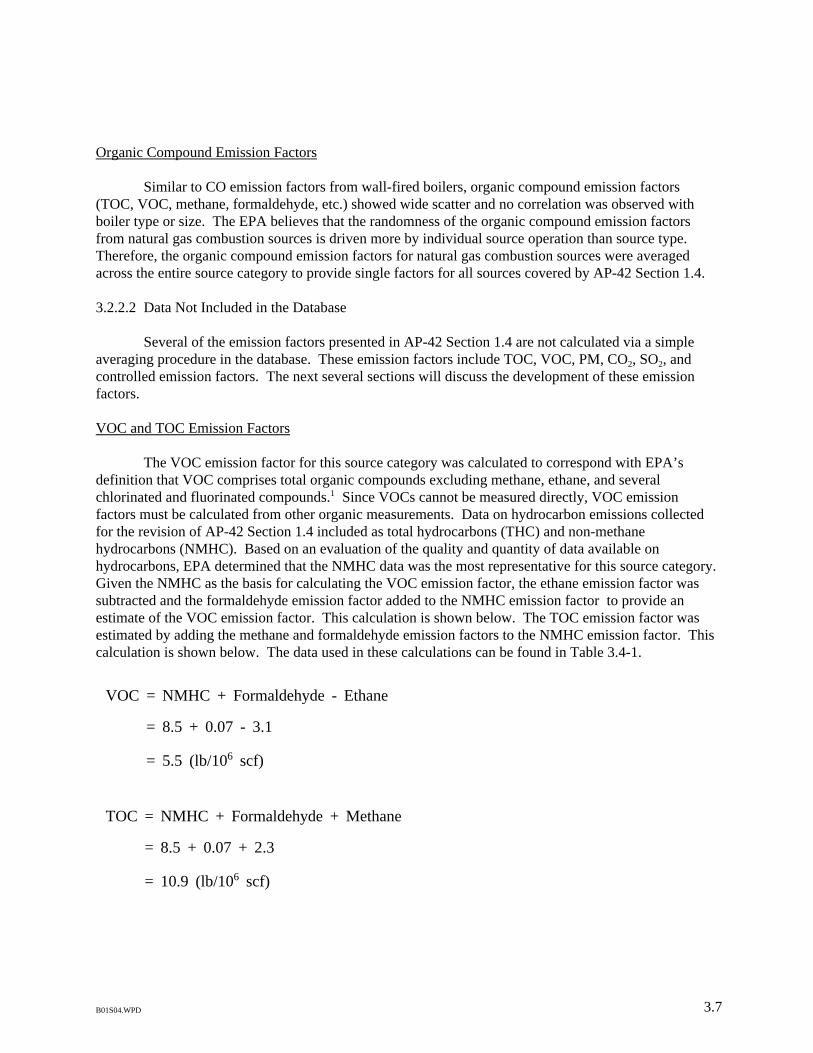
Organic Compound Emission Factors
Similar to CO emission factors from wall-fired boilers, organic compound emission factors(TOC, VOC, methane, formaldehyde, etc.) showed wide scatter and no correlation was observed withboiler type or size. The EPA believes that the randomness of the organic compound emission factorsfrom natural gas combustion sources is driven more by individual source operation than source type. Therefore, the organic compound emission factors for natural gas combustion sources were averagedacross the entire source category to provide single factors for all sources covered by AP-42 Section 1.4.
3.2.2.2 Data Not Included in the Database
Several of the emission factors presented in AP-42 Section 1.4 are not calculated via a simpleaveraging procedure in the database. These emission factors include TOC, VOC, PM, CO2, SO2, andcontrolled emission factors. The next several sections will discuss the development of these emissionfactors.
VOC and TOC Emission Factors
The VOC emission factor for this source category was calculated to correspond with EPA’sdefinition that VOC comprises total organic compounds excluding methane, ethane, and severalchlorinated and fluorinated compounds.1 Since VOCs cannot be measured directly, VOC emissionfactors must be calculated from other organic measurements. Data on hydrocarbon emissions collectedfor the revision of AP-42 Section 1.4 included as total hydrocarbons (THC) and non-methanehydrocarbons (NMHC). Based on an evaluation of the quality and quantity of data available onhydrocarbons, EPA determined that the NMHC data was the most representative for this source category. Given the NMHC as the basis for calculating the VOC emission factor, the ethane emission factor wassubtracted and the formaldehyde emission factor added to the NMHC emission factor to provide anestimate of the VOC emission factor. This calculation is shown below. The TOC emission factor wasestimated by adding the methane and formaldehyde emission factors to the NMHC emission factor. Thiscalculation is shown below. The data used in these calculations can be found in Table 3.4-1.

3.8B01S04.WPD
PM (Total) = PM (Condensable) + PM (Filterable) ' PM10 ' PM2.5 ' PM1.0
= 5.7 + 1.9
= 7.6 (lb/106 scf)
PM Emission Factors
For a limited number of tests, PM measurements were conducted. These PM measurementsincluded both condensable and filterable PM. As with the organic compounds emitted from natural gascombustion sources, no correlation between combustion source type and PM emission levels could beestablished. Therefore, the PM emission factors presented in AP-42 Section 1.4 are intended to representall natural gas combustion sources. To provide a total PM emission factor, the average condensible andfilterable PM fractions were added together. This calculation is shown below. The EPA has assumedthat all condensable and filterable PM resulting from natural gas combustion is less that 1 micrometer(Fm) in diameter. Therefore, the total PM emission factor also provided an estimate of PM10, PM2.5, andPM1.0 emissions from natural gas combustion sources. The EPA believes that these assumptions for PMsize are valid since natural gas does not contain ash and the nucleation of PM from combustion productsill not yield particles larger than 1 Fm.
CO2 and SO2
As outlined in the Procedures for Preparing Emission Factor Documents,1 emission factors forCO2 were calculated by mass balance. This approach was also taken for calculating SO2. Since thecarbon and sulfur content in pipeline-quality natural gas is fairly consistent, EPA believes that this is thebest method for calculating CO2 and SO2 emission factors. For CO2, it was assumed that approximately100 percent of the fuel carbon was converted to CO2. For SO2, a 100 percent conversion of fuel sulfurwas assumed. The CO2 emission factor was based on a carbon weight percent in natural gas of76 percent and the SO2 emission factor was based on a sulfur content in natural gas of 2,000 grains permillion standard cubic feet.
Selective Non-catalytic Reduction (SNCR) Controlled Emission Factors
Several of the data sources provided emissions data for sources operating with SNCR control. To evaluate SNCR control efficiency, only tests where NOx measurements were taken upstream anddownstream of the ammonia or urea injection area were considered. This method was chosen to evaluateSNCR performance while avoiding the effects of boiler performance, with respect to NOx emissions. Toestimate SNCR performance, NOx control efficiency was based on tests conducted upstream anddownstream of the control device. Thirty-three sets of upstream and downstream tests on SNCRperformance were evaluated. The SNCR performance data for wall-fired boilers are presented inTable 3.2-1 and SNCR performance data for tangential-fired boilers are presented in Table 3.2-2. Theaverage NOx reduction efficiency achieved by SNCR control on wall-fired and tangential-fired units was24 percent and 13 percent, respectively. These reduction efficiencies were also put in the footnotes to thetables presented in Section 1.4 so these reduction efficiencies could be applied to the NOx emissionfactor if necessary.

3.9B01S04.WPD
3.3 Emission Factor Quality Rating System
The quality of the emission factors developed from analysis of the test data was rated using thefollowing general criteria:
A--Excellent: Developed only from A-rated test data taken from many randomly chosenfacilities in the industry population. The source category is specific enough that variability within thesource category population may be minimized.
B--Above average: Developed only from A-rated test data from a reasonable number offacilities. Although no specific bias is evident, it is not clear if the facilities tested represent a randomsample of the industries. The source category is specific enough that variability within the sourcecategory population may be minimized.
C--Average: Developed only from A- and B-rated test data from a reasonable number offacilities. Although no specific bias is evident, it is not clear if the facilities tested represent a randomsample of the industry. The source category is specific enough that variability within the source categorypopulation may be minimized.
D--Below average: The emission factor was developed only from A- and B-rated test data from asmall number of facilities, and there is reason to suspect that these facilities do not represent a randomsample of the industry. There also may be evidence of variability within the source category population. Limitations on the use of the emission factor are always noted in the emission factor table.
Table 3.2-1. SNCR TEST RESULTS FOR WALL-FIRED BOILERS (NOx)
Database I.D.
Uncontrolled EmissionFactor (1b/106 scf)
Controlled EmissionFactor (1b/106 scf)
Percent Reduction(%)
16.1/16.2 1.32E+02 1.17E+02 11
16.3/16.4 8.14E+01 6.31E+01 23
16.5/16.6 5.57E+01 4.53E+01 19
23.1/23.2 1.12E+02 9.64E+01 14
23.3/23.4 8.20E+01 5.96E+01 27
23.5/23.6 5.24E+01 4.10E+01 22
15.1/15.2 1.78E+02 1.29E+02 27
15.3/15.6 1.08E+02 9.25E+01 14
15.8/15.7 1.79E+02 1.51E+02 16
18.2/18.1 1.97E+02 1.30E+02 34
18.4/18.3 1.03E+02 7.76E+01 25
18.6/18.5 5.29E+01 3.08E+01 42
18.7/18.8 1.76E+02 1.25E+02 29
18.9/18.10 1.01E+02 7.79E+01 23
18.12/18.11 7.91E+01 4.81E+01 39
Average = 24

3.10B01S04.WPD
Table 3.2-2. SNCR TEST RESULTS FOR TANGENTIAL-FIRED BOILERS (NOx)
Database I.D.
Uncontrolled Emission Factor
(1b/106 scf)
Controlled Emission Factor
(1b/106 scf)Percent Reduction
(%)
20.2/20.1 5.45E+01 4.70E+01 14
20.4/20.3 8.21E+01 6.87E+01 16
20.6/20.5 9.08E+01 8.12E+01 11
21.1/21.2 6.63E+01 5.93E+01 10
21.4/21.3 9.36E+01 7.77E+01 17
21.6/21.5 1.05E+02 9.42E+01 10
22.2/22.3 6.83E+01 5.82E+01 15
22.5/22.6 4.08E+01 3.53E+01 13
17.1/17.2 6.70E+01 6.47E+01 3
17.10/17.9 7.39E+01 5.97E+01 19
17.12/17.11 8.70E+01 7.34E+01 16
17.4/17.3 5.42E+01 4.79E+01 12
17.6/17.5 7.16E+01 4.43E+01 38
17.8/17.7 8.36E+01 7.64E+01 9
19.2/19.3 8.38E+01 7.40E+01 12
19.6/19.8 4.35E+01 4.10E+01 6
19.7/19.8 4.35E+01 4.10E+01 6
19.10/19.9 4.79E+01 4.38E+01 9
Average = 13
E--Poor: The emission factor was developed from C- and D-rated test data, and there is reason tosuspect that the facilities tested do not represent a random sample of the industry. There also may beevidence of variability within the source category population. Limitations on the use of these factors arealways noted, in the emission factor table.
The above criteria for emission factor ratings are defined in and OAQPS document whichprovided guidance for preparing emission factor documents. The use of these criteria is somewhatsubjective and depends to an extent upon the individual reviewer. As these criteria were applied to theemission factors, the term “number of facilities” was interpreted to mean “number of different boilers”. This criteria prevented emission factors generated from multiple tests on a single boiler from receiving higher emission factor ratings.
Emission factors for this section were rated in the following manner:
A-Rated Emission factor average based on results of A-rated data from 20 ormore different boilers, or from approved mass balance calculations.
B-Rated Emission factor average based on results of A-rated data from 10 to19 different boilers.
C-Rated Emission factor average based on results of A-rated data from five to
3.11B01S04.WPD
nine different boilers.
D-Rated Emission factor average based on results of A-rated data from three to fourdifferent boilers.
E-Rated Emission factor based on less than three A- or B-rated source tests.
In several cases for the revision of AP-42 Section 1.4, the data did not show a strong enoughcorrelation to boiler type, boiler size, or combustion control to justify the grouping of data by theseparameters. Where data were averaged across these parameters, the resulting emission factors were ratedby the above criteria but subsequently lowered one rating. The decision was made to lower the emissionfactor rating in these cases to reflect the lack of certainty in the resulting emission factor.
3.4 Emission Factors
The emission factors for the sources covered in Section 1.4 of the AP-42 document are presentedin Table 3.4-1. This table provides the number of source tests used in calculating the various emissionfactors as well as the relative standard deviation associated with each emission factor. This additionalinformation is intended to provide greater insight to the reader about the background of each emissionfactor. For further detail on each emission factor, the database used to generate most of these factors(except for NOx emission factors generated from ARD data) is provided on the TTN (See Section 3.2.1 ofthis document for more details on the database). For NOx emission factors generated from data providedby the Acid Rain Division, the supporting data is provided in Appendix A.
3.5 Peer Review Process
Part of the development processes of an AP-42 section includes review by a peer group. Thisgroup include individuals from EPA, industry, and environmental organizations. In the peer reviewprocess, EPA gains an extra level of confidence in the final version of a section. Comments received onthe draft version of a section are reviewed to determine if they warrant any changes to the draft version ofthe section before it becomes final. Appendix B presents the substantial comments received on the draftAP-42 Section 1.4 and EPA’s responses to those comments.
3.6 References for Section 3
1. Procedures for Preparing Emission Factor Documents, EPA-454/R-95-015, Office ofAir Quality Planning and Standards, U.S. EPA, Research Triangle Park, North Carolina 27711, September 1997.
2. Muhlbaier, J.L. “Particulate and Gaseous Emissions from Natural Gas Furnaces and WaterHeaters,” Journal of the Air Pollution Control Association, December 1981.
3. Evaluation of the Pollutant Emissions from Gas-Fired Forced Air Furnaces: Research ReportNo. 1503, American Gas Association Laboratories, Cleveland, OH. May 1975.
4. Nelson, L.P., L.M. Russell, J. J. Watson. “Global Combustion Sources of Nitrous OxideEmissions,” Research Project 2333-4 Interim Report. Radian Corporation, Sacramento,California. 1991.
3.12B01S04.WPD
5. Peer, R.L., E.P. Epner, R.S. Billings. “Characterization of Nitrous Oxide Emission Sources,”Prepared for U.S. EPA Contract 68-D1-0031. Radian Corporation, Research Triangle Park,North Carolina. 1995.

3.13B01S04.WPD
Table 3.4-1. SUMMARY OF EMISSION FACTORS FOR AP-42 SECTION 1.4
Pollutant Number of TestsEmission Factor
(lb/106 scf) Relative Standard
Deviation (%)
2-Methylnaphthalene 4 2.4E-5 72.77%
3-Methylchloranthrene 1 <1.8E-6
7,12-Dimethylbenz(a)anthracene 1 <1.6E-5
Acenaphthene 1 <1.8E-6
Acenaphthylene 1 <1.8E-6
Anthracene 1 <2.4E-6
Arsenic 2 2.0E-4 22.36%
Barium 3 4.4E-3 38.85%
Benz(a)anthracene 1 <1.8E-6
Benzene 17 2.1E-3 172.00%
Benzo(a)pyrene 1 <1.2E-6
Benzo(b)fluoranthene 1 <1.8E-6
Benzo(g,h,i)perylene 1 <1.2E-6
Benzo(k)fluoranthene 1 <1.8E-6
Beryllium 1 <1.2E-5
Butane 1 2.1
Cadmium 3 1.1E-3 166.72%
Chromium 5 1.4E-3 55.69%
Chrysene 1 <1.8E-6
CO (Wall-Fired) 49 84 124.00%
CO (Tangential-Uncontrolled) 17 24 179.00%
CO (Tangential-FGR) 7 98 57.00%
Cobalt 2 8.4E-5 63.59%
Copper 4 8.5E-4 49.36%
Dibenzo(a,h)anthracene 1 <1.2E-6
Dichlorobenzene 1 1.2E-3
Ethane 4 3.1 43.77%
Fluoranthene 1 3.0E-6
Fluorene 2 2.8E-6 14.02%
Formaldehyde 22 8.1E-2 194.00%
Hexane 2 1.8 95.61%
Indeno(1,2,3-cd)pyrene 1 <1.8E-6
Lead 4 4.6E-4 77.61%
Manganese 2 3.8E-4 2.53%
Mercury 2 2.6E-4 43.50%
Methane 42 2.3 118.83%
Molybdenum 2 1.1E-3 64.41%
Naphthalene 2 6.1E-4 85.19%
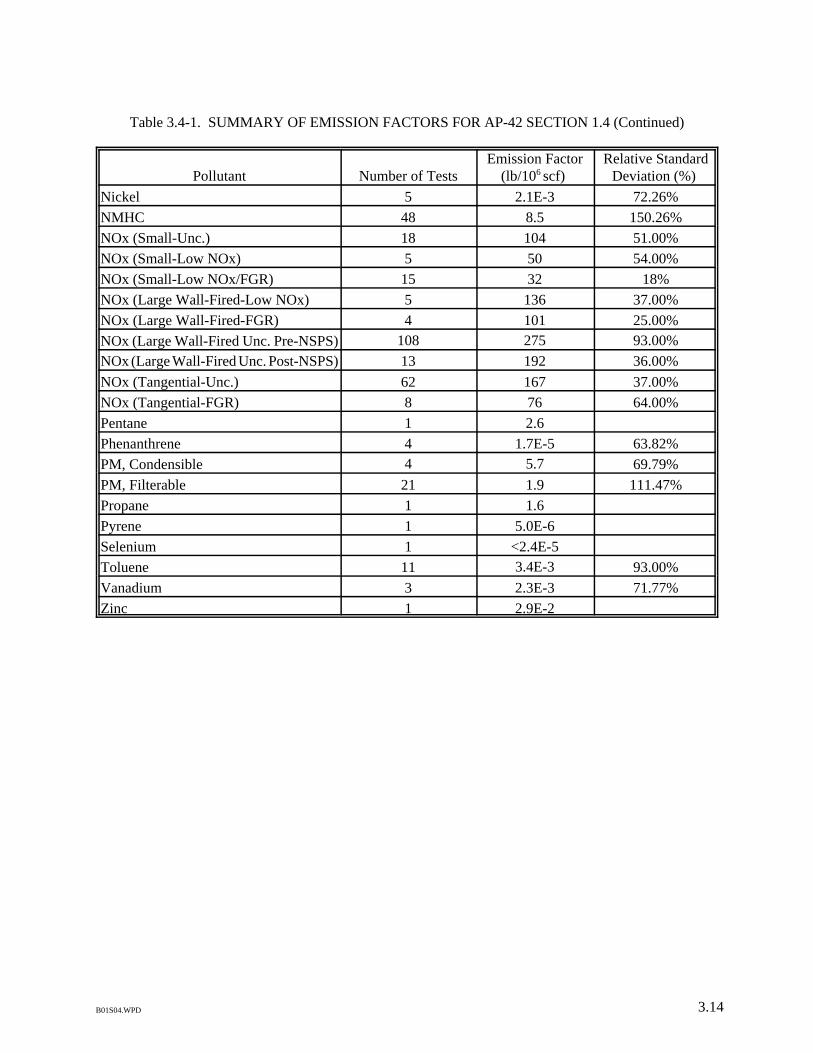
Table 3.4-1. SUMMARY OF EMISSION FACTORS FOR AP-42 SECTION 1.4 (Continued)
Pollutant Number of TestsEmission Factor
(lb/106 scf) Relative Standard
Deviation (%)
3.14B01S04.WPD
Nickel 5 2.1E-3 72.26%
NMHC 48 8.5 150.26%
NOx (Small-Unc.) 18 104 51.00%
NOx (Small-Low NOx) 5 50 54.00%
NOx (Small-Low NOx/FGR) 15 32 18%
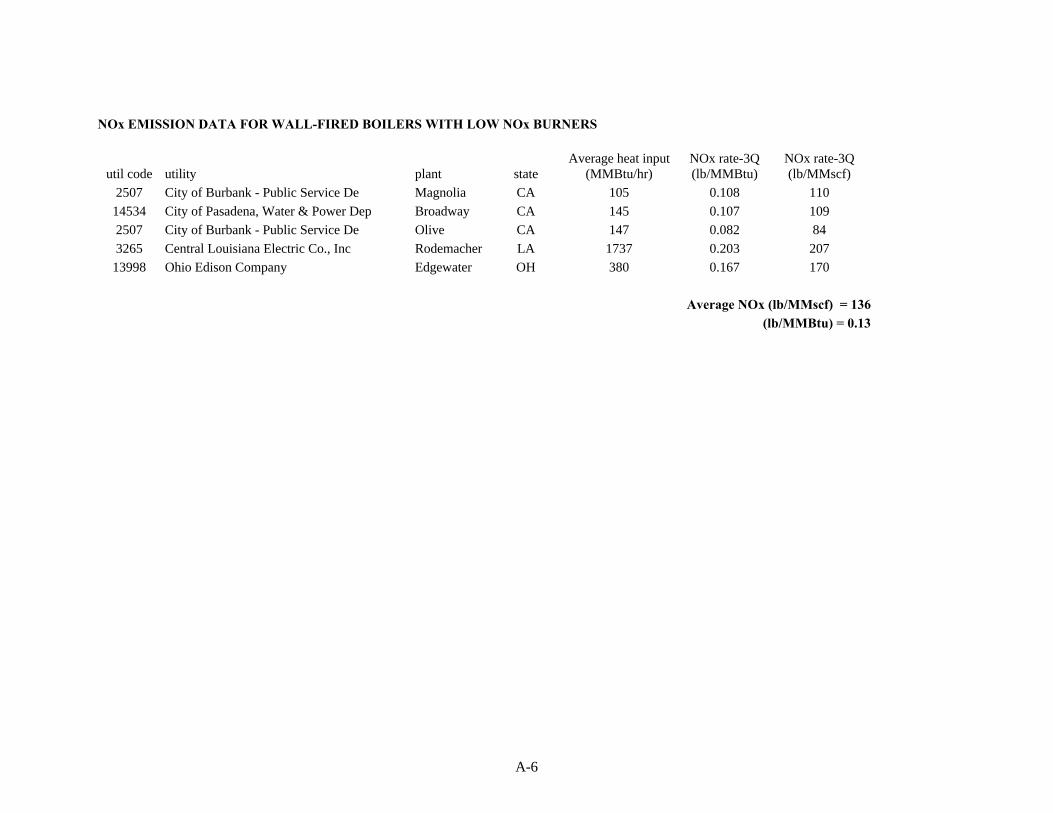
NOx (Large Wall-Fired-Low NOx) 5 136 37.00%
NOx (Large Wall-Fired-FGR) 4 101 25.00%
NOx (Large Wall-Fired Unc. Pre-NSPS) 108 275 93.00%
NOx (Large Wall-Fired Unc. Post-NSPS) 13 192 36.00%
NOx (Tangential-Unc.) 62 167 37.00%
NOx (Tangential-FGR) 8 76 64.00%
Pentane 1 2.6
Phenanthrene 4 1.7E-5 63.82%
PM, Condensible 4 5.7 69.79%
PM, Filterable 21 1.9 111.47%
Propane 1 1.6
Pyrene 1 5.0E-6
Selenium 1 <2.4E-5
Toluene 11 3.4E-3 93.00%
Vanadium 3 2.3E-3 71.77%
Zinc 1 2.9E-2

4.1B01S04.WPD
4.0 AP-42 Section 1.4

APPENDIX A
Acid Rain Division Data
A-1
UNCONTROLLED NOx EMISSION DATA FOR LARGE PRE-NSPS WALL-FIRED BOILERS
util code utility plant stateAverage heat input
(MMBtu/hr)nox rate-3Q(lb/MMBtu)
nox rate-3Q(lb/MMscf)
3892 City of Coffeyville Mun. Lght & Pow Coffeyville KS 283 0.155 158814 ENTERGY Harvey Couch AR 129 0.282 288
44372 TU Electric Handley TX 518 0.403 41119804 City of Vero Beach Vero Beach Municipal FL 337 0.124 1261167 Baltimore Gas and Electric Company Riverside MD 308 0.338 345
22500 Western Resources, Inc. Murray Gill KS 251 0.211 21515474 Central and South West Services Southwestern OK 149 0.278 28414354 Illinois Power Gadsby UT 438 0.104 106814 ENTERGY Lake Catherine AR 506 0.24 245
44372 TU Electric Parkdale TX 509 0.339 34644372 TU Electric Lake Creek TX 519 0.282 28817718 Southwestern Public Service Co. Plant X TX 348 0.347 354814 ENTERGY Harvey Couch AR 502 0.1 102
16572 Salt River Project Ag. Imp. & Power Kyrene AZ 391 0.28 28614534 City of Pasadena, Water & Power Dep Broadway CA 145 0.097 9922500 Western Resources, Inc. Murray Gill KS 381 0.165 16815474 Central and South West Services Southwestern OK 149 0.257 26244372 TU Electric Eagle Mountain TX 736 0.509 5193278 Central and South West Services Lon C Hill TX 447 0.254 259
44372 TU Electric Morgan Creek TX 449 0.412 42014063 Oklahoma Gas & Electric Co. Mustang OK 726 0.302 30844372 TU Electric Parkdale TX 620 0.41 41822500 Western Resources, Inc. Murray Gill KS 428 0.224 22814063 Oklahoma Gas & Electric Co. Muskogee OK 826 0.303 3093278 Central and South West Services Lon C Hill TX 433 0.222 226
17698 Central and South West Services Knox Lee TX 436 0.324 33044372 TU Electric Mountain Creek TX 704 0.237 24244372 TU Electric Eagle Mountain TX 1051 0.29 296
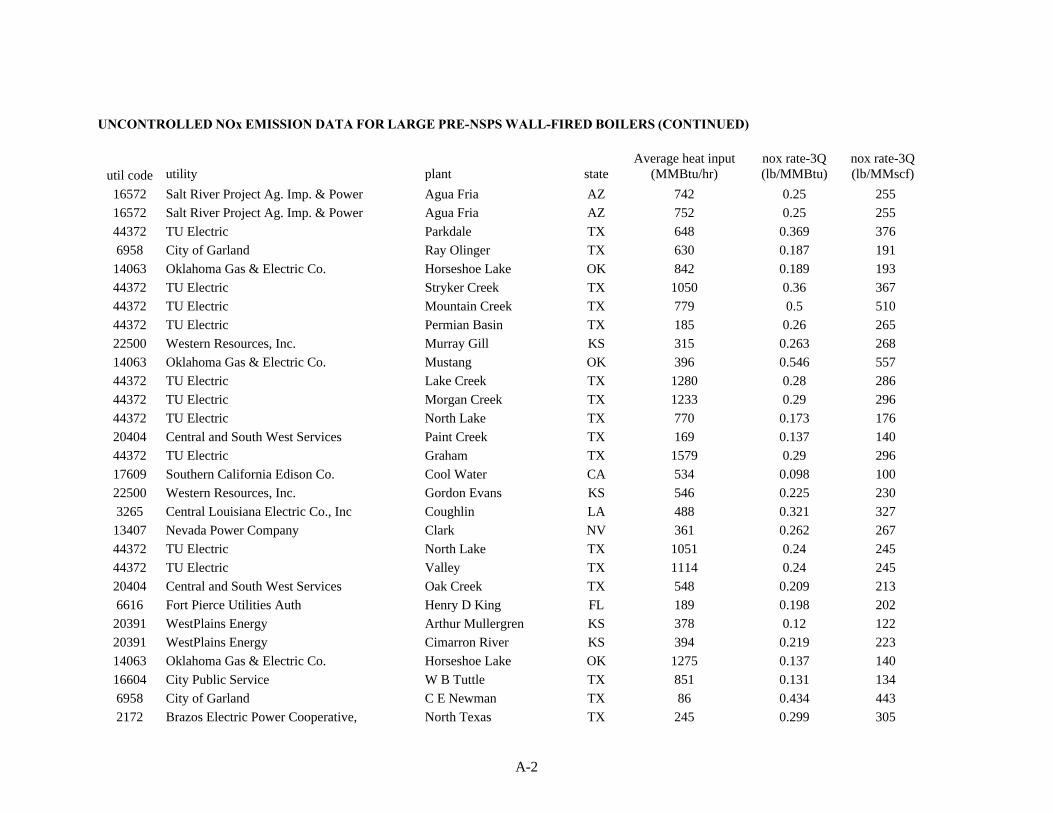
UNCONTROLLED NOx EMISSION DATA FOR LARGE PRE-NSPS WALL-FIRED BOILERS (CONTINUED)
util code utility plant stateAverage heat input
(MMBtu/hr)nox rate-3Q(lb/MMBtu)
nox rate-3Q(lb/MMscf)
A-2
16572 Salt River Project Ag. Imp. & Power Agua Fria AZ 742 0.25 25516572 Salt River Project Ag. Imp. & Power Agua Fria AZ 752 0.25 25544372 TU Electric Parkdale TX 648 0.369 3766958 City of Garland Ray Olinger TX 630 0.187 191
14063 Oklahoma Gas & Electric Co. Horseshoe Lake OK 842 0.189 19344372 TU Electric Stryker Creek TX 1050 0.36 36744372 TU Electric Mountain Creek TX 779 0.5 51044372 TU Electric Permian Basin TX 185 0.26 26522500 Western Resources, Inc. Murray Gill KS 315 0.263 26814063 Oklahoma Gas & Electric Co. Mustang OK 396 0.546 55744372 TU Electric Lake Creek TX 1280 0.28 28644372 TU Electric Morgan Creek TX 1233 0.29 29644372 TU Electric North Lake TX 770 0.173 17620404 Central and South West Services Paint Creek TX 169 0.137 14044372 TU Electric Graham TX 1579 0.29 29617609 Southern California Edison Co. Cool Water CA 534 0.098 10022500 Western Resources, Inc. Gordon Evans KS 546 0.225 2303265 Central Louisiana Electric Co., Inc Coughlin LA 488 0.321 327
13407 Nevada Power Company Clark NV 361 0.262 26744372 TU Electric North Lake TX 1051 0.24 24544372 TU Electric Valley TX 1114 0.24 24520404 Central and South West Services Oak Creek TX 548 0.209 2136616 Fort Pierce Utilities Auth Henry D King FL 189 0.198 202
20391 WestPlains Energy Arthur Mullergren KS 378 0.12 12220391 WestPlains Energy Cimarron River KS 394 0.219 22314063 Oklahoma Gas & Electric Co. Horseshoe Lake OK 1275 0.137 14016604 City Public Service W B Tuttle TX 851 0.131 1346958 City of Garland C E Newman TX 86 0.434 4432172 Brazos Electric Power Cooperative, North Texas TX 245 0.299 305

UNCONTROLLED NOx EMISSION DATA FOR LARGE PRE-NSPS WALL-FIRED BOILERS (CONTINUED)
util code utility plant stateAverage heat input
(MMBtu/hr)nox rate-3Q(lb/MMBtu)
nox rate-3Q(lb/MMscf)
A-3
44372 TU Electric Handley TX 2383 0.281 2877294 City of Glendale, Public Service De Grayson CA 161 0.06 61
17609 Southern California Edison Co. Cool Water CA 709 0.106 10813407 Nevada Power Company Sunrise NV 379 0.354 36120447 Western Farmers Electric Mooreland OK 252 0.323 32944372 TU Electric North Lake TX 2025 0.28 2868901 Houston Lighting & Power Company Webster TX 1823 0.237 242
11269 Lower Colorado River Authority Sim Gideon TX 664 0.202 20618445 Electric Operations S O Purdom FL 272 0.202 2063265 Central Louisiana Electric Co., Inc Coughlin LA 797 0.301 3071015 City of Austin Electric Utility Dpt Holly Street TX 810 0.157 1605063 City of Denton Spencer TX 354 0.334 341
44372 TU Electric Morgan Creek TX 3671 0.591 60310620 City of Lake Worth Tom G Smith FL 158 0.234 23922500 Western Resources, Inc. Gordon Evans KS 1514 0.409 41715474 Central and South West Services Southwestern OK 576 0.372 37944372 TU Electric Valley TX 3312 0.25 25516463 Ruston Utilities System Ruston LA 42 0.182 18620447 Western Farmers Electric Mooreland OK 648 0.213 2172172 Brazos Electric Power Cooperative, R W Miller TX 499 0.175 179
11269 Lower Colorado River Authority Sim Gideon TX 659 0.189 19320391 WestPlains Energy Judson Large KS 600 0.159 1627634 City of Greenville Powerlane Plant TX 31 0.136 139
44372 TU Electric Tradinghouse TX 3111 0.335 34244372 TU Electric Graham TX 2161 0.42 4282442 Bryan Utilities Bryan TX 139 0.211 215
20404 Central and South West Services Rio Pecos TX 912 0.384 392814 ENTERGY Lake Catherine AR 2469 0.22 224
20813 City of Winfield East 12Th St KS 194 0.261 266

UNCONTROLLED NOx EMISSION DATA FOR LARGE PRE-NSPS WALL-FIRED BOILERS (CONTINUED)
util code utility plant stateAverage heat input
(MMBtu/hr)nox rate-3Q(lb/MMBtu)
nox rate-3Q(lb/MMscf)
A-4
17568 South Missisippi Elec. Power Assoc. Moselle MS 454 0.323 32917568 South Missisippi Elec. Power Assoc. Moselle MS 486 0.303 30917568 South Missisippi Elec. Power Assoc. Moselle MS 434 0.28 28614063 Oklahoma Gas & Electric Co. Seminole OK 1806 0.167 17044372 TU Electric Lake Hubbard TX 2198 0.17 17317698 Central and South West Services Wilkes TX 1759 0.299 30518445 Electric Operations Arvah B Hopkins FL 433 0.239 2442777 Cajun Electric Power Cooperative Big Cajun 1 LA 925 0.437 4463265 Central Louisiana Electric Co., Inc Teche LA 1758 0.22 224
44372 TU Electric Eagle Mountain TX 2021 0.17 17344372 TU Electric Valley TX 2276 0.161 16417698 Central and South West Services Wilkes TX 1653 0.263 26820404 Central and South West Services Paint Creek TX 521 0.309 3156909 Gainesville Regional Utilities Deerhaven FL 638 0.151 1542777 Cajun Electric Power Cooperative Big Cajun 1 LA 657 0.347 354
14063 Oklahoma Gas & Electric Co. Seminole OK 1870 0.188 19244372 TU Electric Tradinghouse TX 4972 0.441 4502172 Brazos Electric Power Cooperative, R W Miller TX 993 0.36 3675063 City of Denton Spencer TX 418 0.294 300
44372 TU Electric Permian Basin TX 3929 0.873 89044372 TU Electric Lake Hubbard TX 2844 0.214 21820404 Central and South West Services Fort Phantom TX 966 0.331 338
Pre-NSPS Average Nox (lb/MMscf) = 275(lb/MMBtu) = 0.27
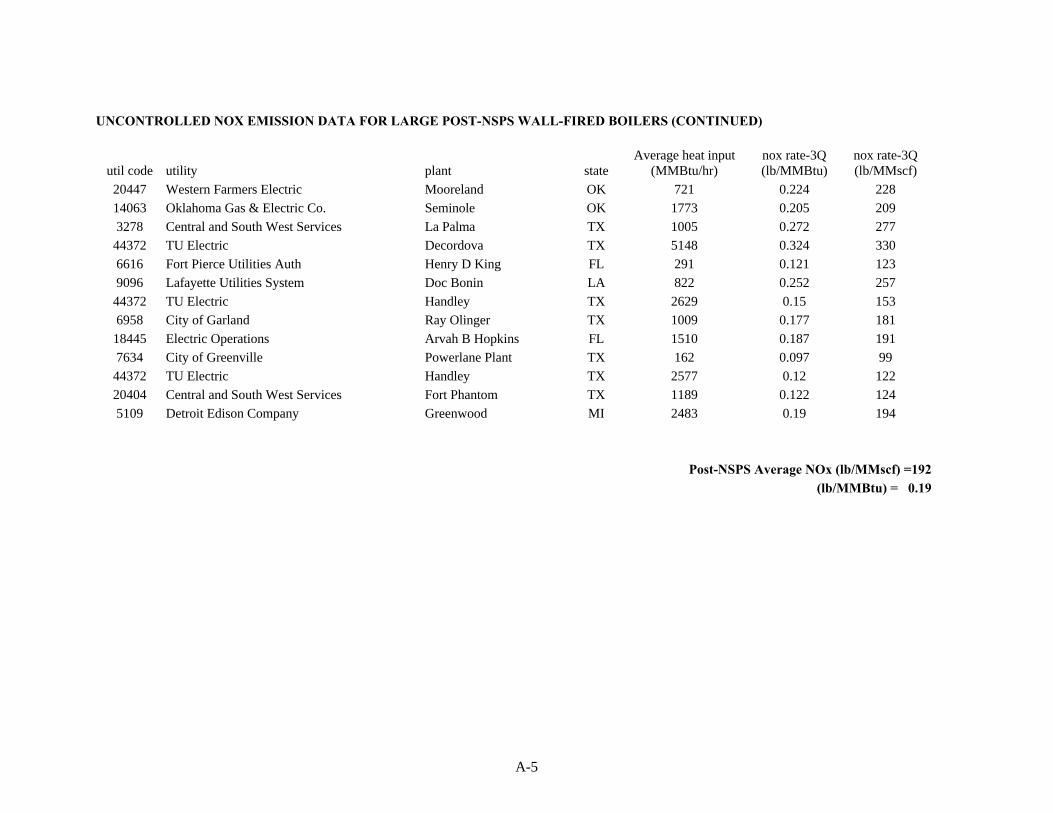
UNCONTROLLED NOX EMISSION DATA FOR LARGE POST-NSPS WALL-FIRED BOILERS (CONTINUED)
A-5
util code utility plant stateAverage heat input
(MMBtu/hr)nox rate-3Q(lb/MMBtu)
nox rate-3Q(lb/MMscf)
20447 Western Farmers Electric Mooreland OK 721 0.224 22814063 Oklahoma Gas & Electric Co. Seminole OK 1773 0.205 2093278 Central and South West Services La Palma TX 1005 0.272 277
44372 TU Electric Decordova TX 5148 0.324 3306616 Fort Pierce Utilities Auth Henry D King FL 291 0.121 1239096 Lafayette Utilities System Doc Bonin LA 822 0.252 257
44372 TU Electric Handley TX 2629 0.15 1536958 City of Garland Ray Olinger TX 1009 0.177 181
18445 Electric Operations Arvah B Hopkins FL 1510 0.187 1917634 City of Greenville Powerlane Plant TX 162 0.097 99
44372 TU Electric Handley TX 2577 0.12 12220404 Central and South West Services Fort Phantom TX 1189 0.122 1245109 Detroit Edison Company Greenwood MI 2483 0.19 194
Post-NSPS Average NOx (lb/MMscf) =192(lb/MMBtu) = 0.19
A-6
NOx EMISSION DATA FOR WALL-FIRED BOILERS WITH LOW NOx BURNERS
util code utility plant stateAverage heat input
(MMBtu/hr)NOx rate-3Q(lb/MMBtu)
NOx rate-3Q(lb/MMscf)
2507 City of Burbank - Public Service De Magnolia CA 105 0.108 11014534 City of Pasadena, Water & Power Dep Broadway CA 145 0.107 1092507 City of Burbank - Public Service De Olive CA 147 0.082 843265 Central Louisiana Electric Co., Inc Rodemacher LA 1737 0.203 20713998 Ohio Edison Company Edgewater OH 380 0.167 170
Average NOx (lb/MMscf) = 136(lb/MMBtu) = 0.13

A-7
UNCONTROLLED NOx EMISSION DATA FOR TANGENTIAL FIRED BOILERS
util code utility plant stateAverage heat input
(MMBtu/hr)nox rate-3Q(lb/MMBtu)
nox rate-3Q(lb/MMscf)
9726 GPU Generation Corporation Gilbert NJ 505 0.238 243195 Alabama Power Company Chickasaw AL 256 0.168 171
12686 Mississippi Power Company Sweatt MS 344 0.335 3423249 Central Hudson Gas & Electric Corp. Danskammer NY 205 0.08 8214354 Illinois Power Gadsby UT 392 0.093 9512686 Mississippi Power Company Sweatt MS 346 0.325 33217718 Southwestern Public Service Co. Plant X TX 605 0.125 128
803 Arizona Public Service Company Saguaro AZ 720 0.335 3426452 Florida Power & Light Company Cutler FL 518 0.083 853249 Central Hudson Gas & Electric Corp. Danskammer NY 381 0.102 104803 Arizona Public Service Company Saguaro AZ 622 0.219 223
6452 Florida Power & Light Company Cutler FL 919 0.079 8144372 TU Electric Collin TX 753 0.139 14217718 Southwestern Public Service Co. Plant X TX 529 0.158 16114354 Illinois Power Gadsby UT 624 0.08 8217609 Southern California Edison Co. San Bernardino CA 395 0.1 10217698 Central and South West Services Lieberman LA 471 0.15 15312686 Mississippi Power Company Jack Watson MS 309 0.197 20117718 Southwestern Public Service Co. Cunningham NM 502 0.225 23024211 Tucson Electric Power Company Irvington AZ 363 0.147 15017609 Southern California Edison Co. San Bernardino CA 393 0.103 105
803 Arizona Public Service Company Yuma Axis AZ 343 0.071 7217698 Central and South West Services Lieberman LA 424 0.14 143803 Arizona Public Service Company Ocotillo AZ 598 0.147 150803 Arizona Public Service Company Ocotillo AZ 561 0.138 141
24211 Tucson Electric Power Company Irvington AZ 367 0.185 1897806 Entergy Corporation R S Nelson LA 810 0.161 164
17698 Central and South West Services Arsenal Hill LA 505 0.134 137

UNCONTROLLED NOx EMISSION DATA FOR TANGENTIAL FIRED BOILERS (CONTINUED)
util code utility plant stateAverage heat input
(MMBtu/hr)nox rate-3Q(lb/MMBtu)
nox rate-3Q(lb/MMscf)
A-8
12686 Mississippi Power Company Jack Watson MS 307 0.149 1521015 City of Austin Electric Utility Dpt Holly Street TX 512 0.102 1048901 Houston Lighting & Power Company T H Wharton TX 954 0.157 160
24211 Tucson Electric Power Company Irvington AZ 443 0.202 20612686 Mississippi Power Company Jack Watson MS 490 0.194 19817718 Southwestern Public Service Co. Nichols Station TX 652 0.15 15317698 Central and South West Services Wilkes TX 841 0.151 15417718 Southwestern Public Service Co. Plant X TX 859 0.181 18522500 Western Resources, Inc. Hutchinson KS 579 0.272 27717718 Southwestern Public Service Co. Cunningham NM 1200 0.208 21244372 TU Electric Stryker Creek TX 3615 0.16 16316604 City Public Service V H Braunig TX 1216 0.162 16517718 Southwestern Public Service Co. Maddox NM 883 0.154 1576958 City of Garland Ray Olinger TX 332 0.12 122
44372 TU Electric Mountain Creek TX 3481 0.162 16516604 City Public Service V H Braunig TX 1069 0.179 18317718 Southwestern Public Service Co. Nichols Station TX 945 0.218 2229096 Lafayette Utilities System Doc Bonin LA 427 0.141 144
14063 Oklahoma Gas & Electric Co. Horseshoe Lake OK 590 0.081 831015 City of Austin Electric Utility Dpt Decker Creek TX 1574 0.155 158
16604 City Public Service V H Braunig TX 1945 0.218 22217718 Southwestern Public Service Co. Jones Station TX 1422 0.249 25416604 City Public Service O W Sommers TX 2138 0.205 20911269 Lower Colorado River Authority Sim Gideon TX 1603 0.174 1778901 Houston Lighting & Power Company Greens Bayou TX 2094 0.113 115
16604 City Public Service O W Sommers TX 2525 0.153 15616463 Ruston Utilities System Ruston LA 17 0.14 1431015 City of Austin Electric Utility Dpt Holly Street TX 1151 0.178 182
17718 Southwestern Public Service Co. Jones Station TX 1368 0.245 25011269 Lower Colorado River Authority T C Ferguson TX 2120 0.175 179
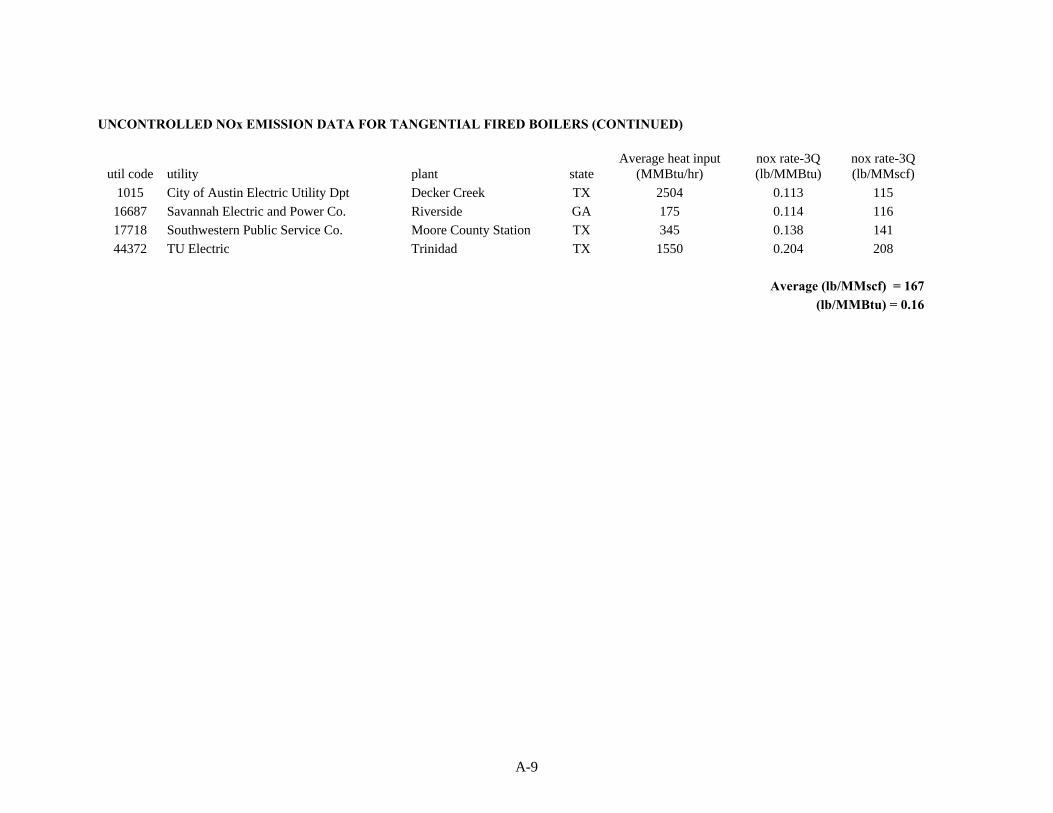
UNCONTROLLED NOx EMISSION DATA FOR TANGENTIAL FIRED BOILERS (CONTINUED)
util code utility plant stateAverage heat input
(MMBtu/hr)nox rate-3Q(lb/MMBtu)
nox rate-3Q(lb/MMscf)
A-9
1015 City of Austin Electric Utility Dpt Decker Creek TX 2504 0.113 11516687 Savannah Electric and Power Co. Riverside GA 175 0.114 11617718 Southwestern Public Service Co. Moore County Station TX 345 0.138 14144372 TU Electric Trinidad TX 1550 0.204 208
Average (lb/MMscf) = 167(lb/MMBtu) = 0.16
APPENDIX B
Reviewer Comments and EPA Responses

B-1
List of Addresseses for Draft Section 1.4
Mr. Lawrence C. Bradbury, P.E., J.D.(provided comments)Director, Environment & SafetyAtlanta Gas Light CompanyP.O. Box 4569Atlanta, GA 30302-4569
Mr. Ray A. Bradford (provided comments)Manager Safety Environmental & Regulatory CompliancePhillips Petroleum CompanyP.O. Box 1967Houston, TX 77251-1967
Mr. Nicholas J. BushNatural Gas Supply Association1129 20th Street N.W.Suite 300Washington, D.C. 20036
Mr. R.E. CannonGas Processors Association6526 E. 60th StreetTulsa, OK 74145
Mr. Paul Chu (provided comments)Electric Power Research Institute3412 Hillview AvenuePalo Alto, CA 94303
Dr. A. Kent EvansSr. Environmental PlannerConsumers Energy1945 West Parnall RoadJackson, WI 49201-8642
Mr. Jeff GlennTexas Natural Resource ConservationCommissionP.O. Box 13087MC 164Austin, TX 78711-3087
Mr. Robert HallAir Pollution Prevention and Control Division
(MD-65)U.S. Environmental Protection AgencyResearch Triangle Park, North Carolina 27711
Mr. Craig S. HarrisonHunton & Williams2000 Pennsylvania Avenue, N.W.Washington, D.C. 20036
Mr. Roy Huntley (provided comments)U.S. Environmental Protection AgencyEmission Factor and Inventory Group (MD-14)Research Triangle Park, N.C. 27711
Mr. David G. Lachapelle (provided comments)U.S. Environmental Protection AgencyAir Pollution Prevention and Control Division(MD-04)Research Triangle Park, N.C. 27711
Mr. Bill Maxwell (provided comments)Office of Air Quality Planning and Standards (MD-13)U.S. Environmental Protection AgencyResearch Triangle Park, North Carolina 27711
Mr. Jim McCarthyGas Research Institute8600 W. Bryn Mawr AvenueChicago, IL 60631
Mr. Russ Mosher (provided comments)American Boiler Manufacturers Association950 N. Glebe RoadSuite 160Arlington, VA 22203
Mr. Peter MussioSupervisor, Environmental EngineeringUnion Gas Limited/Centra Gas Ontario, Inc.50 Keil Drive NorthChatham, Ontario N7M 5M1
Natural Resources Defense Council40 West 20th StreetNew York, NY 10011
B-2
Mr. Ted M. PolychronisSenior Air Quality EngineerSouth CoastAir Quality Management DistrictPlanning & Technology Advancement21865 Copley DriveDiamond Bar, CA 91765
Mr. John PratapasGas Research Institute8600 W. Bryn Mawr AvenueChicago, IL 60631
Mr. Ralph Roberson5400 Glenwood Ave.Suite G-11Raleigh, NC 27612
Ms. Marise Lada TextorUnit Manager, Water & EcologyChevron Research & Technology CompanyP.O. Box 1627Richmond, CA 94802-1627
Ms. Glenda SmithAmerican Petroleum Institute1220 L Street, N.W.Washington, DC 20005
R.E. Sommerlad (provided comments)Gas Research Institute (GRI)8600 West Bryn Mawr AvenueChicago, IL 60631-3562
Mr. John Stower (provided comments)Staff Environmental AnalysisBurns and McDonald Engineering9400 Ward ParkwayKansas City, MO 64114
Ms. Lori TraweekAmerican Gas Association1515 Wilson Blvd.Arlington, VA 22209
Summary of CommentsSection 1.4 - Natural Gas Combustion
B-3
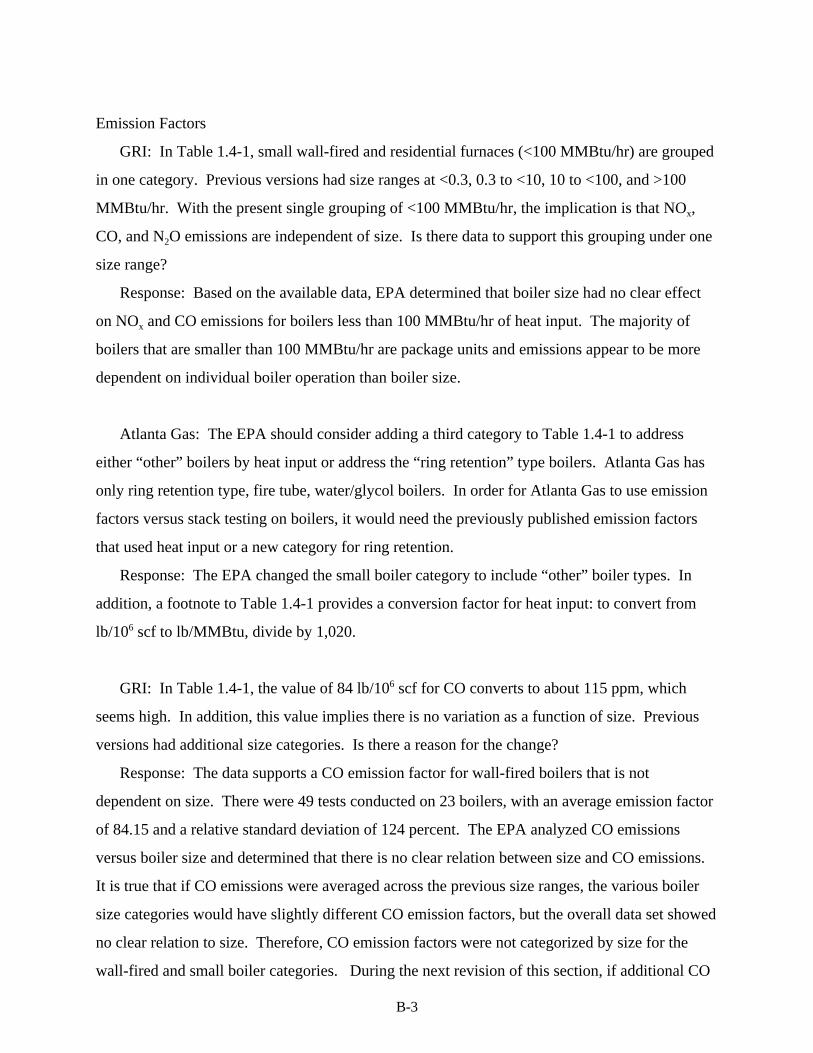
Emission Factors
GRI: In Table 1.4-1, small wall-fired and residential furnaces (<100 MMBtu/hr) are grouped
in one category. Previous versions had size ranges at <0.3, 0.3 to <10, 10 to <100, and >100
MMBtu/hr. With the present single grouping of <100 MMBtu/hr, the implication is that NOx,
CO, and N2O emissions are independent of size. Is there data to support this grouping under one
size range?
Response: Based on the available data, EPA determined that boiler size had no clear effect
on NOx and CO emissions for boilers less than 100 MMBtu/hr of heat input. The majority of
boilers that are smaller than 100 MMBtu/hr are package units and emissions appear to be more
dependent on individual boiler operation than boiler size.
Atlanta Gas: The EPA should consider adding a third category to Table 1.4-1 to address
either “other” boilers by heat input or address the “ring retention” type boilers. Atlanta Gas has
only ring retention type, fire tube, water/glycol boilers. In order for Atlanta Gas to use emission
factors versus stack testing on boilers, it would need the previously published emission factors
that used heat input or a new category for ring retention.
Response: The EPA changed the small boiler category to include “other” boiler types. In
addition, a footnote to Table 1.4-1 provides a conversion factor for heat input: to convert from
lb/106 scf to lb/MMBtu, divide by 1,020.
GRI: In Table 1.4-1, the value of 84 lb/106 scf for CO converts to about 115 ppm, which
seems high. In addition, this value implies there is no variation as a function of size. Previous
versions had additional size categories. Is there a reason for the change?
Response: The data supports a CO emission factor for wall-fired boilers that is not
dependent on size. There were 49 tests conducted on 23 boilers, with an average emission factor
of 84.15 and a relative standard deviation of 124 percent. The EPA analyzed CO emissions
versus boiler size and determined that there is no clear relation between size and CO emissions.
It is true that if CO emissions were averaged across the previous size ranges, the various boiler
size categories would have slightly different CO emission factors, but the overall data set showed
no clear relation to size. Therefore, CO emission factors were not categorized by size for the
wall-fired and small boiler categories. During the next revision of this section, if additional CO

B-4
emission data indicates a stronger correlation between size and CO emission levels, then CO
emission factors would be distinguished by size.
Burns & McDonnell: Footnote “d” is not properly referenced in Table 1.4-2. It should
appear with SO2 in the pollutant column. Also, EPA should stress that since the emission factors
are based on a natural gas heat content of 1,020 Btu/scf, users may need to adjust the emission
factors. If the heat content of their natural gas differs from the 1,020 Btu value, users should
adjust the emission factor by a ratio of the heat rates (actual Btu heat content /1,020 Btu value).
In addition, this same approach applies to the assumed 2,000 grains of sulfur/MMscf for the SO2
emission rates within the Table 1.4-2.
Response: Footnote “d” has been corrected to properly reference the SO2 emission factor.
Footnote “d” of Table 1.4-2 was also amended to provide guidance on adjusting emission factors
for sources firing natural gas with Btu ratings different from 1,020 Btu/scf. A similar approach
was taken with the SO2 emission factor; in this case, EPA provided guidance to adjust the SO2
emission factor at sources where the sulfur content of the natural gas was different from
2,000 grains/MMscf.
U.S. EPA, EFIG: The CO2 emission factor in Table 1.4-2 should be 120,000, not 12,000.
Also, correct footnote “b” calculation.
Response: The emission factor has been corrected to 120,000 lb/MMscf. The EPA also
corrected an error in footnote “b” regarding the calculation of the CO2 emission factor.
GRI: Table 1.4-2 indicates a conversion of fuel carbon to CO2 of 99.5%. This converts to
about 5,000 ppm of CO and other hydrocarbons. This seems high for commercial boilers.
Typical values of CO are less than 50 ppm and other hydrocarbons are typically below 100 ppm.
These would result in a conversion efficiency of 99.995% rounded down to 99.9%. Is this value
correct?
Response: The assumed fuel carbon conversion as been changed to 99.9%. This adjustment
will not change the CO2 emission factor since it was rounded to two significant figures.

B-5
Unidentified commenter via U.S. EPA, EFIG: Put Chemical Abstract Services (CAS)
numbers with the Hazardous Air Pollutant (HAP) in the tables. The HAP list in the section is
confusing because many of those compounds listed are not listed in section 112(b) of the
1990 Amendments to the Clean Air Act, and they only qualify as HAPs because they are
Polycylic Organic Matter (POMs). It would be more clear to label which compounds are HAPs
and which are HAPs because they are POMs.
Response: CAS numbers were assigned to all pollutants for easy identification. The EPA
also distinguished between HAPs and compounds that are classified as HAPs because they are
POMs.
GRI: GRI suggests adding a footnote to the tables to explain to the casual reader the meaning
of “emission factor rating.”
Response: Rather than footnote each table with an explanation of emission factor ratings, the
ratings are discussed at the end of the section. In addition, the EPA fully discusses emission
factor ratings in the introduction to AP-42 and in the Emission Factor Documentation for
Section 1.4 (background report).
Phillips: The emissions data suggest that grouping the toxics data into specific categories of
heaters/boilers could provide more accurate emission factors for air toxics. In the database
enclosed with the report, arithmetic averages are used to calculate the criteria pollutant and toxics
emission factors. By using arithmetic averages, the assumption is made that the distribution is
normal. However, Phillips’ review of the normality and probability of the toxics data shows non-
random behavior (non-normal distribution). The commenter suggests that, if it has not already
been considered, the toxics data may be grouped by heater/boiler heat input to increase the
accuracy of the resulting emission factors. (The commenter recognizes that small sample sizes
reduce the effectiveness of normality tests.) If this suggested grouping has already been
considered and would not work, EPA should discuss this in the background report. Otherwise,
EPA should consider a new grouping.
Response: The toxic data were analyzed for these source categories to determine if grouping
these data by source type would provide more accurate emission factors. Based on this analysis
and given the limited data available, no clear relation is apparent between these source categories

B-6
and toxic emission levels. Therefore, EPA maintains that the current grouping is the most
appropriate. The background report provides a discussion of this decision.
Phillips: The emission factors for natural gas-fired heaters should be delayed pending the
results of the GRI/API/Radian study of engine emissions. A program for characterizing and
quantifying emissions from reciprocating engines used in oil and gas production is underway and
the data will be available in October 1997. The program will also investigate the emissions from
a 62.5 MMBtu/hr boiler and a heater treater which is representative of small heaters used in the
oil and gas production industry. The list of analytes chosen for this effort includes those reported
in Tables 1.4-2 and 1.4-4. The resulting data meet EPA’s criteria for an emission factor rating of
“A.” The value of the data justifies a short delay in publishing the revised emission factors.
Response: The EPA is aware of the data that will be available in the GRI/API/Radian study
but that the final report will not be ready for distribution until early 1998. Given the time frame
of the publication of this report, EPA does not want to delay the revision of Section 1.4 of AP-42
to include this data. The EPA understands that the report has data from 1 boiler and that the
inclusion of 1 extra boiler in the database should have little effect on the emission factors in this
revision. However, the emission test data from the boilers tested in the GRI study will be
incorporated in the next revision to Section 1.4.
Phillips: Only emission factors with an emission factor rating of A, B, or C should be
published in the public domain. The use of emission factors based on poor quality data may have
far-reaching, undesirable consequences.
Response: The primary purpose of AP-42 is to provide emission factors for emission
inventories. The EPA provides emission factors for as many sources and as many pollutants as
available resources allow. The factors are rated “A” through “E” to provide the user with an
indication of how good an emission factor is, with an “A” being excellent and “E” being poor.
The criteria that are used to determine a rating for a factor can be found in the document entitled
“Procedures for Preparing Emission Factor Documents, EPA-454/R-95-0150.” While the EPA
shares your concern about poor quality emission factors for various reasons, the factor rating is
used to judge whether the factor is appropriate.

B-7
Controls
GRI: Section 1.4 states that low-NOx burners and flue gas recirculation (FGR) are the most
prevalent combustion NOx control techniques being applied to natural gas-fired boilers. GRI
agrees that low-NOx burners are prevalent in all classes and size ranges of boilers. However,
GRI does not agree that FGR is prevalent for boilers with capacities less than 100 MMBtu/hr.
Also, one NOx control system not mentioned is gas reburning. Gas reburning is an attractive
technical and economic alternative to SNCR or SCR. The commenter cited demonstrations of
gas reburn on a tangentially-fired utility boiler, a front-wall boiler, and an opposed-wall boiler.
The tangentially-fired boiler achieved a 55-65% reduction of NOx and the opposed-wall and
front-wall burners achieved 80% and 73% reductions, respectively.
Response: The EPA is aware that FGR technology is most prevalent in boilers with heat
inputs greater than 100 MMBtu/hr, however, EPA has data from boilers with heat inputs less
than 100 MMBtu/hr that employ FGR and low-NOx burners for NOx control. The EPA has
received tests from several boilers with heat inputs less than 100 MMBtu/hr that have FGR and
low-NOx burners. Furthermore, there is a separate category for the boilers for NOx emission
factors. With respect to gas reburning, EPA does not have any data to evaluate the performance
of gas reburning. In the final version of this revision to Section 1.4, gas reburning will be
mentioned as a NOx control technology. However, NOx reduction efficiencies will not be
presented in this revision to Section 1.4 due to the lack of supporting data.
GRI: Section 1.4 states that the addition of low-NOx burners and FGR may reduce
combustion efficiency. This implies that low-NOx burners and FGR are the direct cause of
reduced combustion efficiency. This is not necessarily correct. Incomplete combustion can be
unburned fuel, unburned carbon, and newly formed solid, liquid, or gaseous hydrocarbons. One
of the later species could be CO. GRI suggests the following revision to the paragraph:
“Improperly tuned boilers and boilers operating at off-design levels can result in increased
partially oxidized combustibles (e.g., CO) and thus, decreased combustion efficiency. The
addition of NOx control systems such as low-NOx burners and FGR may also result in increased
CO or other partially oxidized combustibles, and likewise, decreased combustion efficiency.”
B-8
Response: The effects of improperly tuned boilers on CO and hydrocarbon emissions
were addressed in the discussions on CO and hydrocarbon emissions. Therefore, GRI’s
suggestion will not be added.
GRI: It is also worth mentioning that current NOx control systems can lower NOx
emissions without increases in other emissions such as CO, VOCs, and PM. An example of this
is shown in Section 2, Reference 6.
Response: The EPA will add this to its discussion of NOx control technologies.
GRI: There has been significant testing of minor products of combustion and also
significant development of low-NOx burners and NOx control technology in recent years. If it is
not within EPA’s current resources to obtain later information, it would be well to indicate the
data in the tables are from sources with publication dates ranging from 1990-1996.
Response: The background report provides a list of all the references used in this
revision including testing dates. If users wish to evaluate the age of the data, they can download
this document from the TTN.
Emission Data
ABMA and EPRI both provided emission data for natural gas fired boilers. The data
provided by ABMA was used for comparative purposes and was not included for emission factor
development because it did not contain complete testing information. The data provided by
EPRI did contain complete testing information and was used in the development of emission
factors.