Embed Size (px)
Citation preview
1
Trauma Epidemiology
Mats O. Beckman
Radiology Karolinska Solna
2 Trauma epidemiology May 06
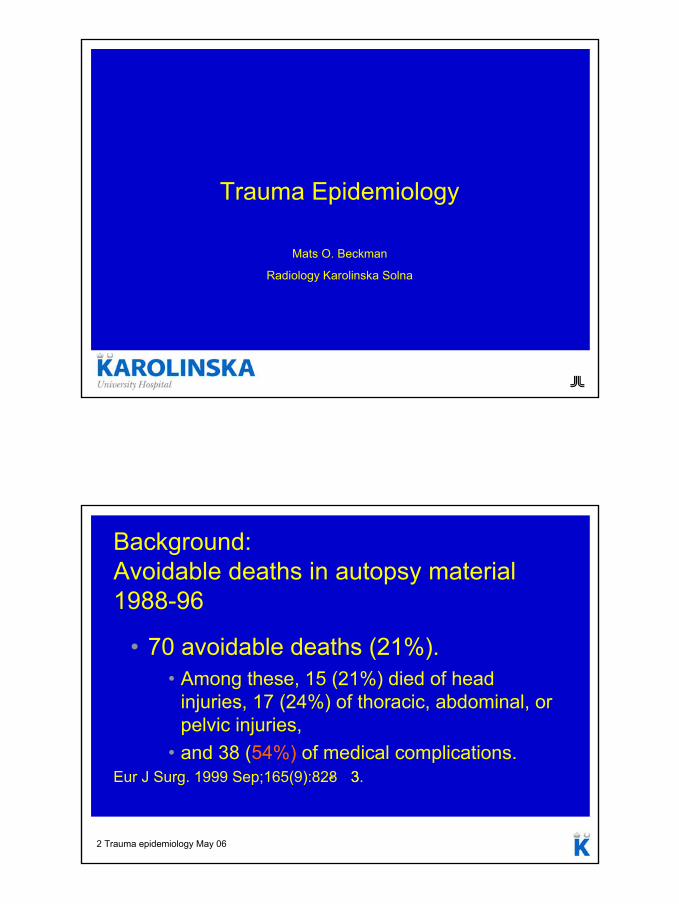
Background:Avoidable deaths in autopsy material 1988-96
• 70 avoidable deaths (21%). • Among these, 15 (21%) died of head
injuries, 17 (24%) of thoracic, abdominal, or pelvic injuries,
• and 38 (54%) of medical complications. Eur J Surg. 1999 Sep;165(9):828- 33.
2
3 Trauma epidemiology May 06
Room for improvement!
4 Trauma epidemiology May 06
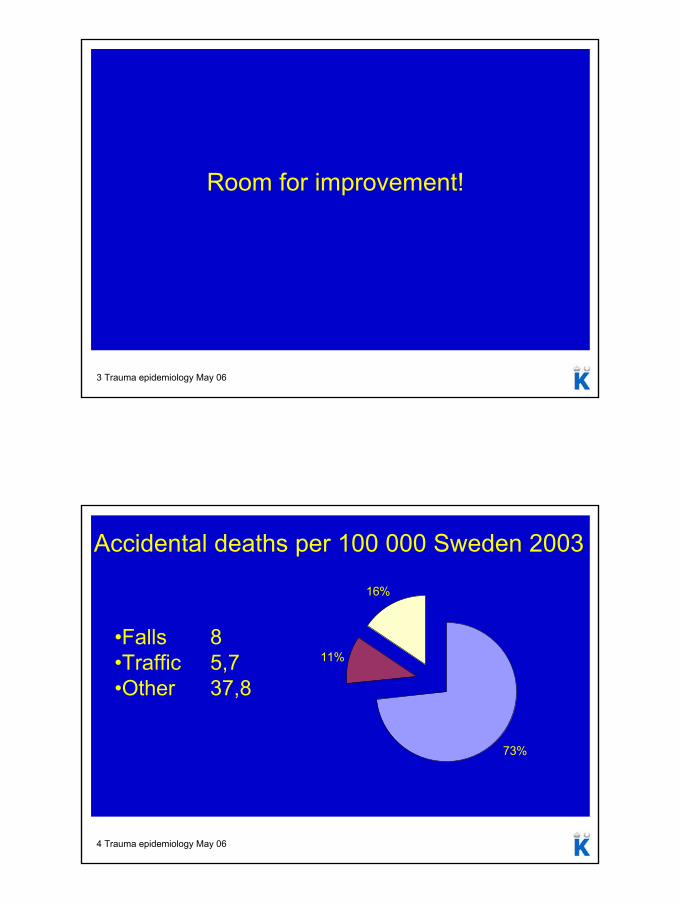
73%
11%
16%
Accidental deaths per 100 000 Sweden 2003
•Falls 8•Traffic 5,7•Other 37,8
3
5 Trauma epidemiology May 06
Causes of trauma KS 2000
Fall 18%
MC 15%
Ped 12%
Penetr 3.1%
Cycling 5%
Other 6.9
MVC 41%
MVC 41%Fall 18%MC 15%Ped 12%Cycling 5%Penetr 3.1%Other 6.9
6 Trauma epidemiology May 06
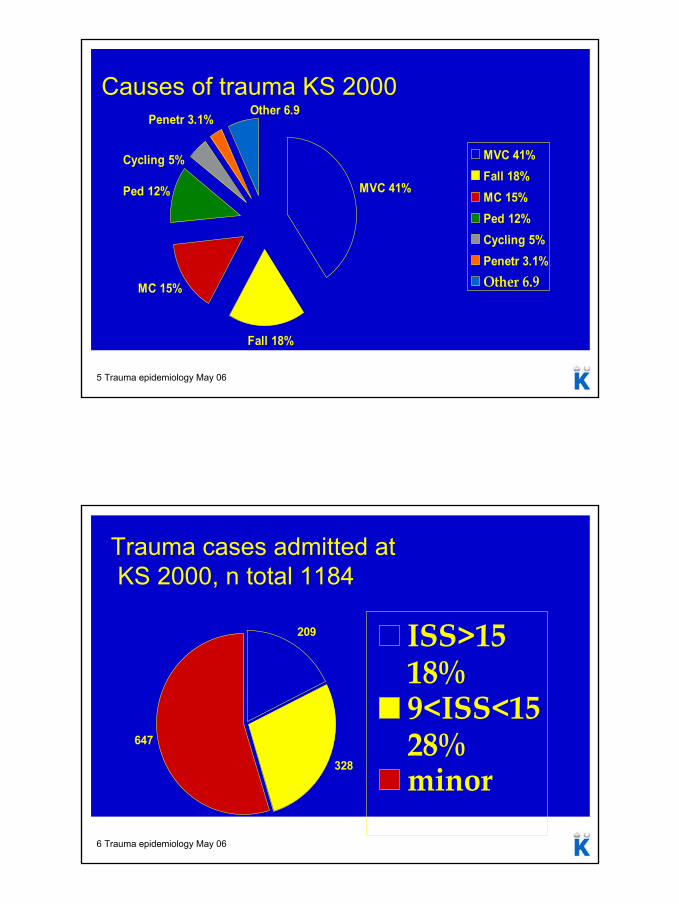
Trauma cases admitted at KS 2000, n total 1184
209
328
647
ISS>1518%9<ISS<1528%minor
4
7 Trauma epidemiology May 06
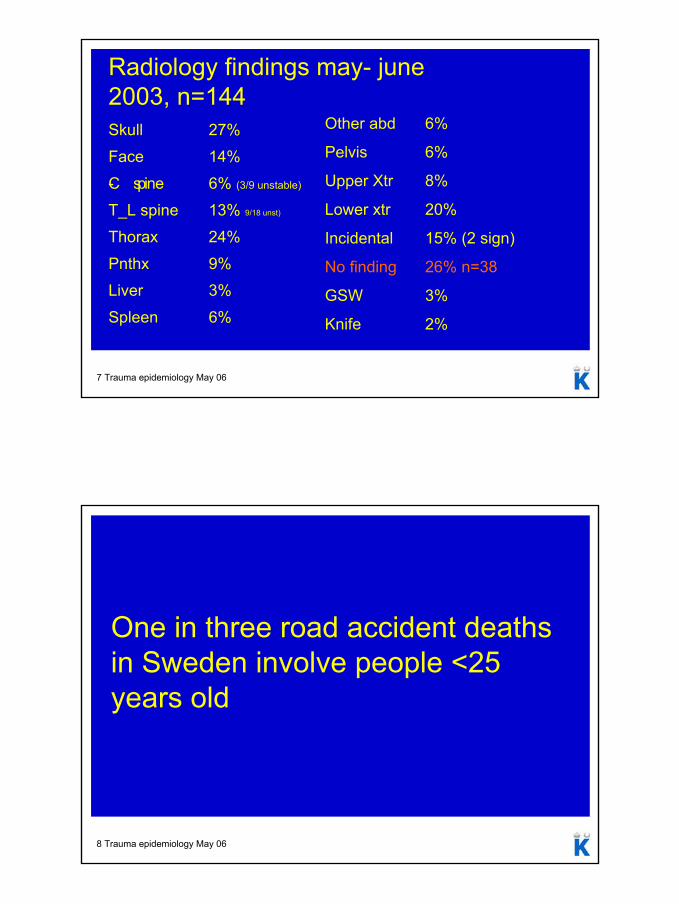
Radiology findings may- june 2003, n=144Skull 27%
Face 14%
C- spine 6% (3/9 unstable)
T_L spine 13% 9/18 unst)
Thorax 24%
Pnthx 9%
Liver 3%
Spleen 6%
Other abd 6%
Pelvis 6%
Upper Xtr 8%
Lower xtr 20%
Incidental 15% (2 sign)
No finding 26% n=38
GSW 3%
Knife 2%
8 Trauma epidemiology May 06
One in three road accident deaths in Sweden involve people <25 years old
5
9 Trauma epidemiology May 06
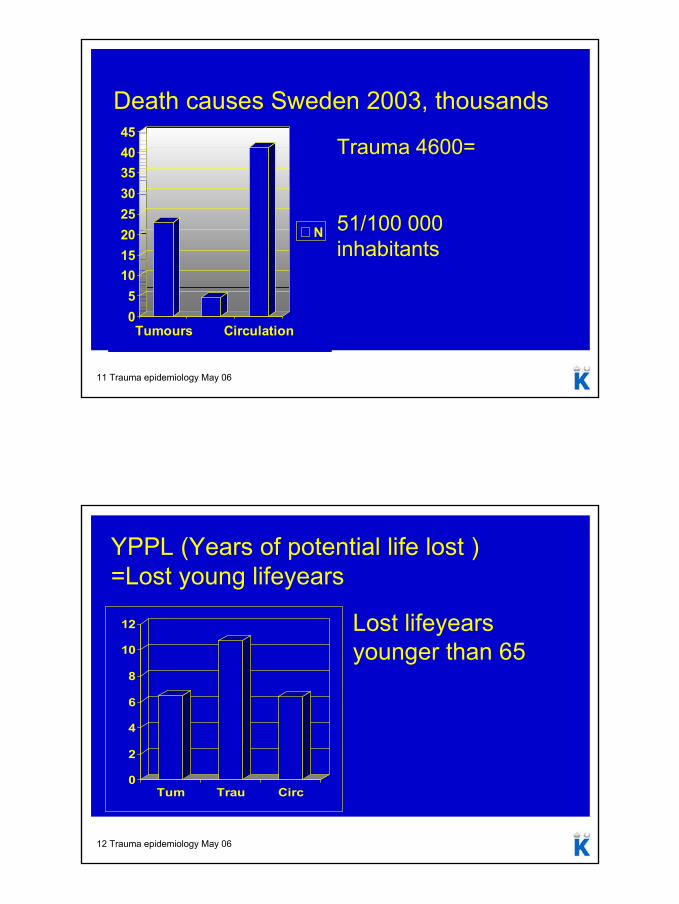
Sweden, Accidents Deaths per 100 000
0,0
10,0
20,0
30,0
40,0
50,0
60,0
70,0
80,0
1997 1998 1999 2000 2001 2002 2003
N
MenWomenBoth
10 Trauma epidemiology May 06
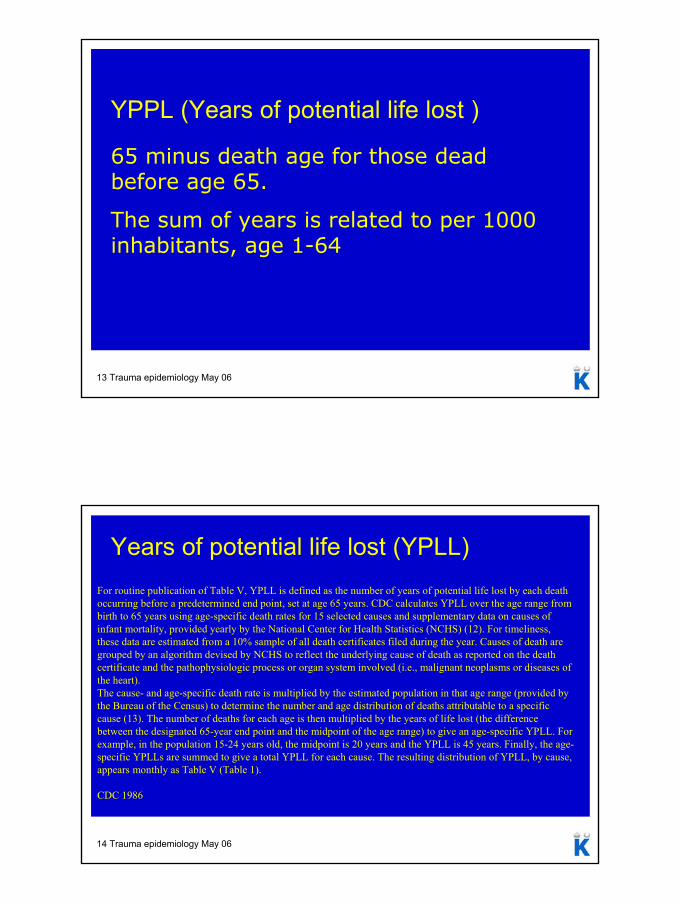
Accidental deaths, rescue statistics
Disco fire 1998
(statistical underestimation)
N
FireTraffic Drowning Total
Other acc.
6
11 Trauma epidemiology May 06
Death causes Sweden 2003, thousands
05
1015202530354045
Tumours Circulation
N
Trauma 4600=
51/100 000 inhabitants
12 Trauma epidemiology May 06
YPPL (Years of potential life lost ) =Lost young lifeyears
0
2
4
6
8
10
12
Tum Trau Circ
Lost lifeyears younger than 65
7
13 Trauma epidemiology May 06
YPPL (Years of potential life lost )
65 minus death age for those dead before age 65.
The sum of years is related to per 1000 inhabitants, age 1-64
14 Trauma epidemiology May 06
Years of potential life lost (YPLL)For routine publication of Table V, YPLL is defined as the number of years of potential life lost by each death occurring before a predetermined end point, set at age 65 years. CDC calculates YPLL over the age range from birth to 65 years using age-specific death rates for 15 selected causes and supplementary data on causes of infant mortality, provided yearly by the National Center for Health Statistics (NCHS) (12). For timeliness, these data are estimated from a 10% sample of all death certificates filed during the year. Causes of death are grouped by an algorithm devised by NCHS to reflect the underlying cause of death as reported on the death certificate and the pathophysiologic process or organ system involved (i.e., malignant neoplasms or diseases of the heart). The cause- and age-specific death rate is multiplied by the estimated population in that age range (provided by the Bureau of the Census) to determine the number and age distribution of deaths attributable to a specific cause (13). The number of deaths for each age is then multiplied by the years of life lost (the difference between the designated 65-year end point and the midpoint of the age range) to give an age-specific YPLL. For example, in the population 15-24 years old, the midpoint is 20 years and the YPLL is 45 years. Finally, the age-specific YPLLs are summed to give a total YPLL for each cause. The resulting distribution of YPLL, by cause, appears monthly as Table V (Table 1).
CDC 1986
8
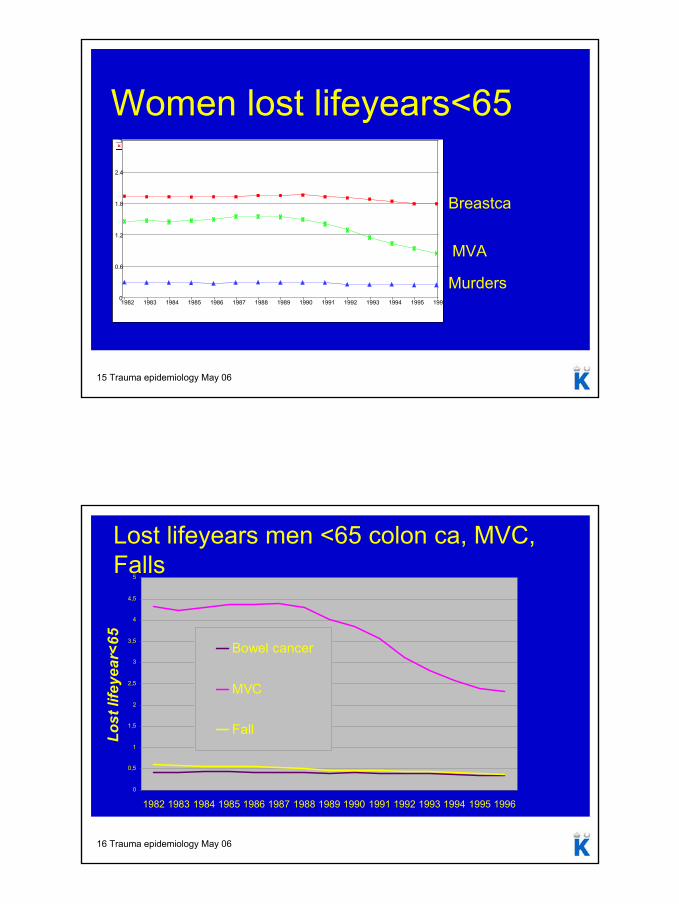
15 Trauma epidemiology May 06
Women lost lifeyears<65
0
0.6
1.2
1.8
2.4
3
1982 1983 1984 1985 1986 1987 1988 1989 1990 1991 1992 1993 1994 1995 1996
Breastca
MVA
Murders
16 Trauma epidemiology May 06
Lost lifeyears men <65 colon ca, MVC, Falls
0
0,5
1
1,5
2
2,5
3
3,5
4
4,5
5
1982 1983 1984 1985 1986 1987 1988 1989 1990 1991 1992 1993 1994 1995 1996
Lost
life
year
<65
Bowel cancer
MVC
Fall
9
17 Trauma epidemiology May 06
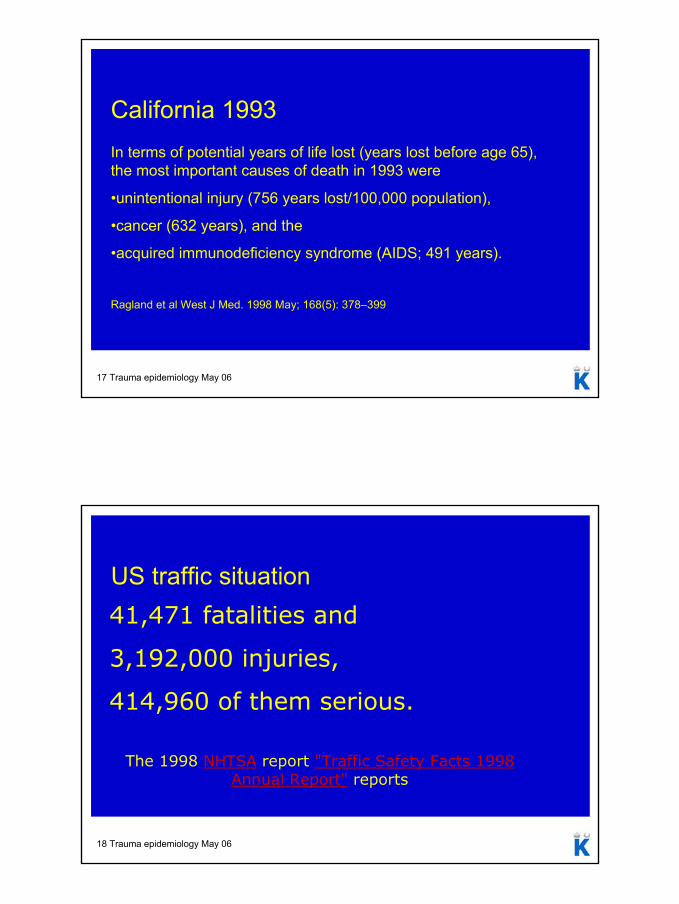
California 1993In terms of potential years of life lost (years lost before age 65), the most important causes of death in 1993 were
•unintentional injury (756 years lost/100,000 population),
•cancer (632 years), and the
•acquired immunodeficiency syndrome (AIDS; 491 years).
Ragland et al West J Med. 1998 May; 168(5): 378–399
18 Trauma epidemiology May 06
US traffic situation41,471 fatalities and
3,192,000 injuries,
414,960 of them serious.
The 1998 NHTSA report "Traffic Safety Facts 1998 Annual Report" reports
10
19 Trauma epidemiology May 06
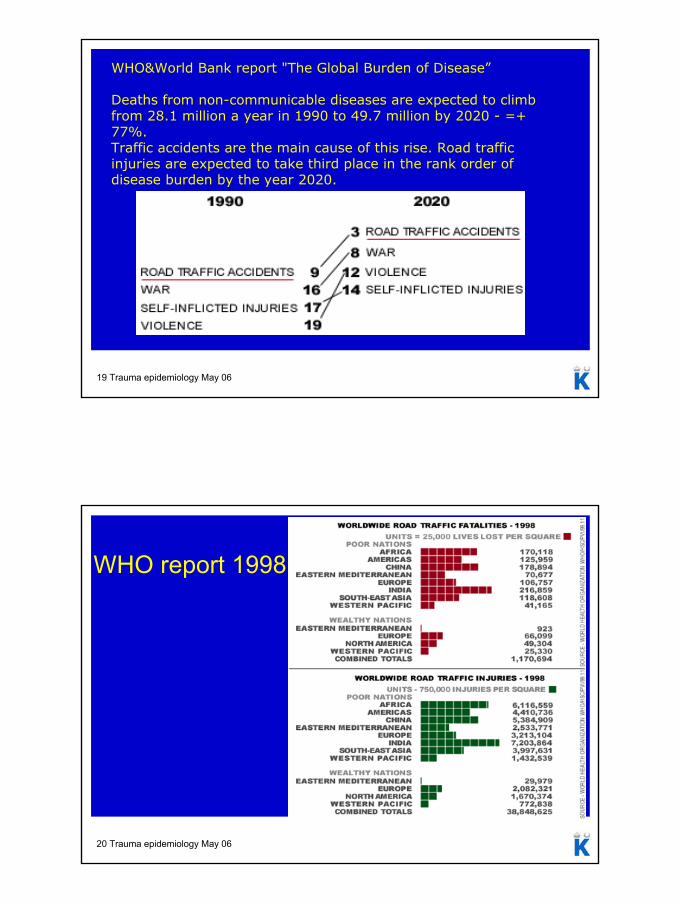
WHO&World Bank report "The Global Burden of Disease”
Deaths from non-communicable diseases are expected to climbfrom 28.1 million a year in 1990 to 49.7 million by 2020 - =+ 77%. Traffic accidents are the main cause of this rise. Road trafficinjuries are expected to take third place in the rank order of disease burden by the year 2020.
20 Trauma epidemiology May 06
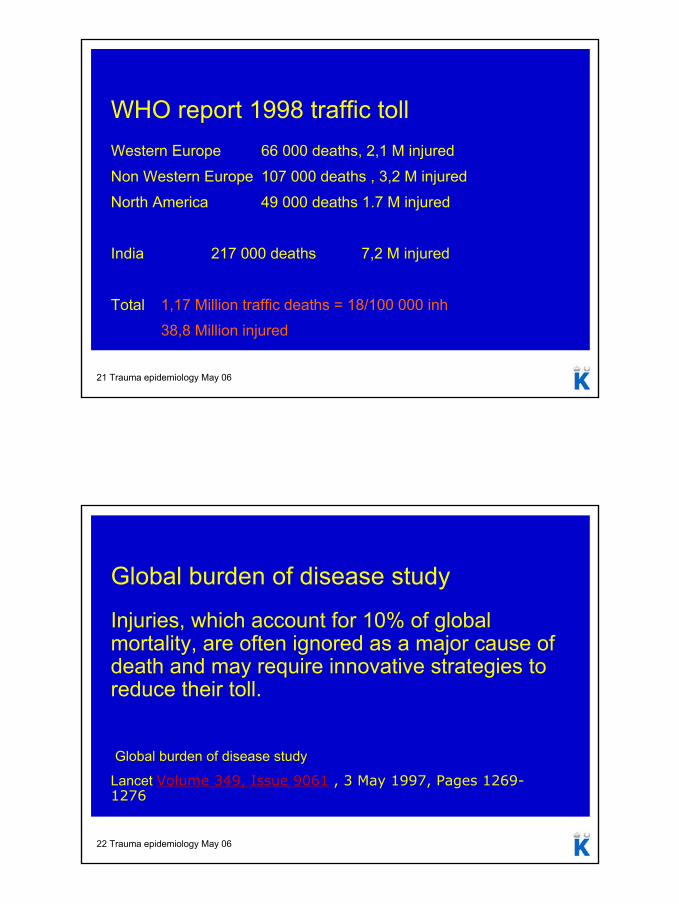
WHO report 1998
11
21 Trauma epidemiology May 06
WHO report 1998 traffic tollWestern Europe 66 000 deaths, 2,1 M injured
Non Western Europe 107 000 deaths , 3,2 M injured
North America 49 000 deaths 1.7 M injured
India 217 000 deaths 7,2 M injured
Total 1,17 Million traffic deaths = 18/100 000 inh
38,8 Million injured
22 Trauma epidemiology May 06
Global burden of disease study
Injuries, which account for 10% of global mortality, are often ignored as a major cause of death and may require innovative strategies to reduce their toll.
Global burden of disease study
Lancet Volume 349, Issue 9061 , 3 May 1997, Pages 1269-1276
12
23 Trauma epidemiology May 06
WHO Global burden of disease
Avian influenza207 cases
115 deaths
Cumulative worldwide since 2003
For every avian flu death there are 31 000 traffic deaths
24 Trauma epidemiology May 06
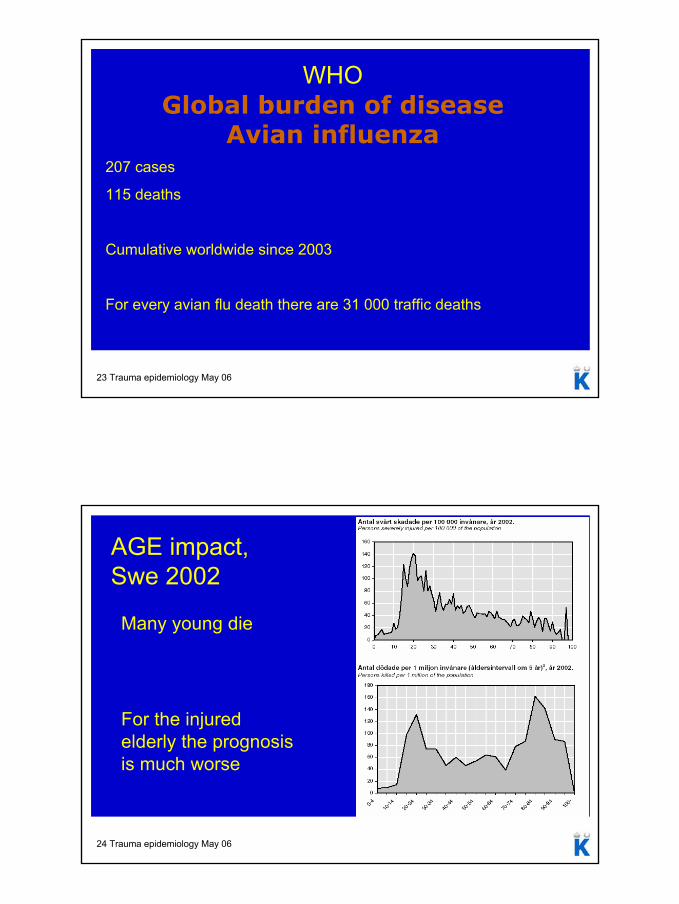
AGE impact, Swe 2002
Many young die
For the injured elderly the prognosis is much worse
13
25 Trauma epidemiology May 06
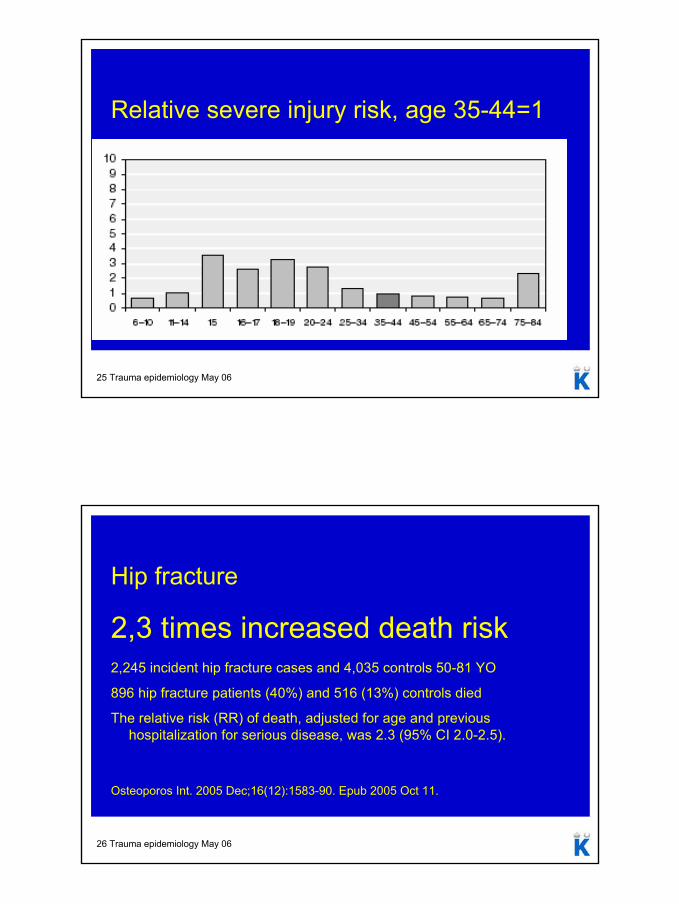
Relative severe injury risk, age 35-44=1
26 Trauma epidemiology May 06
Hip fracture
2,3 times increased death risk2,245 incident hip fracture cases and 4,035 controls 50-81 YO
896 hip fracture patients (40%) and 516 (13%) controls died
The relative risk (RR) of death, adjusted for age and previous hospitalization for serious disease, was 2.3 (95% CI 2.0-2.5).
Osteoporos Int. 2005 Dec;16(12):1583-90. Epub 2005 Oct 11.
14
27 Trauma epidemiology May 06
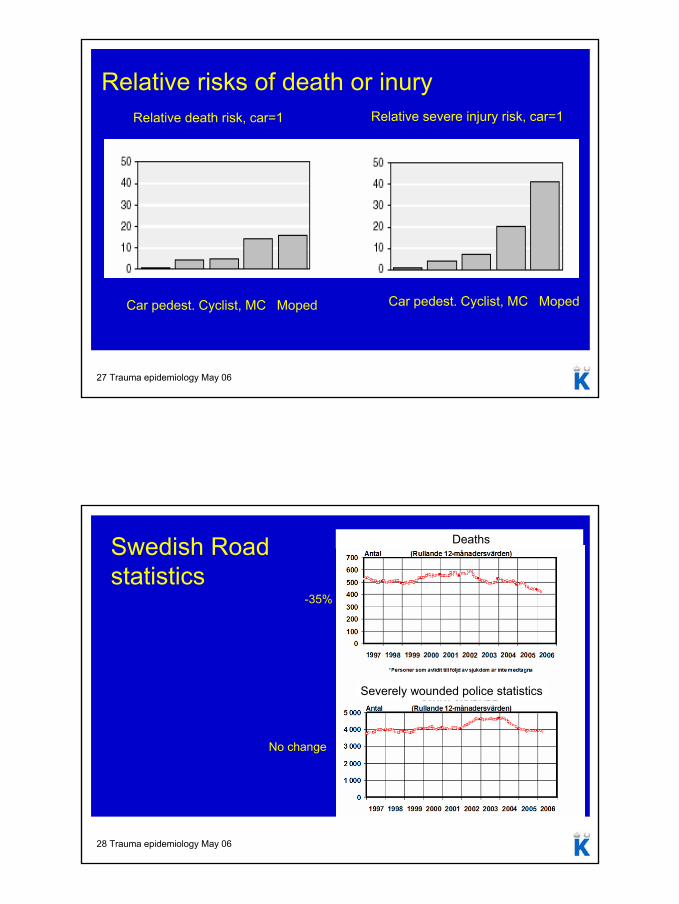
Relative risks of death or inuryRelative death risk, car=1 Relative severe injury risk, car=1
Car pedest. Cyclist, MC Moped Car pedest. Cyclist, MC Moped
28 Trauma epidemiology May 06
Swedish Road statistics
Deaths
Severely wounded police statistics
-35%
No change
15
29 Trauma epidemiology May 06
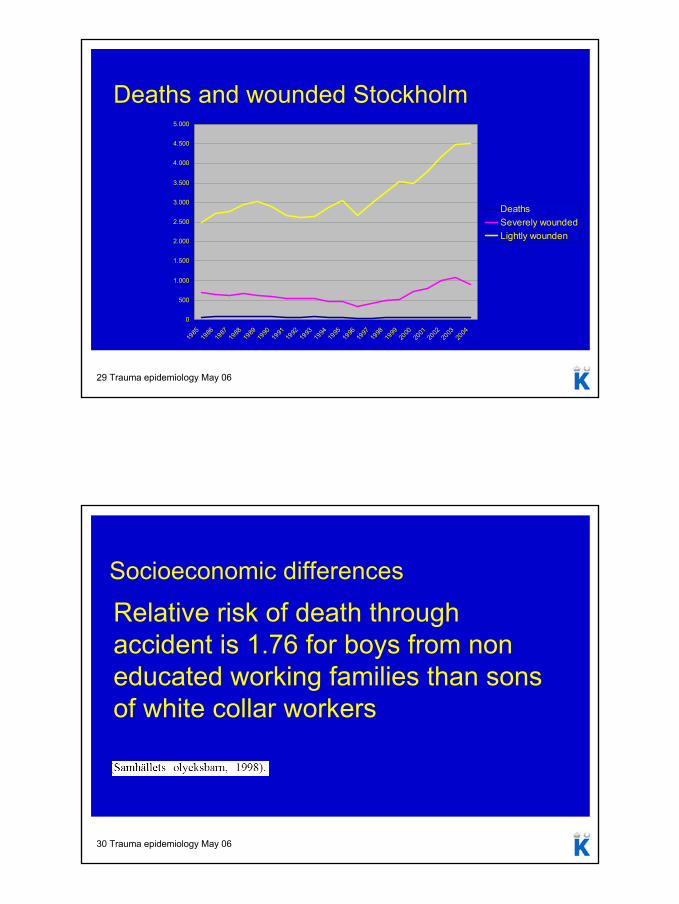
Deaths and wounded Stockholm
0
500
1.000
1.500
2.000
2.500
3.000
3.500
4.000
4.500
5.000
1985
1986
1987
1988
1989
1990
1991
1992
1993
1994
1995
1996
1997
1998
1999
2000
2001
2002
2003
2004
DeathsSeverely woundedLightly wounden
30 Trauma epidemiology May 06
Socioeconomic differences
Relative risk of death through accident is 1.76 for boys from non educated working families than sons of white collar workers
16
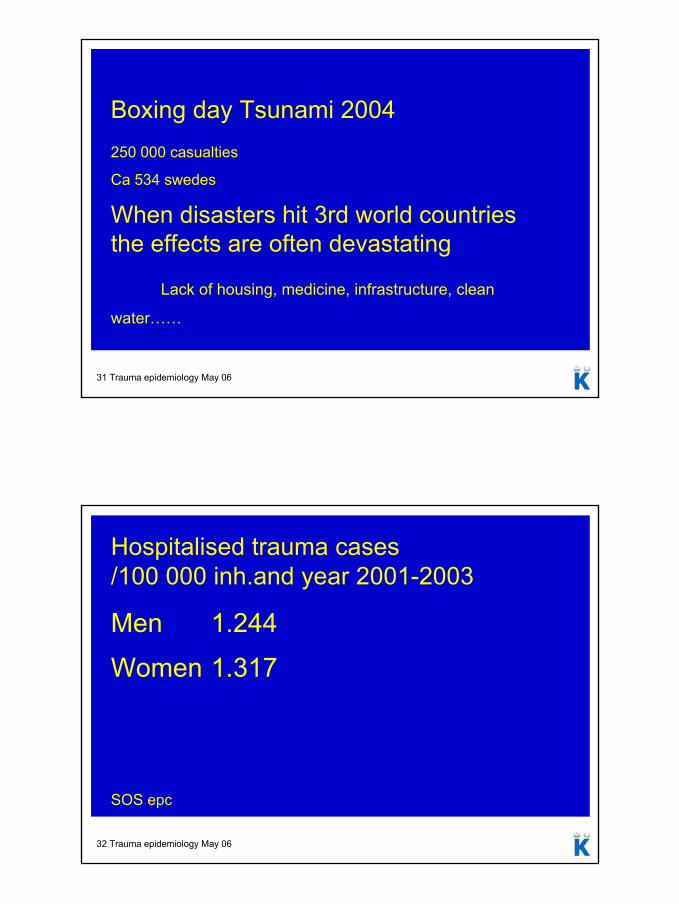
31 Trauma epidemiology May 06
Boxing day Tsunami 2004250 000 casualties
Ca 534 swedes
When disasters hit 3rd world countries the effects are often devastating
Lack of housing, medicine, infrastructure, clean
water……
32 Trauma epidemiology May 06
Hospitalised trauma cases/100 000 inh.and year 2001-2003
Men 1.244
Women 1.317
SOS epc
17
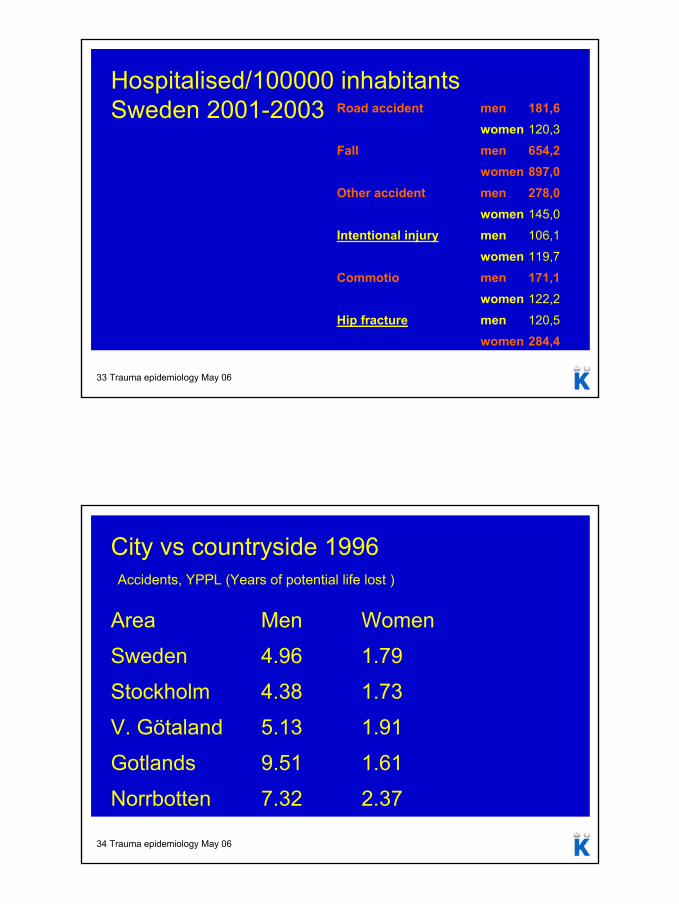
33 Trauma epidemiology May 06
Hospitalised/100000 inhabitantsSweden 2001-2003 Road accident men 181,6
women 120,3
Fall men 654,2women 897,0
Other accident men 278,0women 145,0
Intentional injury men 106,1
women 119,7
Commotio men 171,1women 122,2
Hip fracture men 120,5
women 284,4
34 Trauma epidemiology May 06
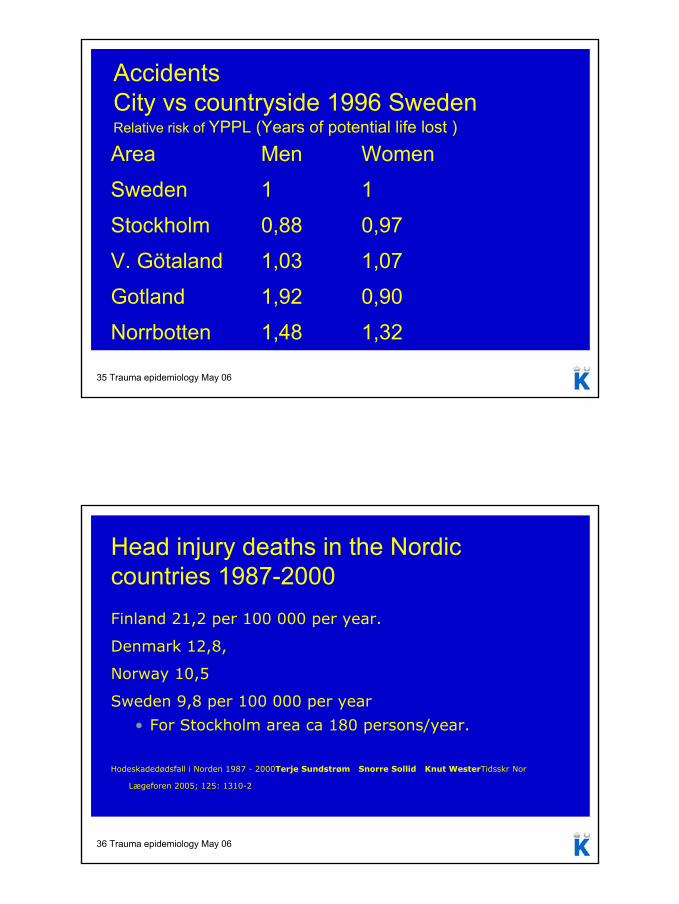
City vs countryside 1996Accidents, YPPL (Years of potential life lost )
Area Men Women
Sweden 4.96 1.79
Stockholm 4.38 1.73
V. Götaland 5.13 1.91
Gotlands 9.51 1.61
Norrbotten 7.32 2.37
18
35 Trauma epidemiology May 06
AccidentsCity vs countryside 1996 Sweden Relative risk of YPPL (Years of potential life lost )
Area Men Women
Sweden 1 1
Stockholm 0,88 0,97
V. Götaland 1,03 1,07
Gotland 1,92 0,90
Norrbotten 1,48 1,32
36 Trauma epidemiology May 06
Head injury deaths in the Nordic countries 1987-2000Finland 21,2 per 100 000 per year.
Denmark 12,8,
Norway 10,5
Sweden 9,8 per 100 000 per year
• For Stockholm area ca 180 persons/year.
Hodeskadedødsfall i Norden 1987 - 2000Terje Sundstrøm Snorre Sollid Knut WesterTidsskr Nor
Lægeforen 2005; 125: 1310-2
19
37 Trauma epidemiology May 06
Sweden 2001Trauma largest cause of deaths< 45.
• Mortality reduced by 37 % for men and 50% for women since 1980
• Traffic is the domination cause of deaths causing 20% of trauma deaths.
Mortality is greatest in low populated areas• SOS report
38 Trauma epidemiology May 06
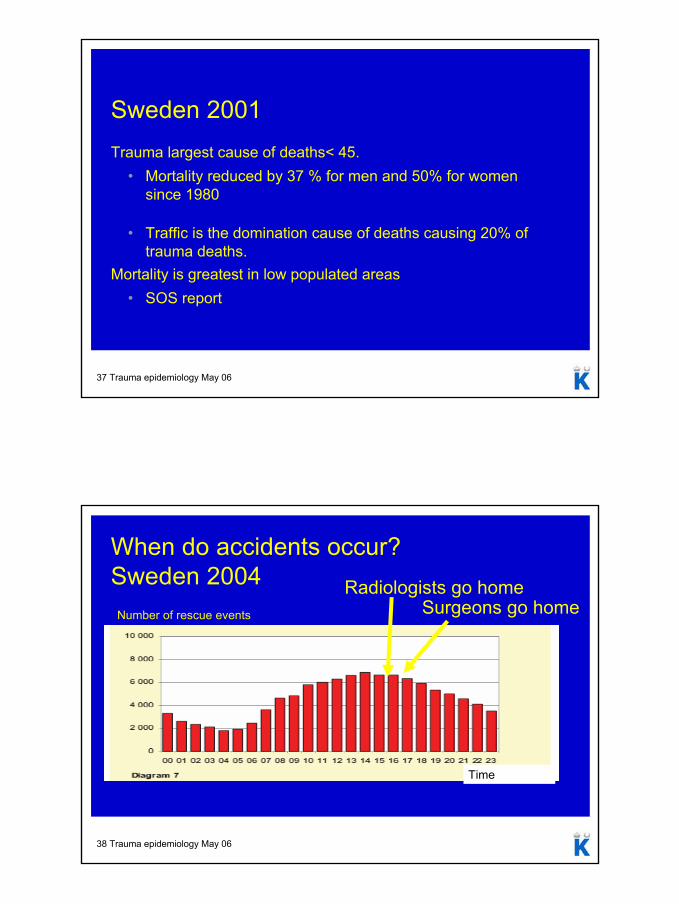
When do accidents occur? Sweden 2004 Radiologists go homeNumber of rescue events Surgeons go home
Time
20
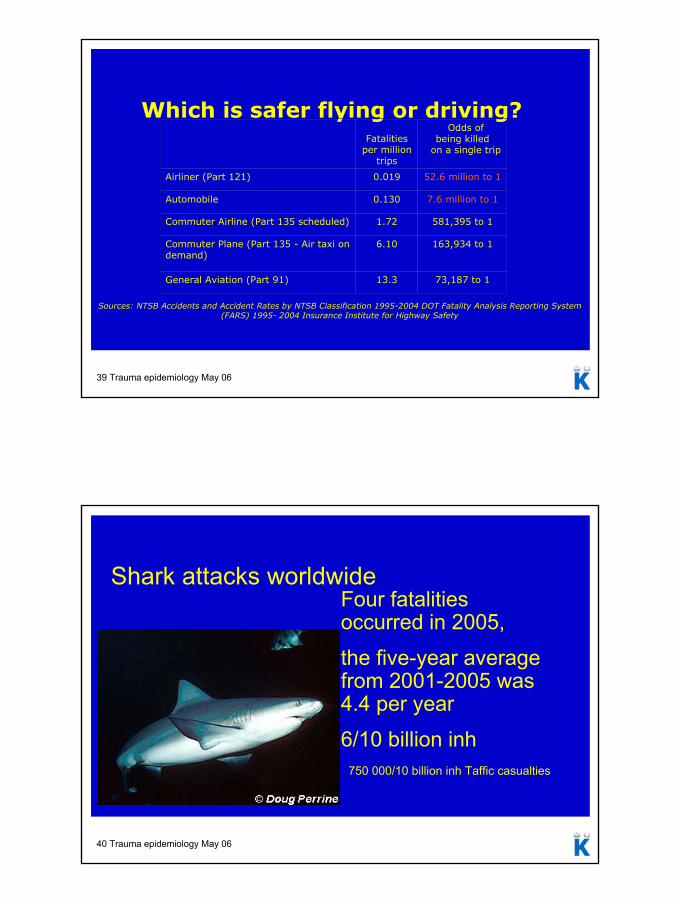
39 Trauma epidemiology May 06
Which is safer flying or driving? Fatalities
per million trips
Odds of being killed
on a single trip
Airliner (Part 121) 0.019 52.6 million to 1
Automobile 0.130 7.6 million to 1
Commuter Airline (Part 135 scheduled) 1.72 581,395 to 1
Commuter Plane (Part 135 - Air taxi on demand)
6.10 163,934 to 1
General Aviation (Part 91) 13.3 73,187 to 1
Sources: NTSB Accidents and Accident Rates by NTSB Classification 1995-2004 DOT Fatality Analysis Reporting System (FARS) 1995- 2004 Insurance Institute for Highway Safety
40 Trauma epidemiology May 06
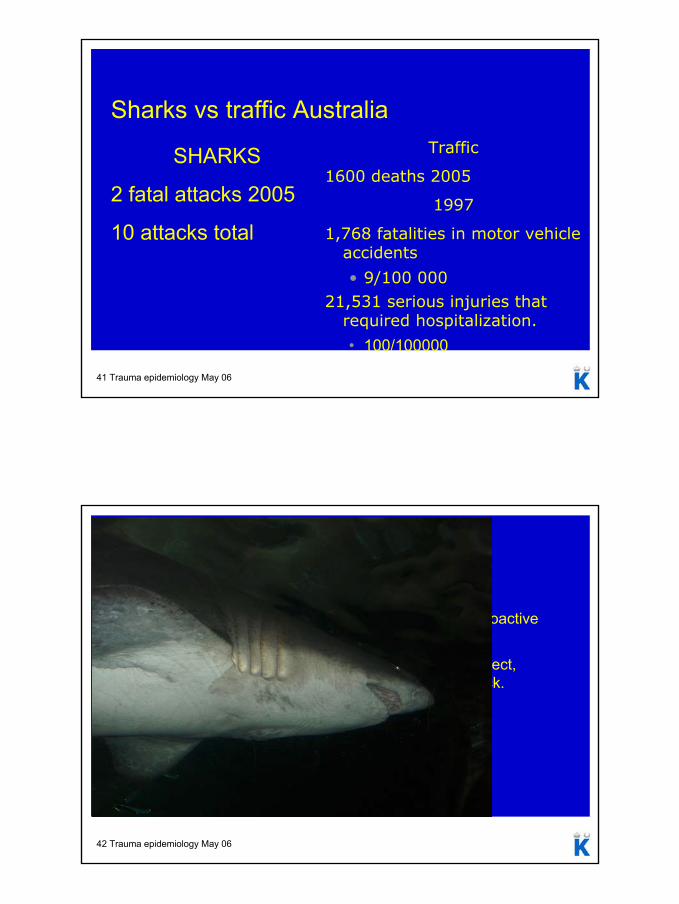
Shark attacks worldwideFour fatalities occurred in 2005,
the five-year averagefrom 2001-2005 was4.4 per year
6/10 billion inh 750 000/10 billion inh Taffic casualties
21
41 Trauma epidemiology May 06
Sharks vs traffic Australia
SHARKS
2 fatal attacks 2005
10 attacks total
Traffic
1600 deaths 2005
1997
1,768 fatalities in motor vehicle accidents
• 9/100 00021,531 serious injuries that
required hospitalization.
• 100/100000
42 Trauma epidemiology May 06
Shark adviseIf one is actually under attack by a shark, we advise a proactive response.
Hitting a shark on the nose, ideally with an inanimate object, usually results in the shark temporarily curtailing its attack.

22
43 Trauma epidemiology May 06
More real problem size
Prophylactic measures best!
23
46 Trauma epidemiology May 06
Thank you!
Use a helmet!