Embed Size (px)
Citation preview
Feary, D.A., Hine, A.C., Malone, M.J., et al., 2000Proceedings of the Ocean Drilling Program, Initial Reports Volume 182
7. SITE 11291
Shipboard Scientific Party2
BACKGROUND AND OBJECTIVES
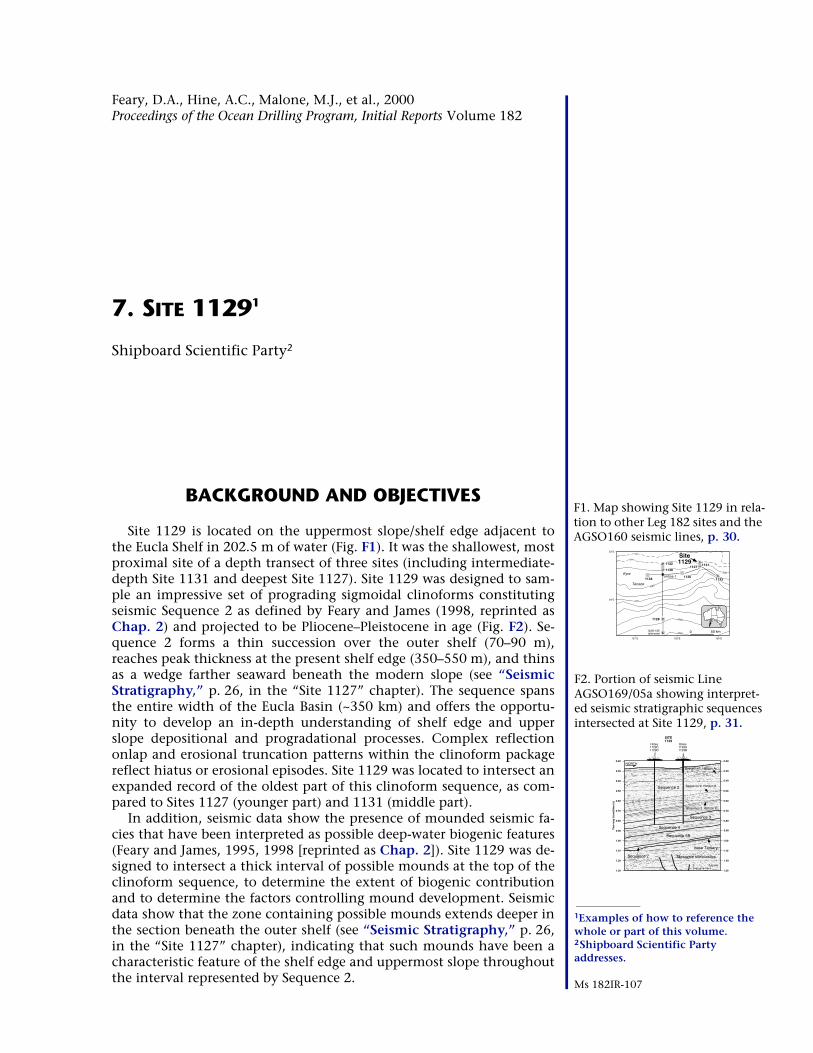
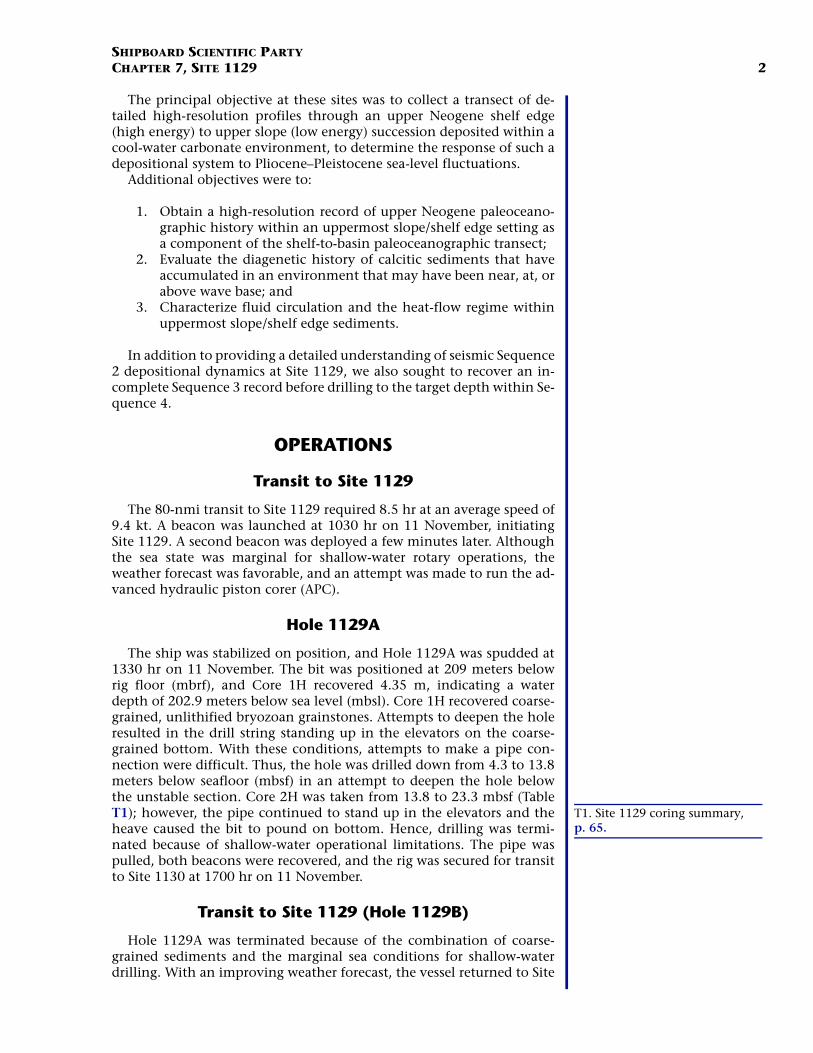
Site 1129 is located on the uppermost slope/shelf edge adjacent tothe Eucla Shelf in 202.5 m of water (Fig. F1). It was the shallowest, mostproximal site of a depth transect of three sites (including intermediate-depth Site 1131 and deepest Site 1127). Site 1129 was designed to sam-ple an impressive set of prograding sigmoidal clinoforms constitutingseismic Sequence 2 as defined by Feary and James (1998, reprinted asChap. 2) and projected to be Pliocene–Pleistocene in age (Fig. F2). Se-quence 2 forms a thin succession over the outer shelf (70–90 m),reaches peak thickness at the present shelf edge (350–550 m), and thinsas a wedge farther seaward beneath the modern slope (see “SeismicStratigraphy,” p. 26, in the “Site 1127” chapter). The sequence spansthe entire width of the Eucla Basin (~350 km) and offers the opportu-nity to develop an in-depth understanding of shelf edge and upperslope depositional and progradational processes. Complex reflectiononlap and erosional truncation patterns within the clinoform packagereflect hiatus or erosional episodes. Site 1129 was located to intersect anexpanded record of the oldest part of this clinoform sequence, as com-pared to Sites 1127 (younger part) and 1131 (middle part).
In addition, seismic data show the presence of mounded seismic fa-cies that have been interpreted as possible deep-water biogenic features(Feary and James, 1995, 1998 [reprinted as Chap. 2]). Site 1129 was de-signed to intersect a thick interval of possible mounds at the top of theclinoform sequence, to determine the extent of biogenic contributionand to determine the factors controlling mound development. Seismicdata show that the zone containing possible mounds extends deeper inthe section beneath the outer shelf (see “Seismic Stratigraphy,” p. 26,in the “Site 1127” chapter), indicating that such mounds have been acharacteristic feature of the shelf edge and uppermost slope throughoutthe interval represented by Sequence 2.
4000
3000
2000
1000
500
200
127°E 129°E128°E
34°S
33°S
EyreJerboa-1
Terrace
100
0 50 km
1132
4500GAB-13B(alternate)
1127
1126
1128
1131
1130
Site1129
11331134
F1. Map showing Site 1129 in rela-tion to other Leg 182 sites and the AGSO160 seismic lines, p. 30.
base Tertiary
Sequence 7
SITE1129
Holes1129C1129D
Holes1129A1129B
0.5 km0
NORTHSequence 2, Horizon A
Sequence 2, Horizon C
Sequence 2, Horizon B
Sequence 3
Sequence 2
Sequence 4
Sequence 6B
Mesozoic siliciclastics
Tw
o-w
ay t
rave
ltim
e (s
)
0.20
0.30
0.40
0.50
0.60
0.70
0.80
0.90
1.00
1.10
1.20
1.30
0.20
0.30
0.40
0.50
0.60
0.70
0.80
0.90
1.00
1.10
1.20
1.30
F2. Portion of seismic Line AGSO169/05a showing interpret-ed seismic stratigraphic sequences intersected at Site 1129, p. 31.
1Examples of how to reference the whole or part of this volume.2Shipboard Scientific Party addresses.
Ms 182IR-107
SHIPBOARD SCIENTIFIC PARTYCHAPTER 7, SITE 1129 2
The principal objective at these sites was to collect a transect of de-tailed high-resolution profiles through an upper Neogene shelf edge(high energy) to upper slope (low energy) succession deposited within acool-water carbonate environment, to determine the response of such adepositional system to Pliocene–Pleistocene sea-level fluctuations.
Additional objectives were to:
1. Obtain a high-resolution record of upper Neogene paleoceano-graphic history within an uppermost slope/shelf edge setting asa component of the shelf-to-basin paleoceanographic transect;
2. Evaluate the diagenetic history of calcitic sediments that haveaccumulated in an environment that may have been near, at, orabove wave base; and
3. Characterize fluid circulation and the heat-flow regime withinuppermost slope/shelf edge sediments.
In addition to providing a detailed understanding of seismic Sequence2 depositional dynamics at Site 1129, we also sought to recover an in-complete Sequence 3 record before drilling to the target depth within Se-quence 4.
OPERATIONS
Transit to Site 1129
The 80-nmi transit to Site 1129 required 8.5 hr at an average speed of9.4 kt. A beacon was launched at 1030 hr on 11 November, initiatingSite 1129. A second beacon was deployed a few minutes later. Althoughthe sea state was marginal for shallow-water rotary operations, theweather forecast was favorable, and an attempt was made to run the ad-vanced hydraulic piston corer (APC).
Hole 1129A
The ship was stabilized on position, and Hole 1129A was spudded at1330 hr on 11 November. The bit was positioned at 209 meters belowrig floor (mbrf), and Core 1H recovered 4.35 m, indicating a waterdepth of 202.9 meters below sea level (mbsl). Core 1H recovered coarse-grained, unlithified bryozoan grainstones. Attempts to deepen the holeresulted in the drill string standing up in the elevators on the coarse-grained bottom. With these conditions, attempts to make a pipe con-nection were difficult. Thus, the hole was drilled down from 4.3 to 13.8meters below seafloor (mbsf) in an attempt to deepen the hole belowthe unstable section. Core 2H was taken from 13.8 to 23.3 mbsf (TableT1); however, the pipe continued to stand up in the elevators and theheave caused the bit to pound on bottom. Hence, drilling was termi-nated because of shallow-water operational limitations. The pipe waspulled, both beacons were recovered, and the rig was secured for transitto Site 1130 at 1700 hr on 11 November.
Transit to Site 1129 (Hole 1129B)
Hole 1129A was terminated because of the combination of coarse-grained sediments and the marginal sea conditions for shallow-waterdrilling. With an improving weather forecast, the vessel returned to Site
T1. Site 1129 coring summary, p. 65.
SHIPBOARD SCIENTIFIC PARTYCHAPTER 7, SITE 1129 3
1129 to attempt another hole. The ship was moved in dynamic posi-tioning mode from Site 1131 back to Site 1129, and the 2-nmi transitrequired 0.6 hr at 3.3 kt. A beacon was dropped at 1820 hr on 19 No-vember, followed by a second beacon, and the ship was positioned ~20m east of Hole 1129A.
Hole 1129B
We thought it was possible to establish a stable hole by drilling in ap-proximately two to three joints and cleaning out the coarse-grainedmaterial with frequent mud sweeps. Hole 1129B was spudded at 2030hr on 19 November and drilled from 0 to 22.0 mbsf with two 20-bblmud sweeps circulated on each connection. However, the bit required40 kilopounds (kips) overpull to pull up on the second connection, and5 m of fill was noted immediately after running back to bottom. Theprocedure was repeated with 5 m of fill noted again. Advanced hydrau-lic piston coring deepened the hole from 22.0 to 41.0 mbsf (Table T1),recovering unlithified bryozoan grainstones and rudstones. Despitepumping three more 20-bbl mud sweeps, the hole conditions remainedunstable. Thus, Hole 1129B was abandoned, the drill string retrieved,and one beacon was recovered. The second beacon released but wasnever sighted. The rig was secured for transit back to Site 1131 at 0230hr on 20 November.
Transit to Site 1129 (Hole 1129C)
The second attempt to core at Site 1129 suggested that the unlithi-fied coarse-grained deposits at the top of the section were too unstablefor successful coring while maintaining hole integrity. A re-examina-tion of the seismic data indicated that a finer grained surficial succes-sion might exist only 0.43 nmi south of Hole 1129B at the intersectionof seismic Lines 169/05a and 169/05m. Approval was requested and re-ceived to spud Hole 1129C in these presumably finer grained sedi-ments. The 44-nmi sea voyage from Site 1132 back to Site 1129 required4.75 hr at 9.3 kt. A beacon was dropped at 2324 hr on 24 November,initiating operations.
Hole 1129C
The bit was positioned at 212.0 m, and Hole 1129C was spudded suc-cessfully at 0200 hr on 24 November. Core 1H recovered 7.29 m, indi-cating a water depth of 202.4 mbsl. Advanced hydraulic piston coringadvanced to 216.3 mbsf with 96.2% recovery. Cores 3H–23H were ori-ented and Adara tool heat-flow measurements were made on Cores 4H,8H, 10H, and 20H. The nonmagnetic APC cutting shoe was run with astandard steel flapper and 10-finger core catcher on Cores 3H, 5H, 7H,9H, 11H, and 13H. A 20-bbl mud sweep was circulated after every fifthcore. Hydrogen sulfide (H2S) gas was detected in the core barrel on therig floor on Core 6H, and H2S alert procedures were implemented. Thelast two APC cores were partial strokes, and the last three cores hadshattered liners, prompting the switch to the extended core barrel(XCB) system. Extended core barrel coring deepened the hole from216.3 to 451.6 mbsf with 48.7% recovery (Table T1). Coring had to beterminated because of deteriorating weather conditions, which causedheave to exceed shallow-water limitations. The hole was abandoned
SHIPBOARD SCIENTIFIC PARTYCHAPTER 7, SITE 1129 4
with 150 bbl of mud. The drill string was retrieved, and the rig floor wassecured for transit at 1830 hr on 26 November.
Transit to Site 1129 (Hole 1129D)
Improving weather conditions provided the opportunity to completeoperations near Hole 1129C with a rotary core barrel (RCB) hole andlogging. The 26-nmi transit from Site 1133 to Site 1129 required 2.5 hrat an average speed of 10.4 kt. A beacon was deployed at 1642 hr on 28November, and the ship was positioned on location.
Hole 1129D
A standard RCB bottom-hole assembly (BHA) was run to the seafloor,and Hole 1129D was spudded at 1915 hr on 28 November. The hole wasdrilled with a center bit from 0 to 280.0 mbsf in 7 hr. Rotary core barrelspot cores were taken from 280.0 to 299.6 mbsf with 16.1% recovery.After H2S was detected in Core 1R, H2S alert procedures were imple-mented. The hole was drilled again with a center bit from 299.6 to373.2 mbsf in 2.75 hr, and RCB coring resumed from 373.2 to 604.2mbsf (Table T1) with overall recovery of 30.6%. A wiper trip was per-formed in preparation for logging, noting 1 m of fill on bottom, andthe bit was released with the mechanical bit release. The hole was filledwith mud, and the end of pipe was positioned at 100 mbsf. The follow-ing logging tool strings were run from 604 mbsf: (1) triple combinationlogging tool (triple combo), (2) Formation MicroScanner (FMS)/sonic,and (3) well seismic tool (WST) in a 10-station check-shot survey. Thepipe was run in to 150 mbsf, and the hole was abandoned with 50 bblof mud. Both beacons were recovered, and the rig floor was secured fortransit at 2215 hr on 29 November, ending operations at Site 1129.
LITHOSTRATIGRAPHY
Introduction
Site 1129 is located at a water depth of 202.4 m at the present-dayshelf edge of the eastern Eucla Shelf and is the shallowest site drilledduring Leg 182. The site is situated at the most landward position on atransect that include Sites 1127 and 1131.
Seismic data indicate that the seafloor on the present-day shelf edgeis underlain by a thick Pleistocene succession composed of a moundedfacies in the upper part and a prograding clinoform package in thelower part (Feary and James, 1998, reprinted as Chap. 2; see “SeismicStratigraphy,” p. 26, in the “Site 1127” chapter). The near-surface,moundlike seismic feature is inferred to represent an extensive bryo-zoan mound complex.
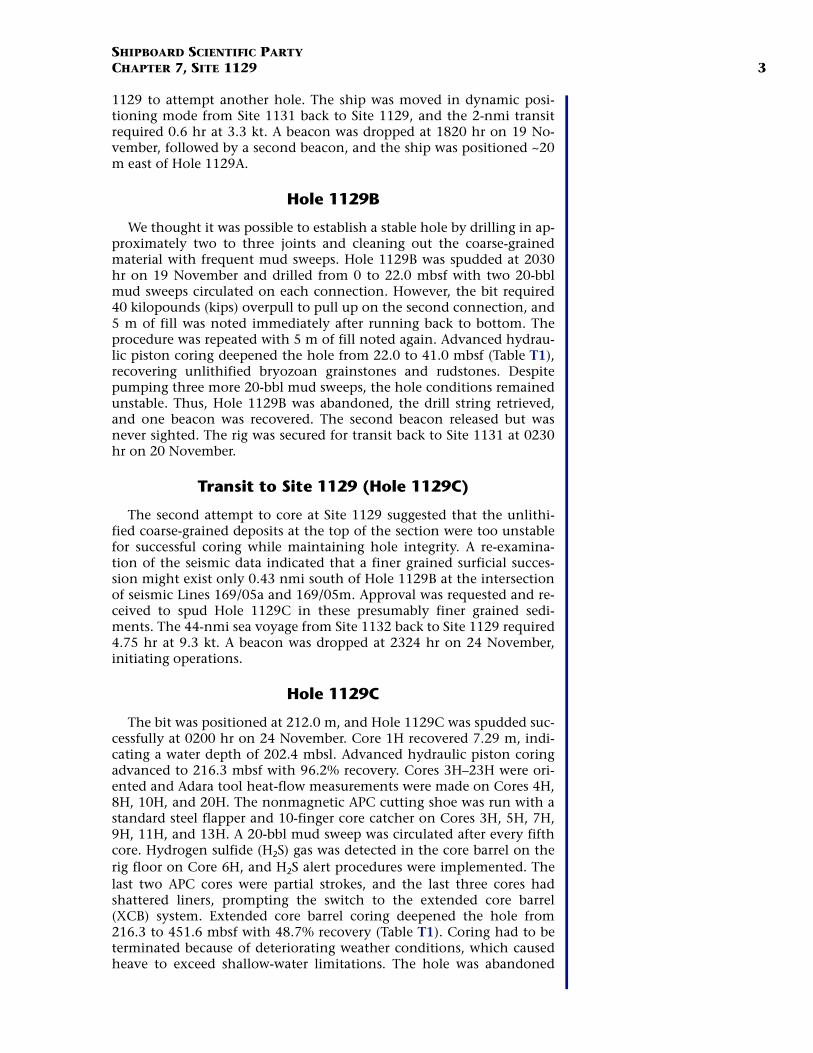
The 604.2-m-thick succession of carbonate sediments recovered atSite 1129 consists of a thick Pleistocene bryozoan floatstone-dominatedpackage, a massive upper Pliocene–Pleistocene bioclastic packstone-dominated package, and a thin middle Miocene package composed ofpackstone and grainstone with chert. The boundary between thePliocene–Pleistocene and middle Miocene strata is sharp and representsa major hiatus.
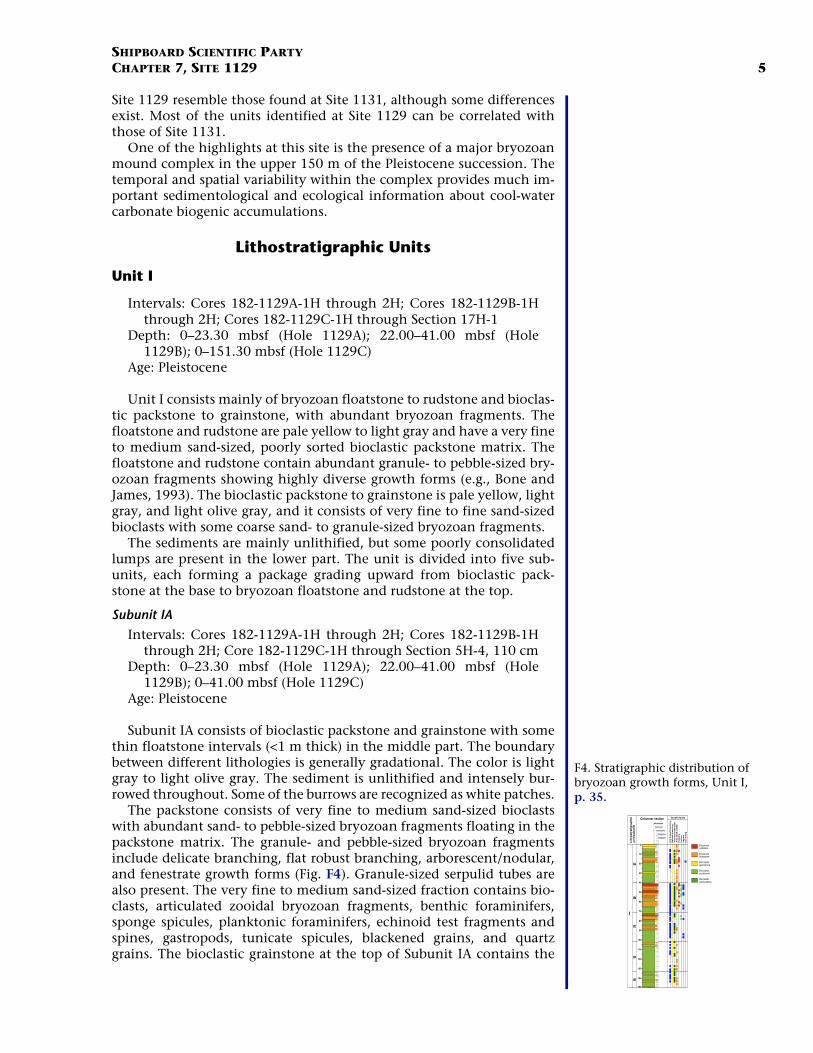
The succession is divided into three units on the basis of major sedi-ment type and compositional changes (Fig. F3). The sediments found at
Mu
dst
on
e
Pac
ksto
ne
Gra
inst
on
eF
loat
sto
ne
Ru
dst
on
e
Wac
kest
on
e
Un
lith
ifie
d
Par
tial
lyL
ith
ifie
d
Lit
hif
ied
Age
Ple
isto
cene
10
20
30
40
50
60
70
80
90
100
110
120
130
140
150
160
170
180
190
1129A
1H
2H
Dril
led
TD =23.3 mbsf
1129B
1H
2H
TD =41.0 mbsf
Dril
led
0-22
mbs
f
1H
2H
3H
4H
5H
6H
7H
8H
9H
10H
11H
12H
13H
14H
15H
16H
17H
18H
19H
20H
21H
22H
1129C
Dep
th (
mb
sf)
Co
re
Co
re
Co
re
Rec
ove
ry
Rec
ove
ry
Rec
ove
ry
Bryozoanrudstone
Bryozoanfloatstone
Bioclasticgrainstone
Bioclasticpackstone
Bioclasticwackestone
Bioclasticmudstone
Nannofossilchalk
Chert
I
IA
IB
IC
ID
IE
II
Litho. unit/subunit
F3. Summary of Site 1129 litho-stratigraphy, p. 32.
SHIPBOARD SCIENTIFIC PARTYCHAPTER 7, SITE 1129 5
Site 1129 resemble those found at Site 1131, although some differencesexist. Most of the units identified at Site 1129 can be correlated withthose of Site 1131.
One of the highlights at this site is the presence of a major bryozoanmound complex in the upper 150 m of the Pleistocene succession. Thetemporal and spatial variability within the complex provides much im-portant sedimentological and ecological information about cool-watercarbonate biogenic accumulations.
Lithostratigraphic Units
Unit I
Intervals: Cores 182-1129A-1H through 2H; Cores 182-1129B-1Hthrough 2H; Cores 182-1129C-1H through Section 17H-1
Depth: 0–23.30 mbsf (Hole 1129A); 22.00–41.00 mbsf (Hole1129B); 0–151.30 mbsf (Hole 1129C)
Age: Pleistocene
Unit I consists mainly of bryozoan floatstone to rudstone and bioclas-tic packstone to grainstone, with abundant bryozoan fragments. Thefloatstone and rudstone are pale yellow to light gray and have a very fineto medium sand-sized, poorly sorted bioclastic packstone matrix. Thefloatstone and rudstone contain abundant granule- to pebble-sized bry-ozoan fragments showing highly diverse growth forms (e.g., Bone andJames, 1993). The bioclastic packstone to grainstone is pale yellow, lightgray, and light olive gray, and it consists of very fine to fine sand-sizedbioclasts with some coarse sand- to granule-sized bryozoan fragments.
The sediments are mainly unlithified, but some poorly consolidatedlumps are present in the lower part. The unit is divided into five sub-units, each forming a package grading upward from bioclastic pack-stone at the base to bryozoan floatstone and rudstone at the top.
Subunit IA
Intervals: Cores 182-1129A-1H through 2H; Cores 182-1129B-1Hthrough 2H; Core 182-1129C-1H through Section 5H-4, 110 cm
Depth: 0–23.30 mbsf (Hole 1129A); 22.00–41.00 mbsf (Hole1129B); 0–41.00 mbsf (Hole 1129C)
Age: Pleistocene
Subunit IA consists of bioclastic packstone and grainstone with somethin floatstone intervals (<1 m thick) in the middle part. The boundarybetween different lithologies is generally gradational. The color is lightgray to light olive gray. The sediment is unlithified and intensely bur-rowed throughout. Some of the burrows are recognized as white patches.
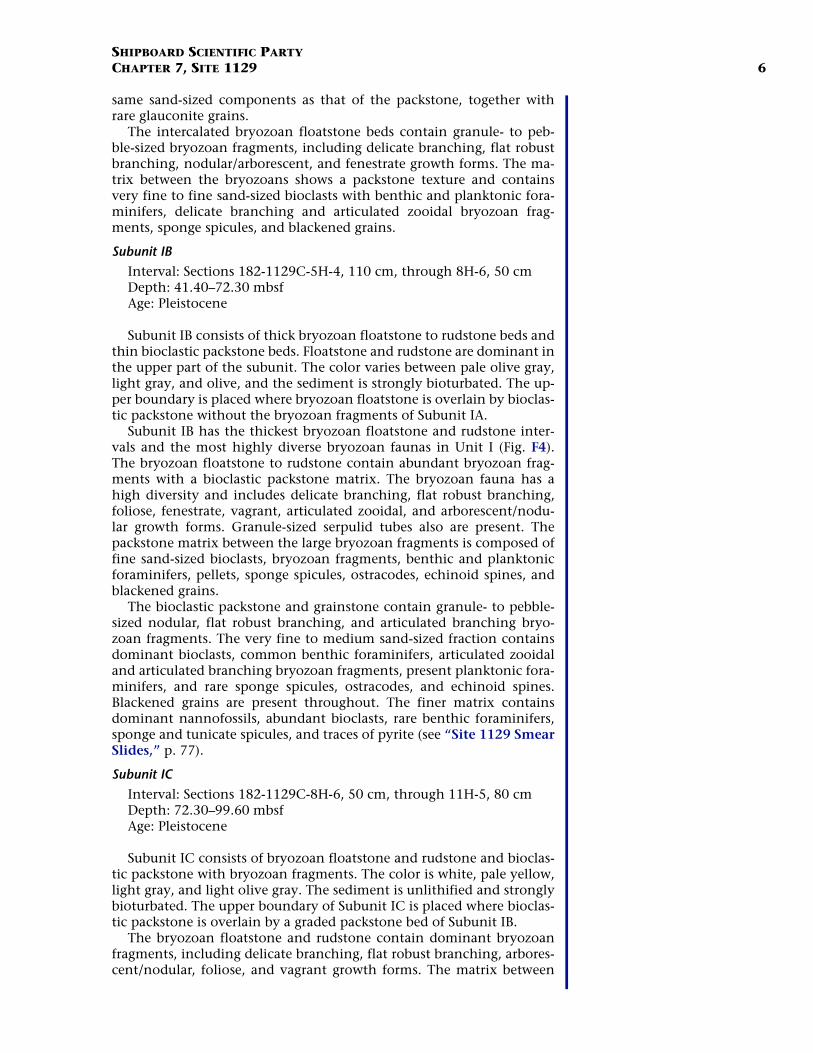
The packstone consists of very fine to medium sand-sized bioclastswith abundant sand- to pebble-sized bryozoan fragments floating in thepackstone matrix. The granule- and pebble-sized bryozoan fragmentsinclude delicate branching, flat robust branching, arborescent/nodular,and fenestrate growth forms (Fig. F4). Granule-sized serpulid tubes arealso present. The very fine to medium sand-sized fraction contains bio-clasts, articulated zooidal bryozoan fragments, benthic foraminifers,sponge spicules, planktonic foraminifers, echinoid test fragments andspines, gastropods, tunicate spicules, blackened grains, and quartzgrains. The bioclastic grainstone at the top of Subunit IA contains the
Fe
ne
str
aF
oli
os
e
Fla
t R
ob
ust
bra
nch
ing
De
lic
ate
bra
nc
hin
g
Art
icu
late
d z
oo
ida
l
Va
gra
nt
En
cru
sti
ng
Arb
ore
sc
en
t/N
od
ula
r
150
140
130
120
110
100
90
80
70
60
50
40
30
20
10
0
I
ID
IC
IA
IE
IB
Growth forms
Lit
ho
str
ati
gra
ph
icu
nit
/su
bu
nit Packstone
Grainstone
Floatstone
Rudstone
Columnar sectionWackestone
Bryozoanrudstone
Bryozoanfloatstone
Bioclasticgrainstone
Bioclasticpackstone
Bioclasticwackestone
F4. Stratigraphic distribution of bryozoan growth forms, Unit I, p. 35.
SHIPBOARD SCIENTIFIC PARTYCHAPTER 7, SITE 1129 6
same sand-sized components as that of the packstone, together withrare glauconite grains.
The intercalated bryozoan floatstone beds contain granule- to peb-ble-sized bryozoan fragments, including delicate branching, flat robustbranching, nodular/arborescent, and fenestrate growth forms. The ma-trix between the bryozoans shows a packstone texture and containsvery fine to fine sand-sized bioclasts with benthic and planktonic fora-minifers, delicate branching and articulated zooidal bryozoan frag-ments, sponge spicules, and blackened grains.
Subunit IB
Interval: Sections 182-1129C-5H-4, 110 cm, through 8H-6, 50 cmDepth: 41.40–72.30 mbsfAge: Pleistocene
Subunit IB consists of thick bryozoan floatstone to rudstone beds andthin bioclastic packstone beds. Floatstone and rudstone are dominant inthe upper part of the subunit. The color varies between pale olive gray,light gray, and olive, and the sediment is strongly bioturbated. The up-per boundary is placed where bryozoan floatstone is overlain by bioclas-tic packstone without the bryozoan fragments of Subunit IA.
Subunit IB has the thickest bryozoan floatstone and rudstone inter-vals and the most highly diverse bryozoan faunas in Unit I (Fig. F4).The bryozoan floatstone to rudstone contain abundant bryozoan frag-ments with a bioclastic packstone matrix. The bryozoan fauna has ahigh diversity and includes delicate branching, flat robust branching,foliose, fenestrate, vagrant, articulated zooidal, and arborescent/nodu-lar growth forms. Granule-sized serpulid tubes also are present. Thepackstone matrix between the large bryozoan fragments is composed offine sand-sized bioclasts, bryozoan fragments, benthic and planktonicforaminifers, pellets, sponge spicules, ostracodes, echinoid spines, andblackened grains.
The bioclastic packstone and grainstone contain granule- to pebble-sized nodular, flat robust branching, and articulated branching bryo-zoan fragments. The very fine to medium sand-sized fraction containsdominant bioclasts, common benthic foraminifers, articulated zooidaland articulated branching bryozoan fragments, present planktonic fora-minifers, and rare sponge spicules, ostracodes, and echinoid spines.Blackened grains are present throughout. The finer matrix containsdominant nannofossils, abundant bioclasts, rare benthic foraminifers,sponge and tunicate spicules, and traces of pyrite (see “Site 1129 SmearSlides,” p. 77).
Subunit IC
Interval: Sections 182-1129C-8H-6, 50 cm, through 11H-5, 80 cmDepth: 72.30–99.60 mbsfAge: Pleistocene
Subunit IC consists of bryozoan floatstone and rudstone and bioclas-tic packstone with bryozoan fragments. The color is white, pale yellow,light gray, and light olive gray. The sediment is unlithified and stronglybioturbated. The upper boundary of Subunit IC is placed where bioclas-tic packstone is overlain by a graded packstone bed of Subunit IB.
The bryozoan floatstone and rudstone contain dominant bryozoanfragments, including delicate branching, flat robust branching, arbores-cent/nodular, foliose, and vagrant growth forms. The matrix between
SHIPBOARD SCIENTIFIC PARTYCHAPTER 7, SITE 1129 7
the large bryozoans consists of bioclastic packstone. The medium tocoarse sand-sized fraction contains pellets, benthic foraminifers, andserpulid tubes. The very fine to fine sand-sized fraction contains bio-clasts with common benthic foraminifers, present planktonic foramini-fers and sponge spicules, rare echinoid spines, and traces of ostracodesand blackened grains.
The bioclastic packstone consists of very fine to fine sand-sized bio-clasts, with common benthic foraminifers, and present tunicate andsponge spicules, bryozoan fragments, ostracodes, pteropods, and black-ened grains. Coarse sand- to granule-sized bryozoan and bivalve frag-ments are also present. The dominant forms of bryozoans are flat robustbranching, articulated branching, foliose, and vagrant. Within thepackstone, two subfacies are distinguished: one characterized by asmuch as 10% blackened grains and another characterized by abundantbryozoan fragments. The bioclastic packstone with blackened grains isdominant in the lower part.
Subunit ID
Interval: Sections 182-1129C-11H-5, 80 cm, through 15H-2, 65 cmDepth: 99.60–132.95 mbsfAge: Pleistocene
Subunit ID consists mainly of bioclastic packstone with two bryozoanfloatstone beds in the upper part. The color is pale yellow, light gray, andgray. The sediments are mainly unlithified, but partially lithified lumpsare present in some intervals (i.e., Section 14H-2). The sediment isstrongly bioturbated. The upper boundary is placed where bioclasticpackstone with abundant delicate branching bryozoan fragments isoverlain by bioclastic packstone with rare bryozoans of Subunit IC.
The two bryozoan floatstone beds at the top of Subunit ID containdominant granule-sized, blackened, delicate branching bryozoan frag-ments and minor amounts of flat robust branching bryozoans. The ma-trix consists of fine sand-sized bioclastic wackestone to packstonecomposed of benthic foraminifers, bioclasts, planktonic foraminifers,sponge spicules, and echinoid spines.
The packstone is dominated by bioclasts with various amounts ofsand- to granule-sized bryozoan fragments. The bryozoan fauna is dom-inated by delicate and robust flat branching, arborescent/nodular, andarticulated zooidal growth forms. In addition to the bioclasts, the veryfine to fine sand-sized fraction includes common benthic foraminifers,serpulid tubes, present planktonic foraminifers, rare ostracodes, echi-noid spines, and some blackened grains. Some bioclastic grains have acoating of calcite cement.
Subunit IE
Interval: Section 182-1129C-15H-2, 65 cm, through Section 17H-1Depth: 132.95–151.30 mbsfAge: Pleistocene
Subunit IE consists of bioclastic packstone with five bryozoan float-stone beds, each less than 80 cm thick. The color is pale yellow to lightgray. The sediment is mainly unlithified, but some partially lithifiedlumps are scattered throughout, and the sediment is intensely bioturbat-ed. The upper boundary is placed where bryozoan floatstone with abun-dant arborescent bryozoan fragments is overlain by the fine sand-sized,well-sorted bioclastic packstone of Subunit ID.
SHIPBOARD SCIENTIFIC PARTYCHAPTER 7, SITE 1129 8
The bioclastic packstone is poorly sorted and contains dominantvery fine to fine sand-sized bioclasts with scattered granule-sized bryo-zoan fragments. The bryozoans are usually abraded, and arborescent,delicate branching, and flat robust branching growth forms are repre-sented. In addition to bioclasts, major components include benthic andplanktonic foraminifers, articulated zooidal and delicate branching bry-ozoan fragments, sponge spicules, echinoid debris, ostracodes, brownorganic filaments, quartz grains, and blackened grains. The bioclastscommonly have a coating of calcite cement. The texture and composi-tion is relatively uniform throughout. The bryozoan floatstone beds aredominated by granule and larger sized particles of arborescent, robustbranching and delicate branching bryozoan growth forms.
Unit II
Intervals: Section 182-1129C-17H-1 through Core 48X; Core 182-1129D-1R through Section 22R-1, 60 cm
Depth: 151.30–451.60 mbsf (Hole 1129C); 280.00–556.70 mbsf(Hole 1129D)
Age: Pliocene–Pleistocene
Unit II consists of thick light gray, light olive-gray, and gray biotur-bated bioclastic packstone and minor grainstone and wackestone beds,with four nannofossil chalk intervals. The sediments are unlithified inthe upper part of Unit II in interval 182-1129C-17H through 25X,whereas the sediments are partially lithified and well lithified in themiddle and lower part of the unit. The sediments are slightly neomor-phosed and dolomitized in the lower part of Unit II, with dolomitegrains constituting ~10% (see “Inorganic Geochemistry,” p. 20). Bodyfossils commonly occur as molds. Some shells, molds, and vugs are filledwith celestite. A remarkable diagenetic feature of Unit II is the presenceof 3- and 6-cm oval concretions of pale yellow to yellow native sulfur inCores 182-1129C-20H through 22H.
The sediment is bioturbated throughout and is uniform in appear-ance in the upper part of the unit; however, burrows are observed as dif-fuse green mottles in the middle to lower part. The lower part especiallyis dominated by abundant, well-defined burrows, including Palaeophy-cus heberti, Planolites, Chondrites, and Zoophycos. These burrows are filledwith a variety of material, including planktonic foraminifers and uni-dentified green material, and commonly have a dark wall lining.
Bioclastic packstone, the dominant lithology of Unit II, is very fineto fine grained, generally well sorted, and uniform due to bioturbation.The packstone consists mainly of skeletal components with rare coarsesand- to granule-sized bryozoan fragments, represented by delicatebranching and flat robust branching growth forms. The size, abun-dance, and diversity of bryozoan fragments are much lower than inUnit I. The other millimeter-sized fraction contains well-preservedbenthic foraminifers and shell fragments. The very fine to fine sand-sized fraction contains abundant bioclasts with common benthic andplanktonic foraminifers, articulated zooidal bryozoan fragments, andrare ostracodes, sponge spicules, and echinoid spines. Blackened grainsare present throughout. Most of the skeletal components have calciteovergrowths.
Some grainstone beds are present in the upper and middle part ofUnit II. The bioclastic grainstone beds are well sorted and have the
SHIPBOARD SCIENTIFIC PARTYCHAPTER 7, SITE 1129 9
same composition as the packstone, with very fine to medium sand-sized grains.
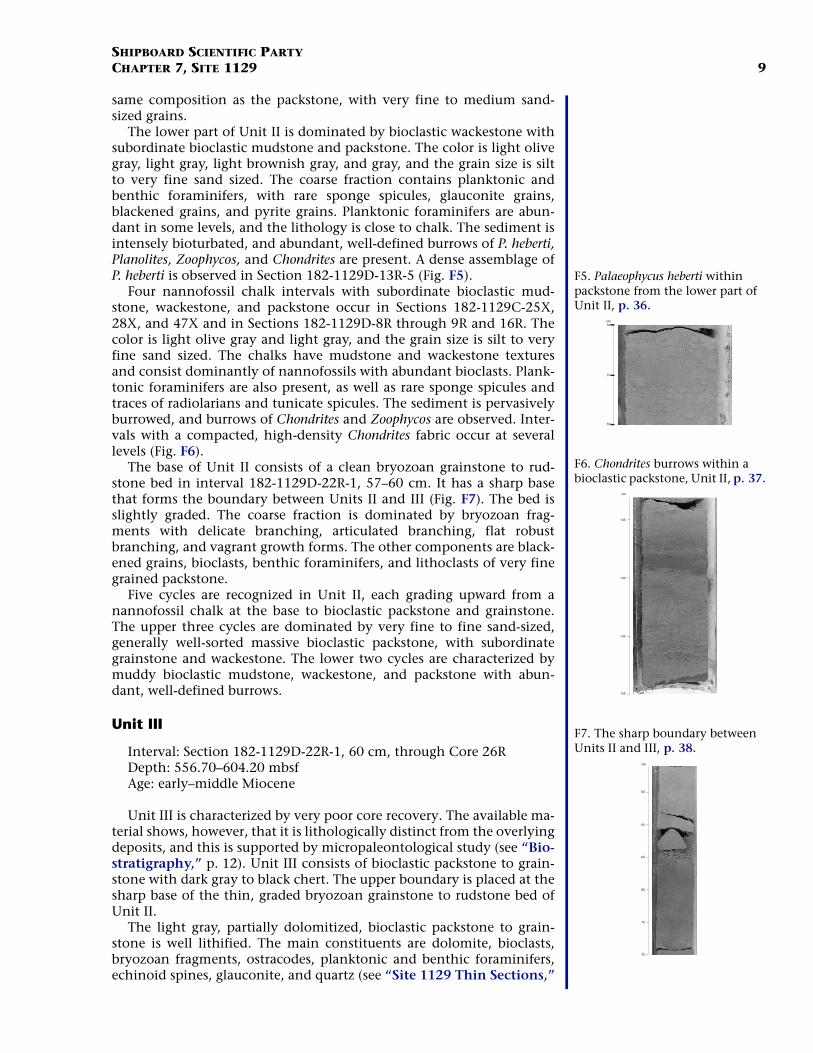
The lower part of Unit II is dominated by bioclastic wackestone withsubordinate bioclastic mudstone and packstone. The color is light olivegray, light gray, light brownish gray, and gray, and the grain size is siltto very fine sand sized. The coarse fraction contains planktonic andbenthic foraminifers, with rare sponge spicules, glauconite grains,blackened grains, and pyrite grains. Planktonic foraminifers are abun-dant in some levels, and the lithology is close to chalk. The sediment isintensely bioturbated, and abundant, well-defined burrows of P. heberti,Planolites, Zoophycos, and Chondrites are present. A dense assemblage ofP. heberti is observed in Section 182-1129D-13R-5 (Fig. F5).
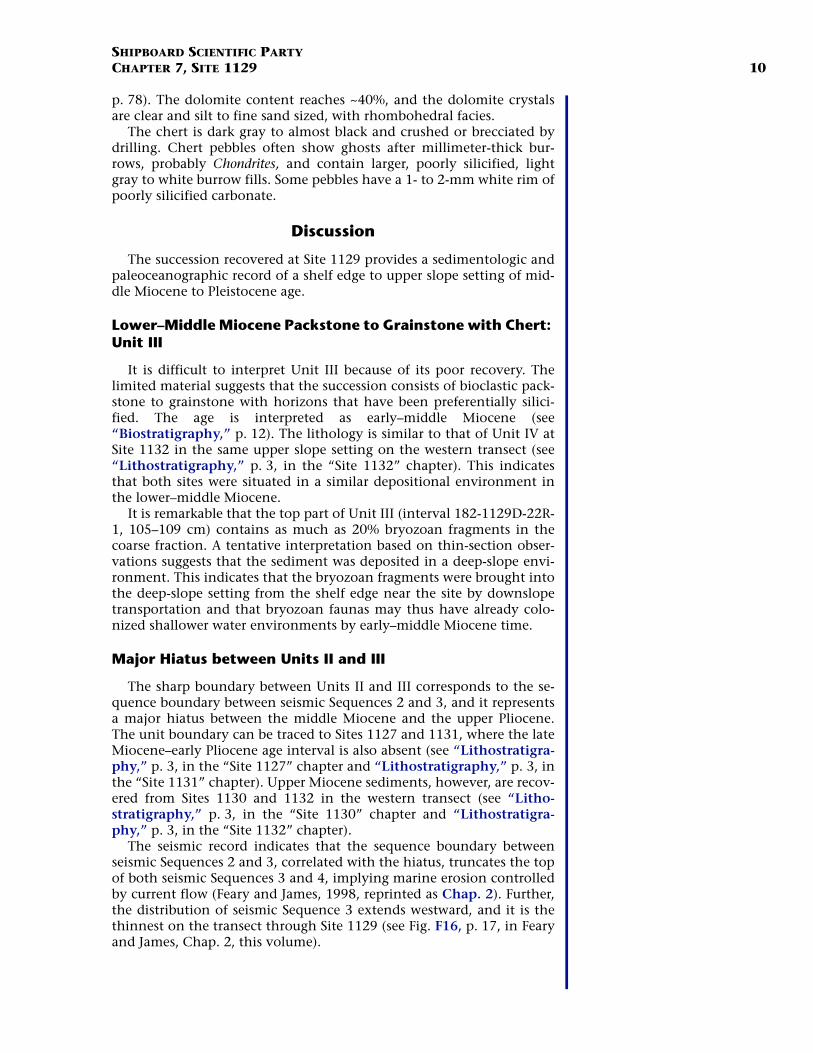
Four nannofossil chalk intervals with subordinate bioclastic mud-stone, wackestone, and packstone occur in Sections 182-1129C-25X,28X, and 47X and in Sections 182-1129D-8R through 9R and 16R. Thecolor is light olive gray and light gray, and the grain size is silt to veryfine sand sized. The chalks have mudstone and wackestone texturesand consist dominantly of nannofossils with abundant bioclasts. Plank-tonic foraminifers are also present, as well as rare sponge spicules andtraces of radiolarians and tunicate spicules. The sediment is pervasivelyburrowed, and burrows of Chondrites and Zoophycos are observed. Inter-vals with a compacted, high-density Chondrites fabric occur at severallevels (Fig. F6).
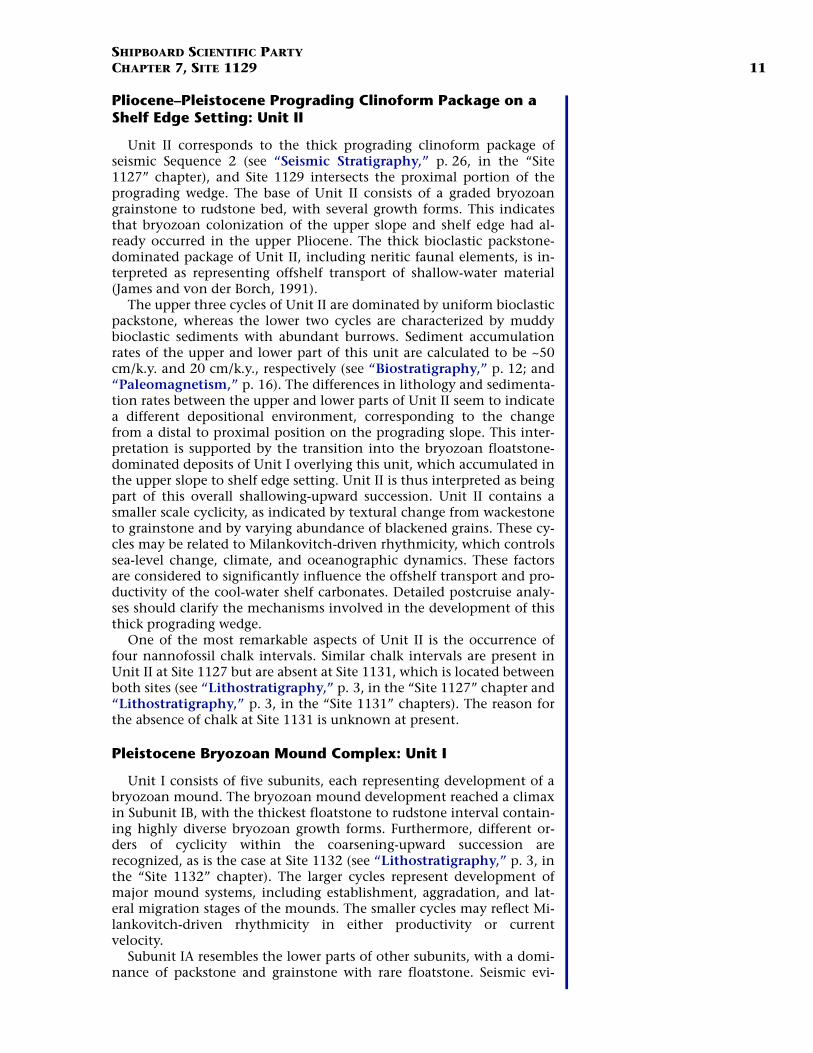
The base of Unit II consists of a clean bryozoan grainstone to rud-stone bed in interval 182-1129D-22R-1, 57–60 cm. It has a sharp basethat forms the boundary between Units II and III (Fig. F7). The bed isslightly graded. The coarse fraction is dominated by bryozoan frag-ments with delicate branching, articulated branching, flat robustbranching, and vagrant growth forms. The other components are black-ened grains, bioclasts, benthic foraminifers, and lithoclasts of very finegrained packstone.
Five cycles are recognized in Unit II, each grading upward from anannofossil chalk at the base to bioclastic packstone and grainstone.The upper three cycles are dominated by very fine to fine sand-sized,generally well-sorted massive bioclastic packstone, with subordinategrainstone and wackestone. The lower two cycles are characterized bymuddy bioclastic mudstone, wackestone, and packstone with abun-dant, well-defined burrows.
Unit III
Interval: Section 182-1129D-22R-1, 60 cm, through Core 26RDepth: 556.70–604.20 mbsfAge: early–middle Miocene
Unit III is characterized by very poor core recovery. The available ma-terial shows, however, that it is lithologically distinct from the overlyingdeposits, and this is supported by micropaleontological study (see “Bio-stratigraphy,” p. 12). Unit III consists of bioclastic packstone to grain-stone with dark gray to black chert. The upper boundary is placed at thesharp base of the thin, graded bryozoan grainstone to rudstone bed ofUnit II.
The light gray, partially dolomitized, bioclastic packstone to grain-stone is well lithified. The main constituents are dolomite, bioclasts,bryozoan fragments, ostracodes, planktonic and benthic foraminifers,echinoid spines, glauconite, and quartz (see “Site 1129 Thin Sections,”
cm54
60
57
F5. Palaeophycus heberti within packstone from the lower part of Unit II, p. 36.
cm
135
140
145
150
F6. Chondrites burrows within a bioclastic packstone, Unit II, p. 37.
cm
50
55
60
65
70
75
F7. The sharp boundary between Units II and III, p. 38.
SHIPBOARD SCIENTIFIC PARTYCHAPTER 7, SITE 1129 10
p. 78). The dolomite content reaches ~40%, and the dolomite crystalsare clear and silt to fine sand sized, with rhombohedral facies.
The chert is dark gray to almost black and crushed or brecciated bydrilling. Chert pebbles often show ghosts after millimeter-thick bur-rows, probably Chondrites, and contain larger, poorly silicified, lightgray to white burrow fills. Some pebbles have a 1- to 2-mm white rim ofpoorly silicified carbonate.
Discussion
The succession recovered at Site 1129 provides a sedimentologic andpaleoceanographic record of a shelf edge to upper slope setting of mid-dle Miocene to Pleistocene age.
Lower–Middle Miocene Packstone to Grainstone with Chert: Unit III
It is difficult to interpret Unit III because of its poor recovery. Thelimited material suggests that the succession consists of bioclastic pack-stone to grainstone with horizons that have been preferentially silici-fied. The age is interpreted as early–middle Miocene (see“Biostratigraphy,” p. 12). The lithology is similar to that of Unit IV atSite 1132 in the same upper slope setting on the western transect (see“Lithostratigraphy,” p. 3, in the “Site 1132” chapter). This indicatesthat both sites were situated in a similar depositional environment inthe lower–middle Miocene.
It is remarkable that the top part of Unit III (interval 182-1129D-22R-1, 105–109 cm) contains as much as 20% bryozoan fragments in thecoarse fraction. A tentative interpretation based on thin-section obser-vations suggests that the sediment was deposited in a deep-slope envi-ronment. This indicates that the bryozoan fragments were brought intothe deep-slope setting from the shelf edge near the site by downslopetransportation and that bryozoan faunas may thus have already colo-nized shallower water environments by early–middle Miocene time.
Major Hiatus between Units II and III
The sharp boundary between Units II and III corresponds to the se-quence boundary between seismic Sequences 2 and 3, and it representsa major hiatus between the middle Miocene and the upper Pliocene.The unit boundary can be traced to Sites 1127 and 1131, where the lateMiocene–early Pliocene age interval is also absent (see “Lithostratigra-phy,” p. 3, in the “Site 1127” chapter and “Lithostratigraphy,” p. 3, inthe “Site 1131” chapter). Upper Miocene sediments, however, are recov-ered from Sites 1130 and 1132 in the western transect (see “Litho-stratigraphy,” p. 3, in the “Site 1130” chapter and “Lithostratigra-phy,” p. 3, in the “Site 1132” chapter).
The seismic record indicates that the sequence boundary betweenseismic Sequences 2 and 3, correlated with the hiatus, truncates the topof both seismic Sequences 3 and 4, implying marine erosion controlledby current flow (Feary and James, 1998, reprinted as Chap. 2). Further,the distribution of seismic Sequence 3 extends westward, and it is thethinnest on the transect through Site 1129 (see Fig. F16, p. 17, in Fearyand James, Chap. 2, this volume).
SHIPBOARD SCIENTIFIC PARTYCHAPTER 7, SITE 1129 11
Pliocene–Pleistocene Prograding Clinoform Package on a Shelf Edge Setting: Unit II
Unit II corresponds to the thick prograding clinoform package ofseismic Sequence 2 (see “Seismic Stratigraphy,” p. 26, in the “Site1127” chapter), and Site 1129 intersects the proximal portion of theprograding wedge. The base of Unit II consists of a graded bryozoangrainstone to rudstone bed, with several growth forms. This indicatesthat bryozoan colonization of the upper slope and shelf edge had al-ready occurred in the upper Pliocene. The thick bioclastic packstone-dominated package of Unit II, including neritic faunal elements, is in-terpreted as representing offshelf transport of shallow-water material(James and von der Borch, 1991).
The upper three cycles of Unit II are dominated by uniform bioclasticpackstone, whereas the lower two cycles are characterized by muddybioclastic sediments with abundant burrows. Sediment accumulationrates of the upper and lower part of this unit are calculated to be ~50cm/k.y. and 20 cm/k.y., respectively (see “Biostratigraphy,” p. 12; and“Paleomagnetism,” p. 16). The differences in lithology and sedimenta-tion rates between the upper and lower parts of Unit II seem to indicatea different depositional environment, corresponding to the changefrom a distal to proximal position on the prograding slope. This inter-pretation is supported by the transition into the bryozoan floatstone-dominated deposits of Unit I overlying this unit, which accumulated inthe upper slope to shelf edge setting. Unit II is thus interpreted as beingpart of this overall shallowing-upward succession. Unit II contains asmaller scale cyclicity, as indicated by textural change from wackestoneto grainstone and by varying abundance of blackened grains. These cy-cles may be related to Milankovitch-driven rhythmicity, which controlssea-level change, climate, and oceanographic dynamics. These factorsare considered to significantly influence the offshelf transport and pro-ductivity of the cool-water shelf carbonates. Detailed postcruise analy-ses should clarify the mechanisms involved in the development of thisthick prograding wedge.
One of the most remarkable aspects of Unit II is the occurrence offour nannofossil chalk intervals. Similar chalk intervals are present inUnit II at Site 1127 but are absent at Site 1131, which is located betweenboth sites (see “Lithostratigraphy,” p. 3, in the “Site 1127” chapter and“Lithostratigraphy,” p. 3, in the “Site 1131” chapters). The reason forthe absence of chalk at Site 1131 is unknown at present.
Pleistocene Bryozoan Mound Complex: Unit I
Unit I consists of five subunits, each representing development of abryozoan mound. The bryozoan mound development reached a climaxin Subunit IB, with the thickest floatstone to rudstone interval contain-ing highly diverse bryozoan growth forms. Furthermore, different or-ders of cyclicity within the coarsening-upward succession arerecognized, as is the case at Site 1132 (see “Lithostratigraphy,” p. 3, inthe “Site 1132” chapter). The larger cycles represent development ofmajor mound systems, including establishment, aggradation, and lat-eral migration stages of the mounds. The smaller cycles may reflect Mi-lankovitch-driven rhythmicity in either productivity or currentvelocity.
Subunit IA resembles the lower parts of other subunits, with a domi-nance of packstone and grainstone with rare floatstone. Seismic evi-
SHIPBOARD SCIENTIFIC PARTYCHAPTER 7, SITE 1129 12
dence shows that the mound complexes are overlapping and laterallymigrating with time. This subunit probably represents an intermittentstage or initial stage in mound development.
The main subunit boundaries within the bryozoan mound complexappear to correlate with seismic reflectors seen in dip sections across theshelf-slope break. Therefore, a synthesis of internal structure of themound succession and geometric distribution of seismic reflectors willgive important information on the dynamic architecture and temporalevolution of the bryozoan mound complex as a whole.
BIOSTRATIGRAPHY
Introduction
Site 1129, the shallowest (202.4 m water depth) site of an upperslope/shelf edge transect that includes Site 1131 (333.6 m water depth)and Site 1127 (479.3 m water depth), is situated at the present-day shelfedge. This site includes two biostratigraphic units: (1) an expandedQuaternary section more than 540 m thick that is underlain by a thin(16 m thick) and conformable Pliocene section (see “Paleomag-netism,” p. 16); and (2) a middle–lower Miocene section (Fig. F8).These units are separated at 556 mbsf by an unconformity of ~12 m.y.The unconformity is marked by a bryozoan turbidite overlying indu-rated sediments and chert layers (see “Lithostratigraphy,” p. 4). Cal-careous nannofossils are generally abundant and moderately wellpreserved in the upper parts of the succession and poorly preserved be-low 371 mbsf. Preservation and abundance of planktonic foraminifersbecome increasingly degraded in the upper part of the section. Below~68 mbsf, most characteristic features of foraminifers are obscured bycarbonate cement and recrystallization.
Benthic foraminifers are generally abundant and well preserved inthe upper part of Hole 1129C, and both preservation and abundancedeteriorate markedly at ~140 mbsf. Three main assemblages are recog-nized at Site 1129: a distinctive well-preserved Pleistocene assemblagefound in bryozoan-rich accumulations (down to ~140 mbsf); a Pleis-tocene–Pliocene assemblage (140 mbsf–565 mbsf), which includes avariable redeposited neritic component; and a sparse Miocene assem-blage in Core 182-1129D-24R. The two Pleistocene assemblages indicateupper bathyal paleodepths, whereas the Miocene assemblage indicatesan upper to middle bathyal paleodepth.
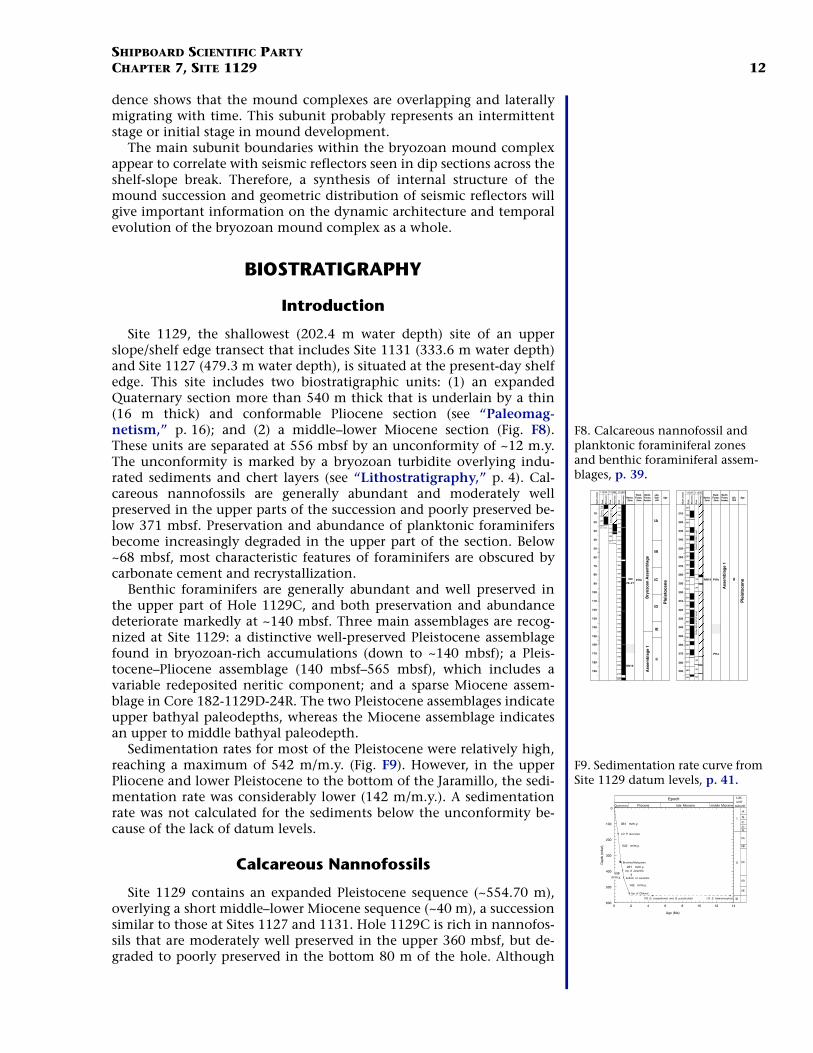
Sedimentation rates for most of the Pleistocene were relatively high,reaching a maximum of 542 m/m.y. (Fig. F9). However, in the upperPliocene and lower Pleistocene to the bottom of the Jaramillo, the sedi-mentation rate was considerably lower (142 m/m.y.). A sedimentationrate was not calculated for the sediments below the unconformity be-cause of the lack of datum levels.
Calcareous Nannofossils
Site 1129 contains an expanded Pleistocene sequence (~554.70 m),overlying a short middle–lower Miocene sequence (~40 m), a successionsimilar to those at Sites 1127 and 1131. Hole 1129C is rich in nannofos-sils that are moderately well preserved in the upper 360 mbsf, but de-graded to poorly preserved in the bottom 80 m of the hole. Although
F8. Calcareous nannofossil and planktonic foraminiferal zones and benthic foraminiferal assem-blages, p. 39.
Dep
th (
mb
sf)
NN20–21
Pt1b
NN19
10
20
30
40
50
60
70
80
90
100
110
120
130
140
150
160
170
180
190
1129A
1H
2H
TD =23.3 mbsf
1129B
1H
2H
TD =41.0 mbsf
1H
2H
3H
4H
5H
6H
7H
8H
9H
10H
11H
12H
13H
14H
15H
16H
17H
18H
19H
20H
21H
22H
1129C
IA
IC
ID
IE
IB
II
Co
re
Rec
ove
ry
Co
re
Rec
ove
ry
Co
re
Rec
ove
ry
Dril
led
Dril
led
0-22
mbs
f
Ass
emb
lag
e 1
Bry
ozo
an A
ssem
bla
ge
Ple
isto
cen
e
Nanno.Zone
Plank.Foram.Zone
Benth.Foram.Assem.
Lith.Unit
Age
Dep
th (
mb
sf)
NN19 Pt1b
210
220
230
240
250
260
270
280
290
300
310
320
330
340
350
360
370
380
390
22H
1129C
23H
24X
25X
26X
27X
28X
29X
30X
31X
32X
33X
34X
35X
36X
37X
38X
39X
40X
41X
42X
43X
1129D
1R
2R
Dril
led
299.
6-37
3.2
mbs
f
3R
4R
5R
Pt1a
II
Co
re
Rec
ove
ry
Co
re
Rec
ove
ry
Ass
emb
lag
e 1
Ple
isto
cen
e
Dril
led
0.0-
280.
0 m
bsf
Nanno.Zone
Plank.Foram.Zone
Benth.Foram.Assem.
Lith.Sub-unit
Age
0
100
200
300
500
6000 2 4 6 8 10 12 14
Dep
th (
mbs
f)
Age (Ma)
Lith. unit/
subunit
LO P. lacunosa
Brunhes/Matuyama
364 m/m.y.
542 m/m.y.
FO G. crassaformis and G. puncticulata LO S. heteromorphus
Quaternary Pliocene late Miocene middle Miocene
top of Jaramillo
bottom of Jaramillo
top of Olduvai
261 m/m.y.
538m/m.y.
142 m/m.y.
I
II
IA
IB
IC
IDIE
IIA
IIB
IIC
IID
IIE
III
Epoch
400
F9. Sedimentation rate curve from Site 1129 datum levels, p. 41.
SHIPBOARD SCIENTIFIC PARTYCHAPTER 7, SITE 1129 13
sediments from Hole 1129D are also rich in nannofossils, they are gen-erally poorly preserved.
The upper 160 mbsf at Site 1129 is characterized by common toabundant Gephyrocapsa caribbeanica, common small Gephyrocapsa spp.,and common occurrences of Calcidiscus leptoporus. The lack of Pseudoe-miliania lacunosa indicates that this section should be assigned to thecombined Zones NN21–NN20. Also present in this section are Cocco-lithus pelagicus, Dictyococcites antarcticus, Dictyococcites productus, Heli-cosphaera carteri, Oolithotus fragilis, Rhabdosphaera clavigera, andUmbilicosphaera sibogae.
Sample 182-1129C-18H-CC, 8–11 cm (168.85 mbsf), contains thehighest stratigraphic occurrence of P. lacunosa, indicating that sedi-ments below this horizon in Hole 1129C (to 444.88 mbsf) and fromSamples 182-1129D-1R-CC, 6–9 cm (282.33 mbsf), to 21R-CC, 31–34cm (554.70 mbsf), belong to Zone NN19. Proceeding downhole, abun-dances of small Gephyrocapsa spp. increase, G. caribbeanica decrease, andC. leptoporus varies from rare to common. The highest stratigraphic oc-currence of Calcidiscus macintyrei is found in Sample 182-1129C-37X-CC, 24–27 cm (347.47 mbsf). This occurrence may be caused by rework-ing because it does not occur again until Sample 182-1129C-45X-CC,20–23 cm (414.00 mbsf).
Samples 182-1129D-22R-CC, 16–19 cm (557.68 mbsf), to 26R-CC,30–33 cm (594.90 mbsf), contain Sphenolithus heteromorphus, togetherwith Cyclicargolithus floridanus, Sphenolithus moriformis, and Braaru-dosphaera bigelowii. This association indicates a zonal assignment to thecombined Zones NN5–NN4. This section lies directly below a bryozoanturbidite marking an unconformity that spans 12 m.y. (see “Litho-stratigraphy,” p. 4).
Planktonic Foraminifers
The section at Site 1129 is comprised of two biostratigraphic units:(1) a Pleistocene interval that exceeds 540 m in thickness, underlainconformably by an ~17-m-thick upper Pliocene unit; and (2) a middleMiocene unit. The biostratigraphic units are separated by an unconfor-mity that coincides with the boundary between lithostratigraphic UnitsII and III at 556.7 mbsf (see “Lithostratigraphy,” p. 4), and appears tocorrespond to the base of seismic Sequence 2 (see “Seismic Stratigra-phy,” p. 26, in the “Site 1127” chapter). The succession of biostrati-graphic units is similar to those at Sites 1127 and 1131.
Preservation and Abundance
Planktonic foraminifers are comparatively rare, although beautifullypreserved, among abundant bryozoans, gastropods, ostracodes, andbenthic foraminifers in the sand-sized fraction above 36.28 mbsf. How-ever, preservation and abundance decline rapidly, from moderate below36.28 mbsf to poor below ~68 mbsf, and carbonate cement and recrys-tallized overgrowths obscure test features throughout the remainder ofthe section. Some intervals are so degraded that they contain no recog-nizable taxa. In general, the inferior condition of the tests makes us un-certain whether we accurately recognized the first and last occurrencesof species used to mark zonal boundaries. This is borne out by magneto-stratigraphic results and is discussed in “Paleomagnetism,” p. 16.
SHIPBOARD SCIENTIFIC PARTYCHAPTER 7, SITE 1129 14
Quaternary
The two most abundant species of the well-preserved, temperate as-semblage above ~68 mbsf are Globigerinoides ruber and Globorotalia in-flata. Eleven other species are rare to common and include Globigerinabulloides, Globigerina falconensis, Globigerina quinqueloba, Globigerinitaglutinata, Globorotalia hirsuta, Globorotalia truncatulinoides, Orbulina uni-versa, Neogloboquadrina pachyderma (dextral), and Zeaglobigerina rubes-cens. Only a few robust and distinctive species, however, areconsistently recognized in the poorly preserved section below ~68mbsf. They are Globorotalia inflata, G. ruber, N. pachyderma, and G. trun-catulinoides.
Samples above ~414 mbsf are placed in Pleistocene Zones Pt1 (Berg-gren et al., 1995) and SN14 of Jenkins (1985, 1993), based on the pres-ence of G. truncatulinoides. The last occurrence of Globorotalia tosaensisbetween 335.83 and 347.47 mbsf (Sample 182-1129C-37X-CC, 24–27cm) is used to divide the zone into Subzones Pt1b and Pt1a. Poor preser-vation, however, may have deepened the last appearance of G. tosaensis,which occurs between 335.83 and 347.47 mbsf. This is only slightlyabove the Brunhes/Matuyama boundary, which lies between 338.8 and347.2 mbsf in Hole 1129C (see “Paleomagnetism,” p. 16). The last oc-currence of G. tosaensis occurred at 0.65 Ma in subtropical latitudes andlocally at 0.71 Ma. Based on data from Site 1127, this datum should lie71 to 38 m above the Brunhes/Matuyama boundary, based on estimatesfrom the sedimentation rate for this interval (Fig. F9).
Placement of the base of Zone Pt 1 also may be affected by poor pres-ervation. The poor preservation may have caused the first appearanceof G. truncatulinoides to be recognized at a depth that is too shallow.This horizon occurs 42 m below the onset of the Jaramillo Subchron,and its age is estimated to be 1.04 Ma on the basis of the sedimentationrate. The estimate is much younger than the age of the first appearanceof G. truncatulinoides in subtropical regions (excluding the southwestPacific Ocean according to Berggren et al., 1995). The estimate is alsoyounger than the age estimated at 1.23 Ma at nearby Site 1127 in whichpreservation is superior.
Globorotalia crassaformis Interval
Samples from 413.86–432.93 mbsf to 554.7–554.70 mbsf containmost of the species found in the Pleistocene Zone Pt1 described above,although without G. truncatulinoides and with more common G. cras-saformis. Therefore, the unit is placed in the G. crassaformis interval,which at this site includes a lengthy portion of the lower Pleistoceneand a portion of the upper Pliocene (Fig. F8) on the basis of magneto-stratigraphy (see “Paleomagnetism,” p. 16) (Berggren et al., 1995).
Miocene
The middle Miocene section below the disconformity at 556.7 mbsf(see “Lithostratigraphy,” p. 4) contains two samples (Samples 182-1129D-22R-CC, 16–19 cm, and 24R-1, 20–25 cm, from 557.68 and575.60 mbsf, respectively) containing sparse and poorly preservedplanktonic foraminifers. Both samples contain Globigerinoides trilobusand Globoconella conoidea, an association consistent with a late–middleMiocene age. The latter sample also contains Globigerinella obesa,Zeaglobigerina woodi, Globigerinita glutinata, O. universa, Globoconella
SHIPBOARD SCIENTIFIC PARTYCHAPTER 7, SITE 1129 15
miozea, Globoquadrina dehiscens, Globigerinita juvenilis, and Neoglobo-quadrina continuosa. The association of the last five species is consistentwith a middle Miocene age.
Benthic Foraminifers
Benthic foraminifers were studied from the only two core-catchersamples recovered at Hole 1129B and from every fourth core-catchersample from Holes 1129C and 1129D. Additional samples were exam-ined from intervals in which marked lithologic change occurred.Benthic foraminifers are generally abundant and well preserved at Hole1129B and in the upper part of Hole 1129C (Cores 1H–15H). Abun-dance decreases significantly and preservation deteriorates markedlybelow Core 182-1129C-15H. Between 100 and 300 benthic foraminiferswere picked from the >63-µm fraction, except in samples in whichabundance was low. The benthic foraminiferal assemblages at Site 1129contain mainly cosmopolitan taxa, although they also include specieswith a more geographically restricted distribution. Postcruise studieswill be necessary to fully document benthic foraminifer distribution atSite 1129 during the Pleistocene and to investigate faunal changes in re-lation to climate, sea-level, and/or circulation fluctuations within a se-quence stratigraphic framework. A shallowing-upward trend frommiddle bathyal paleodepths in the Miocene to upper bathyal pale-odepths in the Pleistocene is exhibited by the following assemblages atSite 1129.
Bryozoan Assemblage (Pleistocene)
Cores 182-1129B-1H through 2H and 182-1129C-1H through 15H
This relatively diverse, well-preserved assemblage is found in core-catcher samples together with abundant, well-preserved bryozoan frag-ments. It includes some large specimens (>1 mm) of Sigmoilina obesa,Heterolepa dutemplei, Textularia spp., Spirillina spp., and miliolids. Alsopresent as rare to few constituents of the assemblage are Sphaeroidinabulloides, Martinottiella communis, Sphaeroidina variabilis, Hoeglundia ele-gans, Bigenerina nodosaria, Uvigerina hispidocostata, Bulimina marginata,Bolivina spp., Loxostomum spp., Loxostomoides spp., Rosalina spp., Cibici-doides spp., Anomalinoides spp., and various nodosariids. The presenceof S. bulloides, Hoeglundia elegans, B. nodosaria, and Bulimina marginataindicates upper bathyal paleodepths. Similar benthic foraminiferal as-semblages were found at Sites 1131 and 1132. They appear to have beenassociated with the establishment of diversified bryozoan communitiesat the seafloor at various times during the Pleistocene. Variations in thecomposition of the assemblage may reflect changes in circulation or sealevel in the Great Australian Bight, which may have also influenced thedevelopment of bryozoan buildups during the Pleistocene. Further sedi-mentological and micropaleontological work will clarify the evolutionof these bryozoan buildups and the paleoceanographic setting of theGreat Australian Bight.
Assemblage 1 (Pleistocene)
Cores 182-1129C-16H through 48X and 182-1129D-1R through 22R
This impoverished assemblage is characterized by fluctuating num-bers of Hoeglundia elegans, M. communis, H. dutemplei, S. bulloides, Plan-
SHIPBOARD SCIENTIFIC PARTYCHAPTER 7, SITE 1129 16
ulina wuellerstorfi, U. hispidocostata, Loxostomum spp., Loxostomoidesspp., Elphidium spp., Rosalina spp, Cibicidoides spp., Anomalinoides spp.,Palliolatella spp., miliolids, and various nodosariids. Upper bathyal pale-odepths are suggested by the presence of the depth-indicative speciesHoeglundia elegans, S. bulloides, M. communis, H. dutemplei, and U. hispi-docostata. Variable abundance of small miliolids and Elphidium spp. sug-gests that part of the assemblage was redeposited from shallowerdepths. However, poor preservation in many of the samples and gener-ally low abundance overall prevent detailed analysis of faunal changeswithin this interval.
Assemblage 2 (Miocene)
Sample 182-1129D-24R-1, 20–25 cm
A sparse assemblage was found in Sample 182-1129D-24R-1, 20–25cm, within an interval of poor recovery in which mostly chert frag-ments were recovered. This assemblage is characterized by Vulvulina spi-nosa, Plectofrondicularia vaughni, Rectuvigerina striata, Siphoninatenuicarinata, Bolivina spp., and various nodosariids. Middle bathyal pa-leodepths are suggested by the presence of V. spinosa, P. vaughni, and R.striata.
Sedimentation Rates
Sediment accumulation rates were calculated from preliminary bio-stratigraphic and paleomagnetic data from Site 1129. The results arepresented in Figure F9. The biostratigraphic datum levels, together withthe paleomagnetic data used, are listed in Table T2.
An exceptionally high sedimentation rate, averaging 364 m/m.y., iscalculated for the Pleistocene section. During the Jaramillo polarity re-versal, the sedimentation rate reached its peak of 542 m/m.y. In con-trast, the underlying lower part of the Pleistocene registered 142 m/m.y.,the slowest rate for the entire Pliocene section. A major disconformitybelow the Pliocene section is indicated by the simultaneous downholedisappearance of two planktonic foraminifers, G. crassaformis and G.puncticulata, that originate in the lower Pliocene, with the downholeappearance of the middle–lower Miocene nannofossil S. heteromorphus.Biostratigraphic data suggest that the entire lower Pliocene and thegreater part of the Miocene (nannofossil Zones NN18–NN6) are miss-ing. The duration of this hiatus is >11 m.y.
PALEOMAGNETISM
Shipboard paleomagnetic measurements for Holes 1129C and 1129Dconsisted of long-core measurements at 5- to 10-cm intervals of the nat-ural remanent magnetization (NRM) and the remanence after alternat-ing field (AF) demagnetization at 20 mT, as described in“Paleomagnetism,” p. 12, in the “Explanatory Notes” chapter. Mea-surements were performed on archive halves of all APC and XCB cores,except for intervals affected by core disturbance. Long-core measure-ments established a magnetostratigraphy to a depth of ~550 mbsf,which includes the Brunhes and upper Matuyama epochs. In partiallylithified materials below 250 mbsf, measurements on discrete sampleswere used to confirm polarity determinations obtained from long-coremeasurements. Discrete samples were also collected from representative
T2. Datum levels used in the graph of sedimentation rate, p. 68.
SHIPBOARD SCIENTIFIC PARTYCHAPTER 7, SITE 1129 17
core material and subjected to progressive AF demagnetization up to 30mT. These samples were also used for anhysteretic remanent magnetiza-tion (ARM) and isothermal remanent magnetization (IRM) acquisitionand demagnetization experiments.
Long-Core Measurements
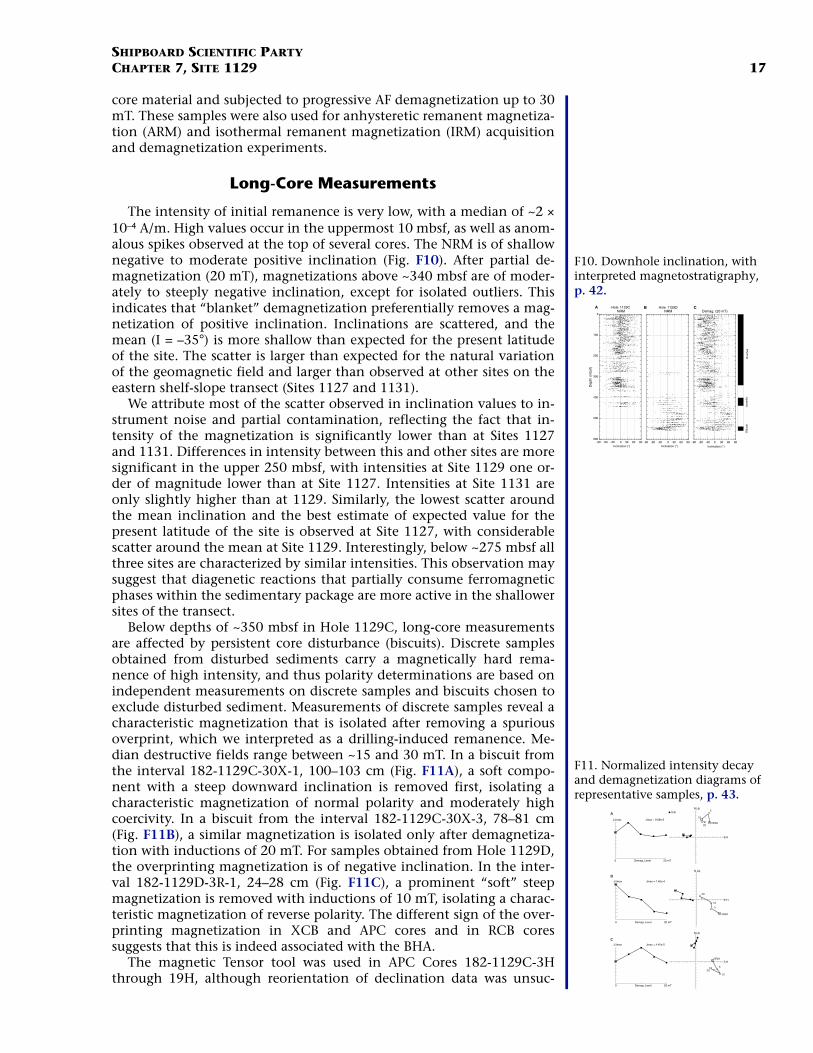
The intensity of initial remanence is very low, with a median of ~2 ×10⁻⁴ A/m. High values occur in the uppermost 10 mbsf, as well as anom-alous spikes observed at the top of several cores. The NRM is of shallownegative to moderate positive inclination (Fig. F10). After partial de-magnetization (20 mT), magnetizations above ~340 mbsf are of moder-ately to steeply negative inclination, except for isolated outliers. Thisindicates that “blanket” demagnetization preferentially removes a mag-netization of positive inclination. Inclinations are scattered, and themean (I = –35°) is more shallow than expected for the present latitudeof the site. The scatter is larger than expected for the natural variationof the geomagnetic field and larger than observed at other sites on theeastern shelf-slope transect (Sites 1127 and 1131).
We attribute most of the scatter observed in inclination values to in-strument noise and partial contamination, reflecting the fact that in-tensity of the magnetization is significantly lower than at Sites 1127and 1131. Differences in intensity between this and other sites are moresignificant in the upper 250 mbsf, with intensities at Site 1129 one or-der of magnitude lower than at Site 1127. Intensities at Site 1131 areonly slightly higher than at 1129. Similarly, the lowest scatter aroundthe mean inclination and the best estimate of expected value for thepresent latitude of the site is observed at Site 1127, with considerablescatter around the mean at Site 1129. Interestingly, below ~275 mbsf allthree sites are characterized by similar intensities. This observation maysuggest that diagenetic reactions that partially consume ferromagneticphases within the sedimentary package are more active in the shallowersites of the transect.
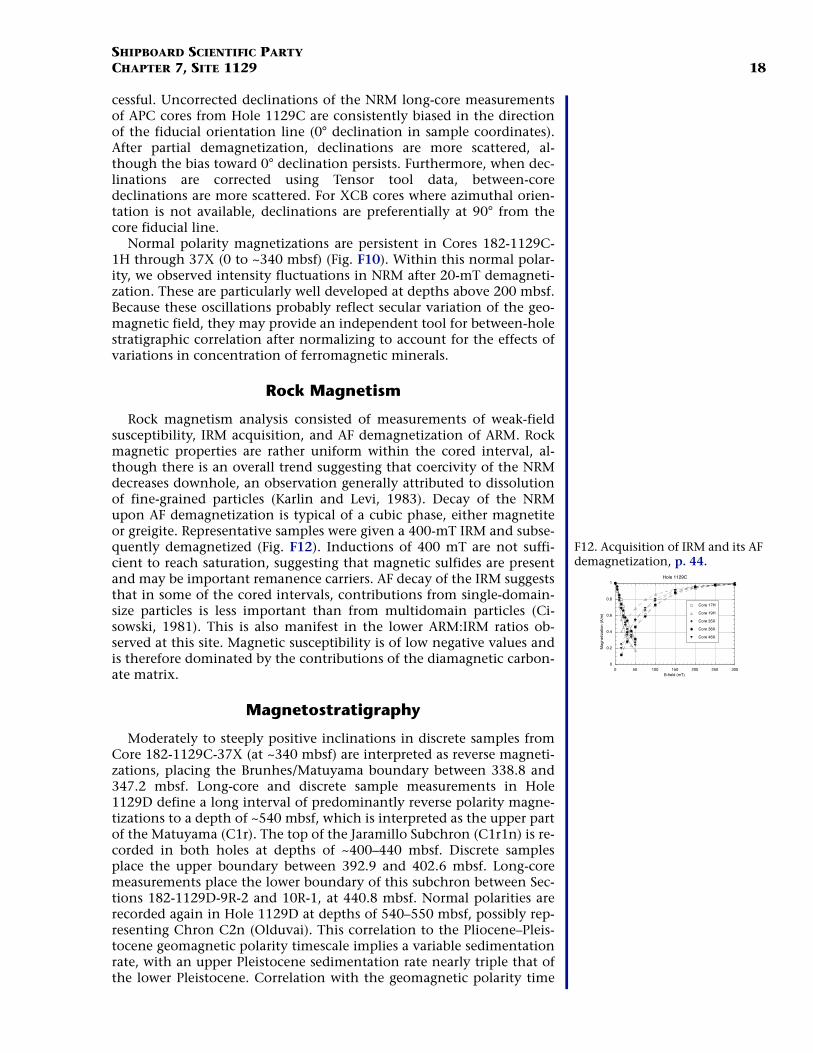
Below depths of ~350 mbsf in Hole 1129C, long-core measurementsare affected by persistent core disturbance (biscuits). Discrete samplesobtained from disturbed sediments carry a magnetically hard rema-nence of high intensity, and thus polarity determinations are based onindependent measurements on discrete samples and biscuits chosen toexclude disturbed sediment. Measurements of discrete samples reveal acharacteristic magnetization that is isolated after removing a spuriousoverprint, which we interpreted as a drilling-induced remanence. Me-dian destructive fields range between ~15 and 30 mT. In a biscuit fromthe interval 182-1129C-30X-1, 100–103 cm (Fig. F11A), a soft compo-nent with a steep downward inclination is removed first, isolating acharacteristic magnetization of normal polarity and moderately highcoercivity. In a biscuit from the interval 182-1129C-30X-3, 78–81 cm(Fig. F11B), a similar magnetization is isolated only after demagnetiza-tion with inductions of 20 mT. For samples obtained from Hole 1129D,the overprinting magnetization is of negative inclination. In the inter-val 182-1129D-3R-1, 24–28 cm (Fig. F11C), a prominent “soft” steepmagnetization is removed with inductions of 10 mT, isolating a charac-teristic magnetization of reverse polarity. The different sign of the over-printing magnetization in XCB and APC cores and in RCB coressuggests that this is indeed associated with the BHA.
The magnetic Tensor tool was used in APC Cores 182-1129C-3Hthrough 19H, although reorientation of declination data was unsuc-
-90 -60 -30 0 30 60 90
0
100
200
300
400
500
600
Hole 1129C NRM
Inclination (°)
Dep
th (
mbs
f)
-90 -60 -30 0 30 60 90
Hole 1129DNRM
Inclination (°)-90 -60 -30 0 30 60 90
Demag. (20 mT)
Inclination (°)
Bru
nhes
Jara
mill
oO
lduv
ai
A B C
F10. Downhole inclination, with interpreted magnetostratigraphy, p. 42.
N,E
J/Jmax Jmax = 9.09e-5
0 Demag. Level 20 mT
N,Up
E,H
NRM20
5
10
J/Jmax Jmax = 1.40e-4
0 Demag. Level 20 mT
N,Up
E,H
NRM
5
10
20
J/Jmax Jmax = 4.45e-5
0 Demag. Level 20 mT
N,Up
E,HNRM
5
10
20
A
B
C
F11. Normalized intensity decay and demagnetization diagrams of representative samples, p. 43.
SHIPBOARD SCIENTIFIC PARTYCHAPTER 7, SITE 1129 18
cessful. Uncorrected declinations of the NRM long-core measurementsof APC cores from Hole 1129C are consistently biased in the directionof the fiducial orientation line (0° declination in sample coordinates).After partial demagnetization, declinations are more scattered, al-though the bias toward 0° declination persists. Furthermore, when dec-linations are corrected using Tensor tool data, between-coredeclinations are more scattered. For XCB cores where azimuthal orien-tation is not available, declinations are preferentially at 90° from thecore fiducial line.
Normal polarity magnetizations are persistent in Cores 182-1129C-1H through 37X (0 to ~340 mbsf) (Fig. F10). Within this normal polar-ity, we observed intensity fluctuations in NRM after 20-mT demagneti-zation. These are particularly well developed at depths above 200 mbsf.Because these oscillations probably reflect secular variation of the geo-magnetic field, they may provide an independent tool for between-holestratigraphic correlation after normalizing to account for the effects ofvariations in concentration of ferromagnetic minerals.
Rock Magnetism
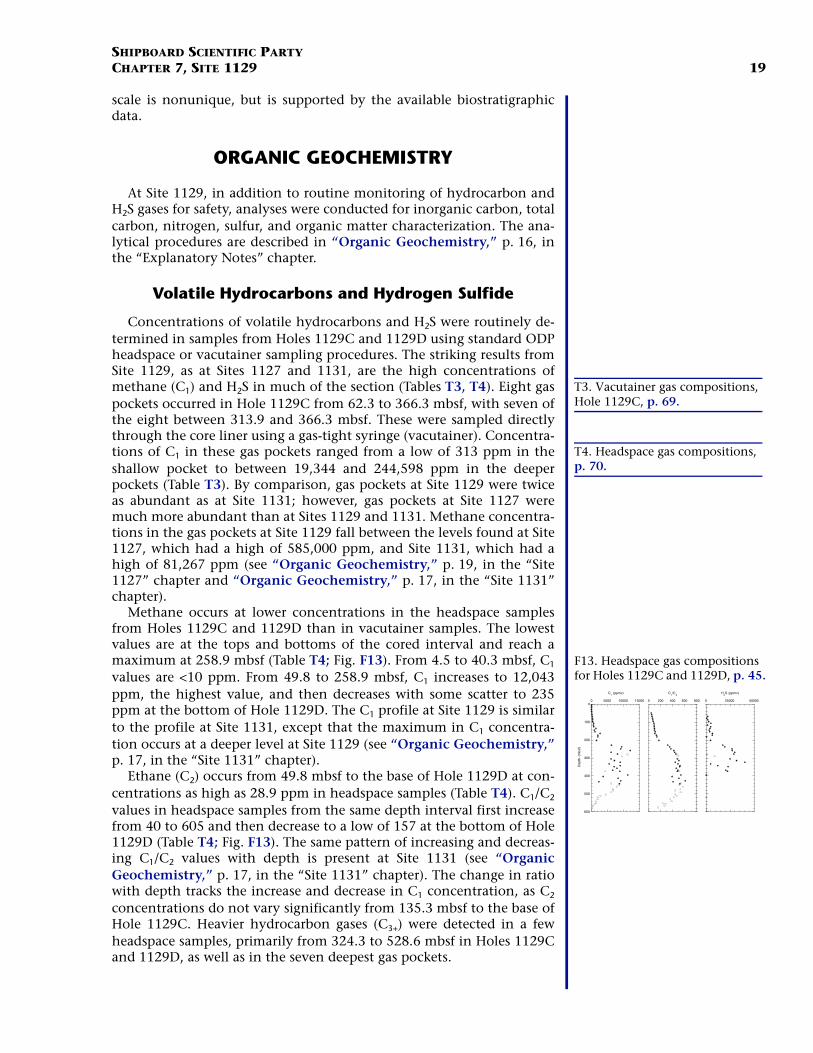
Rock magnetism analysis consisted of measurements of weak-fieldsusceptibility, IRM acquisition, and AF demagnetization of ARM. Rockmagnetic properties are rather uniform within the cored interval, al-though there is an overall trend suggesting that coercivity of the NRMdecreases downhole, an observation generally attributed to dissolutionof fine-grained particles (Karlin and Levi, 1983). Decay of the NRMupon AF demagnetization is typical of a cubic phase, either magnetiteor greigite. Representative samples were given a 400-mT IRM and subse-quently demagnetized (Fig. F12). Inductions of 400 mT are not suffi-cient to reach saturation, suggesting that magnetic sulfides are presentand may be important remanence carriers. AF decay of the IRM suggeststhat in some of the cored intervals, contributions from single-domain-size particles is less important than from multidomain particles (Ci-sowski, 1981). This is also manifest in the lower ARM:IRM ratios ob-served at this site. Magnetic susceptibility is of low negative values andis therefore dominated by the contributions of the diamagnetic carbon-ate matrix.
Magnetostratigraphy
Moderately to steeply positive inclinations in discrete samples fromCore 182-1129C-37X (at ~340 mbsf) are interpreted as reverse magneti-zations, placing the Brunhes/Matuyama boundary between 338.8 and347.2 mbsf. Long-core and discrete sample measurements in Hole1129D define a long interval of predominantly reverse polarity magne-tizations to a depth of ~540 mbsf, which is interpreted as the upper partof the Matuyama (C1r). The top of the Jaramillo Subchron (C1r1n) is re-corded in both holes at depths of ~400–440 mbsf. Discrete samplesplace the upper boundary between 392.9 and 402.6 mbsf. Long-coremeasurements place the lower boundary of this subchron between Sec-tions 182-1129D-9R-2 and 10R-1, at 440.8 mbsf. Normal polarities arerecorded again in Hole 1129D at depths of 540–550 mbsf, possibly rep-resenting Chron C2n (Olduvai). This correlation to the Pliocene–Pleis-tocene geomagnetic polarity timescale implies a variable sedimentationrate, with an upper Pleistocene sedimentation rate nearly triple that ofthe lower Pleistocene. Correlation with the geomagnetic polarity time
0
0.2
0.4
0.6
0.8
1
0 50 100 150 200 250 300
Hole 1129C
Mag
netiz
atio
n (A
/m)
B-field (mT)
Core 17H
Core 19H
Core 35X
Core 36X
Core 46X
F12. Acquisition of IRM and its AF demagnetization, p. 44.
SHIPBOARD SCIENTIFIC PARTYCHAPTER 7, SITE 1129 19
scale is nonunique, but is supported by the available biostratigraphicdata.
ORGANIC GEOCHEMISTRY
At Site 1129, in addition to routine monitoring of hydrocarbon andH2S gases for safety, analyses were conducted for inorganic carbon, totalcarbon, nitrogen, sulfur, and organic matter characterization. The ana-lytical procedures are described in “Organic Geochemistry,” p. 16, inthe “Explanatory Notes” chapter.
Volatile Hydrocarbons and Hydrogen Sulfide
Concentrations of volatile hydrocarbons and H2S were routinely de-termined in samples from Holes 1129C and 1129D using standard ODPheadspace or vacutainer sampling procedures. The striking results fromSite 1129, as at Sites 1127 and 1131, are the high concentrations ofmethane (C1) and H2S in much of the section (Tables T3, T4). Eight gaspockets occurred in Hole 1129C from 62.3 to 366.3 mbsf, with seven ofthe eight between 313.9 and 366.3 mbsf. These were sampled directlythrough the core liner using a gas-tight syringe (vacutainer). Concentra-tions of C1 in these gas pockets ranged from a low of 313 ppm in theshallow pocket to between 19,344 and 244,598 ppm in the deeperpockets (Table T3). By comparison, gas pockets at Site 1129 were twiceas abundant as at Site 1131; however, gas pockets at Site 1127 weremuch more abundant than at Sites 1129 and 1131. Methane concentra-tions in the gas pockets at Site 1129 fall between the levels found at Site1127, which had a high of 585,000 ppm, and Site 1131, which had ahigh of 81,267 ppm (see “Organic Geochemistry,” p. 19, in the “Site1127” chapter and “Organic Geochemistry,” p. 17, in the “Site 1131”chapter).
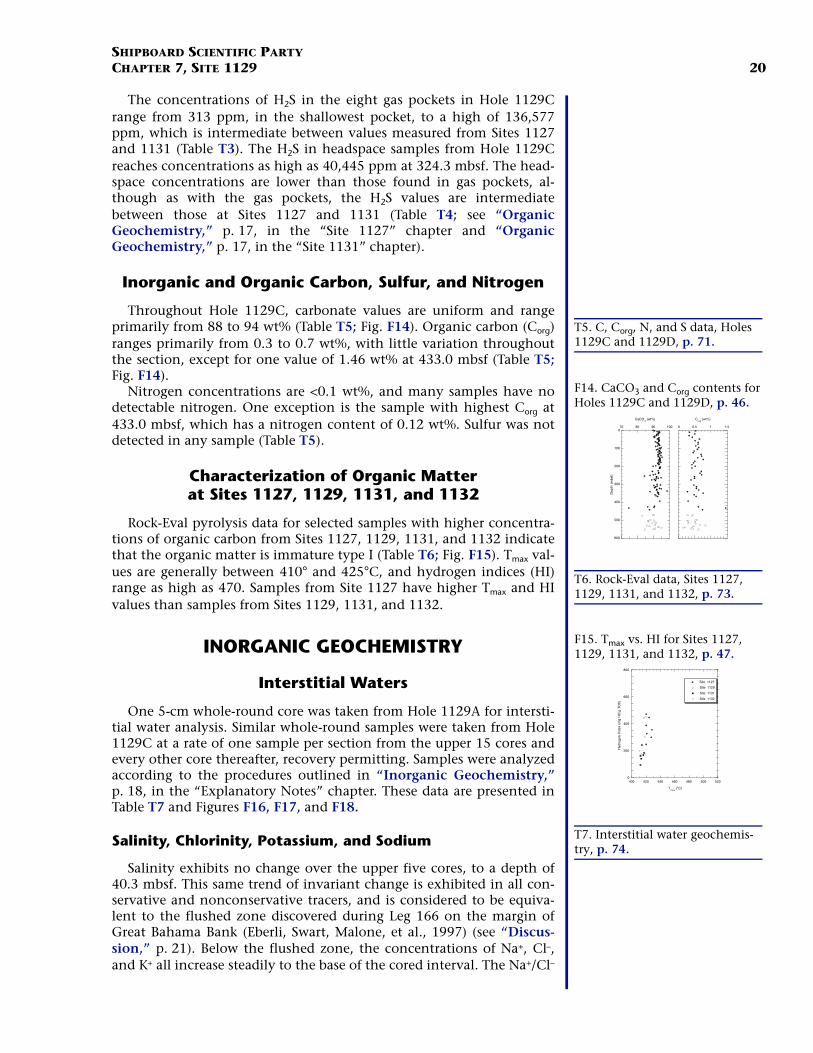
Methane occurs at lower concentrations in the headspace samplesfrom Holes 1129C and 1129D than in vacutainer samples. The lowestvalues are at the tops and bottoms of the cored interval and reach amaximum at 258.9 mbsf (Table T4; Fig. F13). From 4.5 to 40.3 mbsf, C1
values are <10 ppm. From 49.8 to 258.9 mbsf, C1 increases to 12,043ppm, the highest value, and then decreases with some scatter to 235ppm at the bottom of Hole 1129D. The C1 profile at Site 1129 is similarto the profile at Site 1131, except that the maximum in C1 concentra-tion occurs at a deeper level at Site 1129 (see “Organic Geochemistry,”p. 17, in the “Site 1131” chapter).
Ethane (C2) occurs from 49.8 mbsf to the base of Hole 1129D at con-centrations as high as 28.9 ppm in headspace samples (Table T4). C1/C2
values in headspace samples from the same depth interval first increasefrom 40 to 605 and then decrease to a low of 157 at the bottom of Hole1129D (Table T4; Fig. F13). The same pattern of increasing and decreas-ing C1/C2 values with depth is present at Site 1131 (see “OrganicGeochemistry,” p. 17, in the “Site 1131” chapter). The change in ratiowith depth tracks the increase and decrease in C1 concentration, as C2
concentrations do not vary significantly from 135.3 mbsf to the base ofHole 1129C. Heavier hydrocarbon gases (C3+) were detected in a fewheadspace samples, primarily from 324.3 to 528.6 mbsf in Holes 1129Cand 1129D, as well as in the seven deepest gas pockets.
T3. Vacutainer gas compositions, Hole 1129C, p. 69.
T4. Headspace gas compositions, p. 70.
0
100
200
300
400
500
600
0 5000 10000 15000
Dep
th (
mbs
f)
C1 (ppmv)
0 200 400 600 800
C1/C
2
0 25000 50000
H2S (ppmv)
F13. Headspace gas compositions for Holes 1129C and 1129D, p. 45.
SHIPBOARD SCIENTIFIC PARTYCHAPTER 7, SITE 1129 20
The concentrations of H2S in the eight gas pockets in Hole 1129Crange from 313 ppm, in the shallowest pocket, to a high of 136,577ppm, which is intermediate between values measured from Sites 1127and 1131 (Table T3). The H2S in headspace samples from Hole 1129Creaches concentrations as high as 40,445 ppm at 324.3 mbsf. The head-space concentrations are lower than those found in gas pockets, al-though as with the gas pockets, the H2S values are intermediatebetween those at Sites 1127 and 1131 (Table T4; see “OrganicGeochemistry,” p. 17, in the “Site 1127” chapter and “OrganicGeochemistry,” p. 17, in the “Site 1131” chapter).
Inorganic and Organic Carbon, Sulfur, and Nitrogen
Throughout Hole 1129C, carbonate values are uniform and rangeprimarily from 88 to 94 wt% (Table T5; Fig. F14). Organic carbon (Corg)ranges primarily from 0.3 to 0.7 wt%, with little variation throughoutthe section, except for one value of 1.46 wt% at 433.0 mbsf (Table T5;Fig. F14).
Nitrogen concentrations are <0.1 wt%, and many samples have nodetectable nitrogen. One exception is the sample with highest Corg at433.0 mbsf, which has a nitrogen content of 0.12 wt%. Sulfur was notdetected in any sample (Table T5).
Characterization of Organic Matter at Sites 1127, 1129, 1131, and 1132
Rock-Eval pyrolysis data for selected samples with higher concentra-tions of organic carbon from Sites 1127, 1129, 1131, and 1132 indicatethat the organic matter is immature type I (Table T6; Fig. F15). Tmax val-ues are generally between 410° and 425°C, and hydrogen indices (HI)range as high as 470. Samples from Site 1127 have higher Tmax and HIvalues than samples from Sites 1129, 1131, and 1132.
INORGANIC GEOCHEMISTRY
Interstitial Waters
One 5-cm whole-round core was taken from Hole 1129A for intersti-tial water analysis. Similar whole-round samples were taken from Hole1129C at a rate of one sample per section from the upper 15 cores andevery other core thereafter, recovery permitting. Samples were analyzedaccording to the procedures outlined in “Inorganic Geochemistry,”p. 18, in the “Explanatory Notes” chapter. These data are presented inTable T7 and Figures F16, F17, and F18.
Salinity, Chlorinity, Potassium, and Sodium
Salinity exhibits no change over the upper five cores, to a depth of40.3 mbsf. This same trend of invariant change is exhibited in all con-servative and nonconservative tracers, and is considered to be equiva-lent to the flushed zone discovered during Leg 166 on the margin ofGreat Bahama Bank (Eberli, Swart, Malone, et al., 1997) (see “Discus-sion,” p. 21). Below the flushed zone, the concentrations of Na+, Cl–,and K+ all increase steadily to the base of the cored interval. The Na+/Cl–
T5. C, Corg, N, and S data, Holes 1129C and 1129D, p. 71.
0
100
200
300
400
500
600
70 80 90 100
Dep
th (
mbs
f)
CaCO3 (wt%)
0 0.5 1 1.5
Corg
(wt%)
F14. CaCO3 and Corg contents for Holes 1129C and 1129D, p. 46.
T6. Rock-Eval data, Sites 1127, 1129, 1131, and 1132, p. 73.
0
200
400
600
800
400 420 440 460 480 500 520
Site 1127
Site 1129
Site 1131
Site 1132
Hyd
roge
n In
dex
(mg
HC
/g T
OC
)
Tmax
(oC)
F15. Tmax vs. HI for Sites 1127, 1129, 1131, and 1132, p. 47.
T7. Interstitial water geochemis-try, p. 74.
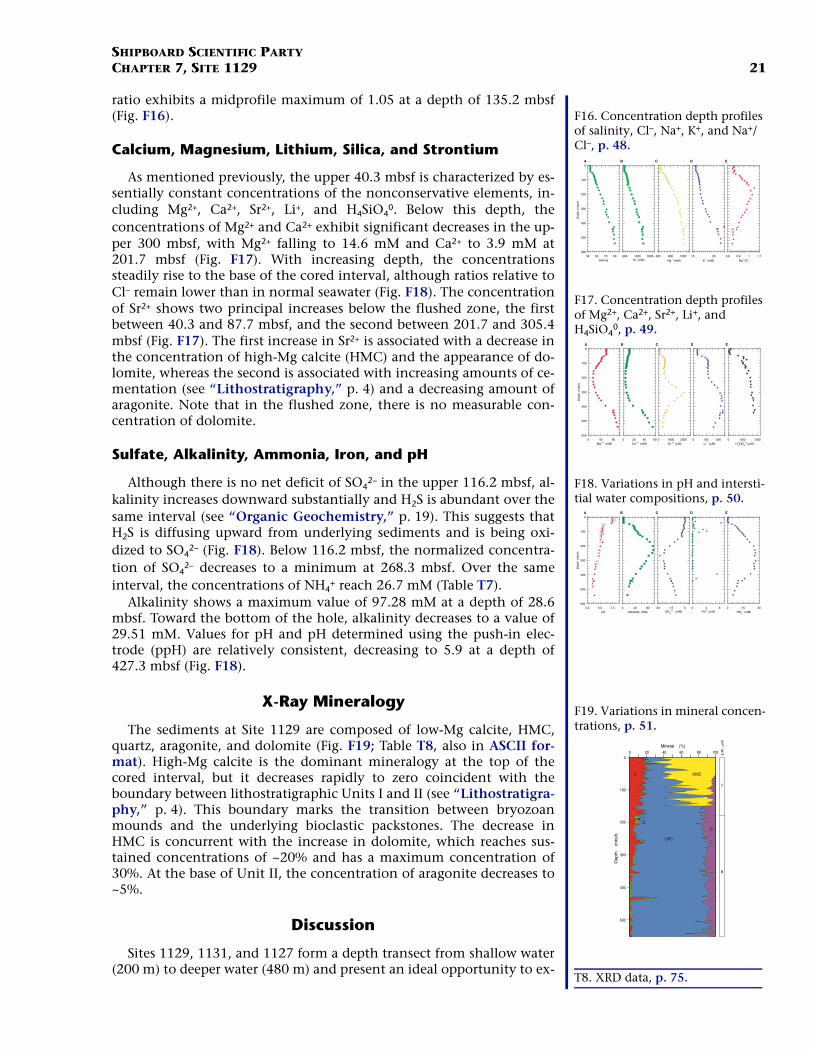
SHIPBOARD SCIENTIFIC PARTYCHAPTER 7, SITE 1129 21
ratio exhibits a midprofile maximum of 1.05 at a depth of 135.2 mbsf(Fig. F16).
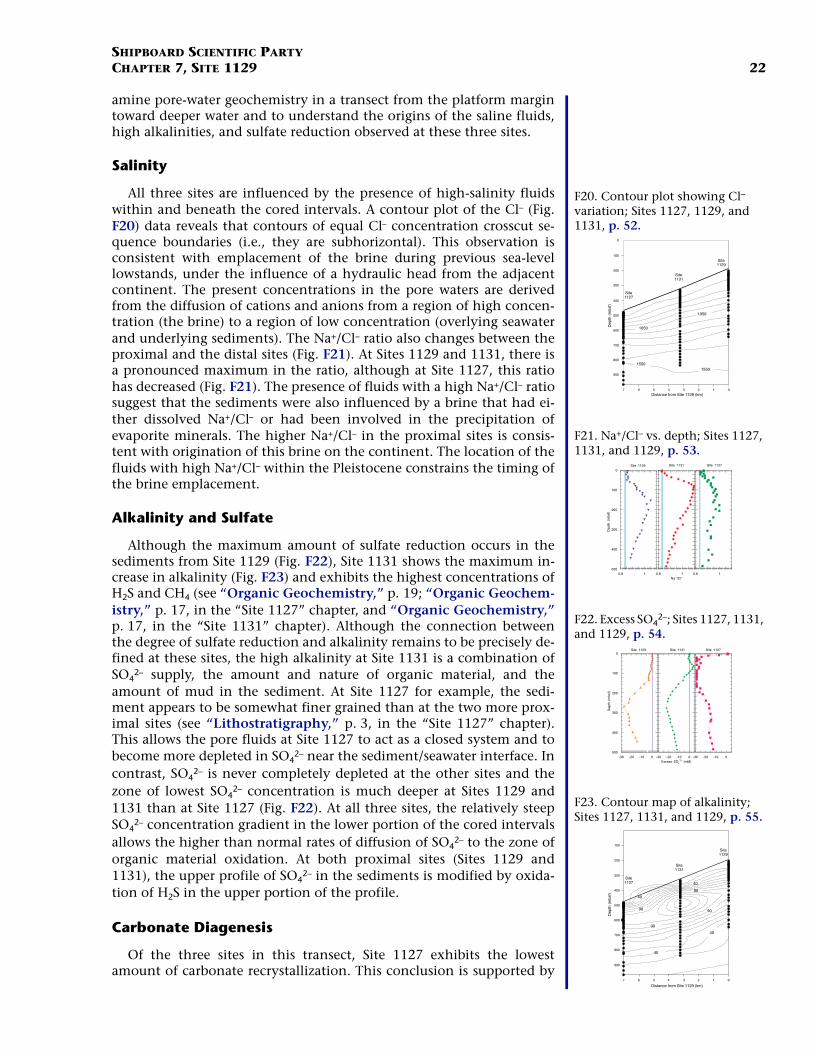
Calcium, Magnesium, Lithium, Silica, and Strontium
As mentioned previously, the upper 40.3 mbsf is characterized by es-sentially constant concentrations of the nonconservative elements, in-cluding Mg2+, Ca2+, Sr2+, Li+, and H4SiO4
0. Below this depth, theconcentrations of Mg2+ and Ca2+ exhibit significant decreases in the up-per 300 mbsf, with Mg2+ falling to 14.6 mM and Ca2+ to 3.9 mM at201.7 mbsf (Fig. F17). With increasing depth, the concentrationssteadily rise to the base of the cored interval, although ratios relative toCl– remain lower than in normal seawater (Fig. F18). The concentrationof Sr2+ shows two principal increases below the flushed zone, the firstbetween 40.3 and 87.7 mbsf, and the second between 201.7 and 305.4mbsf (Fig. F17). The first increase in Sr2+ is associated with a decrease inthe concentration of high-Mg calcite (HMC) and the appearance of do-lomite, whereas the second is associated with increasing amounts of ce-mentation (see “Lithostratigraphy,” p. 4) and a decreasing amount ofaragonite. Note that in the flushed zone, there is no measurable con-centration of dolomite.
Sulfate, Alkalinity, Ammonia, Iron, and pH
Although there is no net deficit of SO42– in the upper 116.2 mbsf, al-
kalinity increases downward substantially and H2S is abundant over thesame interval (see “Organic Geochemistry,” p. 19). This suggests thatH2S is diffusing upward from underlying sediments and is being oxi-dized to SO4
2– (Fig. F18). Below 116.2 mbsf, the normalized concentra-tion of SO4
2– decreases to a minimum at 268.3 mbsf. Over the sameinterval, the concentrations of NH4
+ reach 26.7 mM (Table T7).Alkalinity shows a maximum value of 97.28 mM at a depth of 28.6
mbsf. Toward the bottom of the hole, alkalinity decreases to a value of29.51 mM. Values for pH and pH determined using the push-in elec-trode (ppH) are relatively consistent, decreasing to 5.9 at a depth of427.3 mbsf (Fig. F18).
X-Ray Mineralogy
The sediments at Site 1129 are composed of low-Mg calcite, HMC,quartz, aragonite, and dolomite (Fig. F19; Table T8, also in ASCII for-mat). High-Mg calcite is the dominant mineralogy at the top of thecored interval, but it decreases rapidly to zero coincident with theboundary between lithostratigraphic Units I and II (see “Lithostratigra-phy,” p. 4). This boundary marks the transition between bryozoanmounds and the underlying bioclastic packstones. The decrease inHMC is concurrent with the increase in dolomite, which reaches sus-tained concentrations of ~20% and has a maximum concentration of30%. At the base of Unit II, the concentration of aragonite decreases to~5%.
Discussion
Sites 1129, 1131, and 1127 form a depth transect from shallow water(200 m) to deeper water (480 m) and present an ideal opportunity to ex-
30 50 70 90
0
100
200
300
400
500
600
Salinity
Dep
th (
mbs
f)
600 1200 1800Cl– (mM)
400 800 1200
Na+ (mM)
10 20
K+ (mM)
0.8 0.9 1 1.1
Na+/Cl–
A B C D E
F16. Concentration depth profiles of salinity, Cl–, Na+, K+, and Na+/Cl–, p. 48.
0 40 80
0
100
200
300
400
500
600
Mg 2+ (mM)
Dep
th (
mbs
f)
0 20 40 60Ca 2+ (mM)
0 1000 2000Sr 2+ (µM)
0 100 200Li + (µM)
0 600 1200H
4SiO
40 (µM)
A B C D E
F17. Concentration depth profiles of Mg2+, Ca2+, Sr2+, Li+, and H4SiO4
0, p. 49.
5.5 6.5 7.5
0
100
200
300
400
500
600
pH
Dep
th (
mbs
f)
0 40 80Alkalinity (mM)
-30 -15 0SO
42– (mM)
0 3 6Fe2+ (µM)
0 15 30NH
4+ (m M)
A B C D E
F18. Variations in pH and intersti-tial water compositions, p. 50.
0 20 40 60 80 1000
100
200
300
400
500
Mineral (%)
Depth
(m
bsf
)
Lith
. unit
I
II
A
Q
LMC
HMC
D
F19. Variations in mineral concen-trations, p. 51.
T8. XRD data, p. 75.
SHIPBOARD SCIENTIFIC PARTYCHAPTER 7, SITE 1129 22
amine pore-water geochemistry in a transect from the platform margintoward deeper water and to understand the origins of the saline fluids,high alkalinities, and sulfate reduction observed at these three sites.
Salinity
All three sites are influenced by the presence of high-salinity fluidswithin and beneath the cored intervals. A contour plot of the Cl– (Fig.F20) data reveals that contours of equal Cl– concentration crosscut se-quence boundaries (i.e., they are subhorizontal). This observation isconsistent with emplacement of the brine during previous sea-levellowstands, under the influence of a hydraulic head from the adjacentcontinent. The present concentrations in the pore waters are derivedfrom the diffusion of cations and anions from a region of high concen-tration (the brine) to a region of low concentration (overlying seawaterand underlying sediments). The Na+/Cl– ratio also changes between theproximal and the distal sites (Fig. F21). At Sites 1129 and 1131, there isa pronounced maximum in the ratio, although at Site 1127, this ratiohas decreased (Fig. F21). The presence of fluids with a high Na+/Cl– ratiosuggest that the sediments were also influenced by a brine that had ei-ther dissolved Na+/Cl– or had been involved in the precipitation ofevaporite minerals. The higher Na+/Cl– in the proximal sites is consis-tent with origination of this brine on the continent. The location of thefluids with high Na+/Cl– within the Pleistocene constrains the timing ofthe brine emplacement.
Alkalinity and Sulfate
Although the maximum amount of sulfate reduction occurs in thesediments from Site 1129 (Fig. F22), Site 1131 shows the maximum in-crease in alkalinity (Fig. F23) and exhibits the highest concentrations ofH2S and CH4 (see “Organic Geochemistry,” p. 19; “Organic Geochem-istry,” p. 17, in the “Site 1127” chapter, and “Organic Geochemistry,”p. 17, in the “Site 1131” chapter). Although the connection betweenthe degree of sulfate reduction and alkalinity remains to be precisely de-fined at these sites, the high alkalinity at Site 1131 is a combination ofSO4
2– supply, the amount and nature of organic material, and theamount of mud in the sediment. At Site 1127 for example, the sedi-ment appears to be somewhat finer grained than at the two more prox-imal sites (see “Lithostratigraphy,” p. 3, in the “Site 1127” chapter).This allows the pore fluids at Site 1127 to act as a closed system and tobecome more depleted in SO4
2– near the sediment/seawater interface. Incontrast, SO4
2– is never completely depleted at the other sites and thezone of lowest SO4
2– concentration is much deeper at Sites 1129 and1131 than at Site 1127 (Fig. F22). At all three sites, the relatively steepSO4
2– concentration gradient in the lower portion of the cored intervalsallows the higher than normal rates of diffusion of SO4
2– to the zone oforganic material oxidation. At both proximal sites (Sites 1129 and1131), the upper profile of SO4
2– in the sediments is modified by oxida-tion of H2S in the upper portion of the profile.
Carbonate Diagenesis
Of the three sites in this transect, Site 1127 exhibits the lowestamount of carbonate recrystallization. This conclusion is supported by
1050
1050
15501550
Site1129
Site1131
Site1127
7 6 5 4 3 2 1 0
0
100
200
300
400
500
600
700
800
900
Dep
th (
mbs
f)
Distance from Site 1129 (km)
F20. Contour plot showing Cl– variation; Sites 1127, 1129, and 1131, p. 52.
0.8 1
0
100
200
300
400
500
Dep
th (
mbs
f)
Site 1129
0.8 1
Site 1127
0.8 1Na+/Cl–
Site 1131
F21. Na+/Cl– vs. depth; Sites 1127, 1131, and 1129, p. 53.
-30 -20 -10 0
0
100
200
300
400
500
Dep
th (
mbs
f)
Site 1129
-30 -20 -10 0Excess SO
4 2– (mM)
Site 1131
-30 -20 -10 0
Site 1127
F22. Excess SO42–; Sites 1127, 1131,
and 1129, p. 54.
40
90
40
90
40
40
Distance from Site 1129 (km)
Dep
th (
mbs
f)
Site1131
Site1129
Site1127
90 90
100
200
300
400
500
600
700
800
900
7 6 5 4 3 2 01
F23. Contour map of alkalinity; Sites 1127, 1131, and 1129, p. 55.
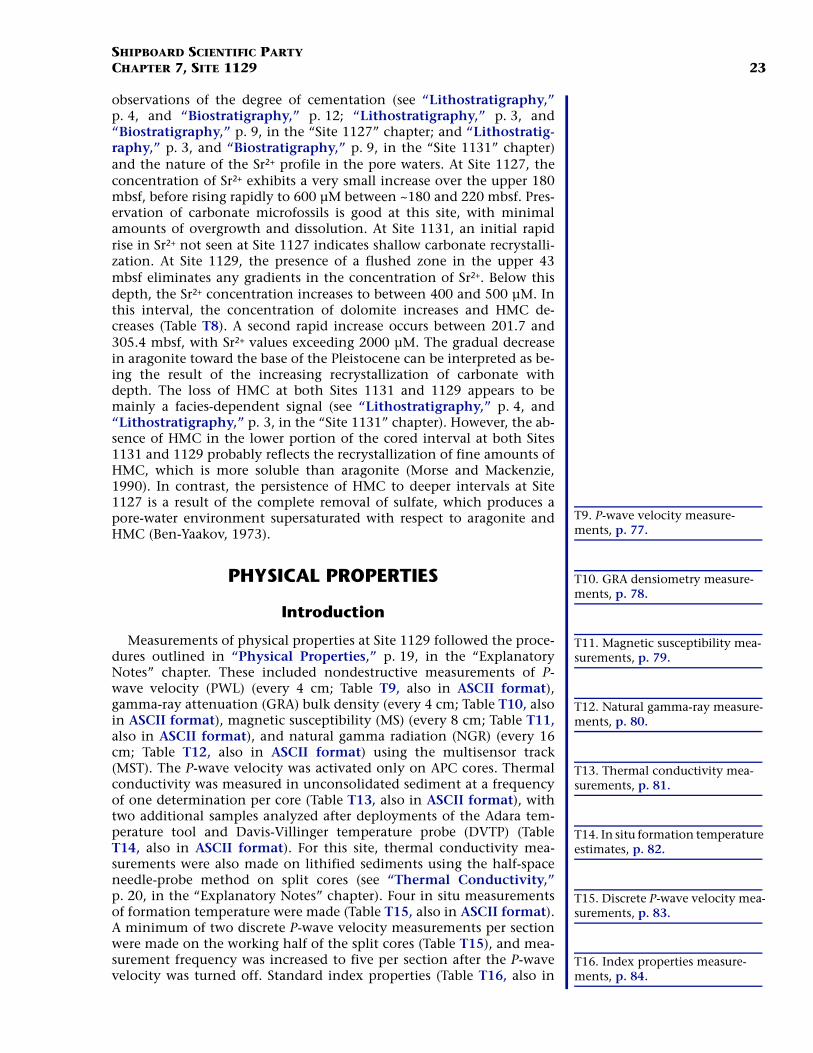
SHIPBOARD SCIENTIFIC PARTYCHAPTER 7, SITE 1129 23
observations of the degree of cementation (see “Lithostratigraphy,”p. 4, and “Biostratigraphy,” p. 12; “Lithostratigraphy,” p. 3, and“Biostratigraphy,” p. 9, in the “Site 1127” chapter; and “Lithostratig-raphy,” p. 3, and “Biostratigraphy,” p. 9, in the “Site 1131” chapter)and the nature of the Sr2+ profile in the pore waters. At Site 1127, theconcentration of Sr2+ exhibits a very small increase over the upper 180mbsf, before rising rapidly to 600 µM between ~180 and 220 mbsf. Pres-ervation of carbonate microfossils is good at this site, with minimalamounts of overgrowth and dissolution. At Site 1131, an initial rapidrise in Sr2+ not seen at Site 1127 indicates shallow carbonate recrystalli-zation. At Site 1129, the presence of a flushed zone in the upper 43mbsf eliminates any gradients in the concentration of Sr2+. Below thisdepth, the Sr2+ concentration increases to between 400 and 500 µM. Inthis interval, the concentration of dolomite increases and HMC de-creases (Table T8). A second rapid increase occurs between 201.7 and305.4 mbsf, with Sr2+ values exceeding 2000 µM. The gradual decreasein aragonite toward the base of the Pleistocene can be interpreted as be-ing the result of the increasing recrystallization of carbonate withdepth. The loss of HMC at both Sites 1131 and 1129 appears to bemainly a facies-dependent signal (see “Lithostratigraphy,” p. 4, and“Lithostratigraphy,” p. 3, in the “Site 1131” chapter). However, the ab-sence of HMC in the lower portion of the cored interval at both Sites1131 and 1129 probably reflects the recrystallization of fine amounts ofHMC, which is more soluble than aragonite (Morse and Mackenzie,1990). In contrast, the persistence of HMC to deeper intervals at Site1127 is a result of the complete removal of sulfate, which produces apore-water environment supersaturated with respect to aragonite andHMC (Ben-Yaakov, 1973).
PHYSICAL PROPERTIES
Introduction
Measurements of physical properties at Site 1129 followed the proce-dures outlined in “Physical Properties,” p. 19, in the “ExplanatoryNotes” chapter. These included nondestructive measurements of P-wave velocity (PWL) (every 4 cm; Table T9, also in ASCII format),gamma-ray attenuation (GRA) bulk density (every 4 cm; Table T10, alsoin ASCII format), magnetic susceptibility (MS) (every 8 cm; Table T11,also in ASCII format), and natural gamma radiation (NGR) (every 16cm; Table T12, also in ASCII format) using the multisensor track(MST). The P-wave velocity was activated only on APC cores. Thermalconductivity was measured in unconsolidated sediment at a frequencyof one determination per core (Table T13, also in ASCII format), withtwo additional samples analyzed after deployments of the Adara tem-perature tool and Davis-Villinger temperature probe (DVTP) (TableT14, also in ASCII format). For this site, thermal conductivity mea-surements were also made on lithified sediments using the half-spaceneedle-probe method on split cores (see “Thermal Conductivity,”p. 20, in the “Explanatory Notes” chapter). Four in situ measurementsof formation temperature were made (Table T15, also in ASCII format).A minimum of two discrete P-wave velocity measurements per sectionwere made on the working half of the split cores (Table T15), and mea-surement frequency was increased to five per section after the P-wavevelocity was turned off. Standard index properties (Table T16, also in
T9. P-wave velocity measure-ments, p. 77.
T10. GRA densiometry measure-ments, p. 78.
T11. Magnetic susceptibility mea-surements, p. 79.
T12. Natural gamma-ray measure-ments, p. 80.
T13. Thermal conductivity mea-surements, p. 81.
T14. In situ formation temperature estimates, p. 82.
T15. Discrete P-wave velocity mea-surements, p. 83.
T16. Index properties measure-ments, p. 84.
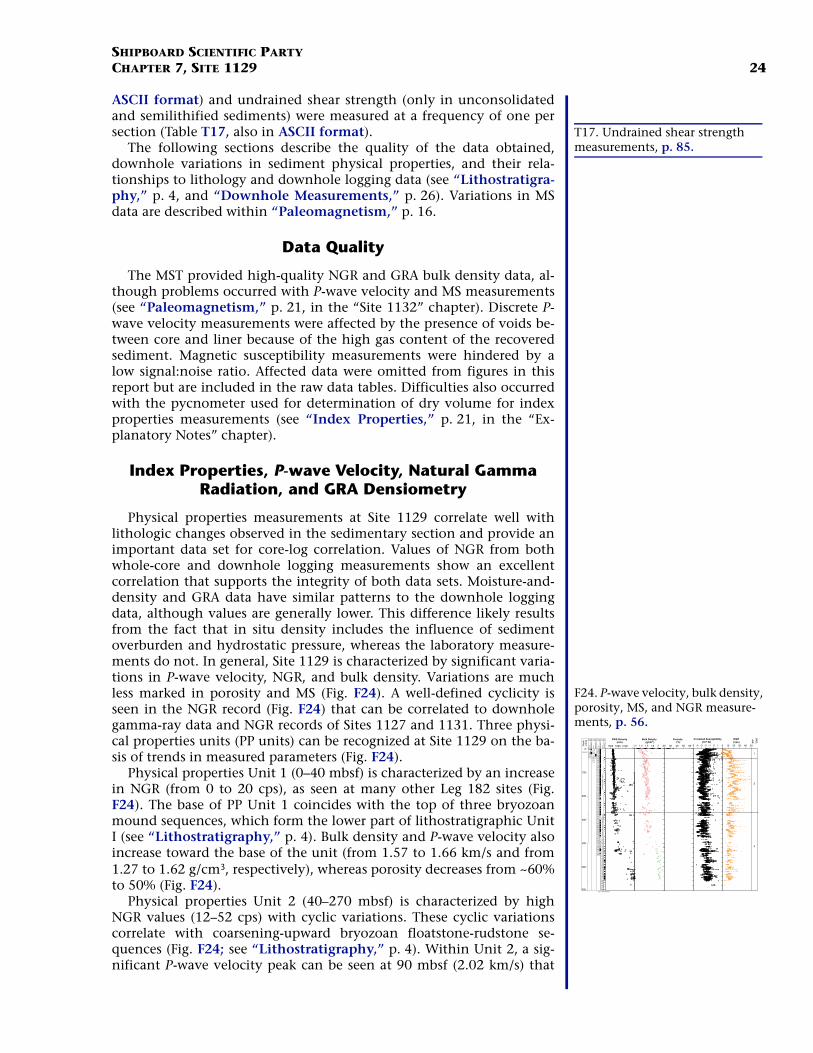
SHIPBOARD SCIENTIFIC PARTYCHAPTER 7, SITE 1129 24
ASCII format) and undrained shear strength (only in unconsolidatedand semilithified sediments) were measured at a frequency of one persection (Table T17, also in ASCII format).
The following sections describe the quality of the data obtained,downhole variations in sediment physical properties, and their rela-tionships to lithology and downhole logging data (see “Lithostratigra-phy,” p. 4, and “Downhole Measurements,” p. 26). Variations in MSdata are described within “Paleomagnetism,” p. 16.
Data Quality
The MST provided high-quality NGR and GRA bulk density data, al-though problems occurred with P-wave velocity and MS measurements(see “Paleomagnetism,” p. 21, in the “Site 1132” chapter). Discrete P-wave velocity measurements were affected by the presence of voids be-tween core and liner because of the high gas content of the recoveredsediment. Magnetic susceptibility measurements were hindered by alow signal:noise ratio. Affected data were omitted from figures in thisreport but are included in the raw data tables. Difficulties also occurredwith the pycnometer used for determination of dry volume for indexproperties measurements (see “Index Properties,” p. 21, in the “Ex-planatory Notes” chapter).
Index Properties, P-wave Velocity, Natural Gamma Radiation, and GRA Densiometry
Physical properties measurements at Site 1129 correlate well withlithologic changes observed in the sedimentary section and provide animportant data set for core-log correlation. Values of NGR from bothwhole-core and downhole logging measurements show an excellentcorrelation that supports the integrity of both data sets. Moisture-and-density and GRA data have similar patterns to the downhole loggingdata, although values are generally lower. This difference likely resultsfrom the fact that in situ density includes the influence of sedimentoverburden and hydrostatic pressure, whereas the laboratory measure-ments do not. In general, Site 1129 is characterized by significant varia-tions in P-wave velocity, NGR, and bulk density. Variations are muchless marked in porosity and MS (Fig. F24). A well-defined cyclicity isseen in the NGR record (Fig. F24) that can be correlated to downholegamma-ray data and NGR records of Sites 1127 and 1131. Three physi-cal properties units (PP units) can be recognized at Site 1129 on the ba-sis of trends in measured parameters (Fig. F24).
Physical properties Unit 1 (0–40 mbsf) is characterized by an increasein NGR (from 0 to 20 cps), as seen at many other Leg 182 sites (Fig.F24). The base of PP Unit 1 coincides with the top of three bryozoanmound sequences, which form the lower part of lithostratigraphic UnitI (see “Lithostratigraphy,” p. 4). Bulk density and P-wave velocity alsoincrease toward the base of the unit (from 1.57 to 1.66 km/s and from1.27 to 1.62 g/cm3, respectively), whereas porosity decreases from ~60%to 50% (Fig. F24).
Physical properties Unit 2 (40–270 mbsf) is characterized by highNGR values (12–52 cps) with cyclic variations. These cyclic variationscorrelate with coarsening-upward bryozoan floatstone-rudstone se-quences (Fig. F24; see “Lithostratigraphy,” p. 4). Within Unit 2, a sig-nificant P-wave velocity peak can be seen at 90 mbsf (2.02 km/s) that
T17. Undrained shear strength measurements, p. 85.
-5 -4 -3 -2 -1 0 1
Corrected Susceptibility (10-6 SI)
0 10 20 30 40 50
NGR(cps)
1
2
3
1500 1800 2100
PWS Velocity (m/s)
Dep
th(m
bsf)
1.2 1.4 1.6 1.8 2
Bulk Density (g/cm3)
20 30 40 50 60
Porosity(%)
100
200
300
400
500
0
600
PP
Uni
t
Dri
lled
0.0-
280.
0 m
bsf
Dri
lled
299.
6-37
3.2
mbs
f
1R
2R
3R
4R
5R
6R
7R
8R
9R
10R
11R
12R
13R
14R
15R
16R
17R
18R
19R
20R
21R
22R
23R
24R
25R26R
T.D. = 604.2 mbsf
26X
27X
28X
29X
30X31X
32X
33X
34X
35X36X37X38X
39X40X
41X
42X
43X
44X
45X
46X
47X
48X
16H
17H
18H
19H
20H21H
22H
23H
24X
25X
6H
7H
8H
9H
10H11H
12H
13H
14H
15H
1H2H
3H
4H5H
1H
2HDrilled
1H
2H
Dril
led
0-22
mbs
f
T.D.=23.3mbsf
T.D.=41.0mbsf
Rec
over
y
Rec
over
y
Rec
over
y
Rec
over
y
Cor
e
Cor
e
Cor
e
Cor
e
1129A 1129B 1129C 1129D
F24. P-wave velocity, bulk density, porosity, MS, and NGR measure-ments, p. 56.
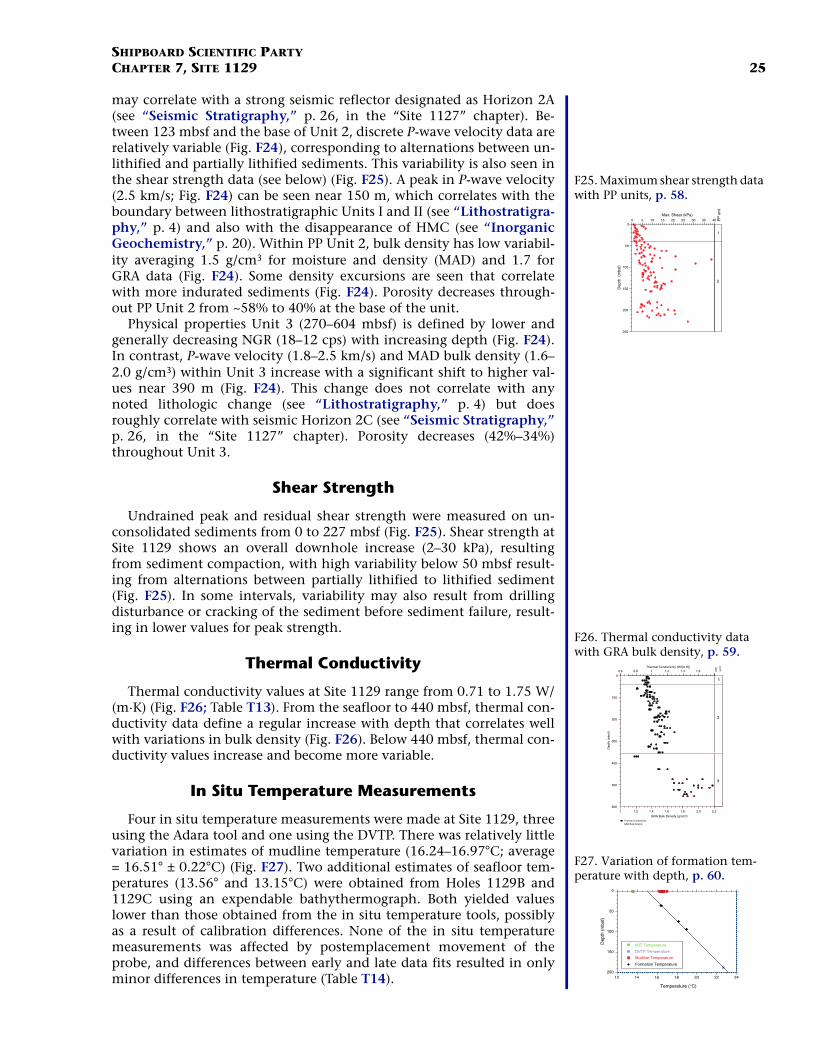
SHIPBOARD SCIENTIFIC PARTYCHAPTER 7, SITE 1129 25
may correlate with a strong seismic reflector designated as Horizon 2A(see “Seismic Stratigraphy,” p. 26, in the “Site 1127” chapter). Be-tween 123 mbsf and the base of Unit 2, discrete P-wave velocity data arerelatively variable (Fig. F24), corresponding to alternations between un-lithified and partially lithified sediments. This variability is also seen inthe shear strength data (see below) (Fig. F25). A peak in P-wave velocity(2.5 km/s; Fig. F24) can be seen near 150 m, which correlates with theboundary between lithostratigraphic Units I and II (see “Lithostratigra-phy,” p. 4) and also with the disappearance of HMC (see “InorganicGeochemistry,” p. 20). Within PP Unit 2, bulk density has low variabil-ity averaging 1.5 g/cm3 for moisture and density (MAD) and 1.7 forGRA data (Fig. F24). Some density excursions are seen that correlatewith more indurated sediments (Fig. F24). Porosity decreases through-out PP Unit 2 from ~58% to 40% at the base of the unit.
Physical properties Unit 3 (270–604 mbsf) is defined by lower andgenerally decreasing NGR (18–12 cps) with increasing depth (Fig. F24).In contrast, P-wave velocity (1.8–2.5 km/s) and MAD bulk density (1.6–2.0 g/cm3) within Unit 3 increase with a significant shift to higher val-ues near 390 m (Fig. F24). This change does not correlate with anynoted lithologic change (see “Lithostratigraphy,” p. 4) but doesroughly correlate with seismic Horizon 2C (see “Seismic Stratigraphy,”p. 26, in the “Site 1127” chapter). Porosity decreases (42%–34%)throughout Unit 3.
Shear Strength
Undrained peak and residual shear strength were measured on un-consolidated sediments from 0 to 227 mbsf (Fig. F25). Shear strength atSite 1129 shows an overall downhole increase (2–30 kPa), resultingfrom sediment compaction, with high variability below 50 mbsf result-ing from alternations between partially lithified to lithified sediment(Fig. F25). In some intervals, variability may also result from drillingdisturbance or cracking of the sediment before sediment failure, result-ing in lower values for peak strength.
Thermal Conductivity
Thermal conductivity values at Site 1129 range from 0.71 to 1.75 W/(m·K) (Fig. F26; Table T13). From the seafloor to 440 mbsf, thermal con-ductivity data define a regular increase with depth that correlates wellwith variations in bulk density (Fig. F26). Below 440 mbsf, thermal con-ductivity values increase and become more variable.
In Situ Temperature Measurements
Four in situ temperature measurements were made at Site 1129, threeusing the Adara tool and one using the DVTP. There was relatively littlevariation in estimates of mudline temperature (16.24–16.97°C; average= 16.51° ± 0.22°C) (Fig. F27). Two additional estimates of seafloor tem-peratures (13.56° and 13.15°C) were obtained from Holes 1129B and1129C using an expendable bathythermograph. Both yielded valueslower than those obtained from the in situ temperature tools, possiblyas a result of calibration differences. None of the in situ temperaturemeasurements was affected by postemplacement movement of theprobe, and differences between early and late data fits resulted in onlyminor differences in temperature (Table T14).
0 5 10 15 20 25 30 35 400
50
100
150
200
250
Max. Shear (kPa)
Dep
th (
mbs
f)
1
2
PP
uni
t
F25. Maximum shear strength data with PP units, p. 58.
0
100
200
300
400
500
600
0.8 1 1.2 1.4 1.6
Dep
th (
mbs
f)
Thermal Conductivity (W/[m·K])
1
2
3
PP
unit
GRA Bulk Density (g/cm3)
1 1.2 1.4 1.6 1.8
0.6
2.0 2.2
Thermal Conductivity GRA Bulk Density
F26. Thermal conductivity data with GRA bulk density, p. 59.
12 14 16 18 20 22 24
0
50
100
150
200
Mudline Temperature
Formation Temperature
DVTP Temperature
XBT Temperature
Temperature (°C)
Dep
th (
mbs
f)
F27. Variation of formation tem-perature with depth, p. 60.
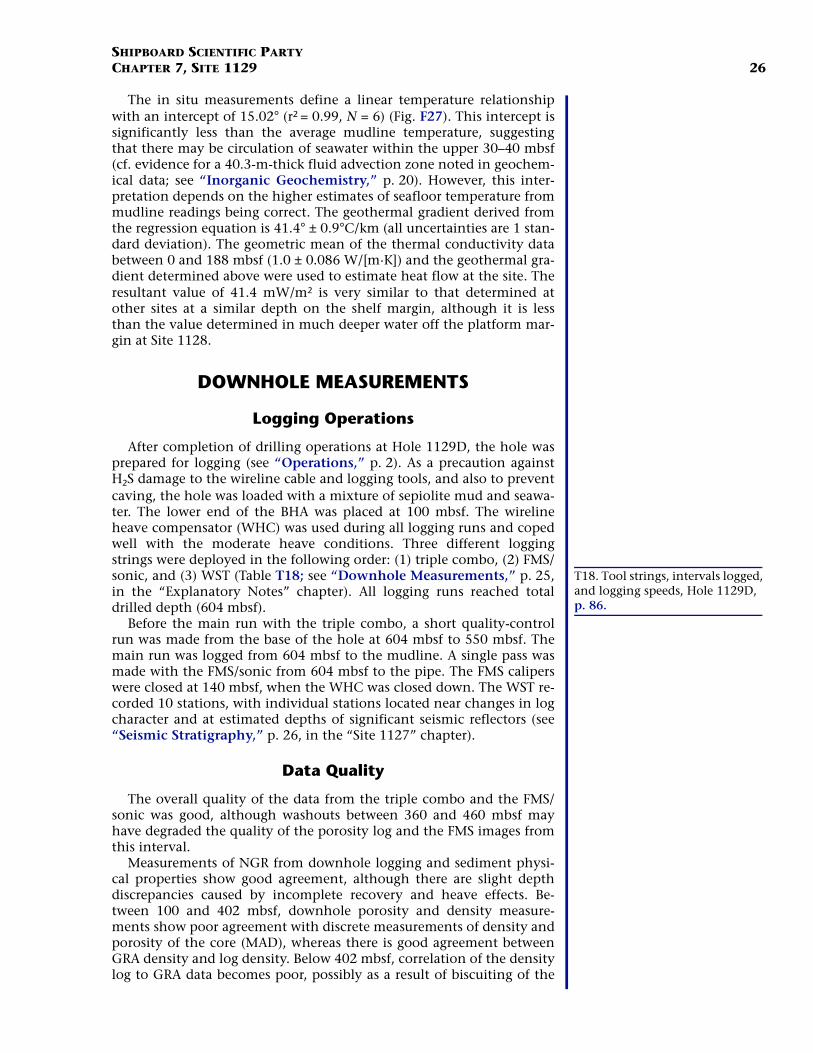
SHIPBOARD SCIENTIFIC PARTYCHAPTER 7, SITE 1129 26
The in situ measurements define a linear temperature relationshipwith an intercept of 15.02° (r2 = 0.99, N = 6) (Fig. F27). This intercept issignificantly less than the average mudline temperature, suggestingthat there may be circulation of seawater within the upper 30–40 mbsf(cf. evidence for a 40.3-m-thick fluid advection zone noted in geochem-ical data; see “Inorganic Geochemistry,” p. 20). However, this inter-pretation depends on the higher estimates of seafloor temperature frommudline readings being correct. The geothermal gradient derived fromthe regression equation is 41.4° ± 0.9°C/km (all uncertainties are 1 stan-dard deviation). The geometric mean of the thermal conductivity databetween 0 and 188 mbsf (1.0 ± 0.086 W/[m·K]) and the geothermal gra-dient determined above were used to estimate heat flow at the site. Theresultant value of 41.4 mW/m2 is very similar to that determined atother sites at a similar depth on the shelf margin, although it is lessthan the value determined in much deeper water off the platform mar-gin at Site 1128.
DOWNHOLE MEASUREMENTS
Logging Operations
After completion of drilling operations at Hole 1129D, the hole wasprepared for logging (see “Operations,” p. 2). As a precaution againstH2S damage to the wireline cable and logging tools, and also to preventcaving, the hole was loaded with a mixture of sepiolite mud and seawa-ter. The lower end of the BHA was placed at 100 mbsf. The wirelineheave compensator (WHC) was used during all logging runs and copedwell with the moderate heave conditions. Three different loggingstrings were deployed in the following order: (1) triple combo, (2) FMS/sonic, and (3) WST (Table T18; see “Downhole Measurements,” p. 25,in the “Explanatory Notes” chapter). All logging runs reached totaldrilled depth (604 mbsf).
Before the main run with the triple combo, a short quality-controlrun was made from the base of the hole at 604 mbsf to 550 mbsf. Themain run was logged from 604 mbsf to the mudline. A single pass wasmade with the FMS/sonic from 604 mbsf to the pipe. The FMS caliperswere closed at 140 mbsf, when the WHC was closed down. The WST re-corded 10 stations, with individual stations located near changes in logcharacter and at estimated depths of significant seismic reflectors (see“Seismic Stratigraphy,” p. 26, in the “Site 1127” chapter).
Data Quality
The overall quality of the data from the triple combo and the FMS/sonic was good, although washouts between 360 and 460 mbsf mayhave degraded the quality of the porosity log and the FMS images fromthis interval.
Measurements of NGR from downhole logging and sediment physi-cal properties show good agreement, although there are slight depthdiscrepancies caused by incomplete recovery and heave effects. Be-tween 100 and 402 mbsf, downhole porosity and density measure-ments show poor agreement with discrete measurements of density andporosity of the core (MAD), whereas there is good agreement betweenGRA density and log density. Below 402 mbsf, correlation of the densitylog to GRA data becomes poor, possibly as a result of biscuiting of the
T18. Tool strings, intervals logged, and logging speeds, Hole 1129D, p. 86.
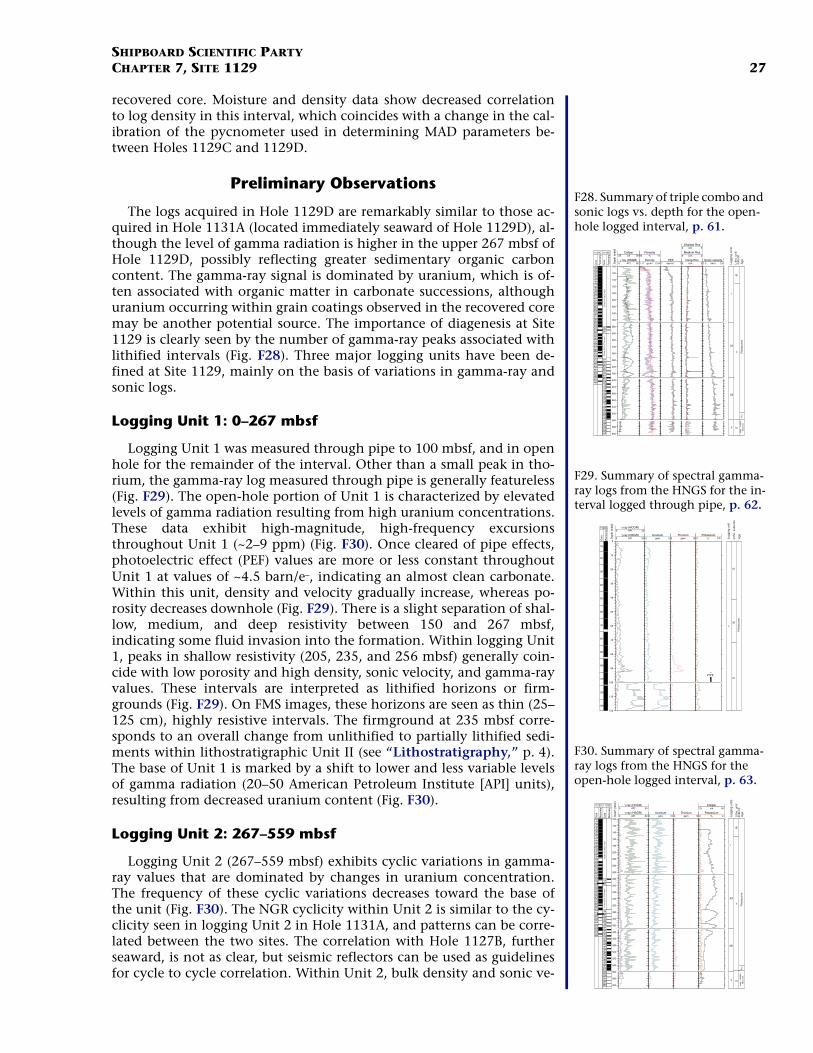
SHIPBOARD SCIENTIFIC PARTYCHAPTER 7, SITE 1129 27
recovered core. Moisture and density data show decreased correlationto log density in this interval, which coincides with a change in the cal-ibration of the pycnometer used in determining MAD parameters be-tween Holes 1129C and 1129D.
Preliminary Observations
The logs acquired in Hole 1129D are remarkably similar to those ac-quired in Hole 1131A (located immediately seaward of Hole 1129D), al-though the level of gamma radiation is higher in the upper 267 mbsf ofHole 1129D, possibly reflecting greater sedimentary organic carboncontent. The gamma-ray signal is dominated by uranium, which is of-ten associated with organic matter in carbonate successions, althoughuranium occurring within grain coatings observed in the recovered coremay be another potential source. The importance of diagenesis at Site1129 is clearly seen by the number of gamma-ray peaks associated withlithified intervals (Fig. F28). Three major logging units have been de-fined at Site 1129, mainly on the basis of variations in gamma-ray andsonic logs.
Logging Unit 1: 0–267 mbsf
Logging Unit 1 was measured through pipe to 100 mbsf, and in openhole for the remainder of the interval. Other than a small peak in tho-rium, the gamma-ray log measured through pipe is generally featureless(Fig. F29). The open-hole portion of Unit 1 is characterized by elevatedlevels of gamma radiation resulting from high uranium concentrations.These data exhibit high-magnitude, high-frequency excursionsthroughout Unit 1 (~2–9 ppm) (Fig. F30). Once cleared of pipe effects,photoelectric effect (PEF) values are more or less constant throughoutUnit 1 at values of ~4.5 barn/e–, indicating an almost clean carbonate.Within this unit, density and velocity gradually increase, whereas po-rosity decreases downhole (Fig. F29). There is a slight separation of shal-low, medium, and deep resistivity between 150 and 267 mbsf,indicating some fluid invasion into the formation. Within logging Unit1, peaks in shallow resistivity (205, 235, and 256 mbsf) generally coin-cide with low porosity and high density, sonic velocity, and gamma-rayvalues. These intervals are interpreted as lithified horizons or firm-grounds (Fig. F29). On FMS images, these horizons are seen as thin (25–125 cm), highly resistive intervals. The firmground at 235 mbsf corre-sponds to an overall change from unlithified to partially lithified sedi-ments within lithostratigraphic Unit II (see “Lithostratigraphy,” p. 4).The base of Unit 1 is marked by a shift to lower and less variable levelsof gamma radiation (20–50 American Petroleum Institute [API] units),resulting from decreased uranium content (Fig. F30).
Logging Unit 2: 267–559 mbsf
Logging Unit 2 (267–559 mbsf) exhibits cyclic variations in gamma-ray values that are dominated by changes in uranium concentration.The frequency of these cyclic variations decreases toward the base ofthe unit (Fig. F30). The NGR cyclicity within Unit 2 is similar to the cy-clicity seen in logging Unit 2 in Hole 1131A, and patterns can be corre-lated between the two sites. The correlation with Hole 1127B, furtherseaward, is not as clear, but seismic reflectors can be used as guidelinesfor cycle to cycle correlation. Within Unit 2, bulk density and sonic ve-
Dep
th (
mbs
f)
1R2R
3R4R5R6R7R8R9R10R11R12R13R14R15R16R17R18R19R20R21R22R23R24R25R26R
100
120
140
160
180
200
220
240
260
280
300
320
340
360
380
400
420
440
460
480
500
520
540
560
580
600
0 80APIγ ray (HSGR)
25 50cmCaliper
1.17 2.54g/cm3Density
90 10%Porosity
1 7barn/e–PEF
0 2ΩmDeep Res.
0 2ΩmMedium Res.
0 2ΩmShallow Res.
1.5 3.5km/sSonic velocity
11H12H13H14H15H16H17H18H19H20H21H22H23H24X25X26X27X28X29X30X31X32X33X34X35X36X37X38X39X40X41X42X43X44X45X46X47X48X
1129C 1129D
Dril
led
299.
6-37
3.2
mbs
fD
rille
d 0.
0-28
0.0
mbs
f
Logg
ing
units
Lith
o. u
nit/
subu
nit
Age
3
Ple
isto
cene
II
IE
III
early
- m
iddl
e
Mio
cene
Plio
.
2B
2A
1
Rec
over
y
Cor
e
Rec
over
y
Cor
e
F28. Summary of triple combo and sonic logs vs. depth for the open-hole logged interval, p. 61.
Dep
th (
mbs
f)
1H
2H
3H
4H
5H
6H
7H
8H
9H
10H
11H
12H
13H
0
10
20
30
40
50
60
70
80
90
100
110
120
0 50APIγ ray (HSGR)
0 50APIγ ray (HCGR)
0 6ppmUranium
0 10ppmThorium
0 0.8%Potassium
1129C
Ple
isto
cene
IC
IA
IB
Logg
ing
unit
Lith
o. s
ubun
its
Age
1
PIPE
Rec
over
y
Cor
e
F29. Summary of spectral gamma-ray logs from the HNGS for the in-terval logged through pipe, p. 62.
Dep
th (
mbs
f)
1R2R
3R4R5R6R7R8R9R10R11R12R13R14R15R16R17R18R19R20R21R22R23R24R25R26R
100
120
140
160
180
200
220
240
260
280
300
320
340
360
380
400
420
440
460
480
500
520
540
560
580
600
0 80APIγ ray (HSGR)
0 90APIγ ray (HCGR)
0 10ppmUranium
0 16ppmThorium
0 2%Potassium
25 50cmCaliper
11H12H13H14H15H16H17H18H19H20H21H22H23H24X25X26X27X28X29X30X31X32X33X34X35X36X37X38X39X40X41X42X43X44X45X46X47X48X
Logg
ing
units
Lith
o. u
nit/
subu
nit
Age
3
Ple
isto
cene
II
IE
Dril
led
299.
6-37
3.2
mbs
fD
rille
d 0.
0-28
0.0
mbs
f
III
early
- m
iddl
e
Mio
cene
Plio
.
2B
2A
1
Rec
over
y
Cor
e
Rec
over
y
Cor
e
1129C 1129D
F30. Summary of spectral gamma-ray logs from the HNGS for the open-hole logged interval, p. 63.
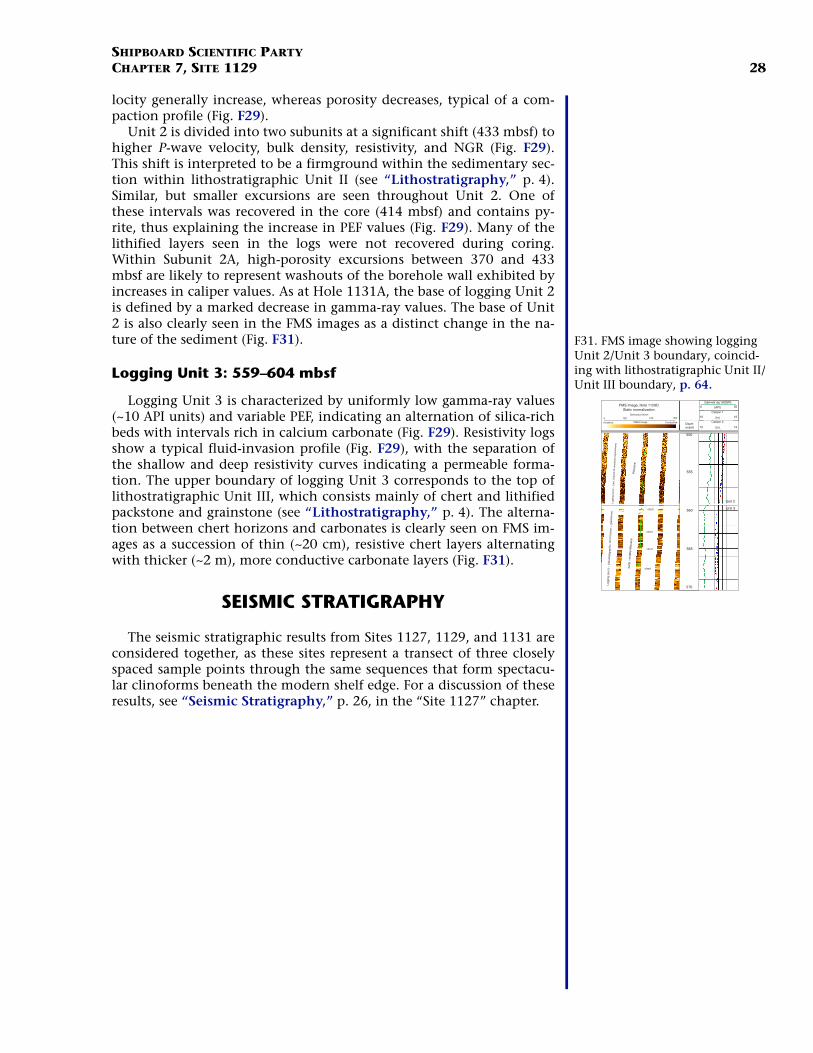
SHIPBOARD SCIENTIFIC PARTYCHAPTER 7, SITE 1129 28
locity generally increase, whereas porosity decreases, typical of a com-paction profile (Fig. F29).
Unit 2 is divided into two subunits at a significant shift (433 mbsf) tohigher P-wave velocity, bulk density, resistivity, and NGR (Fig. F29).This shift is interpreted to be a firmground within the sedimentary sec-tion within lithostratigraphic Unit II (see “Lithostratigraphy,” p. 4).Similar, but smaller excursions are seen throughout Unit 2. One ofthese intervals was recovered in the core (414 mbsf) and contains py-rite, thus explaining the increase in PEF values (Fig. F29). Many of thelithified layers seen in the logs were not recovered during coring.Within Subunit 2A, high-porosity excursions between 370 and 433mbsf are likely to represent washouts of the borehole wall exhibited byincreases in caliper values. As at Hole 1131A, the base of logging Unit 2is defined by a marked decrease in gamma-ray values. The base of Unit2 is also clearly seen in the FMS images as a distinct change in the na-ture of the sediment (Fig. F31).
Logging Unit 3: 559–604 mbsf
Logging Unit 3 is characterized by uniformly low gamma-ray values(~10 API units) and variable PEF, indicating an alternation of silica-richbeds with intervals rich in calcium carbonate (Fig. F29). Resistivity logsshow a typical fluid-invasion profile (Fig. F29), with the separation ofthe shallow and deep resistivity curves indicating a permeable forma-tion. The upper boundary of logging Unit 3 corresponds to the top oflithostratigraphic Unit III, which consists mainly of chert and lithifiedpackstone and grainstone (see “Lithostratigraphy,” p. 4). The alterna-tion between chert horizons and carbonates is clearly seen on FMS im-ages as a succession of thin (~20 cm), resistive chert layers alternatingwith thicker (~2 m), more conductive carbonate layers (Fig. F31).
SEISMIC STRATIGRAPHY
The seismic stratigraphic results from Sites 1127, 1129, and 1131 areconsidered together, as these sites represent a transect of three closelyspaced sample points through the same sequences that form spectacu-lar clinoforms beneath the modern shelf edge. For a discussion of theseresults, see “Seismic Stratigraphy,” p. 26, in the “Site 1127” chapter.
FMS Image, Hole 1129DStatic normalization
Orientation North
0 120 240 360
FMS4 ImageResistive Conductive Depth(mbsf)
555
560
565
570
550
0 50
10 16(in)
(in)10
Caliper 1
Gamma ray (HSGR)
(API)
Caliper 2
16
Logg
ing
Uni
t 3 ~
Lith
ostr
atig
raph
ic. U
nit I
II (c
hert
+ g
rain
ston
e)Lo
ggin
g U
nit 2
~ L
itho.
Sub
unit
IIE (
wac
kest
one/
pack
ston
e)
chert
chert
chert
chertearly
- m
iddl
e M
ioce
neP
lioce
ne
Unit 2
Unit 3
F31. FMS image showing logging Unit 2/Unit 3 boundary, coincid-ing with lithostratigraphic Unit II/Unit III boundary, p. 64.
SHIPBOARD SCIENTIFIC PARTYCHAPTER 7, SITE 1129 29
REFERENCES
Ben-Yaakov, S., 1973. pH buffering of pore water of recent anoxic marine sediments.Limnol. Oceanogr., 18:86–94.
Berggren, W.A., Kent, D.V., Swisher, C.C., III, and Aubry, M.-P., 1995. A revised Ceno-zoic geochronology and chronostratigraphy. In Berggren, W.A., Kent, D.V., Aubry,M.-P., and Hardenbol, J. (Eds.), Geochronology, Time Scales and Global StratigraphicCorrelation. Spec. Publ.—Soc. Econ. Paleontol. Mineral. (Soc. Sediment. Geol.),54:129–212.
Bone, Y., and James, N.P., 1993. Bryozoans as carbonate sediment producers on thecool-water Lacepede Shelf, Southern Australia. Sediment. Geol., 86:247–271.
Cisowski, S., 1981. Interacting vs. non-interacting single domain behavior in naturaland synthetic samples. Phys. Earth Planet. Inter., 26:56–62.
Eberli, G.P., Swart, P.K., Malone, M.J., et al., 1997. Proc. ODP, Init. Repts., 166: CollegeStation, TX (Ocean Drilling Program).
Feary, D.A., and James, N.P., 1995. Cenozoic biogenic mounds and buried Miocene(?) barrier reef on a predominantly cool-water carbonate continental margin, EuclaBasin, western Great Australian Bight. Geology, 23:427–430.
————, 1998. Seismic stratigraphy and geological evolution of the Cenozoic, cool-water, Eucla Platform, Great Australian Bight. AAPG Bull., 82:792–816.
James, N.P., and von der Borch, C.C., 1991. Carbonate shelf edge off southern Austra-lia: a prograding open-platform margin. Geology, 19:1005–1008.
Jenkins, D.G., 1985. Southern mid-latitude Paleocene to Holocene planktic foramin-ifera. In Bolli, H.M., Saunders, J.B., and Perch-Nielsen, K. (Eds.), Plankton Stratigra-phy: Cambridge (Cambridge Univ. Press), 263–282.
————, 1993. Cenozoic Southern mid- and high-latitude biostratigraphy and chro-nostratigraphy based on planktonic foraminifera. In Kennett, J.P., and Warnke,D.A. (Eds.), The Antarctic Paleoenvironment: A Perspective on Global Change. Antarct.Res. Ser., 60:125–144.
Karlin, R., and Levi, S., 1983. Diagenesis of magnetic minerals in recent hemipelagicsediments. Nature, 303:327–330.
Morse, J.W., and Mackenzie, F.T., 1990. Geochemistry of Sedimentary Carbonates:Amsterdam (Elsevier).
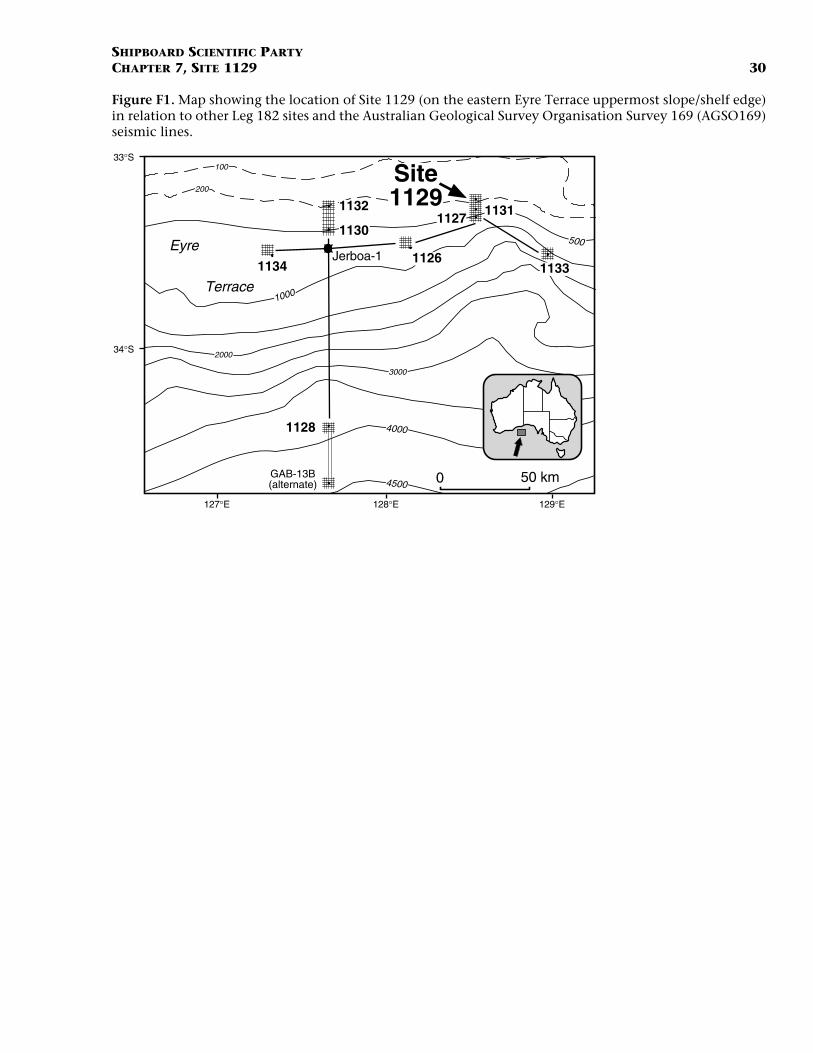
SHIPBOARD SCIENTIFIC PARTYCHAPTER 7, SITE 1129 30
Figure F1. Map showing the location of Site 1129 (on the eastern Eyre Terrace uppermost slope/shelf edge)in relation to other Leg 182 sites and the Australian Geological Survey Organisation Survey 169 (AGSO169)seismic lines.
4000
3000
2000
1000
500
200
127°E 129°E128°E
34°S
33°S
EyreJerboa-1
Terrace
100
0 50 km
1132
4500GAB-13B(alternate)
1127
1126
1128
1131
1130
Site1129
11331134
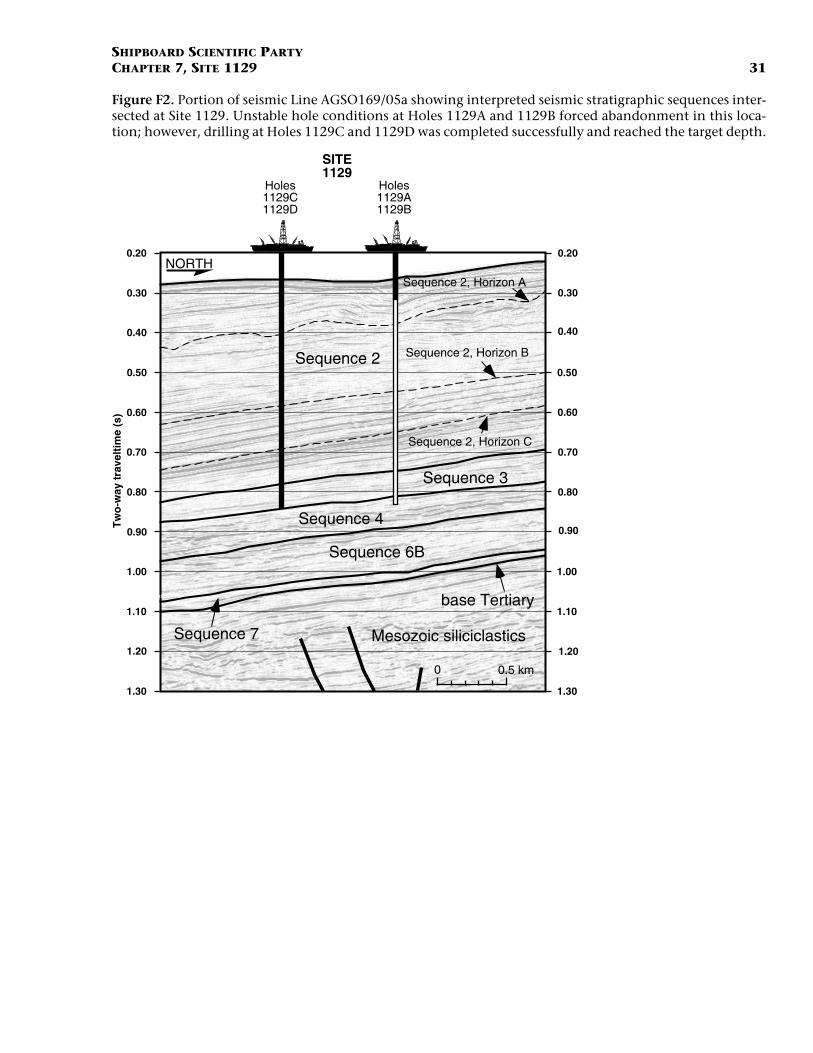
SHIPBOARD SCIENTIFIC PARTYCHAPTER 7, SITE 1129 31
Figure F2. Portion of seismic Line AGSO169/05a showing interpreted seismic stratigraphic sequences inter-sected at Site 1129. Unstable hole conditions at Holes 1129A and 1129B forced abandonment in this loca-tion; however, drilling at Holes 1129C and 1129D was completed successfully and reached the target depth.
base Tertiary
Sequence 7
SITE1129
Holes1129C1129D
Holes1129A1129B
0.5 km0
NORTHSequence 2, Horizon A
Sequence 2, Horizon C
Sequence 2, Horizon B
Sequence 3
Sequence 2
Sequence 4
Sequence 6B
Mesozoic siliciclastics
Tw
o-w
ay t
rave
ltim
e (s
)
0.20
0.30
0.40
0.50
0.60
0.70
0.80
0.90
1.00
1.10
1.20
1.30
0.20
0.30
0.40
0.50
0.60
0.70
0.80
0.90
1.00
1.10
1.20
1.30
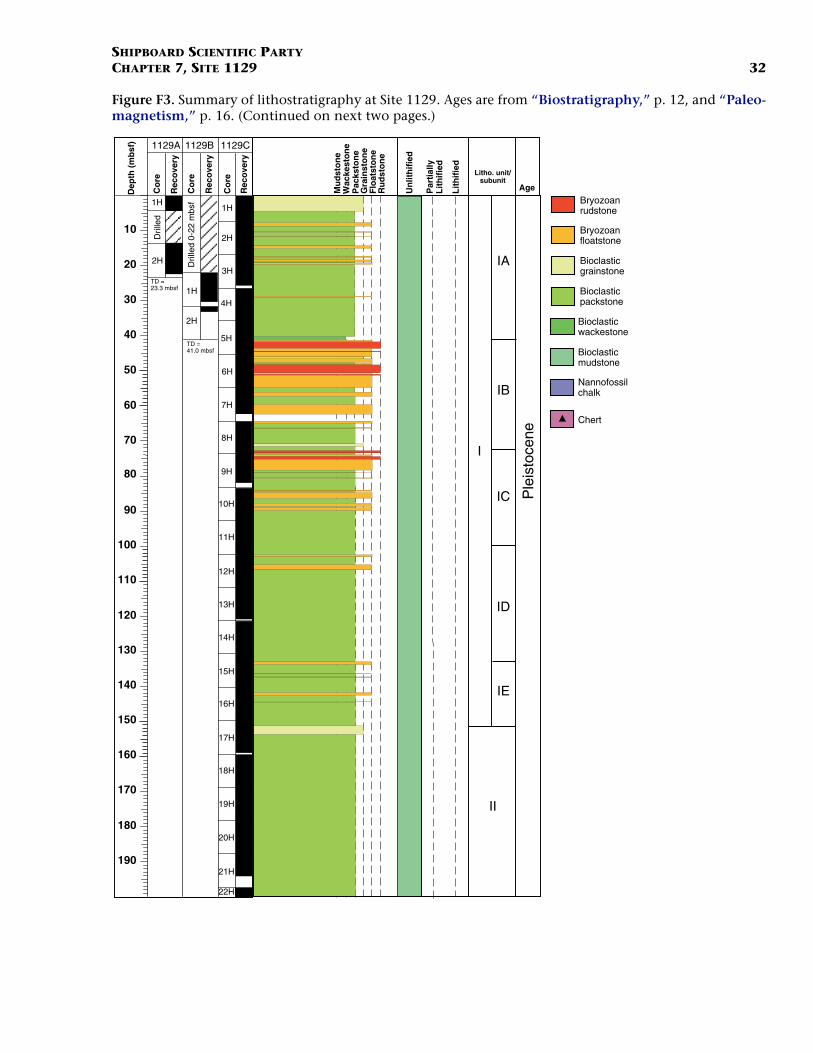
SHIPBOARD SCIENTIFIC PARTYCHAPTER 7, SITE 1129 32
Figure F3. Summary of lithostratigraphy at Site 1129. Ages are from “Biostratigraphy,” p. 12, and “Paleo-magnetism,” p. 16. (Continued on next two pages.)
Mu
dst
on
e
Pac
ksto
ne
Gra
inst
on
eF
loat
sto
ne
Ru
dst
on
e
Wac
kest
on
e
Un
lith
ifie
d
Par
tial
lyL
ith
ifie
d
Lit
hif
ied
Age
Ple
isto
cene
10
20
30
40
50
60
70
80
90
100
110
120
130
140
150
160
170
180
190
1129A
1H
2H
Dril
led
TD =23.3 mbsf
1129B
1H
2H
TD =41.0 mbsf
Dril
led
0-22
mbs
f
1H
2H
3H
4H
5H
6H
7H
8H
9H
10H
11H
12H
13H
14H
15H
16H
17H
18H
19H
20H
21H
22H
1129C
Dep
th (
mb
sf)
Co
re
Co
re
Co
re
Rec
ove
ry
Rec
ove
ry
Rec
ove
ry
Bryozoanrudstone
Bryozoanfloatstone
Bioclasticgrainstone
Bioclasticpackstone
Bioclasticwackestone
Bioclasticmudstone
Nannofossilchalk
Chert
I
IA
IB
IC
ID
IE
II
Litho. unit/subunit
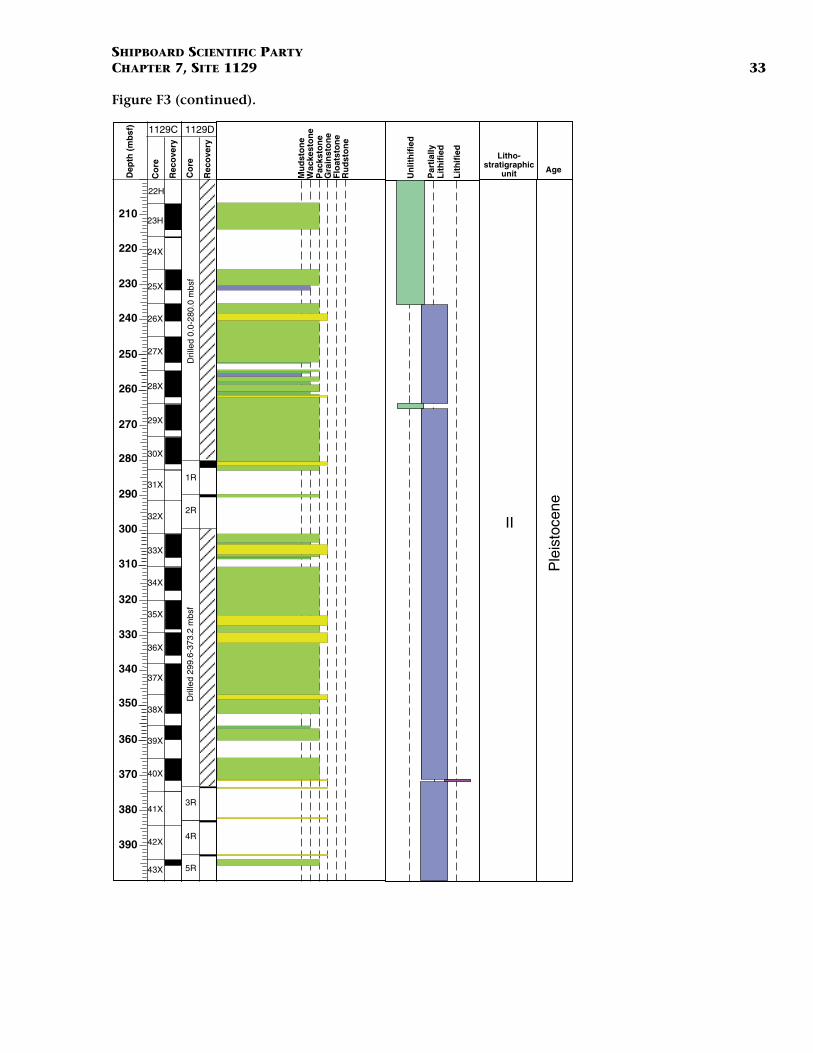
SHIPBOARD SCIENTIFIC PARTYCHAPTER 7, SITE 1129 33
Figure F3 (continued).
Ple
isto
cene
210
220
230
240
250
260
270
280
290
300
310
320
330
340
350
360
370
380
390
22H
1129C
23H
24X
25X
26X
27X
28X
29X
30X
31X
32X
33X
34X
35X
36X
37X
38X
39X
40X
41X
42X
43X
1129D
Dril
led
0.0-
280.
0 m
bsf
1R
2R
Dril
led
299.
6-37
3.2
mbs
f
3R
4R
5R
Dep
th (
mb
sf)
Co
re
Co
re
Rec
ove
ry
Rec
ove
ry
Mu
dst
on
e
Pac
ksto
ne
Gra
inst
on
eF
loat
sto
ne
Ru
dst
on
e
Wac
kest
on
e
Un
lith
ifie
d
Par
tial
lyL
ith
ifie
d
Lit
hif
ied
Litho-stratigraphic
unit Age
II
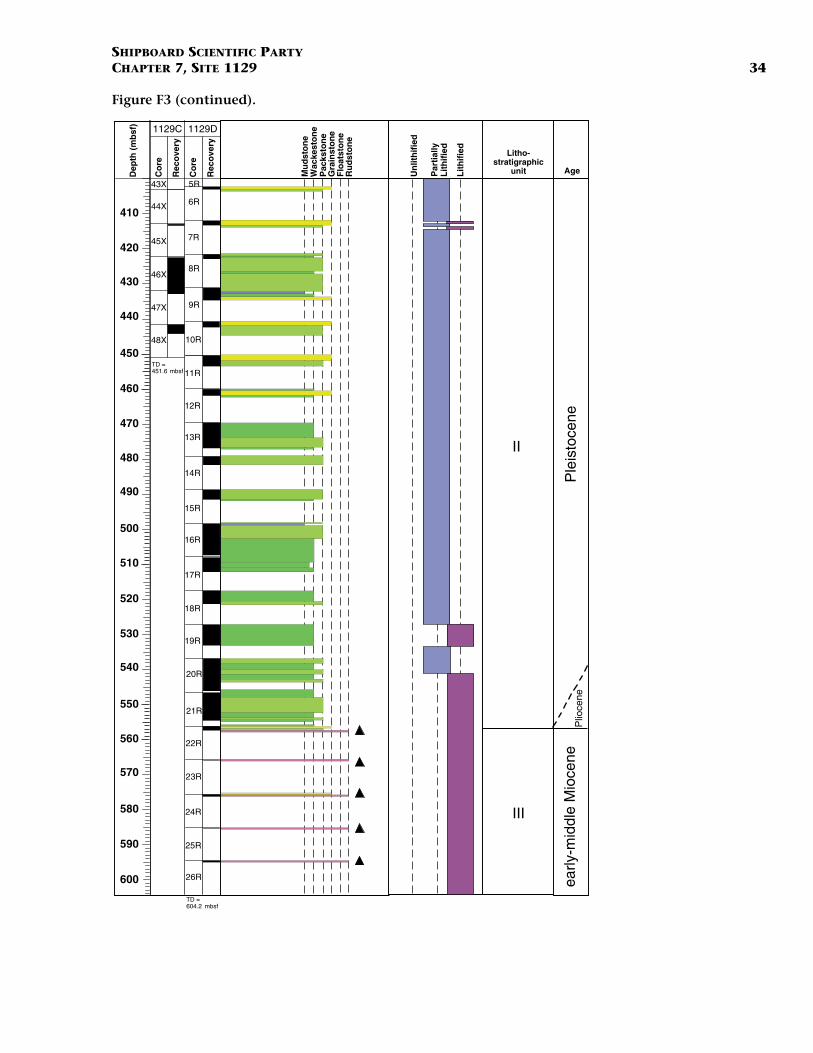
SHIPBOARD SCIENTIFIC PARTYCHAPTER 7, SITE 1129 34
Figure F3 (continued).
II
early
-mid
dle
Mio
cene
P
leis
toce
ne
43X
44X
45X
46X
47X
48X
TD =604.2 mbsf
5R
410
420
430
440
450
460
470
480
490
500
510
520
530
540
550
560
570
580
590
1129C 1129D
6R
7R
8R
9R
10R
11R
12R
13R
14R
15R
16R
17R
18R
19R
20R
21R
22R
23R
24R
25R
26R600
Plio
cene
Mu
dst
on
e
Pac
ksto
ne
Gra
inst
on
eF
loat
sto
ne
Ru
dst
on
e
Wac
kest
on
e
Un
lith
ifie
d
Par
tial
lyL
ith
ifie
d
Lit
hif
ied
AgeDep
th (
mb
sf)
Co
re
Co
re
Rec
ove
ry
Rec
ove
ry
Litho-stratigraphic
unit
III
TD =451.6 mbsf
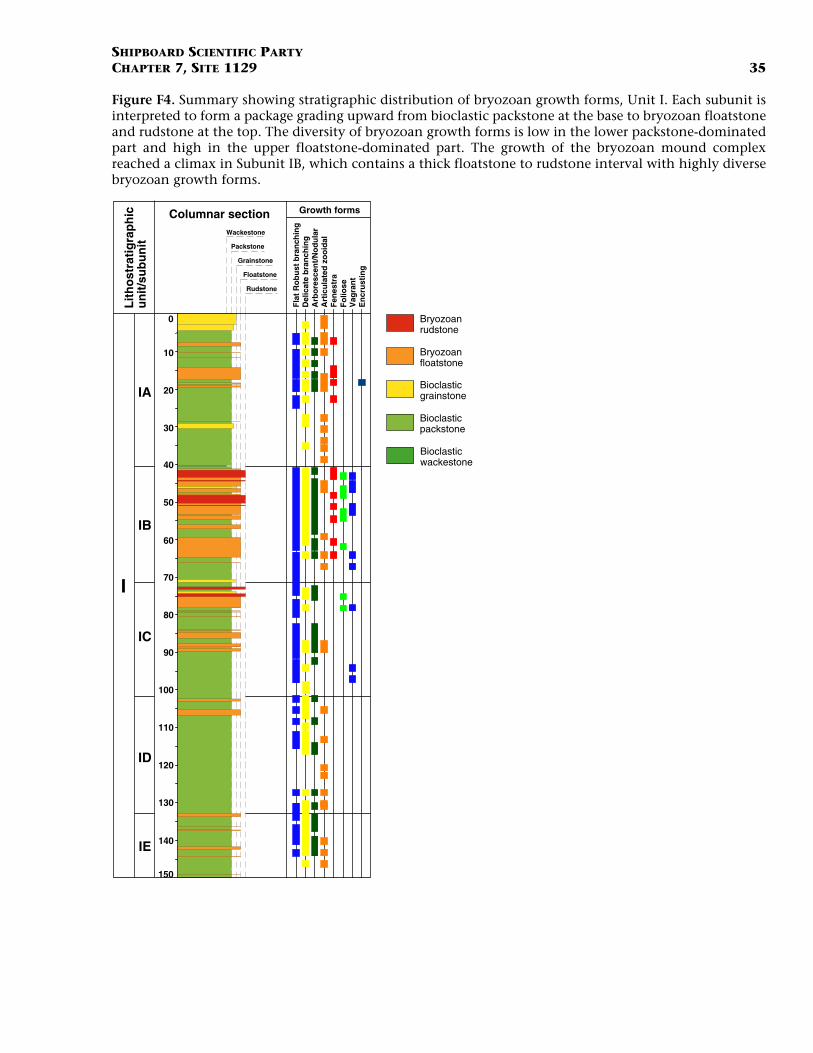
SHIPBOARD SCIENTIFIC PARTYCHAPTER 7, SITE 1129 35
Figure F4. Summary showing stratigraphic distribution of bryozoan growth forms, Unit I. Each subunit isinterpreted to form a package grading upward from bioclastic packstone at the base to bryozoan floatstoneand rudstone at the top. The diversity of bryozoan growth forms is low in the lower packstone-dominatedpart and high in the upper floatstone-dominated part. The growth of the bryozoan mound complexreached a climax in Subunit IB, which contains a thick floatstone to rudstone interval with highly diversebryozoan growth forms.
Fen
estr
aF
olio
se
Fla
t R
ob
ust
bra
nch
ing
Del
icat
e b
ran
chin
g
Art
icu
late
d z
oo
idal
Vag
ran
tE
ncr
ust
ing
Arb
ore
scen
t/N
od
ula
r
150
140
130
120
110
100
90
80
70
60
50
40
30
20
10
0
I
ID
IC
IA
IE
IB
Growth forms
Lit
ho
stra
tig
rap
hic
un
it/s
ub
un
it Packstone
Grainstone
Floatstone
Rudstone
Columnar sectionWackestone
Bryozoanrudstone
Bryozoanfloatstone
Bioclasticgrainstone
Bioclasticpackstone
Bioclasticwackestone
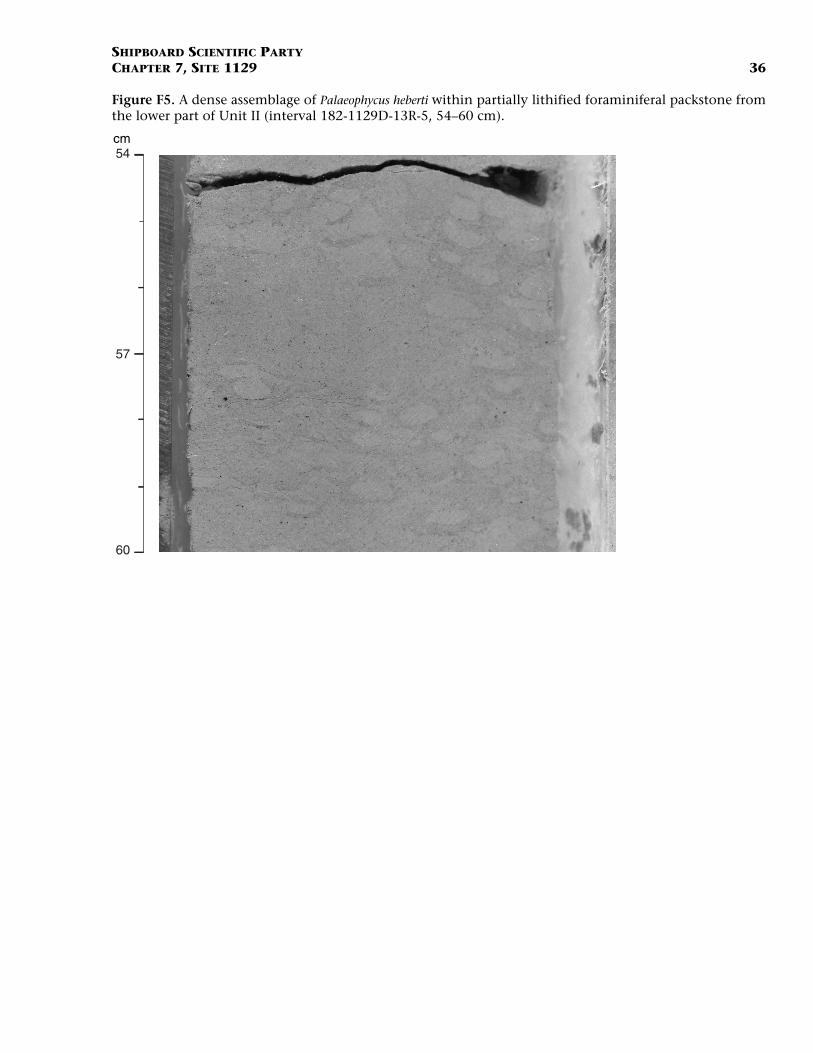
SHIPBOARD SCIENTIFIC PARTYCHAPTER 7, SITE 1129 36
Figure F5. A dense assemblage of Palaeophycus heberti within partially lithified foraminiferal packstone fromthe lower part of Unit II (interval 182-1129D-13R-5, 54–60 cm).
cm54
60
57
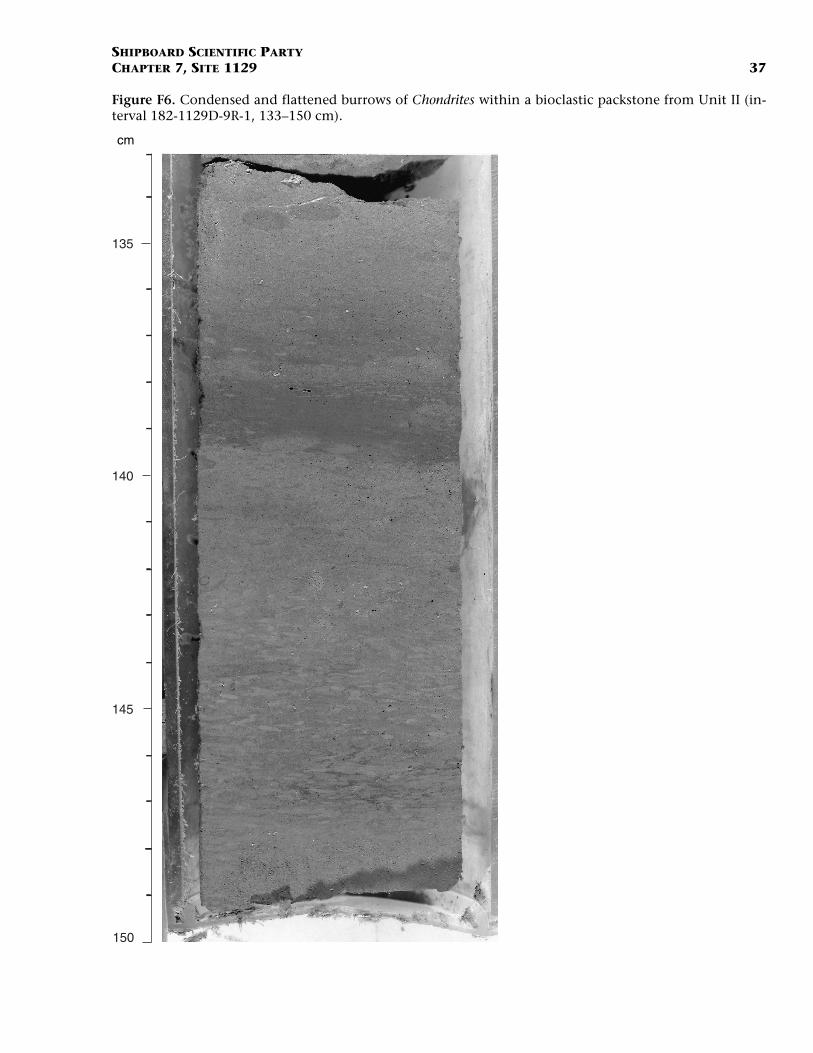
SHIPBOARD SCIENTIFIC PARTYCHAPTER 7, SITE 1129 37
Figure F6. Condensed and flattened burrows of Chondrites within a bioclastic packstone from Unit II (in-terval 182-1129D-9R-1, 133–150 cm).
cm
135
140
145
150
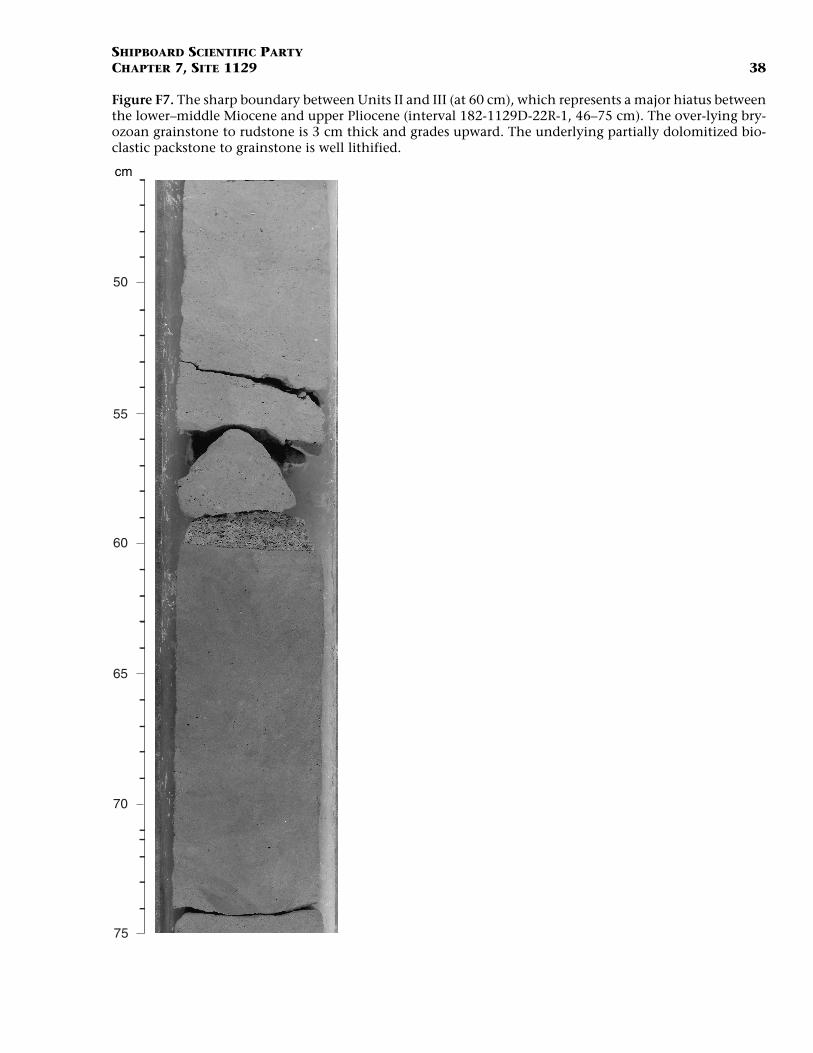
SHIPBOARD SCIENTIFIC PARTYCHAPTER 7, SITE 1129 38
Figure F7. The sharp boundary between Units II and III (at 60 cm), which represents a major hiatus betweenthe lower–middle Miocene and upper Pliocene (interval 182-1129D-22R-1, 46–75 cm). The over-lying bry-ozoan grainstone to rudstone is 3 cm thick and grades upward. The underlying partially dolomitized bio-clastic packstone to grainstone is well lithified.
cm
50
55
60
65
70
75
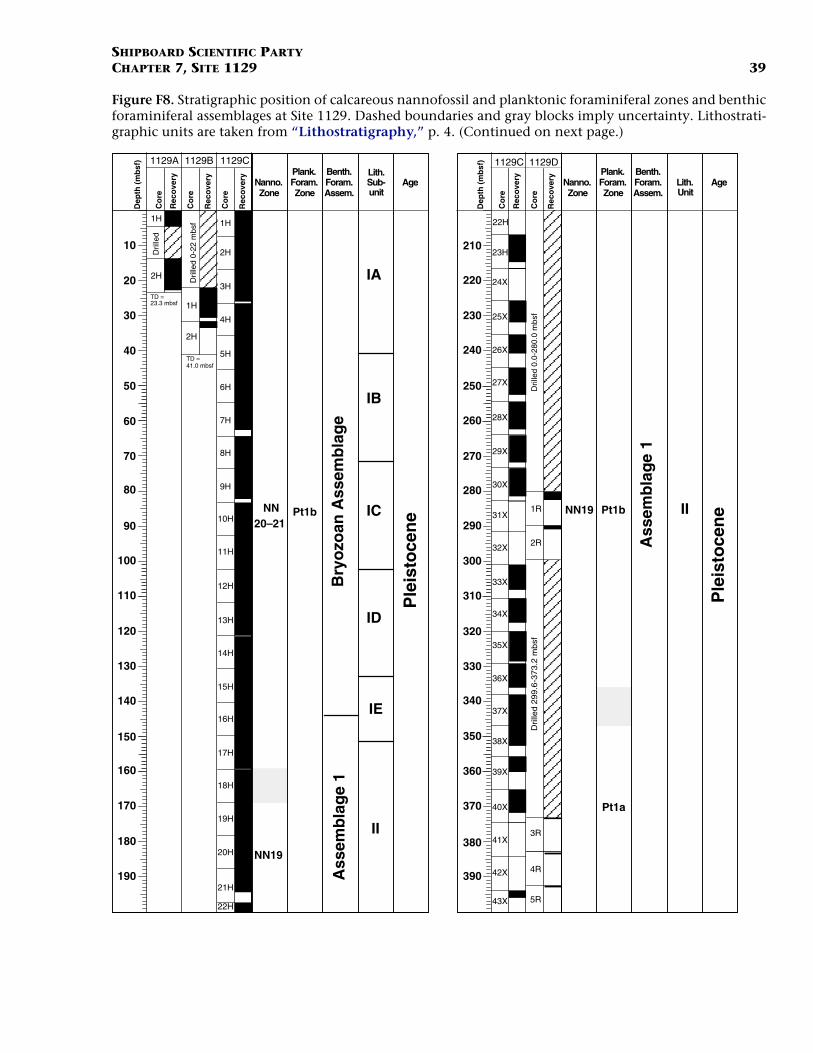
SHIPBOARD SCIENTIFIC PARTYCHAPTER 7, SITE 1129 39
Figure F8. Stratigraphic position of calcareous nannofossil and planktonic foraminiferal zones and benthicforaminiferal assemblages at Site 1129. Dashed boundaries and gray blocks imply uncertainty. Lithostrati-graphic units are taken from “Lithostratigraphy,” p. 4. (Continued on next page.)
Dep
th (
mb
sf)
NN20–21
Pt1b
NN19
10
20
30
40
50
60
70
80
90
100
110
120
130
140
150
160
170
180
190
1129A
1H
2H
TD =23.3 mbsf
1129B
1H
2H
TD =41.0 mbsf
1H
2H
3H
4H
5H
6H
7H
8H
9H
10H
11H
12H
13H
14H
15H
16H
17H
18H
19H
20H
21H
22H
1129C
IA
IC
ID
IE
IB
II
Co
re
Rec
ove
ry
Co
re
Rec
ove
ry
Co
re
Rec
ove
ry
Dril
led
Dril
led
0-22
mbs
f
Ass
emb
lag
e 1
Bry
ozo
an A
ssem
bla
ge
Ple
isto
cen
e
Nanno.Zone
Plank.Foram.Zone
Benth.Foram.Assem.
Lith.Unit
Age
Dep
th (
mb
sf)
NN19 Pt1b
210
220
230
240
250
260
270
280
290
300
310
320
330
340
350
360
370
380
390
22H
1129C
23H
24X
25X
26X
27X
28X
29X
30X
31X
32X
33X
34X
35X
36X
37X
38X
39X
40X
41X
42X
43X
1129D
1R
2RD
rille
d 29
9.6-
373.
2 m
bsf
3R
4R
5R
Pt1a
IIC
ore
Rec
ove
ry
Co
re
Rec
ove
ry
Ass
emb
lag
e 1
Ple
isto
cen
e
Dril
led
0.0-
280.
0 m
bsf
Nanno.Zone
Plank.Foram.Zone
Benth.Foram.Assem.
Lith.Sub-unit
Age
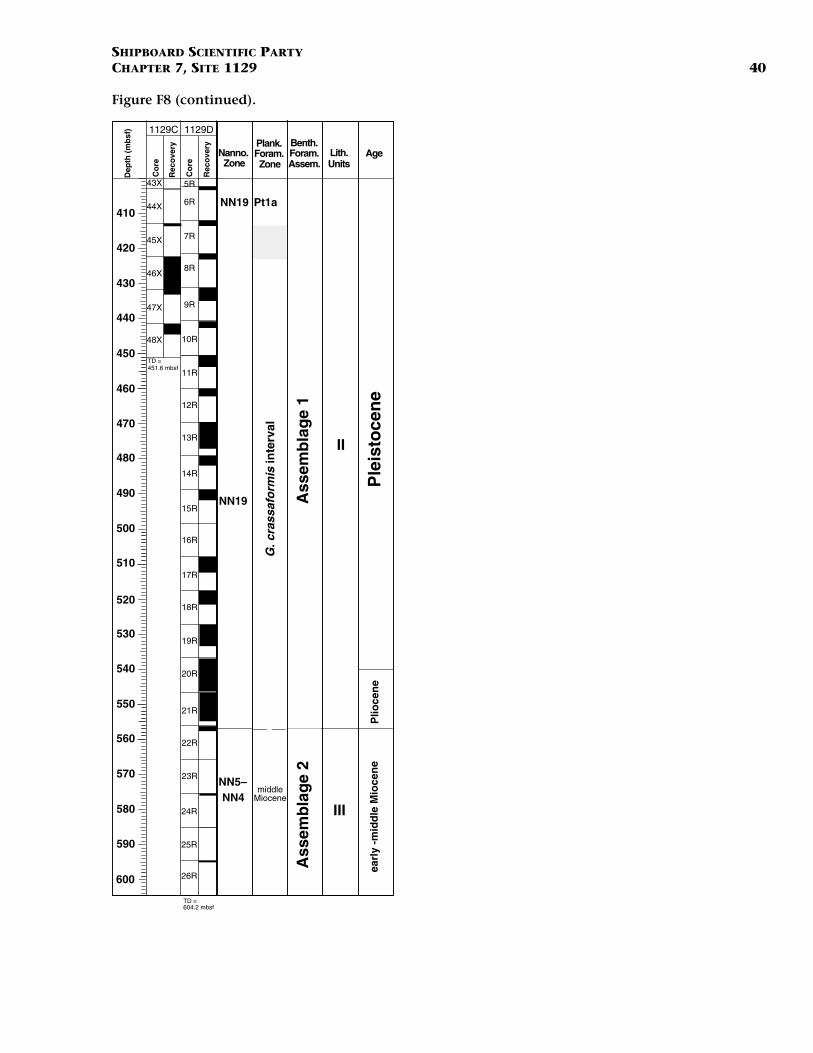
SHIPBOARD SCIENTIFIC PARTYCHAPTER 7, SITE 1129 40
Figure F8 (continued).
Nanno.Zone
Plank.Foram.Zone
Benth.Foram.Assem.
Lith.Units
Age
NN19 Pt1a
43X
44X
45X
46X
47X
48X
TD =451.6 mbsf
5R
410
420
430
440
450
460
470
480
490
500
510
520
530
540
550
560
570
580
590
1129C 1129D
6R
7R
8R
9R
10R
11R
12R
13R
14R
15R
16R
17R
18R
19R
20R
21R
22R
23RNN5–NN4
TD =604.2 mbsf
24R
25R
26R600
NN19
middleMiocene
II
III
Dep
th (
mb
sf)
Co
re
Rec
ove
ry
Co
re
Rec
ove
ry
Ass
emb
lag
e 1
Ple
isto
cen
e
Ass
emb
lag
e 2
G. c
rass
afo
rmis
inte
rval
earl
y -m
idd
le M
ioce
ne
Plio
cen
e
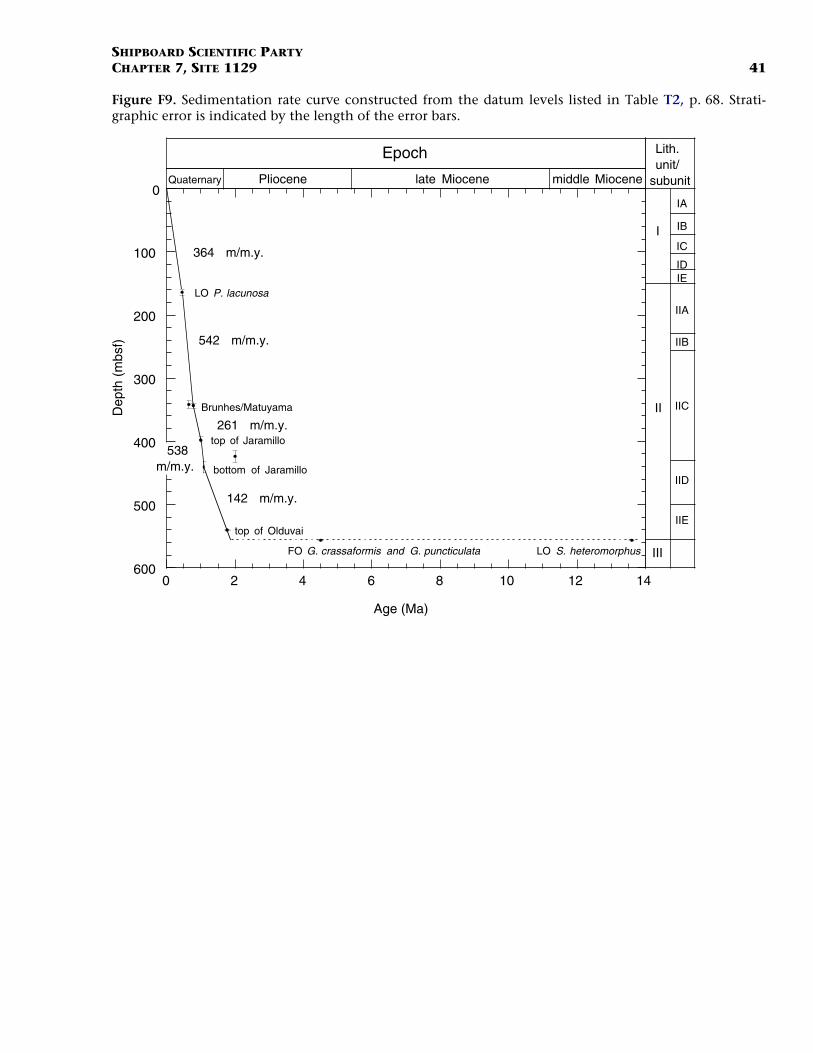
SHIPBOARD SCIENTIFIC PARTYCHAPTER 7, SITE 1129 41
Figure F9. Sedimentation rate curve constructed from the datum levels listed in Table T2, p. 68. Strati-graphic error is indicated by the length of the error bars.
0
100
200
300
500
6000 2 4 6 8 10 12 14
Dep
th (
mbs
f)
Age (Ma)
Lith. unit/
subunit
LO P. lacunosa
Brunhes/Matuyama
364 m/m.y.
542 m/m.y.
FO G. crassaformis and G. puncticulata LO S. heteromorphus
Quaternary Pliocene late Miocene middle Miocene
top of Jaramillo
bottom of Jaramillo
top of Olduvai
261 m/m.y.
538m/m.y.
142 m/m.y.
I
II
IA
IB
IC
IDIE
IIA
IIB
IIC
IID
IIE
III
Epoch
400
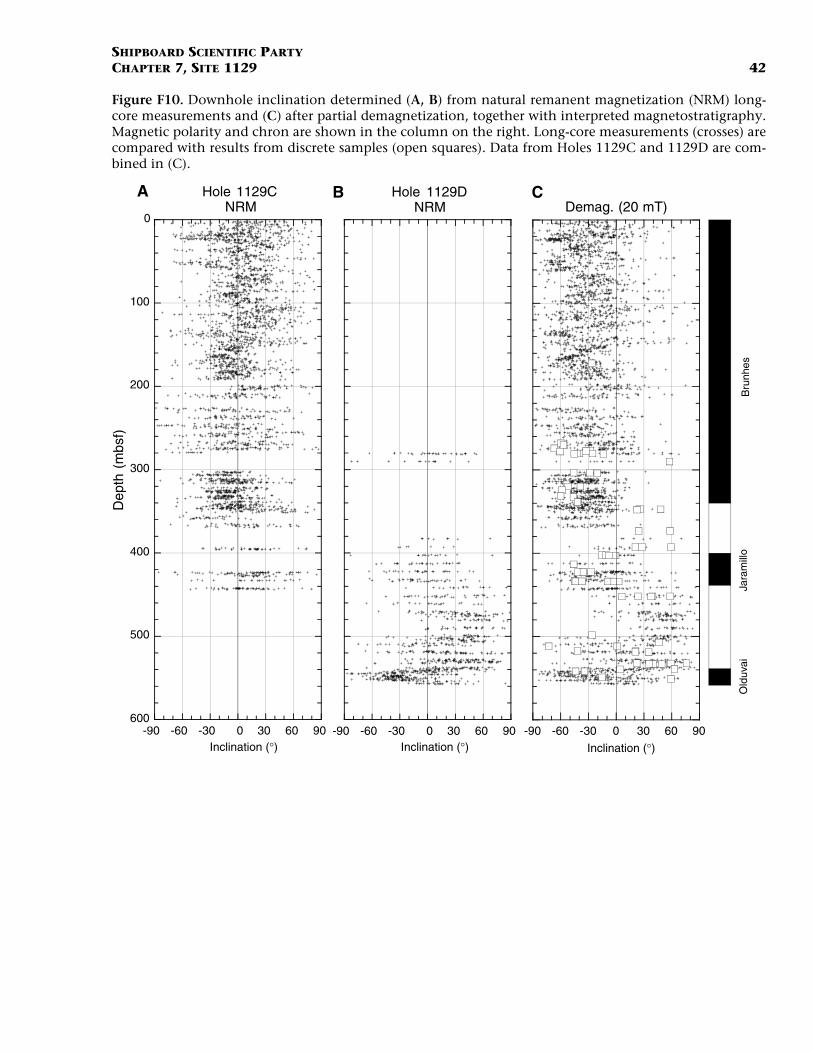
SHIPBOARD SCIENTIFIC PARTYCHAPTER 7, SITE 1129 42
Figure F10. Downhole inclination determined (A, B) from natural remanent magnetization (NRM) long-core measurements and (C) after partial demagnetization, together with interpreted magnetostratigraphy.Magnetic polarity and chron are shown in the column on the right. Long-core measurements (crosses) arecompared with results from discrete samples (open squares). Data from Holes 1129C and 1129D are com-bined in (C).
-90 -60 -30 0 30 60 90
0
100
200
300
400
500
600
Hole 1129C NRM
Inclination (°)
Dep
th (
mbs
f)
-90 -60 -30 0 30 60 90
Hole 1129DNRM
Inclination (°)-90 -60 -30 0 30 60 90
Demag. (20 mT)
Inclination (°)B
runh
esJa
ram
illo
Old
uvai
A B C
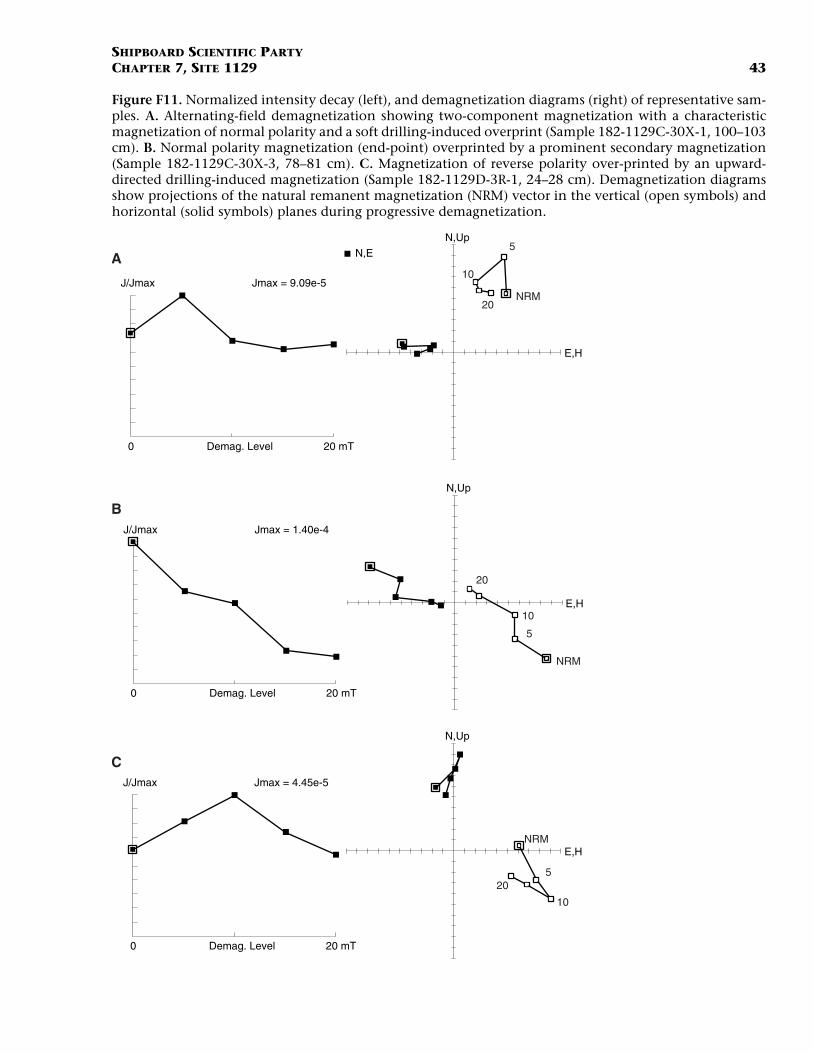
SHIPBOARD SCIENTIFIC PARTYCHAPTER 7, SITE 1129 43
Figure F11. Normalized intensity decay (left), and demagnetization diagrams (right) of representative sam-ples. A. Alternating-field demagnetization showing two-component magnetization with a characteristicmagnetization of normal polarity and a soft drilling-induced overprint (Sample 182-1129C-30X-1, 100–103cm). B. Normal polarity magnetization (end-point) overprinted by a prominent secondary magnetization(Sample 182-1129C-30X-3, 78–81 cm). C. Magnetization of reverse polarity over-printed by an upward-directed drilling-induced magnetization (Sample 182-1129D-3R-1, 24–28 cm). Demagnetization diagramsshow projections of the natural remanent magnetization (NRM) vector in the vertical (open symbols) andhorizontal (solid symbols) planes during progressive demagnetization.
N,E
J/Jmax Jmax = 9.09e-5
0 Demag. Level 20 mT
N,Up
E,H
NRM20
5
10
J/Jmax Jmax = 1.40e-4
0 Demag. Level 20 mT
N,Up
E,H
NRM
5
10
20
J/Jmax Jmax = 4.45e-5
0 Demag. Level 20 mT
N,Up
E,HNRM
5
10
20
A
B
C
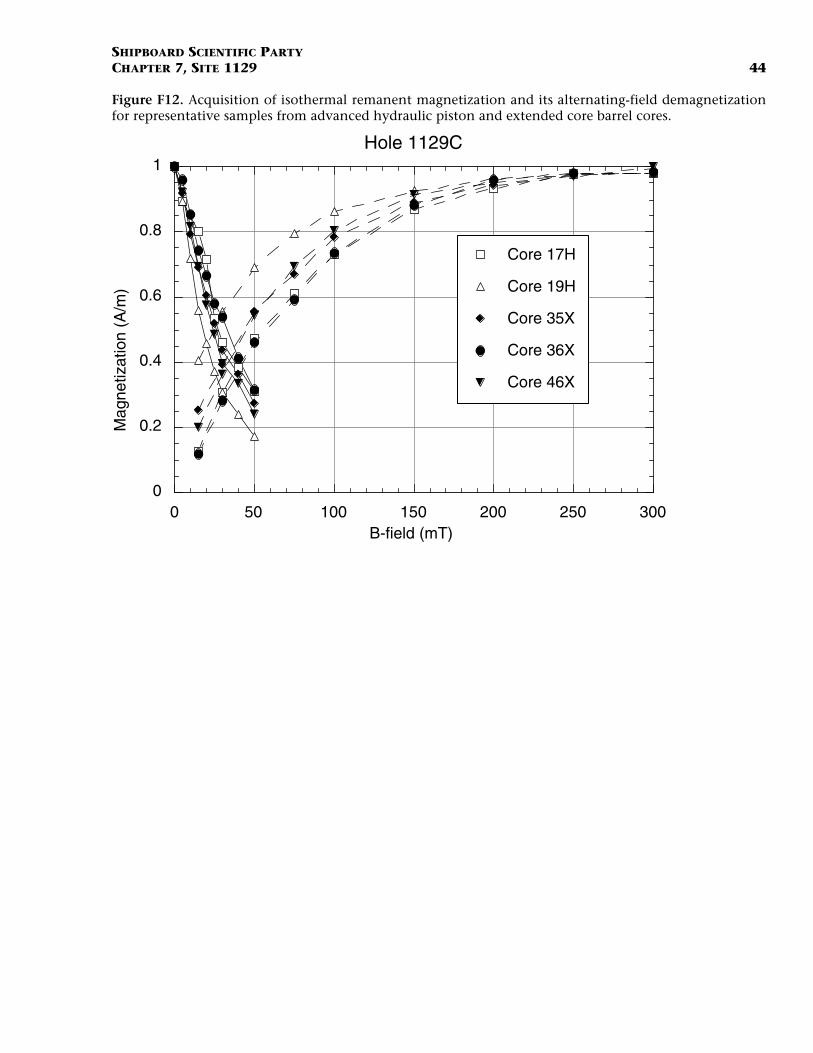
SHIPBOARD SCIENTIFIC PARTYCHAPTER 7, SITE 1129 44
Figure F12. Acquisition of isothermal remanent magnetization and its alternating-field demagnetizationfor representative samples from advanced hydraulic piston and extended core barrel cores.
0
0.2
0.4
0.6
0.8
1
0 50 100 150 200 250 300
Hole 1129CM
agne
tizat
ion
(A/m
)
B-field (mT)
Core 17H
Core 19H
Core 35X
Core 36X
Core 46X
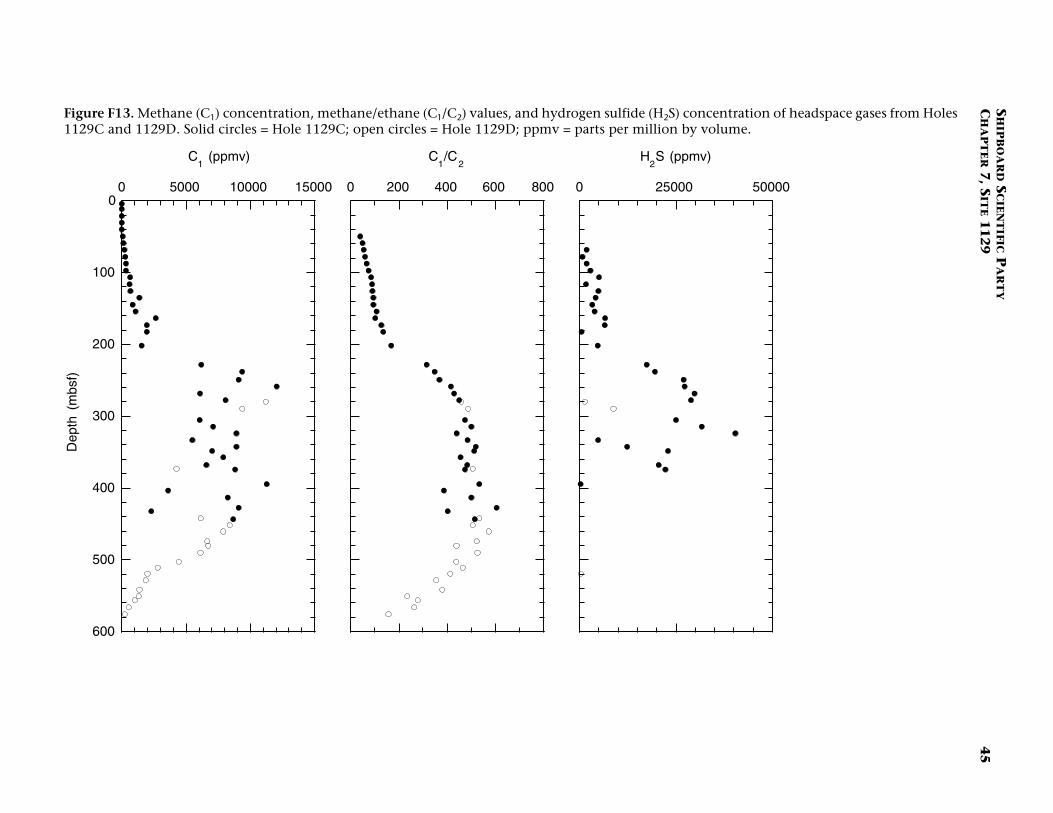
SH
IPB
OA
RD
SC
IEN
TIFIC P
AR
TY
CH
AP
TE
R 7
, SIT
E 11
29
45
Figure F13. Meth ntration of headspace gases from Holes1129C and 1129 lume.
0
100
200
300
400
500
600
0
Dep
th (
mbs
f)
50000
ane (C1) concentration, methane/ethane (C1/C2) values, and hydrogen sulfide (H2S) conceD. Solid circles = Hole 1129C; open circles = Hole 1129D; ppmv = parts per million by vo
5000 10000 15000
C1 (ppmv)
0 200 400 600 800
C1/C
2
0 25000
H2S (ppmv)
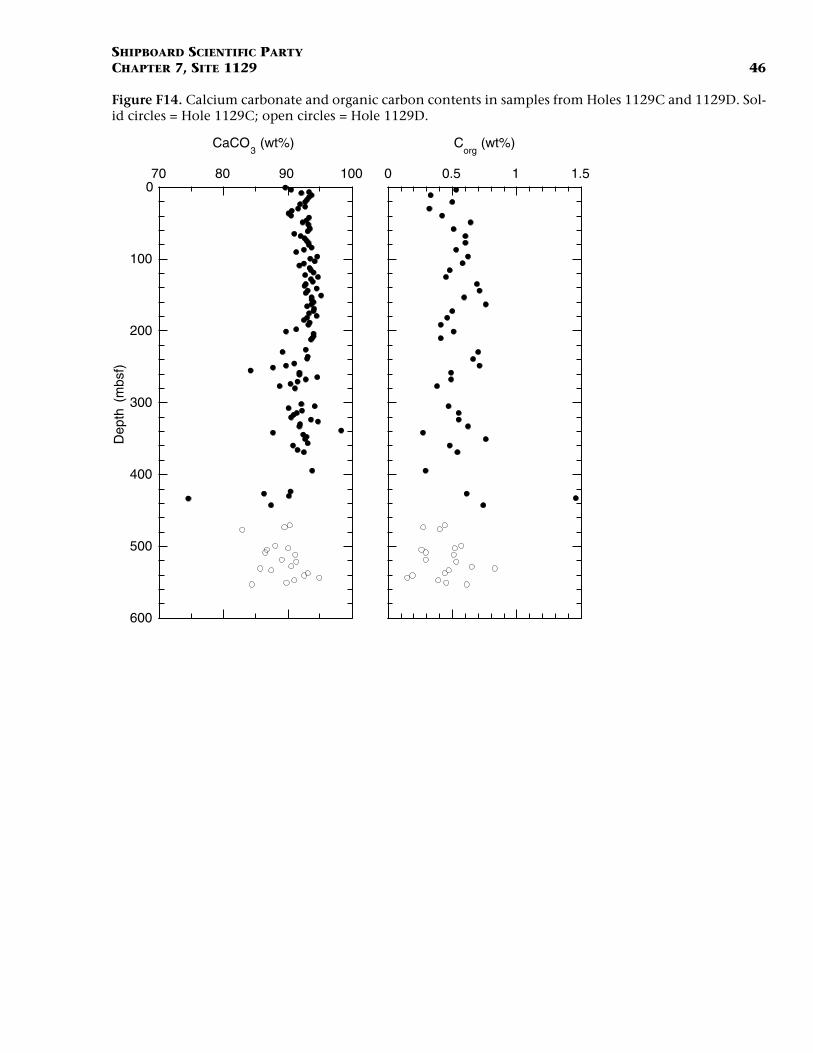
SHIPBOARD SCIENTIFIC PARTYCHAPTER 7, SITE 1129 46
Figure F14. Calcium carbonate and organic carbon contents in samples from Holes 1129C and 1129D. Sol-id circles = Hole 1129C; open circles = Hole 1129D.
0
100
200
300
400
500
600
70 80 90 100
Dep
th (
mbs
f)
CaCO3 (wt%)
0 0.5 1 1.5
Corg
(wt%)
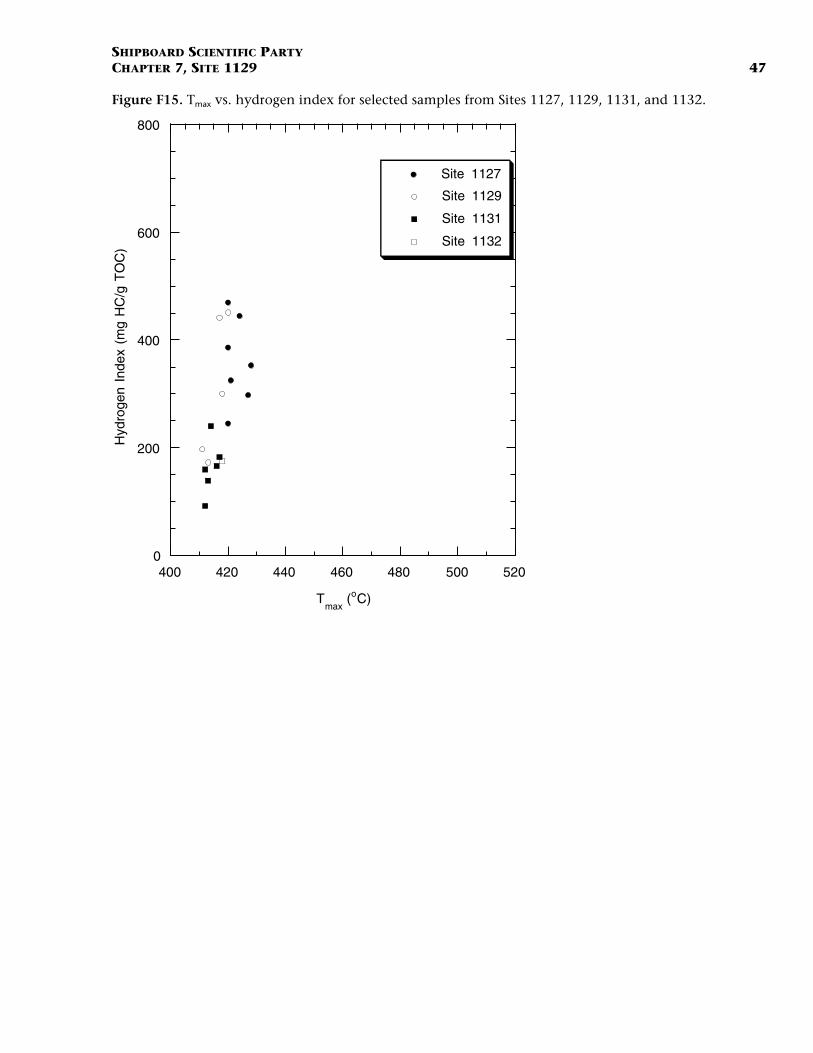
SHIPBOARD SCIENTIFIC PARTYCHAPTER 7, SITE 1129 47
Figure F15. Tmax vs. hydrogen index for selected samples from Sites 1127, 1129, 1131, and 1132.
0
200
400
600
800
400 420 440 460 480 500 520
Site 1127
Site 1129
Site 1131
Site 1132
Hyd
roge
n In
dex
(mg
HC
/g T
OC
)
Tmax
(oC)
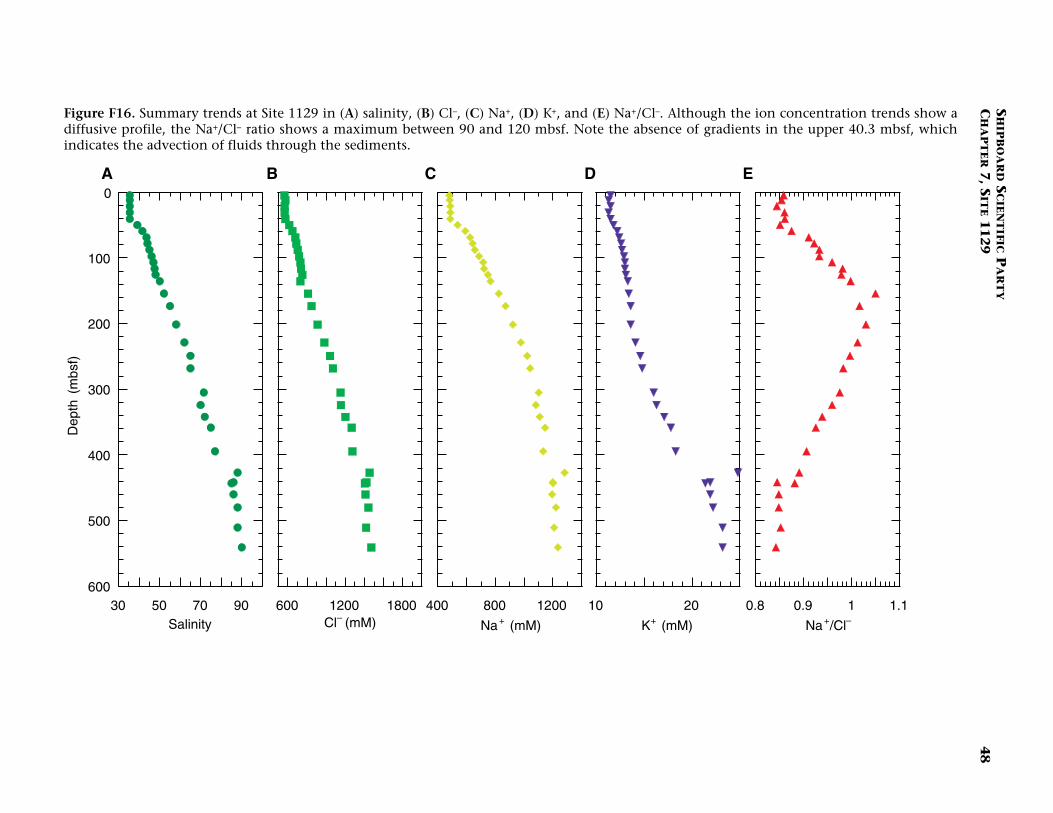
SH
IPB
OA
RD
SC
IEN
TIFIC P
AR
TY
CH
AP
TE
R 7
, SIT
E 11
29
48
Figure F16. Summ h the ion concentration trends show adiffusive profile, t adients in the upper 40.3 mbsf, whichindicates the adve
30 50
0
100
200
300
400
500
600
S
Dep
th (
mbs
f)
0.8 0.9 1 1.1
Na+/Cl–
A E
ary trends at Site 1129 in (A) salinity, (B) Cl–, (C) Na+, (D) K+, and (E) Na+/Cl–. Althoughe Na+/Cl– ratio shows a maximum between 90 and 120 mbsf. Note the absence of grction of fluids through the sediments.
70 90alinity
600 1200 1800Cl– (mM)
400 800 1200
Na+ (mM)
10 20
K+ (mM)
B C D
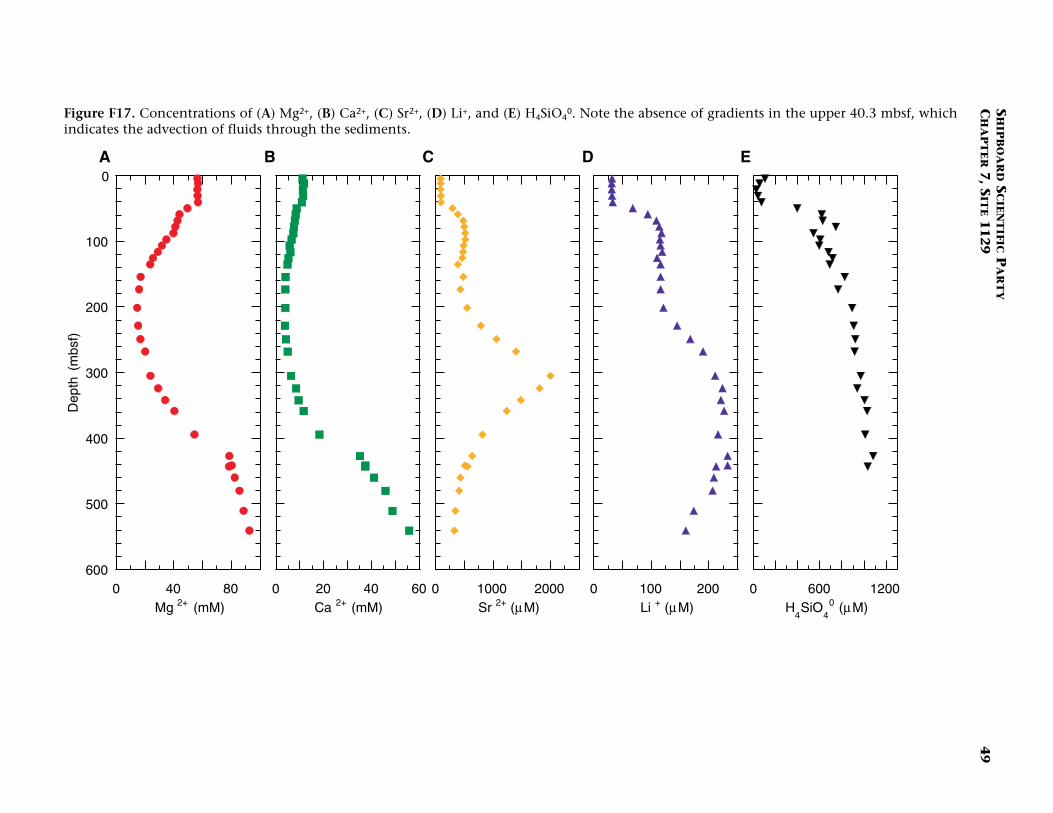
SH
IPB
OA
RD
SC
IEN
TIFIC P
AR
TY
CH
AP
TE
R 7
, SIT
E 11
29
49
Figure F17. Concen radients in the upper 40.3 mbsf, whichindicates the advect
0 40
0
100
200
300
400
500
600
Mg 2+
Dep
th (
mbs
f)
0 600 1200H
4SiO
40 (µM)
A E
trations of (A) Mg2+, (B) Ca2+, (C) Sr2+, (D) Li+, and (E) H4SiO40. Note the absence of g
ion of fluids through the sediments.
80 (mM)
0 20 40 60Ca 2+ (mM)
0 1000 2000Sr 2+ (µM)
0 100 200Li + (µM)
B C D
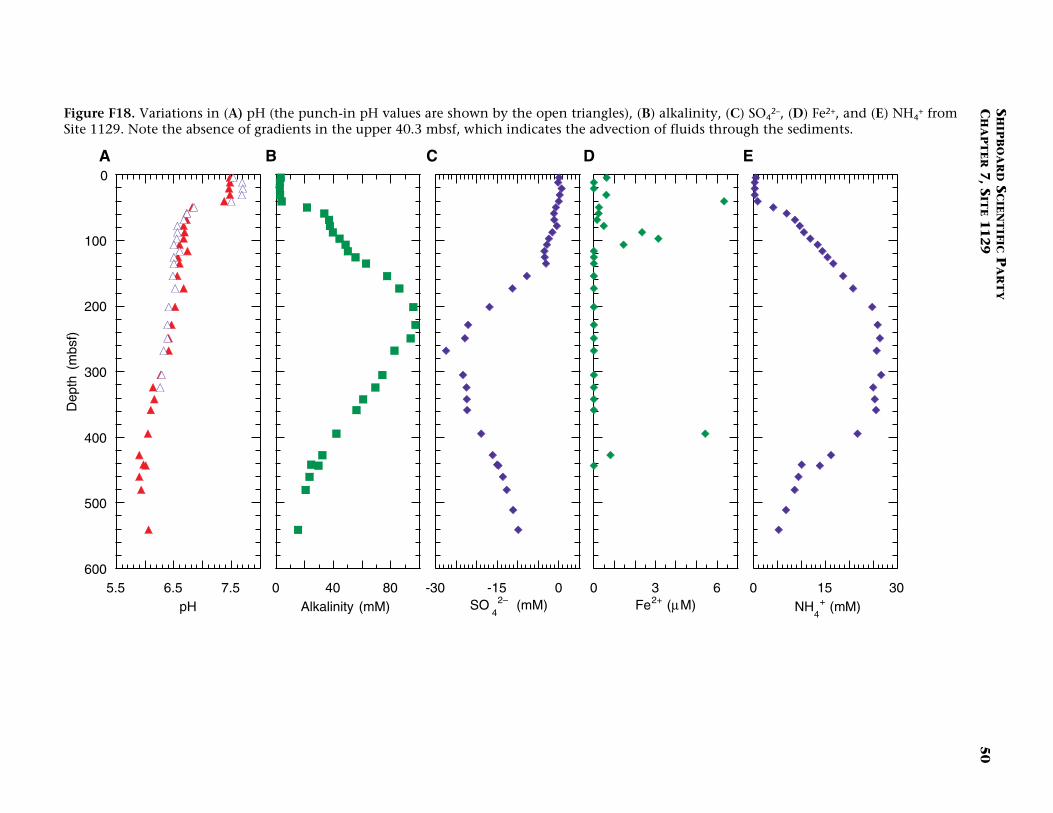
SH
IPB
OA
RD
SC
IEN
TIFIC P
AR
TY
CH
AP
TE
R 7
, SIT
E 11
29
50
Figure F18. Variatio , (C) SO42–, (D) Fe2+, and (E) NH4
+ fromSite 1129. Note the a rough the sediments.
5.5 6.5
0
100
200
300
400
500
600
pH
Dep
th (
mbs
f)
0 15 30NH
4+ (m M)
A E
ns in (A) pH (the punch-in pH values are shown by the open triangles), (B) alkalinitybsence of gradients in the upper 40.3 mbsf, which indicates the advection of fluids th
7.5 0 40 80Alkalinity (mM)
-30 -15 0SO
42– (mM)
0 3 6Fe2+ (µM)
B C D
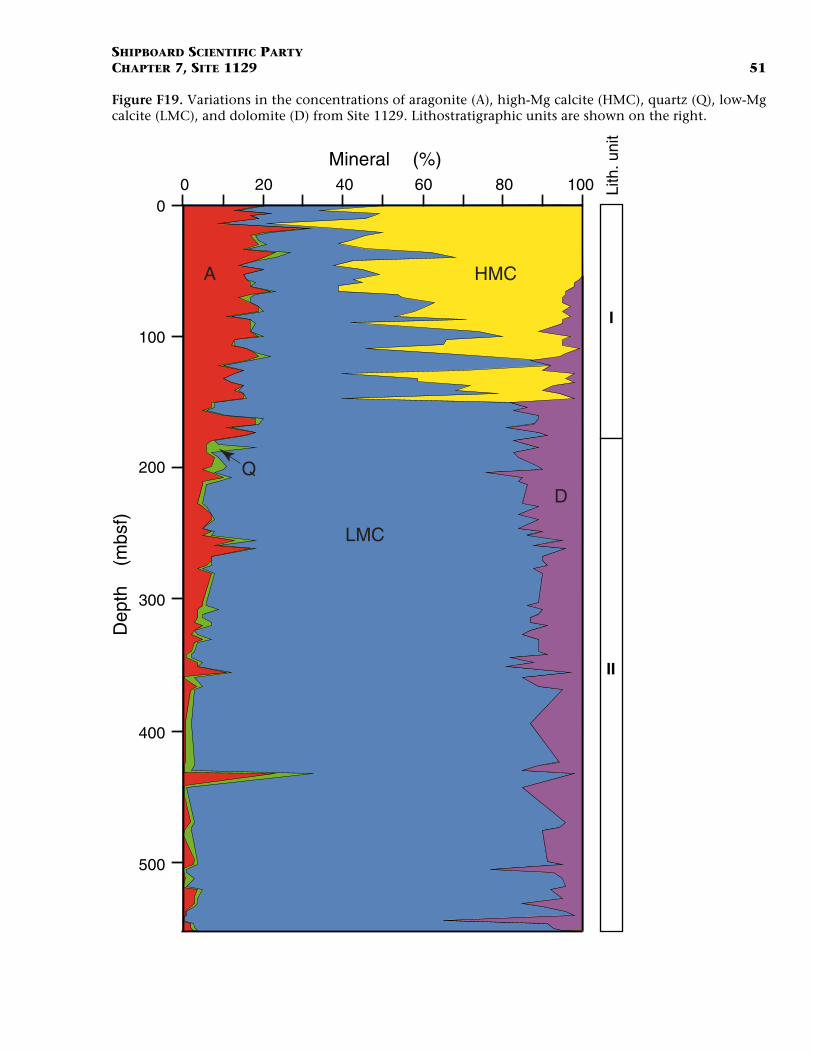
SHIPBOARD SCIENTIFIC PARTYCHAPTER 7, SITE 1129 51
Figure F19. Variations in the concentrations of aragonite (A), high-Mg calcite (HMC), quartz (Q), low-Mgcalcite (LMC), and dolomite (D) from Site 1129. Lithostratigraphic units are shown on the right.
0 20 40 60 80 1000
100
200
300
400
500
Mineral (%)
Dep
th
(mbs
f)
Lith
. uni
t
I
II
A
Q
LMC
HMC
D
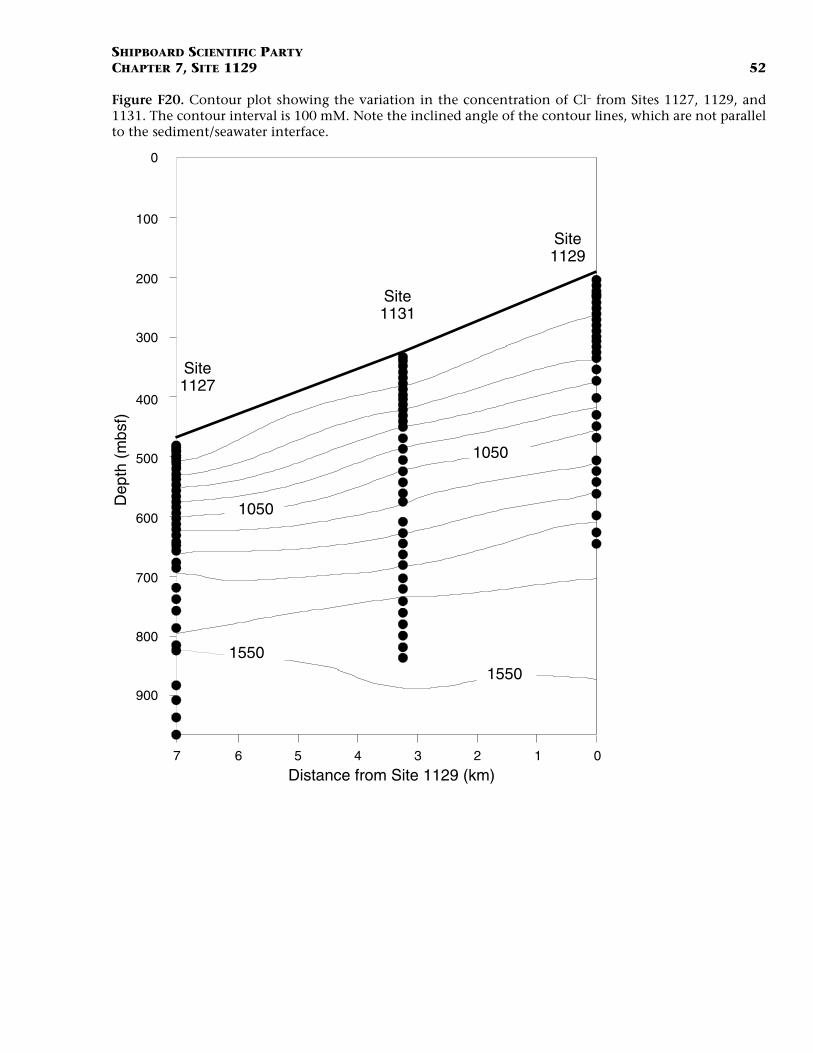
SHIPBOARD SCIENTIFIC PARTYCHAPTER 7, SITE 1129 52
Figure F20. Contour plot showing the variation in the concentration of Cl– from Sites 1127, 1129, and1131. The contour interval is 100 mM. Note the inclined angle of the contour lines, which are not parallelto the sediment/seawater interface.
1050
1050
15501550
Site1129
Site1131
Site1127
7 6 5 4 3 2 1 0
0
100
200
300
400
500
600
700
800
900
Dep
th (
mbs
f)
Distance from Site 1129 (km)
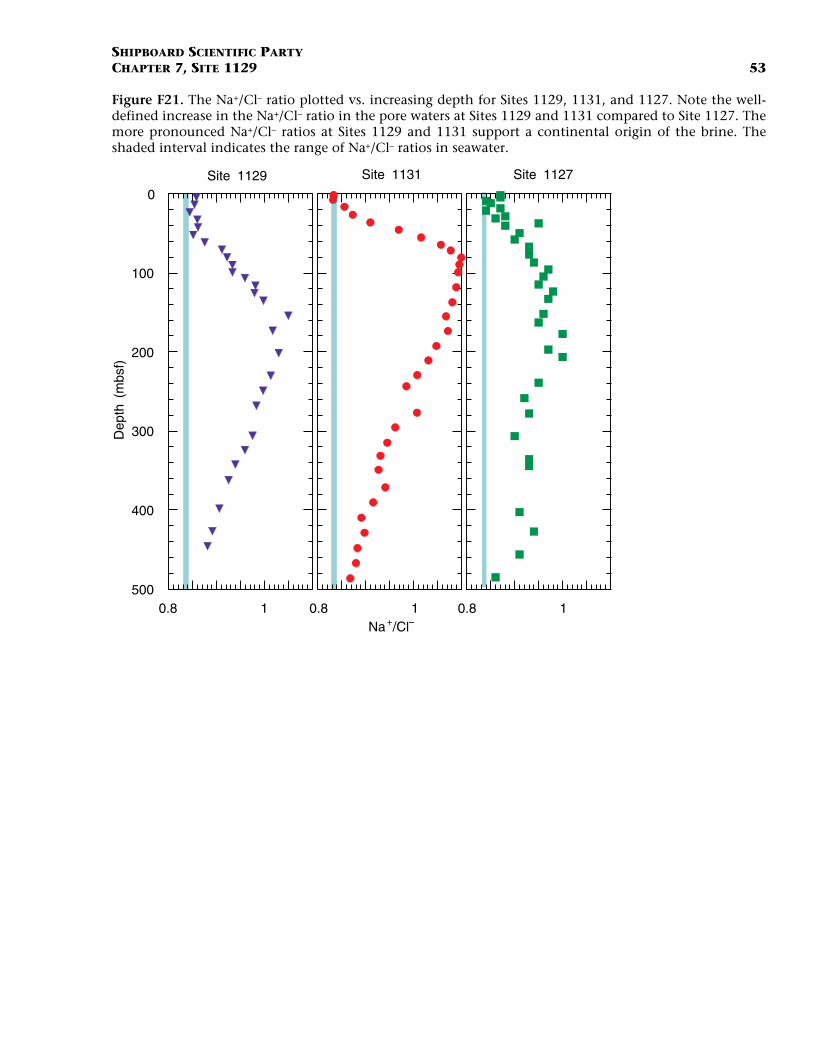
SHIPBOARD SCIENTIFIC PARTYCHAPTER 7, SITE 1129 53
Figure F21. The Na+/Cl– ratio plotted vs. increasing depth for Sites 1129, 1131, and 1127. Note the well-defined increase in the Na+/Cl– ratio in the pore waters at Sites 1129 and 1131 compared to Site 1127. Themore pronounced Na+/Cl– ratios at Sites 1129 and 1131 support a continental origin of the brine. Theshaded interval indicates the range of Na+/Cl– ratios in seawater.
0.8 1
0
100
200
300
400
500
Dep
th (
mbs
f)
Site 1129
0.8 1
Site 1127
0.8 1Na+/Cl–
Site 1131
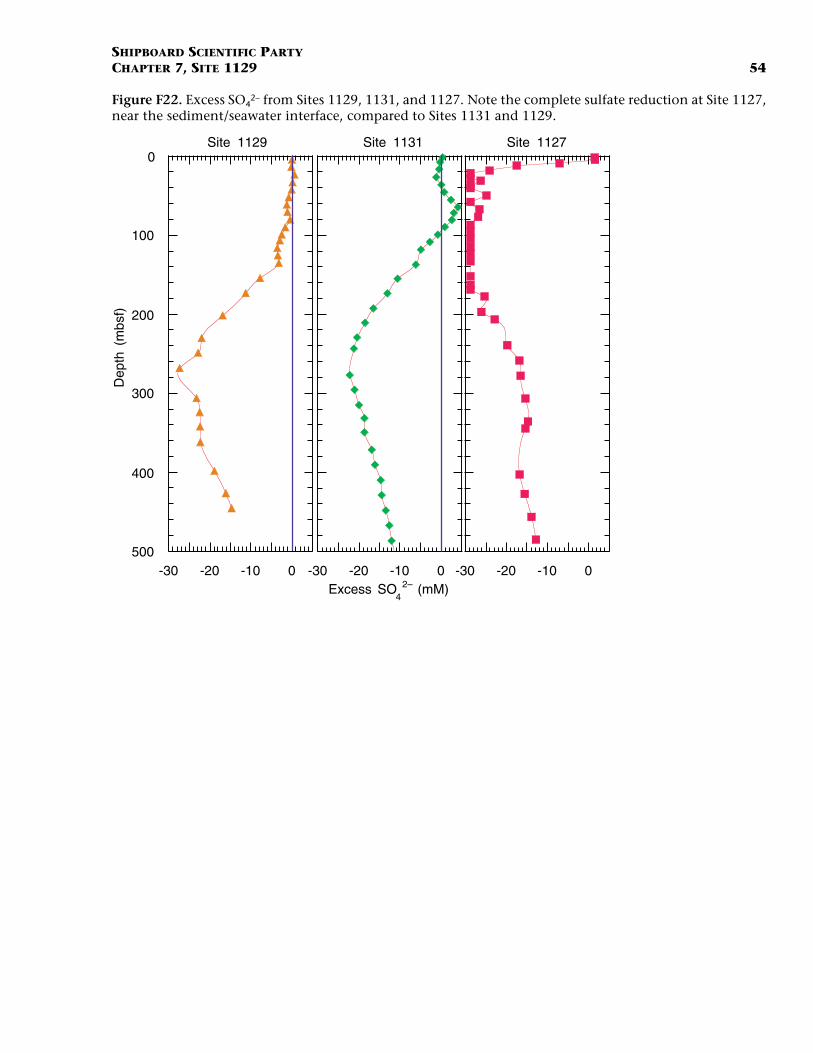
SHIPBOARD SCIENTIFIC PARTYCHAPTER 7, SITE 1129 54
Figure F22. Excess SO42– from Sites 1129, 1131, and 1127. Note the complete sulfate reduction at Site 1127,
near the sediment/seawater interface, compared to Sites 1131 and 1129.
-30 -20 -10 0
0
100
200
300
400
500
Dep
th (
mbs
f)
Site 1129
-30 -20 -10 0Excess SO
4 2– (mM)
Site 1131
-30 -20 -10 0
Site 1127
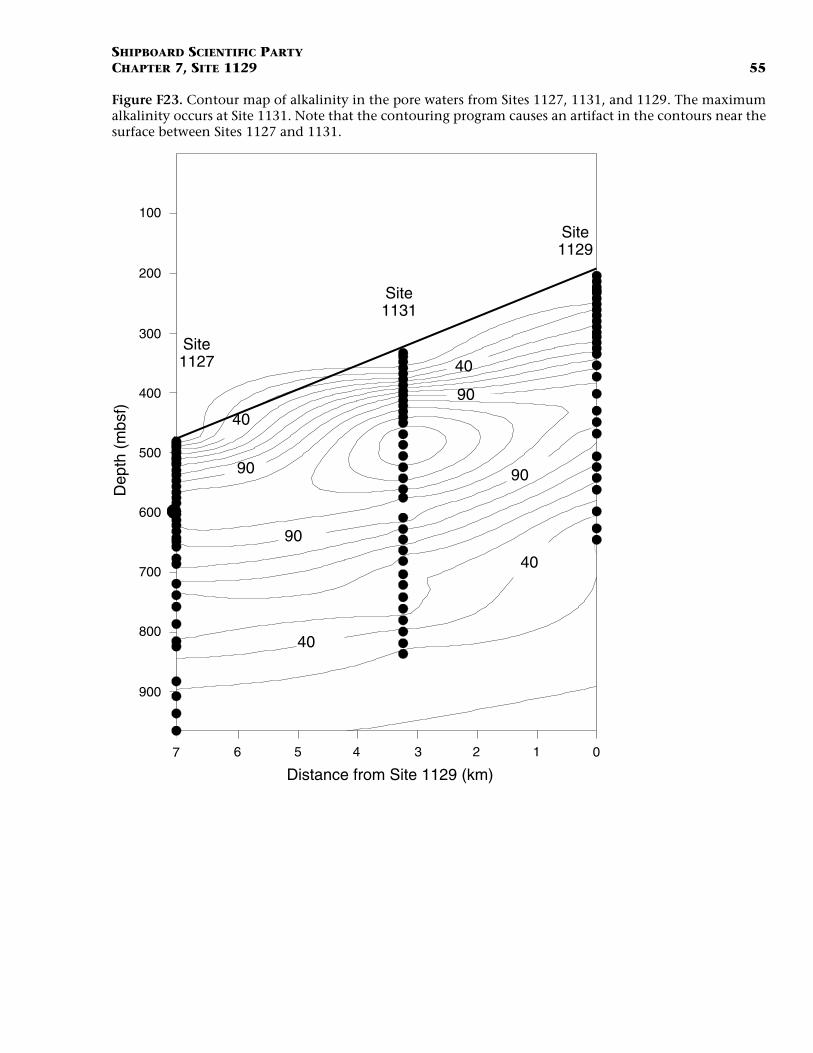
SHIPBOARD SCIENTIFIC PARTYCHAPTER 7, SITE 1129 55
Figure F23. Contour map of alkalinity in the pore waters from Sites 1127, 1131, and 1129. The maximumalkalinity occurs at Site 1131. Note that the contouring program causes an artifact in the contours near thesurface between Sites 1127 and 1131.
40
90
40
90
40
40
Distance from Site 1129 (km)
Dep
th (
mbs
f)
Site1131
Site1129
Site1127
90 90
100
200
300
400
500
600
700
800
900
7 6 5 4 3 2 01

SHIPBOARD SCIENTIFIC PARTYCHAPTER 7, SITE 1129 56
Figure F24. Combined plot of P-wave velocity, discrete moisture-and-density bulk density and porosity(red dots = Hole 1129C, green dots = Hole 1129D), corrected magnetic susceptibility, and NGR from Site1129. Recovery column is shown on the left and physical properties units (PP units) are shown on the right.(Figure shown on next page.)
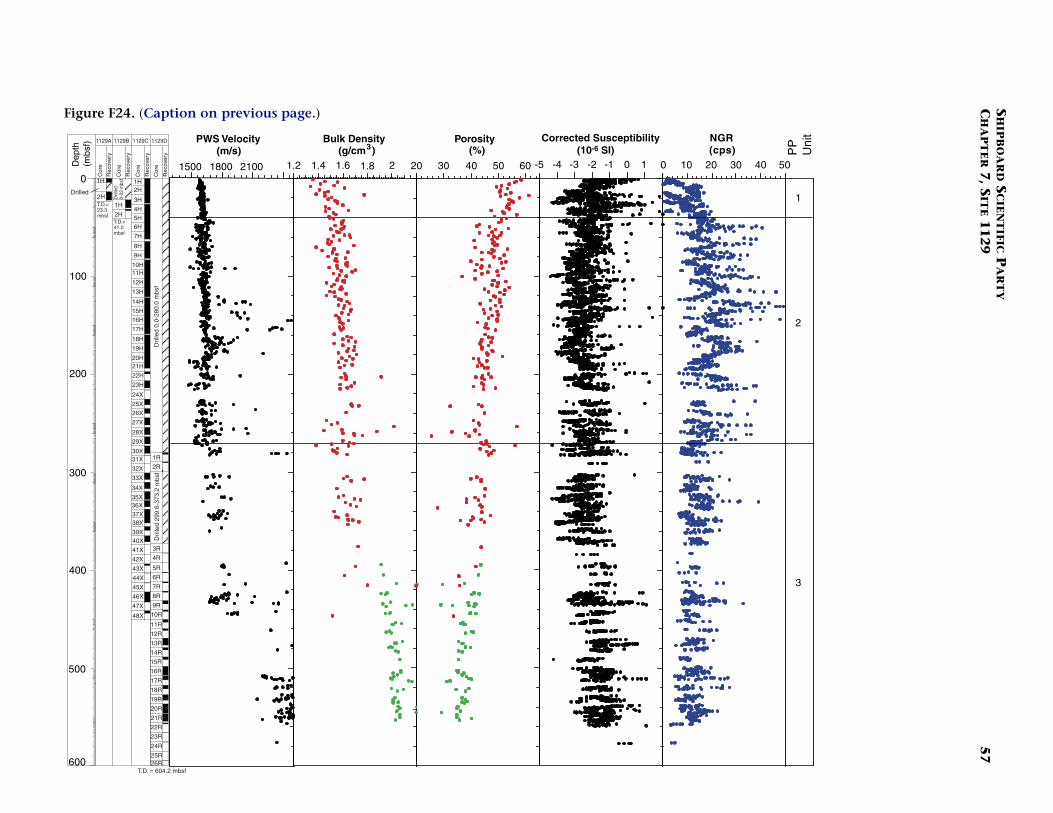
SH
IPB
OA
RD
SC
IEN
TIFIC P
AR
TY
CH
AP
TE
R 7
, SIT
E 11
29
57
30 40 50
GRps)
1
2
3
PP
Uni
t
Figure F24. (Caption on previous page.)
-5 -4 -3 -2 -1 0 1
Corrected Susceptibility (10-6 SI)
0 10 20
N(c
1500 1800 2100
PWS Velocity (m/s)
Dep
th(m
bsf)
1.2 1.4 1.6 1.8 2
Bulk Density (g/cm3)
20 30 40 50 60
Porosity(%)
100
200
300
400
500
0
600
Dril
led
0.0-
280.
0 m
bsf
Dril
led
299.
6-37
3.2
mbs
f
1R
2R
3R
4R
5R
6R
7R
8R
9R
10R
11R
12R
13R
14R
15R
16R
17R
18R
19R
20R
21R
22R
23R
24R
25R26R
T.D. = 604.2 mbsf
26X
27X
28X
29X
30X31X
32X
33X
34X
35X36X37X38X
39X40X
41X
42X
43X
44X
45X
46X
47X
48X
16H
17H
18H
19H
20H21H
22H
23H
24X
25X
6H
7H
8H
9H
10H11H
12H
13H
14H
15H
1H2H
3H
4H5H
1H
2HDrilled
1H
2H
Dril
led
0-22
mbs
f
T.D.=23.3mbsf
T.D.=41.0mbsf
Rec
over
y
Rec
over
y
Rec
over
y
Rec
over
y
Cor
e
Cor
e
Cor
e
Cor
e
1129A 1129B 1129C 1129D
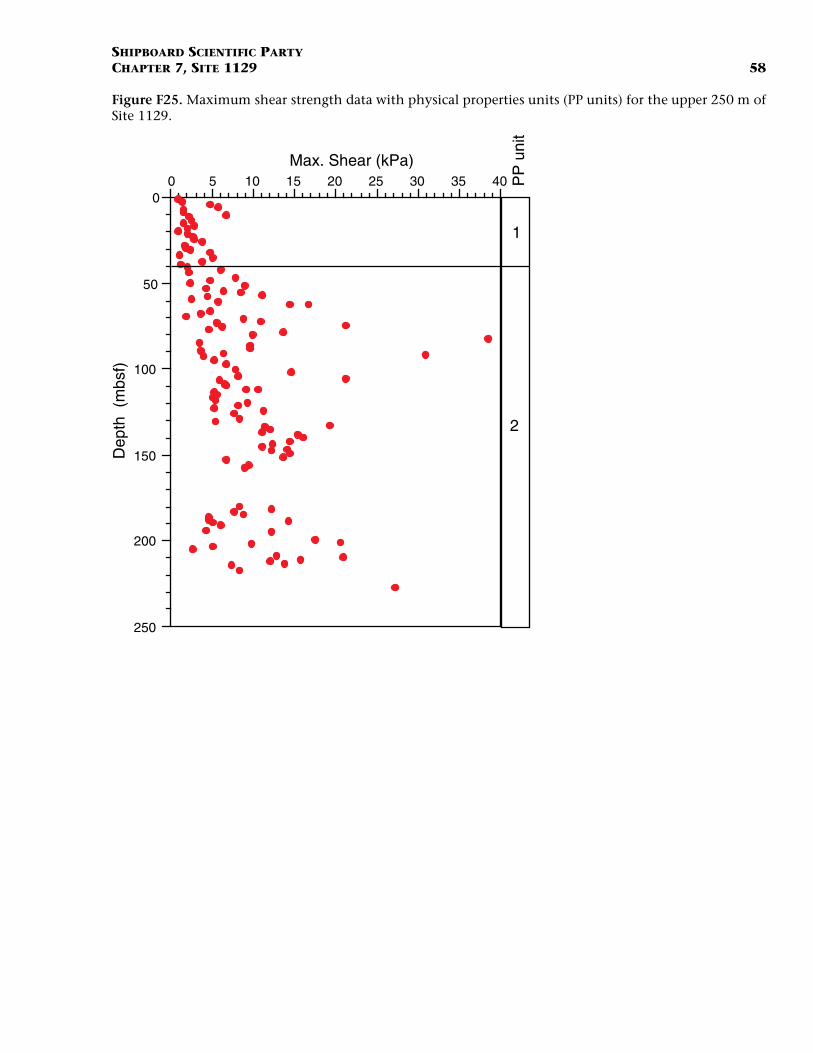
SHIPBOARD SCIENTIFIC PARTYCHAPTER 7, SITE 1129 58
Figure F25. Maximum shear strength data with physical properties units (PP units) for the upper 250 m ofSite 1129.
0 5 10 15 20 25 30 35 400
50
100
150
200
250
Max. Shear (kPa)
Dep
th (
mbs
f)
1
2
PP
uni
t
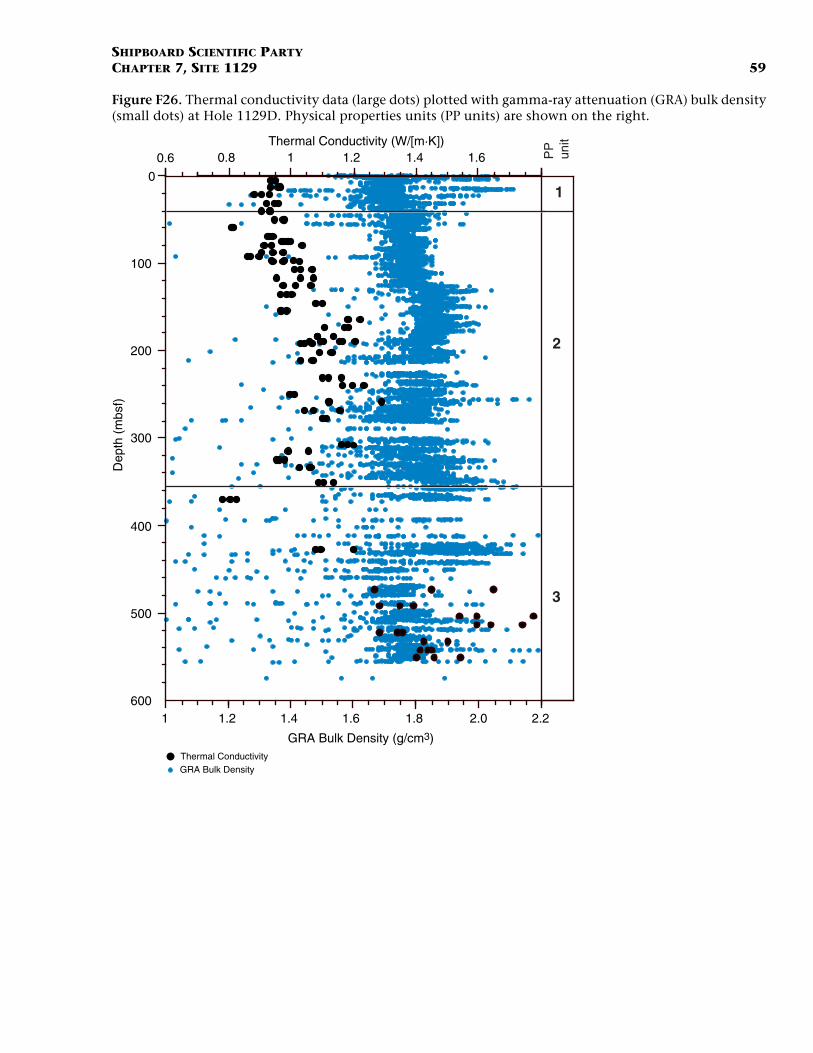
SHIPBOARD SCIENTIFIC PARTYCHAPTER 7, SITE 1129 59
Figure F26. Thermal conductivity data (large dots) plotted with gamma-ray attenuation (GRA) bulk density(small dots) at Hole 1129D. Physical properties units (PP units) are shown on the right.
0
100
200
300
400
500
600
0.8 1 1.2 1.4 1.6
Dep
th (
mbs
f)
Thermal Conductivity (W/[m·K])
1
2
3
PP
unit
GRA Bulk Density (g/cm3)
1 1.2 1.4 1.6 1.8
0.6
2.0 2.2
Thermal Conductivity GRA Bulk Density
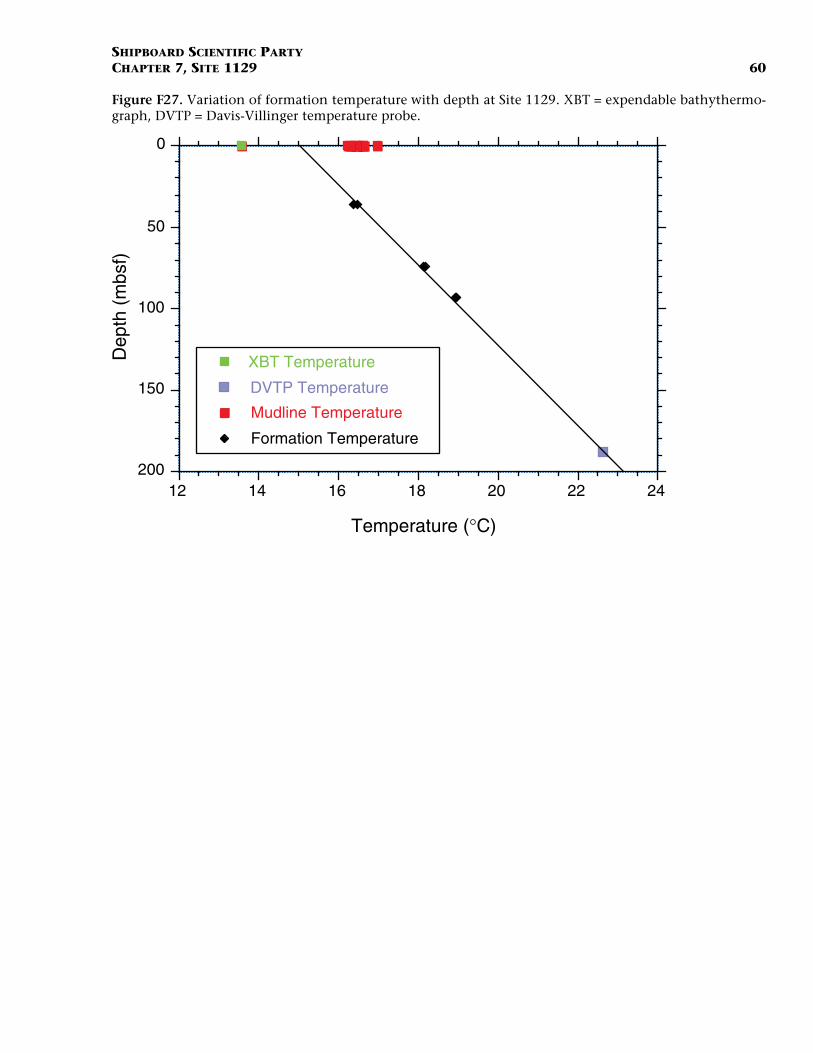
SHIPBOARD SCIENTIFIC PARTYCHAPTER 7, SITE 1129 60
Figure F27. Variation of formation temperature with depth at Site 1129. XBT = expendable bathythermo-graph, DVTP = Davis-Villinger temperature probe.
12 14 16 18 20 22 24
0
50
100
150
200
Mudline Temperature
Formation Temperature
DVTP Temperature
XBT Temperature
Temperature (°C)
Dep
th (
mbs
f)
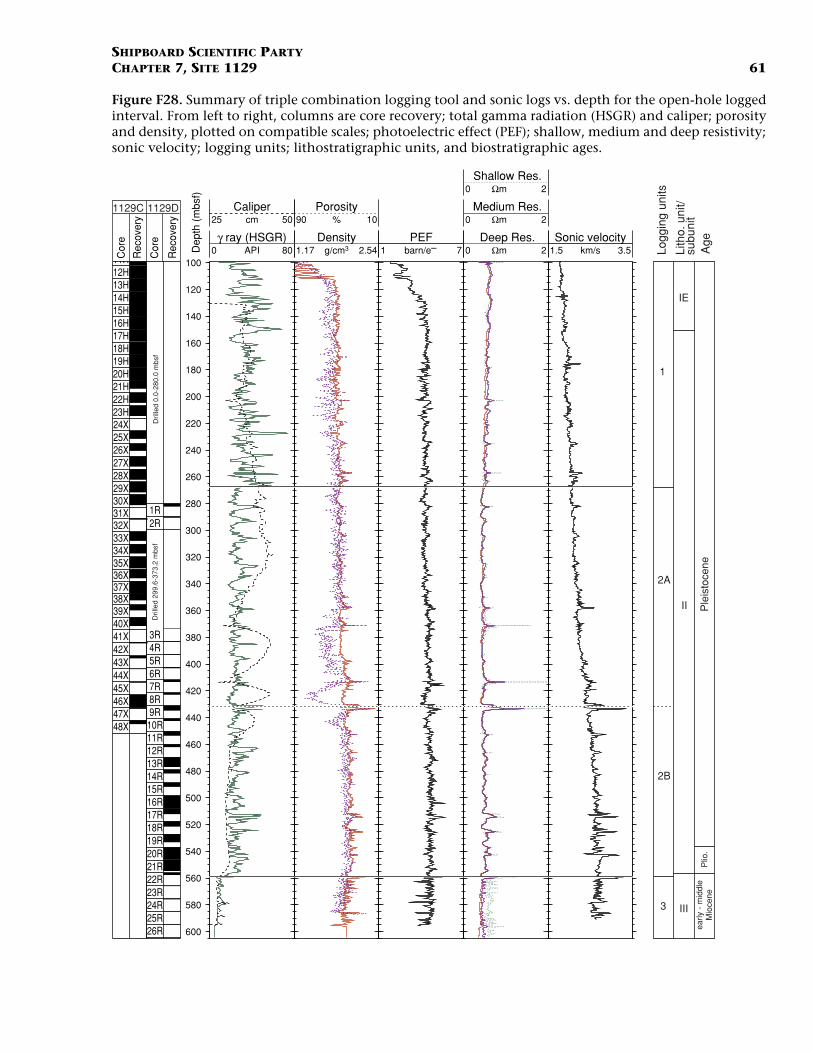
SHIPBOARD SCIENTIFIC PARTYCHAPTER 7, SITE 1129 61
Figure F28. Summary of triple combination logging tool and sonic logs vs. depth for the open-hole loggedinterval. From left to right, columns are core recovery; total gamma radiation (HSGR) and caliper; porosityand density, plotted on compatible scales; photoelectric effect (PEF); shallow, medium and deep resistivity;sonic velocity; logging units; lithostratigraphic units, and biostratigraphic ages.
Dep
th (
mbs
f)
1R2R
3R4R5R6R7R8R9R10R11R12R13R14R15R16R17R18R19R20R21R22R23R24R25R26R
100
120
140
160
180
200
220
240
260
280
300
320
340
360
380
400
420
440
460
480
500
520
540
560
580
600
0 80APIγ ray (HSGR)
25 50cmCaliper
1.17 2.54g/cm3Density
90 10%Porosity
1 7barn/e–PEF
0 2ΩmDeep Res.
0 2ΩmMedium Res.
0 2ΩmShallow Res.
1.5 3.5km/sSonic velocity
11H12H13H14H15H16H17H18H19H20H21H22H23H24X25X26X27X28X29X30X31X32X33X34X35X36X37X38X39X40X41X42X43X44X45X46X47X48X
1129C 1129D
Dril
led
299.
6-37
3.2
mbs
fD
rille
d 0.
0-28
0.0
mbs
f
Logg
ing
units
Lith
o. u
nit/
subu
nit
Age
3
Ple
isto
cene
II
IE
III
early
- m
iddl
e
Mio
cene
Plio
.
2B
2A
1
Rec
over
y
Cor
e
Rec
over
y
Cor
e
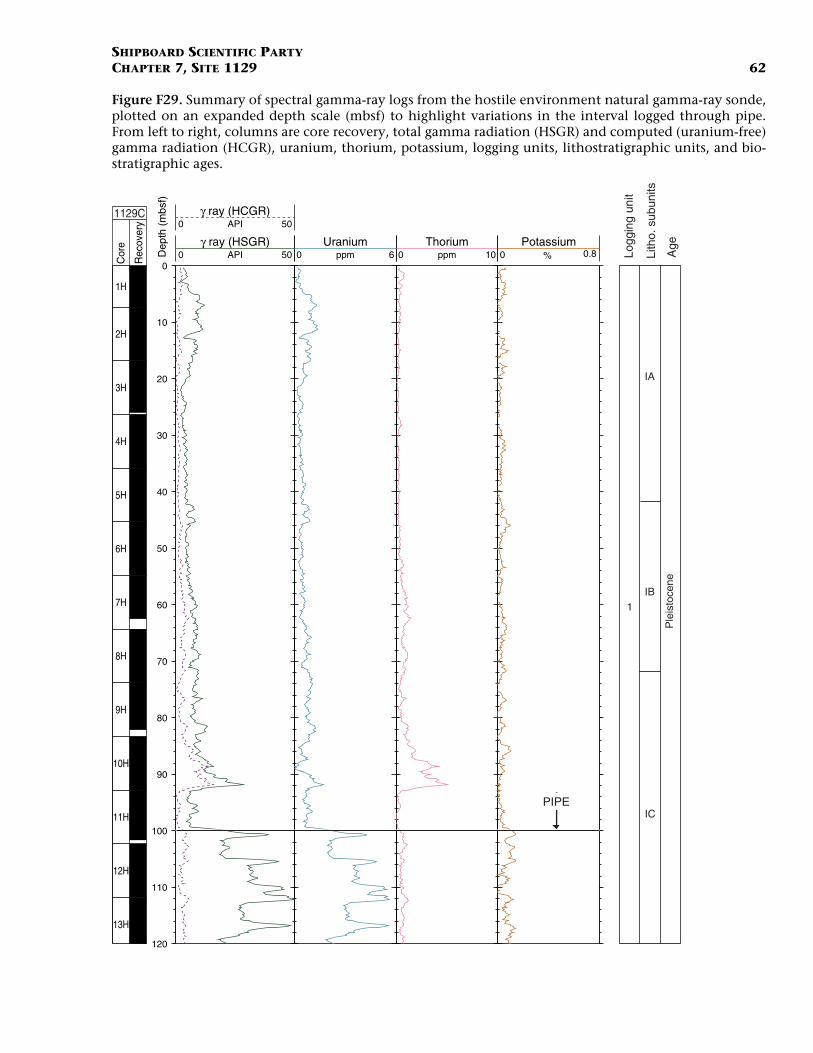
SHIPBOARD SCIENTIFIC PARTYCHAPTER 7, SITE 1129 62
Figure F29. Summary of spectral gamma-ray logs from the hostile environment natural gamma-ray sonde,plotted on an expanded depth scale (mbsf) to highlight variations in the interval logged through pipe.From left to right, columns are core recovery, total gamma radiation (HSGR) and computed (uranium-free)gamma radiation (HCGR), uranium, thorium, potassium, logging units, lithostratigraphic units, and bio-stratigraphic ages.
Dep
th (
mbs
f)
1H
2H
3H
4H
5H
6H
7H
8H
9H
10H
11H
12H
13H
0
10
20
30
40
50
60
70
80
90
100
110
120
0 50APIγ ray (HSGR)
0 50APIγ ray (HCGR)
0 6ppmUranium
0 10ppmThorium
0 0.8%Potassium
1129C
Ple
isto
cene
IC
IA
IB
Logg
ing
unit
Lith
o. s
ubun
its
Age
1
PIPE
Rec
over
y
Cor
e
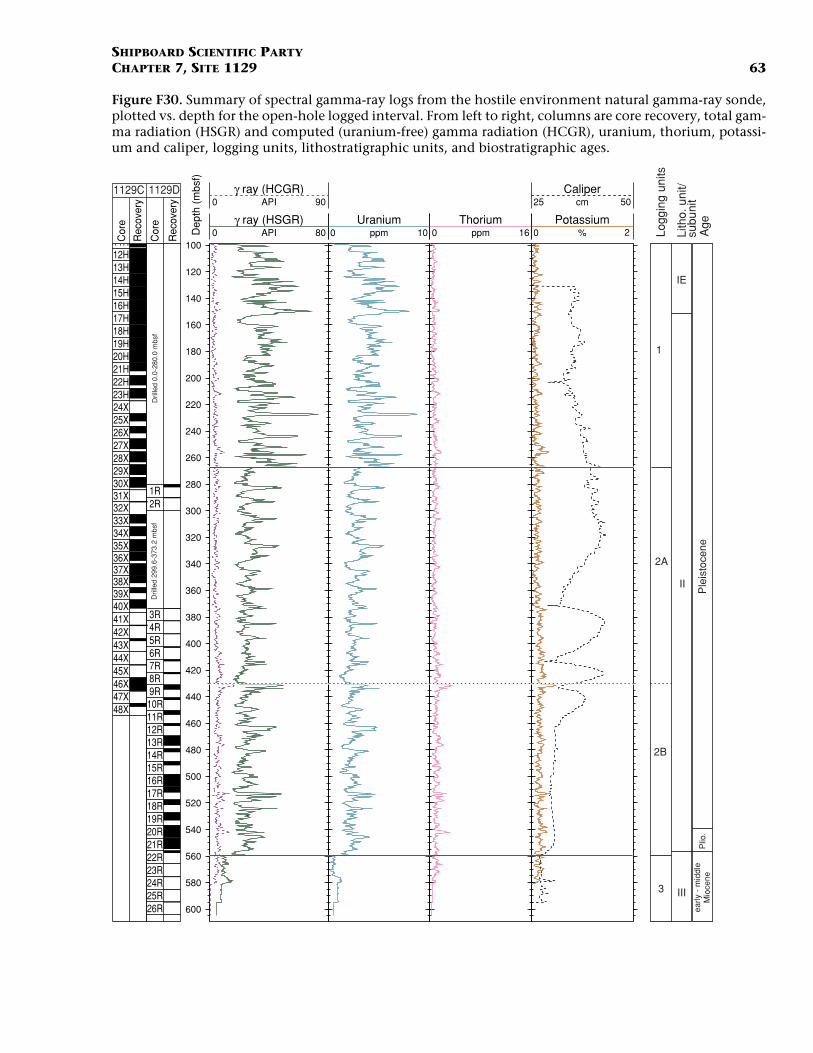
SHIPBOARD SCIENTIFIC PARTYCHAPTER 7, SITE 1129 63
Figure F30. Summary of spectral gamma-ray logs from the hostile environment natural gamma-ray sonde,plotted vs. depth for the open-hole logged interval. From left to right, columns are core recovery, total gam-ma radiation (HSGR) and computed (uranium-free) gamma radiation (HCGR), uranium, thorium, potassi-um and caliper, logging units, lithostratigraphic units, and biostratigraphic ages.
Dep
th (
mbs
f)
1R2R
3R4R5R6R7R8R9R
10R11R12R13R14R15R16R17R18R19R20R21R22R23R24R25R26R
100
120
140
160
180
200
220
240
260
280
300
320
340
360
380
400
420
440
460
480
500
520
540
560
580
600
0 80APIγ ray (HSGR)
0 90APIγ ray (HCGR)
0 10ppmUranium
0 16ppmThorium
0 2%Potassium
25 50cmCaliper
11H12H13H14H15H16H17H18H19H20H21H22H23H24X25X26X27X28X29X30X31X32X33X34X35X36X37X38X39X40X41X42X43X44X45X46X47X48X
Logg
ing
units
Lith
o. u
nit/
subu
nit
Age
3
Ple
isto
cene
II
IE
Dril
led
299.
6-37
3.2
mbs
fD
rille
d 0.
0-28
0.0
mbs
f
III
early
- m
iddl
e
Mio
cene
Plio
.
2B
2A
1
Rec
over
y
Cor
e
Rec
over
y
Cor
e
1129C 1129D
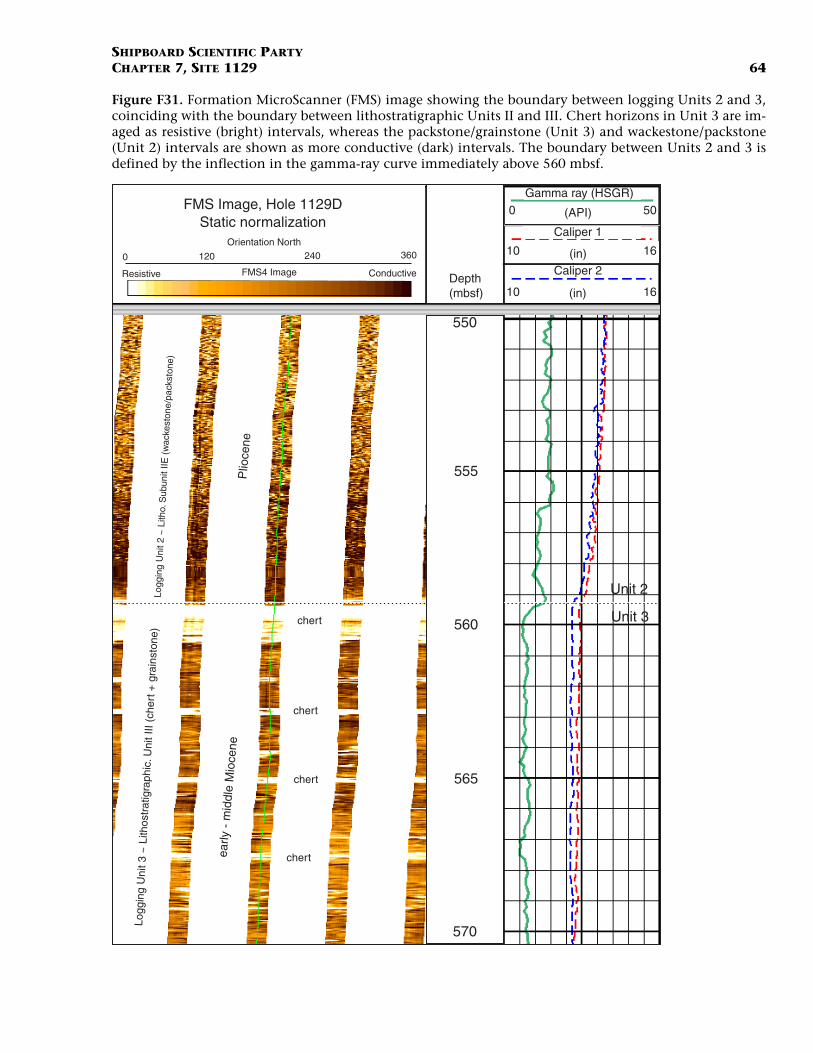
SHIPBOARD SCIENTIFIC PARTYCHAPTER 7, SITE 1129 64
Figure F31. Formation MicroScanner (FMS) image showing the boundary between logging Units 2 and 3,coinciding with the boundary between lithostratigraphic Units II and III. Chert horizons in Unit 3 are im-aged as resistive (bright) intervals, whereas the packstone/grainstone (Unit 3) and wackestone/packstone(Unit 2) intervals are shown as more conductive (dark) intervals. The boundary between Units 2 and 3 isdefined by the inflection in the gamma-ray curve immediately above 560 mbsf.
FMS Image, Hole 1129DStatic normalization
Orientation North
0 120 240 360
FMS4 ImageResistive Conductive Depth(mbsf)
555
560
565
570
550
0 50
10 16(in)
(in)10
Caliper 1
Gamma ray (HSGR)
(API)
Caliper 2
16
Logg
ing
Uni
t 3 ~
Lith
ostr
atig
raph
ic. U
nit I
II (c
hert
+ g
rain
ston
e)Lo
ggin
g U
nit 2
~ L
itho.
Sub
unit
IIE (
wac
kest
one/
pack
ston
e)
chert
chert
chert
chertearly
- m
iddl
e M
ioce
neP
lioce
ne
Unit 2
Unit 3
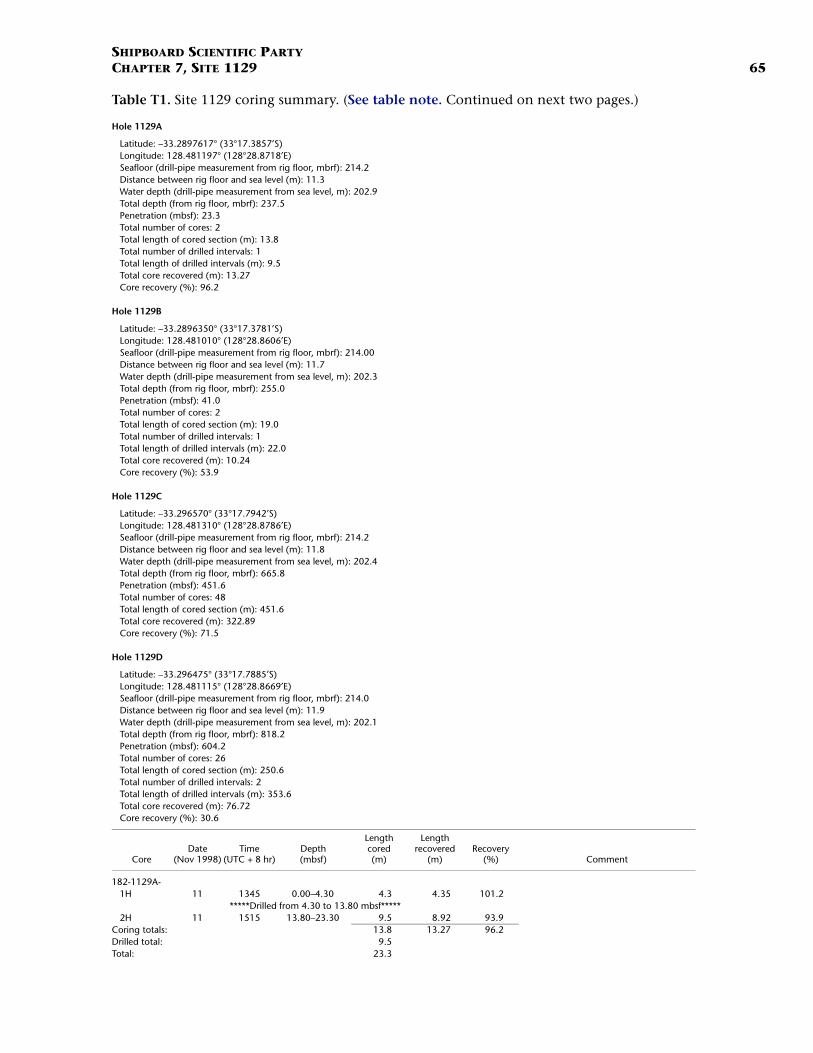
SHIPBOARD SCIENTIFIC PARTYCHAPTER 7, SITE 1129 65
Table T1. Site 1129 coring summary. (See table note. Continued on next two pages.)
Hole 1129A
Latitude: –33.2897617° (33°17.3857′S)Longitude: 128.481197° (128°28.8718′E)Seafloor (drill-pipe measurement from rig floor, mbrf): 214.2Distance between rig floor and sea level (m): 11.3Water depth (drill-pipe measurement from sea level, m): 202.9Total depth (from rig floor, mbrf): 237.5Penetration (mbsf): 23.3Total number of cores: 2Total length of cored section (m): 13.8Total number of drilled intervals: 1Total length of drilled intervals (m): 9.5Total core recovered (m): 13.27Core recovery (%): 96.2
Hole 1129B
Latitude: –33.2896350° (33°17.3781′S)Longitude: 128.481010° (128°28.8606′E)Seafloor (drill-pipe measurement from rig floor, mbrf): 214.00Distance between rig floor and sea level (m): 11.7Water depth (drill-pipe measurement from sea level, m): 202.3Total depth (from rig floor, mbrf): 255.0Penetration (mbsf): 41.0Total number of cores: 2Total length of cored section (m): 19.0Total number of drilled intervals: 1Total length of drilled intervals (m): 22.0Total core recovered (m): 10.24Core recovery (%): 53.9
Hole 1129C
Latitude: –33.296570° (33°17.7942′S)Longitude: 128.481310° (128°28.8786′E)Seafloor (drill-pipe measurement from rig floor, mbrf): 214.2Distance between rig floor and sea level (m): 11.8Water depth (drill-pipe measurement from sea level, m): 202.4Total depth (from rig floor, mbrf): 665.8Penetration (mbsf): 451.6Total number of cores: 48Total length of cored section (m): 451.6Total core recovered (m): 322.89Core recovery (%): 71.5
Hole 1129D
Latitude: –33.296475° (33°17.7885′S)Longitude: 128.481115° (128°28.8669′E)Seafloor (drill-pipe measurement from rig floor, mbrf): 214.0Distance between rig floor and sea level (m): 11.9 Water depth (drill-pipe measurement from sea level, m): 202.1Total depth (from rig floor, mbrf): 818.2Penetration (mbsf): 604.2Total number of cores: 26Total length of cored section (m): 250.6Total number of drilled intervals: 2Total length of drilled intervals (m): 353.6Total core recovered (m): 76.72Core recovery (%): 30.6
CoreDate
(Nov 1998)Time
(UTC + 8 hr)Depth(mbsf)
Lengthcored(m)
Lengthrecovered
(m)Recovery
(%) Comment
182-1129A-1H 11 1345 0.00–4.30 4.3 4.35 101.2
*****Drilled from 4.30 to 13.80 mbsf***** 2H 11 1515 13.80–23.30 9.5 8.92 93.9
Coring totals: 13.8 13.27 96.2Drilled total: 9.5Total: 23.3
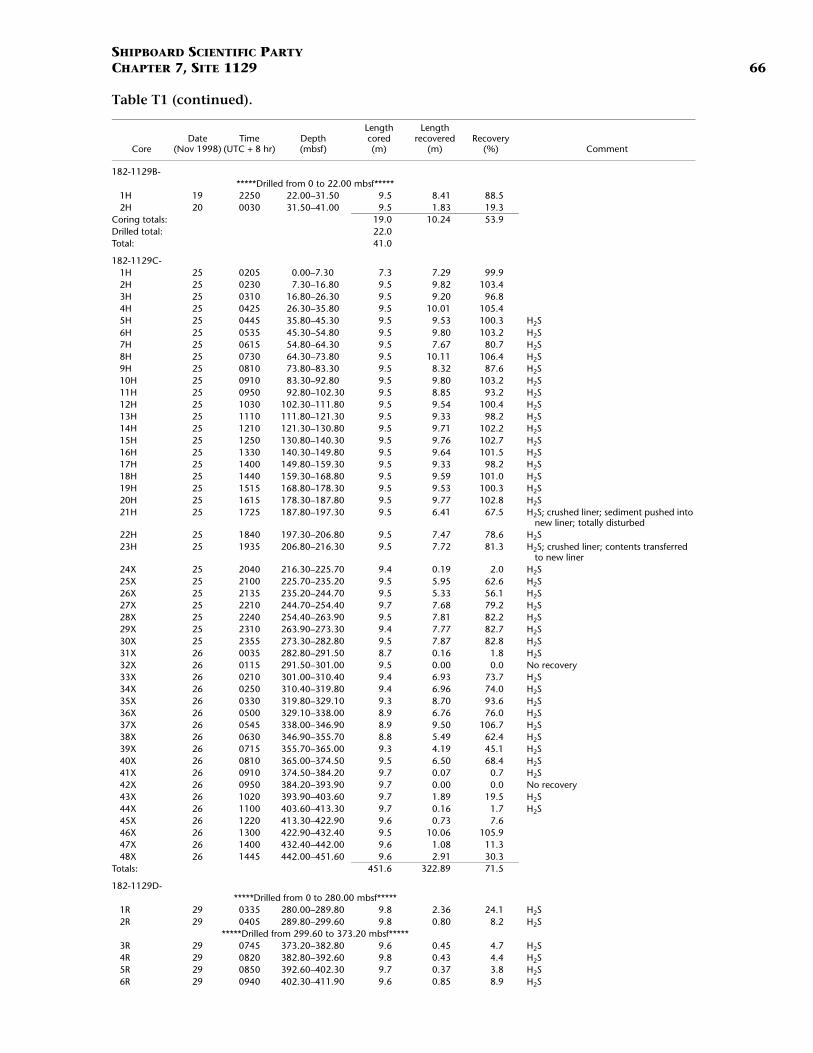
SHIPBOARD SCIENTIFIC PARTYCHAPTER 7, SITE 1129 66
182-1129B-*****Drilled from 0 to 22.00 mbsf*****
1H 19 2250 22.00–31.50 9.5 8.41 88.52H 20 0030 31.50–41.00 9.5 1.83 19.3
Coring totals: 19.0 10.24 53.9Drilled total: 22.0Total: 41.0
182-1129C-1H 25 0205 0.00–7.30 7.3 7.29 99.92H 25 0230 7.30–16.80 9.5 9.82 103.43H 25 0310 16.80–26.30 9.5 9.20 96.84H 25 0425 26.30–35.80 9.5 10.01 105.45H 25 0445 35.80–45.30 9.5 9.53 100.3 H2S6H 25 0535 45.30–54.80 9.5 9.80 103.2 H2S7H 25 0615 54.80–64.30 9.5 7.67 80.7 H2S8H 25 0730 64.30–73.80 9.5 10.11 106.4 H2S9H 25 0810 73.80–83.30 9.5 8.32 87.6 H2S10H 25 0910 83.30–92.80 9.5 9.80 103.2 H2S11H 25 0950 92.80–102.30 9.5 8.85 93.2 H2S12H 25 1030 102.30–111.80 9.5 9.54 100.4 H2S13H 25 1110 111.80–121.30 9.5 9.33 98.2 H2S14H 25 1210 121.30–130.80 9.5 9.71 102.2 H2S15H 25 1250 130.80–140.30 9.5 9.76 102.7 H2S16H 25 1330 140.30–149.80 9.5 9.64 101.5 H2S17H 25 1400 149.80–159.30 9.5 9.33 98.2 H2S18H 25 1440 159.30–168.80 9.5 9.59 101.0 H2S19H 25 1515 168.80–178.30 9.5 9.53 100.3 H2S20H 25 1615 178.30–187.80 9.5 9.77 102.8 H2S21H 25 1725 187.80–197.30 9.5 6.41 67.5 H2S; crushed liner; sediment pushed into
new liner; totally disturbed22H 25 1840 197.30–206.80 9.5 7.47 78.6 H2S23H 25 1935 206.80–216.30 9.5 7.72 81.3 H2S; crushed liner; contents transferred
to new liner24X 25 2040 216.30–225.70 9.4 0.19 2.0 H2S25X 25 2100 225.70–235.20 9.5 5.95 62.6 H2S26X 25 2135 235.20–244.70 9.5 5.33 56.1 H2S27X 25 2210 244.70–254.40 9.7 7.68 79.2 H2S28X 25 2240 254.40–263.90 9.5 7.81 82.2 H2S29X 25 2310 263.90–273.30 9.4 7.77 82.7 H2S30X 25 2355 273.30–282.80 9.5 7.87 82.8 H2S31X 26 0035 282.80–291.50 8.7 0.16 1.8 H2S32X 26 0115 291.50–301.00 9.5 0.00 0.0 No recovery33X 26 0210 301.00–310.40 9.4 6.93 73.7 H2S34X 26 0250 310.40–319.80 9.4 6.96 74.0 H2S35X 26 0330 319.80–329.10 9.3 8.70 93.6 H2S36X 26 0500 329.10–338.00 8.9 6.76 76.0 H2S37X 26 0545 338.00–346.90 8.9 9.50 106.7 H2S38X 26 0630 346.90–355.70 8.8 5.49 62.4 H2S39X 26 0715 355.70–365.00 9.3 4.19 45.1 H2S40X 26 0810 365.00–374.50 9.5 6.50 68.4 H2S41X 26 0910 374.50–384.20 9.7 0.07 0.7 H2S42X 26 0950 384.20–393.90 9.7 0.00 0.0 No recovery43X 26 1020 393.90–403.60 9.7 1.89 19.5 H2S44X 26 1100 403.60–413.30 9.7 0.16 1.7 H2S45X 26 1220 413.30–422.90 9.6 0.73 7.646X 26 1300 422.90–432.40 9.5 10.06 105.947X 26 1400 432.40–442.00 9.6 1.08 11.348X 26 1445 442.00–451.60 9.6 2.91 30.3
Totals: 451.6 322.89 71.5
182-1129D-*****Drilled from 0 to 280.00 mbsf*****
1R 29 0335 280.00–289.80 9.8 2.36 24.1 H2S2R 29 0405 289.80–299.60 9.8 0.80 8.2 H2S
*****Drilled from 299.60 to 373.20 mbsf*****3R 29 0745 373.20–382.80 9.6 0.45 4.7 H2S4R 29 0820 382.80–392.60 9.8 0.43 4.4 H2S5R 29 0850 392.60–402.30 9.7 0.37 3.8 H2S6R 29 0940 402.30–411.90 9.6 0.85 8.9 H2S
CoreDate
(Nov 1998)Time
(UTC + 8 hr)Depth(mbsf)
Lengthcored(m)
Lengthrecovered
(m)Recovery
(%) Comment
Table T1 (continued).
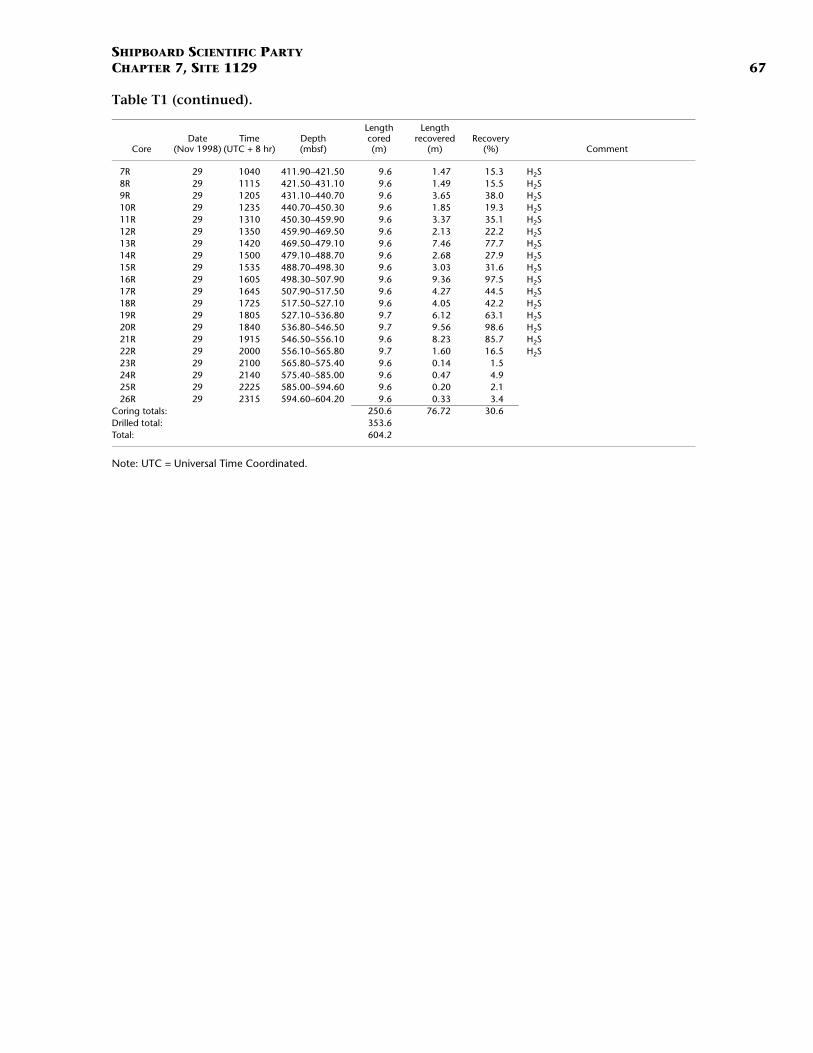
SHIPBOARD SCIENTIFIC PARTYCHAPTER 7, SITE 1129 67
Note: UTC = Universal Time Coordinated.
7R 29 1040 411.90–421.50 9.6 1.47 15.3 H2S8R 29 1115 421.50–431.10 9.6 1.49 15.5 H2S9R 29 1205 431.10–440.70 9.6 3.65 38.0 H2S10R 29 1235 440.70–450.30 9.6 1.85 19.3 H2S11R 29 1310 450.30–459.90 9.6 3.37 35.1 H2S12R 29 1350 459.90–469.50 9.6 2.13 22.2 H2S13R 29 1420 469.50–479.10 9.6 7.46 77.7 H2S14R 29 1500 479.10–488.70 9.6 2.68 27.9 H2S15R 29 1535 488.70–498.30 9.6 3.03 31.6 H2S16R 29 1605 498.30–507.90 9.6 9.36 97.5 H2S17R 29 1645 507.90–517.50 9.6 4.27 44.5 H2S18R 29 1725 517.50–527.10 9.6 4.05 42.2 H2S19R 29 1805 527.10–536.80 9.7 6.12 63.1 H2S20R 29 1840 536.80–546.50 9.7 9.56 98.6 H2S21R 29 1915 546.50–556.10 9.6 8.23 85.7 H2S22R 29 2000 556.10–565.80 9.7 1.60 16.5 H2S23R 29 2100 565.80–575.40 9.6 0.14 1.524R 29 2140 575.40–585.00 9.6 0.47 4.925R 29 2225 585.00–594.60 9.6 0.20 2.126R 29 2315 594.60–604.20 9.6 0.33 3.4
Coring totals: 250.6 76.72 30.6Drilled total: 353.6Total: 604.2
CoreDate
(Nov 1998)Time
(UTC + 8 hr)Depth(mbsf)
Lengthcored(m)
Lengthrecovered
(m)Recovery
(%) Comment
Table T1 (continued).
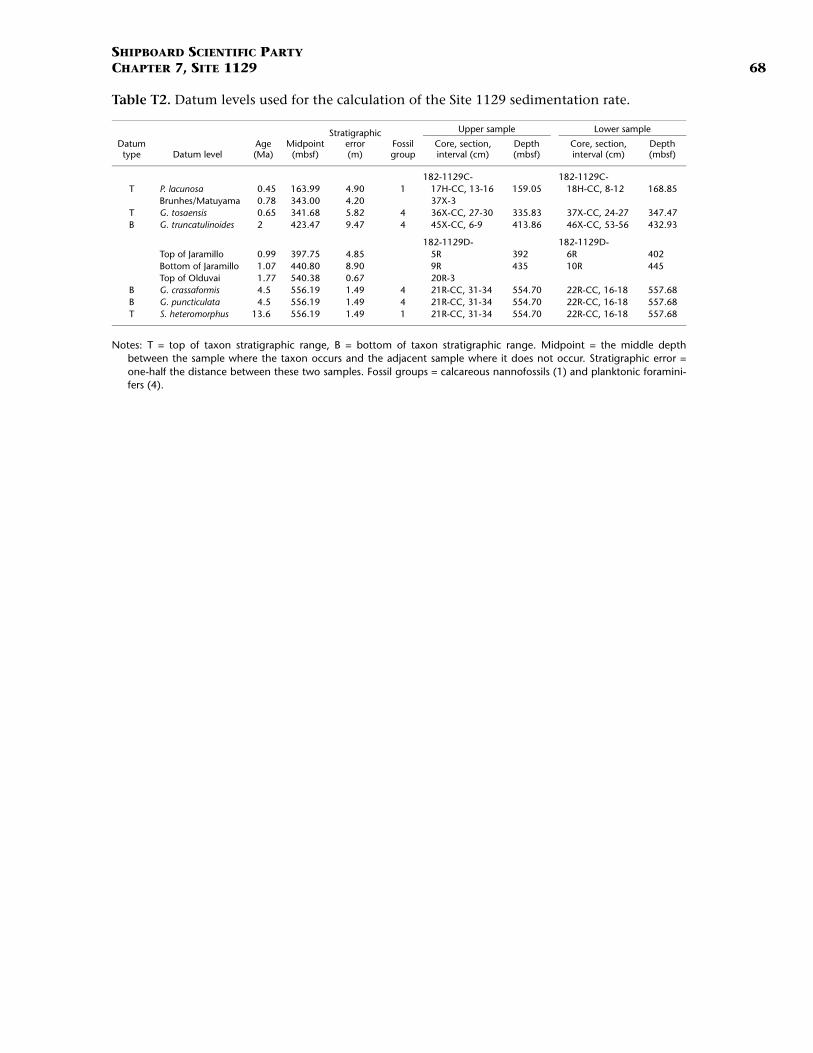
SHIPBOARD SCIENTIFIC PARTYCHAPTER 7, SITE 1129 68
Table T2. Datum levels used for the calculation of the Site 1129 sedimentation rate.
Notes: T = top of taxon stratigraphic range, B = bottom of taxon stratigraphic range. Midpoint = the middle depthbetween the sample where the taxon occurs and the adjacent sample where it does not occur. Stratigraphic error =one-half the distance between these two samples. Fossil groups = calcareous nannofossils (1) and planktonic foramini-fers (4).
Datumtype Datum level
Age(Ma)
Midpoint(mbsf)
Stratigraphicerror(m)
Fossilgroup
Upper sample Lower sample
Core, section,interval (cm)
Depth(mbsf)
Core, section,interval (cm)
Depth(mbsf)
182-1129C- 182-1129C-T P. lacunosa 0.45 163.99 4.90 1 17H-CC, 13-16 159.05 18H-CC, 8-12 168.85
Brunhes/Matuyama 0.78 343.00 4.20 37X-3T G. tosaensis 0.65 341.68 5.82 4 36X-CC, 27-30 335.83 37X-CC, 24-27 347.47B G. truncatulinoides 2 423.47 9.47 4 45X-CC, 6-9 413.86 46X-CC, 53-56 432.93
182-1129D- 182-1129D-Top of Jaramillo 0.99 397.75 4.85 5R 392 6R 402Bottom of Jaramillo 1.07 440.80 8.90 9R 435 10R 445Top of Olduvai 1.77 540.38 0.67 20R-3
B G. crassaformis 4.5 556.19 1.49 4 21R-CC, 31-34 554.70 22R-CC, 16-18 557.68B G. puncticulata 4.5 556.19 1.49 4 21R-CC, 31-34 554.70 22R-CC, 16-18 557.68T S. heteromorphus 13.6 556.19 1.49 1 21R-CC, 31-34 554.70 22R-CC, 16-18 557.68
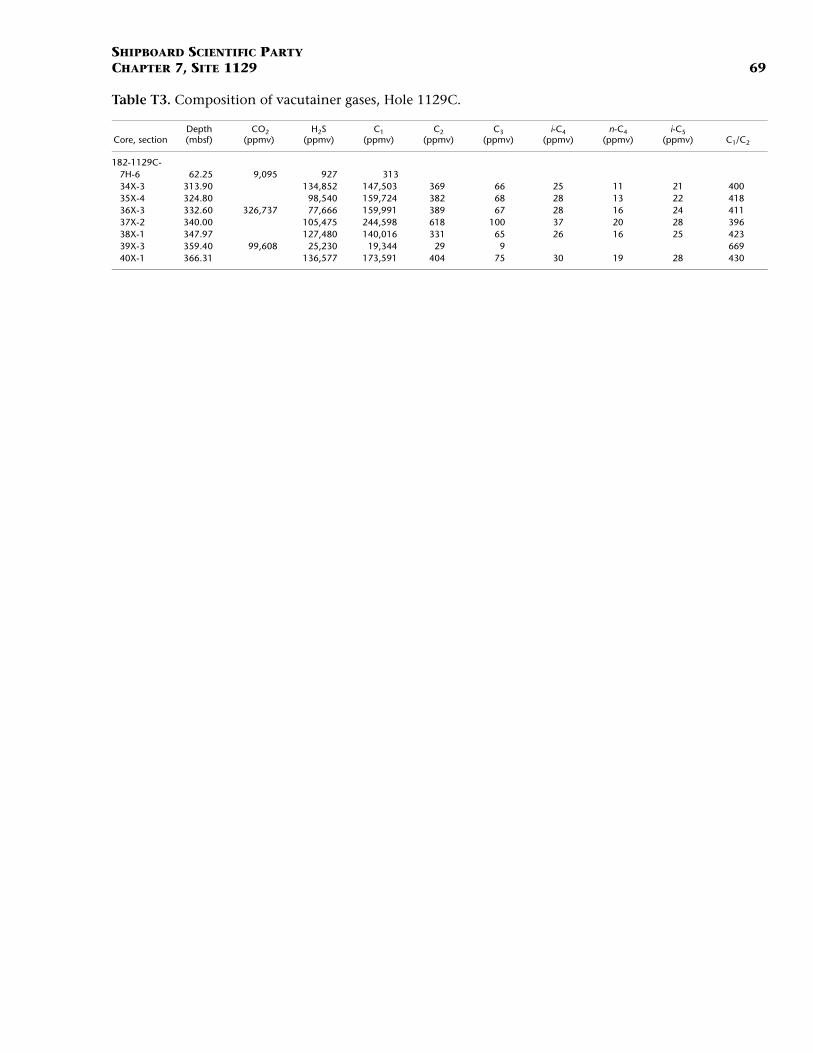
SHIPBOARD SCIENTIFIC PARTYCHAPTER 7, SITE 1129 69
Table T3. Composition of vacutainer gases, Hole 1129C.
Core, sectionDepth(mbsf)
CO2(ppmv)
H2S(ppmv)
C1(ppmv)
C2(ppmv)
C3(ppmv)
i-C4(ppmv)
n-C4(ppmv)
i-C5(ppmv) C1/C2
182-1129C- 7H-6 62.25 9,095 927 313 34X-3 313.90 134,852 147,503 369 66 25 11 21 40035X-4 324.80 98,540 159,724 382 68 28 13 22 41836X-3 332.60 326,737 77,666 159,991 389 67 28 16 24 41137X-2 340.00 105,475 244,598 618 100 37 20 28 39638X-1 347.97 127,480 140,016 331 65 26 16 25 42339X-3 359.40 99,608 25,230 19,344 29 9 66940X-1 366.31 136,577 173,591 404 75 30 19 28 430
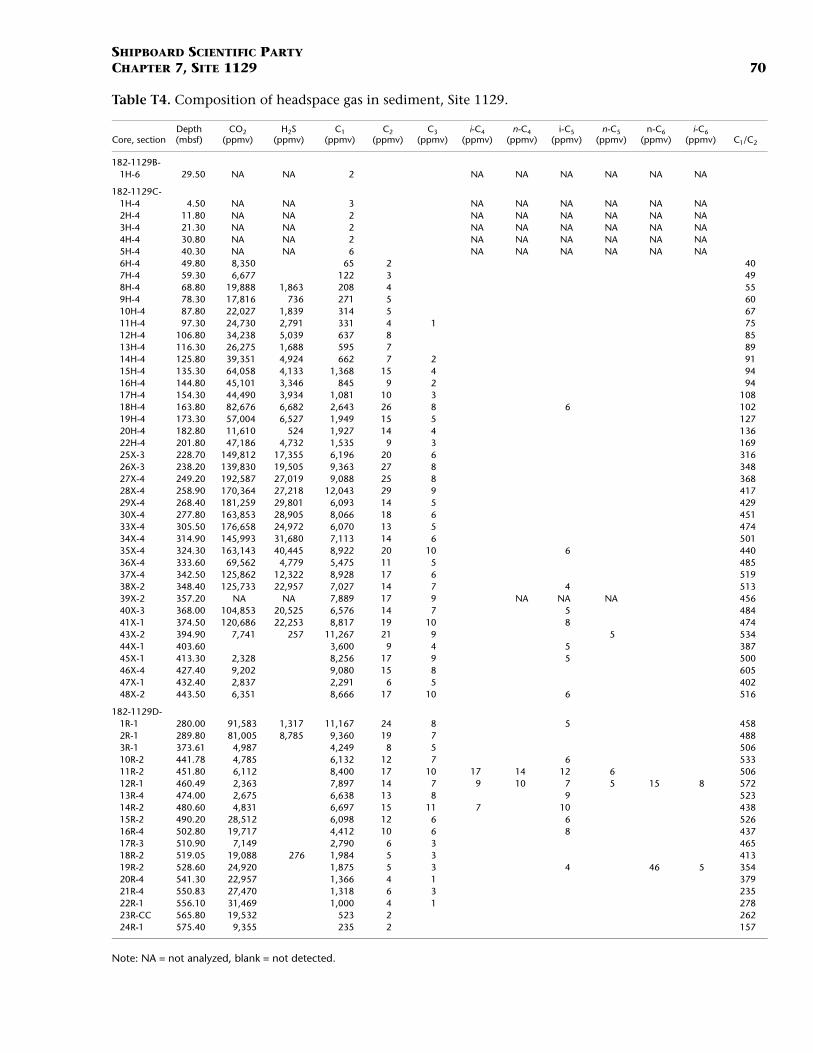
SHIPBOARD SCIENTIFIC PARTYCHAPTER 7, SITE 1129 70
Table T4. Composition of headspace gas in sediment, Site 1129.
Note: NA = not analyzed, blank = not detected.
Core, sectionDepth (mbsf)
CO2(ppmv)
H2S(ppmv)
C1(ppmv)
C2(ppmv)
C3(ppmv)
i-C4 (ppmv)
n-C4 (ppmv)
i-C5 (ppmv)
n-C5 (ppmv)
n-C6 (ppmv)
i-C6 (ppmv) C1/C2
182-1129B- 1H-6 29.50 NA NA 2 NA NA NA NA NA NA
182-1129C-1H-4 4.50 NA NA 3 NA NA NA NA NA NA2H-4 11.80 NA NA 2 NA NA NA NA NA NA3H-4 21.30 NA NA 2 NA NA NA NA NA NA4H-4 30.80 NA NA 2 NA NA NA NA NA NA5H-4 40.30 NA NA 6 NA NA NA NA NA NA6H-4 49.80 8,350 65 2 407H-4 59.30 6,677 122 3 498H-4 68.80 19,888 1,863 208 4 559H-4 78.30 17,816 736 271 5 6010H-4 87.80 22,027 1,839 314 5 6711H-4 97.30 24,730 2,791 331 4 1 7512H-4 106.80 34,238 5,039 637 8 8513H-4 116.30 26,275 1,688 595 7 8914H-4 125.80 39,351 4,924 662 7 2 9115H-4 135.30 64,058 4,133 1,368 15 4 9416H-4 144.80 45,101 3,346 845 9 2 9417H-4 154.30 44,490 3,934 1,081 10 3 10818H-4 163.80 82,676 6,682 2,643 26 8 6 10219H-4 173.30 57,004 6,527 1,949 15 5 12720H-4 182.80 11,610 524 1,927 14 4 13622H-4 201.80 47,186 4,732 1,535 9 3 16925X-3 228.70 149,812 17,355 6,196 20 6 31626X-3 238.20 139,830 19,505 9,363 27 8 34827X-4 249.20 192,587 27,019 9,088 25 8 36828X-4 258.90 170,364 27,218 12,043 29 9 41729X-4 268.40 181,259 29,801 6,093 14 5 42930X-4 277.80 163,853 28,905 8,066 18 6 45133X-4 305.50 176,658 24,972 6,070 13 5 47434X-4 314.90 145,993 31,680 7,113 14 6 50135X-4 324.30 163,143 40,445 8,922 20 10 6 44036X-4 333.60 69,562 4,779 5,475 11 5 48537X-4 342.50 125,862 12,322 8,928 17 6 51938X-2 348.40 125,733 22,957 7,027 14 7 4 51339X-2 357.20 NA NA 7,889 17 9 NA NA NA 45640X-3 368.00 104,853 20,525 6,576 14 7 5 48441X-1 374.50 120,686 22,253 8,817 19 10 8 47443X-2 394.90 7,741 257 11,267 21 9 5 53444X-1 403.60 3,600 9 4 5 38745X-1 413.30 2,328 8,256 17 9 5 50046X-4 427.40 9,202 9,080 15 8 60547X-1 432.40 2,837 2,291 6 5 40248X-2 443.50 6,351 8,666 17 10 6 516
182-1129D-1R-1 280.00 91,583 1,317 11,167 24 8 5 4582R-1 289.80 81,005 8,785 9,360 19 7 4883R-1 373.61 4,987 4,249 8 5 50610R-2 441.78 4,785 6,132 12 7 6 53311R-2 451.80 6,112 8,400 17 10 17 14 12 6 50612R-1 460.49 2,363 7,897 14 7 9 10 7 5 15 8 57213R-4 474.00 2,675 6,638 13 8 9 52314R-2 480.60 4,831 6,697 15 11 7 10 43815R-2 490.20 28,512 6,098 12 6 6 52616R-4 502.80 19,717 4,412 10 6 8 43717R-3 510.90 7,149 2,790 6 3 46518R-2 519.05 19,088 276 1,984 5 3 41319R-2 528.60 24,920 1,875 5 3 4 46 5 35420R-4 541.30 22,957 1,366 4 1 37921R-4 550.83 27,470 1,318 6 3 23522R-1 556.10 31,469 1,000 4 1 27823R-CC 565.80 19,532 523 2 26224R-1 575.40 9,355 235 2 157
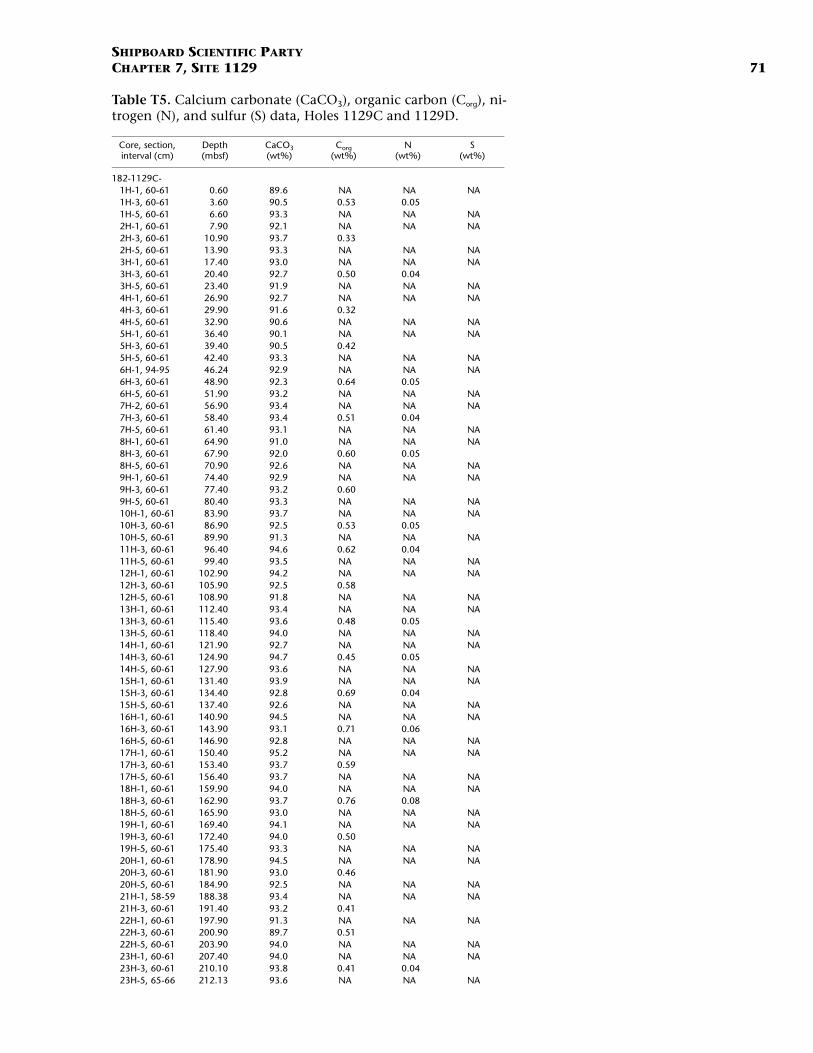
SHIPBOARD SCIENTIFIC PARTYCHAPTER 7, SITE 1129 71
Table T5. Calcium carbonate (CaCO3), organic carbon (Corg), ni-trogen (N), and sulfur (S) data, Holes 1129C and 1129D.
Core, section,interval (cm)
Depth(mbsf)
CaCO3(wt%)
Corg(wt%)
N(wt%)
S(wt%)
182-1129C-1H-1, 60-61 0.60 89.6 NA NA NA1H-3, 60-61 3.60 90.5 0.53 0.051H-5, 60-61 6.60 93.3 NA NA NA2H-1, 60-61 7.90 92.1 NA NA NA2H-3, 60-61 10.90 93.7 0.332H-5, 60-61 13.90 93.3 NA NA NA3H-1, 60-61 17.40 93.0 NA NA NA3H-3, 60-61 20.40 92.7 0.50 0.043H-5, 60-61 23.40 91.9 NA NA NA4H-1, 60-61 26.90 92.7 NA NA NA4H-3, 60-61 29.90 91.6 0.324H-5, 60-61 32.90 90.6 NA NA NA5H-1, 60-61 36.40 90.1 NA NA NA5H-3, 60-61 39.40 90.5 0.425H-5, 60-61 42.40 93.3 NA NA NA6H-1, 94-95 46.24 92.9 NA NA NA6H-3, 60-61 48.90 92.3 0.64 0.056H-5, 60-61 51.90 93.2 NA NA NA7H-2, 60-61 56.90 93.4 NA NA NA7H-3, 60-61 58.40 93.4 0.51 0.047H-5, 60-61 61.40 93.1 NA NA NA8H-1, 60-61 64.90 91.0 NA NA NA8H-3, 60-61 67.90 92.0 0.60 0.058H-5, 60-61 70.90 92.6 NA NA NA9H-1, 60-61 74.40 92.9 NA NA NA9H-3, 60-61 77.40 93.2 0.609H-5, 60-61 80.40 93.3 NA NA NA10H-1, 60-61 83.90 93.7 NA NA NA10H-3, 60-61 86.90 92.5 0.53 0.0510H-5, 60-61 89.90 91.3 NA NA NA11H-3, 60-61 96.40 94.6 0.62 0.0411H-5, 60-61 99.40 93.5 NA NA NA12H-1, 60-61 102.90 94.2 NA NA NA12H-3, 60-61 105.90 92.5 0.5812H-5, 60-61 108.90 91.8 NA NA NA13H-1, 60-61 112.40 93.4 NA NA NA13H-3, 60-61 115.40 93.6 0.48 0.0513H-5, 60-61 118.40 94.0 NA NA NA14H-1, 60-61 121.90 92.7 NA NA NA14H-3, 60-61 124.90 94.7 0.45 0.0514H-5, 60-61 127.90 93.6 NA NA NA15H-1, 60-61 131.40 93.9 NA NA NA15H-3, 60-61 134.40 92.8 0.69 0.0415H-5, 60-61 137.40 92.6 NA NA NA16H-1, 60-61 140.90 94.5 NA NA NA16H-3, 60-61 143.90 93.1 0.71 0.0616H-5, 60-61 146.90 92.8 NA NA NA17H-1, 60-61 150.40 95.2 NA NA NA17H-3, 60-61 153.40 93.7 0.5917H-5, 60-61 156.40 93.7 NA NA NA18H-1, 60-61 159.90 94.0 NA NA NA18H-3, 60-61 162.90 93.7 0.76 0.0818H-5, 60-61 165.90 93.0 NA NA NA19H-1, 60-61 169.40 94.1 NA NA NA19H-3, 60-61 172.40 94.0 0.5019H-5, 60-61 175.40 93.3 NA NA NA20H-1, 60-61 178.90 94.5 NA NA NA20H-3, 60-61 181.90 93.0 0.4620H-5, 60-61 184.90 92.5 NA NA NA21H-1, 58-59 188.38 93.4 NA NA NA21H-3, 60-61 191.40 93.2 0.4122H-1, 60-61 197.90 91.3 NA NA NA22H-3, 60-61 200.90 89.7 0.5122H-5, 60-61 203.90 94.0 NA NA NA23H-1, 60-61 207.40 94.0 NA NA NA23H-3, 60-61 210.10 93.8 0.41 0.0423H-5, 65-66 212.13 93.6 NA NA NA
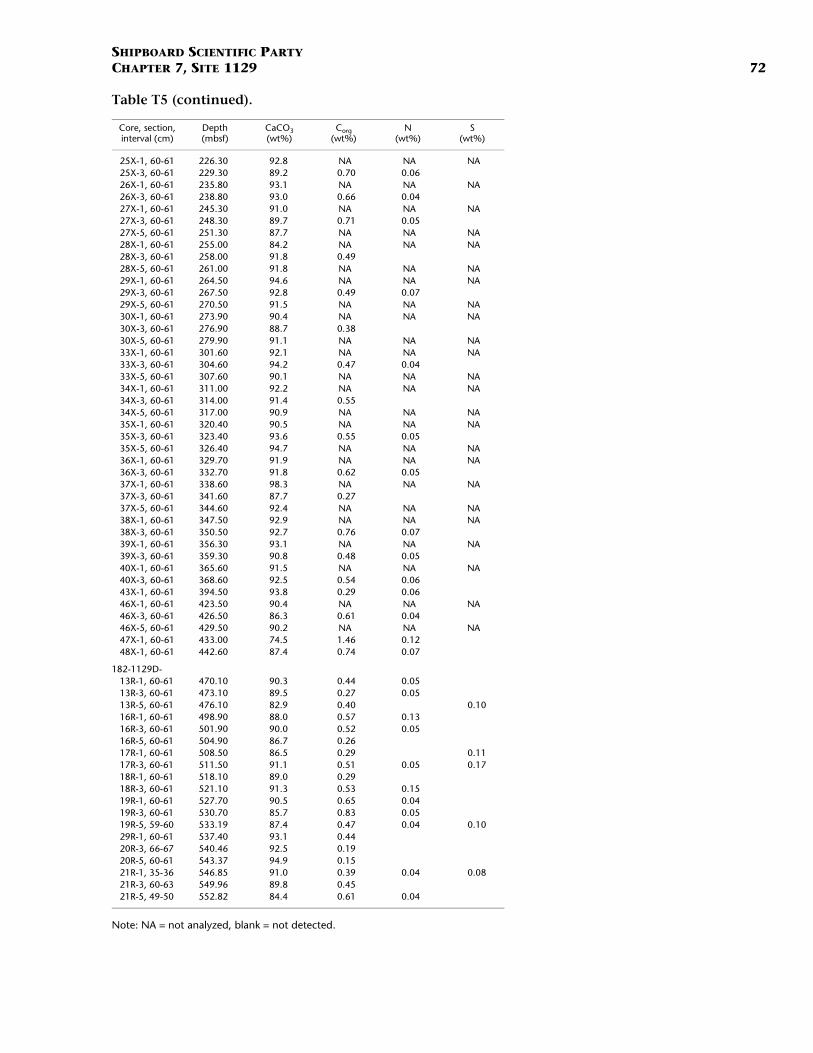
SHIPBOARD SCIENTIFIC PARTYCHAPTER 7, SITE 1129 72
Note: NA = not analyzed, blank = not detected.
25X-1, 60-61 226.30 92.8 NA NA NA25X-3, 60-61 229.30 89.2 0.70 0.0626X-1, 60-61 235.80 93.1 NA NA NA26X-3, 60-61 238.80 93.0 0.66 0.0427X-1, 60-61 245.30 91.0 NA NA NA27X-3, 60-61 248.30 89.7 0.71 0.0527X-5, 60-61 251.30 87.7 NA NA NA28X-1, 60-61 255.00 84.2 NA NA NA28X-3, 60-61 258.00 91.8 0.4928X-5, 60-61 261.00 91.8 NA NA NA29X-1, 60-61 264.50 94.6 NA NA NA29X-3, 60-61 267.50 92.8 0.49 0.0729X-5, 60-61 270.50 91.5 NA NA NA30X-1, 60-61 273.90 90.4 NA NA NA30X-3, 60-61 276.90 88.7 0.3830X-5, 60-61 279.90 91.1 NA NA NA33X-1, 60-61 301.60 92.1 NA NA NA33X-3, 60-61 304.60 94.2 0.47 0.0433X-5, 60-61 307.60 90.1 NA NA NA34X-1, 60-61 311.00 92.2 NA NA NA34X-3, 60-61 314.00 91.4 0.5534X-5, 60-61 317.00 90.9 NA NA NA35X-1, 60-61 320.40 90.5 NA NA NA35X-3, 60-61 323.40 93.6 0.55 0.0535X-5, 60-61 326.40 94.7 NA NA NA36X-1, 60-61 329.70 91.9 NA NA NA36X-3, 60-61 332.70 91.8 0.62 0.0537X-1, 60-61 338.60 98.3 NA NA NA37X-3, 60-61 341.60 87.7 0.2737X-5, 60-61 344.60 92.4 NA NA NA38X-1, 60-61 347.50 92.9 NA NA NA38X-3, 60-61 350.50 92.7 0.76 0.0739X-1, 60-61 356.30 93.1 NA NA NA39X-3, 60-61 359.30 90.8 0.48 0.0540X-1, 60-61 365.60 91.5 NA NA NA40X-3, 60-61 368.60 92.5 0.54 0.0643X-1, 60-61 394.50 93.8 0.29 0.0646X-1, 60-61 423.50 90.4 NA NA NA46X-3, 60-61 426.50 86.3 0.61 0.0446X-5, 60-61 429.50 90.2 NA NA NA47X-1, 60-61 433.00 74.5 1.46 0.1248X-1, 60-61 442.60 87.4 0.74 0.07
182-1129D- 13R-1, 60-61 470.10 90.3 0.44 0.0513R-3, 60-61 473.10 89.5 0.27 0.0513R-5, 60-61 476.10 82.9 0.40 0.1016R-1, 60-61 498.90 88.0 0.57 0.1316R-3, 60-61 501.90 90.0 0.52 0.0516R-5, 60-61 504.90 86.7 0.2617R-1, 60-61 508.50 86.5 0.29 0.1117R-3, 60-61 511.50 91.1 0.51 0.05 0.1718R-1, 60-61 518.10 89.0 0.2918R-3, 60-61 521.10 91.3 0.53 0.1519R-1, 60-61 527.70 90.5 0.65 0.0419R-3, 60-61 530.70 85.7 0.83 0.0519R-5, 59-60 533.19 87.4 0.47 0.04 0.1029R-1, 60-61 537.40 93.1 0.4420R-3, 66-67 540.46 92.5 0.1920R-5, 60-61 543.37 94.9 0.1521R-1, 35-36 546.85 91.0 0.39 0.04 0.0821R-3, 60-63 549.96 89.8 0.4521R-5, 49-50 552.82 84.4 0.61 0.04
Core, section,interval (cm)
Depth(mbsf)
CaCO3(wt%)
Corg(wt%)
N(wt%)
S(wt%)
Table T5 (continued).
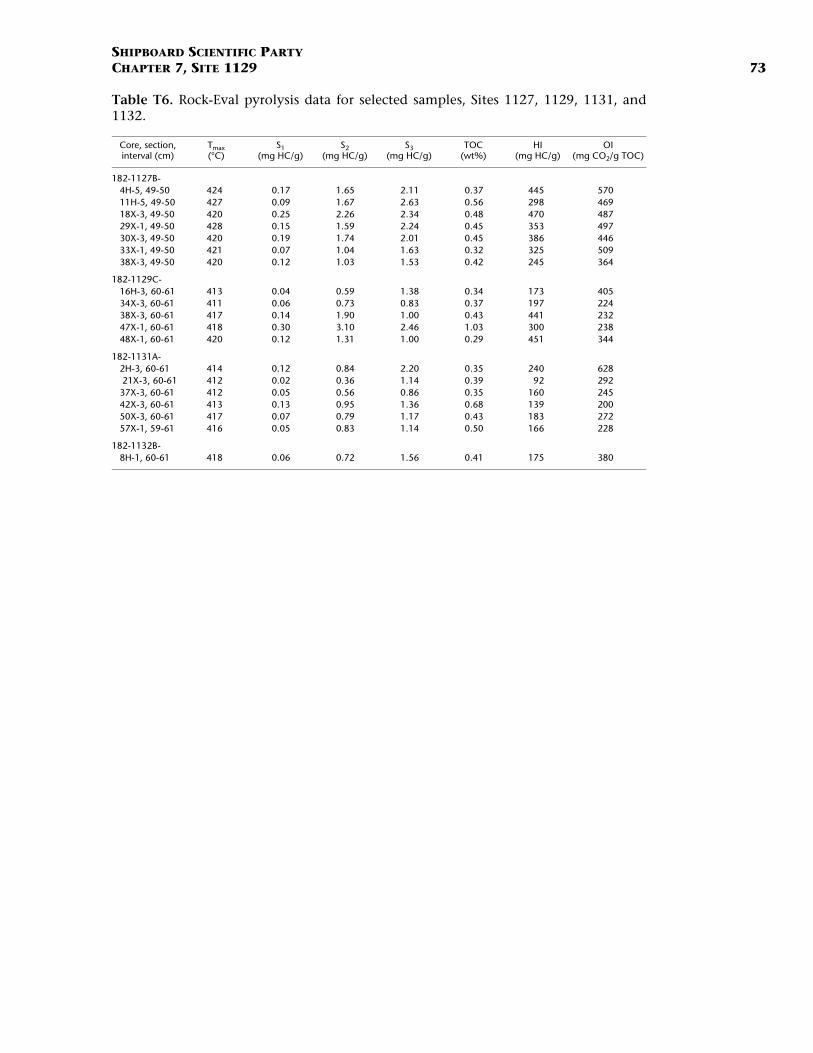
SHIPBOARD SCIENTIFIC PARTYCHAPTER 7, SITE 1129 73
Table T6. Rock-Eval pyrolysis data for selected samples, Sites 1127, 1129, 1131, and1132.
Core, section,interval (cm)
Tmax(°C)
S1(mg HC/g)
S2(mg HC/g)
S3(mg HC/g)
TOC(wt%)
HI(mg HC/g)
OI(mg CO2/g TOC)
182-1127B- 4H-5, 49-50 424 0.17 1.65 2.11 0.37 445 57011H-5, 49-50 427 0.09 1.67 2.63 0.56 298 46918X-3, 49-50 420 0.25 2.26 2.34 0.48 470 48729X-1, 49-50 428 0.15 1.59 2.24 0.45 353 49730X-3, 49-50 420 0.19 1.74 2.01 0.45 386 44633X-1, 49-50 421 0.07 1.04 1.63 0.32 325 50938X-3, 49-50 420 0.12 1.03 1.53 0.42 245 364
182-1129C-16H-3, 60-61 413 0.04 0.59 1.38 0.34 173 40534X-3, 60-61 411 0.06 0.73 0.83 0.37 197 22438X-3, 60-61 417 0.14 1.90 1.00 0.43 441 23247X-1, 60-61 418 0.30 3.10 2.46 1.03 300 23848X-1, 60-61 420 0.12 1.31 1.00 0.29 451 344
182-1131A-2H-3, 60-61 414 0.12 0.84 2.20 0.35 240 628 21X-3, 60-61 412 0.02 0.36 1.14 0.39 92 29237X-3, 60-61 412 0.05 0.56 0.86 0.35 160 24542X-3, 60-61 413 0.13 0.95 1.36 0.68 139 20050X-3, 60-61 417 0.07 0.79 1.17 0.43 183 27257X-1, 59-61 416 0.05 0.83 1.14 0.50 166 228
182-1132B-8H-1, 60-61 418 0.06 0.72 1.56 0.41 175 380
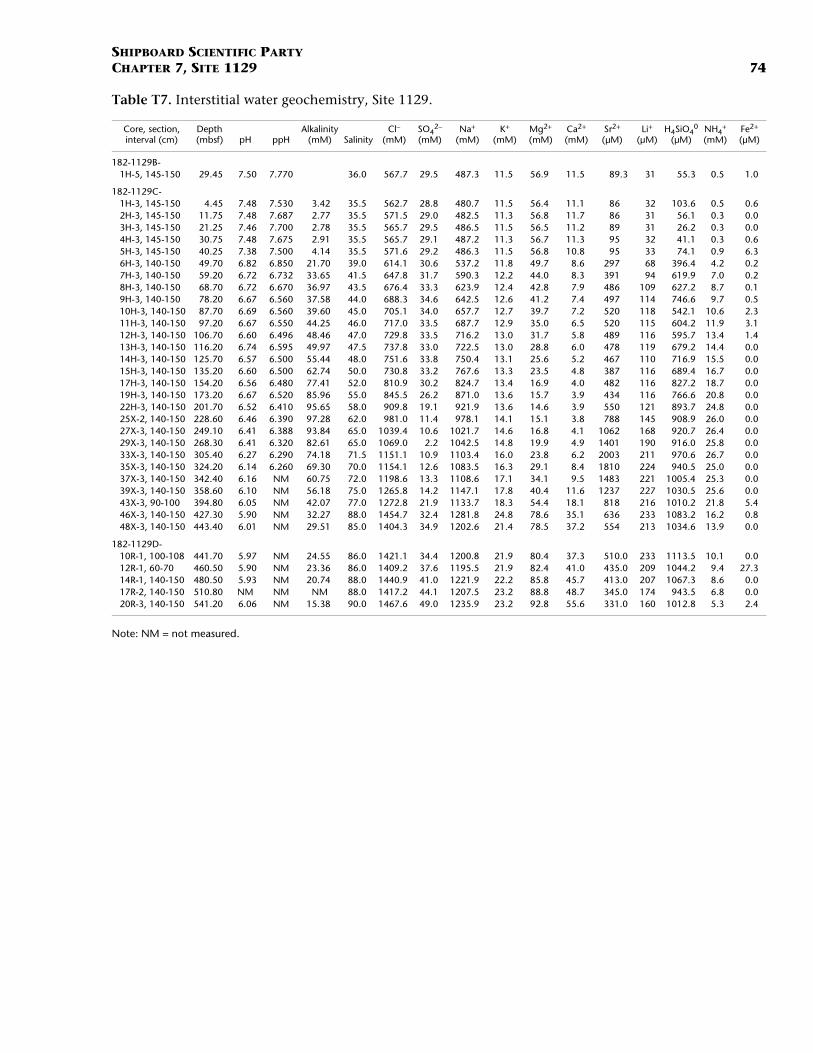
SHIPBOARD SCIENTIFIC PARTYCHAPTER 7, SITE 1129 74
Table T7. Interstitial water geochemistry, Site 1129.
Note: NM = not measured.
Core, section, interval (cm)
Depth (mbsf) pH ppH
Alkalinity (mM) Salinity
Cl– (mM)
SO42–
(mM)Na+
(mM)K+
(mM)Mg2+ (mM)
Ca2+ (mM)
Sr2+ (µM)
Li+
(µM)H4SiO4
0 (µM)
NH4+
(mM)Fe2+ (µM)
182-1129B-1H-5, 145-150 29.45 7.50 7.770 36.0 567.7 29.5 487.3 11.5 56.9 11.5 89.3 31 55.3 0.5 1.0
182-1129C-1H-3, 145-150 4.45 7.48 7.530 3.42 35.5 562.7 28.8 480.7 11.5 56.4 11.1 86 32 103.6 0.5 0.62H-3, 145-150 11.75 7.48 7.687 2.77 35.5 571.5 29.0 482.5 11.3 56.8 11.7 86 31 56.1 0.3 0.03H-3, 145-150 21.25 7.46 7.700 2.78 35.5 565.7 29.5 486.5 11.5 56.5 11.2 89 31 26.2 0.3 0.04H-3, 145-150 30.75 7.48 7.675 2.91 35.5 565.7 29.1 487.2 11.3 56.7 11.3 95 32 41.1 0.3 0.65H-3, 145-150 40.25 7.38 7.500 4.14 35.5 571.6 29.2 486.3 11.5 56.8 10.8 95 33 74.1 0.9 6.36H-3, 140-150 49.70 6.82 6.850 21.70 39.0 614.1 30.6 537.2 11.8 49.7 8.6 297 68 396.4 4.2 0.27H-3, 140-150 59.20 6.72 6.732 33.65 41.5 647.8 31.7 590.3 12.2 44.0 8.3 391 94 619.9 7.0 0.28H-3, 140-150 68.70 6.72 6.670 36.97 43.5 676.4 33.3 623.9 12.4 42.8 7.9 486 109 627.2 8.7 0.19H-3, 140-150 78.20 6.67 6.560 37.58 44.0 688.3 34.6 642.5 12.6 41.2 7.4 497 114 746.6 9.7 0.510H-3, 140-150 87.70 6.69 6.560 39.60 45.0 705.1 34.0 657.7 12.7 39.7 7.2 520 118 542.1 10.6 2.311H-3, 140-150 97.20 6.67 6.550 44.25 46.0 717.0 33.5 687.7 12.9 35.0 6.5 520 115 604.2 11.9 3.112H-3, 140-150 106.70 6.60 6.496 48.46 47.0 729.8 33.5 716.2 13.0 31.7 5.8 489 116 595.7 13.4 1.413H-3, 140-150 116.20 6.74 6.595 49.97 47.5 737.8 33.0 722.5 13.0 28.8 6.0 478 119 679.2 14.4 0.014H-3, 140-150 125.70 6.57 6.500 55.44 48.0 751.6 33.8 750.4 13.1 25.6 5.2 467 110 716.9 15.5 0.015H-3, 140-150 135.20 6.60 6.500 62.74 50.0 730.8 33.2 767.6 13.3 23.5 4.8 387 116 689.4 16.7 0.017H-3, 140-150 154.20 6.56 6.480 77.41 52.0 810.9 30.2 824.7 13.4 16.9 4.0 482 116 827.2 18.7 0.019H-3, 140-150 173.20 6.67 6.520 85.96 55.0 845.5 26.2 871.0 13.6 15.7 3.9 434 116 766.6 20.8 0.022H-3, 140-150 201.70 6.52 6.410 95.65 58.0 909.8 19.1 921.9 13.6 14.6 3.9 550 121 893.7 24.8 0.025X-2, 140-150 228.60 6.46 6.390 97.28 62.0 981.0 11.4 978.1 14.1 15.1 3.8 788 145 908.9 26.0 0.027X-3, 140-150 249.10 6.41 6.388 93.84 65.0 1039.4 10.6 1021.7 14.6 16.8 4.1 1062 168 920.7 26.4 0.029X-3, 140-150 268.30 6.41 6.320 82.61 65.0 1069.0 2.2 1042.5 14.8 19.9 4.9 1401 190 916.0 25.8 0.033X-3, 140-150 305.40 6.27 6.290 74.18 71.5 1151.1 10.9 1103.4 16.0 23.8 6.2 2003 211 970.6 26.7 0.035X-3, 140-150 324.20 6.14 6.260 69.30 70.0 1154.1 12.6 1083.5 16.3 29.1 8.4 1810 224 940.5 25.0 0.037X-3, 140-150 342.40 6.16 NM 60.75 72.0 1198.6 13.3 1108.6 17.1 34.1 9.5 1483 221 1005.4 25.3 0.039X-3, 140-150 358.60 6.10 NM 56.18 75.0 1265.8 14.2 1147.1 17.8 40.4 11.6 1237 227 1030.5 25.6 0.043X-3, 90-100 394.80 6.05 NM 42.07 77.0 1272.8 21.9 1133.7 18.3 54.4 18.1 818 216 1010.2 21.8 5.446X-3, 140-150 427.30 5.90 NM 32.27 88.0 1454.7 32.4 1281.8 24.8 78.6 35.1 636 233 1083.2 16.2 0.848X-3, 140-150 443.40 6.01 NM 29.51 85.0 1404.3 34.9 1202.6 21.4 78.5 37.2 554 213 1034.6 13.9 0.0
182-1129D-10R-1, 100-108 441.70 5.97 NM 24.55 86.0 1421.1 34.4 1200.8 21.9 80.4 37.3 510.0 233 1113.5 10.1 0.012R-1, 60-70 460.50 5.90 NM 23.36 86.0 1409.2 37.6 1195.5 21.9 82.4 41.0 435.0 209 1044.2 9.4 27.314R-1, 140-150 480.50 5.93 NM 20.74 88.0 1440.9 41.0 1221.9 22.2 85.8 45.7 413.0 207 1067.3 8.6 0.017R-2, 140-150 510.80 NM NM NM 88.0 1417.2 44.1 1207.5 23.2 88.8 48.7 345.0 174 943.5 6.8 0.020R-3, 140-150 541.20 6.06 NM 15.38 90.0 1467.6 49.0 1235.9 23.2 92.8 55.6 331.0 160 1012.8 5.3 2.4
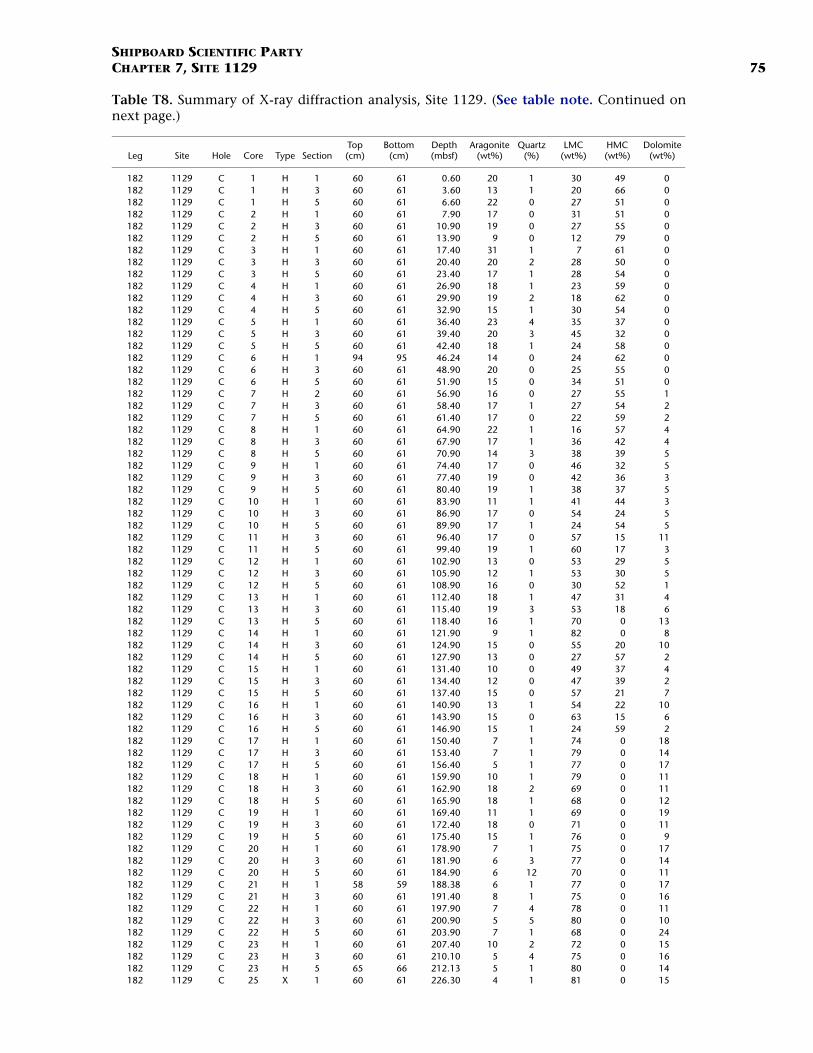
SHIPBOARD SCIENTIFIC PARTYCHAPTER 7, SITE 1129 75
Table T8. Summary of X-ray diffraction analysis, Site 1129. (See table note. Continued onnext page.)
Leg Site Hole Core Type SectionTop(cm)
Bottom(cm)
Depth(mbsf)
Aragonite(wt%)
Quartz(%)
LMC(wt%)
HMC(wt%)
Dolomite(wt%)
182 1129 C 1 H 1 60 61 0.60 20 1 30 49 0182 1129 C 1 H 3 60 61 3.60 13 1 20 66 0182 1129 C 1 H 5 60 61 6.60 22 0 27 51 0182 1129 C 2 H 1 60 61 7.90 17 0 31 51 0182 1129 C 2 H 3 60 61 10.90 19 0 27 55 0182 1129 C 2 H 5 60 61 13.90 9 0 12 79 0182 1129 C 3 H 1 60 61 17.40 31 1 7 61 0182 1129 C 3 H 3 60 61 20.40 20 2 28 50 0182 1129 C 3 H 5 60 61 23.40 17 1 28 54 0182 1129 C 4 H 1 60 61 26.90 18 1 23 59 0182 1129 C 4 H 3 60 61 29.90 19 2 18 62 0182 1129 C 4 H 5 60 61 32.90 15 1 30 54 0182 1129 C 5 H 1 60 61 36.40 23 4 35 37 0182 1129 C 5 H 3 60 61 39.40 20 3 45 32 0182 1129 C 5 H 5 60 61 42.40 18 1 24 58 0182 1129 C 6 H 1 94 95 46.24 14 0 24 62 0182 1129 C 6 H 3 60 61 48.90 20 0 25 55 0182 1129 C 6 H 5 60 61 51.90 15 0 34 51 0182 1129 C 7 H 2 60 61 56.90 16 0 27 55 1182 1129 C 7 H 3 60 61 58.40 17 1 27 54 2182 1129 C 7 H 5 60 61 61.40 17 0 22 59 2182 1129 C 8 H 1 60 61 64.90 22 1 16 57 4182 1129 C 8 H 3 60 61 67.90 17 1 36 42 4182 1129 C 8 H 5 60 61 70.90 14 3 38 39 5182 1129 C 9 H 1 60 61 74.40 17 0 46 32 5182 1129 C 9 H 3 60 61 77.40 19 0 42 36 3182 1129 C 9 H 5 60 61 80.40 19 1 38 37 5182 1129 C 10 H 1 60 61 83.90 11 1 41 44 3182 1129 C 10 H 3 60 61 86.90 17 0 54 24 5182 1129 C 10 H 5 60 61 89.90 17 1 24 54 5182 1129 C 11 H 3 60 61 96.40 17 0 57 15 11182 1129 C 11 H 5 60 61 99.40 19 1 60 17 3182 1129 C 12 H 1 60 61 102.90 13 0 53 29 5182 1129 C 12 H 3 60 61 105.90 12 1 53 30 5182 1129 C 12 H 5 60 61 108.90 16 0 30 52 1182 1129 C 13 H 1 60 61 112.40 18 1 47 31 4182 1129 C 13 H 3 60 61 115.40 19 3 53 18 6182 1129 C 13 H 5 60 61 118.40 16 1 70 0 13182 1129 C 14 H 1 60 61 121.90 9 1 82 0 8182 1129 C 14 H 3 60 61 124.90 15 0 55 20 10182 1129 C 14 H 5 60 61 127.90 13 0 27 57 2182 1129 C 15 H 1 60 61 131.40 10 0 49 37 4182 1129 C 15 H 3 60 61 134.40 12 0 47 39 2182 1129 C 15 H 5 60 61 137.40 15 0 57 21 7182 1129 C 16 H 1 60 61 140.90 13 1 54 22 10182 1129 C 16 H 3 60 61 143.90 15 0 63 15 6182 1129 C 16 H 5 60 61 146.90 15 1 24 59 2182 1129 C 17 H 1 60 61 150.40 7 1 74 0 18182 1129 C 17 H 3 60 61 153.40 7 1 79 0 14182 1129 C 17 H 5 60 61 156.40 5 1 77 0 17182 1129 C 18 H 1 60 61 159.90 10 1 79 0 11182 1129 C 18 H 3 60 61 162.90 18 2 69 0 11182 1129 C 18 H 5 60 61 165.90 18 1 68 0 12182 1129 C 19 H 1 60 61 169.40 11 1 69 0 19182 1129 C 19 H 3 60 61 172.40 18 0 71 0 11182 1129 C 19 H 5 60 61 175.40 15 1 76 0 9182 1129 C 20 H 1 60 61 178.90 7 1 75 0 17182 1129 C 20 H 3 60 61 181.90 6 3 77 0 14182 1129 C 20 H 5 60 61 184.90 6 12 70 0 11182 1129 C 21 H 1 58 59 188.38 6 1 77 0 17182 1129 C 21 H 3 60 61 191.40 8 1 75 0 16182 1129 C 22 H 1 60 61 197.90 7 4 78 0 11182 1129 C 22 H 3 60 61 200.90 5 5 80 0 10182 1129 C 22 H 5 60 61 203.90 7 1 68 0 24182 1129 C 23 H 1 60 61 207.40 10 2 72 0 15182 1129 C 23 H 3 60 61 210.10 5 4 75 0 16182 1129 C 23 H 5 65 66 212.13 5 1 80 0 14182 1129 C 25 X 1 60 61 226.30 4 1 81 0 15
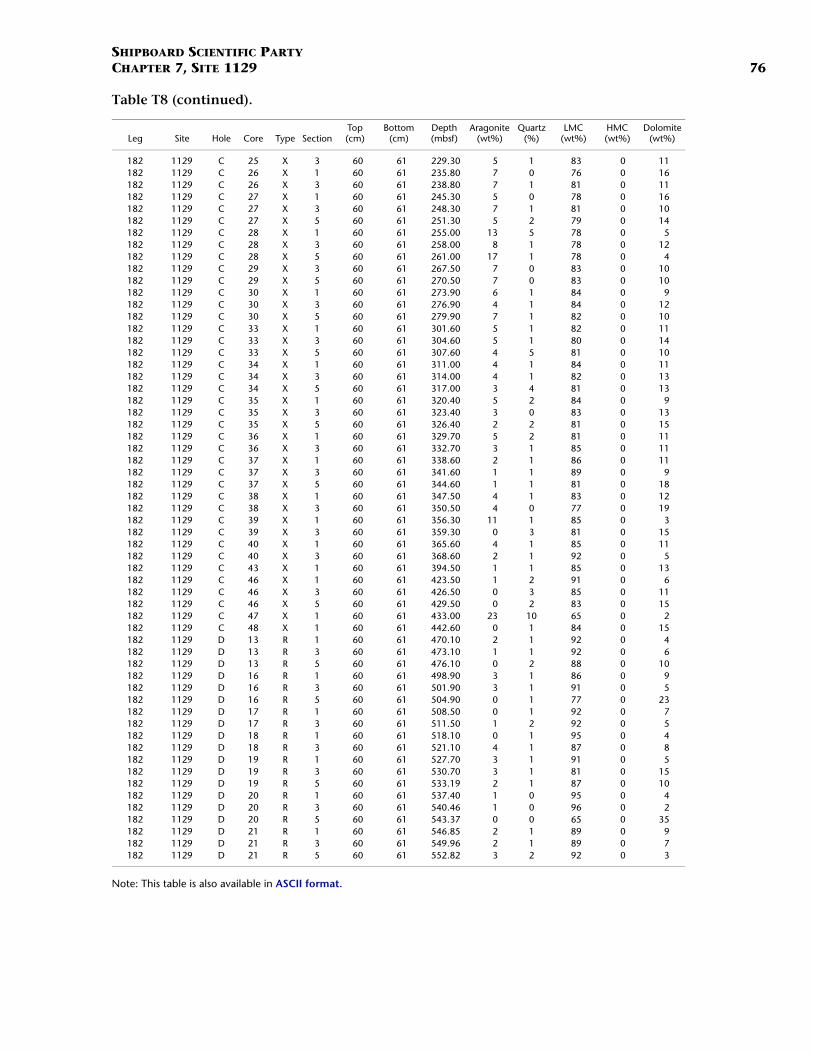
SHIPBOARD SCIENTIFIC PARTYCHAPTER 7, SITE 1129 76
Note: This table is also available in ASCII format.
182 1129 C 25 X 3 60 61 229.30 5 1 83 0 11182 1129 C 26 X 1 60 61 235.80 7 0 76 0 16182 1129 C 26 X 3 60 61 238.80 7 1 81 0 11182 1129 C 27 X 1 60 61 245.30 5 0 78 0 16182 1129 C 27 X 3 60 61 248.30 7 1 81 0 10182 1129 C 27 X 5 60 61 251.30 5 2 79 0 14182 1129 C 28 X 1 60 61 255.00 13 5 78 0 5182 1129 C 28 X 3 60 61 258.00 8 1 78 0 12182 1129 C 28 X 5 60 61 261.00 17 1 78 0 4182 1129 C 29 X 3 60 61 267.50 7 0 83 0 10182 1129 C 29 X 5 60 61 270.50 7 0 83 0 10182 1129 C 30 X 1 60 61 273.90 6 1 84 0 9182 1129 C 30 X 3 60 61 276.90 4 1 84 0 12182 1129 C 30 X 5 60 61 279.90 7 1 82 0 10182 1129 C 33 X 1 60 61 301.60 5 1 82 0 11182 1129 C 33 X 3 60 61 304.60 5 1 80 0 14182 1129 C 33 X 5 60 61 307.60 4 5 81 0 10182 1129 C 34 X 1 60 61 311.00 4 1 84 0 11182 1129 C 34 X 3 60 61 314.00 4 1 82 0 13182 1129 C 34 X 5 60 61 317.00 3 4 81 0 13182 1129 C 35 X 1 60 61 320.40 5 2 84 0 9182 1129 C 35 X 3 60 61 323.40 3 0 83 0 13182 1129 C 35 X 5 60 61 326.40 2 2 81 0 15182 1129 C 36 X 1 60 61 329.70 5 2 81 0 11182 1129 C 36 X 3 60 61 332.70 3 1 85 0 11182 1129 C 37 X 1 60 61 338.60 2 1 86 0 11182 1129 C 37 X 3 60 61 341.60 1 1 89 0 9182 1129 C 37 X 5 60 61 344.60 1 1 81 0 18182 1129 C 38 X 1 60 61 347.50 4 1 83 0 12182 1129 C 38 X 3 60 61 350.50 4 0 77 0 19182 1129 C 39 X 1 60 61 356.30 11 1 85 0 3182 1129 C 39 X 3 60 61 359.30 0 3 81 0 15182 1129 C 40 X 1 60 61 365.60 4 1 85 0 11182 1129 C 40 X 3 60 61 368.60 2 1 92 0 5182 1129 C 43 X 1 60 61 394.50 1 1 85 0 13182 1129 C 46 X 1 60 61 423.50 1 2 91 0 6182 1129 C 46 X 3 60 61 426.50 0 3 85 0 11182 1129 C 46 X 5 60 61 429.50 0 2 83 0 15182 1129 C 47 X 1 60 61 433.00 23 10 65 0 2182 1129 C 48 X 1 60 61 442.60 0 1 84 0 15182 1129 D 13 R 1 60 61 470.10 2 1 92 0 4182 1129 D 13 R 3 60 61 473.10 1 1 92 0 6182 1129 D 13 R 5 60 61 476.10 0 2 88 0 10182 1129 D 16 R 1 60 61 498.90 3 1 86 0 9182 1129 D 16 R 3 60 61 501.90 3 1 91 0 5182 1129 D 16 R 5 60 61 504.90 0 1 77 0 23182 1129 D 17 R 1 60 61 508.50 0 1 92 0 7182 1129 D 17 R 3 60 61 511.50 1 2 92 0 5182 1129 D 18 R 1 60 61 518.10 0 1 95 0 4182 1129 D 18 R 3 60 61 521.10 4 1 87 0 8182 1129 D 19 R 1 60 61 527.70 3 1 91 0 5182 1129 D 19 R 3 60 61 530.70 3 1 81 0 15182 1129 D 19 R 5 60 61 533.19 2 1 87 0 10182 1129 D 20 R 1 60 61 537.40 1 0 95 0 4182 1129 D 20 R 3 60 61 540.46 1 0 96 0 2182 1129 D 20 R 5 60 61 543.37 0 0 65 0 35182 1129 D 21 R 1 60 61 546.85 2 1 89 0 9182 1129 D 21 R 3 60 61 549.96 2 1 89 0 7182 1129 D 21 R 5 60 61 552.82 3 2 92 0 3
Leg Site Hole Core Type SectionTop(cm)
Bottom(cm)
Depth(mbsf)
Aragonite(wt%)
Quartz(%)
LMC(wt%)
HMC(wt%)
Dolomite(wt%)
Table T8 (continued).
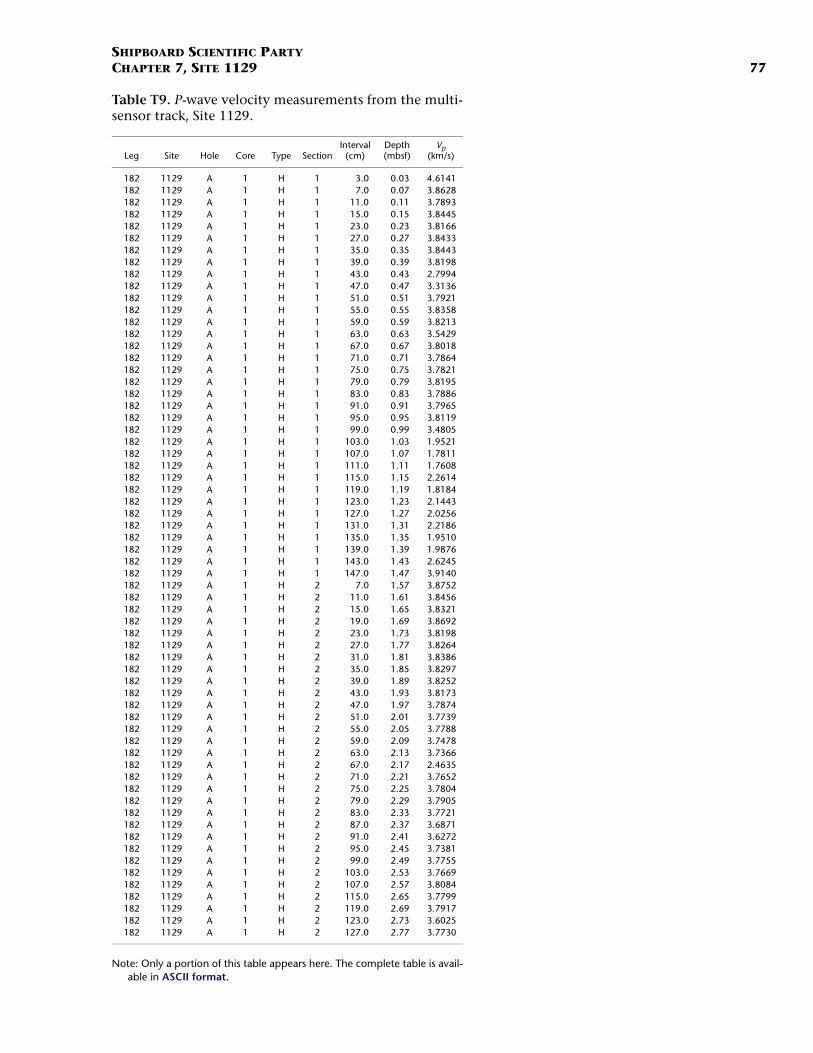
SHIPBOARD SCIENTIFIC PARTYCHAPTER 7, SITE 1129 77
Table T9. P-wave velocity measurements from the multi-sensor track, Site 1129.
Note: Only a portion of this table appears here. The complete table is avail-able in ASCII format.
Leg Site Hole Core Type SectionInterval
(cm)Depth (mbsf)
Vp (km/s)
182 1129 A 1 H 1 3.0 0.03 4.6141182 1129 A 1 H 1 7.0 0.07 3.8628182 1129 A 1 H 1 11.0 0.11 3.7893182 1129 A 1 H 1 15.0 0.15 3.8445182 1129 A 1 H 1 23.0 0.23 3.8166182 1129 A 1 H 1 27.0 0.27 3.8433182 1129 A 1 H 1 35.0 0.35 3.8443182 1129 A 1 H 1 39.0 0.39 3.8198182 1129 A 1 H 1 43.0 0.43 2.7994182 1129 A 1 H 1 47.0 0.47 3.3136182 1129 A 1 H 1 51.0 0.51 3.7921182 1129 A 1 H 1 55.0 0.55 3.8358182 1129 A 1 H 1 59.0 0.59 3.8213182 1129 A 1 H 1 63.0 0.63 3.5429182 1129 A 1 H 1 67.0 0.67 3.8018182 1129 A 1 H 1 71.0 0.71 3.7864182 1129 A 1 H 1 75.0 0.75 3.7821182 1129 A 1 H 1 79.0 0.79 3.8195182 1129 A 1 H 1 83.0 0.83 3.7886182 1129 A 1 H 1 91.0 0.91 3.7965182 1129 A 1 H 1 95.0 0.95 3.8119182 1129 A 1 H 1 99.0 0.99 3.4805182 1129 A 1 H 1 103.0 1.03 1.9521182 1129 A 1 H 1 107.0 1.07 1.7811182 1129 A 1 H 1 111.0 1.11 1.7608182 1129 A 1 H 1 115.0 1.15 2.2614182 1129 A 1 H 1 119.0 1.19 1.8184182 1129 A 1 H 1 123.0 1.23 2.1443182 1129 A 1 H 1 127.0 1.27 2.0256182 1129 A 1 H 1 131.0 1.31 2.2186182 1129 A 1 H 1 135.0 1.35 1.9510182 1129 A 1 H 1 139.0 1.39 1.9876182 1129 A 1 H 1 143.0 1.43 2.6245182 1129 A 1 H 1 147.0 1.47 3.9140182 1129 A 1 H 2 7.0 1.57 3.8752182 1129 A 1 H 2 11.0 1.61 3.8456182 1129 A 1 H 2 15.0 1.65 3.8321182 1129 A 1 H 2 19.0 1.69 3.8692182 1129 A 1 H 2 23.0 1.73 3.8198182 1129 A 1 H 2 27.0 1.77 3.8264182 1129 A 1 H 2 31.0 1.81 3.8386182 1129 A 1 H 2 35.0 1.85 3.8297182 1129 A 1 H 2 39.0 1.89 3.8252182 1129 A 1 H 2 43.0 1.93 3.8173182 1129 A 1 H 2 47.0 1.97 3.7874182 1129 A 1 H 2 51.0 2.01 3.7739182 1129 A 1 H 2 55.0 2.05 3.7788182 1129 A 1 H 2 59.0 2.09 3.7478182 1129 A 1 H 2 63.0 2.13 3.7366182 1129 A 1 H 2 67.0 2.17 2.4635182 1129 A 1 H 2 71.0 2.21 3.7652182 1129 A 1 H 2 75.0 2.25 3.7804182 1129 A 1 H 2 79.0 2.29 3.7905182 1129 A 1 H 2 83.0 2.33 3.7721182 1129 A 1 H 2 87.0 2.37 3.6871182 1129 A 1 H 2 91.0 2.41 3.6272182 1129 A 1 H 2 95.0 2.45 3.7381182 1129 A 1 H 2 99.0 2.49 3.7755182 1129 A 1 H 2 103.0 2.53 3.7669182 1129 A 1 H 2 107.0 2.57 3.8084182 1129 A 1 H 2 115.0 2.65 3.7799182 1129 A 1 H 2 119.0 2.69 3.7917182 1129 A 1 H 2 123.0 2.73 3.6025182 1129 A 1 H 2 127.0 2.77 3.7730
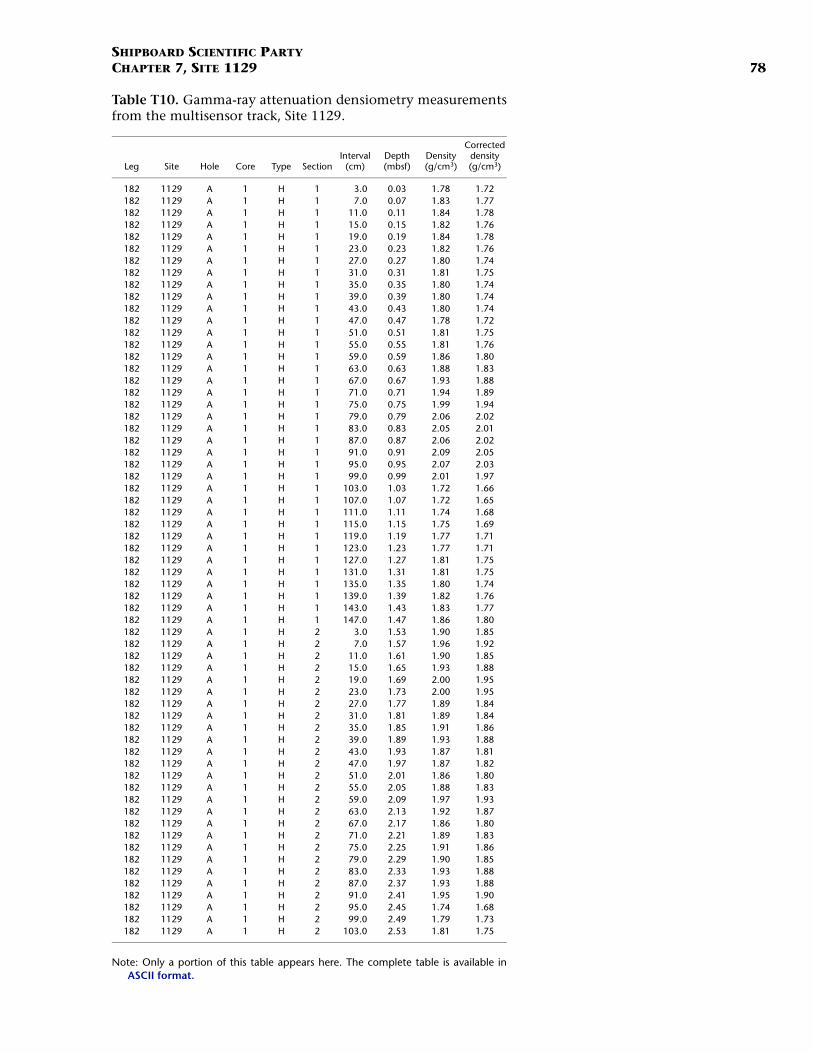
SHIPBOARD SCIENTIFIC PARTYCHAPTER 7, SITE 1129 78
Table T10. Gamma-ray attenuation densiometry measurementsfrom the multisensor track, Site 1129.
Note: Only a portion of this table appears here. The complete table is available inASCII format.
Leg Site Hole Core Type SectionInterval
(cm)Depth (mbsf)
Density (g/cm3)
Corrected density (g/cm3)
182 1129 A 1 H 1 3.0 0.03 1.78 1.72182 1129 A 1 H 1 7.0 0.07 1.83 1.77182 1129 A 1 H 1 11.0 0.11 1.84 1.78182 1129 A 1 H 1 15.0 0.15 1.82 1.76182 1129 A 1 H 1 19.0 0.19 1.84 1.78182 1129 A 1 H 1 23.0 0.23 1.82 1.76182 1129 A 1 H 1 27.0 0.27 1.80 1.74182 1129 A 1 H 1 31.0 0.31 1.81 1.75182 1129 A 1 H 1 35.0 0.35 1.80 1.74182 1129 A 1 H 1 39.0 0.39 1.80 1.74182 1129 A 1 H 1 43.0 0.43 1.80 1.74182 1129 A 1 H 1 47.0 0.47 1.78 1.72182 1129 A 1 H 1 51.0 0.51 1.81 1.75182 1129 A 1 H 1 55.0 0.55 1.81 1.76182 1129 A 1 H 1 59.0 0.59 1.86 1.80182 1129 A 1 H 1 63.0 0.63 1.88 1.83182 1129 A 1 H 1 67.0 0.67 1.93 1.88182 1129 A 1 H 1 71.0 0.71 1.94 1.89182 1129 A 1 H 1 75.0 0.75 1.99 1.94182 1129 A 1 H 1 79.0 0.79 2.06 2.02182 1129 A 1 H 1 83.0 0.83 2.05 2.01182 1129 A 1 H 1 87.0 0.87 2.06 2.02182 1129 A 1 H 1 91.0 0.91 2.09 2.05182 1129 A 1 H 1 95.0 0.95 2.07 2.03182 1129 A 1 H 1 99.0 0.99 2.01 1.97182 1129 A 1 H 1 103.0 1.03 1.72 1.66182 1129 A 1 H 1 107.0 1.07 1.72 1.65182 1129 A 1 H 1 111.0 1.11 1.74 1.68182 1129 A 1 H 1 115.0 1.15 1.75 1.69182 1129 A 1 H 1 119.0 1.19 1.77 1.71182 1129 A 1 H 1 123.0 1.23 1.77 1.71182 1129 A 1 H 1 127.0 1.27 1.81 1.75182 1129 A 1 H 1 131.0 1.31 1.81 1.75182 1129 A 1 H 1 135.0 1.35 1.80 1.74182 1129 A 1 H 1 139.0 1.39 1.82 1.76182 1129 A 1 H 1 143.0 1.43 1.83 1.77182 1129 A 1 H 1 147.0 1.47 1.86 1.80182 1129 A 1 H 2 3.0 1.53 1.90 1.85182 1129 A 1 H 2 7.0 1.57 1.96 1.92182 1129 A 1 H 2 11.0 1.61 1.90 1.85182 1129 A 1 H 2 15.0 1.65 1.93 1.88182 1129 A 1 H 2 19.0 1.69 2.00 1.95182 1129 A 1 H 2 23.0 1.73 2.00 1.95182 1129 A 1 H 2 27.0 1.77 1.89 1.84182 1129 A 1 H 2 31.0 1.81 1.89 1.84182 1129 A 1 H 2 35.0 1.85 1.91 1.86182 1129 A 1 H 2 39.0 1.89 1.93 1.88182 1129 A 1 H 2 43.0 1.93 1.87 1.81182 1129 A 1 H 2 47.0 1.97 1.87 1.82182 1129 A 1 H 2 51.0 2.01 1.86 1.80182 1129 A 1 H 2 55.0 2.05 1.88 1.83182 1129 A 1 H 2 59.0 2.09 1.97 1.93182 1129 A 1 H 2 63.0 2.13 1.92 1.87182 1129 A 1 H 2 67.0 2.17 1.86 1.80182 1129 A 1 H 2 71.0 2.21 1.89 1.83182 1129 A 1 H 2 75.0 2.25 1.91 1.86182 1129 A 1 H 2 79.0 2.29 1.90 1.85182 1129 A 1 H 2 83.0 2.33 1.93 1.88182 1129 A 1 H 2 87.0 2.37 1.93 1.88182 1129 A 1 H 2 91.0 2.41 1.95 1.90182 1129 A 1 H 2 95.0 2.45 1.74 1.68182 1129 A 1 H 2 99.0 2.49 1.79 1.73182 1129 A 1 H 2 103.0 2.53 1.81 1.75
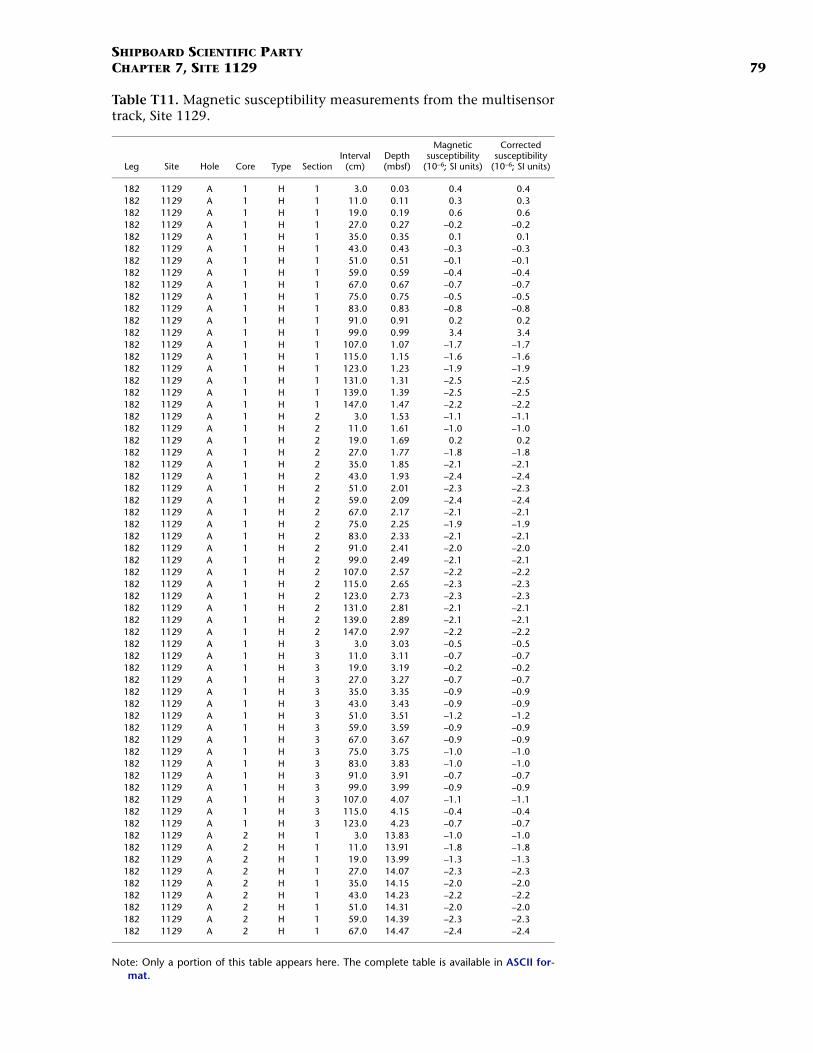
SHIPBOARD SCIENTIFIC PARTYCHAPTER 7, SITE 1129 79
Table T11. Magnetic susceptibility measurements from the multisensortrack, Site 1129.
Note: Only a portion of this table appears here. The complete table is available in ASCII for-mat.
Leg Site Hole Core Type SectionInterval
(cm) Depth (mbsf)
Magnetic susceptibility
(10–6; SI units)
Corrected susceptibility
(10–6; SI units)
182 1129 A 1 H 1 3.0 0.03 0.4 0.4182 1129 A 1 H 1 11.0 0.11 0.3 0.3182 1129 A 1 H 1 19.0 0.19 0.6 0.6182 1129 A 1 H 1 27.0 0.27 –0.2 –0.2182 1129 A 1 H 1 35.0 0.35 0.1 0.1182 1129 A 1 H 1 43.0 0.43 –0.3 –0.3182 1129 A 1 H 1 51.0 0.51 –0.1 –0.1182 1129 A 1 H 1 59.0 0.59 –0.4 –0.4182 1129 A 1 H 1 67.0 0.67 –0.7 –0.7182 1129 A 1 H 1 75.0 0.75 –0.5 –0.5182 1129 A 1 H 1 83.0 0.83 –0.8 –0.8182 1129 A 1 H 1 91.0 0.91 0.2 0.2182 1129 A 1 H 1 99.0 0.99 3.4 3.4182 1129 A 1 H 1 107.0 1.07 –1.7 –1.7182 1129 A 1 H 1 115.0 1.15 –1.6 –1.6182 1129 A 1 H 1 123.0 1.23 –1.9 –1.9182 1129 A 1 H 1 131.0 1.31 –2.5 –2.5182 1129 A 1 H 1 139.0 1.39 –2.5 –2.5182 1129 A 1 H 1 147.0 1.47 –2.2 –2.2182 1129 A 1 H 2 3.0 1.53 –1.1 –1.1182 1129 A 1 H 2 11.0 1.61 –1.0 –1.0182 1129 A 1 H 2 19.0 1.69 0.2 0.2182 1129 A 1 H 2 27.0 1.77 –1.8 –1.8182 1129 A 1 H 2 35.0 1.85 –2.1 –2.1182 1129 A 1 H 2 43.0 1.93 –2.4 –2.4182 1129 A 1 H 2 51.0 2.01 –2.3 –2.3182 1129 A 1 H 2 59.0 2.09 –2.4 –2.4182 1129 A 1 H 2 67.0 2.17 –2.1 –2.1182 1129 A 1 H 2 75.0 2.25 –1.9 –1.9182 1129 A 1 H 2 83.0 2.33 –2.1 –2.1182 1129 A 1 H 2 91.0 2.41 –2.0 –2.0182 1129 A 1 H 2 99.0 2.49 –2.1 –2.1182 1129 A 1 H 2 107.0 2.57 –2.2 –2.2182 1129 A 1 H 2 115.0 2.65 –2.3 –2.3182 1129 A 1 H 2 123.0 2.73 –2.3 –2.3182 1129 A 1 H 2 131.0 2.81 –2.1 –2.1182 1129 A 1 H 2 139.0 2.89 –2.1 –2.1182 1129 A 1 H 2 147.0 2.97 –2.2 –2.2182 1129 A 1 H 3 3.0 3.03 –0.5 –0.5182 1129 A 1 H 3 11.0 3.11 –0.7 –0.7182 1129 A 1 H 3 19.0 3.19 –0.2 –0.2182 1129 A 1 H 3 27.0 3.27 –0.7 –0.7182 1129 A 1 H 3 35.0 3.35 –0.9 –0.9182 1129 A 1 H 3 43.0 3.43 –0.9 –0.9182 1129 A 1 H 3 51.0 3.51 –1.2 –1.2182 1129 A 1 H 3 59.0 3.59 –0.9 –0.9182 1129 A 1 H 3 67.0 3.67 –0.9 –0.9182 1129 A 1 H 3 75.0 3.75 –1.0 –1.0182 1129 A 1 H 3 83.0 3.83 –1.0 –1.0182 1129 A 1 H 3 91.0 3.91 –0.7 –0.7182 1129 A 1 H 3 99.0 3.99 –0.9 –0.9182 1129 A 1 H 3 107.0 4.07 –1.1 –1.1182 1129 A 1 H 3 115.0 4.15 –0.4 –0.4182 1129 A 1 H 3 123.0 4.23 –0.7 –0.7182 1129 A 2 H 1 3.0 13.83 –1.0 –1.0182 1129 A 2 H 1 11.0 13.91 –1.8 –1.8182 1129 A 2 H 1 19.0 13.99 –1.3 –1.3182 1129 A 2 H 1 27.0 14.07 –2.3 –2.3182 1129 A 2 H 1 35.0 14.15 –2.0 –2.0182 1129 A 2 H 1 43.0 14.23 –2.2 –2.2182 1129 A 2 H 1 51.0 14.31 –2.0 –2.0182 1129 A 2 H 1 59.0 14.39 –2.3 –2.3182 1129 A 2 H 1 67.0 14.47 –2.4 –2.4
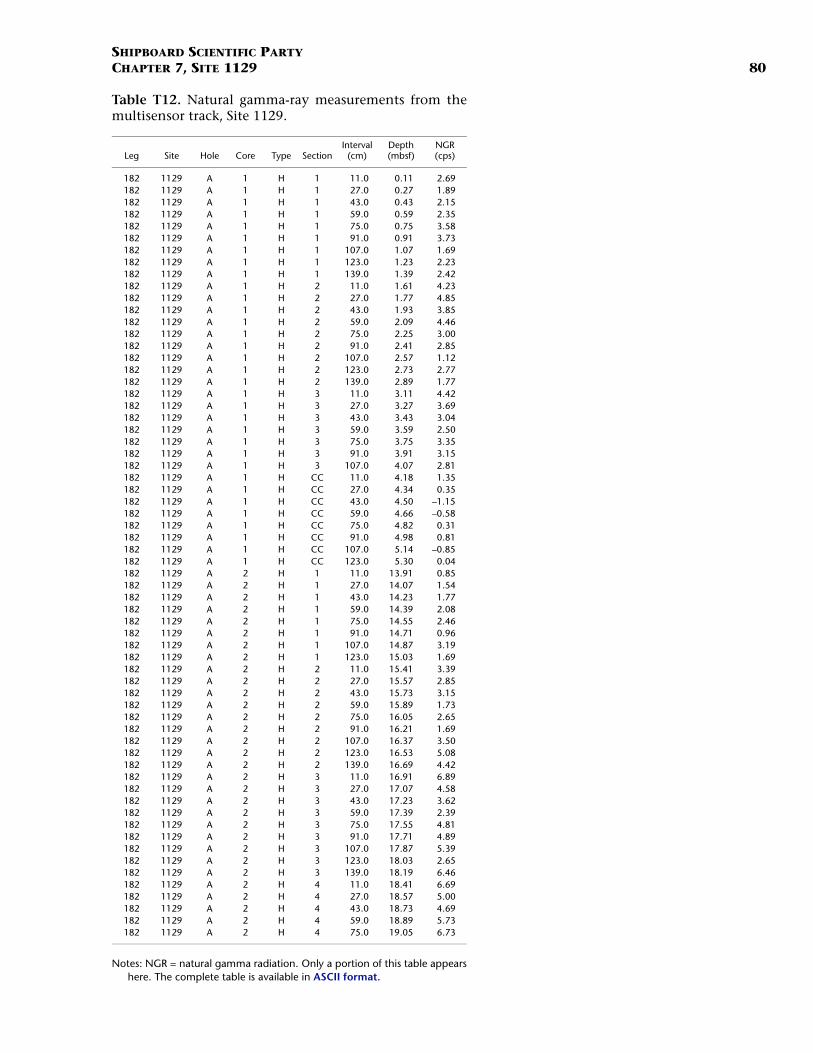
SHIPBOARD SCIENTIFIC PARTYCHAPTER 7, SITE 1129 80
Table T12. Natural gamma-ray measurements from themultisensor track, Site 1129.
Notes: NGR = natural gamma radiation. Only a portion of this table appearshere. The complete table is available in ASCII format.
Leg Site Hole Core Type SectionInterval
(cm)Depth (mbsf)
NGR (cps)
182 1129 A 1 H 1 11.0 0.11 2.69182 1129 A 1 H 1 27.0 0.27 1.89182 1129 A 1 H 1 43.0 0.43 2.15182 1129 A 1 H 1 59.0 0.59 2.35182 1129 A 1 H 1 75.0 0.75 3.58182 1129 A 1 H 1 91.0 0.91 3.73182 1129 A 1 H 1 107.0 1.07 1.69182 1129 A 1 H 1 123.0 1.23 2.23182 1129 A 1 H 1 139.0 1.39 2.42182 1129 A 1 H 2 11.0 1.61 4.23182 1129 A 1 H 2 27.0 1.77 4.85182 1129 A 1 H 2 43.0 1.93 3.85182 1129 A 1 H 2 59.0 2.09 4.46182 1129 A 1 H 2 75.0 2.25 3.00182 1129 A 1 H 2 91.0 2.41 2.85182 1129 A 1 H 2 107.0 2.57 1.12182 1129 A 1 H 2 123.0 2.73 2.77182 1129 A 1 H 2 139.0 2.89 1.77182 1129 A 1 H 3 11.0 3.11 4.42182 1129 A 1 H 3 27.0 3.27 3.69182 1129 A 1 H 3 43.0 3.43 3.04182 1129 A 1 H 3 59.0 3.59 2.50182 1129 A 1 H 3 75.0 3.75 3.35182 1129 A 1 H 3 91.0 3.91 3.15182 1129 A 1 H 3 107.0 4.07 2.81182 1129 A 1 H CC 11.0 4.18 1.35182 1129 A 1 H CC 27.0 4.34 0.35182 1129 A 1 H CC 43.0 4.50 –1.15182 1129 A 1 H CC 59.0 4.66 –0.58182 1129 A 1 H CC 75.0 4.82 0.31182 1129 A 1 H CC 91.0 4.98 0.81182 1129 A 1 H CC 107.0 5.14 –0.85182 1129 A 1 H CC 123.0 5.30 0.04182 1129 A 2 H 1 11.0 13.91 0.85182 1129 A 2 H 1 27.0 14.07 1.54182 1129 A 2 H 1 43.0 14.23 1.77182 1129 A 2 H 1 59.0 14.39 2.08182 1129 A 2 H 1 75.0 14.55 2.46182 1129 A 2 H 1 91.0 14.71 0.96182 1129 A 2 H 1 107.0 14.87 3.19182 1129 A 2 H 1 123.0 15.03 1.69182 1129 A 2 H 2 11.0 15.41 3.39182 1129 A 2 H 2 27.0 15.57 2.85182 1129 A 2 H 2 43.0 15.73 3.15182 1129 A 2 H 2 59.0 15.89 1.73182 1129 A 2 H 2 75.0 16.05 2.65182 1129 A 2 H 2 91.0 16.21 1.69182 1129 A 2 H 2 107.0 16.37 3.50182 1129 A 2 H 2 123.0 16.53 5.08182 1129 A 2 H 2 139.0 16.69 4.42182 1129 A 2 H 3 11.0 16.91 6.89182 1129 A 2 H 3 27.0 17.07 4.58182 1129 A 2 H 3 43.0 17.23 3.62182 1129 A 2 H 3 59.0 17.39 2.39182 1129 A 2 H 3 75.0 17.55 4.81182 1129 A 2 H 3 91.0 17.71 4.89182 1129 A 2 H 3 107.0 17.87 5.39182 1129 A 2 H 3 123.0 18.03 2.65182 1129 A 2 H 3 139.0 18.19 6.46182 1129 A 2 H 4 11.0 18.41 6.69182 1129 A 2 H 4 27.0 18.57 5.00182 1129 A 2 H 4 43.0 18.73 4.69182 1129 A 2 H 4 59.0 18.89 5.73182 1129 A 2 H 4 75.0 19.05 6.73
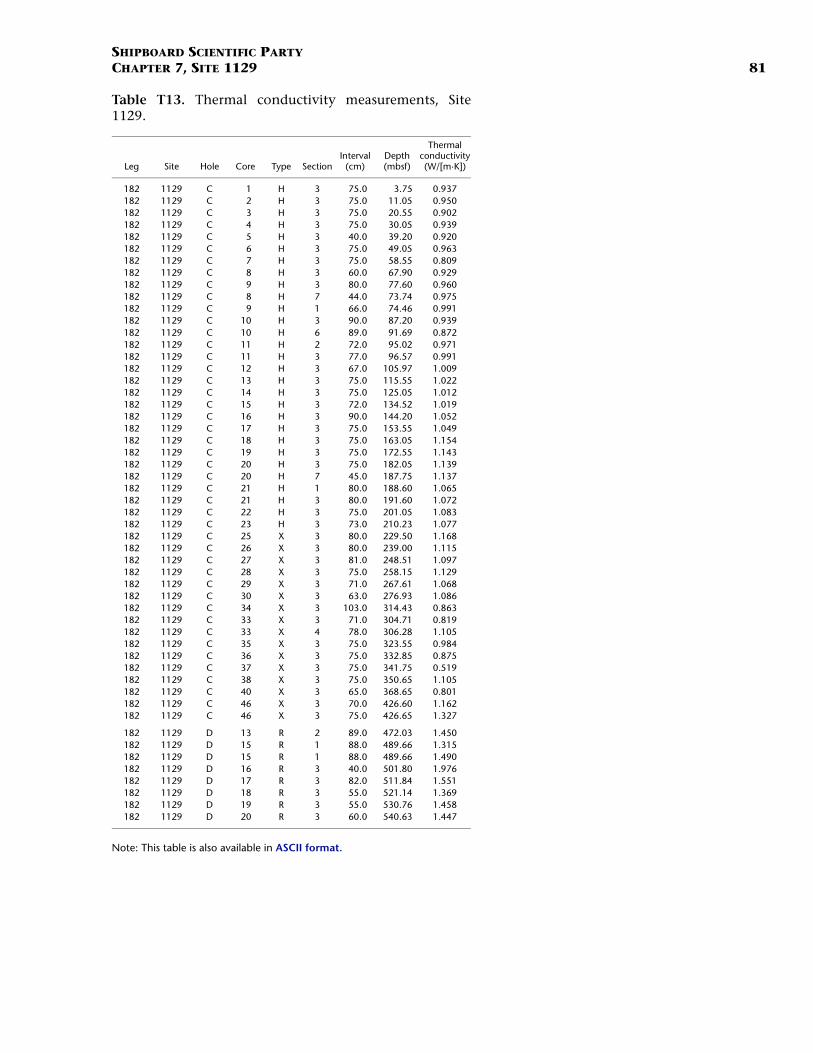
SHIPBOARD SCIENTIFIC PARTYCHAPTER 7, SITE 1129 81
Table T13. Thermal conductivity measurements, Site1129.
Note: This table is also available in ASCII format.
Leg Site Hole Core Type SectionInterval
(cm)Depth (mbsf)
Thermal conductivity (W/[m·K])
182 1129 C 1 H 3 75.0 3.75 0.937182 1129 C 2 H 3 75.0 11.05 0.950182 1129 C 3 H 3 75.0 20.55 0.902182 1129 C 4 H 3 75.0 30.05 0.939182 1129 C 5 H 3 40.0 39.20 0.920182 1129 C 6 H 3 75.0 49.05 0.963182 1129 C 7 H 3 75.0 58.55 0.809182 1129 C 8 H 3 60.0 67.90 0.929182 1129 C 9 H 3 80.0 77.60 0.960182 1129 C 8 H 7 44.0 73.74 0.975182 1129 C 9 H 1 66.0 74.46 0.991182 1129 C 10 H 3 90.0 87.20 0.939182 1129 C 10 H 6 89.0 91.69 0.872182 1129 C 11 H 2 72.0 95.02 0.971182 1129 C 11 H 3 77.0 96.57 0.991182 1129 C 12 H 3 67.0 105.97 1.009182 1129 C 13 H 3 75.0 115.55 1.022182 1129 C 14 H 3 75.0 125.05 1.012182 1129 C 15 H 3 72.0 134.52 1.019182 1129 C 16 H 3 90.0 144.20 1.052182 1129 C 17 H 3 75.0 153.55 1.049182 1129 C 18 H 3 75.0 163.05 1.154182 1129 C 19 H 3 75.0 172.55 1.143182 1129 C 20 H 3 75.0 182.05 1.139182 1129 C 20 H 7 45.0 187.75 1.137182 1129 C 21 H 1 80.0 188.60 1.065182 1129 C 21 H 3 80.0 191.60 1.072182 1129 C 22 H 3 75.0 201.05 1.083182 1129 C 23 H 3 73.0 210.23 1.077182 1129 C 25 X 3 80.0 229.50 1.168182 1129 C 26 X 3 80.0 239.00 1.115182 1129 C 27 X 3 81.0 248.51 1.097182 1129 C 28 X 3 75.0 258.15 1.129182 1129 C 29 X 3 71.0 267.61 1.068182 1129 C 30 X 3 63.0 276.93 1.086182 1129 C 34 X 3 103.0 314.43 0.863182 1129 C 33 X 3 71.0 304.71 0.819182 1129 C 33 X 4 78.0 306.28 1.105182 1129 C 35 X 3 75.0 323.55 0.984182 1129 C 36 X 3 75.0 332.85 0.875182 1129 C 37 X 3 75.0 341.75 0.519182 1129 C 38 X 3 75.0 350.65 1.105182 1129 C 40 X 3 65.0 368.65 0.801182 1129 C 46 X 3 70.0 426.60 1.162182 1129 C 46 X 3 75.0 426.65 1.327
182 1129 D 13 R 2 89.0 472.03 1.450182 1129 D 15 R 1 88.0 489.66 1.315182 1129 D 15 R 1 88.0 489.66 1.490182 1129 D 16 R 3 40.0 501.80 1.976182 1129 D 17 R 3 82.0 511.84 1.551182 1129 D 18 R 3 55.0 521.14 1.369182 1129 D 19 R 3 55.0 530.76 1.458182 1129 D 20 R 3 60.0 540.63 1.447
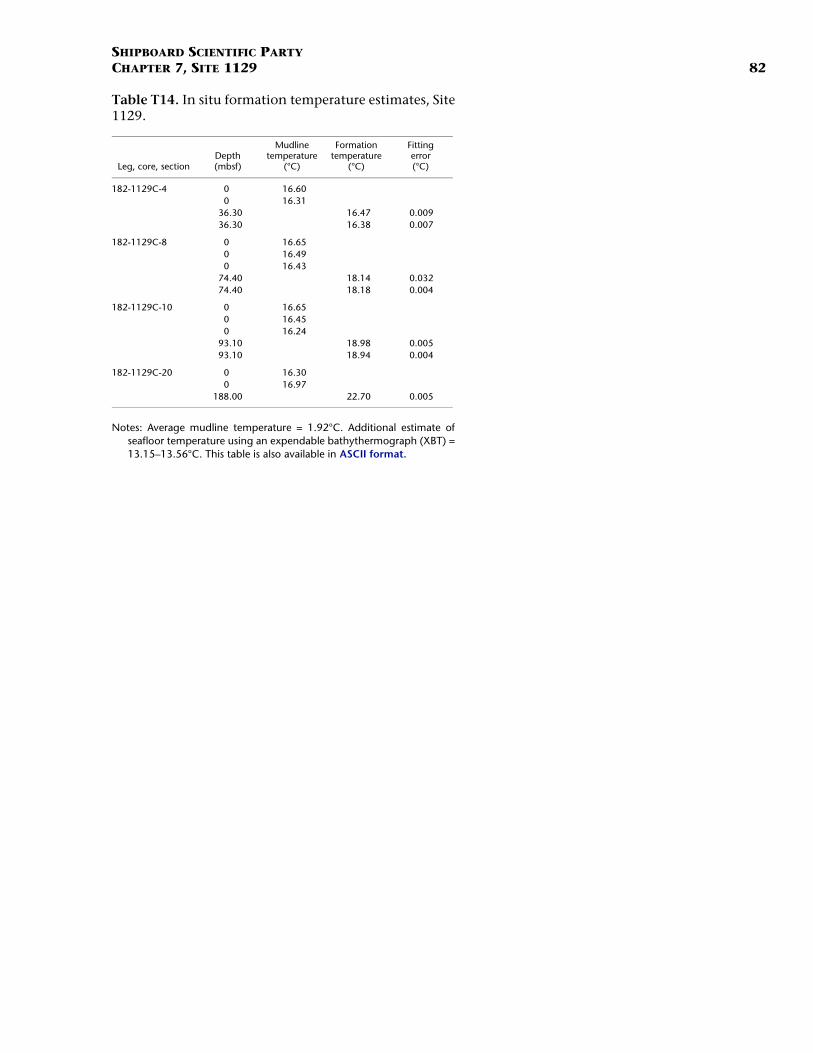
SHIPBOARD SCIENTIFIC PARTYCHAPTER 7, SITE 1129 82
Table T14. In situ formation temperature estimates, Site1129.
Notes: Average mudline temperature = 1.92°C. Additional estimate ofseafloor temperature using an expendable bathythermograph (XBT) =13.15–13.56°C. This table is also available in ASCII format.
Leg, core, sectionDepth(mbsf)
Mudlinetemperature
(°C)
Formationtemperature
(°C)
Fittingerror(°C)
182-1129C-4 0 16.600 16.31
36.30 16.47 0.00936.30 16.38 0.007
182-1129C-8 0 16.650 16.490 16.43
74.40 18.14 0.03274.40 18.18 0.004
182-1129C-10 0 16.650 16.450 16.24
93.10 18.98 0.00593.10 18.94 0.004
182-1129C-20 0 16.300 16.97
188.00 22.70 0.005
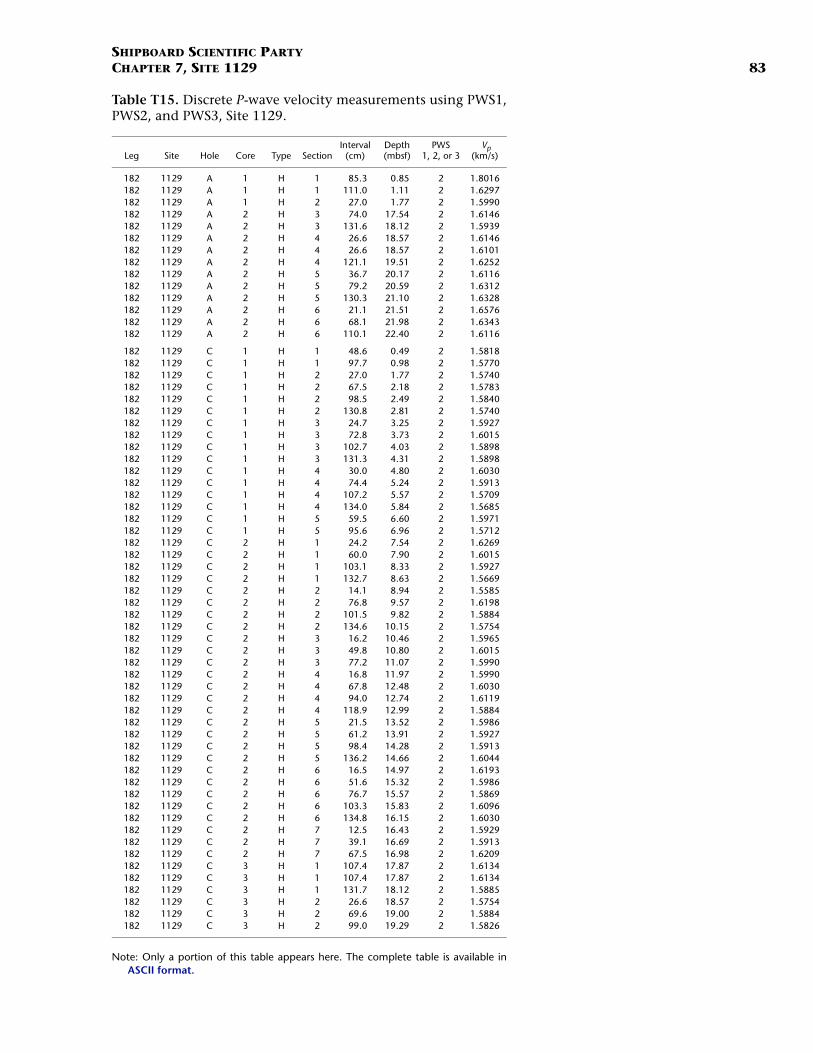
SHIPBOARD SCIENTIFIC PARTYCHAPTER 7, SITE 1129 83
Table T15. Discrete P-wave velocity measurements using PWS1,PWS2, and PWS3, Site 1129.
Note: Only a portion of this table appears here. The complete table is available inASCII format.
Leg Site Hole Core Type SectionInterval
(cm)Depth (mbsf)
PWS 1, 2, or 3
Vp (km/s)
182 1129 A 1 H 1 85.3 0.85 2 1.8016182 1129 A 1 H 1 111.0 1.11 2 1.6297182 1129 A 1 H 2 27.0 1.77 2 1.5990182 1129 A 2 H 3 74.0 17.54 2 1.6146182 1129 A 2 H 3 131.6 18.12 2 1.5939182 1129 A 2 H 4 26.6 18.57 2 1.6146182 1129 A 2 H 4 26.6 18.57 2 1.6101182 1129 A 2 H 4 121.1 19.51 2 1.6252182 1129 A 2 H 5 36.7 20.17 2 1.6116182 1129 A 2 H 5 79.2 20.59 2 1.6312182 1129 A 2 H 5 130.3 21.10 2 1.6328182 1129 A 2 H 6 21.1 21.51 2 1.6576182 1129 A 2 H 6 68.1 21.98 2 1.6343182 1129 A 2 H 6 110.1 22.40 2 1.6116
182 1129 C 1 H 1 48.6 0.49 2 1.5818182 1129 C 1 H 1 97.7 0.98 2 1.5770182 1129 C 1 H 2 27.0 1.77 2 1.5740182 1129 C 1 H 2 67.5 2.18 2 1.5783182 1129 C 1 H 2 98.5 2.49 2 1.5840182 1129 C 1 H 2 130.8 2.81 2 1.5740182 1129 C 1 H 3 24.7 3.25 2 1.5927182 1129 C 1 H 3 72.8 3.73 2 1.6015182 1129 C 1 H 3 102.7 4.03 2 1.5898182 1129 C 1 H 3 131.3 4.31 2 1.5898182 1129 C 1 H 4 30.0 4.80 2 1.6030182 1129 C 1 H 4 74.4 5.24 2 1.5913182 1129 C 1 H 4 107.2 5.57 2 1.5709182 1129 C 1 H 4 134.0 5.84 2 1.5685182 1129 C 1 H 5 59.5 6.60 2 1.5971182 1129 C 1 H 5 95.6 6.96 2 1.5712182 1129 C 2 H 1 24.2 7.54 2 1.6269182 1129 C 2 H 1 60.0 7.90 2 1.6015182 1129 C 2 H 1 103.1 8.33 2 1.5927182 1129 C 2 H 1 132.7 8.63 2 1.5669182 1129 C 2 H 2 14.1 8.94 2 1.5585182 1129 C 2 H 2 76.8 9.57 2 1.6198182 1129 C 2 H 2 101.5 9.82 2 1.5884182 1129 C 2 H 2 134.6 10.15 2 1.5754182 1129 C 2 H 3 16.2 10.46 2 1.5965182 1129 C 2 H 3 49.8 10.80 2 1.6015182 1129 C 2 H 3 77.2 11.07 2 1.5990182 1129 C 2 H 4 16.8 11.97 2 1.5990182 1129 C 2 H 4 67.8 12.48 2 1.6030182 1129 C 2 H 4 94.0 12.74 2 1.6119182 1129 C 2 H 4 118.9 12.99 2 1.5884182 1129 C 2 H 5 21.5 13.52 2 1.5986182 1129 C 2 H 5 61.2 13.91 2 1.5927182 1129 C 2 H 5 98.4 14.28 2 1.5913182 1129 C 2 H 5 136.2 14.66 2 1.6044182 1129 C 2 H 6 16.5 14.97 2 1.6193182 1129 C 2 H 6 51.6 15.32 2 1.5986182 1129 C 2 H 6 76.7 15.57 2 1.5869182 1129 C 2 H 6 103.3 15.83 2 1.6096182 1129 C 2 H 6 134.8 16.15 2 1.6030182 1129 C 2 H 7 12.5 16.43 2 1.5929182 1129 C 2 H 7 39.1 16.69 2 1.5913182 1129 C 2 H 7 67.5 16.98 2 1.6209182 1129 C 3 H 1 107.4 17.87 2 1.6134182 1129 C 3 H 1 107.4 17.87 2 1.6134182 1129 C 3 H 1 131.7 18.12 2 1.5885182 1129 C 3 H 2 26.6 18.57 2 1.5754182 1129 C 3 H 2 69.6 19.00 2 1.5884182 1129 C 3 H 2 99.0 19.29 2 1.5826
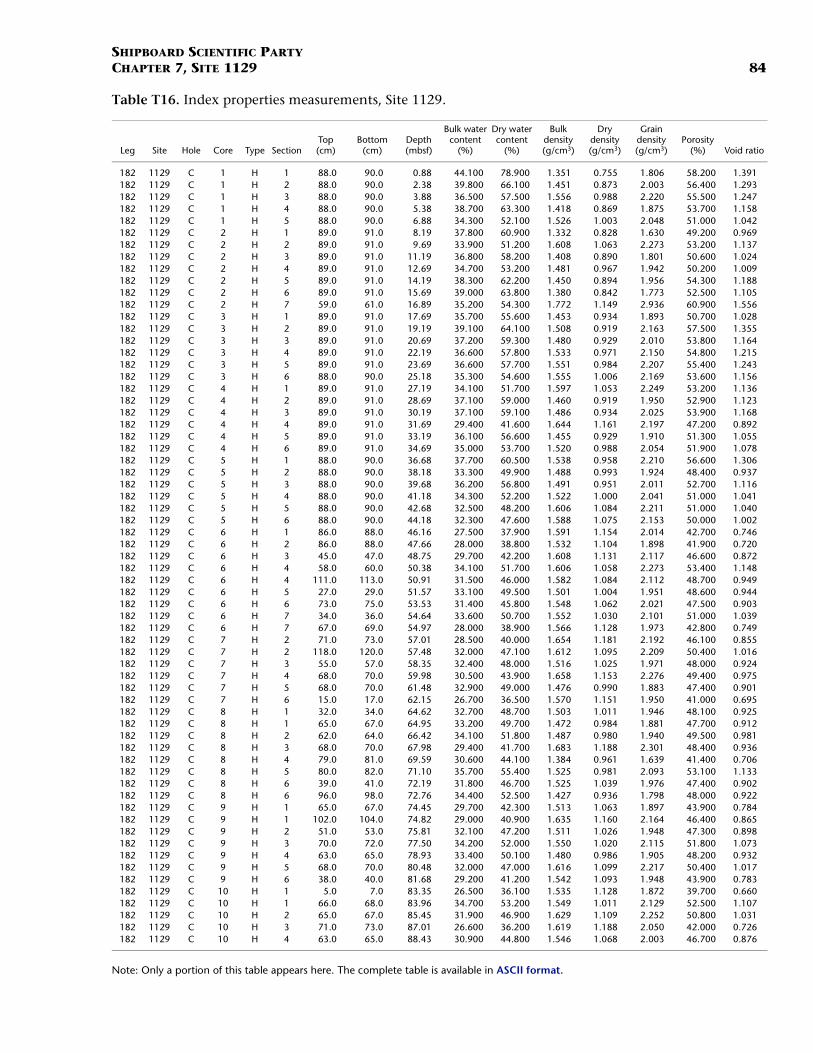
SHIPBOARD SCIENTIFIC PARTYCHAPTER 7, SITE 1129 84
Table T16. Index properties measurements, Site 1129.
Note: Only a portion of this table appears here. The complete table is available in ASCII format.
Leg Site Hole Core Type SectionTop(cm)
Bottom(cm)
Depth(mbsf)
Bulk watercontent
(%)
Dry watercontent
(%)
Bulkdensity(g/cm3)
Drydensity(g/cm3)
Graindensity(g/cm3)
Porosity(%) Void ratio
182 1129 C 1 H 1 88.0 90.0 0.88 44.100 78.900 1.351 0.755 1.806 58.200 1.391182 1129 C 1 H 2 88.0 90.0 2.38 39.800 66.100 1.451 0.873 2.003 56.400 1.293182 1129 C 1 H 3 88.0 90.0 3.88 36.500 57.500 1.556 0.988 2.220 55.500 1.247182 1129 C 1 H 4 88.0 90.0 5.38 38.700 63.300 1.418 0.869 1.875 53.700 1.158182 1129 C 1 H 5 88.0 90.0 6.88 34.300 52.100 1.526 1.003 2.048 51.000 1.042182 1129 C 2 H 1 89.0 91.0 8.19 37.800 60.900 1.332 0.828 1.630 49.200 0.969182 1129 C 2 H 2 89.0 91.0 9.69 33.900 51.200 1.608 1.063 2.273 53.200 1.137182 1129 C 2 H 3 89.0 91.0 11.19 36.800 58.200 1.408 0.890 1.801 50.600 1.024182 1129 C 2 H 4 89.0 91.0 12.69 34.700 53.200 1.481 0.967 1.942 50.200 1.009182 1129 C 2 H 5 89.0 91.0 14.19 38.300 62.200 1.450 0.894 1.956 54.300 1.188182 1129 C 2 H 6 89.0 91.0 15.69 39.000 63.800 1.380 0.842 1.773 52.500 1.105182 1129 C 2 H 7 59.0 61.0 16.89 35.200 54.300 1.772 1.149 2.936 60.900 1.556182 1129 C 3 H 1 89.0 91.0 17.69 35.700 55.600 1.453 0.934 1.893 50.700 1.028182 1129 C 3 H 2 89.0 91.0 19.19 39.100 64.100 1.508 0.919 2.163 57.500 1.355182 1129 C 3 H 3 89.0 91.0 20.69 37.200 59.300 1.480 0.929 2.010 53.800 1.164182 1129 C 3 H 4 89.0 91.0 22.19 36.600 57.800 1.533 0.971 2.150 54.800 1.215182 1129 C 3 H 5 89.0 91.0 23.69 36.600 57.700 1.551 0.984 2.207 55.400 1.243182 1129 C 3 H 6 88.0 90.0 25.18 35.300 54.600 1.555 1.006 2.169 53.600 1.156182 1129 C 4 H 1 89.0 91.0 27.19 34.100 51.700 1.597 1.053 2.249 53.200 1.136182 1129 C 4 H 2 89.0 91.0 28.69 37.100 59.000 1.460 0.919 1.950 52.900 1.123182 1129 C 4 H 3 89.0 91.0 30.19 37.100 59.100 1.486 0.934 2.025 53.900 1.168182 1129 C 4 H 4 89.0 91.0 31.69 29.400 41.600 1.644 1.161 2.197 47.200 0.892182 1129 C 4 H 5 89.0 91.0 33.19 36.100 56.600 1.455 0.929 1.910 51.300 1.055182 1129 C 4 H 6 89.0 91.0 34.69 35.000 53.700 1.520 0.988 2.054 51.900 1.078182 1129 C 5 H 1 88.0 90.0 36.68 37.700 60.500 1.538 0.958 2.210 56.600 1.306182 1129 C 5 H 2 88.0 90.0 38.18 33.300 49.900 1.488 0.993 1.924 48.400 0.937182 1129 C 5 H 3 88.0 90.0 39.68 36.200 56.800 1.491 0.951 2.011 52.700 1.116182 1129 C 5 H 4 88.0 90.0 41.18 34.300 52.200 1.522 1.000 2.041 51.000 1.041182 1129 C 5 H 5 88.0 90.0 42.68 32.500 48.200 1.606 1.084 2.211 51.000 1.040182 1129 C 5 H 6 88.0 90.0 44.18 32.300 47.600 1.588 1.075 2.153 50.000 1.002182 1129 C 6 H 1 86.0 88.0 46.16 27.500 37.900 1.591 1.154 2.014 42.700 0.746182 1129 C 6 H 2 86.0 88.0 47.66 28.000 38.800 1.532 1.104 1.898 41.900 0.720182 1129 C 6 H 3 45.0 47.0 48.75 29.700 42.200 1.608 1.131 2.117 46.600 0.872182 1129 C 6 H 4 58.0 60.0 50.38 34.100 51.700 1.606 1.058 2.273 53.400 1.148182 1129 C 6 H 4 111.0 113.0 50.91 31.500 46.000 1.582 1.084 2.112 48.700 0.949182 1129 C 6 H 5 27.0 29.0 51.57 33.100 49.500 1.501 1.004 1.951 48.600 0.944182 1129 C 6 H 6 73.0 75.0 53.53 31.400 45.800 1.548 1.062 2.021 47.500 0.903182 1129 C 6 H 7 34.0 36.0 54.64 33.600 50.700 1.552 1.030 2.101 51.000 1.039182 1129 C 6 H 7 67.0 69.0 54.97 28.000 38.900 1.566 1.128 1.973 42.800 0.749182 1129 C 7 H 2 71.0 73.0 57.01 28.500 40.000 1.654 1.181 2.192 46.100 0.855182 1129 C 7 H 2 118.0 120.0 57.48 32.000 47.100 1.612 1.095 2.209 50.400 1.016182 1129 C 7 H 3 55.0 57.0 58.35 32.400 48.000 1.516 1.025 1.971 48.000 0.924182 1129 C 7 H 4 68.0 70.0 59.98 30.500 43.900 1.658 1.153 2.276 49.400 0.975182 1129 C 7 H 5 68.0 70.0 61.48 32.900 49.000 1.476 0.990 1.883 47.400 0.901182 1129 C 7 H 6 15.0 17.0 62.15 26.700 36.500 1.570 1.151 1.950 41.000 0.695182 1129 C 8 H 1 32.0 34.0 64.62 32.700 48.700 1.503 1.011 1.946 48.100 0.925182 1129 C 8 H 1 65.0 67.0 64.95 33.200 49.700 1.472 0.984 1.881 47.700 0.912182 1129 C 8 H 2 62.0 64.0 66.42 34.100 51.800 1.487 0.980 1.940 49.500 0.981182 1129 C 8 H 3 68.0 70.0 67.98 29.400 41.700 1.683 1.188 2.301 48.400 0.936182 1129 C 8 H 4 79.0 81.0 69.59 30.600 44.100 1.384 0.961 1.639 41.400 0.706182 1129 C 8 H 5 80.0 82.0 71.10 35.700 55.400 1.525 0.981 2.093 53.100 1.133182 1129 C 8 H 6 39.0 41.0 72.19 31.800 46.700 1.525 1.039 1.976 47.400 0.902182 1129 C 8 H 6 96.0 98.0 72.76 34.400 52.500 1.427 0.936 1.798 48.000 0.922182 1129 C 9 H 1 65.0 67.0 74.45 29.700 42.300 1.513 1.063 1.897 43.900 0.784182 1129 C 9 H 1 102.0 104.0 74.82 29.000 40.900 1.635 1.160 2.164 46.400 0.865182 1129 C 9 H 2 51.0 53.0 75.81 32.100 47.200 1.511 1.026 1.948 47.300 0.898182 1129 C 9 H 3 70.0 72.0 77.50 34.200 52.000 1.550 1.020 2.115 51.800 1.073182 1129 C 9 H 4 63.0 65.0 78.93 33.400 50.100 1.480 0.986 1.905 48.200 0.932182 1129 C 9 H 5 68.0 70.0 80.48 32.000 47.000 1.616 1.099 2.217 50.400 1.017182 1129 C 9 H 6 38.0 40.0 81.68 29.200 41.200 1.542 1.093 1.948 43.900 0.783182 1129 C 10 H 1 5.0 7.0 83.35 26.500 36.100 1.535 1.128 1.872 39.700 0.660182 1129 C 10 H 1 66.0 68.0 83.96 34.700 53.200 1.549 1.011 2.129 52.500 1.107182 1129 C 10 H 2 65.0 67.0 85.45 31.900 46.900 1.629 1.109 2.252 50.800 1.031182 1129 C 10 H 3 71.0 73.0 87.01 26.600 36.200 1.619 1.188 2.050 42.000 0.726182 1129 C 10 H 4 63.0 65.0 88.43 30.900 44.800 1.546 1.068 2.003 46.700 0.876
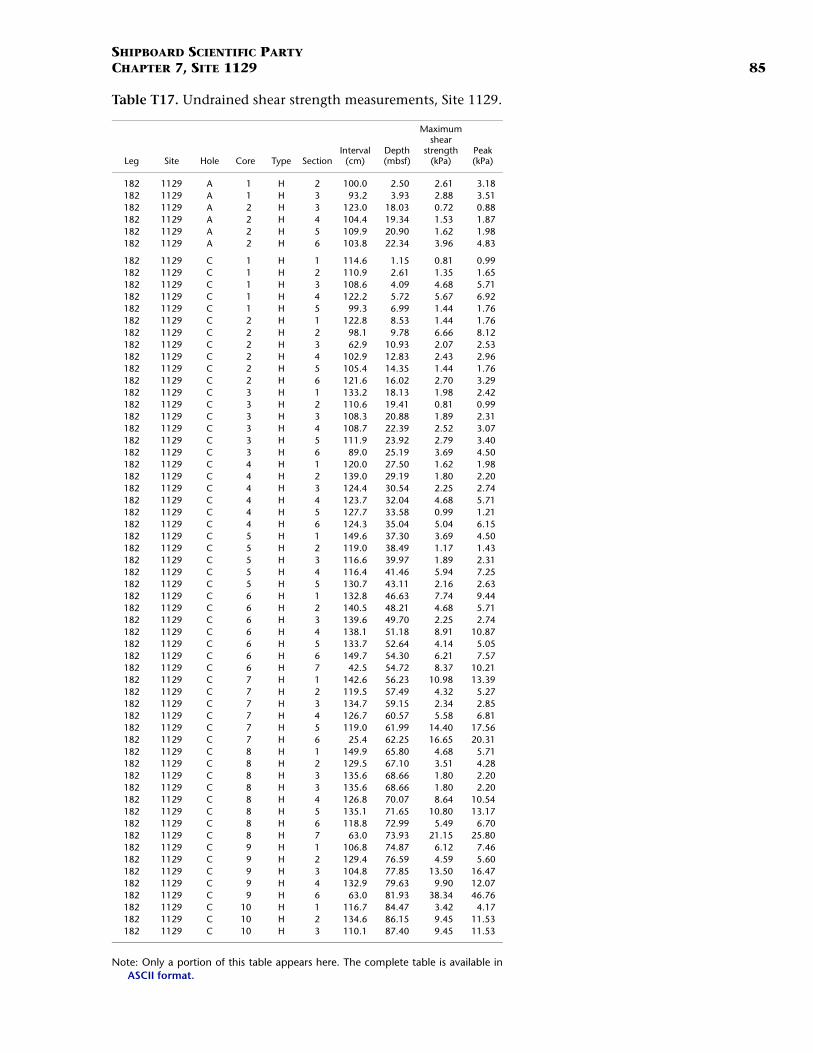
SHIPBOARD SCIENTIFIC PARTYCHAPTER 7, SITE 1129 85
Table T17. Undrained shear strength measurements, Site 1129.
Note: Only a portion of this table appears here. The complete table is available inASCII format.
Leg Site Hole Core Type SectionInterval
(cm)Depth (mbsf)
Maximum shear
strength (kPa)
Peak (kPa)
182 1129 A 1 H 2 100.0 2.50 2.61 3.18182 1129 A 1 H 3 93.2 3.93 2.88 3.51182 1129 A 2 H 3 123.0 18.03 0.72 0.88182 1129 A 2 H 4 104.4 19.34 1.53 1.87182 1129 A 2 H 5 109.9 20.90 1.62 1.98182 1129 A 2 H 6 103.8 22.34 3.96 4.83
182 1129 C 1 H 1 114.6 1.15 0.81 0.99182 1129 C 1 H 2 110.9 2.61 1.35 1.65182 1129 C 1 H 3 108.6 4.09 4.68 5.71182 1129 C 1 H 4 122.2 5.72 5.67 6.92182 1129 C 1 H 5 99.3 6.99 1.44 1.76182 1129 C 2 H 1 122.8 8.53 1.44 1.76182 1129 C 2 H 2 98.1 9.78 6.66 8.12182 1129 C 2 H 3 62.9 10.93 2.07 2.53182 1129 C 2 H 4 102.9 12.83 2.43 2.96182 1129 C 2 H 5 105.4 14.35 1.44 1.76182 1129 C 2 H 6 121.6 16.02 2.70 3.29182 1129 C 3 H 1 133.2 18.13 1.98 2.42182 1129 C 3 H 2 110.6 19.41 0.81 0.99182 1129 C 3 H 3 108.3 20.88 1.89 2.31182 1129 C 3 H 4 108.7 22.39 2.52 3.07182 1129 C 3 H 5 111.9 23.92 2.79 3.40182 1129 C 3 H 6 89.0 25.19 3.69 4.50182 1129 C 4 H 1 120.0 27.50 1.62 1.98182 1129 C 4 H 2 139.0 29.19 1.80 2.20182 1129 C 4 H 3 124.4 30.54 2.25 2.74182 1129 C 4 H 4 123.7 32.04 4.68 5.71182 1129 C 4 H 5 127.7 33.58 0.99 1.21182 1129 C 4 H 6 124.3 35.04 5.04 6.15182 1129 C 5 H 1 149.6 37.30 3.69 4.50182 1129 C 5 H 2 119.0 38.49 1.17 1.43182 1129 C 5 H 3 116.6 39.97 1.89 2.31182 1129 C 5 H 4 116.4 41.46 5.94 7.25182 1129 C 5 H 5 130.7 43.11 2.16 2.63182 1129 C 6 H 1 132.8 46.63 7.74 9.44182 1129 C 6 H 2 140.5 48.21 4.68 5.71182 1129 C 6 H 3 139.6 49.70 2.25 2.74182 1129 C 6 H 4 138.1 51.18 8.91 10.87182 1129 C 6 H 5 133.7 52.64 4.14 5.05182 1129 C 6 H 6 149.7 54.30 6.21 7.57182 1129 C 6 H 7 42.5 54.72 8.37 10.21182 1129 C 7 H 1 142.6 56.23 10.98 13.39182 1129 C 7 H 2 119.5 57.49 4.32 5.27182 1129 C 7 H 3 134.7 59.15 2.34 2.85182 1129 C 7 H 4 126.7 60.57 5.58 6.81182 1129 C 7 H 5 119.0 61.99 14.40 17.56182 1129 C 7 H 6 25.4 62.25 16.65 20.31182 1129 C 8 H 1 149.9 65.80 4.68 5.71182 1129 C 8 H 2 129.5 67.10 3.51 4.28182 1129 C 8 H 3 135.6 68.66 1.80 2.20182 1129 C 8 H 3 135.6 68.66 1.80 2.20182 1129 C 8 H 4 126.8 70.07 8.64 10.54182 1129 C 8 H 5 135.1 71.65 10.80 13.17182 1129 C 8 H 6 118.8 72.99 5.49 6.70182 1129 C 8 H 7 63.0 73.93 21.15 25.80182 1129 C 9 H 1 106.8 74.87 6.12 7.46182 1129 C 9 H 2 129.4 76.59 4.59 5.60182 1129 C 9 H 3 104.8 77.85 13.50 16.47182 1129 C 9 H 4 132.9 79.63 9.90 12.07182 1129 C 9 H 6 63.0 81.93 38.34 46.76182 1129 C 10 H 1 116.7 84.47 3.42 4.17182 1129 C 10 H 2 134.6 86.15 9.45 11.53182 1129 C 10 H 3 110.1 87.40 9.45 11.53
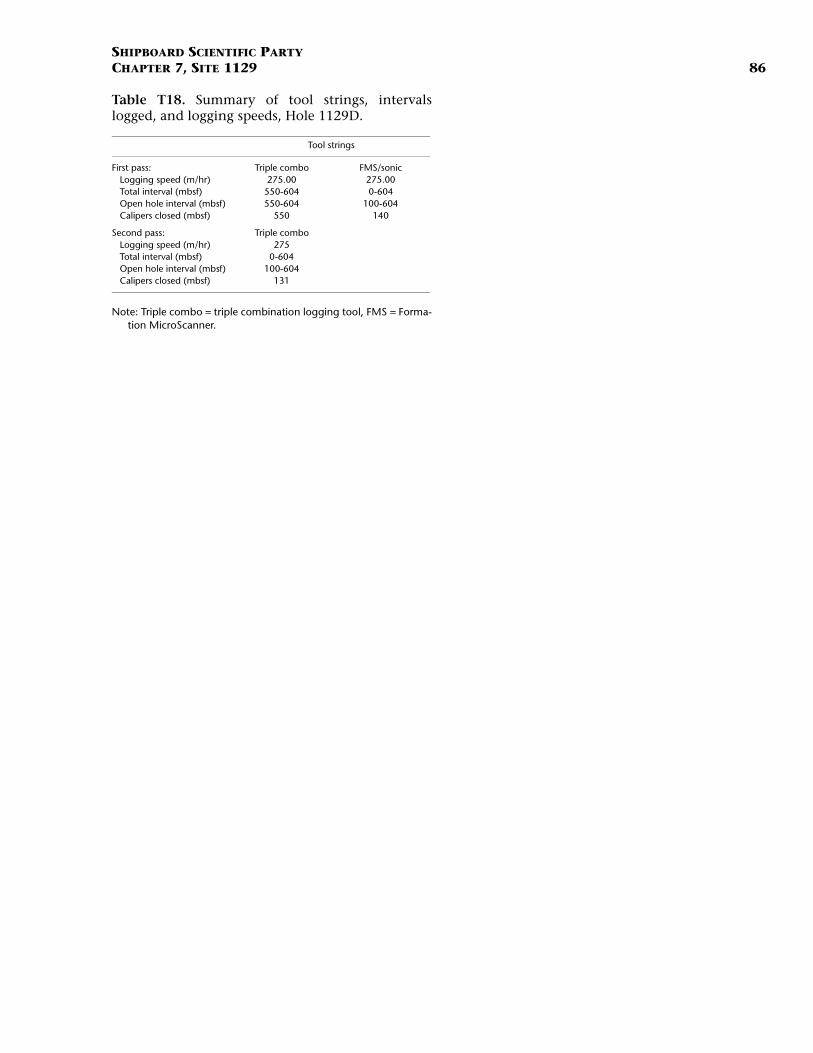
SHIPBOARD SCIENTIFIC PARTYCHAPTER 7, SITE 1129 86
Table T18. Summary of tool strings, intervalslogged, and logging speeds, Hole 1129D.
Note: Triple combo = triple combination logging tool, FMS = Forma-tion MicroScanner.
Tool strings
First pass: Triple combo FMS/sonicLogging speed (m/hr) 275.00 275.00Total interval (mbsf) 550-604 0-604Open hole interval (mbsf) 550-604 100-604Calipers closed (mbsf) 550 140
Second pass: Triple comboLogging speed (m/hr) 275Total interval (mbsf) 0-604Open hole interval (mbsf) 100-604Calipers closed (mbsf) 131
![Scientific Ocean Drilling: Accomplishments and … · Drilling Program [ODP, 1984–2003], and Integrated Ocean Drilling Program [IODP, 2003–2013]), have spurred remarkable progress](https://img.pdfslide.us/doc/110x75/5b8e23e609d3f2187e8d2095/scientific-ocean-drilling-accomplishments-and-drilling-program-odp-19842003.jpg)