Embed Size (px)
Citation preview

Background Analysis
Columbia University REU 2015
Kylee BranningNorthern Michigan University
Adviser: Dr. Kalliopi Iordanidou
July 31, 2015
Abstract
This study focuses on the development of data driven backgroundestimation techniques to discriminate the backgrounds for VV reso-nance searches in the final state of lepton, neutrino, and two quarks.The background is composed of W+Jets, Z+Jets, tt̄, multijets, andstandard model dibosons. Comparisons are made between data andMonte Carlo for an integrated luminosity of 6 pb−1 collected at 13TeV center of mass energy. No discrepancy between data and MonteCarlo was found during this study.
1

Contents
1 Introduction 31.1 CERN . . . . . . . . . . . . . . . . . . . . . . . . . . . . . . . 31.2 Large Hadron Collider . . . . . . . . . . . . . . . . . . . . . . 31.3 ATLAS . . . . . . . . . . . . . . . . . . . . . . . . . . . . . . 41.4 Particles . . . . . . . . . . . . . . . . . . . . . . . . . . . . . . 51.5 Bosons and Jets . . . . . . . . . . . . . . . . . . . . . . . . . . 81.6 Search for VV Resonances . . . . . . . . . . . . . . . . . . . . 10
2 Studying the Background 102.1 Introduction . . . . . . . . . . . . . . . . . . . . . . . . . . . . 102.2 Background Composition . . . . . . . . . . . . . . . . . . . . 102.3 Estimation Methods . . . . . . . . . . . . . . . . . . . . . . . 112.4 Control Regions . . . . . . . . . . . . . . . . . . . . . . . . . . 16
2.4.1 Multijets . . . . . . . . . . . . . . . . . . . . . . . . . 192.4.2 W+Jets and tt̄ . . . . . . . . . . . . . . . . . . . . . . 20
3 Conclusion 21
4 Acknowledgments 22
References 23
2

1 Introduction
1.1 CERN
The European Organization for Nuclear Research (CERN) founded in1954 has been leading the study of high energy particle physics for yearswith experiments run by collaborations of scientists from institutes all overthe world. Home to some of the world’s most intricate scientific instrumentsincluding the Large Hadron Collider (LHC), CERN has accomplished manyinconceivable feats from the creation of the World Wide Web to makingNoble Prize winning discoveries. With the recent start of the 13 TeV ex-periments, CERN’s main focus has been pushed towards the LHC; however,many other important experiments are still proceeding both on and off site[6].
1.2 Large Hadron Collider
Figure 1: Map of LHC ring to highlight the size and experiment detectorlocations [9].
The Large Hadron Collider (LHC) is currently the largest and mostpowerful particle accelerator in the world. First starting operation in 2010,the LHC uses superconducting magnets with accelerating structures to boostthe energy of particles around a 27 kilometer underground ring. Traveling
3

close to the speed of light, two high energy particle beams move through theaccelerator in opposite directions and separate beam pipes until they collide.The superconducting electromagnets chilled to -271.3 ◦C create a strongmagnetic field to guide the beams around the ring [6]. Seven experimentsat CERN, each of which is distinct and characterized by its detectors, makeuse of the LHC’s detectors to analyze the collisions within these detectorscaused by the accelerator. Four detectors, those of the larger experiments,are located in huge caverns that are underground along the LHC’s ring [8].
1.3 ATLAS
Figure 2: ATLAS detector with cut out side and humans for size reference[5].
One of the biggest experiments at CERN is ATLAS. ATLAS, whichstands for A Toroidal LHC ApparatuS, is a particle physics experiment thatexplores head-on collisions of protons at high energies in an attempt tomake new discoveries such as new forces, the origin of mass, dark matter,and many others. Due to the recent discovery of the Higgs boson, data beingcollected now allows for a deeper examination of the boson’s properties andthe search for exotic physics or physics beyond the standard model.
Beams of particles traveling around the LHC collide at the center of
4

the ATLAS detector forming new particles that expand from the point ofcollision in all directions. Around the point of collision are multiple differentlayers of detection. The layer closest to the particle beam is known as theinner detector and is used to track charged particles. The next layer isthe calorimeters which measure the energy of easily stopped particles byabsorbing it. Then there are the muon spectrometers which are used toaccurately measure the momentum of the muons.
In addition to these main detector layers, there is the magnet systemwhich consists of two large superconducting magnet systems that bendscharged particles allowing for their momenta to be measured. The firstmagnet, the solenoid magnet, is located around the inner detector layer andthe second magnet, the toroidal magnet is located at the endcaps.
After the collision, the different layers of detection record data includingpaths, momentum, and energy of the particles which then allows for each ofthe new particles to be identified. Since the ATLAS detector can experiencea huge flow of events, it uses a ”trigger” system. This allows for only certainevents to be recorded and all other events are ignored [2].
1.4 Particles
Figure 3: Multiple groupings of particles [13].
The experiments at CERN are exploring particle physics which refers tothe study of the most basic elements of matter. Particles can be classifiedinto different groups, shown in Figure 3, including the fermions and thehadrons. These groups contain the basic particles that are the cornerstonefor the ATLAS experiment.
The fermion group is comprised of the lightest particles called the lep-tons. There are three generations of leptons shown in Figure 4 that arethe pairs of electron - neutrino electron, muon - muon neutrino, tau - tau
5

neutrino. All of the leptons have a spin of 1/2. The electron, muon, and tauhave a charge of -1 where as their associated neutrinos have a charge of 0.The neutrinos cannot be identified or recorded from the detector when tak-ing data. Instead, they can be determined by looking at the energy. Sincethe total energy is known, it is able to distinguish the neutrinos from themissing energy [10].
Figure 4: Table of leptons with flavors, mass, and charge [7].
The hadron group consists of the heavier particles. This group is splitinto two more subgroups called the baryons and mesons. Within the baryongroup are the protons and neutrons. Protons and neutrons, held together bythe strong force, make up the nucleus of an atom [11]. These particles arecomposed of quarks. Quarks come in six different flavors shown in Figure 5,and they can successfully account for all known mesons and baryons (over200) [12].
6

Figure 5: Table of quarks with flavors, approximate mass, and charge [7].
For most kinds of particles there is also an antiparticle. The antiparticleis the particle with the same mass but an opposite charge including theelectric charge, for instance, the antiparticle of an electron is a positivelycharged electron or a positron.
Figure 6 below shows that how each of these particles interacts with dif-ferent parts of the ATLAS detector. As can be seen, some particles, such asmuons and neutrinos are able to pass through layers of the detector whereas particles like the proton, neutron, photon, and electron are absorbed inthe different layers of the detector.
7
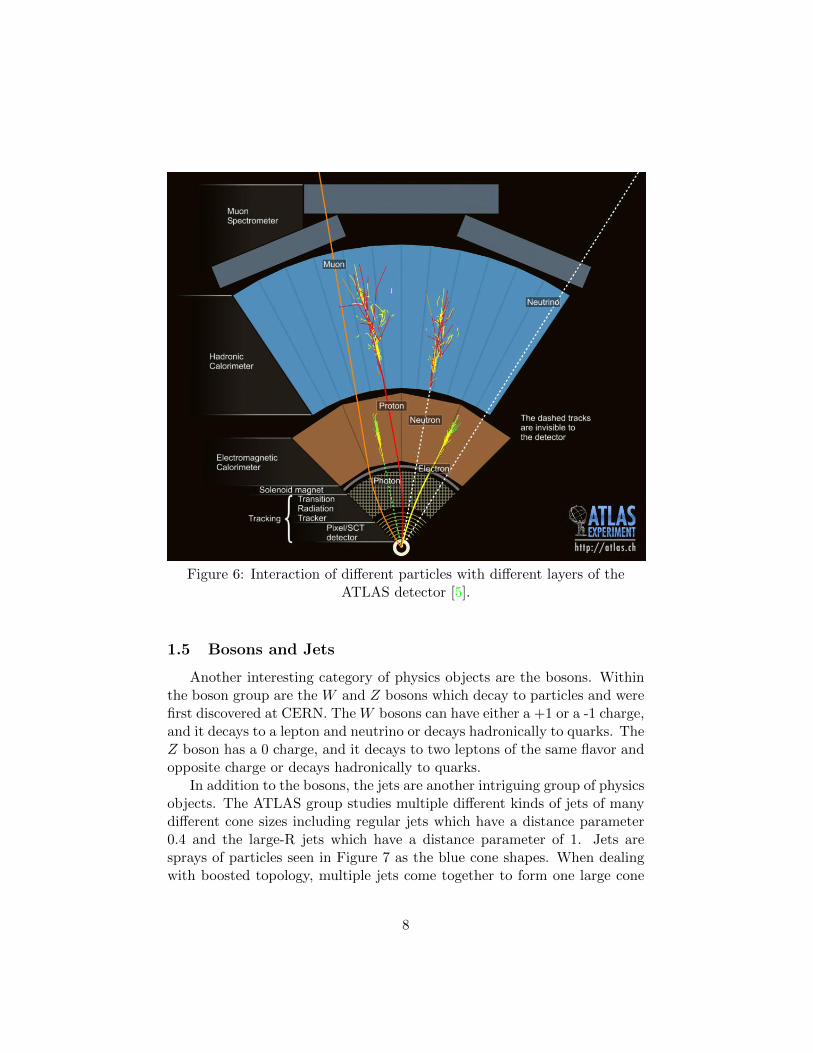
Figure 6: Interaction of different particles with different layers of theATLAS detector [5].
1.5 Bosons and Jets
Another interesting category of physics objects are the bosons. Withinthe boson group are the W and Z bosons which decay to particles and werefirst discovered at CERN. The W bosons can have either a +1 or a -1 charge,and it decays to a lepton and neutrino or decays hadronically to quarks. TheZ boson has a 0 charge, and it decays to two leptons of the same flavor andopposite charge or decays hadronically to quarks.
In addition to the bosons, the jets are another intriguing group of physicsobjects. The ATLAS group studies multiple different kinds of jets of manydifferent cone sizes including regular jets which have a distance parameter0.4 and the large-R jets which have a distance parameter of 1. Jets aresprays of particles seen in Figure 7 as the blue cone shapes. When dealingwith boosted topology, multiple jets come together to form one large cone
8

shape which is known as a large-R jet. This can be seen in Figure 8 below.The large-R jets that studied by the ATLAS group can be created fromwhen the W or Z boson decay hadronically.
Figure 7: Image from the ATLAS detector that highlights all parts of thedetector that had interaction during the collision [5].
Figure 8: Boosted topology forming large-R Jets from regular jets [1].
9

1.6 Search for VV Resonances
Our work with the ATLAS group at CERN is contributing to the searchfor Heavy Vector Triplet (HVT) decays. The search for HVT decays is saidto be one of the most direct ways to find new physics at TeV scale. Weare looking at VV resonance in our data samples. These resonances are Wand Z bosons. Using specific selections and cuts in our code, we are ableto detect the different kinds of bosons and determine which events are VVresonances [14].
Figure 9: Feynman diagram of VV Resonance and W and W/Z decay [5].
2 Studying the Background
2.1 Introduction
Here at CERN, my work focuses on VV resonance in the boosted topol-ogy where one of the V is a W which then decays to a lepton and neutrinoand the other V decays hadronically forming a large-R jet. Our signal hy-pothesis is a heavy vector triplet. I have been studying the background ofour data samples in a data driven way. Specifically, I am looking at W+Jets,multijets, tt̄, and standard model dibosons which are not studied in a datadriven way by us.
2.2 Background Composition
The samples I am using for my work are normalized to 6 pb−1 at 13TeV. The samples and their generators can be seen in Table 1 below.
10

Events Cross Sections Filter Efficiency Generators
Signal 1.960000× 10+4 0.003853 pb 1.000 MadGraphPythia8W+ → eν 3.391847× 10+10 11302 pb 1.000 PowhegPythia8W+ → µν 3.391694× 10+10 11302 pb 1.000 PowhegPythia8W+ → τν 3.391262× 10+10 11302 pb 1.000 PowhegPythia8W− → eν 1.654872× 10+10 8280 pb 1.000 PowhegPythia8W− → µν 1.656678× 10+10 8280 pb 1.000 PowhegPythia8W− → τν 1.656333× 10+10 8280 pb 1.000 PowhegPythia8Z → ee 3.801334× 10+9 1900 pb 1.000 PowhegPythia8Z → µµ 3.800993× 10+9 1900 pb 1.000 PowhegPythia8Z → ττ 3.800333× 10+9 1900 pb 1.000 PowhegPythia8
tt̄ 1.997000× 10+6 831.76 pb 0.543 PowhegPythia
Table 1: All of the data files and their generators are listed here as well asthe number of initial events, cross sections, and filter efficiency which wereused to scale the samples. Not listed is the data file. The data file has aluminosity of 6 pb−1.
2.3 Estimation Methods
Since the standard model dibosons are very small and precision mea-surements are carried out by dedicated ATLAS groups, they are well knownand understood backgrounds, and they are estimated from the Monte Carlo.The other estimation methods depend on the selection cuts that are made.For our finalized selection cuts I have a baseline selection as follows:
• jet pT greater than 200 GeV
• tight electron and medium muon which vetos events with more than onegood lepton
• L1 trigger which is the lowest level trigger that is part of the triggersystem that the detector uses to veto certain events
• MET greater than 100 GeV
• lepton and neutrino pT greater than 100 GeV
• at least one large-R jet with a pT greater than 200 GeV
• jet mass between 60 and 105 GeV
11

• overlap removal between the electrons and the large-R jets
• overlap removal between the regular jets and the large-R jets
Our mass for the jets is cut between 60 and 105 GeV in order for us tofocus on the signal region. The mass between 60 and 110 GeV is where theW and Z masses are. Specifically, the W has a mass of 80.385 GeV andthe Z has a mass of 91.1876 GeV. Table 2 seen below shows the normalizedevent yields of our samples within the signal region. The data and totalbackground are very much in agreement for this region.
Normalized Event YieldsData 21
Signal 0.00544± 0.00008
W+Jets 6.055± 0.004Z+Jets 0.1282± 0.0006tt̄ 15.21± 0.14
Total Background 21.39± 0.14
Table 2: These are the normalized event yields for each of the different partsof the background as well as the data for the signal region. The quoteduncertainties are statistical only.
For the plots shown in Figure 10 through Figure 15, they show variousdistributions between the data, W+Jets, and tt̄ for the signal region cuts todisplay what the topology and kinematics region looks like.
Figure 10: Large-R jet pT for signal region.
12

Figure 11: Large-R jet η for signal region.
Figure 12: Number of large-R jets for signal region.
Figure 13: Large-R jet Mass for signal region.
13

Figure 14: Φ for lepton and large-R jets for signal region.
Figure 15: Φ for neutrino and large-R jets for signal region.
Figure 16 through 20 below show various distributions between the data,signal, and all backgrounds for the signal region.
14

Figure 16: Large-R jet mass for signal region.
Figure 17: Lepton-Neutrino mass for signal region.
Figure 18: Lepton-Neutrino and large-R Jet mass for signal region.
15

Figure 19: Number of Jets for signal region.
Figure 20: MET for signal region.
2.4 Control Regions
I have also looked at regions other than the signal region. This is knownas the control region and is used for the background measurement. To makethis control region, the signal region cuts are reverted to minimize the signalcontamination. With the reverted cut for the jet mass, it is now requiredthat the jet mass is to be either less than 60 GeV or greater than 105 GeV.With this, I intend to measure W/Z+Jets, tt̄, and multijets. Table 3 seenbelow shows the shows normalized event yields of the samples within thecontrol region. In this table, the total background expects less events thanwhat was found in the data sample. Figure 25 shows the MET for the con-trol region and it can be seen that the low end of the MET is where this
16

small discrepancy between the data and total background is coming from.
Normalized Event YieldsData 87
Signal 0.00142± 0.00004
W+Jets 50.52± 0.011Z+Jets 1.2300± 0.0019tt̄ 23.41± 0.18
Total Background 75.16± 0.18
Table 3: These are the normalized event yields for each of the different partsof the background as well as the data for the control region. The quoteduncertainties are statistical only.
Figure 21 through 25 below show various distributions for the controlregion.
Figure 21: Large-R jet mass outside the signal region.
17

Figure 22: Lepton-Neutrino mass outside the signal region.
Figure 23: Lepton-Neutrino and large-R Jet mass outside the signal region.
Figure 24: Number of Jets outside the signal region.
18

Figure 25: MET outside the signal region.
2.4.1 Multijets
The multijets are misidentified electrons and muons coming from semilep-tonic decay of hadrons within jets. The cut of the MET between 50 and80 GeV is used in the plot shown in Figure 28 to validate the multijets.The case where there is more than 1 lepton in the events was checked as apossible control region; however, there were too low statistics.
Figure 28: Lepton and Neutrino mass with MET between 50 and 80 GeVcut.
When the selection for the MET between 50 and 80 GeV was made,no data excess was observed. This is from the low multijets contaminationprobably due to the tight electron and muon cuts.
19

In Run I, the analysis of VV resonance was performed using an integratedluminosity of 20.3 fb−1 collisions at 8 TeV collected by the ATLAS detector.There were 29 events and this means we are normalizing to 6 pb−1 at 13TeV and with cross sections that gives us 6± 3 events [4].
2.4.2 W+Jets and tt̄
Then I had to distinguish between the W+Jets and tt̄. The W+Jets andthe tt̄ both have a W peak shape, so to distinguish between the W+Jetsand the tt̄ b tagging is used. B tagging is the identification of b jets whichare jets containing b-hadrons. I used the b-veto with the good jet selection,overlap removal for regular and fat jets, and MV2c20 tagger greater than-0.0836, to distinguish if an event had b jets. The MV2c20 cut correspondsto 80 percent efficiency, and it is an algorithm that determines if an eventcontains b-jets or not. If the event passed the b-veto than it is recognizedit as the W+Jets where as if there is presence of b’s, it is recognized as thett̄ [3]. Figures 26 and 27 below show the application of the b-veto and howit effects the number of jets.
Figure 26: Number of Jets with the presence of b’s.
20

Figure 27: Number of Jets with the no presence of b’s.
Table 4 below shows the data and Monte Carlo comparison for the b andno b cases.
Normalized Event Yields Normalized Event Yieldswith b’s without b’s
Data 17 70
Signal 0.000026± 0.000006 0.00141± 0.00004
W+Jets 0.9762± 0.0015 49.588± 0.012Z+Jets 0.0641± 0.0004 1.1717± 0.0019tt̄ 15.08± 0.14 8.34± 0.11
Total Background 16.12± 0.14 59.10± 0.11
Table 4: These are the normalized event yields for each of the different partsof the background as well as the data for the case of presence of b jets andno b jets. The quoted uncertainties are statistical only.
3 Conclusion
Data driven background techniques were developed for the study of VVresonances that result in the final state of a lepton, neutrino and two quarks.Specifically the W/Z+Jets and tt̄ backgrounds are measured in control re-gions formed by reverting the signal region cuts. Additionally b-tagging isused to discriminate between the different background types. For the stan-
21

dard model dibosons, the estimation is based on the Monte Carlo. The mul-tijets Run I extrapolation shows marginal quantum chromodynamics (QCD)contamination. Comparison has been made between data and Monte Carlofor 6 pb−1 at 13 TeV and no discrepancy was observed.
4 Acknowledgments
I would like to thank the Columbia REU program and the National Sci-ence Foundation for providing students with opportunities like this. Also, Iwould like to thank Professor John Parsons for granting me this experiencehere at CERN. Most of all I would like to thank my adviser Dr. Kalliopi Ior-danidou for helping me through every aspect of this research with patience,kindness, and understanding.
22
References
[1] Abteilung, EDV. ”Projects.” ATLAS Group PI Heidel-berg. N.p., n.d. Web. 25 June 2015. ¡http://www.physi.uni-heidelberg.de/Forschung/he/ATLAS/projects/¿.
[2] ”ATLAS.” CERN Accelerating Science. N.p., n.d. Web. 23 June 2015.¡http://home.web.cern.ch/about/experiments/atlas¿.
[3] The ATLAS Collaboration. ”ATLAS Note.” (2015):n. pag. CERN, 12 July 2015. Web. 21 July 2015.¡https://cds.cern.ch/record/2032461/files/ATL-COM-PHYS-2015-644.pdf¿.
[4] ATLAS Collaboration. ”Search for Production of WW / WZ ResonancesDecaying to a Lepton, Neutrino and Jets in Pp Collisions at S = 8TeVwith the ATLAS Detector.” The European Physical Journal C (2015):n. pag. 12 May 2015. Web. 10 July 2015.
[5] ”ATLAS Photos.” ATLAS Experiment. N.p., n.d. Web. 23 June 2015.¡http://www.atlas.ch/photos/full-detector-photos.html¿.
[6] ”Experiments.” CERN Accelerating Science. N.p., n.d. Web. 23 June2015. ¡http://home.web.cern.ch/about/experiments¿.
[7] ”The Fundamentals of Matter and Force.” The Particle Adventure. De-partment of Energy and National Science Foundation, n.d. Web. 27 July2015. ¡http://www.particleadventure.org¿.
[8] ”The Large Haadron Collider.” CERN Accelerating Science. N.p.,n.d. Web. 23 June 2015. ¡http://home.web.cern.ch/topics/large-hadron-collider¿.
[9] ”LARGE HADRON COLLIDER - LHC.” HEPHY:Large Hadron Collider. N.p., n.d. Web. 23 June2015. ¡http://www.hephy.at/en/physics/techniques/particle-accelerators/large-hadron-collider/¿.
[10] Nave, R. ”Leptons.” Leptons. HyperPhysics, n.d. Web. 30 June 2015.¡http://hyperphysics.phy-astr.gsu.edu/hbase/particles/lepton.html¿.
[11] Nave, R. ”Proton.” Protons and Neutrons. Hyper-Physics, n.d. Web. 29 June 2015. ¡http://hyperphysics.phy-astr.gsu.edu/hbase/particles/proton.html¿.
23
[12] Nave, R. ”Quarks.” Quarks. HyperPhysics, n.d. Web. 29 June 2015.¡http://hyperphysics.phy-astr.gsu.edu/hbase/particles/quark.html¿.
[13] ”The Quantum Evolution of the Early Universe.” Rel-evancy22. N.p., 1 Apr. 2013. Web. 23 June 2015.¡http://relevancy22.blogspot.ch/2013/04/evolution-of-early-universe.html¿.
[14] Santanastasio, Francesco. ”Search for Heavy Resonances De-caying to Bosons with the ATLAS and CMS Detectors.”Sapienza , University of Rome and INFN), 4 July 2012. Web.¡http://indico.ific.uv.es/indico/getFile.py/access?contribId=1026&sessionId=24&resId=0&materialId=slides&confId=2025¿.
24