Embed Size (px)
Citation preview
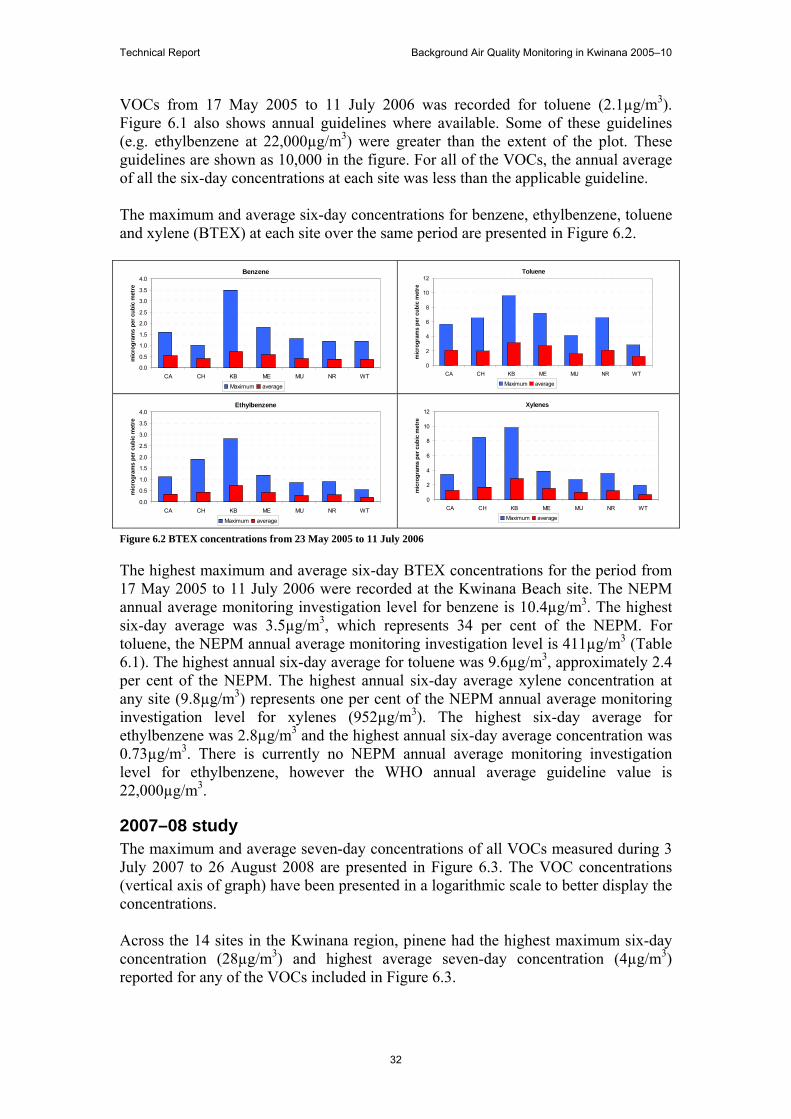
Background Air Quality Monitoring in Kwinana 2005–10
December 2011
20110190
Background Air Quality Monitoring in Kwinana 2005–10
Technical Report
Prepared by Department of Environment and Conservation
Air Quality Management Branch
December 2011
Technical Report Background Air Quality Monitoring in Kwinana 2005–10
i
Executive summary
In 2004, the then Department of Environment began developing the Background Air Quality Study (BAQS). The BAQS was initiated to assess ambient concentrations of a class of pollutants known as ’air toxics‘ in the Perth metropolitan and selected regional areas. The study was conducted in three phases—2005–06, 2007–08 and 2009–10. The Kwinana Airshed Study Advisory Group (KASAG) was formed in 2008 with membership from industry, community and Government to advise on the direction of and validity of the studies performed in Kwinana under this program. The KASAG members provided valuable local knowledge and direction during the planning and implementation of Phase 3 of this program. The study commenced in 2005, and initially focused on VOCs, heavy metals, PAHs and carbonyl compounds at Duncraig, Queens Buildings, and Hope Valley. After community consultation, this initial phase was extended to include monitoring of volatile organic compounds (VOCs), nitrogen dioxide (NO2), ammonia (NH3) and fine particles (PM2.5) at seven additional locations within the Kwinana and Rockingham areas. A combination of active and passive air samplers were used in this phase of the BAQS. Following additional community consultation, air monitoring of VOCs, carbonyls and ammonia was conducted from 2007 to 2008 in the Kwinana area. During this second phase of the BAQS, samples were collected using passive samplers. The third phase of the BAQS was conducted at Hillman and Calista from 2009 to 2010 and focused on oxides of nitrogen (NOx) and PM2.5. The levels of air toxics recorded during the three studies of 2005–06, 2007–08 and 2009–10 were similar to those found elsewhere in the Perth metropolitan area and were within health guidelines, except for acrolein, crotonaldehyde and methacrolein which the Department of Health (DOH) has advised are not sufficiently increased to cause a health concern for the majority of people. The majority of elevated crotonaldehyde, acrolein and methacrolein concentrations occurs in the summer months and is most likely due to various smoke events originating in the south-west of the state. The number of complaints by the local community shows that there is strong interest in air quality in the region. Unfortunately limitations with current monitoring technologies available make it difficult to determine the root cause of many of these complaints.
Technical Report Background Air Quality Monitoring in Kwinana 2005–10
ii
Table of contents Introduction ...................................................................................................... 1
2005–06 study ............................................................................................................ 2 2007–08 study ............................................................................................................ 2 2009–10 study ............................................................................................................ 5 Ambient air monitoring in Kwinana .......................................................................... 6
2 Particles as PM2.5 ........................................................................................ 7 Method ....................................................................................................................... 7 Results ........................................................................................................................ 7
2005–06 study ........................................................................................................ 7 2009–10 study ........................................................................................................ 9 Particle events associated with winds from KIA ................................................. 12
Discussion ................................................................................................................ 15 3 Nitrogen dioxide ........................................................................................ 16
Method ..................................................................................................................... 16 Results ...................................................................................................................... 16
2005–06 study ...................................................................................................... 16 2009–10 Study ..................................................................................................... 17
Discussion ................................................................................................................ 18 4 Carbonyls .................................................................................................. 19
Method ..................................................................................................................... 19 Results ...................................................................................................................... 19
2005–06 study ...................................................................................................... 19 2007–08 study ...................................................................................................... 21
Discussion ................................................................................................................ 22 5 Ammonia ................................................................................................... 25
Method ..................................................................................................................... 25 Results ...................................................................................................................... 26
2005–06 study ...................................................................................................... 26 2007–08 study ...................................................................................................... 26
Discussion ................................................................................................................ 28 6 Volatile organic compounds (VOCs) ......................................................... 30
Method ..................................................................................................................... 30 Results ...................................................................................................................... 31
2005–06 study ...................................................................................................... 31 2007–08 study ...................................................................................................... 32
Discussion ................................................................................................................ 34 7 Heavy metals ............................................................................................ 35
Method ..................................................................................................................... 35 Results ...................................................................................................................... 35
2005–06 study ...................................................................................................... 35 2009–10 study ...................................................................................................... 37
Discussion ................................................................................................................ 38 8 Polycyclic aromatic hydrocarbons ............................................................. 39
Method ..................................................................................................................... 39 Results ...................................................................................................................... 39
2005–06 ............................................................................................................... 39
Technical Report Background Air Quality Monitoring in Kwinana 2005–10
iii
Discussion ................................................................................................................ 40 9 Summary outcomes .................................................................................. 41 Appendix 1–Back trajectories for NEPM PM2.5 advisory standard exceedences ....................................................................................................................... 42
11 November 2009—8am .................................................................................... 43 11 November 2009—12 noon .............................................................................. 44 11 November 2009—5pm ................................................................................... 45 16 December 2009—7am .................................................................................... 46 16 December 2009—11am .................................................................................. 47 16 December 2009—11pm .................................................................................. 48 28 April 2010—3am ............................................................................................ 49 29 April 2010—4am ............................................................................................ 50 29 April 2010—6pm ............................................................................................ 51 6 May 2010—12 noon ......................................................................................... 52 7 May 2010—4am ............................................................................................... 53 7 May 2010—1pm ............................................................................................... 54
Appendix 2 Particle events while winds were from the KIA ..................... 55 22 March 2010—4:50pm ..................................................................................... 56 24 April 2010—11:40pm ..................................................................................... 57
Appendix 3 Guidelines used in this document ............................................. 58 Appendix 4 Quick guide to air sampling methods ........................................ 64
Figures Figure 1.1 Locations of the 2005–06 study sites in Kwinana and Rockingham. ........... 3 Figure 1.2 Locations of the 2007–08 study sites in Kwinana and Rockingham. ........... 4 Figure 1.3 Locations of the 2009–10 study sites in Kwinana and Rockingham. ........... 5 Figure 2.1 PM2.5 concentrations during 14 September 2005 to14 September 2006 ...... 8 Figure 2.2 One-hour averaged particle concentrations on 18 June 2006. ...................... 8 Figure 2.3 Moving monthly averaged PM2.5 concentrations ......................................... 9 Figure 2.4 PM2.5 concentrations during 2009–10 study ............................................... 10 Figure 2.5 PM2.5 pollution roses for the period from 1 July 2009 to 30 June 2010 ..... 12 Figure 2.6 Wind sectors identified for more investigation. ......................................... 13 Figure 2.7 Cumulative frequency graph for PM2.5 - 1 July 2009 to 30 June 2010 ...... 13 Figure 3.1 Annual average and maximum six-day NO2 concentrations ...................... 17 Figure 3.2 NO2 concentration statistics from 1 July 2009 to 30 June 2010................. 17 Figure 3.3 NO2 pollution roses for Calista and Hillman .............................................. 18 Figure 4.1 Carbonyl concentrations from 1 July 2005 to 30 June 2006 ...................... 20 Figure 4.2 Formaldehyde concentrations from 1 July 2005 to 30 June 2006 ............. .21 Figure 4.3 Carbonyl concentrations from 3 July 2007 to 2 September 2008 .............. 21 Figure 4.4 Formaldehyde concentrations from 3 July 2007 to 2 September2008. ...... 22 Figure 4.5 PM10 (blue) and PM2.5 (red) levels in Perth. ............................................... 23 Figure 5.1 Ammonia concentrations at Challenger from July 2005 to June 2006. ..... 26 Figure 5.2 Wind roses for the six highest ammonia readings during 2005–06 ........... 27 Figure 5.3 Ammonia concentrations in the Kwinana region from 1 July2007 to 30 June2008. ..................................................................................................................... 28 Figure 5.4 Wind rose and ammonia concentrations from 26 November 2007 to 3 December 2007 ............................................................................................................ 29 Figure 6.1 VOC concentrations from 23 May 2005 to 11 July2006. .......................... 31 Figure 6.2 BTEX concentrations from 23 May 2005 to 11 July 2006 ........................ 32
Technical Report Background Air Quality Monitoring in Kwinana 2005–10
iv
Figure 6.3 VOC concentrations from 3 July2007 to 26 August 2008 ......................... 33 Figure 6.4 BTEX concentrations 3 July 2007 to 26 August2008 ................................ 33 Figure 7.1 Heavy metals concentrations from 21 Fubruary2005 to 22 February2006 36 Figure 7.2 Heavy metals concentration 12 June 2009 to 1 June 2010 ......................... 38 Figure 8.1 Polycyclic aromatic hydrocarbon concentrations from 29 January 2005 to 29 January 2006 ........................................................................................................... 40
Tables
Table 1.1 Kwinana region air toxics sampling conducted since 2005. .......................... 1 Table 1.2 Long-term monitoring in the Kwinana region ............................................... 6 Table 2.1 Monitoring in the Kwinana region in 2005–06 and 2009–10 ........................ 7 Table 2.2 PM2.5 exceedences during 2009–10 study ................................................... 11 Table 2.3 Periods when winds were between 260o to 30o and 10-minute averaged PM2.5 concentrations at Calista Primary School were greater than 50 µg/m3. ............ 14 Table 2.4 Periods when winds were between 300o to 60o and 10-minute averaged PM2.5 concentrations at Hillman Primary School were greater than 50 µg/m3. .......... 15 Table 3.1 Monitoring in the Kwinana region in 2005–06 and 2009–10 ...................... 16 Table 5.1 Ammonia monitoring sites in the Kwinana region in 2007–08. .................. 25 Table 6.1: Annual Average Guideline Values for BTEX compounds ......................... 30 Table 7.1 Metals monitoring in 2005–06 and 2009–10 ............................................... 35
Technical Report Background Air Quality Monitoring in Kwinana 2005–10
v
Glossary Aerodynamic diameter
The diameter of a sphere of unit density (i.e. 1 g per cm³) which has the same settling velocity in the same gas as the particle being measured. It is also known as aerodynamic equivalent diameter (AED). Particles with the same AED are dynamically (although not necessarily physically) identical.
Air toxics Gaseous, aerosol or particle pollutants which are present in the air in low concentrations with characteristics such as toxicity and persistence so as to be a hazard to human, plant or animal life.
ATSDR United States Agency for Toxic Substances and Disease Registry Back trajectory A trajectory is the path a parcel of air takes as it responds to
changes in winds at different locations and times. A back trajectory indicates the recent history of a parcel of air before a given time.
BAQS Background Air Quality Study Cumulative frequency graph
The cumulative frequency value corresponding to a particular concentration is the total number of periods where the pollutant concentration is greater than or equal to the indicated concentration.
DEC Western Australian Department of Environment and Conservation
DOH Western Australian Department of Health EPP Environmental Protection Policy Heavy metals Heavy metals are elements and therefore cannot be destroyed,
nor can their properties be easily altered. In the context of this study, heavy metals are elements that generally exist as a solid at room temperature and so may not, in the strict sense of the word, actually be a metal or be one of the heavier elements.
HiVol A high volume sampler draws a large known volume of air through a filter paper over a 24-hour period. This filter is weighed both before and after sampling. The difference in filter weight divided by the volume of air gives the average concentration of particles in the air over the 24-hour sampling period. The filters can be analysed for heavy metals.
Log 10 scale Scale where each successive period or distance is equal to 10 times the previous period or distance. Presentation of data on a logarithmic scale is helpful when the data covers a large range of values—the logarithm reduces this to a more manageable range.
KIA Kwinana Industrial Area KIC Kwinana Industry Council Micrometre (µm) 0.000 001 or 10-6 metres Microgram (µg) 0.000 001 or 10-6 gram Nanograms (ng) 0.000 000 001 or 10-9 gram NEPM National Environment Protection Measure NH3 Ammonia NO Nitric oxide NO2 Nitrogen dioxide NOx Oxides of nitrogen— includes both NO and NO2
Technical Report Background Air Quality Monitoring in Kwinana 2005–10
vi
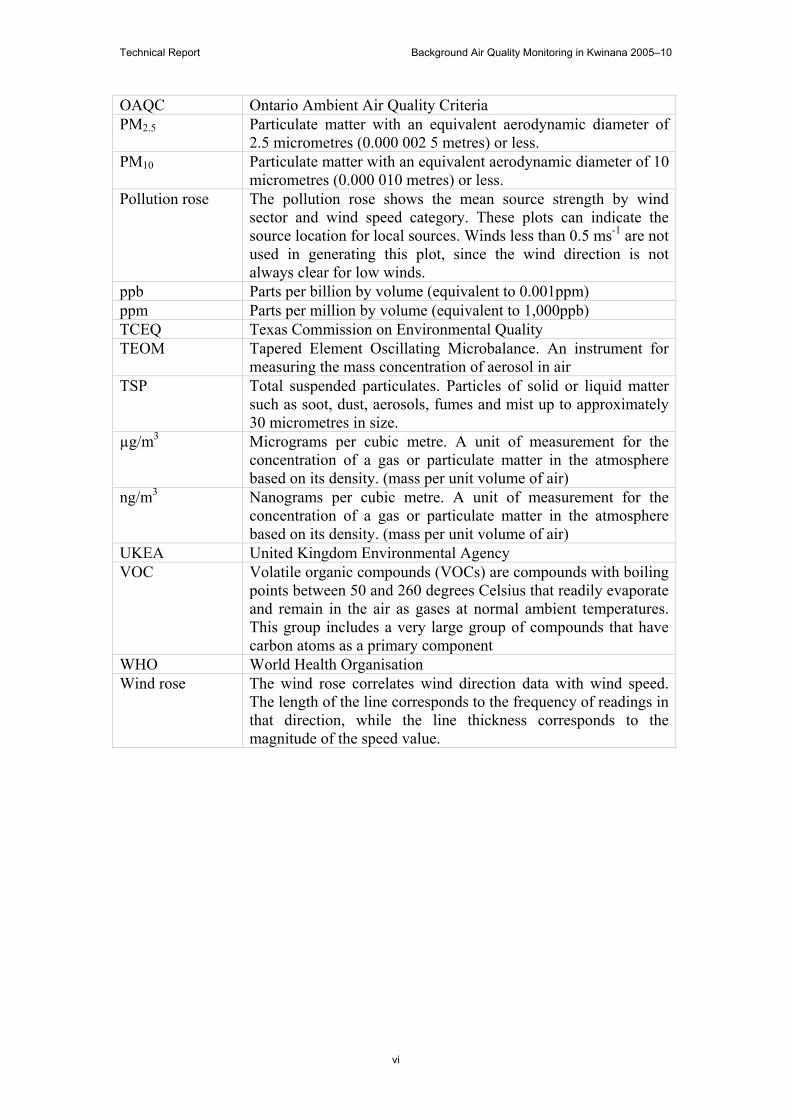
OAQC Ontario Ambient Air Quality Criteria PM2.5 Particulate matter with an equivalent aerodynamic diameter of
2.5 micrometres (0.000 002 5 metres) or less. PM10 Particulate matter with an equivalent aerodynamic diameter of 10
micrometres (0.000 010 metres) or less. Pollution rose The pollution rose shows the mean source strength by wind
sector and wind speed category. These plots can indicate the source location for local sources. Winds less than 0.5 ms-1 are not used in generating this plot, since the wind direction is not always clear for low winds.
ppb Parts per billion by volume (equivalent to 0.001ppm) ppm Parts per million by volume (equivalent to 1,000ppb) TCEQ Texas Commission on Environmental Quality TEOM Tapered Element Oscillating Microbalance. An instrument for
measuring the mass concentration of aerosol in air TSP Total suspended particulates. Particles of solid or liquid matter
such as soot, dust, aerosols, fumes and mist up to approximately 30 micrometres in size.
µg/m3 Micrograms per cubic metre. A unit of measurement for the concentration of a gas or particulate matter in the atmosphere based on its density. (mass per unit volume of air)
ng/m3 Nanograms per cubic metre. A unit of measurement for the concentration of a gas or particulate matter in the atmosphere based on its density. (mass per unit volume of air)
UKEA United Kingdom Environmental Agency VOC Volatile organic compounds (VOCs) are compounds with boiling
points between 50 and 260 degrees Celsius that readily evaporate and remain in the air as gases at normal ambient temperatures. This group includes a very large group of compounds that have carbon atoms as a primary component
WHO World Health Organisation Wind rose The wind rose correlates wind direction data with wind speed.
The length of the line corresponds to the frequency of readings in that direction, while the line thickness corresponds to the magnitude of the speed value.
Technical Report Background Air Quality Monitoring in Kwinana 2005–10
1
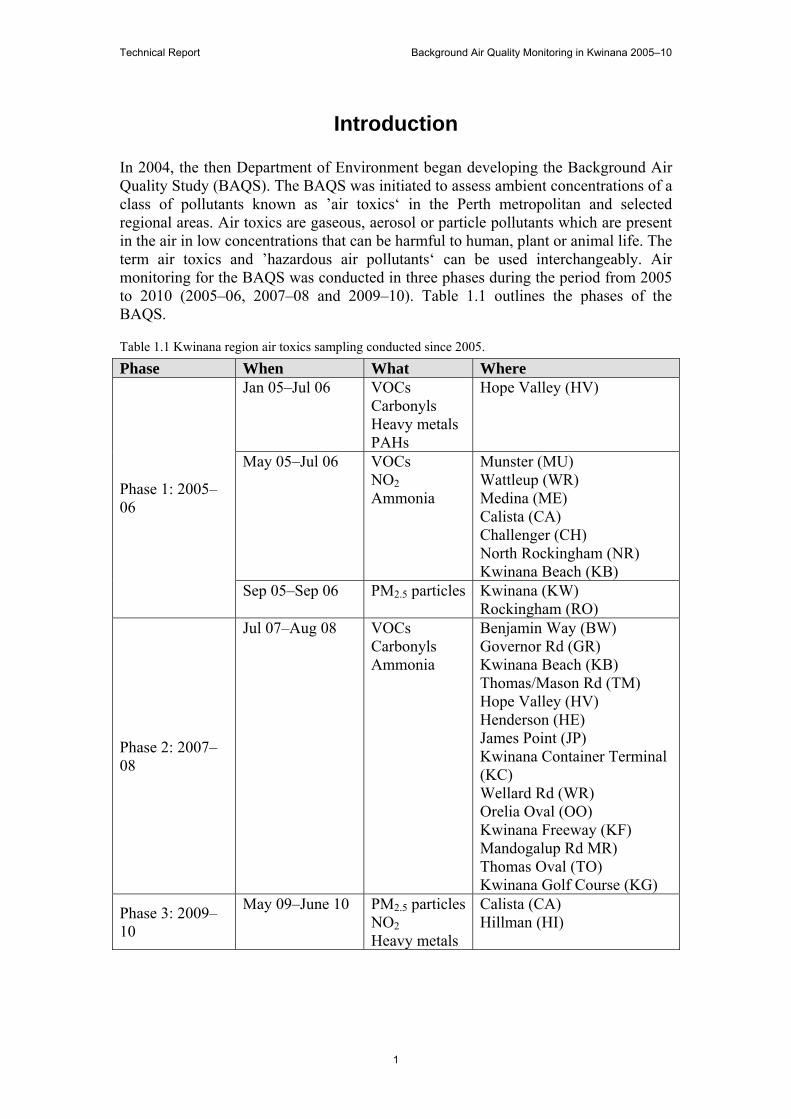
Introduction In 2004, the then Department of Environment began developing the Background Air Quality Study (BAQS). The BAQS was initiated to assess ambient concentrations of a class of pollutants known as ’air toxics‘ in the Perth metropolitan and selected regional areas. Air toxics are gaseous, aerosol or particle pollutants which are present in the air in low concentrations that can be harmful to human, plant or animal life. The term air toxics and ’hazardous air pollutants‘ can be used interchangeably. Air monitoring for the BAQS was conducted in three phases during the period from 2005 to 2010 (2005–06, 2007–08 and 2009–10). Table 1.1 outlines the phases of the BAQS.
Table 1.1 Kwinana region air toxics sampling conducted since 2005.
Phase When What Where
Phase 1: 2005–06
Jan 05–Jul 06 VOCs Carbonyls Heavy metals PAHs
Hope Valley (HV)
May 05–Jul 06 VOCs NO2 Ammonia
Munster (MU) Wattleup (WR) Medina (ME) Calista (CA) Challenger (CH) North Rockingham (NR) Kwinana Beach (KB)
Sep 05–Sep 06 PM2.5 particles Kwinana (KW) Rockingham (RO)
Phase 2: 2007–08
Jul 07–Aug 08 VOCs Carbonyls Ammonia
Benjamin Way (BW) Governor Rd (GR) Kwinana Beach (KB) Thomas/Mason Rd (TM) Hope Valley (HV) Henderson (HE) James Point (JP) Kwinana Container Terminal (KC) Wellard Rd (WR) Orelia Oval (OO) Kwinana Freeway (KF) Mandogalup Rd MR) Thomas Oval (TO) Kwinana Golf Course (KG)
Phase 3: 2009–10
May 09–June 10 PM2.5 particlesNO2 Heavy metals
Calista (CA) Hillman (HI)
Technical Report Background Air Quality Monitoring in Kwinana 2005–10
2
2005–06 study
Sampling for air toxics in Perth initially commenced in January 2005 and continued through 2006. The study focused on volatile organic compounds (VOCs), heavy metals, polycyclic aromatic hydrocarbons (PAHs) and carbonyl compounds. Sampling during this first phase was undertaken at three metropolitan sites; Duncraig, Queens Buildings and Hope Valley. Duncraig is located in a residential area about 16 kilometres north-west of the Perth Central Business District (CBD). Queens Buildings is an inner-city site with a major road intersection and very heavy traffic flow. Hope Valley is a site located south of the Perth CBD in an industrial buffer zone next to the Kwinana Industrial Area (KIA). The KIA has been home to Western Australia’s premier industrial site for more than 50 years. Growth of Perth’s southern corridor has meant that industrial impacts on urban communities have become increasingly important. After community consultation, the BAQS was extended to include monitoring of volatile organic compounds (VOCs), nitrogen dioxide (NO2), ammonia (NH3) and fine particles (PM2.5) at seven additional locations within the Kwinana and Rockingham areas. A combination of active and passive air samplers were used in this phase of the BAQS. The Kwinana region is located about 25 kilometres south of the Perth CBD. A map of the Kwinana region with the locations of the 2005–06 sites is shown in Figure 1.1. Radiello® passive samplers were used to measure six-day averages of VOCs, NO2 and NH3 concentrations over one year. Passive samplers were chosen due to the absence of power at chosen locations. PM2.5 sampling was also carried out using a Tapered Element Oscillating Microbalance (TEOM) at the Kwinana Town Centre and Rockingham City Shopping Centre. TEOMs provide information on the concentration of particles in the air and operate continuously with data being collected every 10 minutes.
2007–08 study
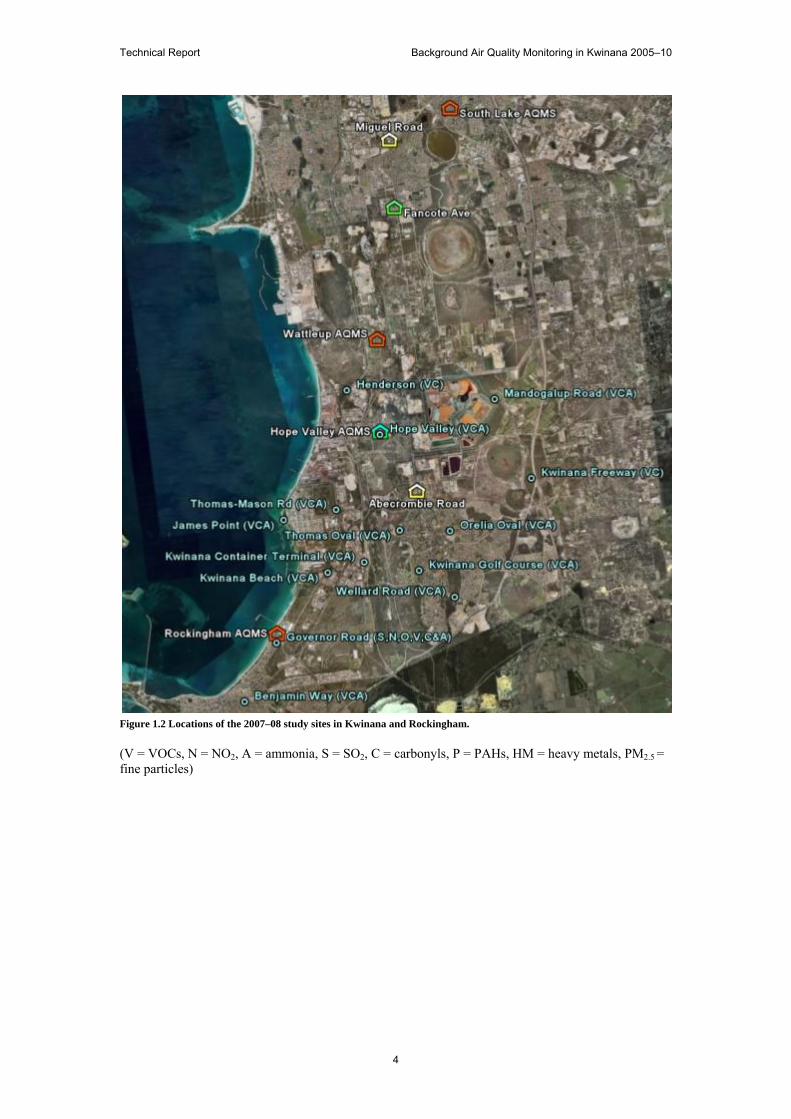
After the completion of the 2005–06 study, more consultation was held with community groups resulting in additional sampling in 2007–08 in the Kwinana and Rockingham area. During this second phase of the BAQS, VOCs, carbonyls and ammonia were monitored using passive samplers. A map with the locations of the 2007–08 sites is shown in Figure 1.2. The main objectives of the 2007–08 study were to: collect additional baseline data on levels of ambient air toxics in Kwinana compare these measured air toxics levels to NEPM (Air Toxics) guidelines collect and compile air quality data in a suitable format to facilitate rapid health
risk assessments and future epidemiological studies establish baseline values as an aid for assessing industry submissions to either
expand existing facilities or future new proposals create a database of background atmospheric air toxic profiles for use during
HAZMAT chemical incidents (e.g. dangerous chemical spillage or industrial emission).
Technical Report Background Air Quality Monitoring in Kwinana 2005–10
3
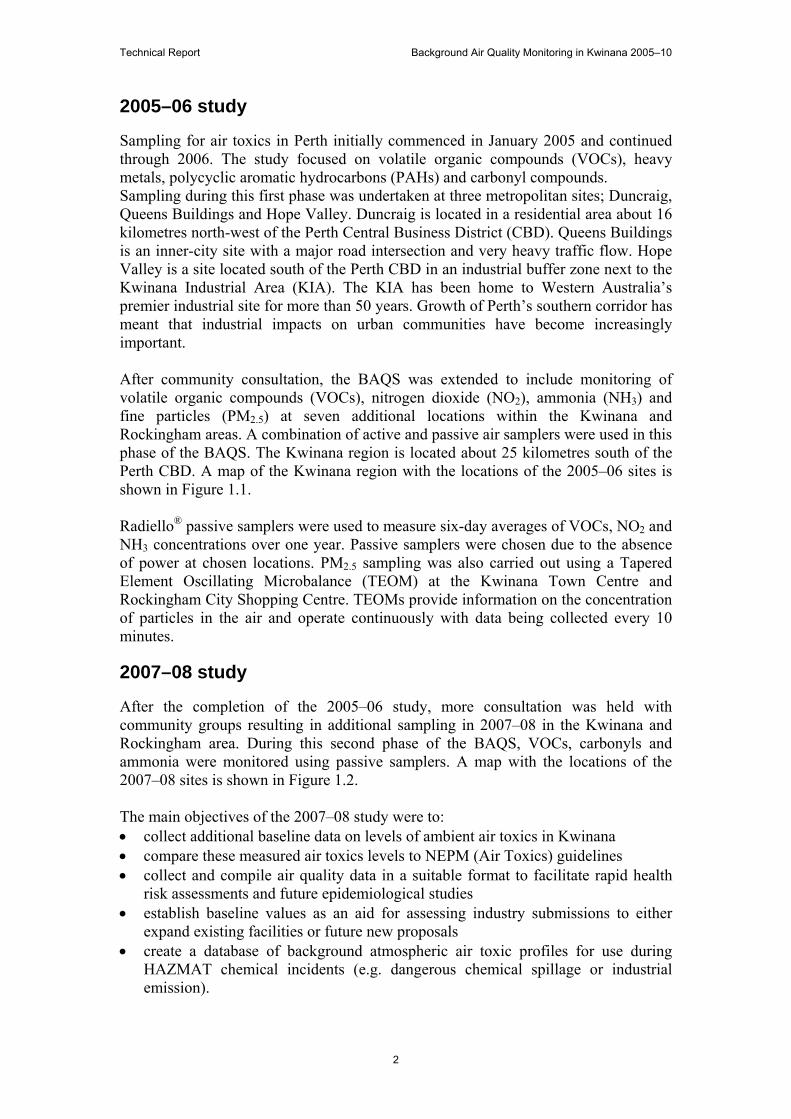
Figure 1.1 Locations of the 2005–2006 study sites in Kwinana and Rockingham.
(V = VOCs, N = NO2, A = ammonia, S = SO2, C = carbonyls, P = PAHs, HM = heavy metals, PM2.5 = fine particles)
Technical Report Background Air Quality Monitoring in Kwinana 2005–10
4
Figure 1.2 Locations of the 2007–08 study sites in Kwinana and Rockingham.
(V = VOCs, N = NO2, A = ammonia, S = SO2, C = carbonyls, P = PAHs, HM = heavy metals, PM2.5 = fine particles)
Technical Report Background Air Quality Monitoring in Kwinana 2005–10
5
2009–10 study
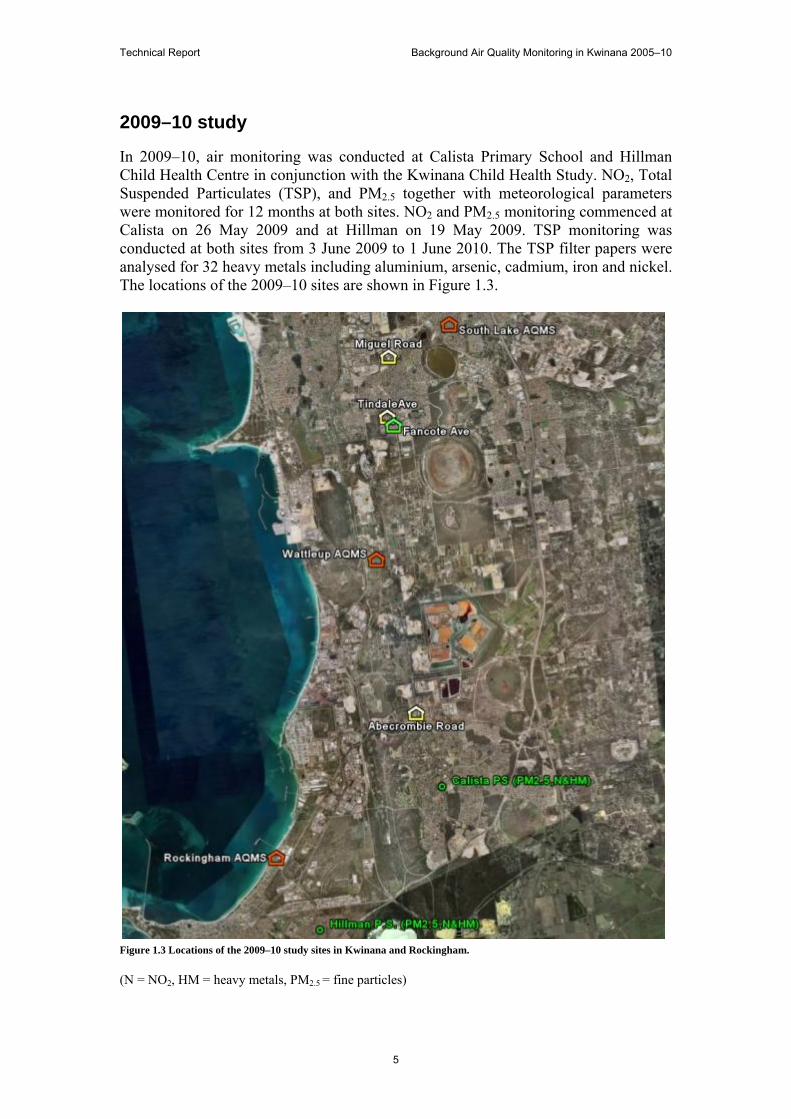
In 2009–10, air monitoring was conducted at Calista Primary School and Hillman Child Health Centre in conjunction with the Kwinana Child Health Study. NO2, Total Suspended Particulates (TSP), and PM2.5 together with meteorological parameters were monitored for 12 months at both sites. NO2 and PM2.5 monitoring commenced at Calista on 26 May 2009 and at Hillman on 19 May 2009. TSP monitoring was conducted at both sites from 3 June 2009 to 1 June 2010. The TSP filter papers were analysed for 32 heavy metals including aluminium, arsenic, cadmium, iron and nickel. The locations of the 2009–10 sites are shown in Figure 1.3.
Figure 1.3 Locations of the 2009–10 study sites in Kwinana and Rockingham.
(N = NO2, HM = heavy metals, PM2.5 = fine particles)
Technical Report Background Air Quality Monitoring in Kwinana 2005–10
6
Ambient air monitoring in Kwinana
In addition to the BAQS monitoring (Table 1.1), ambient air monitoring of SO2 and other criteria pollutants has been conducted within the Kwinana region for a number of years. The air monitoring sites listed in Table 1.2 are used to assess the effectiveness of the Environmental Protection (Kwinana) (Atmospheric Wastes) Policy (EPP). Industries with SO2 emission limits determined through the EPP procedure are required to establish and maintain a continuous emissions monitoring system for measuring the quantities of SO2 being emitted from their premises. In addition to this, each industry is required to monitor the ambient air concentration of SO2 at specified locations in the EPP area. Currently, industry fulfils this obligation through the Kwinana Industry Council (KIC). KIC operates three ambient air monitoring stations within the EPP area. DEC also currently maintains and operates an additional two (previously three) monitoring stations in the EPP area for monitoring compliance with the ambient air criteria for SO2.
Table 1.2 Long-term monitoring in the Kwinana region.
Station Operated by Currently operating Monitoring Abercrombie Road KIC Since 1993 SO2 Fancote Avenue KIC Since 2004
Closed February 2010 SO2, PM10
Tindale Avenue KIC Since 2010 SO2, PM10 Hope Valley DEC Since 1989
Closed April 2008 SO2, NO2
Miguel Road KIC Since 1993 SO2 North Rockingham DEC Since 1992 SO2, NO2, O3 Wattleup DEC Since 1990 SO2 This report summarises the air sampling that was undertaken during the BAQS for the periods from July 2007 to August 2008 and from May 2009 to June 2010. For comparative purposes, data from the 2005–06 study has been included where applicable.
Technical Report Background Air Quality Monitoring in Kwinana 2005–10
7
2 Particles as PM2.5
PM2.5 are particles that have an aerodynamic equivalent diameter of less than 2.5µm (0.000 002 5 metres). The aerodynamic size of a particle is different from its actual size. The aerodynamic equivalent diameter (also called aerodynamic diameter) is the diameter of a sphere, with a density of 1g/cm3 (the same as water), that has the same terminal settling velocity under gravity as the airborne particle considered. For example; a 1 µm diameter particle of carbon or 0.22µm diameter lead particle has a similar aerodynamic equivalent diameter as a 2.5µm diameter water particle. The aerodynamic diameter influences the aerodynamic behaviour of an aerosol. Sources of PM2.5 are generally combustion based and include power plants, industrial and commercial boilers/incinerators, mining operations, vehicle exhaust emissions, bushfires, domestic wood heating and the burning of vegetation for agricultural or fuel reduction purposes.
Method
Sampling for PM2.5 was conducted in Kwinana in 2005–06 using a TEOM located at the Kwinana Town Centre and the Rockingham City Shopping Centre. Both TEOMs operated continuously taking a sample every 10 minutes. A TEOM ambient particulate monitor measures ambient particulate concentrations directly and in real time. A known airflow is drawn through a 2.5μm size selective inlet head and maintained over a tapered glass element with a filter cartridge attached. The glass element vibrates at its natural frequency. As particulate matter gathers on the cartridge, the tube's natural frequency decreases. The ambient mass concentration is proportional to this change in frequency and is displayed in real time. In 2009–10, additional PM2.5 sampling was conducted at Calista Primary School and the Child Health Centre in Hillman. The sites and dates of PM2.5 monitoring undertaken by DEC in the region are presented in Table 2.1.
Table 2.1 Monitoring in the Kwinana region in 2005–06 and 2009–10
Site Monitoring dates Kwinana Town Centre 14 September 2005–14 September 2006 Rockingham City Shopping Centre 14 September 2005–14 September 2006 Calista Primary School 26 May 2009–30 June 2010 Hillman Child Health Centre 19 May 2009–30 June 2010
Results
2005–06 study Figure 2.1 shows a plot of summary statistics for PM2.5 at Kwinana Town Centre and Rockingham City Shopping Centre for 2005–06 in comparison to that of Duncraig for the same time period. Summary statistics have not been provided for South Lake as the PM2.5 TEOM was not installed until March 2006.
Technical Report Background Air Quality Monitoring in Kwinana 2005–10
8
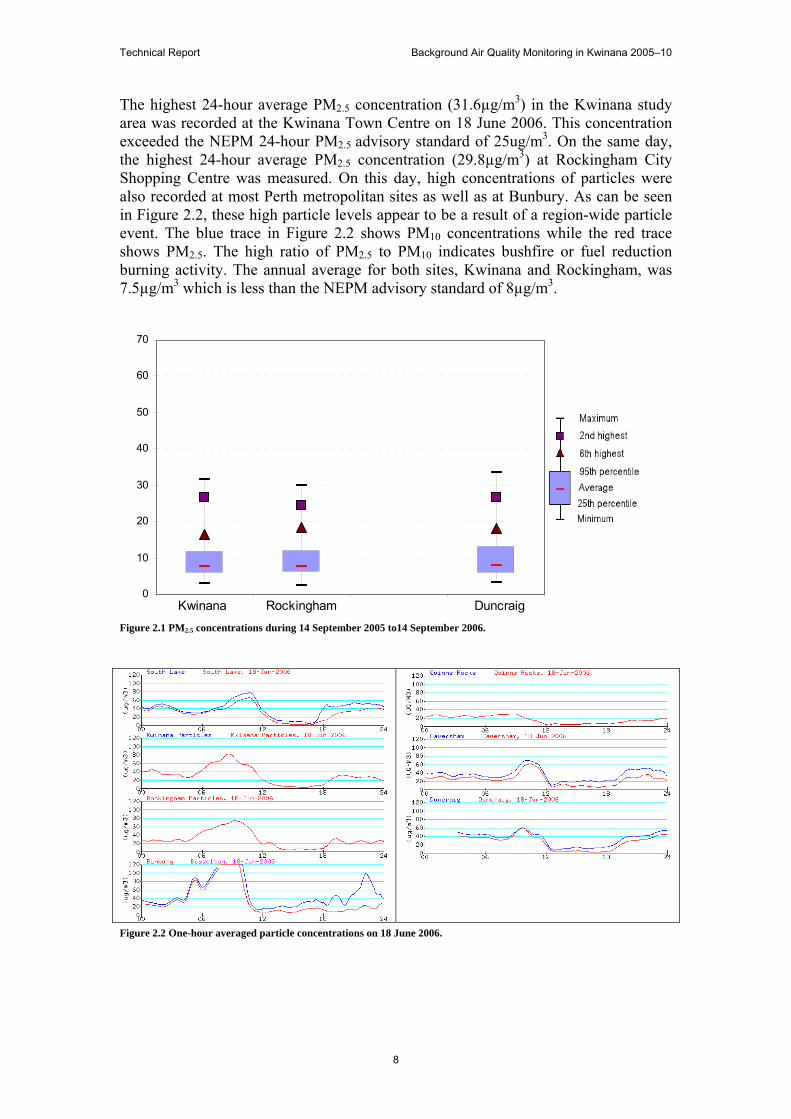
The highest 24-hour average PM2.5 concentration (31.6µg/m3) in the Kwinana study area was recorded at the Kwinana Town Centre on 18 June 2006. This concentration exceeded the NEPM 24-hour PM2.5 advisory standard of 25ug/m3. On the same day, the highest 24-hour average PM2.5 concentration (29.8µg/m3) at Rockingham City Shopping Centre was measured. On this day, high concentrations of particles were also recorded at most Perth metropolitan sites as well as at Bunbury. As can be seen in Figure 2.2, these high particle levels appear to be a result of a region-wide particle event. The blue trace in Figure 2.2 shows PM10 concentrations while the red trace shows PM2.5. The high ratio of PM2.5 to PM10 indicates bushfire or fuel reduction burning activity. The annual average for both sites, Kwinana and Rockingham, was 7.5µg/m3 which is less than the NEPM advisory standard of 8µg/m3.
Figure 2.1 PM2.5 concentrations during 14 September 2005 to14 September 2006.
Figure 2.2 One-hour averaged particle concentrations on 18 June 2006.
0
10
20
30
40
50
60
70
1 2 3 4Kwinana Rockingham Duncraig
Technical Report Background Air Quality Monitoring in Kwinana 2005–10
9
2009–10 study
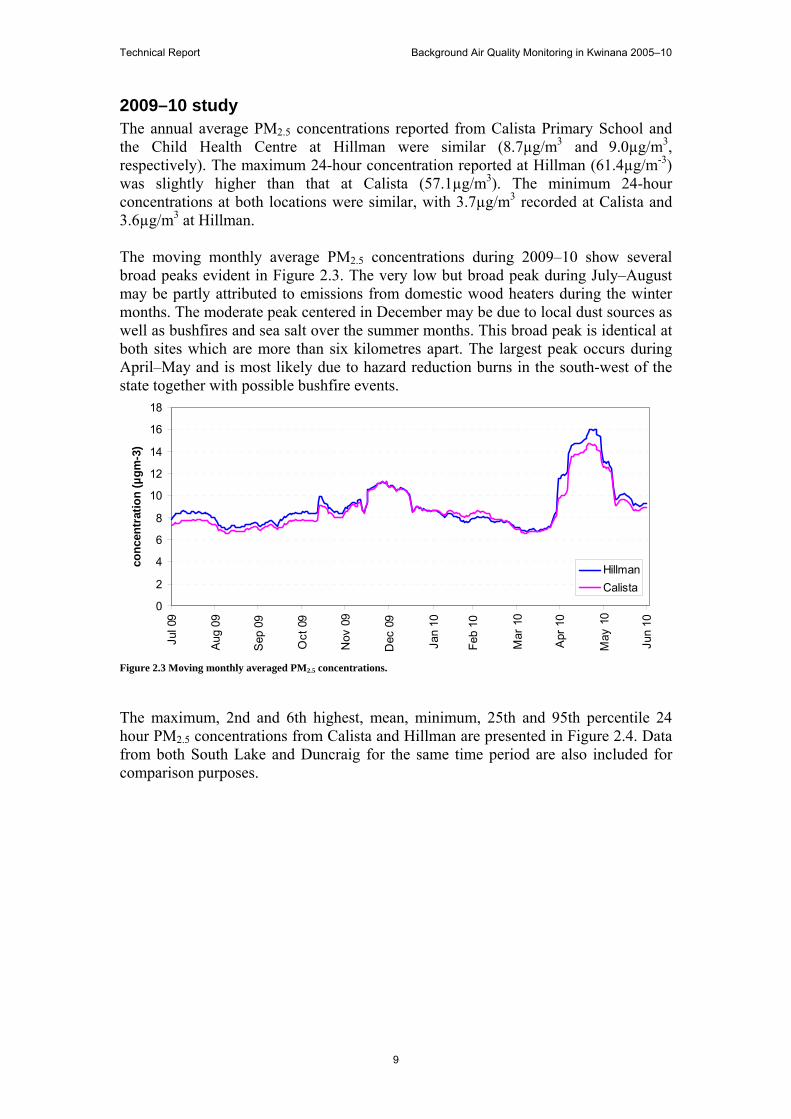
The annual average PM2.5 concentrations reported from Calista Primary School and the Child Health Centre at Hillman were similar (8.7µg/m3 and 9.0µg/m3, respectively). The maximum 24-hour concentration reported at Hillman (61.4µg/m-3) was slightly higher than that at Calista (57.1µg/m3). The minimum 24-hour concentrations at both locations were similar, with 3.7µg/m3 recorded at Calista and 3.6µg/m3 at Hillman. The moving monthly average PM2.5 concentrations during 2009–10 show several broad peaks evident in Figure 2.3. The very low but broad peak during July–August may be partly attributed to emissions from domestic wood heaters during the winter months. The moderate peak centered in December may be due to local dust sources as well as bushfires and sea salt over the summer months. This broad peak is identical at both sites which are more than six kilometres apart. The largest peak occurs during April–May and is most likely due to hazard reduction burns in the south-west of the state together with possible bushfire events.
Figure 2.3 Moving monthly averaged PM2.5 concentrations.
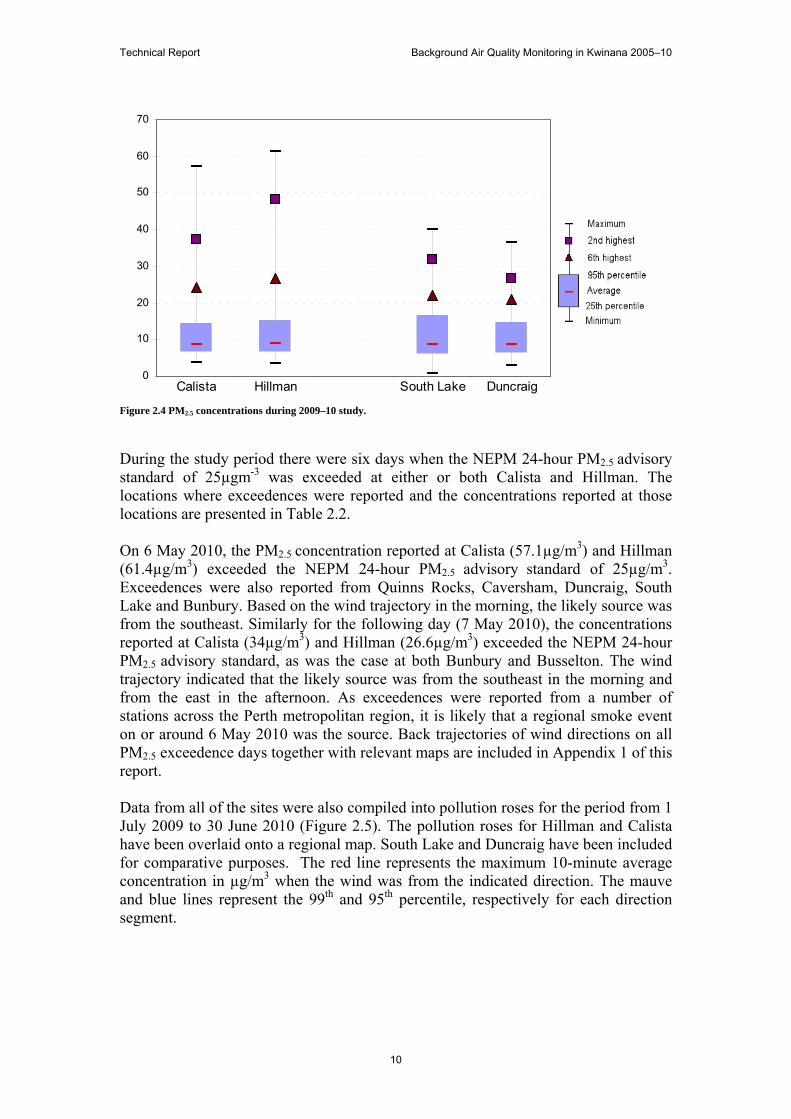
The maximum, 2nd and 6th highest, mean, minimum, 25th and 95th percentile 24 hour PM2.5 concentrations from Calista and Hillman are presented in Figure 2.4. Data from both South Lake and Duncraig for the same time period are also included for comparison purposes.
0
2
4
6
8
10
12
14
16
18
Jul 0
9
Aug
09
Sep
09
Oct
09
Nov
09
Dec
09
Jan
10
Feb
10
Mar
10
Apr
10
May
10
Jun
10
con
cen
trat
ion
(µ
gm
-3)
HillmanCalista
Technical Report Background Air Quality Monitoring in Kwinana 2005–10
10
Figure 2.4 PM2.5 concentrations during 2009–10 study.
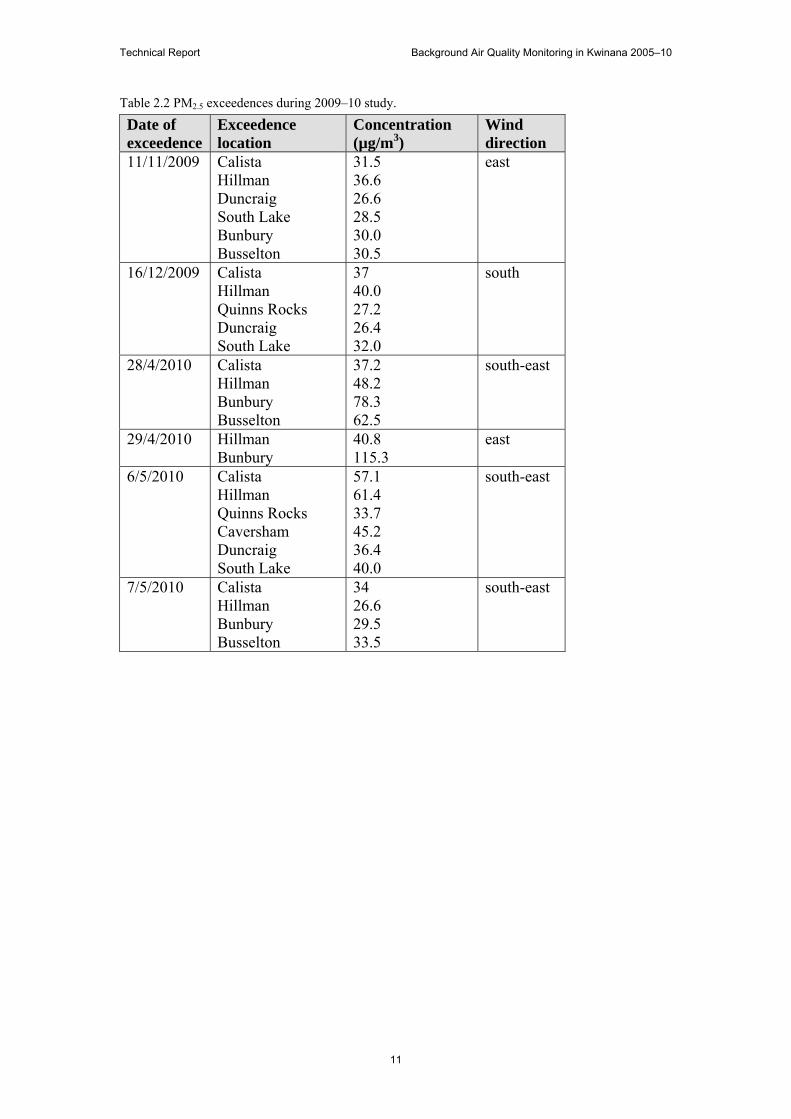
During the study period there were six days when the NEPM 24-hour PM2.5 advisory standard of 25µgm-3 was exceeded at either or both Calista and Hillman. The locations where exceedences were reported and the concentrations reported at those locations are presented in Table 2.2. On 6 May 2010, the PM2.5 concentration reported at Calista (57.1µg/m3) and Hillman (61.4µg/m3) exceeded the NEPM 24-hour PM2.5 advisory standard of 25µg/m3. Exceedences were also reported from Quinns Rocks, Caversham, Duncraig, South Lake and Bunbury. Based on the wind trajectory in the morning, the likely source was from the southeast. Similarly for the following day (7 May 2010), the concentrations reported at Calista (34µg/m3) and Hillman (26.6µg/m3) exceeded the NEPM 24-hour PM2.5 advisory standard, as was the case at both Bunbury and Busselton. The wind trajectory indicated that the likely source was from the southeast in the morning and from the east in the afternoon. As exceedences were reported from a number of stations across the Perth metropolitan region, it is likely that a regional smoke event on or around 6 May 2010 was the source. Back trajectories of wind directions on all PM2.5 exceedence days together with relevant maps are included in Appendix 1 of this report. Data from all of the sites were also compiled into pollution roses for the period from 1 July 2009 to 30 June 2010 (Figure 2.5). The pollution roses for Hillman and Calista have been overlaid onto a regional map. South Lake and Duncraig have been included for comparative purposes. The red line represents the maximum 10-minute average concentration in µg/m3 when the wind was from the indicated direction. The mauve and blue lines represent the 99th and 95th percentile, respectively for each direction segment.
0
10
20
30
40
50
60
70
1 2 3 4 5Calista Hillman South Lake Duncraig
Technical Report Background Air Quality Monitoring in Kwinana 2005–10
11
Table 2.2 PM2.5 exceedences during 2009–10 study.
Date of exceedence
Exceedence location
Concentration (µg/m3)
Wind direction
11/11/2009 Calista Hillman Duncraig South Lake Bunbury Busselton
31.5 36.6 26.6 28.5 30.0 30.5
east
16/12/2009 Calista Hillman Quinns Rocks Duncraig South Lake
37 40.0 27.2 26.4 32.0
south
28/4/2010 Calista Hillman Bunbury Busselton
37.2 48.2 78.3 62.5
south-east
29/4/2010 Hillman Bunbury
40.8 115.3
east
6/5/2010 Calista Hillman Quinns Rocks Caversham Duncraig South Lake
57.1 61.4 33.7 45.2 36.4 40.0
south-east
7/5/2010 Calista Hillman Bunbury Busselton
34 26.6 29.5 33.5
south-east
Technical Report Background Air Quality Monitoring in Kwinana 2005–10
12
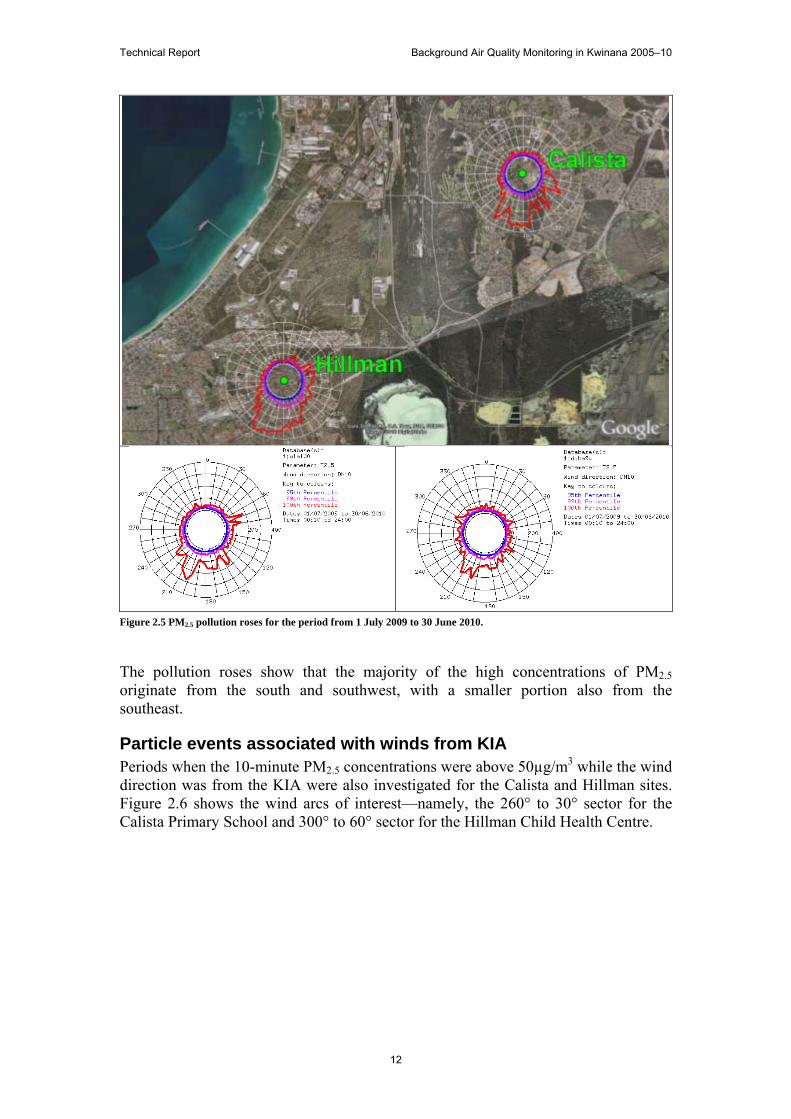
Figure 2.5 PM2.5 pollution roses for the period from 1 July 2009 to 30 June 2010.
The pollution roses show that the majority of the high concentrations of PM2.5 originate from the south and southwest, with a smaller portion also from the southeast.
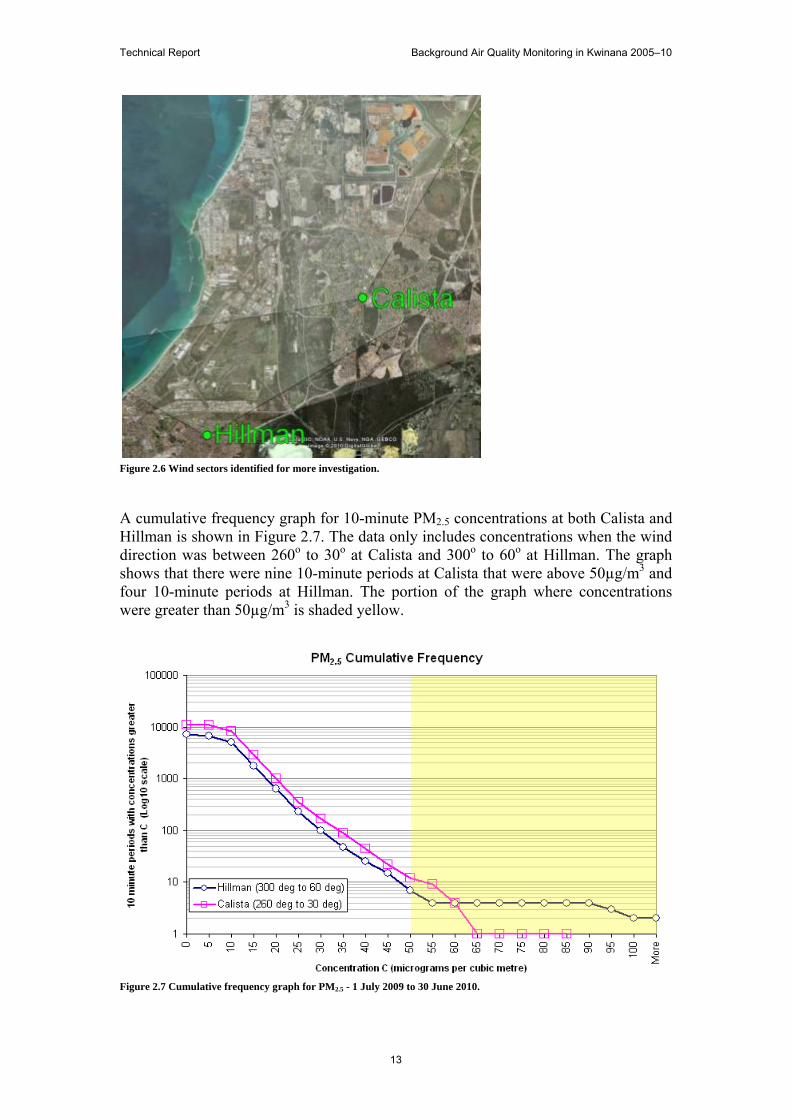
Particle events associated with winds from KIA Periods when the 10-minute PM2.5 concentrations were above 50µg/m3 while the wind direction was from the KIA were also investigated for the Calista and Hillman sites. Figure 2.6 shows the wind arcs of interest—namely, the 260° to 30° sector for the Calista Primary School and 300° to 60° sector for the Hillman Child Health Centre.
Technical Report Background Air Quality Monitoring in Kwinana 2005–10
13
Figure 2.6 Wind sectors identified for more investigation.
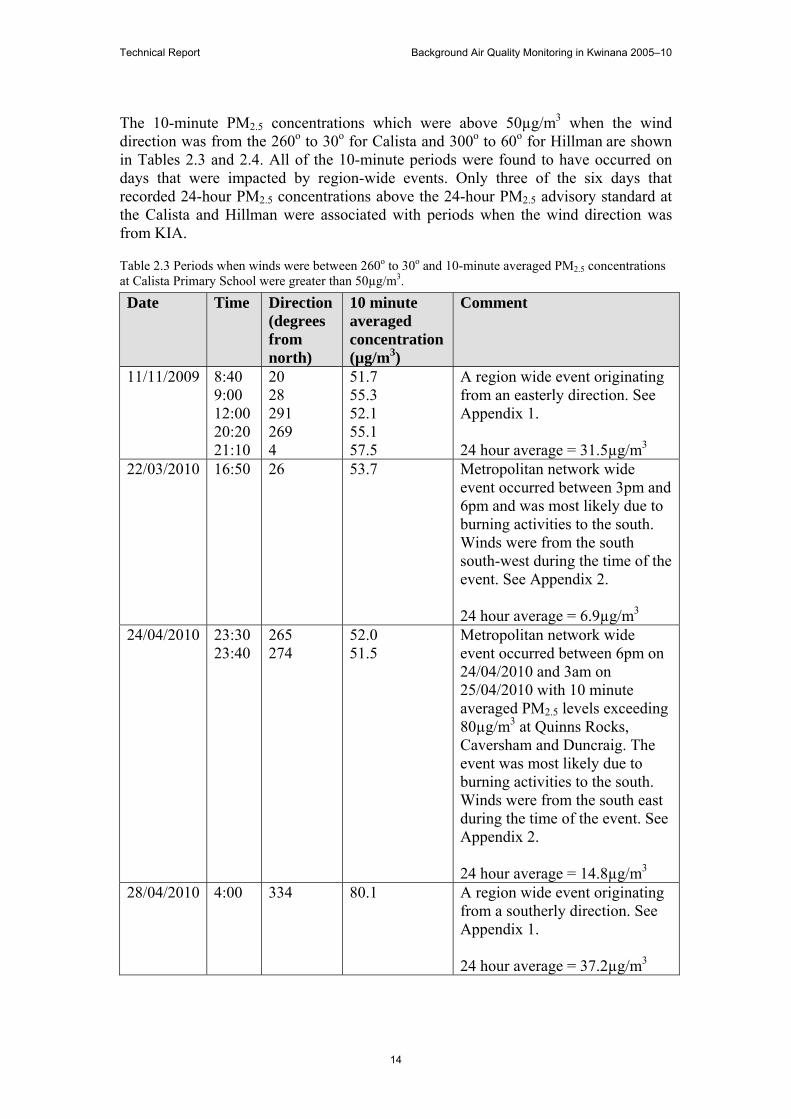
A cumulative frequency graph for 10-minute PM2.5 concentrations at both Calista and Hillman is shown in Figure 2.7. The data only includes concentrations when the wind direction was between 260o to 30o at Calista and 300o to 60o at Hillman. The graph shows that there were nine 10-minute periods at Calista that were above 50µg/m3 and four 10-minute periods at Hillman. The portion of the graph where concentrations were greater than 50µg/m3 is shaded yellow.
Figure 2.7 Cumulative frequency graph for PM2.5 - 1 July 2009 to 30 June 2010.
Technical Report Background Air Quality Monitoring in Kwinana 2005–10
14
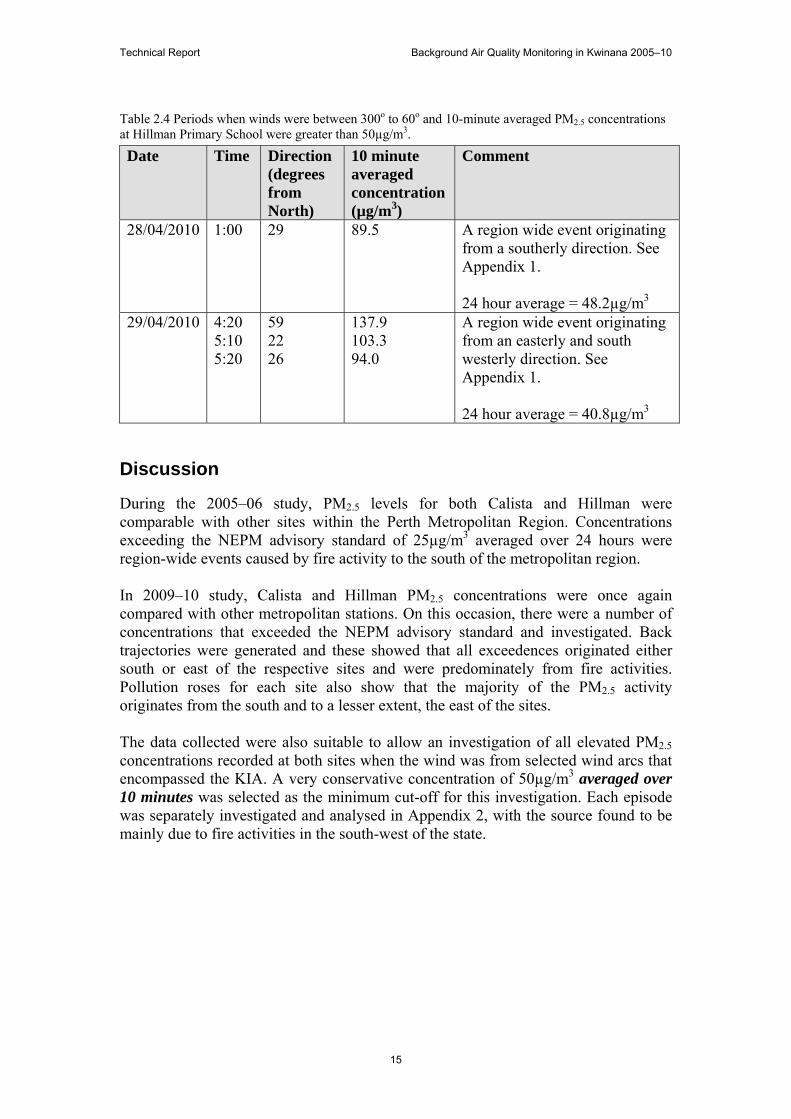
The 10-minute PM2.5 concentrations which were above 50µg/m3 when the wind direction was from the 260o to 30o for Calista and 300o to 60o for Hillman are shown in Tables 2.3 and 2.4. All of the 10-minute periods were found to have occurred on days that were impacted by region-wide events. Only three of the six days that recorded 24-hour PM2.5 concentrations above the 24-hour PM2.5 advisory standard at the Calista and Hillman were associated with periods when the wind direction was from KIA.
Table 2.3 Periods when winds were between 260o to 30o and 10-minute averaged PM2.5 concentrations at Calista Primary School were greater than 50µg/m3.
Date Time Direction (degrees from north)
10 minute averaged concentration (µg/m3)
Comment
11/11/2009 8:40 9:00 12:00 20:20 21:10
20 28 291 269 4
51.7 55.3 52.1 55.1 57.5
A region wide event originating from an easterly direction. See Appendix 1. 24 hour average = 31.5µg/m3
22/03/2010 16:50 26 53.7 Metropolitan network wide event occurred between 3pm and 6pm and was most likely due to burning activities to the south. Winds were from the south south-west during the time of the event. See Appendix 2. 24 hour average = 6.9µg/m3
24/04/2010 23:30 23:40
265 274
52.0 51.5
Metropolitan network wide event occurred between 6pm on 24/04/2010 and 3am on 25/04/2010 with 10 minute averaged PM2.5 levels exceeding 80µg/m3 at Quinns Rocks, Caversham and Duncraig. The event was most likely due to burning activities to the south. Winds were from the south east during the time of the event. See Appendix 2. 24 hour average = 14.8µg/m3
28/04/2010 4:00 334 80.1 A region wide event originating from a southerly direction. See Appendix 1. 24 hour average = 37.2µg/m3
Technical Report Background Air Quality Monitoring in Kwinana 2005–10
15
Table 2.4 Periods when winds were between 300o to 60o and 10-minute averaged PM2.5 concentrations at Hillman Primary School were greater than 50µg/m3.
Date Time Direction (degrees from North)
10 minute averaged concentration (µg/m3)
Comment
28/04/2010 1:00 29 89.5 A region wide event originating from a southerly direction. See Appendix 1. 24 hour average = 48.2µg/m3
29/04/2010 4:20 5:10 5:20
59 22 26
137.9 103.3 94.0
A region wide event originating from an easterly and south westerly direction. See Appendix 1. 24 hour average = 40.8µg/m3
Discussion
During the 2005–06 study, PM2.5 levels for both Calista and Hillman were comparable with other sites within the Perth Metropolitan Region. Concentrations exceeding the NEPM advisory standard of 25µg/m3 averaged over 24 hours were region-wide events caused by fire activity to the south of the metropolitan region. In 2009–10 study, Calista and Hillman PM2.5 concentrations were once again compared with other metropolitan stations. On this occasion, there were a number of concentrations that exceeded the NEPM advisory standard and investigated. Back trajectories were generated and these showed that all exceedences originated either south or east of the respective sites and were predominately from fire activities. Pollution roses for each site also show that the majority of the PM2.5 activity originates from the south and to a lesser extent, the east of the sites. The data collected were also suitable to allow an investigation of all elevated PM2.5 concentrations recorded at both sites when the wind was from selected wind arcs that encompassed the KIA. A very conservative concentration of 50µg/m3 averaged over 10 minutes was selected as the minimum cut-off for this investigation. Each episode was separately investigated and analysed in Appendix 2, with the source found to be mainly due to fire activities in the south-west of the state.
Technical Report Background Air Quality Monitoring in Kwinana 2005–10
16
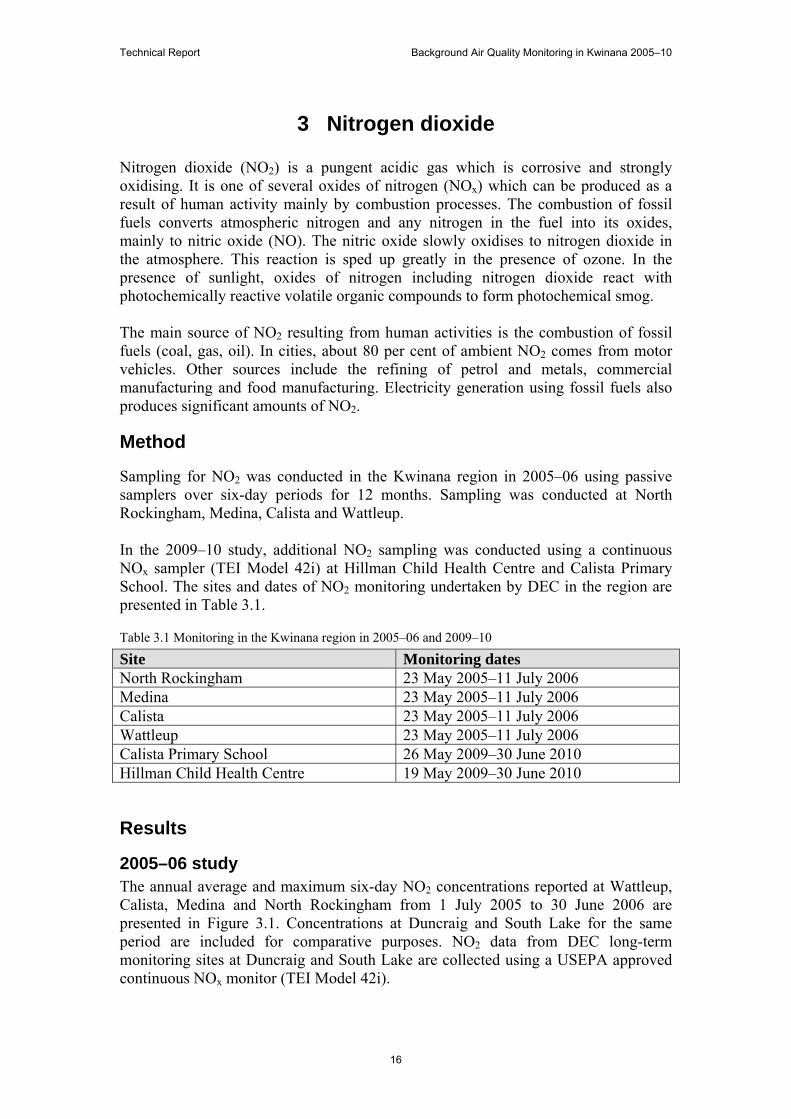
3 Nitrogen dioxide Nitrogen dioxide (NO2) is a pungent acidic gas which is corrosive and strongly oxidising. It is one of several oxides of nitrogen (NOx) which can be produced as a result of human activity mainly by combustion processes. The combustion of fossil fuels converts atmospheric nitrogen and any nitrogen in the fuel into its oxides, mainly to nitric oxide (NO). The nitric oxide slowly oxidises to nitrogen dioxide in the atmosphere. This reaction is sped up greatly in the presence of ozone. In the presence of sunlight, oxides of nitrogen including nitrogen dioxide react with photochemically reactive volatile organic compounds to form photochemical smog. The main source of NO2 resulting from human activities is the combustion of fossil fuels (coal, gas, oil). In cities, about 80 per cent of ambient NO2 comes from motor vehicles. Other sources include the refining of petrol and metals, commercial manufacturing and food manufacturing. Electricity generation using fossil fuels also produces significant amounts of NO2.
Method
Sampling for NO2 was conducted in the Kwinana region in 2005–06 using passive samplers over six-day periods for 12 months. Sampling was conducted at North Rockingham, Medina, Calista and Wattleup. In the 2009–10 study, additional NO2 sampling was conducted using a continuous NOx sampler (TEI Model 42i) at Hillman Child Health Centre and Calista Primary School. The sites and dates of NO2 monitoring undertaken by DEC in the region are presented in Table 3.1.
Table 3.1 Monitoring in the Kwinana region in 2005–06 and 2009–10
Site Monitoring dates North Rockingham 23 May 2005–11 July 2006 Medina 23 May 2005–11 July 2006 Calista 23 May 2005–11 July 2006 Wattleup 23 May 2005–11 July 2006 Calista Primary School 26 May 2009–30 June 2010 Hillman Child Health Centre 19 May 2009–30 June 2010
Results
2005–06 study The annual average and maximum six-day NO2 concentrations reported at Wattleup, Calista, Medina and North Rockingham from 1 July 2005 to 30 June 2006 are presented in Figure 3.1. Concentrations at Duncraig and South Lake for the same period are included for comparative purposes. NO2 data from DEC long-term monitoring sites at Duncraig and South Lake are collected using a USEPA approved continuous NOx monitor (TEI Model 42i).
Technical Report Background Air Quality Monitoring in Kwinana 2005–10
17
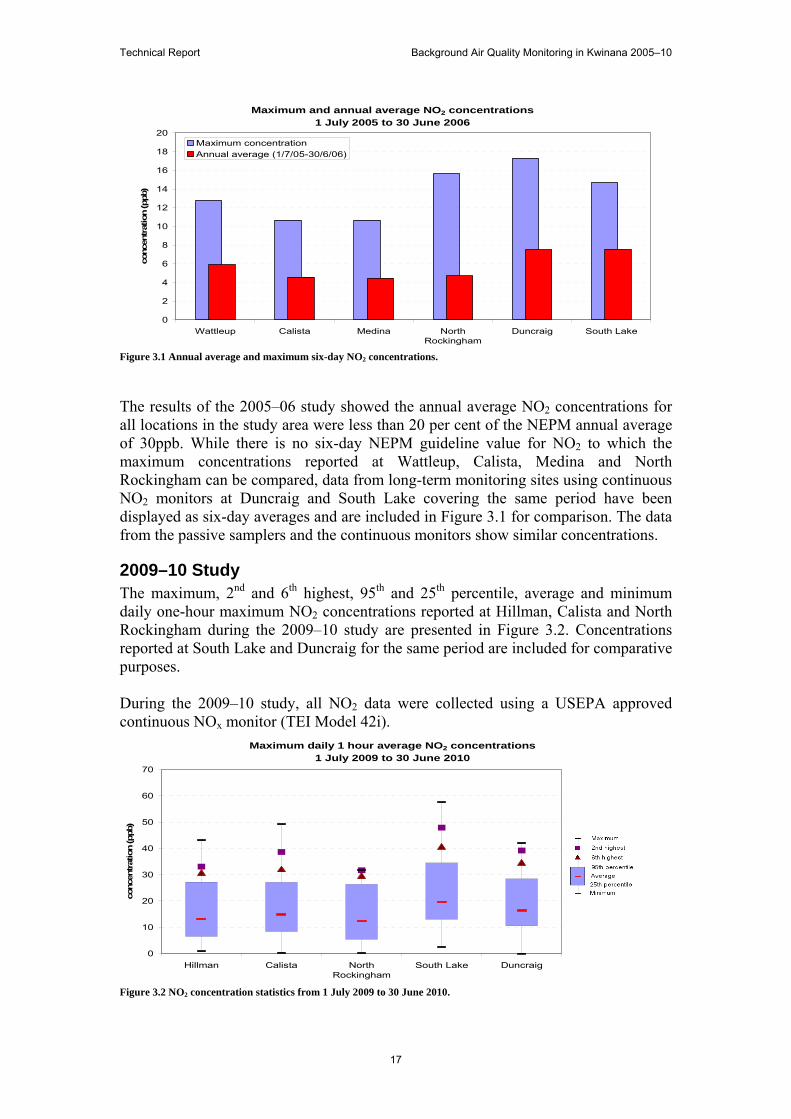
Figure 3.1 Annual average and maximum six-day NO2 concentrations.
The results of the 2005–06 study showed the annual average NO2 concentrations for all locations in the study area were less than 20 per cent of the NEPM annual average of 30ppb. While there is no six-day NEPM guideline value for NO2 to which the maximum concentrations reported at Wattleup, Calista, Medina and North Rockingham can be compared, data from long-term monitoring sites using continuous NO2 monitors at Duncraig and South Lake covering the same period have been displayed as six-day averages and are included in Figure 3.1 for comparison. The data from the passive samplers and the continuous monitors show similar concentrations.
2009–10 Study The maximum, 2nd and 6th highest, 95th and 25th percentile, average and minimum daily one-hour maximum NO2 concentrations reported at Hillman, Calista and North Rockingham during the 2009–10 study are presented in Figure 3.2. Concentrations reported at South Lake and Duncraig for the same period are included for comparative purposes. During the 2009–10 study, all NO2 data were collected using a USEPA approved continuous NOx monitor (TEI Model 42i).
Figure 3.2 NO2 concentration statistics from 1 July 2009 to 30 June 2010.
Maximum and annual average NO2 concentrations1 July 2005 to 30 June 2006
0
2
4
6
8
10
12
14
16
18
20
Wattleup Calista Medina NorthRockingham
Duncraig South Lake
conce
ntrat
ion (ppb)
Maximum concentrationAnnual average (1/7/05-30/6/06)
Maximum daily 1 hour average NO2 concentrations1 July 2009 to 30 June 2010
0
10
20
30
40
50
60
70
Hillman Calista NorthRockingham
South Lake Duncraig
conce
ntrat
ion (ppb)
Technical Report Background Air Quality Monitoring in Kwinana 2005–10
18
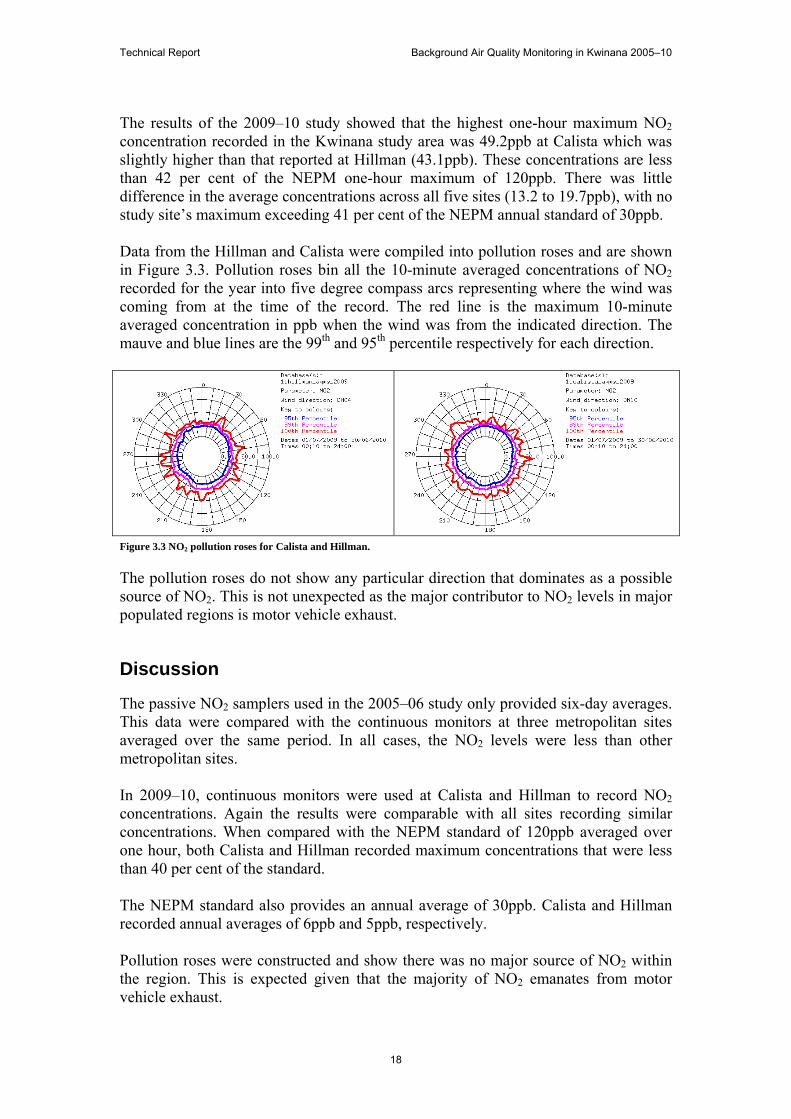
The results of the 2009–10 study showed that the highest one-hour maximum NO2 concentration recorded in the Kwinana study area was 49.2ppb at Calista which was slightly higher than that reported at Hillman (43.1ppb). These concentrations are less than 42 per cent of the NEPM one-hour maximum of 120ppb. There was little difference in the average concentrations across all five sites (13.2 to 19.7ppb), with no study site’s maximum exceeding 41 per cent of the NEPM annual standard of 30ppb. Data from the Hillman and Calista were compiled into pollution roses and are shown in Figure 3.3. Pollution roses bin all the 10-minute averaged concentrations of NO2 recorded for the year into five degree compass arcs representing where the wind was coming from at the time of the record. The red line is the maximum 10-minute averaged concentration in ppb when the wind was from the indicated direction. The mauve and blue lines are the 99th and 95th percentile respectively for each direction.
Figure 3.3 NO2 pollution roses for Calista and Hillman.
The pollution roses do not show any particular direction that dominates as a possible source of NO2. This is not unexpected as the major contributor to NO2 levels in major populated regions is motor vehicle exhaust.
Discussion
The passive NO2 samplers used in the 2005–06 study only provided six-day averages. This data were compared with the continuous monitors at three metropolitan sites averaged over the same period. In all cases, the NO2 levels were less than other metropolitan sites. In 2009–10, continuous monitors were used at Calista and Hillman to record NO2 concentrations. Again the results were comparable with all sites recording similar concentrations. When compared with the NEPM standard of 120ppb averaged over one hour, both Calista and Hillman recorded maximum concentrations that were less than 40 per cent of the standard. The NEPM standard also provides an annual average of 30ppb. Calista and Hillman recorded annual averages of 6ppb and 5ppb, respectively. Pollution roses were constructed and show there was no major source of NO2 within the region. This is expected given that the majority of NO2 emanates from motor vehicle exhaust.
Technical Report Background Air Quality Monitoring in Kwinana 2005–10
19
4 Carbonyls Carbonyl compounds contain a carbon atom which is double-bonded to an oxygen atom. Commonly known carbonyls include formaldehyde, acetaldehyde and acetone. Formaldehyde is a colourless flammable gas at room temperature and has a distinct pungent odour. It is commonly used in the production of fertiliser, paper products, plywood, particleboard and fibreboard, insulation material and urea-formaldehyde resins. Acetaldehyde is a colourless and volatile liquid with a very pungent odour. It is used as an intermediate in the production of a number of chemicals, and in a number of food flavourings. Acetaldehyde is also used in the manufacture of synthetic rubber, perfumes, aniline dyes and plastics. Acetone is used as a solvent and intermediate in chemical production, drug and pharmaceutical manufacture and surface coatings. It is emitted from a number of consumer products including nail polish and paint removers, paint and industrial chemicals.
Method
Carbonyls were monitored in 2005–06 at Duncraig, Queens Buildings and Hope Valley using DNPH tubes according to USEPA Method TO-11A. Twenty-four hour samples were taken once every six days from 27 July 2005 to 28 July 2006. In the 2007–08 study, carbonyls were monitored over a seven day period once per month using passive samplers from 3 July 2007 to 2 September 2008 at 14 locations. These locations are shown in Figures 1.1 and 1.2. A number of carbonyls monitored in the 2005–06 and 2007–08 studies have guideline values with which the concentrations reported in these studies can be compared. The guideline values are presented in Appendix 3. The data from the 2005–06 study has been available on the DEC Air Quality website since 2008.
Results
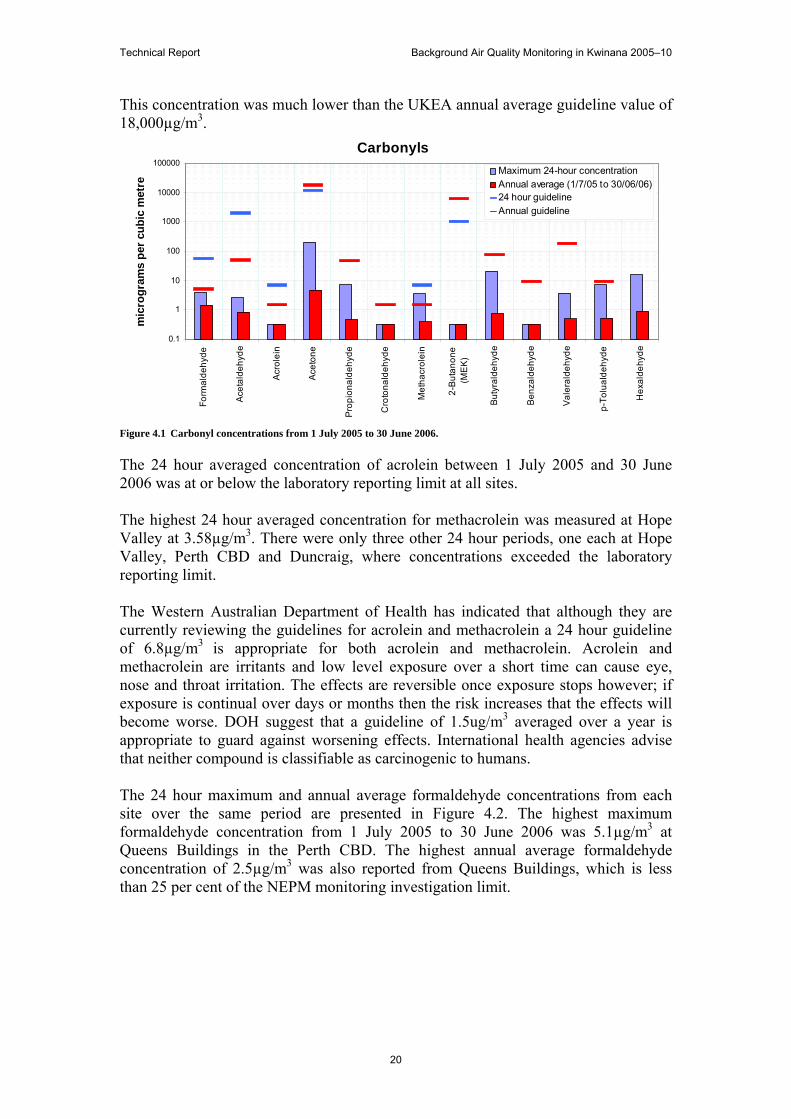
2005–06 study The maximum and average concentrations of all carbonyls measured during 1 July 2005 to 30 June 2006 is presented in Figure 4.1. The graph concentration axis has been presented in a logarithmic scale to better display all the concentrations. Where guidelines are available and are less than the maximum value displayed on the graph, these have also been included in the figure. While the highest carbonyl concentration reported was for acetone at Hope Valley on 29 January 2006 (201.2µg/m3), this concentration was much less than the OAQC 24 hour guideline value of 11,800µg/m3. The second highest concentration of acetone at Hope Valley was 19.8µg/m3, with the remainder being less than 5µg/m3. The highest annual average acetone concentration from 1 July 2005 to 30 June 2006 was also reported at Hope Valley (4.7µg/m3).
Technical Report Background Air Quality Monitoring in Kwinana 2005–10
20
This concentration was much lower than the UKEA annual average guideline value of 18,000µg/m3.
Figure 4.1 Carbonyl concentrations from 1 July 2005 to 30 June 2006.
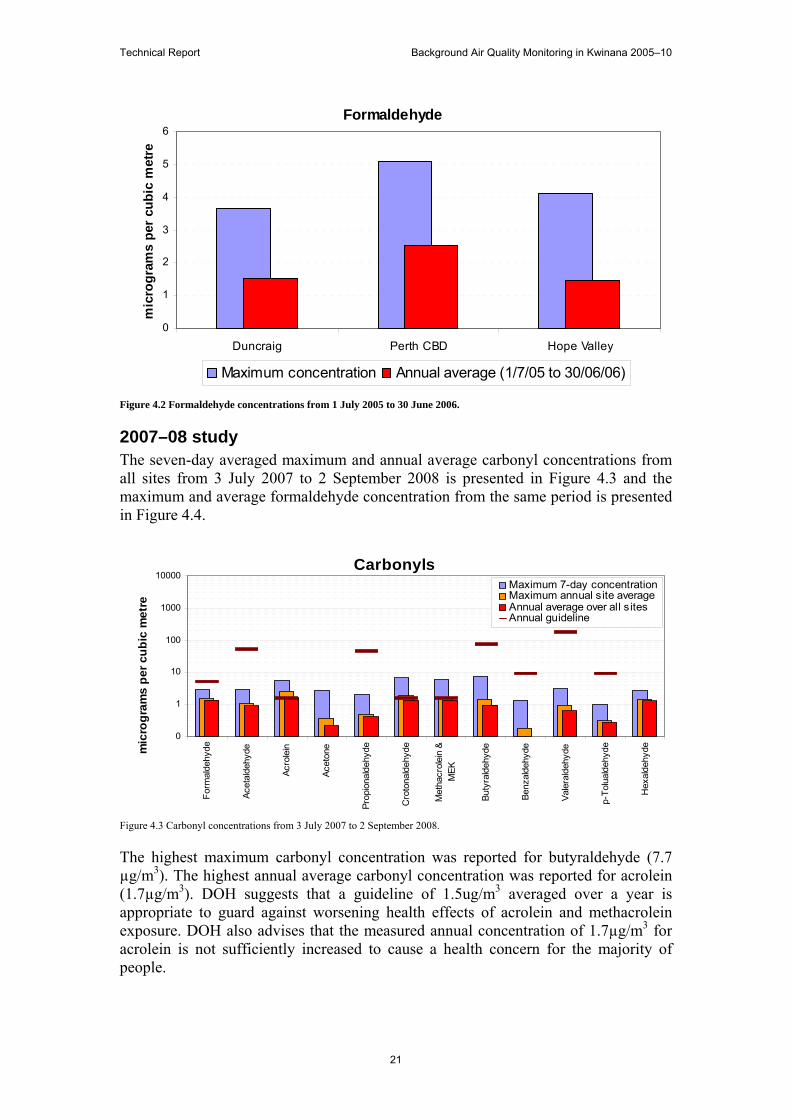
The 24 hour averaged concentration of acrolein between 1 July 2005 and 30 June 2006 was at or below the laboratory reporting limit at all sites. The highest 24 hour averaged concentration for methacrolein was measured at Hope Valley at 3.58µg/m3. There were only three other 24 hour periods, one each at Hope Valley, Perth CBD and Duncraig, where concentrations exceeded the laboratory reporting limit. The Western Australian Department of Health has indicated that although they are currently reviewing the guidelines for acrolein and methacrolein a 24 hour guideline of 6.8µg/m3 is appropriate for both acrolein and methacrolein. Acrolein and methacrolein are irritants and low level exposure over a short time can cause eye, nose and throat irritation. The effects are reversible once exposure stops however; if exposure is continual over days or months then the risk increases that the effects will become worse. DOH suggest that a guideline of 1.5ug/m3 averaged over a year is appropriate to guard against worsening effects. International health agencies advise that neither compound is classifiable as carcinogenic to humans. The 24 hour maximum and annual average formaldehyde concentrations from each site over the same period are presented in Figure 4.2. The highest maximum formaldehyde concentration from 1 July 2005 to 30 June 2006 was 5.1µg/m3 at Queens Buildings in the Perth CBD. The highest annual average formaldehyde concentration of 2.5µg/m3 was also reported from Queens Buildings, which is less than 25 per cent of the NEPM monitoring investigation limit.
Carbonyls
0.1
1
10
100
1000
10000
100000
Form
alde
hyde
Ace
tald
ehyd
e
Acr
olei
n
Ace
tone
Pro
pion
alde
hyde
Cro
tona
ldeh
yde
Met
hacr
olei
n
2-B
utan
one
(ME
K)
Buty
rald
ehyd
e
Ben
zald
ehyd
e
Vale
rald
ehyd
e
p-To
lual
dehy
de
Hex
alde
hyde
mic
rog
ram
s p
er c
ub
ic m
etre
Maximum 24-hour concentrationAnnual average (1/7/05 to 30/06/06)24 hour guidelineAnnual guideline
Technical Report Background Air Quality Monitoring in Kwinana 2005–10
21
Figure 4.2 Formaldehyde concentrations from 1 July 2005 to 30 June 2006.
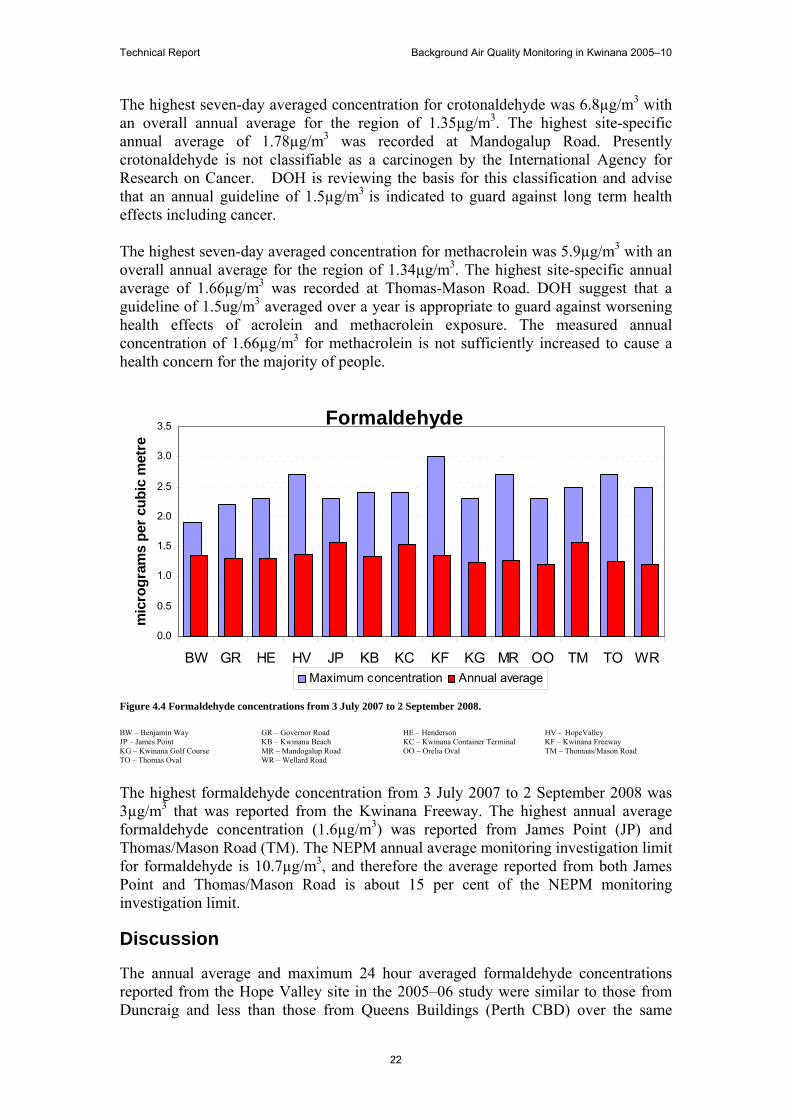
2007–08 study The seven-day averaged maximum and annual average carbonyl concentrations from all sites from 3 July 2007 to 2 September 2008 is presented in Figure 4.3 and the maximum and average formaldehyde concentration from the same period is presented in Figure 4.4.
Figure 4.3 Carbonyl concentrations from 3 July 2007 to 2 September 2008.
The highest maximum carbonyl concentration was reported for butyraldehyde (7.7 µg/m3). The highest annual average carbonyl concentration was reported for acrolein (1.7µg/m3). DOH suggests that a guideline of 1.5ug/m3 averaged over a year is appropriate to guard against worsening health effects of acrolein and methacrolein exposure. DOH also advises that the measured annual concentration of 1.7µg/m3 for acrolein is not sufficiently increased to cause a health concern for the majority of people.
Formaldehyde
0
1
2
3
4
5
6
Duncraig Perth CBD Hope Valley
mic
rog
ram
s p
er c
ub
ic m
etre
Maximum concentration Annual average (1/7/05 to 30/06/06)
Carbonyls
0
1
10
100
1000
10000
Form
alde
hyde
Acet
alde
hyde
Acro
lein
Acet
one
Prop
iona
ldeh
yde
Cro
tona
ldeh
yde
Met
hacr
olei
n &
MEK
Buty
rald
ehyd
e
Benz
alde
hyde
Vale
rald
ehyd
e
p-To
lual
dehy
de
Hex
alde
hydem
icro
gra
ms
pe
r c
ub
ic m
etr
e
Maximum 7-day concentrationMaximum annual site averageAnnual average over all sitesAnnual guideline
Technical Report Background Air Quality Monitoring in Kwinana 2005–10
22
The highest seven-day averaged concentration for crotonaldehyde was 6.8µg/m3 with an overall annual average for the region of 1.35µg/m3. The highest site-specific annual average of 1.78µg/m3 was recorded at Mandogalup Road. Presently crotonaldehyde is not classifiable as a carcinogen by the International Agency for Research on Cancer. DOH is reviewing the basis for this classification and advise that an annual guideline of 1.5µg/m3 is indicated to guard against long term health effects including cancer. The highest seven-day averaged concentration for methacrolein was 5.9µg/m3 with an overall annual average for the region of 1.34µg/m3. The highest site-specific annual average of 1.66µg/m3 was recorded at Thomas-Mason Road. DOH suggest that a guideline of 1.5ug/m3 averaged over a year is appropriate to guard against worsening health effects of acrolein and methacrolein exposure. The measured annual concentration of 1.66µg/m3 for methacrolein is not sufficiently increased to cause a health concern for the majority of people.
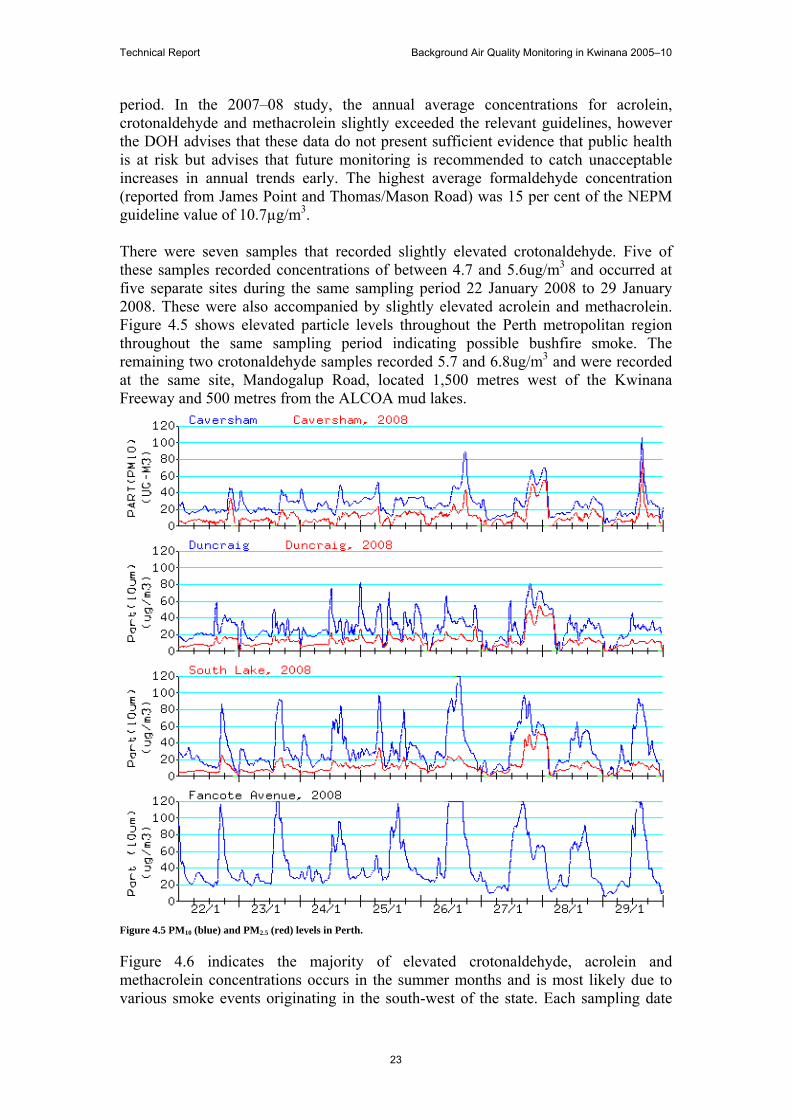
Figure 4.4 Formaldehyde concentrations from 3 July 2007 to 2 September 2008.
BW – Benjamin Way GR – Governor Road HE – Henderson HV - HopeValley JP – James Point KB – Kwinana Beach KC – Kwinana Container Terminal KF – Kwinana Freeway KG – Kwinana Golf Course MR – Mandogalup Road OO – Orelia Oval TM – Thomaas/Mason Road TO – Thomas Oval WR – Wellard Road
The highest formaldehyde concentration from 3 July 2007 to 2 September 2008 was 3µg/m3 that was reported from the Kwinana Freeway. The highest annual average formaldehyde concentration (1.6µg/m3) was reported from James Point (JP) and Thomas/Mason Road (TM). The NEPM annual average monitoring investigation limit for formaldehyde is 10.7µg/m3, and therefore the average reported from both James Point and Thomas/Mason Road is about 15 per cent of the NEPM monitoring investigation limit.
Discussion
The annual average and maximum 24 hour averaged formaldehyde concentrations reported from the Hope Valley site in the 2005–06 study were similar to those from Duncraig and less than those from Queens Buildings (Perth CBD) over the same
Formaldehyde
0.0
0.5
1.0
1.5
2.0
2.5
3.0
3.5
BW GR HE HV JP KB KC KF KG MR OO TM TO WR
mic
rog
ram
s p
er c
ub
ic m
etre
Maximum concentration Annual average
Technical Report Background Air Quality Monitoring in Kwinana 2005–10
23
period. In the 2007–08 study, the annual average concentrations for acrolein, crotonaldehyde and methacrolein slightly exceeded the relevant guidelines, however the DOH advises that these data do not present sufficient evidence that public health is at risk but advises that future monitoring is recommended to catch unacceptable increases in annual trends early. The highest average formaldehyde concentration (reported from James Point and Thomas/Mason Road) was 15 per cent of the NEPM guideline value of 10.7µg/m3. There were seven samples that recorded slightly elevated crotonaldehyde. Five of these samples recorded concentrations of between 4.7 and 5.6ug/m3 and occurred at five separate sites during the same sampling period 22 January 2008 to 29 January 2008. These were also accompanied by slightly elevated acrolein and methacrolein. Figure 4.5 shows elevated particle levels throughout the Perth metropolitan region throughout the same sampling period indicating possible bushfire smoke. The remaining two crotonaldehyde samples recorded 5.7 and 6.8ug/m3 and were recorded at the same site, Mandogalup Road, located 1,500 metres west of the Kwinana Freeway and 500 metres from the ALCOA mud lakes.
Figure 4.5 PM10 (blue) and PM2.5 (red) levels in Perth.
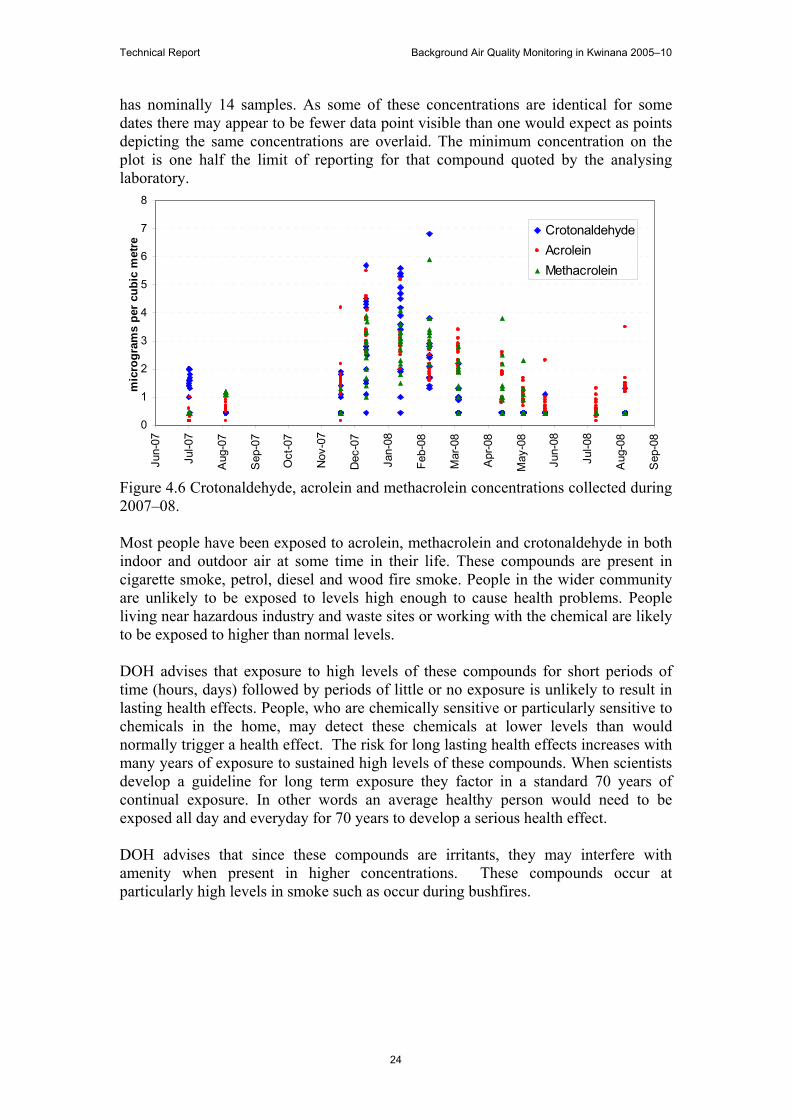
Figure 4.6 indicates the majority of elevated crotonaldehyde, acrolein and methacrolein concentrations occurs in the summer months and is most likely due to various smoke events originating in the south-west of the state. Each sampling date
Technical Report Background Air Quality Monitoring in Kwinana 2005–10
24
has nominally 14 samples. As some of these concentrations are identical for some dates there may appear to be fewer data point visible than one would expect as points depicting the same concentrations are overlaid. The minimum concentration on the plot is one half the limit of reporting for that compound quoted by the analysing laboratory.
Figure 4.6 Crotonaldehyde, acrolein and methacrolein concentrations collected during 2007–08. Most people have been exposed to acrolein, methacrolein and crotonaldehyde in both indoor and outdoor air at some time in their life. These compounds are present in cigarette smoke, petrol, diesel and wood fire smoke. People in the wider community are unlikely to be exposed to levels high enough to cause health problems. People living near hazardous industry and waste sites or working with the chemical are likely to be exposed to higher than normal levels. DOH advises that exposure to high levels of these compounds for short periods of time (hours, days) followed by periods of little or no exposure is unlikely to result in lasting health effects. People, who are chemically sensitive or particularly sensitive to chemicals in the home, may detect these chemicals at lower levels than would normally trigger a health effect. The risk for long lasting health effects increases with many years of exposure to sustained high levels of these compounds. When scientists develop a guideline for long term exposure they factor in a standard 70 years of continual exposure. In other words an average healthy person would need to be exposed all day and everyday for 70 years to develop a serious health effect. DOH advises that since these compounds are irritants, they may interfere with amenity when present in higher concentrations. These compounds occur at particularly high levels in smoke such as occur during bushfires.
0
1
2
3
4
5
6
7
8
Jun-
07
Jul-0
7
Aug
-07
Sep
-07
Oct
-07
Nov
-07
Dec
-07
Jan-
08
Feb-
08
Mar
-08
Apr
-08
May
-08
Jun-
08
Jul-0
8
Aug
-08
Sep
-08
mic
rog
ram
s p
er c
ub
ic m
etre
CrotonaldehydeAcroleinMethacrolein
Technical Report Background Air Quality Monitoring in Kwinana 2005–10
25
5 Ammonia Ammonia is a colourless gas that has a very distinct odour and dissolves in water. In its gaseous form it is also known as anhydrous ammonia and when dissolved in water it is known as liquid or aqueous ammonia. Ammonia can react with acidic compounds in the atmosphere to create ammonia aerosols which can be subject to wet or dry deposition. It is used in nickel refining and the production of fertilisers, synthetic fibres and explosives, and is emitted during the combustion of residential and commercial biomass, from livestock, coal pyrolysis, and in motor vehicle exhaust. Ammonia has an odour threshold of between 1 and 1.5 parts per million (750ug/m3 and 1,000ug/m3)
Method
In the 2005–06 study, ammonia was sampled at the Challenger site (see Figure 1.1) using passive samplers over six-day sampling periods from 22 June 2005 to 11 July 2006. The Challenger site was chosen following an analysis of meteorological data from the Kwinana region and NPI emission data for ammonia. The most common winds were from the sector between east-north-east and south-west, and therefore a site downwind of these prevailing winds and close to the major emission source of ammonia in the region was required. The Challenger site was chosen on this basis. In the 2007–08 study, ammonia was sampled between July 2007 and September 2008 at a total of 11 sites for a seven-day period every month. The site locations are presented in Table 5.1.
Table 5.1 Ammonia monitoring sites in the Kwinana region in 2007–08.
Site name Benjamin Way (BW) Governor Road (GR) James Point (JP) Kwinana Beach (KB) Kwinana Container Terminal (KC) Kwinana Golf Course (KG) Mandogalup Road (MR) Orelia Oval (OO) Thomas Oval (TO) Thomas/Mason Road (TM) Wellard Road (WR)
Technical Report Background Air Quality Monitoring in Kwinana 2005–10
26
Results
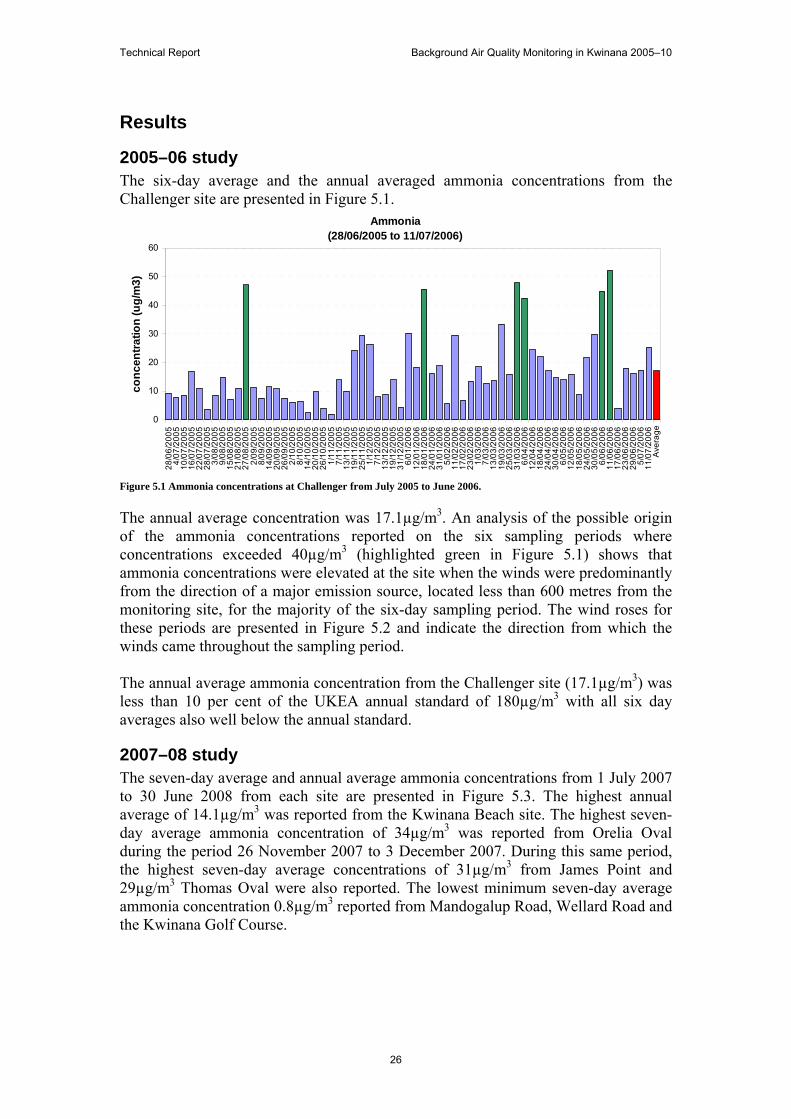
2005–06 study The six-day average and the annual averaged ammonia concentrations from the Challenger site are presented in Figure 5.1.
Figure 5.1 Ammonia concentrations at Challenger from July 2005 to June 2006.
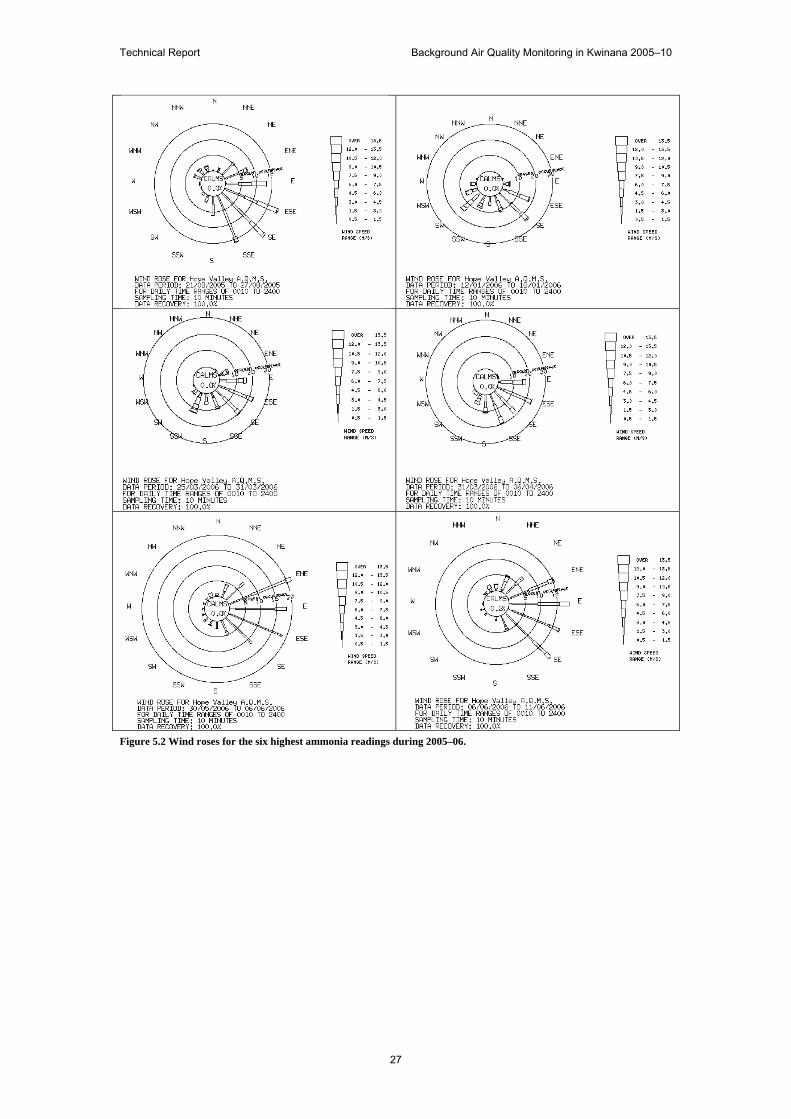
The annual average concentration was 17.1µg/m3. An analysis of the possible origin of the ammonia concentrations reported on the six sampling periods where concentrations exceeded 40µg/m3 (highlighted green in Figure 5.1) shows that ammonia concentrations were elevated at the site when the winds were predominantly from the direction of a major emission source, located less than 600 metres from the monitoring site, for the majority of the six-day sampling period. The wind roses for these periods are presented in Figure 5.2 and indicate the direction from which the winds came throughout the sampling period. The annual average ammonia concentration from the Challenger site (17.1µg/m3) was less than 10 per cent of the UKEA annual standard of 180µg/m3 with all six day averages also well below the annual standard.
2007–08 study The seven-day average and annual average ammonia concentrations from 1 July 2007 to 30 June 2008 from each site are presented in Figure 5.3. The highest annual average of 14.1µg/m3 was reported from the Kwinana Beach site. The highest seven-day average ammonia concentration of 34µg/m3 was reported from Orelia Oval during the period 26 November 2007 to 3 December 2007. During this same period, the highest seven-day average concentrations of 31µg/m3 from James Point and 29µg/m3 Thomas Oval were also reported. The lowest minimum seven-day average ammonia concentration 0.8µg/m3 reported from Mandogalup Road, Wellard Road and the Kwinana Golf Course.
Ammonia(28/06/2005 to 11/07/2006)
0
10
20
30
40
50
60
28/0
6/20
054/
07/2
005
10/0
7/20
0516
/07/
2005
22/0
7/20
0528
/07/
2005
3/08
/200
59/
08/2
005
15/0
8/20
0521
/08/
2005
27/0
8/20
052/
09/2
005
8/09
/200
514
/09/
2005
20/0
9/20
0526
/09/
2005
2/10
/200
58/
10/2
005
14/1
0/20
0520
/10/
2005
26/1
0/20
051/
11/2
005
7/11
/200
513
/11/
2005
19/1
1/20
0525
/11/
2005
1/12
/200
57/
12/2
005
13/1
2/20
0519
/12/
2005
31/1
2/20
056/
01/2
006
12/0
1/20
0618
/01/
2006
24/0
1/20
0631
/01/
2006
5/02
/200
611
/02/
2006
17/0
2/20
0623
/02/
2006
1/03
/200
67/
03/2
006
13/0
3/20
0619
/03/
2006
25/0
3/20
0631
/03/
2006
6/04
/200
612
/04/
2006
18/0
4/20
0624
/04/
2006
30/0
4/20
066/
05/2
006
12/0
5/20
0618
/05/
2006
24/0
5/20
0630
/05/
2006
6/06
/200
611
/06/
2006
17/0
6/20
0623
/06/
2006
29/0
6/20
065/
07/2
006
11/0
7/20
06A
vera
ge
co
nc
entr
ati
on
(u
g/m
3)
Technical Report Background Air Quality Monitoring in Kwinana 2005–10
27
Figure 5.2 Wind roses for the six highest ammonia readings during 2005–06.
Technical Report Background Air Quality Monitoring in Kwinana 2005–10
28
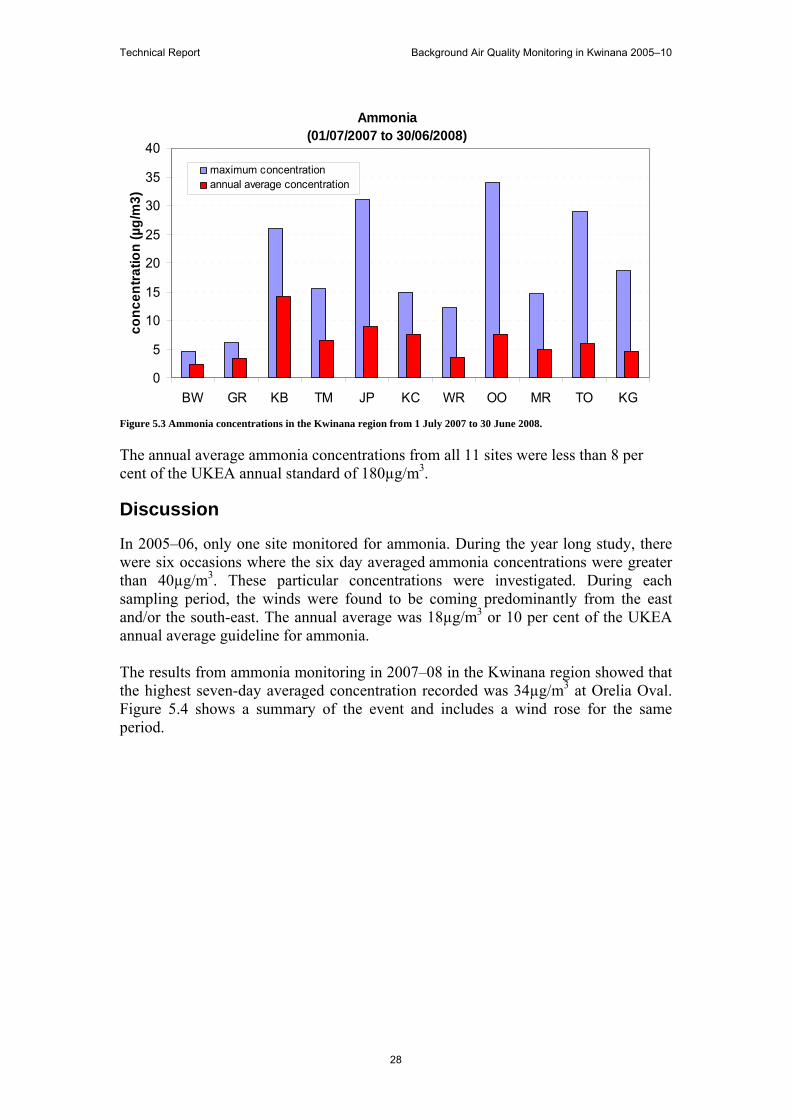
Figure 5.3 Ammonia concentrations in the Kwinana region from 1 July 2007 to 30 June 2008.
The annual average ammonia concentrations from all 11 sites were less than 8 per cent of the UKEA annual standard of 180µg/m3.
Discussion
In 2005–06, only one site monitored for ammonia. During the year long study, there were six occasions where the six day averaged ammonia concentrations were greater than 40µg/m3. These particular concentrations were investigated. During each sampling period, the winds were found to be coming predominantly from the east and/or the south-east. The annual average was 18µg/m3 or 10 per cent of the UKEA annual average guideline for ammonia. The results from ammonia monitoring in 2007–08 in the Kwinana region showed that the highest seven-day averaged concentration recorded was 34µg/m3 at Orelia Oval. Figure 5.4 shows a summary of the event and includes a wind rose for the same period.
Ammonia(01/07/2007 to 30/06/2008)
0
5
10
15
20
25
30
35
40
BW GR KB TM JP KC WR OO MR TO KG
co
nc
en
tra
tio
n (
µg
/m3
)
maximum concentration annual average concentration
Technical Report Background Air Quality Monitoring in Kwinana 2005–10
29
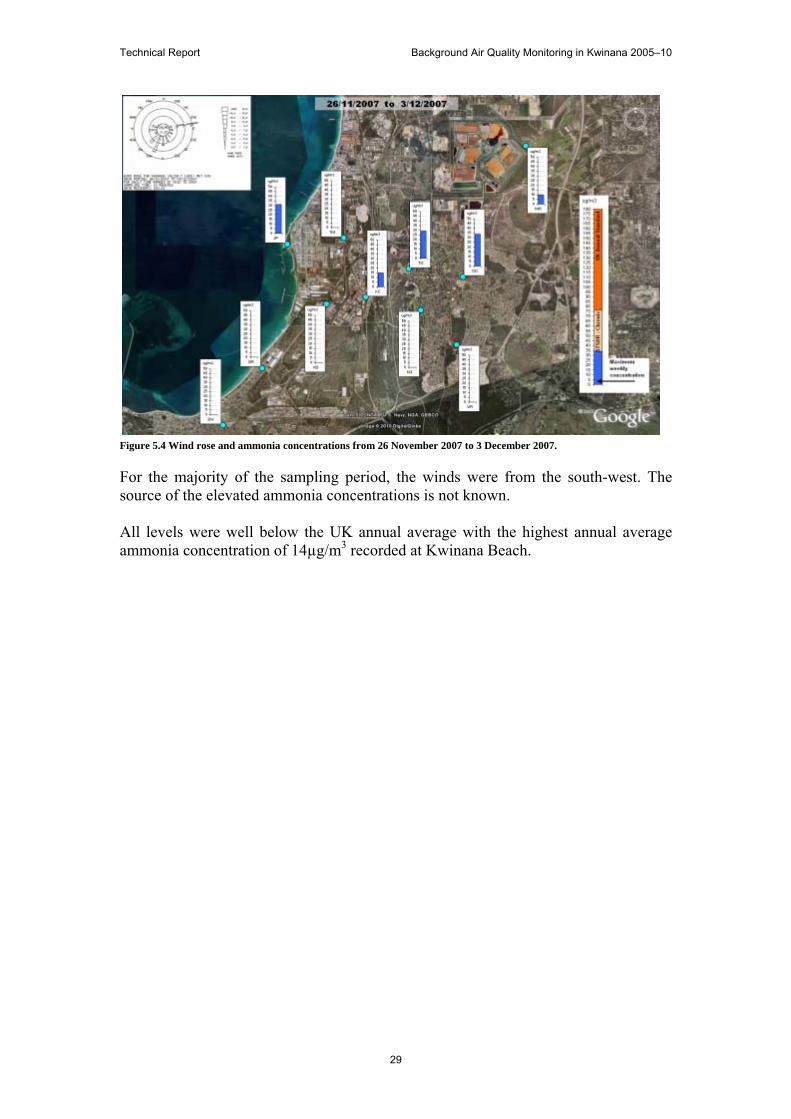
Figure 5.4 Wind rose and ammonia concentrations from 26 November 2007 to 3 December 2007.
For the majority of the sampling period, the winds were from the south-west. The source of the elevated ammonia concentrations is not known. All levels were well below the UK annual average with the highest annual average ammonia concentration of 14µg/m3 recorded at Kwinana Beach.
Technical Report Background Air Quality Monitoring in Kwinana 2005–10
30
6 Volatile organic compounds (VOCs) Volatile organic compounds (VOCs) are gaseous organic compounds that react with other compounds in the atmosphere. Common VOCs include benzene, toluene, ethylbenzene and xylene (BTEX). Benzene is a highly flammable colourless liquid that has a sweet odour and quickly evaporates in air. Industrial processes are the main sources of benzene emissions to the environment, and in particular combustion processes. Other sources of benzene include cigarette smoke, petrol, vehicle exhaust, evaporative emissions from vehicles and petrol storage operations. Toluene is a clear colourless liquid that has a distinctive smell and is a good solvent. Toluene is emitted during the refining of crude oil to produce petrol, coal coking and it is a by-product of styrene manufacture. It is also used in the manufacture of paint and paint thinners, nail polish, lacquers, adhesives and rubber. Ethylbenzene is a colourless, aromatic liquid with an odour similar to that of gasoline. The main use of ethylbenzene is the production of styrene, and it is also used as a solvent in paints, lacquers, rubber and the manufacture of other chemicals. Crude oil, petroleum and combustion products are also sources of ethylbenzene. Xylene is a colourless liquid at room temperature with an aromatic odour. It has three isomers-ortho, meta and para. The largest use of xylene is in petrol, and it is also used as a solvent in paint and printing ink manufacture, pesticides, adhesives, rubber and plastics. Benzene, toluene and xylene have a NEPM annual average monitoring investigation level, and ethylbenzene has a WHO annual average guideline value, with which the average concentrations found in these studies can be compared. These guideline values are presented in table 6.1.
Table 6.1: Annual average guideline values for BTEX compounds .
VOC Annual average (µg/m3) Annual average (ppm) Benzene 10.4 0.003 Toluene 411 0.1 Ethylbenzene 22000 5 Xylene 952 0.2
Method
VOCs were monitored at Hope Valley, Perth CBD and Duncraig from 6 November 2005 to 29 May 2006 using six litre Silco canisters to collect samples over a 24 hour period once every six days. Silco canisters are initially under a high vacuum, which when opened, draws in ambient air at a pre-determined rate. The canister contents were analysed using USEPA method TO14A.
Technical Report Background Air Quality Monitoring in Kwinana 2005–10
31
VOCs were also monitored in the Kwinana region using Radiello® passive samplers. Radiello® samplers absorb selected VOCs at a known rate, which when combined with the length of time exposed and the amount of VOC absorbed, can indicate the average ambient concentration of VOCs during the exposure period. These samplers were located at seven sites; North Rockingham (NR), Challenger (CH), Kwinana Beach (KB), Medina (ME), Calista (CA), Wattleup (WT) and Munster (MU). Sampling was continuous for the period from 17 May 2005 to 11 July 2006, with each passive sampler remaining in the field for six days. In July 2007, more VOC sampling was performed at a total of 14 locations from 3 July 2007 to 2 September 2008 using passive samplers. These samplers were stainless steel tenax tubes fitted with a permeable end cap. These absorb selected VOCs at a known rate, which when combined with the length of time exposed and the amount of VOC absorbed, can indicate the average ambient concentration of VOCs during the exposure period. The tubes were left in the field for a seven-day period once per month.
Results
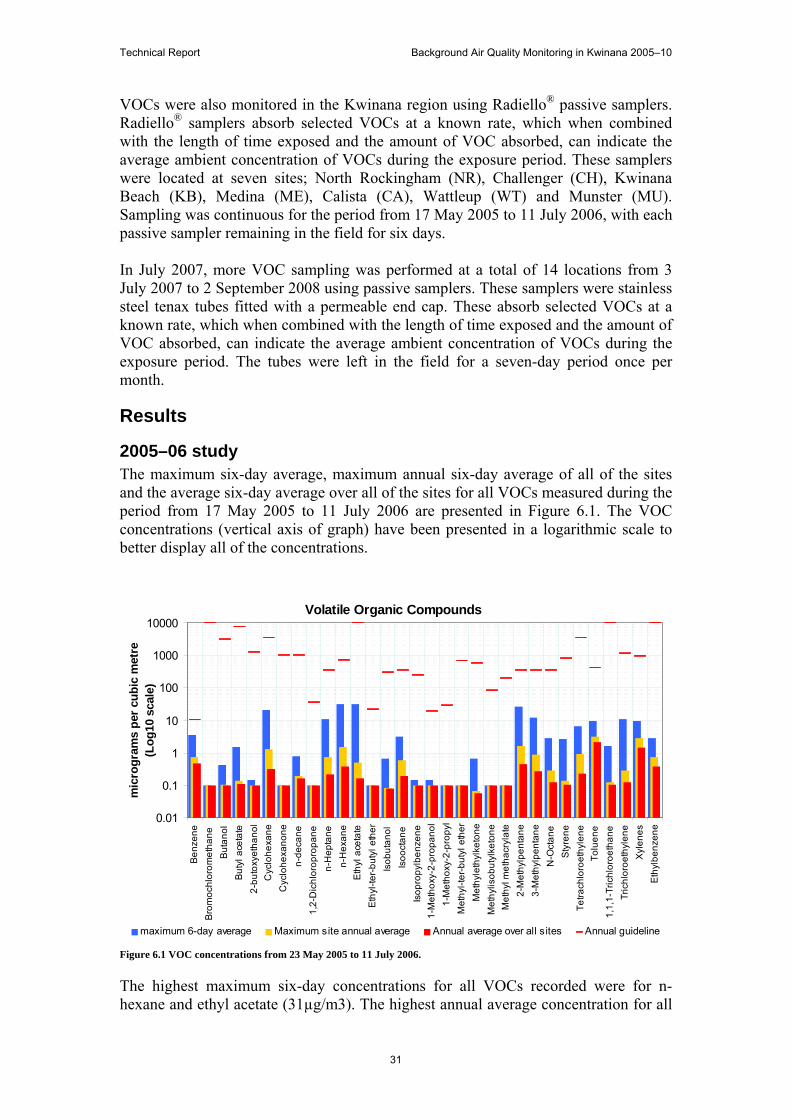
2005–06 study The maximum six-day average, maximum annual six-day average of all of the sites and the average six-day average over all of the sites for all VOCs measured during the period from 17 May 2005 to 11 July 2006 are presented in Figure 6.1. The VOC concentrations (vertical axis of graph) have been presented in a logarithmic scale to better display all of the concentrations.
Figure 6.1 VOC concentrations from 23 May 2005 to 11 July 2006.
The highest maximum six-day concentrations for all VOCs recorded were for n-hexane and ethyl acetate (31µg/m3). The highest annual average concentration for all
Volatile Organic Compounds
0.01
0.1
1
10
100
1000
10000
Ben
zene
Bro
moc
hlor
omet
hane
But
anol
But
yl a
ceta
te2-
buto
xyet
hano
lC
yclo
hexa
neC
yclo
hexa
none
n-de
cane
1,2-
Dic
hlor
opro
pane
n-H
epta
nen-
Hex
ane
Eth
yl a
ceta
teE
thyl
-ter-b
utyl
eth
erIs
obut
anol
Isoo
ctan
eIs
opro
pylb
enze
ne1-
Met
hoxy
-2-p
ropa
nol
1-M
etho
xy-2
-pro
pyl
Met
hyl-t
er-b
utyl
eth
erM
ethy
leth
ylke
tone
Met
hylis
obut
ylke
tone
Met
hyl m
etha
cryl
ate
2-M
ethy
lpen
tane
3-M
ethy
lpen
tane
N-O
ctan
eS
tyre
neTe
trach
loro
ethy
lene
Tolu
ene
1,1,
1-Tr
ichl
oroe
than
eTr
ichl
oroe
thyl
ene
Xyle
nes
Eth
ylbe
nzen
e
mic
rog
ram
s p
er c
ub
ic m
etre
(Lo
g10
sca
le)
maximum 6-day average Maximum site annual average Annual average over all sites Annual guideline
Technical Report Background Air Quality Monitoring in Kwinana 2005–10
32
VOCs from 17 May 2005 to 11 July 2006 was recorded for toluene (2.1µg/m3). Figure 6.1 also shows annual guidelines where available. Some of these guidelines (e.g. ethylbenzene at 22,000µg/m3) were greater than the extent of the plot. These guidelines are shown as 10,000 in the figure. For all of the VOCs, the annual average of all the six-day concentrations at each site was less than the applicable guideline. The maximum and average six-day concentrations for benzene, ethylbenzene, toluene and xylene (BTEX) at each site over the same period are presented in Figure 6.2.
Figure 6.2 BTEX concentrations from 23 May 2005 to 11 July 2006
The highest maximum and average six-day BTEX concentrations for the period from 17 May 2005 to 11 July 2006 were recorded at the Kwinana Beach site. The NEPM annual average monitoring investigation level for benzene is 10.4µg/m3. The highest six-day average was 3.5µg/m3, which represents 34 per cent of the NEPM. For toluene, the NEPM annual average monitoring investigation level is 411µg/m3 (Table 6.1). The highest annual six-day average for toluene was 9.6µg/m3, approximately 2.4 per cent of the NEPM. The highest annual six-day average xylene concentration at any site (9.8µg/m3) represents one per cent of the NEPM annual average monitoring investigation level for xylenes (952µg/m3). The highest six-day average for ethylbenzene was 2.8µg/m3 and the highest annual six-day average concentration was 0.73µg/m3. There is currently no NEPM annual average monitoring investigation level for ethylbenzene, however the WHO annual average guideline value is 22,000µg/m3.
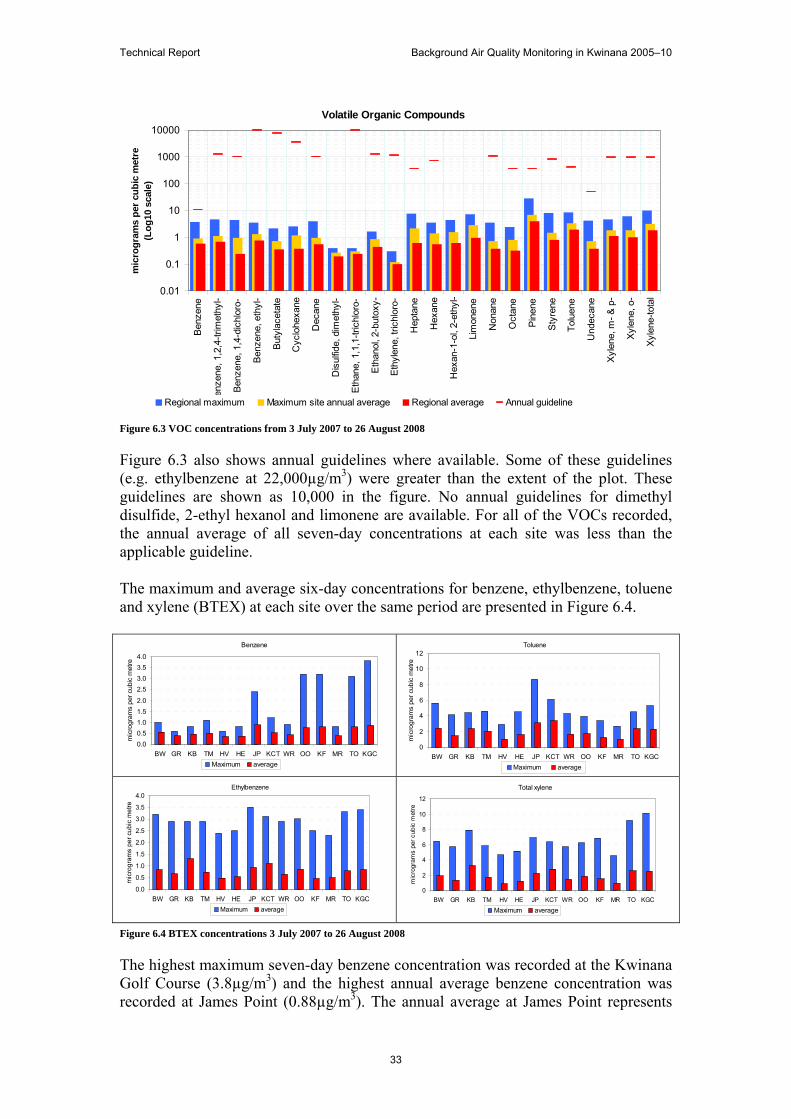
2007–08 study The maximum and average seven-day concentrations of all VOCs measured during 3 July 2007 to 26 August 2008 are presented in Figure 6.3. The VOC concentrations (vertical axis of graph) have been presented in a logarithmic scale to better display the concentrations. Across the 14 sites in the Kwinana region, pinene had the highest maximum six-day concentration (28µg/m3) and highest average seven-day concentration (4µg/m3) reported for any of the VOCs included in Figure 6.3.
Benzene
0.0
0.5
1.0
1.5
2.0
2.5
3.0
3.5
4.0
CA CH KB ME MU NR WT
mic
rog
ram
s p
er c
ub
ic m
etre
Maximum average
Toluene
0
2
4
6
8
10
12
CA CH KB ME MU NR WT
mic
rog
ram
s p
er c
ub
ic m
etre
Maximum average
Ethylbenzene
0.0
0.5
1.0
1.5
2.0
2.5
3.0
3.5
4.0
CA CH KB ME MU NR WT
mic
rog
ram
s p
er c
ub
ic m
etre
Maximum average
Xylenes
0
2
4
6
8
10
12
CA CH KB ME MU NR WT
mic
rog
ram
s p
er c
ub
ic m
etre
Maximum average
Technical Report Background Air Quality Monitoring in Kwinana 2005–10
33
Figure 6.3 VOC concentrations from 3 July 2007 to 26 August 2008
Figure 6.3 also shows annual guidelines where available. Some of these guidelines (e.g. ethylbenzene at 22,000µg/m3) were greater than the extent of the plot. These guidelines are shown as 10,000 in the figure. No annual guidelines for dimethyl disulfide, 2-ethyl hexanol and limonene are available. For all of the VOCs recorded, the annual average of all seven-day concentrations at each site was less than the applicable guideline. The maximum and average six-day concentrations for benzene, ethylbenzene, toluene and xylene (BTEX) at each site over the same period are presented in Figure 6.4.
Figure 6.4 BTEX concentrations 3 July 2007 to 26 August 2008
The highest maximum seven-day benzene concentration was recorded at the Kwinana Golf Course (3.8µg/m3) and the highest annual average benzene concentration was recorded at James Point (0.88µg/m3). The annual average at James Point represents
Volatile Organic Compounds
0.01
0.1
1
10
100
1000
10000
Ben
zene
Ben
zene
, 1,2
,4-tr
imet
hyl-
Ben
zene
, 1,4
-dic
hlor
o-
Ben
zene
, eth
yl-
But
ylac
etat
e
Cyc
lohe
xane
Dec
ane
Dis
ulfid
e, d
imet
hyl-
Eth
ane,
1,1
,1-tr
ichl
oro-
Eth
anol
, 2-b
utox
y-
Eth
ylen
e, tr
ichl
oro-
Hep
tane
Hex
ane
Hex
an-1
-ol,
2-et
hyl-
Lim
onen
e
Non
ane
Oct
ane
Pin
ene
Sty
rene
Tolu
ene
Und
ecan
e
Xyl
ene,
m- &
p-
Xyl
ene,
o-
Xyl
ene-
tota
l
mic
rog
ram
s p
er c
ub
ic m
etre
(Lo
g10
sca
le)
Regional maximum Maximum site annual average Regional average Annual guideline
Benzene
0.00.51.01.52.0
2.53.03.54.0
BW GR KB TM HV HE JP KCT WR OO KF MR TO KGC
mic
rogr
ams
per c
ubic
met
re
Maximum average
Toluene
0
2
4
6
8
10
12
BW GR KB TM HV HE JP KCT WR OO KF MR TO KGC
mic
rogr
ams
per c
ubic
met
re
Maximum average
Ethylbenzene
0.0
0.5
1.0
1.5
2.0
2.5
3.0
3.5
4.0
BW GR KB TM HV HE JP KCT WR OO KF MR TO KGC
mic
rogr
ams
per c
ubic
met
re
Maximum average
Total xylene
0
2
4
6
8
10
12
BW GR KB TM HV HE JP KCT WR OO KF MR TO KGC
mic
rogr
ams
per c
ubic
met
re
Maximum average
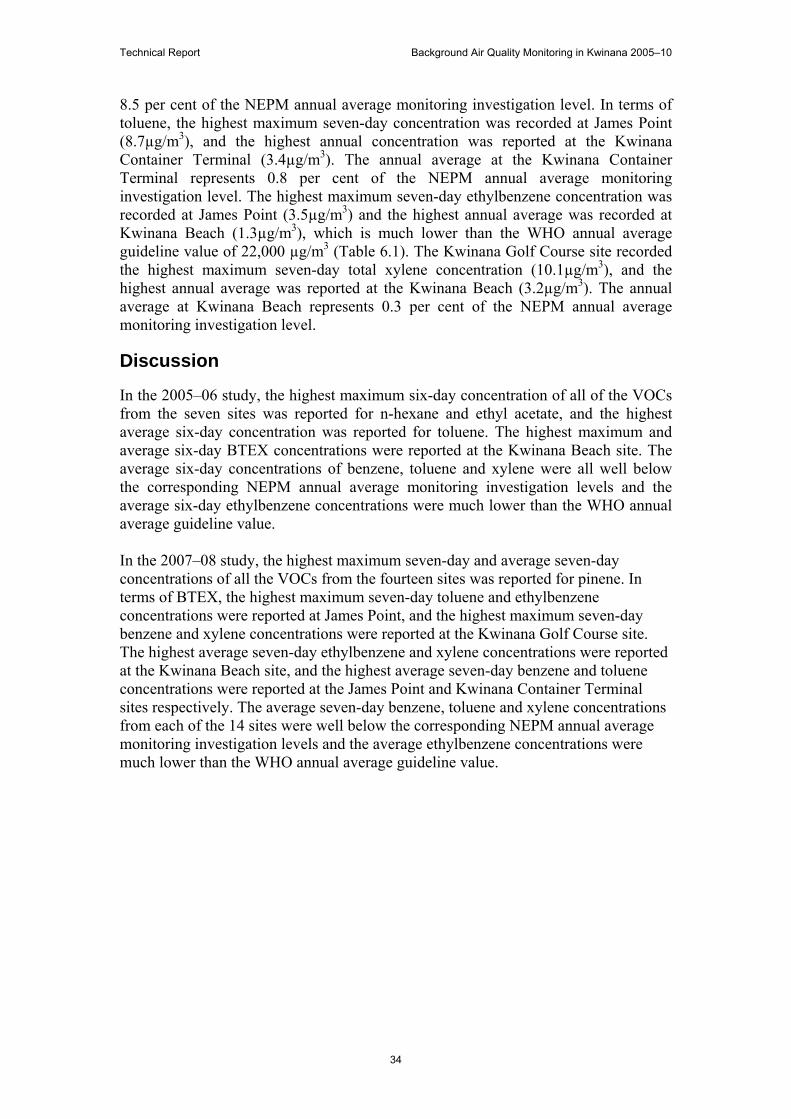
Technical Report Background Air Quality Monitoring in Kwinana 2005–10
34
8.5 per cent of the NEPM annual average monitoring investigation level. In terms of toluene, the highest maximum seven-day concentration was recorded at James Point (8.7µg/m3), and the highest annual concentration was reported at the Kwinana Container Terminal (3.4µg/m3). The annual average at the Kwinana Container Terminal represents 0.8 per cent of the NEPM annual average monitoring investigation level. The highest maximum seven-day ethylbenzene concentration was recorded at James Point (3.5µg/m3) and the highest annual average was recorded at Kwinana Beach (1.3µg/m3), which is much lower than the WHO annual average guideline value of 22,000 µg/m3 (Table 6.1). The Kwinana Golf Course site recorded the highest maximum seven-day total xylene concentration (10.1µg/m3), and the highest annual average was reported at the Kwinana Beach (3.2µg/m3). The annual average at Kwinana Beach represents 0.3 per cent of the NEPM annual average monitoring investigation level.
Discussion
In the 2005–06 study, the highest maximum six-day concentration of all of the VOCs from the seven sites was reported for n-hexane and ethyl acetate, and the highest average six-day concentration was reported for toluene. The highest maximum and average six-day BTEX concentrations were reported at the Kwinana Beach site. The average six-day concentrations of benzene, toluene and xylene were all well below the corresponding NEPM annual average monitoring investigation levels and the average six-day ethylbenzene concentrations were much lower than the WHO annual average guideline value. In the 2007–08 study, the highest maximum seven-day and average seven-day concentrations of all the VOCs from the fourteen sites was reported for pinene. In terms of BTEX, the highest maximum seven-day toluene and ethylbenzene concentrations were reported at James Point, and the highest maximum seven-day benzene and xylene concentrations were reported at the Kwinana Golf Course site. The highest average seven-day ethylbenzene and xylene concentrations were reported at the Kwinana Beach site, and the highest average seven-day benzene and toluene concentrations were reported at the James Point and Kwinana Container Terminal sites respectively. The average seven-day benzene, toluene and xylene concentrations from each of the 14 sites were well below the corresponding NEPM annual average monitoring investigation levels and the average ethylbenzene concentrations were much lower than the WHO annual average guideline value.
Technical Report Background Air Quality Monitoring in Kwinana 2005–10
35
7 Heavy metals Heavy metals occur naturally within the Earths crust. They mainly exist as solid metal particles or metals attached to the surface of other particles. Heavy metals are elements and therefore cannot be destroyed, nor can their properties be easily altered. In the context of this study, heavy metals are elements that generally exist as a solid at room temperature and so may not, in the strictest sense of the word, actually be a metal or be one of the heavier elements. For example, sulfur is not considered a metal, but it is included in the heavy metal suite. Heavy metals enter our bodies through food, drinking water and air. Minute levels of some heavy metals are essential to human health, however high concentrations may be harmful.
Method
Sampling for heavy metals was conducted in Kwinana, Perth CBD and Duncraig in 2005–06 as part of the Perth wide background Air Quality Study. Samples were collected using a TSP High Volume Samplers (HiVol). These HiVols were run for 24 hours on a six-day rotational cycle. The HiVol filter collects particles on a 203mm x 254mm (8inch x 10inch) glass fibre filter. All filter papers were analysed for TSP loading and a range of heavy metals. In 2009–10, additional heavy metals sampling was conducted at Calista Primary School and Hillman Child Health centre. These were performed as per the 2005–06 study using TSP high volume samplers. The sites and dates of sampling undertaken by DEC in the region are presented in Table 7.1.
Table 7.1 Metals monitoring in 2005–06 and 2009–10
Site Monitoring dates Duncraig 21/02/2005 – 22/02/2006 Perth CBD 21/02/2005 – 22/02/2006 Hope Valley 21/02/2005 – 22/02/2006 Calista 12/06/2009 – 1/06/2010 Hillman 12/06/2009 – 1/06/2010
Results
2005–06 study The maximum 24-hour average and annual average concentration for all metals measured at Duncraig, Perth CBD and Hope Valley during the period 21 January 2005 to 22 February 2006 are shown in Figure 7.1. The concentrations (vertical axis of graphs) have been presented in a logarithmic scale to better display all of the concentrations.
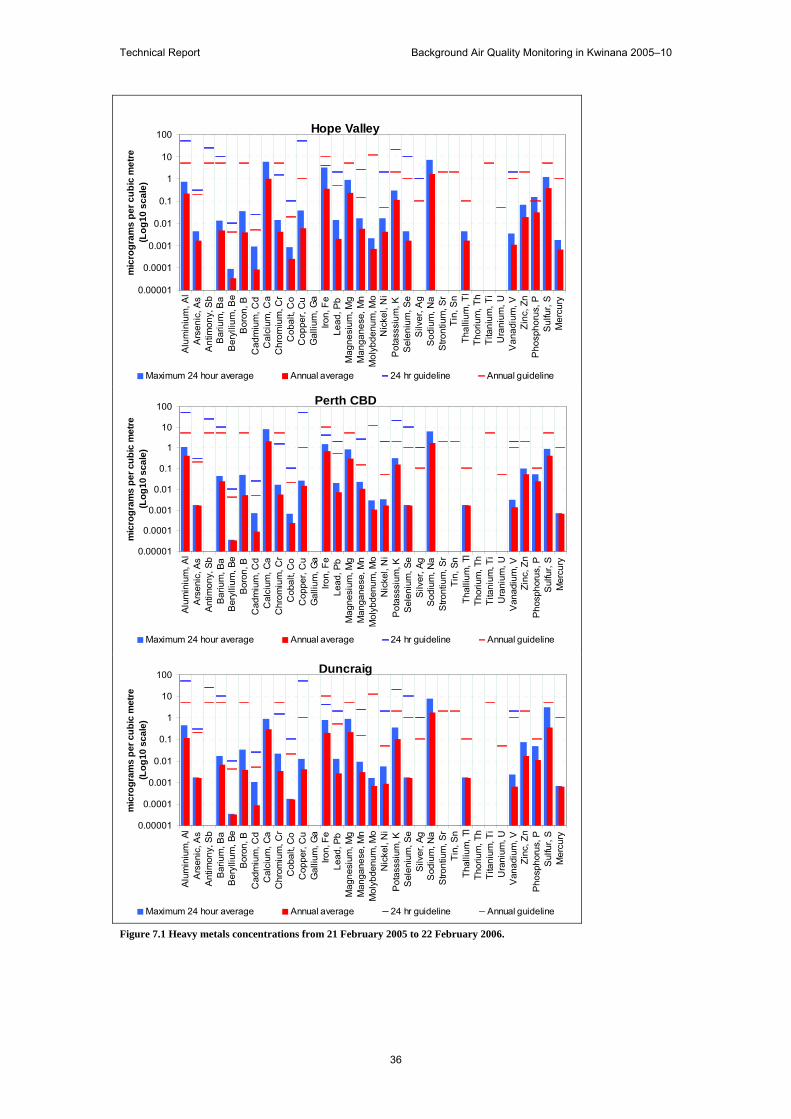
Technical Report Background Air Quality Monitoring in Kwinana 2005–10
36
Figure 7.1 Heavy metals concentrations from 21 February 2005 to 22 February 2006.
Hope Valley
0.00001
0.0001
0.001
0.01
0.1
1
10
100
Alu
min
ium
, Al
Ars
enic
, As
Ant
imon
y, S
bB
ariu
m, B
aB
eryl
lium
, Be
Bor
on, B
Cad
miu
m, C
dC
alci
um, C
aC
hrom
ium
, Cr
Cob
alt,
Co
Cop
per,
Cu
Gal
lium
, Ga
Iron,
Fe
Lead
, Pb
Mag
nesi
um, M
gM
anga
nese
, Mn
Mol
ybde
num
, Mo
Nic
kel,
Ni
Pot
asss
ium
, KS
elen
ium
, Se
Silv
er, A
gS
odiu
m, N
aS
tront
ium
, Sr
Tin,
Sn
Thal
lium
, Tl
Thor
ium
, Th
Tita
nium
, Ti
Ura
nium
, UV
anad
ium
, VZi
nc, Z
nP
hosp
horu
s, P
Sul
fur,
SM
ercu
ry
mic
rog
ram
s p
er
cu
bic
me
tre
(Lo
g1
0 s
ca
le)
Maximum 24 hour average Annual average 24 hr guideline Annual guideline
Perth CBD
0.00001
0.0001
0.001
0.01
0.1
1
10
100
Alu
min
ium
, Al
Ars
enic
, As
Ant
imon
y, S
bB
ariu
m, B
aB
eryl
lium
, Be
Bor
on, B
Cad
miu
m, C
dC
alci
um, C
aC
hrom
ium
, Cr
Cob
alt,
Co
Cop
per,
Cu
Gal
lium
, Ga
Iron,
Fe
Lead
, Pb
Mag
nesi
um, M
gM
anga
nese
, Mn
Mol
ybde
num
, Mo
Nic
kel,
Ni
Pot
asss
ium
, KS
elen
ium
, Se
Silv
er, A
gS
odiu
m, N
aS
tront
ium
, Sr
Tin,
Sn
Thal
lium
, Tl
Thor
ium
, Th
Tita
nium
, Ti
Ura
nium
, UV
anad
ium
, VZi
nc, Z
nP
hosp
horu
s, P
Sul
fur,
SM
ercu
ry
mic
rog
ram
s p
er
cu
bic
me
tre
(Lo
g10
sca
le)
Maximum 24 hour average Annual average 24 hr guideline Annual guideline
Duncraig
0.00001
0.0001
0.001
0.01
0.1
1
10
100
Alu
min
ium
, Al
Ars
enic
, As
Ant
imon
y, S
bB
ariu
m, B
aB
eryl
lium
, Be
Bor
on, B
Cad
miu
m, C
dC
alci
um, C
aC
hrom
ium
, Cr
Cob
alt,
Co
Cop
per,
Cu
Gal
lium
, Ga
Iron,
Fe
Lead
, Pb
Mag
nesi
um, M
gM
anga
nese
, Mn
Mol
ybde
num
, Mo
Nic
kel,
Ni
Pot
asss
ium
, KS
elen
ium
, Se
Silv
er, A
gS
odiu
m, N
aS
tront
ium
, Sr
Tin,
Sn
Thal
lium
, Tl
Thor
ium
, Th
Tita
nium
, Ti
Ura
nium
, UV
anad
ium
, VZi
nc, Z
nP
hosp
horu
s, P
Sul
fur,
SM
ercu
ry
mic
rog
ram
s p
er
cu
bic
metr
e(L
og
10
sca
le)
Maximum 24 hour average Annual average 24 hr guideline Annual guideline
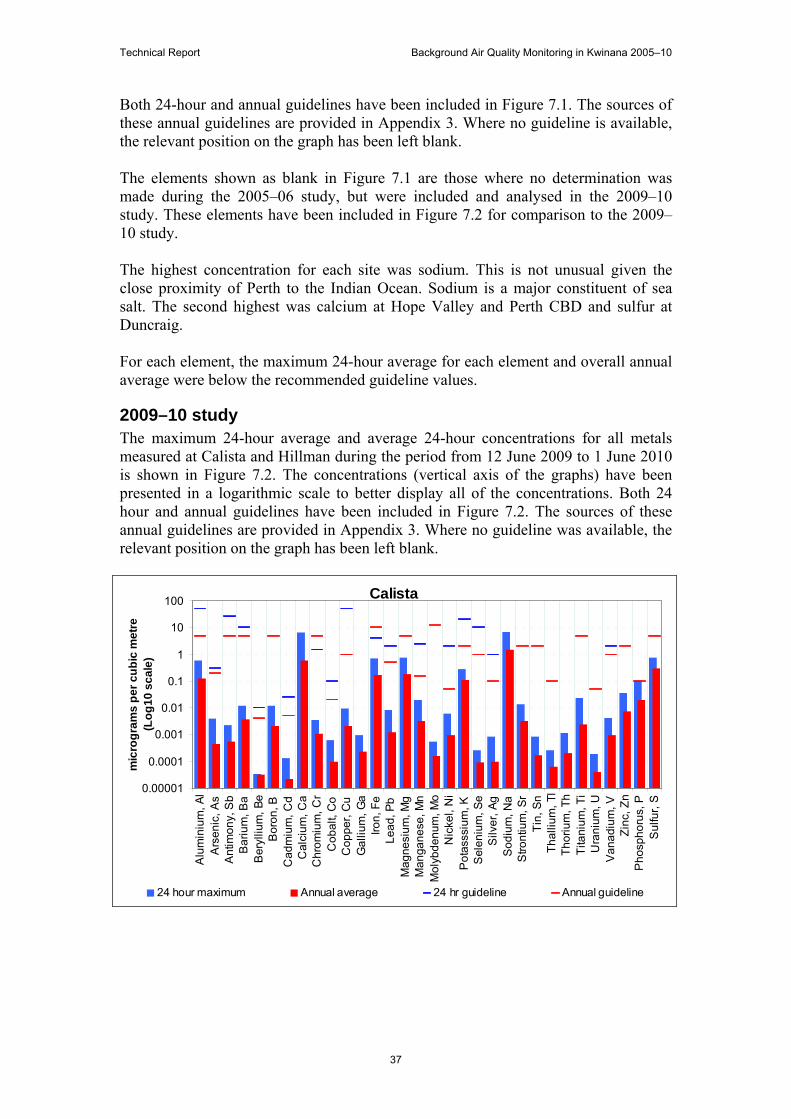
Technical Report Background Air Quality Monitoring in Kwinana 2005–10
37
Both 24-hour and annual guidelines have been included in Figure 7.1. The sources of these annual guidelines are provided in Appendix 3. Where no guideline is available, the relevant position on the graph has been left blank. The elements shown as blank in Figure 7.1 are those where no determination was made during the 2005–06 study, but were included and analysed in the 2009–10 study. These elements have been included in Figure 7.2 for comparison to the 2009–10 study. The highest concentration for each site was sodium. This is not unusual given the close proximity of Perth to the Indian Ocean. Sodium is a major constituent of sea salt. The second highest was calcium at Hope Valley and Perth CBD and sulfur at Duncraig. For each element, the maximum 24-hour average for each element and overall annual average were below the recommended guideline values.
2009–10 study The maximum 24-hour average and average 24-hour concentrations for all metals measured at Calista and Hillman during the period from 12 June 2009 to 1 June 2010 is shown in Figure 7.2. The concentrations (vertical axis of the graphs) have been presented in a logarithmic scale to better display all of the concentrations. Both 24 hour and annual guidelines have been included in Figure 7.2. The sources of these annual guidelines are provided in Appendix 3. Where no guideline was available, the relevant position on the graph has been left blank.
Calista
0.00001
0.0001
0.001
0.01
0.1
1
10
100
Alu
min
ium
, Al
Ars
enic
, As
Ant
imon
y, S
bB
ariu
m, B
aB
eryl
lium
, Be
Bor
on, B
Cad
miu
m, C
dC
alci
um, C
aC
hrom
ium
, Cr
Cob
alt,
Co
Cop
per,
Cu
Gal
lium
, Ga
Iron,
Fe
Lead
, Pb
Mag
nesi
um, M
gM
anga
nese
, Mn
Mol
ybde
num
, Mo
Nic
kel,
Ni
Pot
asss
ium
, KS
elen
ium
, Se
Silv
er, A
gS
odiu
m, N
aS
tront
ium
, Sr
Tin,
Sn
Thal
lium
, Tl
Thor
ium
, Th
Tita
nium
, Ti
Ura
nium
, UV
anad
ium
, VZi
nc, Z
nP
hosp
horu
s, P
Sul
fur,
S
mic
rog
ram
s p
er
cu
bic
met
re(L
og
10
sc
ale
)
24 hour maximum Annual average 24 hr guideline Annual guideline
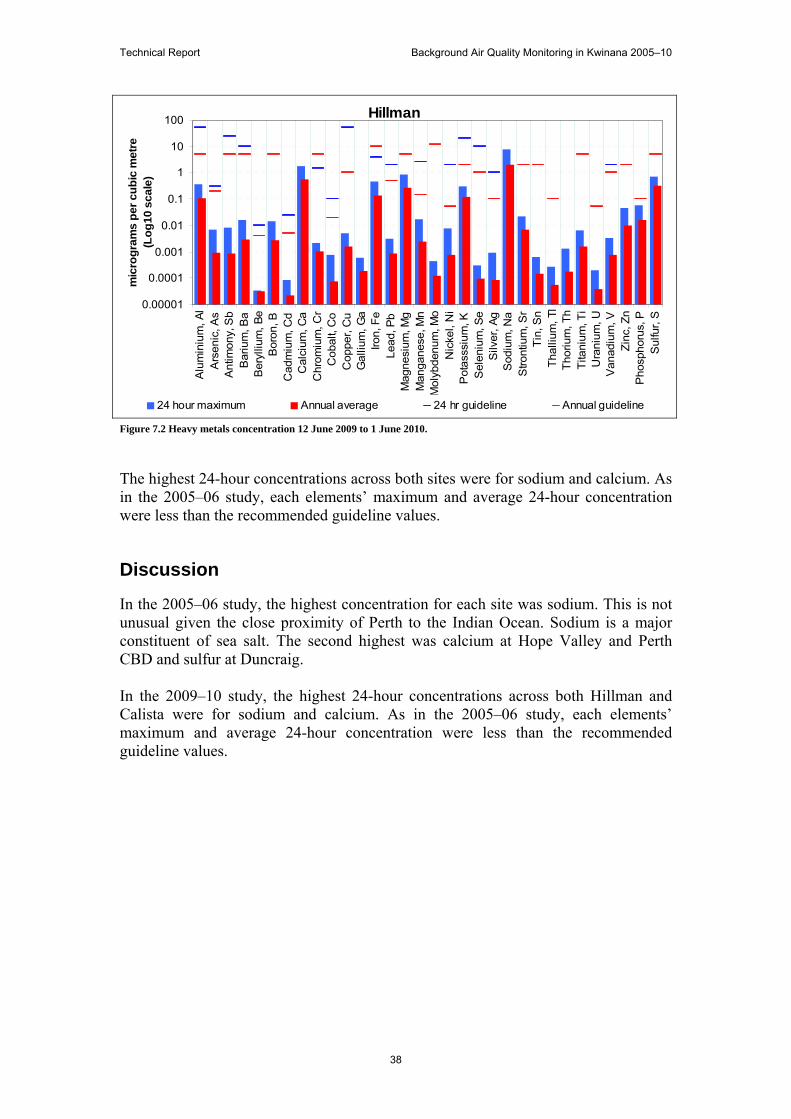
Technical Report Background Air Quality Monitoring in Kwinana 2005–10
38
Figure 7.2 Heavy metals concentration 12 June 2009 to 1 June 2010.
The highest 24-hour concentrations across both sites were for sodium and calcium. As in the 2005–06 study, each elements’ maximum and average 24-hour concentration were less than the recommended guideline values.
Discussion
In the 2005–06 study, the highest concentration for each site was sodium. This is not unusual given the close proximity of Perth to the Indian Ocean. Sodium is a major constituent of sea salt. The second highest was calcium at Hope Valley and Perth CBD and sulfur at Duncraig. In the 2009–10 study, the highest 24-hour concentrations across both Hillman and Calista were for sodium and calcium. As in the 2005–06 study, each elements’ maximum and average 24-hour concentration were less than the recommended guideline values.
Hillman
0.00001
0.0001
0.001
0.01
0.1
1
10
100
Alu
min
ium
, Al
Ars
enic
, As
Ant
imon
y, S
bB
ariu
m, B
aB
eryl
lium
, Be
Bor
on, B
Cad
miu
m, C
dC
alci
um, C
aC
hrom
ium
, Cr
Cob
alt,
Co
Cop
per,
Cu
Gal
lium
, Ga
Iron,
Fe
Lead
, Pb
Mag
nesi
um, M
gM
anga
nese
, Mn
Mol
ybde
num
, Mo
Nic
kel,
Ni
Pot
asss
ium
, KS
elen
ium
, Se
Silv
er, A
gS
odiu
m, N
aS
tront
ium
, Sr
Tin,
Sn
Thal
lium
, Tl
Thor
ium
, Th
Tita
nium
, Ti
Ura
nium
, UV
anad
ium
, VZi
nc, Z
nP
hosp
horu
s, P
Sul
fur,
S
mic
rog
ram
s p
er
cu
bic
metr
e(L
og
10
scale
)
24 hour maximum Annual average 24 hr guideline Annual guideline
Technical Report Background Air Quality Monitoring in Kwinana 2005–10
39
8 Polycyclic aromatic hydrocarbons Polycyclic aromatic hydrocarbons (PAHs) are the product of incomplete combustion i.e. the fuel has not completely burnt. PAHs are organic compounds which include only carbon and hydrogen atoms with a structure resembling rings. The simplest PAH is called naphthalene and contains two fused benzene (six-sided) rings. As a general rule, the more rings a PAH possesses, the less volatile it is. Sources of PAHs include motor vehicles, domestic burning of coal and wood for space heating, power generation via coal and oil, incineration, wood burning, cooking, smoking and burning natural gas. Napthalene is used in dyes, explosives, plastics lubricant and moth repellant (moth balls). Anthracene, containing three rings, is used in insecticides and wood preservatives. PAH levels in the general atmosphere are usually higher during winter months due to the increase in wood heater use and tend to be concentrated in urban areas.
Method
PAHs were monitored in 2005–06 at Duncraig, Queens Buildings and Hope Valley using high volume samplers according to USEPA Method TO-13A ’Determination of Polycyclic Aromatic Hydrocarbons (PAHs) in Ambient Air Using Gas Chromatography/Mass Spectrometry (GC/MS)’. Twenty-four hour samples were taken once every six days from 29 January 2005 to 29 January 2006. The data from the 2005–06 study has been available on the DEC Air Quality website since 2008.
Results
2005–06 The annual average concentration for all PAHs measured at Duncraig, Perth CBD and Hope Valley during the period 29 January 2005 to 29 January 2006 are presented in Figure 8.1. The concentrations (vertical axis of the graph) have been presented in a logarithmic scale to better display all of the concentrations. The annual guidelines have been included in Figure 8.1. The sources of these annual guidelines are provided in Appendix 3. Where no guideline is available, the relevant position on the graph has been left blank. The compound benzo(a)pyrene is used by the NEPM as a marker for PAH’s and has been included in the National Environment Protection (air toxics) Measure. The monitoring investigation level for benzo(a)pyrene is 0.3 nanograms per cubic metre (ng/m3) averaged over one year. The NEPM defines monitoring investigation values as levels of air pollution below which lifetime exposure, or exposure for a given averaging time, does not constitute a significant health risk. If these limits are exceeded in the short term, it does not mean that adverse health effects automatically occur.
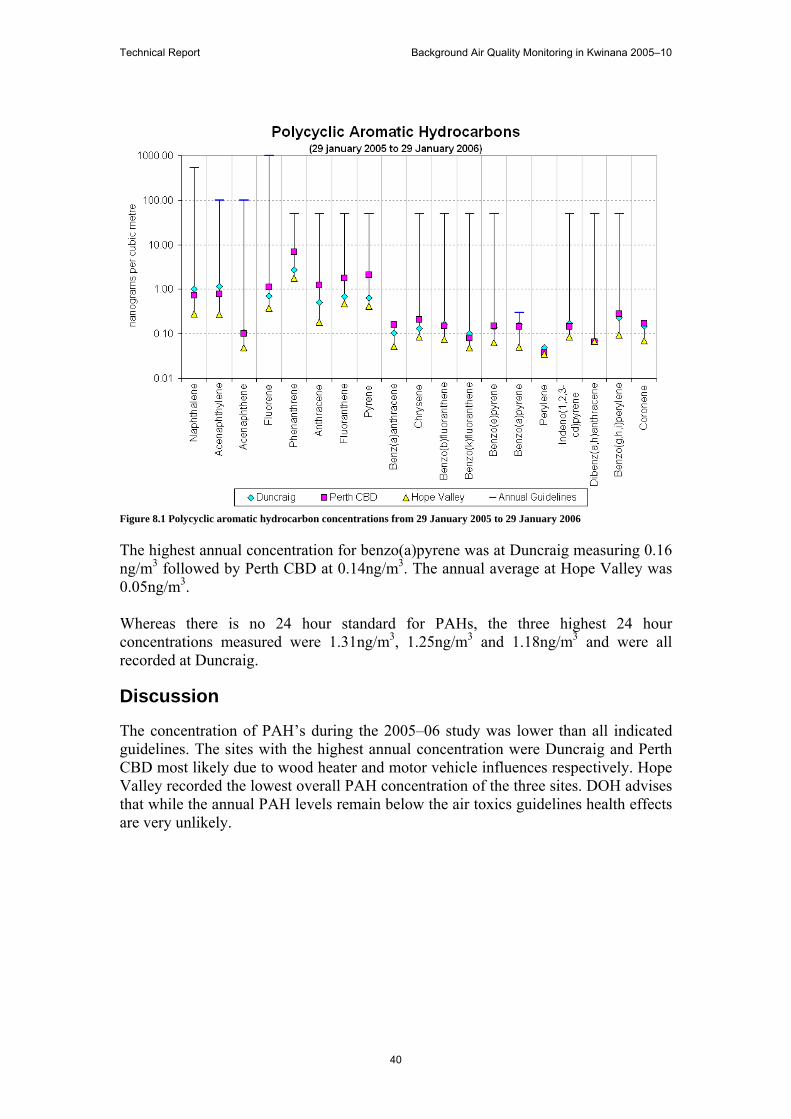
Technical Report Background Air Quality Monitoring in Kwinana 2005–10
40
Figure 8.1 Polycyclic aromatic hydrocarbon concentrations from 29 January 2005 to 29 January 2006
The highest annual concentration for benzo(a)pyrene was at Duncraig measuring 0.16 ng/m3 followed by Perth CBD at 0.14ng/m3. The annual average at Hope Valley was 0.05ng/m3. Whereas there is no 24 hour standard for PAHs, the three highest 24 hour concentrations measured were 1.31ng/m3, 1.25ng/m3 and 1.18ng/m3 and were all recorded at Duncraig.
Discussion
The concentration of PAH’s during the 2005–06 study was lower than all indicated guidelines. The sites with the highest annual concentration were Duncraig and Perth CBD most likely due to wood heater and motor vehicle influences respectively. Hope Valley recorded the lowest overall PAH concentration of the three sites. DOH advises that while the annual PAH levels remain below the air toxics guidelines health effects are very unlikely.
Technical Report Background Air Quality Monitoring in Kwinana 2005–10
41
9 Summary outcomes A number of background air quality studies have been conducted within the KIA and surrounds since 2005. These studies have mainly focused on air toxics such as volatile organic compounds (VOCs), carbonyls, heavy metals, ammonia and particles (PM2.5 and TSP). These studies supplemented the existing three KIC and three DEC air NEPM pollutant stations currently operating in the region. The levels of air toxics recorded during the three studies of 2005–06, 2007–08 and 2009–10 were similar to those found elsewhere in the Perth metropolitan region and were within health guidelines, except for acrolein, crotonaldehyde and methacrolein which DOH has advised are not sufficiently increased to cause a health concern for the majority of people. The majority of elevated crotonaldehyde, acrolein and methacrolein concentrations occurs in the summer months and is most likely due to various smoke events originating in the south-west of the state. The number of complaints by the local community shows that there is strong interest in air quality in the region. Unfortunately limitations with current monitoring technologies available make it difficult to determine the root cause of many of these complaints.
Technical Report Background Air Quality Monitoring in Kwinana 2005–10
42
Appendix 1–Back trajectories for NEPM PM2.5 advisory standard exceedences

Technical Report Background Air Quality Monitoring in Kwinana 2005–10
43
11 November 2009—8am
Wind trajectories for the morning of 11 November 2009 indicate that the source of the PM2.5 event to be from the east. In addition to the Calista Primary School and Hillman Child Health Centre sites, Duncraig, South Lake, Bunbury and Busselton also recorded PM2.5 greater than the NEPM advisory standard of 25µg/m3. The following 24-hour concentrations were recorded within DEC’s PM2.5 network. Quinns Rocks 23.6µg/m3 Calista 31.5µg/m3 Caversham 18.9µg/m3 Hillman 36.6µg/m3 Duncraig 26.6µg/m3 Bunbury 30.0µg/m3 South Lake 28.5µg/m3 Busselton 30.5µg/m3

Technical Report Background Air Quality Monitoring in Kwinana 2005–10
44
11 November 2009—12 noon
Wind trajectories for the morning of 11 November 2009 indicate that the source of the PM2.5 event to be from the east. In addition to the Calista Primary School and Hillman Child Health Centre sites, Duncraig, South Lake, Bunbury and Busselton also recorded PM2.5 greater than the NEPM advisory standard of 25µg/m3. The following 24-hour concentrations were recorded within DEC’s PM2.5 network. Quinns Rocks 23.6µg/m3 Calista 31.5µg/m3 Caversham 18.9µg/m3 Hillman 36.6µg/m3 Duncraig 26.6µg/m3 Bunbury 30.0µg/m3 South Lake 28.5µg/m3 Busselton 30.5µg/m3
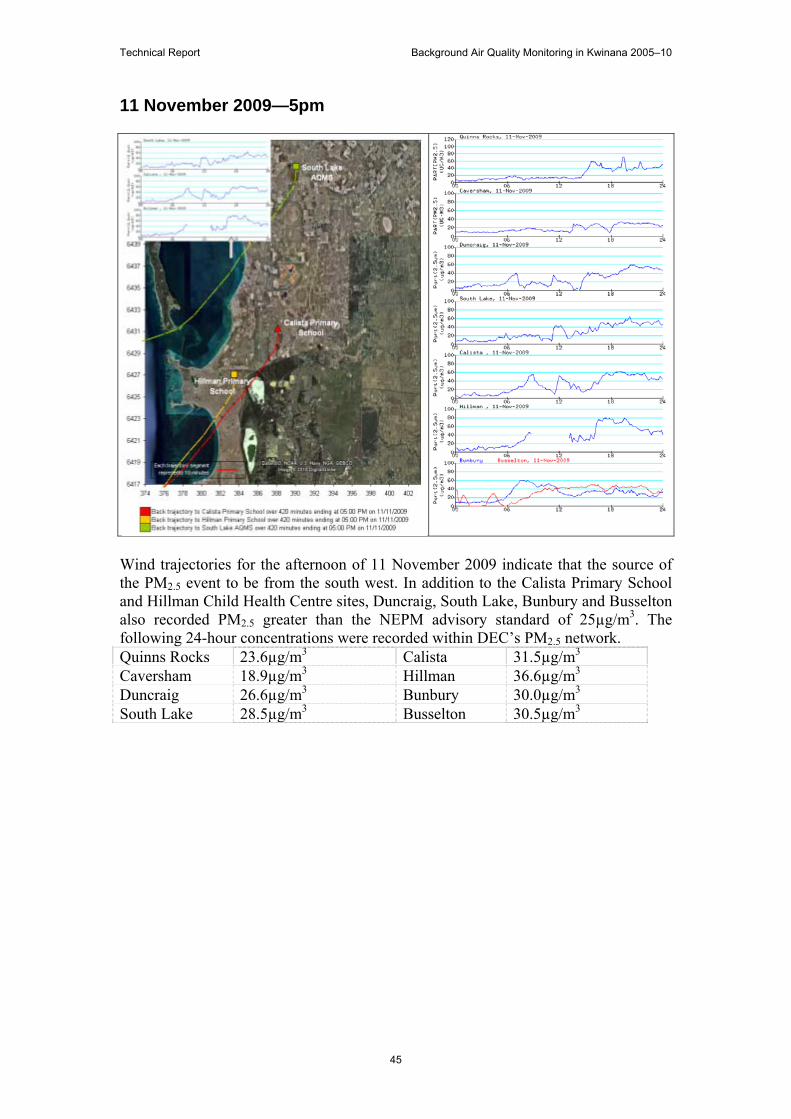
Technical Report Background Air Quality Monitoring in Kwinana 2005–10
45
11 November 2009—5pm
Wind trajectories for the afternoon of 11 November 2009 indicate that the source of the PM2.5 event to be from the south west. In addition to the Calista Primary School and Hillman Child Health Centre sites, Duncraig, South Lake, Bunbury and Busselton also recorded PM2.5 greater than the NEPM advisory standard of 25µg/m3. The following 24-hour concentrations were recorded within DEC’s PM2.5 network. Quinns Rocks 23.6µg/m3 Calista 31.5µg/m3 Caversham 18.9µg/m3 Hillman 36.6µg/m3 Duncraig 26.6µg/m3 Bunbury 30.0µg/m3 South Lake 28.5µg/m3 Busselton 30.5µg/m3

Technical Report Background Air Quality Monitoring in Kwinana 2005–10
46
16 December 2009—7am
Wind trajectories for the morning of 16 December 2009 indicate that the source of the PM2.5 event to be from the south. In addition to the Calista Primary School and Hillman Child Health Centre sites, Quinns Rocks, Duncraig and South Lake also recorded PM2.5 greater than the NEPM advisory standard of 25µg/m3. The following 24-hour concentrations were recorded within DEC’s PM2.5 network. Quinns Rocks 27.2µg/m3 Calista 37.0µg/m3 Caversham 24.7µg/m3 Hillman 40.0µg/m3 Duncraig 26.3µg/m3 Bunbury 7.2µg/m3 South Lake 32.0µg/m3 Busselton 5.9µg/m3

Technical Report Background Air Quality Monitoring in Kwinana 2005–10
47
16 December 2009—11am
Wind trajectories for the morning of 16 December 2009 indicate that the source of the PM2.5 event to be from the south. In addition to the Calista Primary School and Hillman Child Health Centre sites, Quinns Rocks, Duncraig and South Lake also recorded PM2.5 greater than the NEPM advisory standard of 25µg/m3. The following 24-hour concentrations were recorded within DEC’s PM2.5 network. Quinns Rocks 27.2µg/m3 Calista 37.0µg/m3 Caversham 24.7µg/m3 Hillman 40.0µg/m3 Duncraig 26.3µg/m3 Bunbury 7.2µg/m3 South Lake 32.0µg/m3 Busselton 5.9µg/m3

Technical Report Background Air Quality Monitoring in Kwinana 2005–10
48
16 December 2009—11pm
Wind trajectories for the evening of 16 December 2009 indicate that the source of the PM2.5 event to be from the south. In addition to the Calista Primary School and Hillman Child Health Centre sites, Quinns Rocks, Duncraig and South Lake also recorded PM2.5 greater than the NEPM advisory standard of 25µg/m3. The following 24-hour concentrations were recorded within DEC’s PM2.5 network. Quinns Rocks 27.2µg/m3 Calista 37.0µg/m3 Caversham 24.7µg/m3 Hillman 40.0µg/m3 Duncraig 26.3µg/m3 Bunbury 7.2µg/m3 South Lake 32.0µg/m3 Busselton 5.9µg/m3
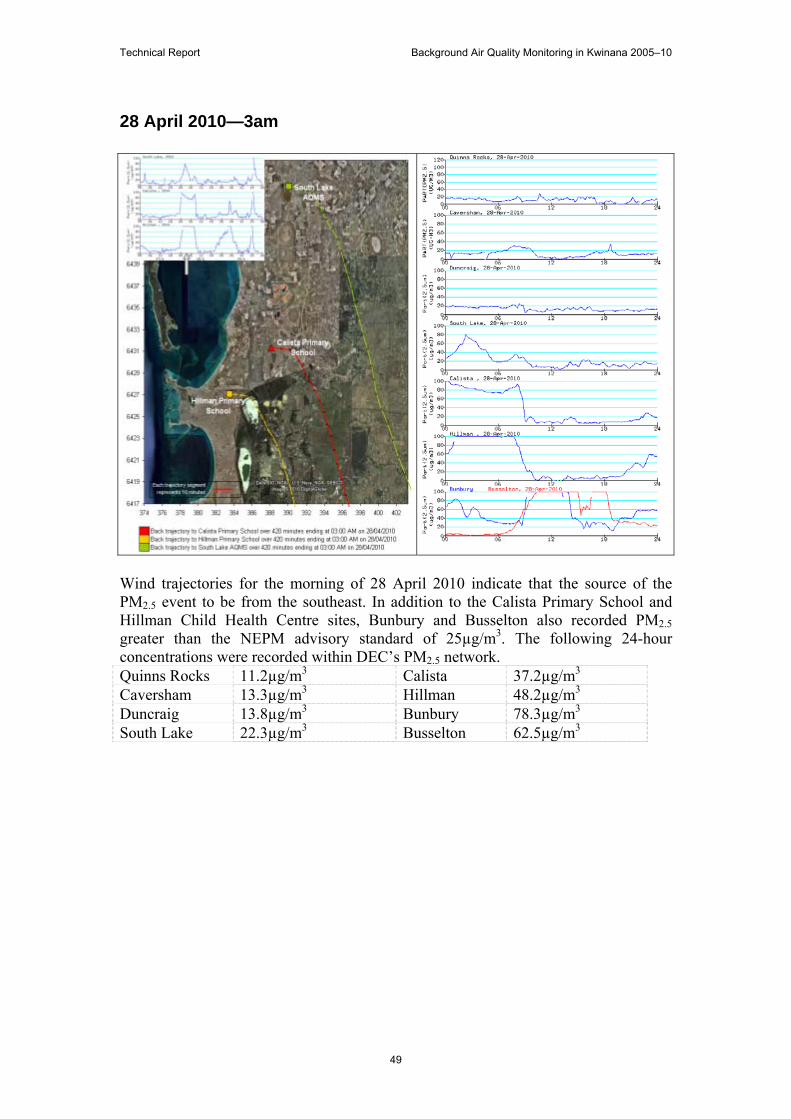
Technical Report Background Air Quality Monitoring in Kwinana 2005–10
49
28 April 2010—3am
Wind trajectories for the morning of 28 April 2010 indicate that the source of the PM2.5 event to be from the southeast. In addition to the Calista Primary School and Hillman Child Health Centre sites, Bunbury and Busselton also recorded PM2.5 greater than the NEPM advisory standard of 25µg/m3. The following 24-hour concentrations were recorded within DEC’s PM2.5 network. Quinns Rocks 11.2µg/m3 Calista 37.2µg/m3 Caversham 13.3µg/m3 Hillman 48.2µg/m3 Duncraig 13.8µg/m3 Bunbury 78.3µg/m3 South Lake 22.3µg/m3 Busselton 62.5µg/m3
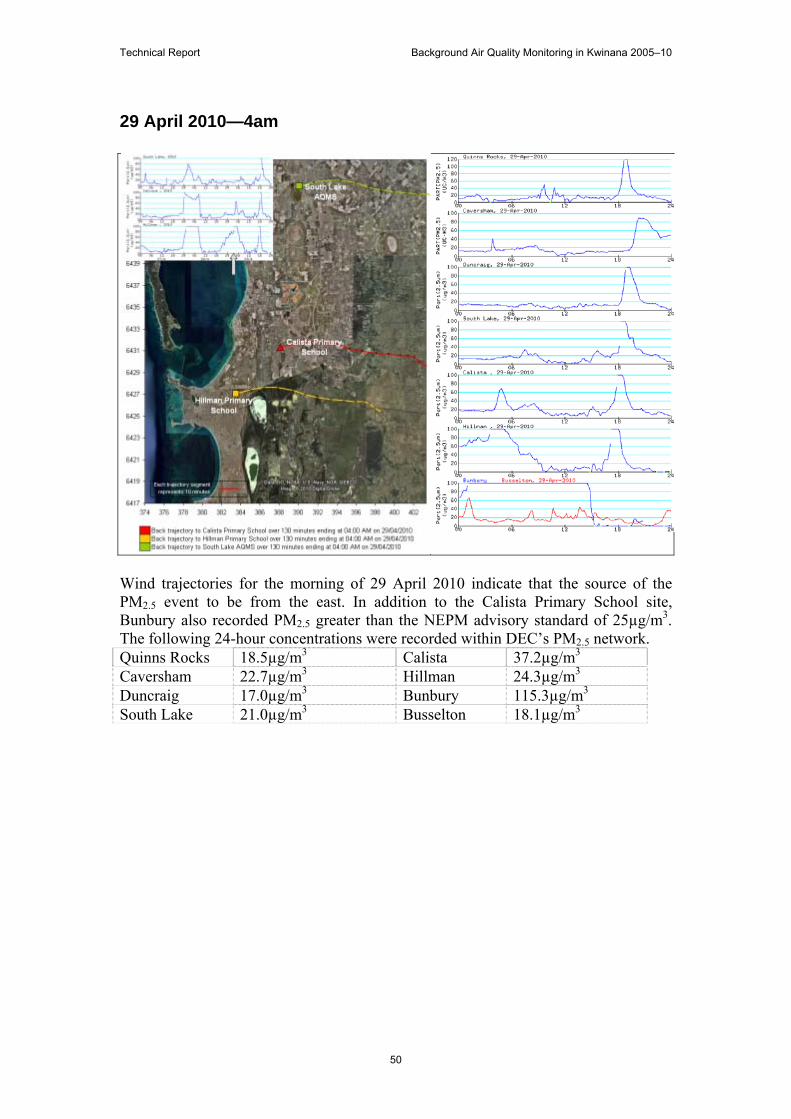
Technical Report Background Air Quality Monitoring in Kwinana 2005–10
50
29 April 2010—4am
Wind trajectories for the morning of 29 April 2010 indicate that the source of the PM2.5 event to be from the east. In addition to the Calista Primary School site, Bunbury also recorded PM2.5 greater than the NEPM advisory standard of 25µg/m3. The following 24-hour concentrations were recorded within DEC’s PM2.5 network. Quinns Rocks 18.5µg/m3 Calista 37.2µg/m3 Caversham 22.7µg/m3 Hillman 24.3µg/m3 Duncraig 17.0µg/m3 Bunbury 115.3µg/m3 South Lake 21.0µg/m3 Busselton 18.1µg/m3

Technical Report Background Air Quality Monitoring in Kwinana 2005–10
51
29 April 2010—6pm
Wind trajectories for the morning of 29 April 2010 indicate that the source of the PM2.5 event to be from the south west. In addition to the Calista Primary School and Hillman Child Health Centre sites, Bunbury and Busselton also recorded PM2.5 greater than the NEPM advisory standard of 25µg/m3. The following 24-hour concentrations were recorded within DEC’s PM2.5 network. Quinns Rocks 11.2µg/m3 Calista 37.2µg/m3 Caversham 13.3µg/m3 Hillman 48.2µg/m3 Duncraig 13.8µg/m3 Bunbury 78.3µg/m3 South Lake 22.3µg/m3 Busselton 62.5µg/m3

Technical Report Background Air Quality Monitoring in Kwinana 2005–10
52
6 May 2010—12 noon
Wind trajectories for the afternoon of 6 May 2010 indicate that the source of the PM2.5 event to be from the southeast. In addition to the Calista Primary School and Hillman Child Health Centre sites, Quinns Rocks, Caversham, Duncraig, South Lake and Bunbury also recorded PM2.5 greater than the NEPM advisory standard of 25µg/m3. The following 24-hour concentrations were recorded within DEC’s PM2.5 network. Quinns Rocks 33.7µg/m3 Calista 57.1µg/m3 Caversham 45.2µg/m3 Hillman 61.4µg/m3 Duncraig 36.4µg/m3 Bunbury 26.5µg/m3 South Lake 40.0µg/m3 Busselton 8.0µg/m3

Technical Report Background Air Quality Monitoring in Kwinana 2005–10
53
7 May 2010—4am
Wind trajectories for the morning of 7 May 2010 indicate that the source of the PM2.5 event to be from the southeast. In addition to the Calista Primary School and Hillman Child Health Centre sites, Bunbury and Busselton also recorded PM2.5 greater than the NEPM advisory standard of 25µg/m3. The following 24-hour concentrations were recorded within DEC’s PM2.5 network. Quinns Rocks 17.0µg/m3 Calista 34.0µg/m3 Caversham 16.3µg/m3 Hillman 26.6µg/m3 Duncraig 18.8µg/m3 Bunbury 29.5µg/m3 South Lake 22.0µg/m3 Busselton 33.5µg/m3
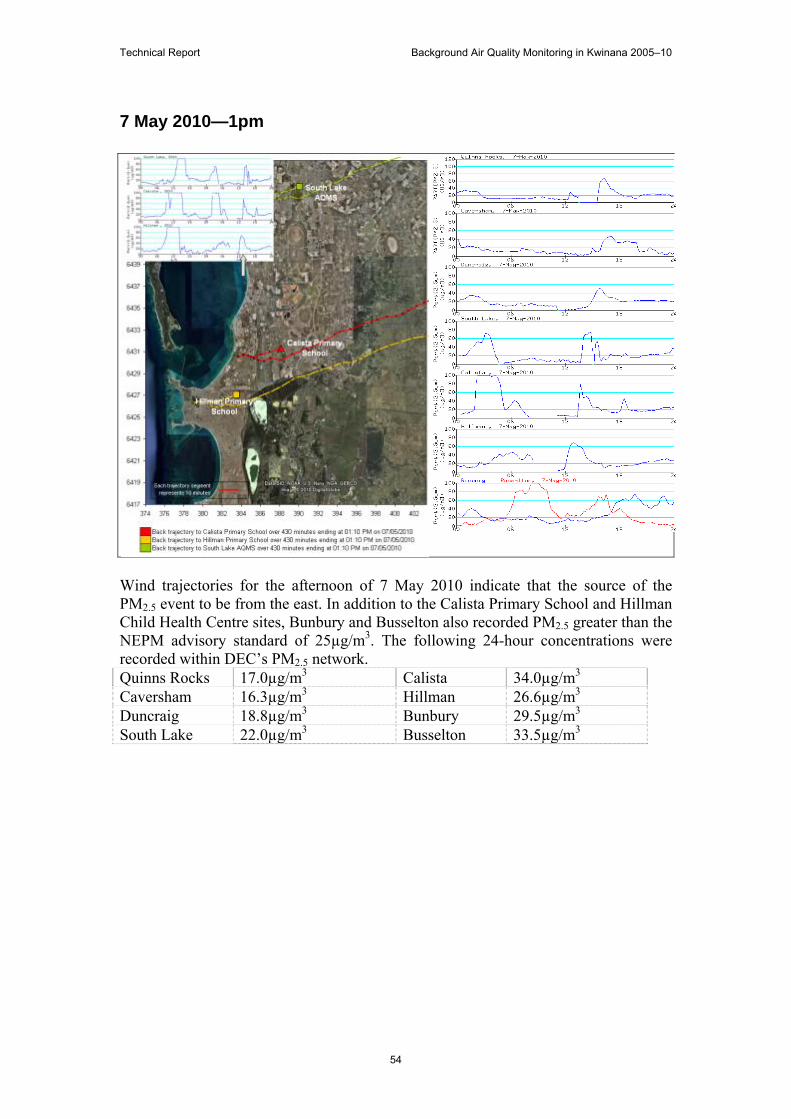
Technical Report Background Air Quality Monitoring in Kwinana 2005–10
54
7 May 2010—1pm
Wind trajectories for the afternoon of 7 May 2010 indicate that the source of the PM2.5 event to be from the east. In addition to the Calista Primary School and Hillman Child Health Centre sites, Bunbury and Busselton also recorded PM2.5 greater than the NEPM advisory standard of 25µg/m3. The following 24-hour concentrations were recorded within DEC’s PM2.5 network. Quinns Rocks 17.0µg/m3 Calista 34.0µg/m3 Caversham 16.3µg/m3 Hillman 26.6µg/m3 Duncraig 18.8µg/m3 Bunbury 29.5µg/m3 South Lake 22.0µg/m3 Busselton 33.5µg/m3
Technical Report Background Air Quality Monitoring in Kwinana 2005–10
55
Appendix 2 Particle events while winds were from the KIA
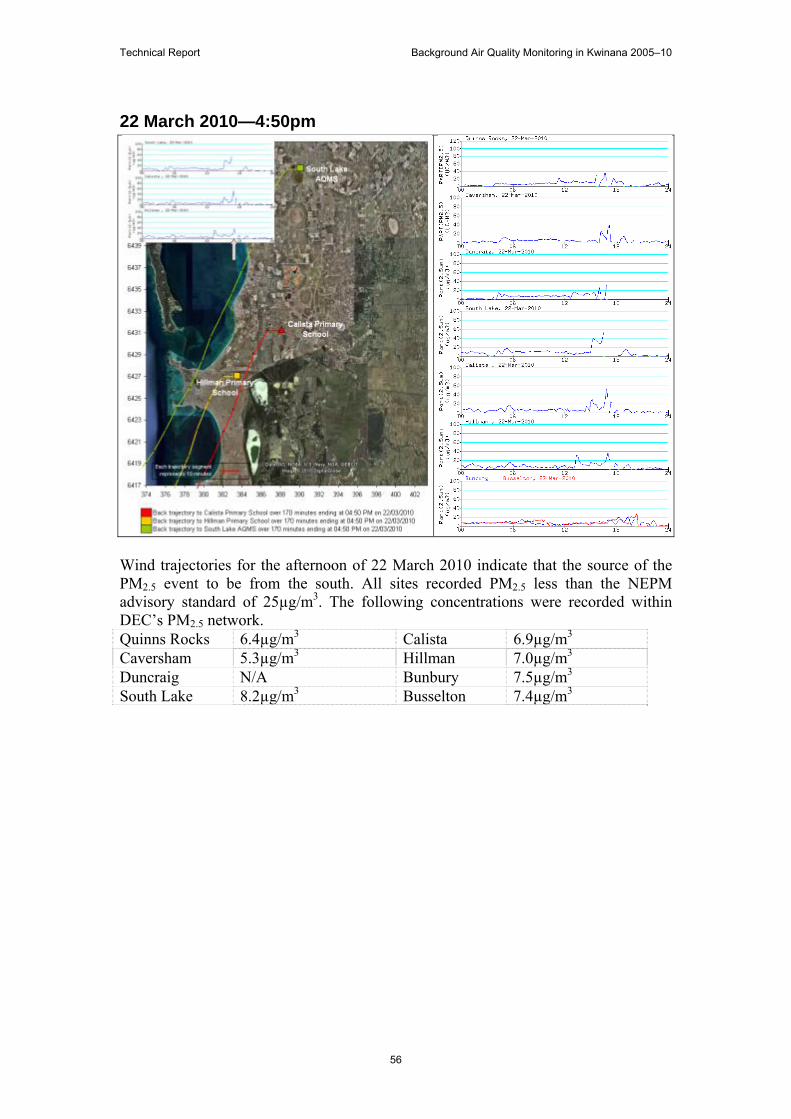
Technical Report Background Air Quality Monitoring in Kwinana 2005–10
56
22 March 2010—4:50pm
Wind trajectories for the afternoon of 22 March 2010 indicate that the source of the PM2.5 event to be from the south. All sites recorded PM2.5 less than the NEPM advisory standard of 25µg/m3. The following concentrations were recorded within DEC’s PM2.5 network. Quinns Rocks 6.4µg/m3 Calista 6.9µg/m3 Caversham 5.3µg/m3 Hillman 7.0µg/m3 Duncraig N/A Bunbury 7.5µg/m3 South Lake 8.2µg/m3 Busselton 7.4µg/m3

Technical Report Background Air Quality Monitoring in Kwinana 2005–10
57
24 April 2010—11:40pm
Wind trajectories for the afternoon of 24 April 2010 indicate that the source of the PM2.5 event to be from the south east. All sites except Caversham recorded PM2.5 less than the NEPM advisory standard of 25µg/m3. The following concentrations were recorded within DEC’s PM2.5 network. Quinns Rocks 15.7µg/m3 Calista 14.8µg/m3 Caversham 27.2µg/m3 Hillman 12.8µg/m3 Duncraig 22.0µg/m3 Bunbury 12.1µg/m3 South Lake 19.3µg/m3 Busselton 8.7µg/m3
Technical Report Background Air Quality Monitoring in Kwinana 2005–10
58
Appendix 3 Guidelines used in this document
Technical Report Background Air Quality Monitoring in Kwinana 2005–10
59
Currently, there is a project underway within DEC and DOH to determine a hierarchy of jurisdictional air quality guidelines suitable for use within Western Australia. Pending the outcome of this project, where Australian air guidelines have been derived and endorsed at the national level, e.g. National Environment Protection Measure (NEPM), these have been used in this report for comparative purposes. Where no relevant Australian guideline has been derived, the World Health Organisation (WHO) has been used. Where there is no WHO guideline value that can be used for comparison, a descending hierarchy of jurisdictions has been used as follows:
1. United Kingdom Environmental Agency (UKEA) 2. Netherlands National Institute of Public Health and the Environment (RIVM) 3. Ontario Ambient Air Quality Criteria (OAQC) 4. United States of America
Agency for Toxic Substances Disease Registry (ATSDR) Texas Commission on Environmental Quality (TCEQ).
Within this report, these jurisdictional guidelines are used to compare concentrations measured during the study. Where these measured concentrations exceed any of these nominated guidelines, DOH is requested to advise of any health impacts. Guidelines from the following jurisdiction were used: NEPM – National Environment protection Measure WHO – World health Organisation UKEA – United Kingdom Environmental Agency OAQC – Ontario Ambient Air Quality Criteria TCEQ – Texas Commission on Environmental Quality * – Odour ATSDR – Agency for Toxic Substances and Disease Registry UKEA – United Kingdom Environmental Agency NEPM – National Environment protection Measure OAQC – Ontario Ambient Air Quality Criteria TCEQ – Texas Commission on Environmental Quality WHO – World health Organisation
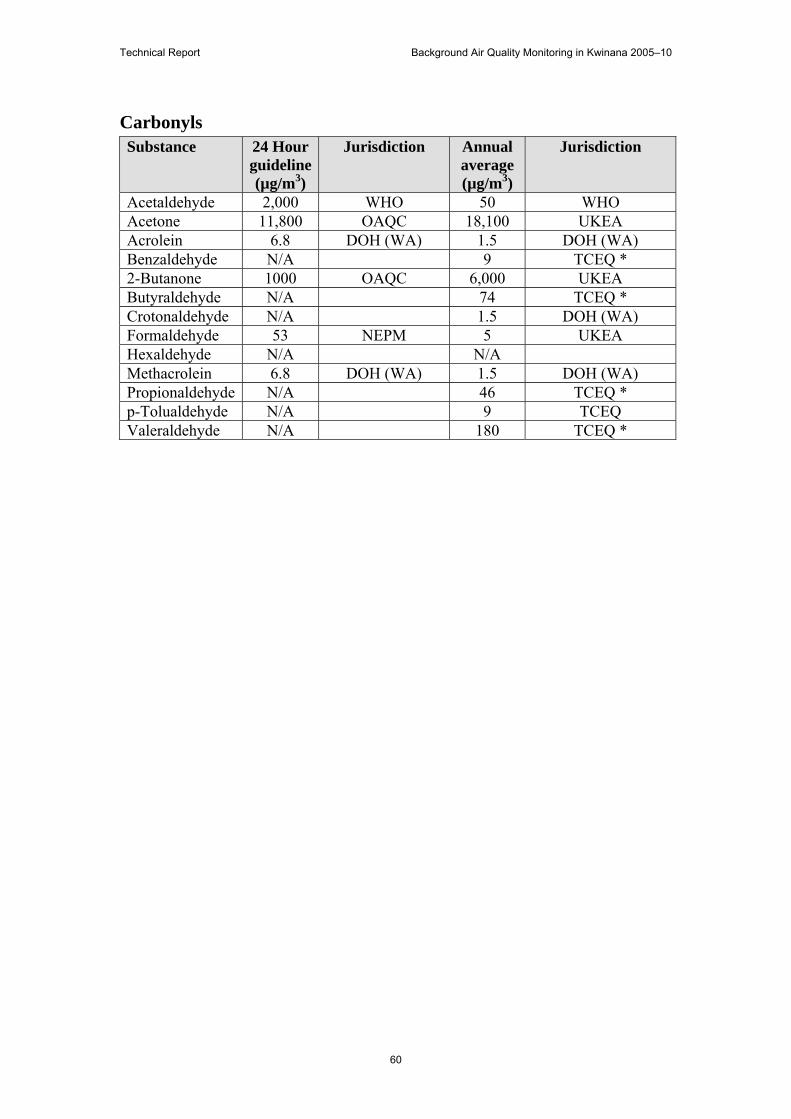
Technical Report Background Air Quality Monitoring in Kwinana 2005–10
60
Carbonyls Substance 24 Hour
guideline (µg/m3)
Jurisdiction Annual average (µg/m3)
Jurisdiction
Acetaldehyde 2,000 WHO 50 WHO Acetone 11,800 OAQC 18,100 UKEA Acrolein 6.8 DOH (WA) 1.5 DOH (WA) Benzaldehyde N/A 9 TCEQ * 2-Butanone 1000 OAQC 6,000 UKEA Butyraldehyde N/A 74 TCEQ * Crotonaldehyde N/A 1.5 DOH (WA) Formaldehyde 53 NEPM 5 UKEA Hexaldehyde N/A N/A Methacrolein 6.8 DOH (WA) 1.5 DOH (WA) Propionaldehyde N/A 46 TCEQ * p-Tolualdehyde N/A 9 TCEQ Valeraldehyde N/A 180 TCEQ *
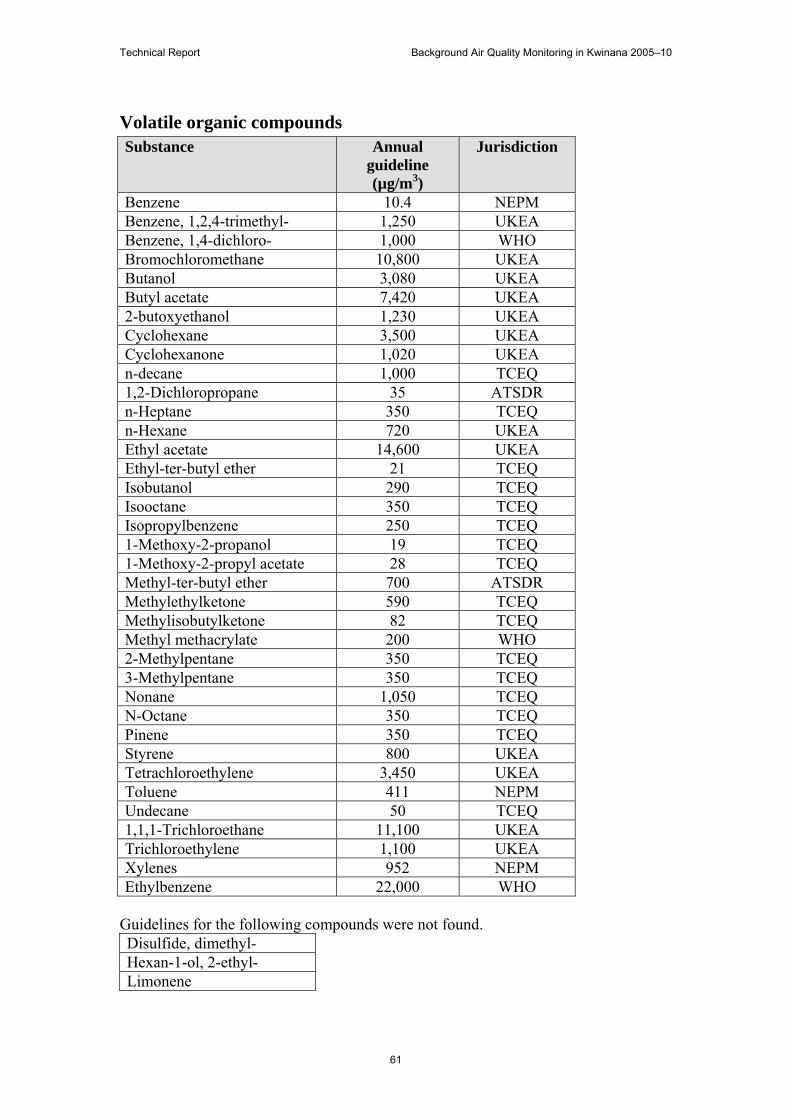
Technical Report Background Air Quality Monitoring in Kwinana 2005–10
61
Volatile organic compounds Substance Annual
guideline (µg/m3)
Jurisdiction
Benzene 10.4 NEPM Benzene, 1,2,4-trimethyl- 1,250 UKEA Benzene, 1,4-dichloro- 1,000 WHO Bromochloromethane 10,800 UKEA Butanol 3,080 UKEA Butyl acetate 7,420 UKEA 2-butoxyethanol 1,230 UKEA Cyclohexane 3,500 UKEA Cyclohexanone 1,020 UKEA n-decane 1,000 TCEQ 1,2-Dichloropropane 35 ATSDR n-Heptane 350 TCEQ n-Hexane 720 UKEA Ethyl acetate 14,600 UKEA Ethyl-ter-butyl ether 21 TCEQ Isobutanol 290 TCEQ Isooctane 350 TCEQ Isopropylbenzene 250 TCEQ 1-Methoxy-2-propanol 19 TCEQ 1-Methoxy-2-propyl acetate 28 TCEQ Methyl-ter-butyl ether 700 ATSDR Methylethylketone 590 TCEQ Methylisobutylketone 82 TCEQ Methyl methacrylate 200 WHO 2-Methylpentane 350 TCEQ 3-Methylpentane 350 TCEQ Nonane 1,050 TCEQ N-Octane 350 TCEQ Pinene 350 TCEQ Styrene 800 UKEA Tetrachloroethylene 3,450 UKEA Toluene 411 NEPM Undecane 50 TCEQ 1,1,1-Trichloroethane 11,100 UKEA Trichloroethylene 1,100 UKEA Xylenes 952 NEPM Ethylbenzene 22,000 WHO
Guidelines for the following compounds were not found. Disulfide, dimethyl- Hexan-1-ol, 2-ethyl- Limonene
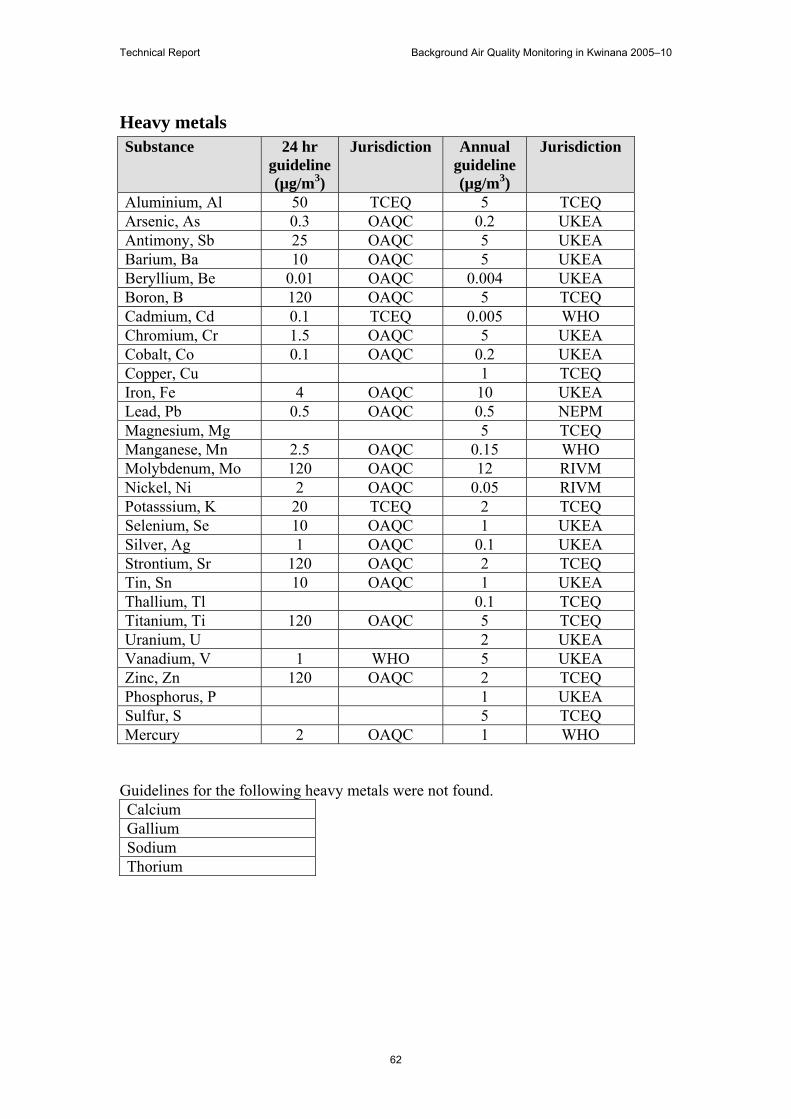
Technical Report Background Air Quality Monitoring in Kwinana 2005–10
62
Heavy metals Substance 24 hr
guideline (µg/m3)
Jurisdiction Annual guideline (µg/m3)
Jurisdiction
Aluminium, Al 50 TCEQ 5 TCEQ Arsenic, As 0.3 OAQC 0.2 UKEA Antimony, Sb 25 OAQC 5 UKEA Barium, Ba 10 OAQC 5 UKEA Beryllium, Be 0.01 OAQC 0.004 UKEA Boron, B 120 OAQC 5 TCEQ Cadmium, Cd 0.1 TCEQ 0.005 WHO Chromium, Cr 1.5 OAQC 5 UKEA Cobalt, Co 0.1 OAQC 0.2 UKEA Copper, Cu 1 TCEQ Iron, Fe 4 OAQC 10 UKEA Lead, Pb 0.5 OAQC 0.5 NEPM Magnesium, Mg 5 TCEQ Manganese, Mn 2.5 OAQC 0.15 WHO Molybdenum, Mo 120 OAQC 12 RIVM Nickel, Ni 2 OAQC 0.05 RIVM Potasssium, K 20 TCEQ 2 TCEQ Selenium, Se 10 OAQC 1 UKEA Silver, Ag 1 OAQC 0.1 UKEA Strontium, Sr 120 OAQC 2 TCEQ Tin, Sn 10 OAQC 1 UKEA Thallium, Tl 0.1 TCEQ Titanium, Ti 120 OAQC 5 TCEQ Uranium, U 2 UKEA Vanadium, V 1 WHO 5 UKEA Zinc, Zn 120 OAQC 2 TCEQ Phosphorus, P 1 UKEA Sulfur, S 5 TCEQ Mercury 2 OAQC 1 WHO
Guidelines for the following heavy metals were not found. Calcium Gallium Sodium Thorium
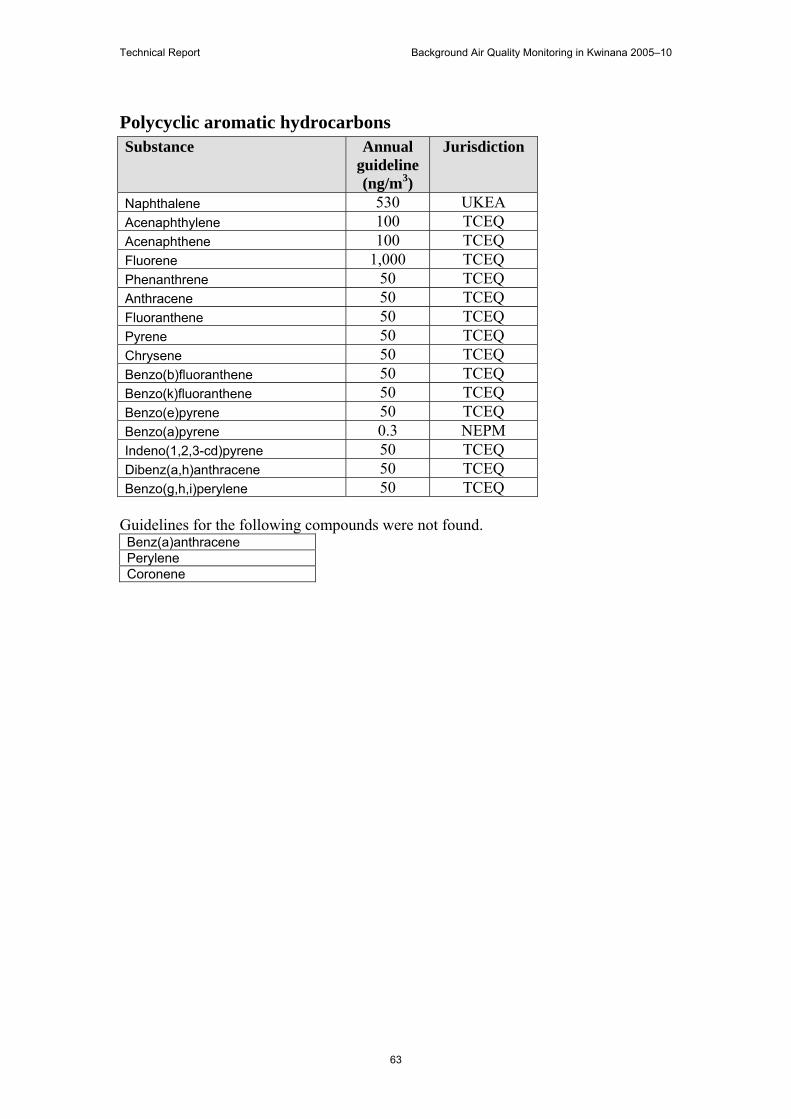
Technical Report Background Air Quality Monitoring in Kwinana 2005–10
63
Polycyclic aromatic hydrocarbons Substance Annual
guideline (ng/m3)
Jurisdiction
Naphthalene 530 UKEA Acenaphthylene 100 TCEQ Acenaphthene 100 TCEQ Fluorene 1,000 TCEQ Phenanthrene 50 TCEQ Anthracene 50 TCEQ Fluoranthene 50 TCEQ Pyrene 50 TCEQ Chrysene 50 TCEQ Benzo(b)fluoranthene 50 TCEQ Benzo(k)fluoranthene 50 TCEQ Benzo(e)pyrene 50 TCEQ Benzo(a)pyrene 0.3 NEPM Indeno(1,2,3-cd)pyrene 50 TCEQ Dibenz(a,h)anthracene 50 TCEQ Benzo(g,h,i)perylene 50 TCEQ
Guidelines for the following compounds were not found. Benz(a)anthracene Perylene Coronene
Technical Report Background Air Quality Monitoring in Kwinana 2005–10
64
Appendix 4 Quick guide to air sampling methods
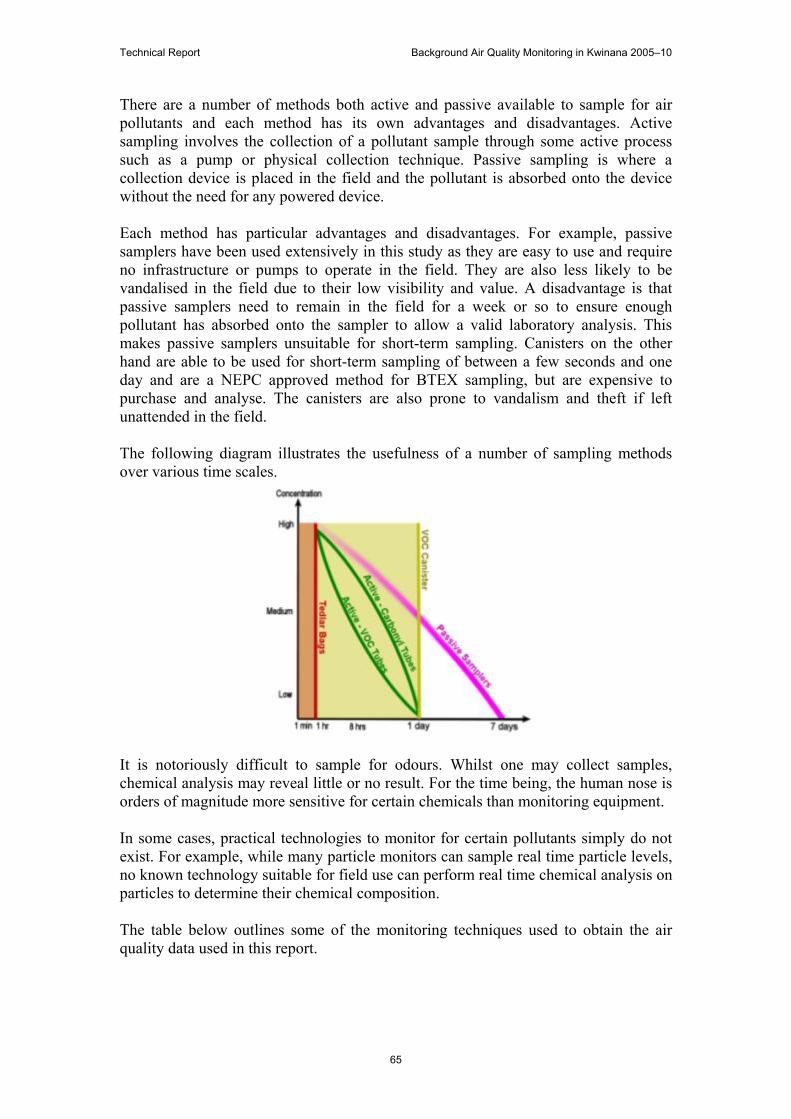
Technical Report Background Air Quality Monitoring in Kwinana 2005–10
65
There are a number of methods both active and passive available to sample for air pollutants and each method has its own advantages and disadvantages. Active sampling involves the collection of a pollutant sample through some active process such as a pump or physical collection technique. Passive sampling is where a collection device is placed in the field and the pollutant is absorbed onto the device without the need for any powered device. Each method has particular advantages and disadvantages. For example, passive samplers have been used extensively in this study as they are easy to use and require no infrastructure or pumps to operate in the field. They are also less likely to be vandalised in the field due to their low visibility and value. A disadvantage is that passive samplers need to remain in the field for a week or so to ensure enough pollutant has absorbed onto the sampler to allow a valid laboratory analysis. This makes passive samplers unsuitable for short-term sampling. Canisters on the other hand are able to be used for short-term sampling of between a few seconds and one day and are a NEPC approved method for BTEX sampling, but are expensive to purchase and analyse. The canisters are also prone to vandalism and theft if left unattended in the field. The following diagram illustrates the usefulness of a number of sampling methods over various time scales.
It is notoriously difficult to sample for odours. Whilst one may collect samples, chemical analysis may reveal little or no result. For the time being, the human nose is orders of magnitude more sensitive for certain chemicals than monitoring equipment. In some cases, practical technologies to monitor for certain pollutants simply do not exist. For example, while many particle monitors can sample real time particle levels, no known technology suitable for field use can perform real time chemical analysis on particles to determine their chemical composition. The table below outlines some of the monitoring techniques used to obtain the air quality data used in this report.
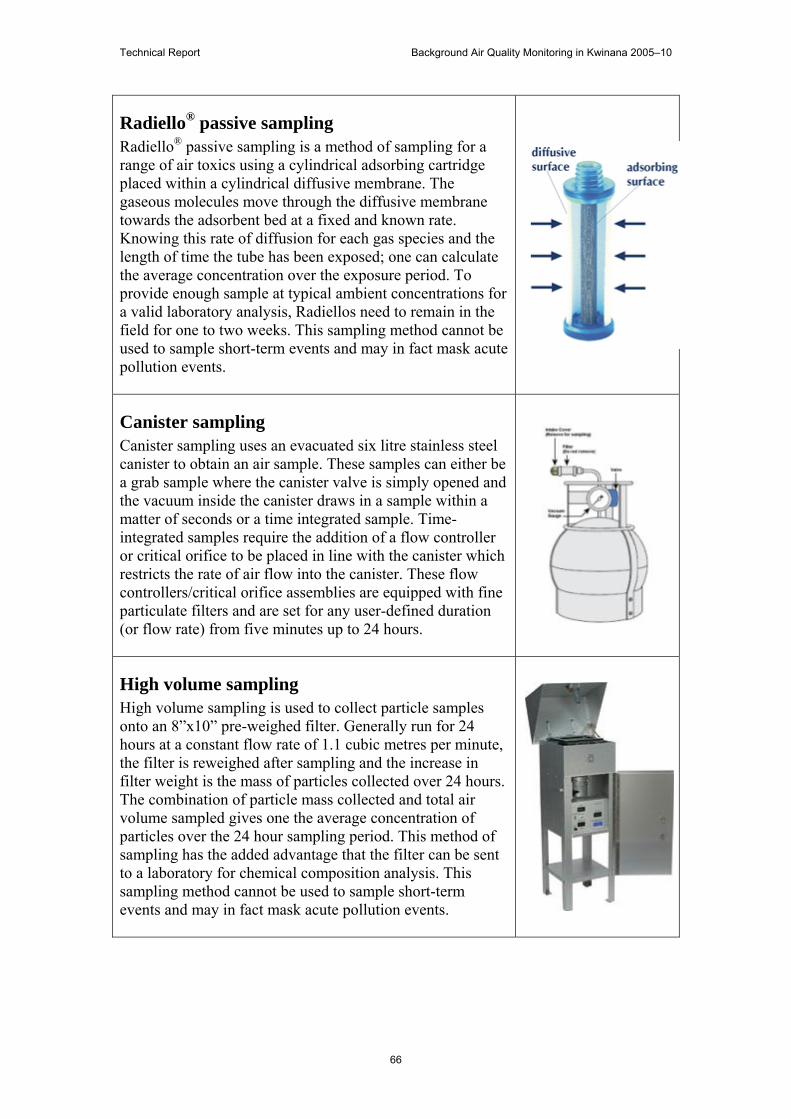
Technical Report Background Air Quality Monitoring in Kwinana 2005–10
66
Radiello® passive sampling Radiello® passive sampling is a method of sampling for a range of air toxics using a cylindrical adsorbing cartridge placed within a cylindrical diffusive membrane. The gaseous molecules move through the diffusive membrane towards the adsorbent bed at a fixed and known rate. Knowing this rate of diffusion for each gas species and the length of time the tube has been exposed; one can calculate the average concentration over the exposure period. To provide enough sample at typical ambient concentrations for a valid laboratory analysis, Radiellos need to remain in the field for one to two weeks. This sampling method cannot be used to sample short-term events and may in fact mask acute pollution events.
Canister sampling Canister sampling uses an evacuated six litre stainless steel canister to obtain an air sample. These samples can either be a grab sample where the canister valve is simply opened and the vacuum inside the canister draws in a sample within a matter of seconds or a time integrated sample. Time-integrated samples require the addition of a flow controller or critical orifice to be placed in line with the canister which restricts the rate of air flow into the canister. These flow controllers/critical orifice assemblies are equipped with fine particulate filters and are set for any user-defined duration (or flow rate) from five minutes up to 24 hours.
High volume sampling High volume sampling is used to collect particle samples onto an 8”x10” pre-weighed filter. Generally run for 24 hours at a constant flow rate of 1.1 cubic metres per minute, the filter is reweighed after sampling and the increase in filter weight is the mass of particles collected over 24 hours. The combination of particle mass collected and total air volume sampled gives one the average concentration of particles over the 24 hour sampling period. This method of sampling has the added advantage that the filter can be sent to a laboratory for chemical composition analysis. This sampling method cannot be used to sample short-term events and may in fact mask acute pollution events.
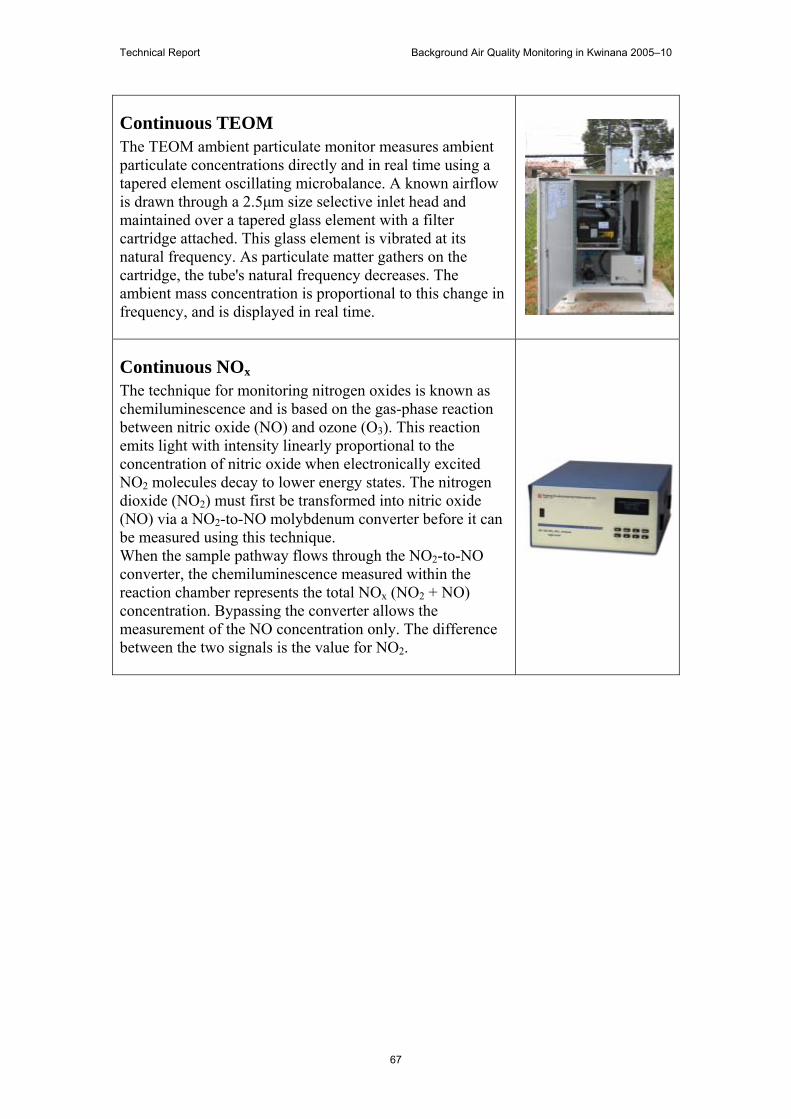
Technical Report Background Air Quality Monitoring in Kwinana 2005–10
67
Continuous TEOM The TEOM ambient particulate monitor measures ambient particulate concentrations directly and in real time using a tapered element oscillating microbalance. A known airflow is drawn through a 2.5μm size selective inlet head and maintained over a tapered glass element with a filter cartridge attached. This glass element is vibrated at its natural frequency. As particulate matter gathers on the cartridge, the tube's natural frequency decreases. The ambient mass concentration is proportional to this change in frequency, and is displayed in real time.
Continuous NOx The technique for monitoring nitrogen oxides is known as chemiluminescence and is based on the gas-phase reaction between nitric oxide (NO) and ozone (O3). This reaction emits light with intensity linearly proportional to the concentration of nitric oxide when electronically excited NO2 molecules decay to lower energy states. The nitrogen dioxide (NO2) must first be transformed into nitric oxide (NO) via a NO2-to-NO molybdenum converter before it can be measured using this technique. When the sample pathway flows through the NO2-to-NO converter, the chemiluminescence measured within the reaction chamber represents the total NOx (NO2 + NO) concentration. Bypassing the converter allows the measurement of the NO concentration only. The difference between the two signals is the value for NO2.