Embed Size (px)
Citation preview

© 2014 Ipsos. All rights reserved.
Contains Ipsos' Confidential and Proprietary information and may not be disclosed or reproduced without the prior written consent of Ipsos.
2013 FULL YEAR RESULTSBACK TO GROWTH
NOW THE PACE ACCELERATES
27 February 2014
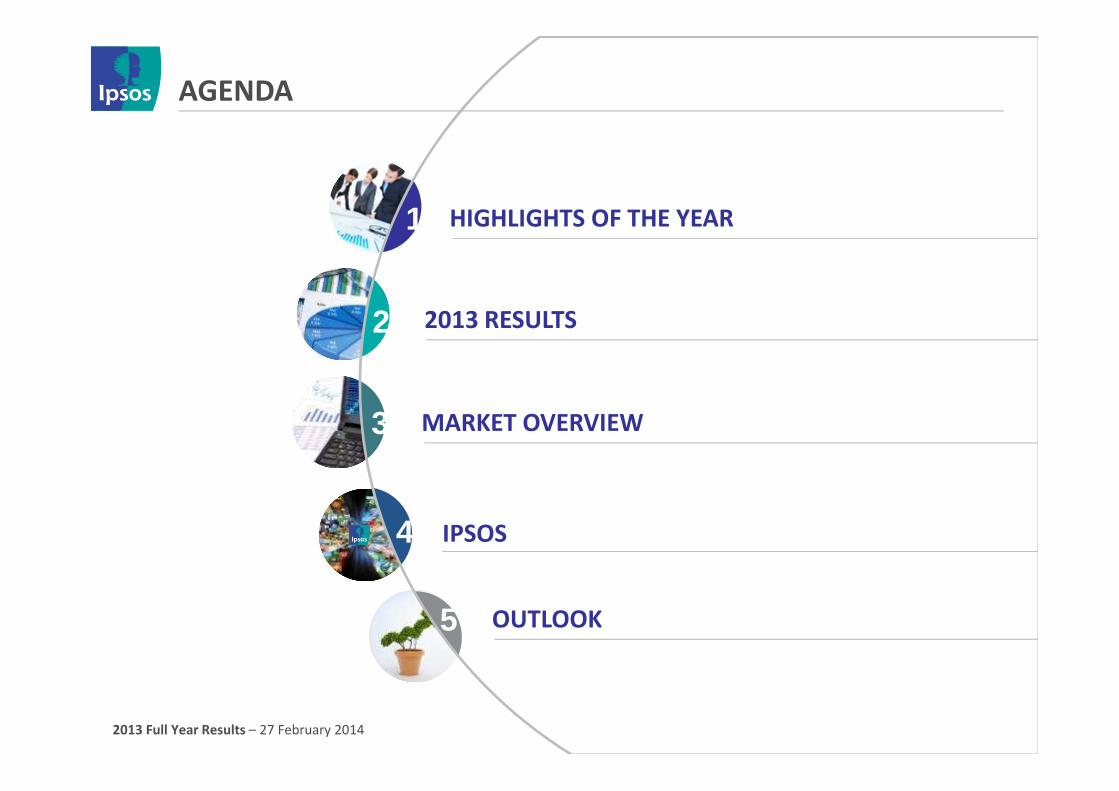
AGENDA
HIGHLIGHTS OF THE YEAR
2013 RESULTS
MARKET OVERVIEW
OUTLOOK
2
1
3
5
IPSOS4
2013 Full Year Results – 27 February 2014

HIGHLIGHTSOF THE YEAR

2013 Full Year Results – 27 February 2014
REVENUE €1,712.4M
OPERATING MARGIN 10.6%
NET PROFIT ATTRIBUTABLE TO THE GROUP €121.0M
HIGHLIGHTS OF THE YEAR
CARBON DISCLOSURE PROJECT AWARD ON SOCIALAND ENVIRONMENTAL TRANSPARENCY
4
NEGATIVE IMPACT OF FOREIGN EXCHANGE -4.4%

2013 RESULTS

2013 Full Year Results – 27 February 2014
OPERATING MARGIN OF 10.6%
In millions of euros 2013 2012 Variation
2013/2012
Revenue 1,712.4 1,789.5 -4.3%
Gross profit 1,097.8 1,147.2 -4.3%
Gross profit/Revenue 64.1% 64.1%
Operating margin 182.1 178.5 +2.1%
Operating margin/Revenue 10.6% 10%
Other operating income and expense (18.2) (36.6) -
Net impact of Remeasurements relating to the Synovate transaction
post allocation period(71.3) - -
Finance costs (23.4) (23.9) -2.2%
Income tax (33.5) (27.3) +22.8%
Net profit (attrib. to the Group) 17.4 74.1 -76.5%
Net income Group share (excluding net impact of Remeasurements
relating to the Synovate transaction post allocation period)88.7 74.1 +19.8%
Adjusted net profit* (attrib. to the Group) 121.0 118.5 +2.1%
6
* Adjusted net profit is calculated before non-cash items linked to IFRS 2 (share-based payments), amortisation of acquisition-related intangible assets
(client relationships), deferred tax liabilities related to goodwill on which amortisation is tax-deductible in certain countries and the impact net of tax of other
non-recurring income and expenses and before the net impact of Remeasurements relating to the Synovate transaction post allocation period
2013 Full Year Results – 27 February 2014
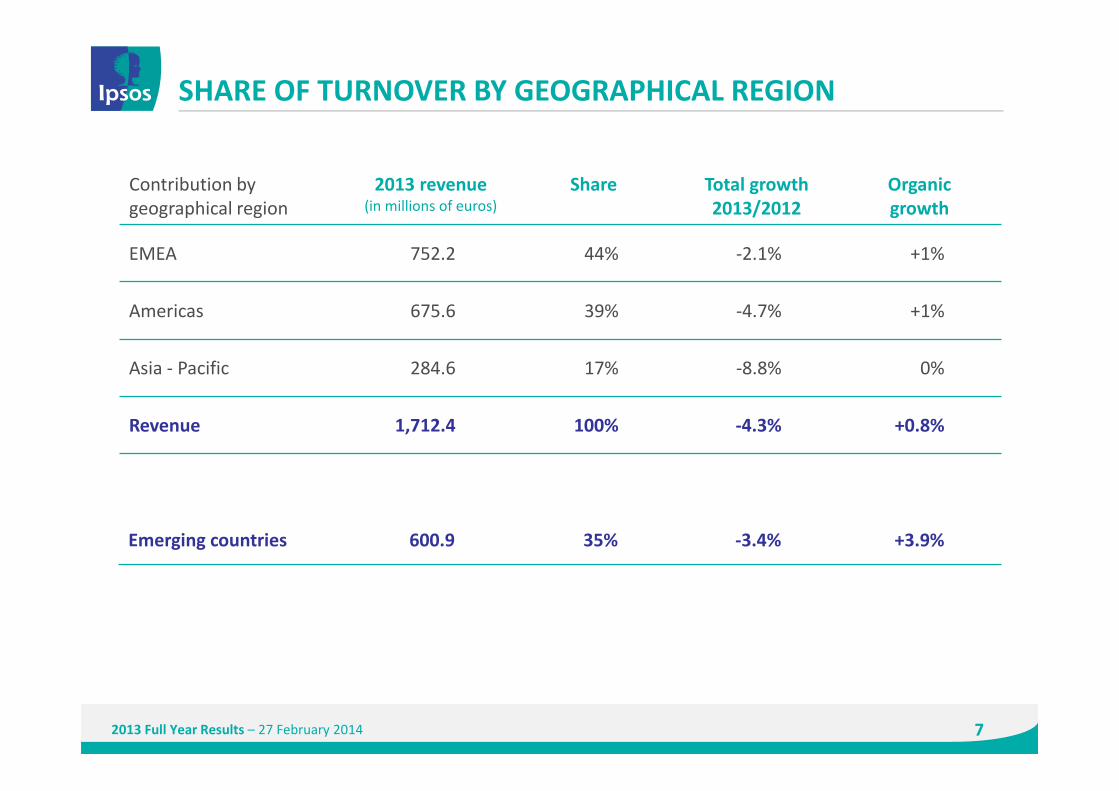
SHARE OF TURNOVER BY GEOGRAPHICAL REGION
Contribution by
geographical region
2013 revenue(in millions of euros)
Share Total growth
2013/2012
Organic
growth
EMEA 752.2 44% -2.1% +1%
Americas 675.6 39% -4.7% +1%
Asia - Pacific 284.6 17% -8.8% 0%
Revenue 1,712.4 100% -4.3% +0.8%
Emerging countries 600.9 35% -3.4% +3.9%
7

2013 Full Year Results – 27 February 2014
SHARE OF TURNOVER BY SPECIALISATION
Contribution by
specialisation
2013 revenue(in millions of euros)
Share Total growth
2013/2012
Organic
growth
Advertising Research 274.5 16% -3.3% -1%
Marketing Research 891.0 52% -6% +1%
Media Research 169.7 10% +0.7% +3%
Opinion & Social
Research152.0 9% -3.7% -1%
Client/Employee
Relationship
Management Research
225.2 13% -2.7% +0.5%
Revenue 1,712.4 100% -4.3% +0.8%
8

2013 Full Year Results – 27 February 2014
48.2 49.0
130.3
133.1178.5
2012H1 2012 H2 2012H1 2013 H2 2013 2013
182.1
14.7%
10.6%
10.0%
13.7%
5.8% 6.1%
MARGINS IMPROVE SEMESTER AFTER SEMESTER
9

2013 Full Year Results – 27 February 2014
COMPONENTS OF CHANGE IN OPERATING MARGIN
10
- 0,20
2012 Variable
remuneration
Investment
in the Client
Organisation and
product offer
2013Benefits of the
combination
(GE and payroll)
10.0%
-0.10
+0.90
10.6%
-0.20
THE OPERATING MARGIN PROGRESSES THANKSTO THE BENEFITS OF THE COMBINATION

TRIPLING OF NET CASH GENERATION
In millions of euros 2013 2012 Variation
Gross Operating Cash flow 196.3 169.7 +16%
Change in WCR (54.1) (66.3)
Tax and interest expense (49.8) (51.9)
Purchases of PP&E and intangible assets (18.0) (28.4)
Free Cash flow 74.4 23.1 +222%
Acquisitions 9.4 (28.4)
Capital increase/(decrease) 0.2 1.6
Share repurchase (3.9) (6.1)
Net change in debt (25.4) 10.5
Dividends (29.9) (29.8)
Cash at end of period 148.7 132.3 +12%
2013 Full Year Results – 27 February 2014 11

2013 Full Year Results – 27 February 2014
BALANCE SHEET STRUCTURE IMPROVED
12
In millions of euros 2013 30 June 2013 2012
Shareholders’ equity 852 804 928
Net debt 545 634 623
Gearing 63.9% 78.8% 67.2%
Net debt/EBITDA x 2.5 x 2.9 x 2.9
Interest cover
(operating margin/interest expense)x 8.2 x 3.8 x 7.5

39
59
127
92
209
146
22
31/12/2013 2014 2015 2016 2017 2018 2020 2022
694
Gross Debt
(€M)
2013 Full Year Results – 27 February 2014
LONG-TERM FINANCIAL RESOURCES
13
31 December 2013: Ipsos has 148.7 million euros of cash and 184 million euros of credit lines enabling itto meet its obligations after the success of its refinancing on better terms than previously:- August 2, 2013: Syndicated loan of 150 million euros to 5 years in fine.- November 7, 2013: Schuldschein of 109 million euros with 3, 5 and 7-year tranches.
SPLIT BY DATE OF MATURITY

PROPOSED DIVIDEND OF 70 CENTIMES (+9%)
2013 Full Year Results – 27 February 2014 14
2013 2012
Dividend per share 0.70 0.64
Earnings per share 0.38 1.64
Adjusted earnings per share 2.67 2.62
Adjusted earnings per share distributed 26.2% 24.4%

TANGIBLE COMMITMENT TO SOCIAL RESPONSIBILITY
15
2013: IPSOS WINS PRESTIGIOUS CARBON DISCLOSURE PROJECT
AWARD AS THE FRENCH COMPANY WITH THE MOST IMPROVED
CDP DISCLOSURE SCORE
� CDP is an international, not-for-profit organisation providing the only global system for companies to measure, disclose, manage and share vital environmental information
Key milestones of Ipsos Corporate Social Responsibility
20132012201120102008/2009
� Launch of TAKING RESPONSIBILITY initiativeIpsos becomes first global market research company to join United Nations Global Compact
� First annual global TAKING RESPONSIBILITY Survey of Corporate Responsibility initiatives undertaken
� First reporting of its environmental information to the Carbon DisclosureProject (CDP)
� Greenhouse Gas (GHG) measurement initiative piloted across 17 countries (c. 70% of our business)
� Ipsos granted ‘Active Status’ by UN Global Compact
� Corporate Responsibility highlighted as a specific disclosure in the Annual Report
� Ipsos’ Global Corporate Responsibility policy launched
� GHG measurement project extended to over 80% of our business
� Ipsos Corporate Responsibility measurement initiatives subject to external audit for the first time
2013 Full Year Results – 27 February 2014

MARKET OVERVIEW

EVEN IF… BASED ON…
� Developing countriesare slowing down
� The differences in performance from one country to another are marked
� A good momentum in Anglo-Saxon countries
� An orderly transitionof China to its new development mode
2014: A POSITIVE ENVIRONMENT, WITH CHALLENGES
2013 Full Year Results – 27 February 2014
� In the short term, the United States, the United Kingdom and Germany are/become key markets again due to their size and their ability to generate innovations, global programs and growth
� In the longer term, large developing countries will remain key drivers of growth, despite their inevitable volatility
THE WORLD ECONOMY IS STILL GROWING
THE SOCIAL AND MARKET RESEARCH INDUSTRY REGAINS STRENGH
17

MARKET RESEARCH ENTERS A NEW PHASE
� The range of new services will increase
� The ability of Anglo-Saxon markets to innovate and grow will be decisive
2009 WAS A PIVOTAL YEAR
2014 WILL BE A PIVOTAL YEAR
2005/2008 2008/2012
� Strong annual growth � Weak annual growth
� Development of panel-based activities
2005 USD 2008 USDAverage annual
change 2005/2008(in current dollars)
2012 USD*Average annual
change 2008/2012(in current dollars)
Size of the Market 23,193 31,857 11.2% 33,331 1.1%
Emerging countries 3,307 5,205 16.3% 6,998 7.7%
Developed countries 19,886 26,652 10.3% 26,333 -0.3%
UK + US + Germany 12,318 16,354 9.9% 16,709 0.5%
Panels 6,494 7,327 4.1% 9,734 7.4%
« Big 4 » (excl. IMS) 7,051 11,429 13.2% 13,017 3.3%
Globalisation: the « Big 4 » move from 30% to 40% of the market share
2013 Full Year Results – 27 February 2014 18
*Restated of scope change made by Esomar

THE WORLD IS CHANGING, THE MARKET IS MOVING
Digital marketing is part of brand building
Let’s celebrate the end of digital marketing.
Let’s focus on creating the great ideas that move people and build
great brands. And let’s leverage the tools, platforms and technology
to make them bigger and engage with people like never before.
“”
Unilever will […] slash its product variants by 30 per cent and focus
predominantly on brands […].
The company is now more inclined to favour fewer global advertising
concepts over multiple local ideas.
Advertising concepts become more global
Paul Polman, Unilever Chief ExecutiveUnilever Investor Day, December 2013, London
Marc Pritchard, P&G’s Global Brand Building Officer
Digital Marketing Exposition & Conference, September 2013, Düsseldorf
2013 Full Year Results – 27 February 2014 19
COMPANIES ARE EVOLVING THEIR BUSINESS MODELS

This necessitates the deployment of global infrastructures and proceduresGLOBAL
To deny differences between countries is to limit proper understandingLOCAL
To be used, information must be understandableSIMPLICITY
The source of many new services, including but not solely Big DataSCIENCE & TECHNOLOGY
Ipsos does not lack these as information on society,people and markets is at the heart of decision-makingCURIOSITY, CONFIDENCE & INTENSITY
ACCURACY The knowledge of statistics and models is the reason for our industry
SPECIALISATIONSThe cornerstone of Ipsos’ differentiation strategy is based on the developmentand co-existence in the same company of specific expertise
SPEED Necessary in terms of what is required from information
MOBILES & CLOUD The tools of transformation for today and for tomorrow
SOCIAL Networks that change the behaviour and feelings of people, and therefore the art of convincing
KEY WORDS
2013 Full Year Results – 27 February 2014 20

IPSOSGrowth levers
NEW SERVICES
SUCCESS WITH BIG CLIENTS
ONE IPSOS
FOCUS ON FLOURISHING MARKETS
TALENTED TEAMS

22
ONE IPSOS
Global Coverageover 4.5 millionof panelists in 46 countries(5 continents, growthin emerging markets)
Common platform for collecting, processingand storing data
Next*WorkbenchWorkflow system establishing a framework of collaboration betweenresearchers and Operations
30/30 initiative
Shorter questionnaires, more actionablepresentations
Copy Testing
Delivery time reduction
= 50%
Cost reduction = 25%
TrackingCentralisationof operating model
Ipsos Training Center
Consistent standards and global training withthe roll-out of the Ipsos Training Centre accross83 countries (+5):- 303 classes available
online (+57) - 7,170 Ipsos
beneficiaries
A global offer of standardised products- Censydiam- ASI*Connect- Brand Value Creator- Brand*Shout- Ideal Customer
Experience- WAO!Optimiser
(Wallet Allocation Optimiser)
Common Information Systems- Harmony- Symphony- iStaff- iTime- iQuote
PRODUCTS INTEGRATION SIMPLIFICATION HUBs & GMUs TRAINING
INFORMATION SYSTEMS
22
GLOBALISATION OF OPERATING SYSTEMS:
BETTER GLOBAL AND LOCAL PERFORMANCE
Hubs
Data processing andInternational projectmanagementcentres in Bulgaria, Roumania, Argentina, Malaysia, Tunisia, Chile:- 872 employees
GMUs
Expert modellingcentres based on specialist activities, located in Argentina, Brazil, China, France, Japan, Malaysia, South Africa, UK, US: - 193 employees
2013 Full Year Results – 27 February 2014 22

THE IPSOS DIFFERENCE: 6 SPECIALISATIONS, 86 COUNTRIES
COUNTRY MANAGERS’ ACCOUNTABILITY…
� Entrepreneurial autonomy
� Management of teams
� Innovation
� Local activation
� Closeness to clients
� Sensitive to local needs
…IN COMPLIANCE WITH
THE VALUES AND RULES
OF THE GROUP
� Information Systems Business Intelligence
� WSBLs, specialised business lines
� Global services
� International clients
� Integrated production
� Monitoring of Quality
� Around 50% of Ipsos’ turnover comes from local business
The Ipsos leadership team is multicultural and motivated by the same values
2013 Full Year Results – 27 February 2014 23
A GLOBAL NETWORK WITH STRONG ROOTS IN COUNTRIES

LOYALTY AND STRENGTHENING OF OUR TEAM
Judith Passingham
CEO Ipsos Interactive
Services (online, mobile)
Peter Braun
CEO Germany
Jim Meyer
CEO Ipsos
ASI NA
Francesc Costa
CEO Spain
Hamish Munro
CEO Australia
Yannick Carriou
CEO MCT & ASI
Jeremy McNamara
COO Operations
Ralf Ganzenmueller
CEO Loyalty
Neville
Rademeyer
Global CIO
Miranda Cheung
CEO Singapore
& Malaysia
New talent joined key activities and markets Support for and development of our leaders
David Parma
President P&G Org.
Marketing US
Dmitry Shoulgin
CEO CEE
Kerstin Wegener
Head of Client
Relationship Prog.
David Somers
CEO PanAfrica
Tim Swift
CEO Nigeria
Virginia Weil
Global Head of
Product Testing
� Sept. 2012: launch of Ipsos Partnership Fund (IPF)
� 147 IPF members still present (out of 156), as of 31/01/2014
2013 Full Year Results – 27 February 2014 24

CLIENTS: COMMITMENT AND TRUST
25
���� Consequence of a long-term commitment, close relationship and dedicated
resources
���� Covering a wide spread of industries
Finance
4 PRP clients
CPG
9 IGP clients 13 PRP clients
Pharma
2 IGP clients 6 PRP clients
Media/tech
3 IGP clients 1 PRP clients
Automotive
1 IGP client5 PRP clients
Energy
1 PRP client
THE 16 PARTNERING CLIENTS ACCOUNT FOR ~25% OF IPSOS BUSINESS IN 2013
� +6% vs 2012
� 6 clients grew more than 10%
STRONG PERFORMANCE IN KEY MARKETS
� Emerging countries: +8.1%
� UK, US and Germany: +6.5%
2013 Full Year Results – 27 February 2014 25
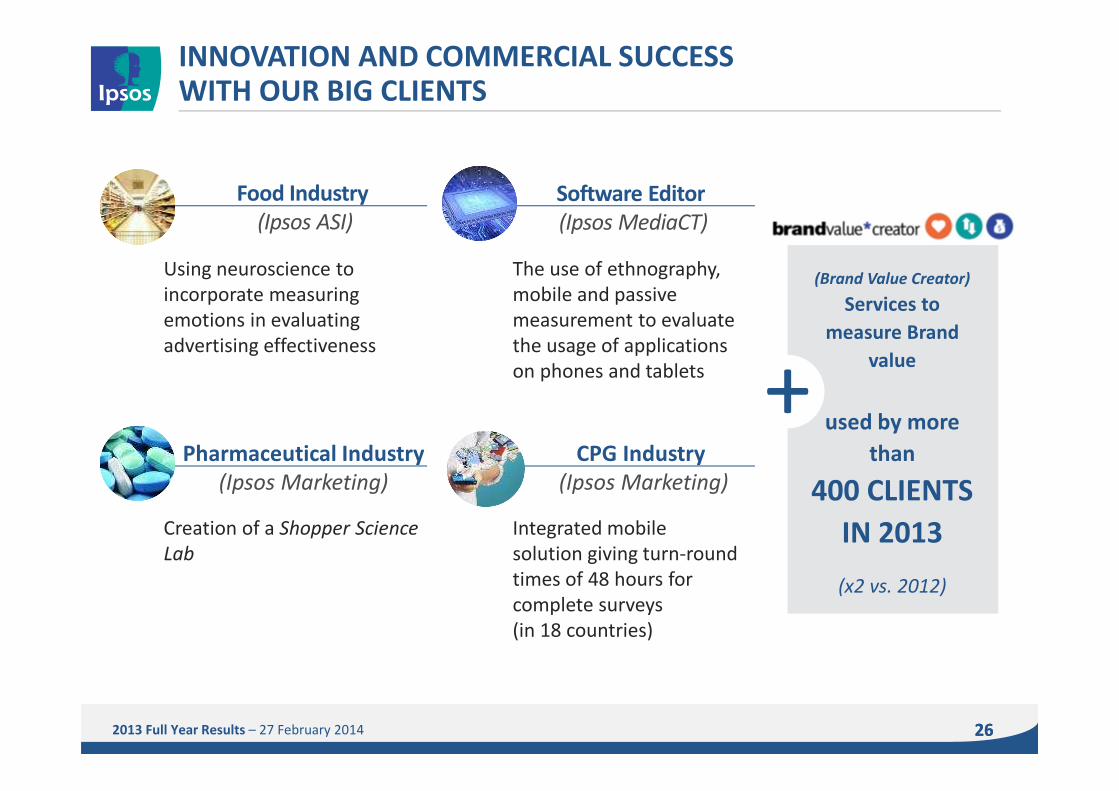
CPG Industry
(Ipsos Marketing)
26
Using neuroscience to
incorporate measuring
emotions in evaluating
advertising effectiveness
Creation of a Shopper Science
Lab
Integrated mobile
solution giving turn-round
times of 48 hours for
complete surveys
(in 18 countries)
(Brand Value Creator)
Services to
measure Brand
value
used by more
than
400 CLIENTS
IN 2013
(x2 vs. 2012)
Pharmaceutical Industry
(Ipsos Marketing)
+
The use of ethnography,
mobile and passive
measurement to evaluate
the usage of applications
on phones and tablets
Software Editor
(Ipsos MediaCT)
Food Industry
(Ipsos ASI)
2013 Full Year Results – 27 February 2014
INNOVATION AND COMMERCIAL SUCCESSWITH OUR BIG CLIENTS
26

NEW SERVICES, NEW OPPORTUNITIES
2013 Full Year Results – 27 February 2014 27
Source: Internal estimates Ipsos – 2012/2013 change
Mobile
SocialMedia
(Web listening andCommunities) Big Data
Analytics
Neuro-sciences
New Services enriching Ipsos’ offer
5.4% of Group turnover
+202%+44%
+73%
+170%Ethnography
+45%

US: IPSOS, AN AMERICAN STORY
SynovateLoyalty,Marketing,PublicAffairs
LEVERAGING CLIENTS’ GLOBALISATION
28
*Esomar 2013: The figures refer to the size of the market in 2012, incl. Advisory services ** 2011 only includes 1Q
for Synovate
3rd largest research company in the US
Size of the market* $13,756M
Ipsos revenue 2013 $575M
2013 Full Year Results – 27 February 2014
1st
office
1996 1998 2000 2001 20132002 2003 2005 2008 2010 2011**
ASIAdvertising
MonroeMendelsohnMediaCT OTX
Digital,Social listening,Communities
1,690
NPDPanels,Marketing
ForwardResearchAnimal Health& NutritionResearch
MarketingMetricsLoyalty
UnderstandingUnlimitedQualitative
Angus Reid (CA)Marketing
AC NielsenVantisModelling 23
offices
� Clients
o We have international programmes with 17 of our top 20 US clients
� New services: +54.2%
o Mobile (+193%)
o Communities and social listening (+30%)
o Marketing Mix Modelling (MMA) (+25%)
o Customer Journey (+40%)
� Partnerships of excellence
o Ivy League: Duke, Yale
o Thomson Reuters
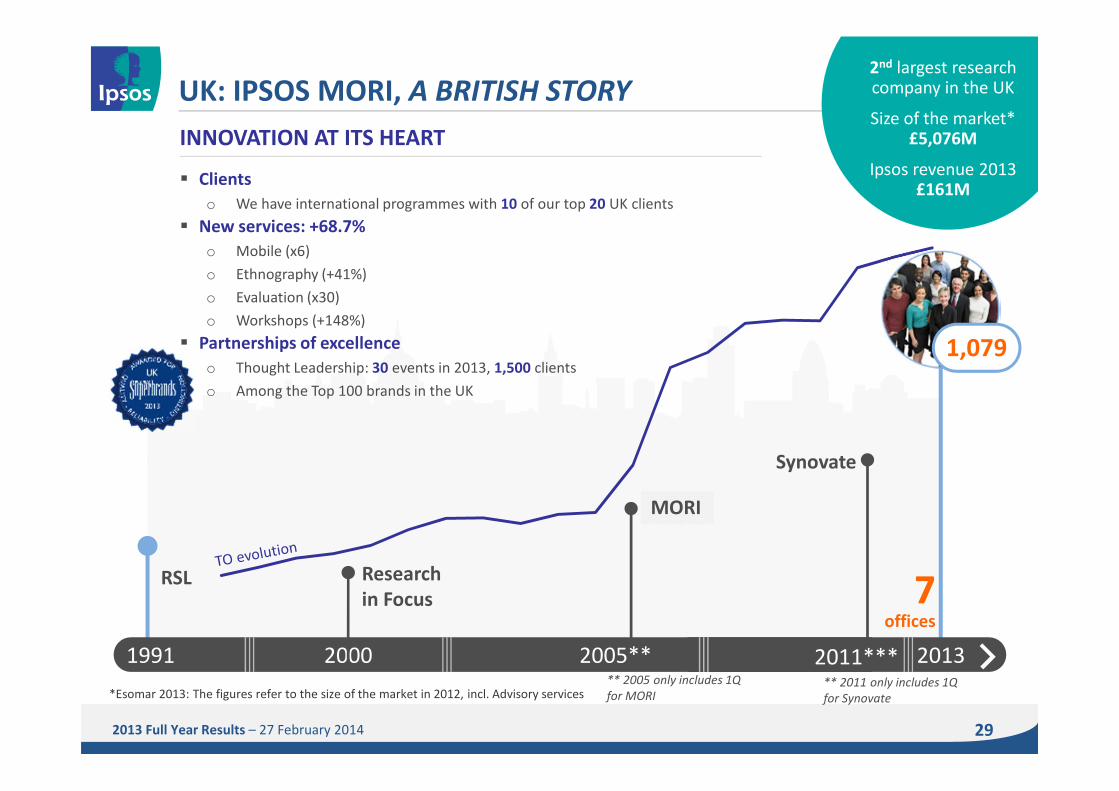
UK: IPSOS MORI, A BRITISH STORY
29
INNOVATION AT ITS HEART
� Clients
o We have international programmes with 10 of our top 20 UK clients
� New services: +68.7%
o Mobile (x6)
o Ethnography (+41%)
o Evaluation (x30)
o Workshops (+148%)
� Partnerships of excellence
o Thought Leadership: 30 events in 2013, 1,500 clients
o Among the Top 100 brands in the UK
2nd largest research company in the UK
Size of the market* £5,076M
Ipsos revenue 2013 £161M
** 2011 only includes 1Q
for Synovate
2013 Full Year Results – 27 February 2014
** 2005 only includes 1Q
for MORI*Esomar 2013: The figures refer to the size of the market in 2012, incl. Advisory services
Research
in Focus
Synovate
1991 2000 20132005**
7offices
1,079
RSL
MORI
2011***

PANAFRICA: NEW BOUNDARIES
IPSOS REVENUE 2013: €21M
MARKET SHARE: 25%
ORGANIC GROWTH: +20%
EMPLOYEES: 499
Ipsos, in the TOP 3 of market research companies:
A story that begins
with a Nigerian start-up (2010)
then the acquisition of Synovate (2011)
Tanzania (1)
Uganda (1)
Zambia (1)
Kenya (1)
Mozambique (3)
Nigeria (2)
LARGEST RESEARCH COMPANY IN PANAFRICA
Ghana (1)
Ivory Coast (1)
QUALIFIED TEAMS
2013 Full Year Results – 27 February 2014 30
We have regional programmes with 6 of our top 10 Pan African clients

SOUTH AFRICA: AN ALREADY SOPHISTICATED MARKET
CLIENTS� + 10% with PartneRing clients
� + 31% with PRP clients
� We have regional programmes with 6 of our top 10 South African clients
PEOPLE� Establishment of a Graduate School to support young graduates
joining Ipsos (10 in 2013)� Employees= 294
SERVICES� Innovation and Forecasting (+32.4%)
� Leading supplier in Automotive research
� Important EFM offer (Enterprise Feedback Management), with own web-based
reporting platform (+15%)
� Largest Mystery Shopping supplier in Africa using latest mobile technology (+7%)
SUPPORTING GROWTHIN AFRICA
2ND LARGEST RESEARCH COMPANY IN SOUTH AFRICA
PARTNERSHIP� Partnership with the South African Sunday Times
SIZE OF THE MARKET*: $249MIPSOS REVENUE 2013: ZAR251M ($26M)ORGANIC GROWTH: +8.5%
2013 Full Year Results – 27 February 2014 31
*Esomar 2013: The figures refer to the size of the market in 2012, incl. Advisory services

2014OUTLOOK

2014 OUTLOOK
Accelerate
Keep implementing
Grow new services
Manage our talent
Balance global/local relationships
Increase margins, dividends
global platforms, solutions, services
building on science and technology
and reward people, reflecting their contribution
the generation of cash flow and deleverage the company
2013 Full Year Results – 27 February 2014 33
organic growth of at least 3%

Nobody’s
Unpredictable