Embed Size (px)
Citation preview
Back to Basics: Health Economics
Gavin Lewis, Head of Health Economics, Roche
BOPA, Brighton, 18th October, 2009
HCMR00008 / Date of Preparation October 2009
Learning Objectives
• Following this session you should be able to better understand:1. Principles of Health Economics2. Meaning of a cost per QALY3. Role of health economics in patient access to
new medicines4. Key challenges facing application of Health
Economics to Oncology
HCMR00008 / Date of Preparation October 2009
Agenda
• What is Health Economics?– Why do we need it?– What is it?– Cost Effectiveness analysis
• How is Health Economics applied in the NHS?– What is a Cost per QALY? – Calculating a cost per QALY
• Health Economics and Oncology– Key challenges– Recent Developments
HCMR00008 / Date of Preparation October 2009

HCMR00008 / Date of Preparation October 2009
Background Common misunderstandings of Health Economics
1. “The most cost-effective patient is a dead patient”
2. “NICE are all about cost containment”
3. “The cheaper drugs are the most cost-effective drugs”
4. “Cost Effectiveness analysis doesn't consider the patient’s quality of life”
HCMR00008 / Date of Preparation October 2009
Why do we need Health Economics?
HCMR00008 / Date of Preparation October 2009
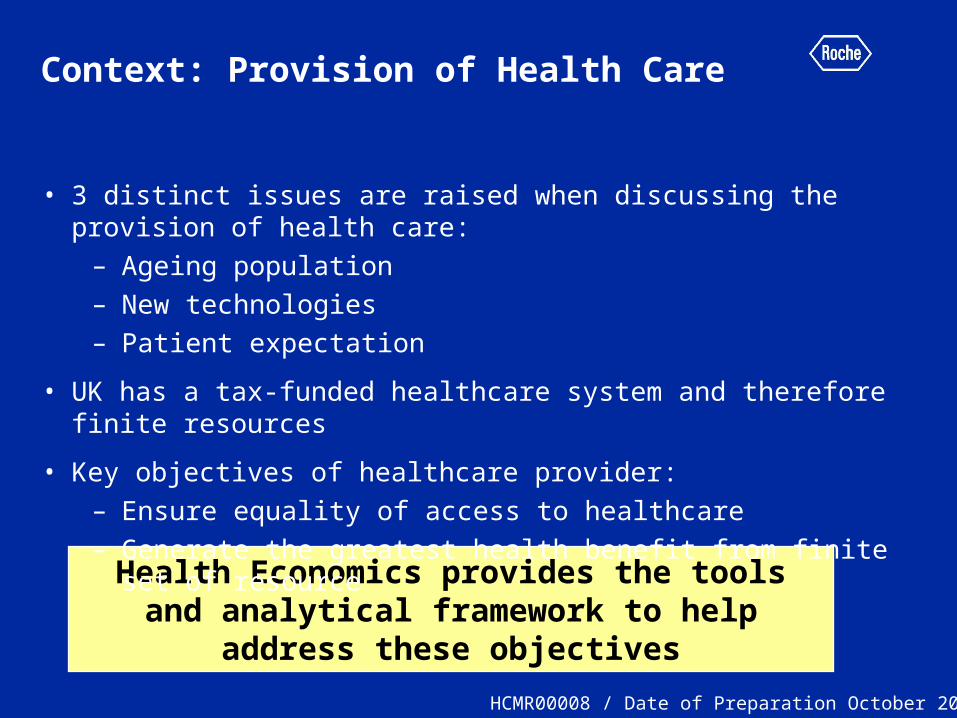
Health Economics provides the tools and analytical framework to help address these
objectives
Context: Provision of Health Care
• 3 distinct issues are raised when discussing the provision of health care:
– Ageing population– New technologies– Patient expectation
• UK has a tax-funded healthcare system and therefore finite resources
• Key objectives of healthcare provider:– Ensure equality of access to healthcare– Generate the greatest health benefit from finite set of
resource
HCMR00008 / Date of Preparation October 2009
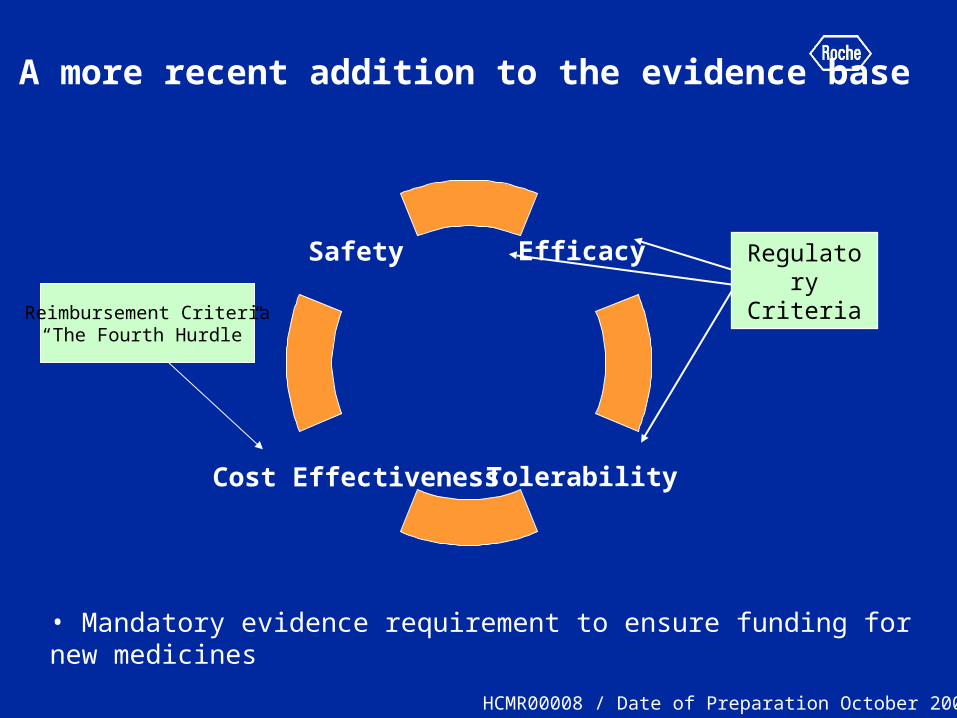
A more recent addition to the evidence base
Efficacy
Cost Effectiveness
Safety
Tolerability
Reimbursement Criteria“The Fourth Hurdle”
• Mandatory evidence requirement to ensure funding for new medicines
RegulatoryCriteria
HCMR00008 / Date of Preparation October 2009
What is Health Economics?
HCMR00008 / Date of Preparation October 2009
Some Definitions
• Economics– Study of the allocation of scarce resources
• Health Economics– Economic principles applied to healthcare
• Pharmacoeconomics– Economic principles applied to drug therapy
• Economic Evaluation– main decision making tool in economics– Economic evaluation is about efficiency and is:
‘the comparative analysis of alternative courses of action in terms of both their costs and consequences’ (Drummond, 1997)
– There are different types……
HCMR00008 / Date of Preparation October 2009
Types of economic evaluation
• Cost minimisation analysis– Equal outcomes / clinical benefit assumed– Which has lowest overall total costs?
• Cost Benefit analysis– Both costs and outcomes expressed in monetary value– Difficult to value all health benefits in monetary terms
• Cost Effectiveness analysis– Outcomes expressed in natural units– Cost per “% drop in blood pressure” / SRE avoided / cure
• Cost Utility analysis – Outcomes expressed in QALYs– Cross disease comparisons possible– What NICE use!– Considered current gold standard measure
HCMR00008 / Date of Preparation October 2009

Other types of Health Outcome analysis
• Epidemiological– Prevalence / incidence of disease
• Patient reported outcomes – Quality of life / Utility studies
• Descriptive Economic studies– Burden of disease analysis – long term cost
consequences of disease– Budget impact analysis – cost of treatment / drug– Resource utilisation / time and motion studies
• However for decision making require full economic evaluation – E.g. Cost Utility analysis
HCMR00008 / Date of Preparation October 2009
Principles and methods of Cost Effectiveness analysis
HCMR00008 / Date of Preparation October 2009
Understanding the principle of cost effectiveness analysis
• Gold standard method:– Cost Utility analysis which utilises the “cost per
QALY” or “incremental cost per QALY” (ICER)
• Methodology to formally evaluate the value for money of a given healthcare technology
• Value for money = “Efficiency”
• A misunderstood phrase……
HCMR00008 / Date of Preparation October 2009
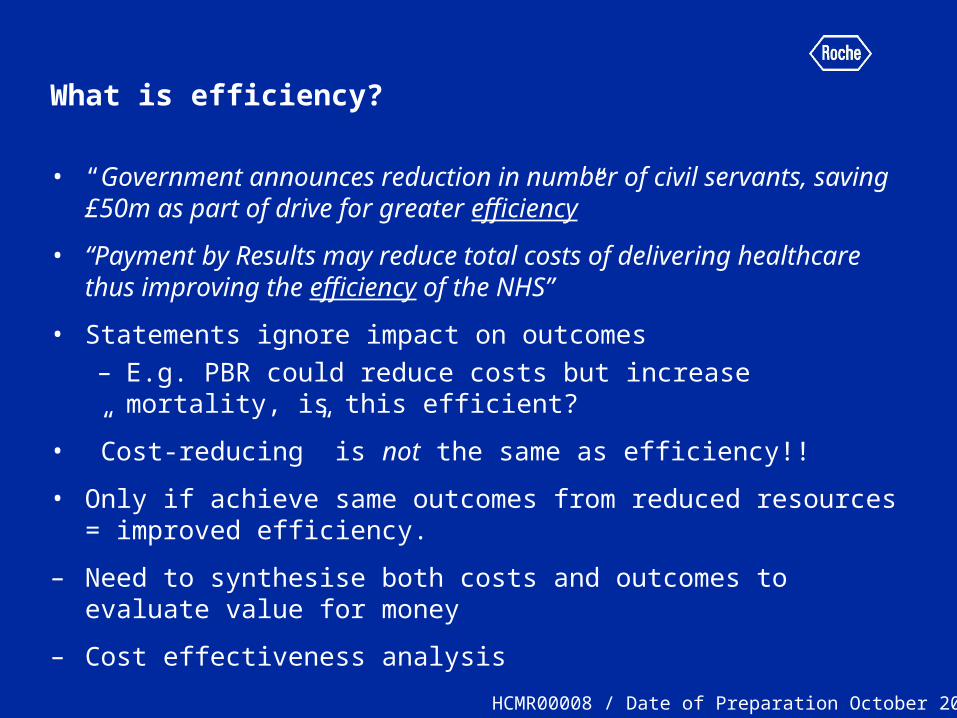
What is efficiency?
• “Government announces reduction in number of civil servants, saving £50m as part of drive for greater efficiency”
• “Payment by Results may reduce total costs of delivering healthcare thus improving the efficiency of the NHS”
• Statements ignore impact on outcomes– E.g. PBR could reduce costs but increase mortality, is this
efficient?
• ”Cost-reducing” is not the same as efficiency!!
• Only if achieve same outcomes from reduced resources = improved efficiency.
– Need to synthesise both costs and outcomes to evaluate value for money
– Cost effectiveness analysisHCMR00008 / Date of Preparation October 2009

Decision making principles
• When judging value for money we naturally evaluate things in increments…
• Purchasing a new home…is it a good buy?
1. What else is available? (Identify options)
2. What is extra cost? (Purchase, stamp duty, repair etc)
3. What is extra benefit? (Location, Size etc)
• Key principle:– We can not judge value for
money in isolation - need to compare
• Principles of Cost Effectiveness Analysis no different!
HCMR00008 / Date of Preparation October 2009
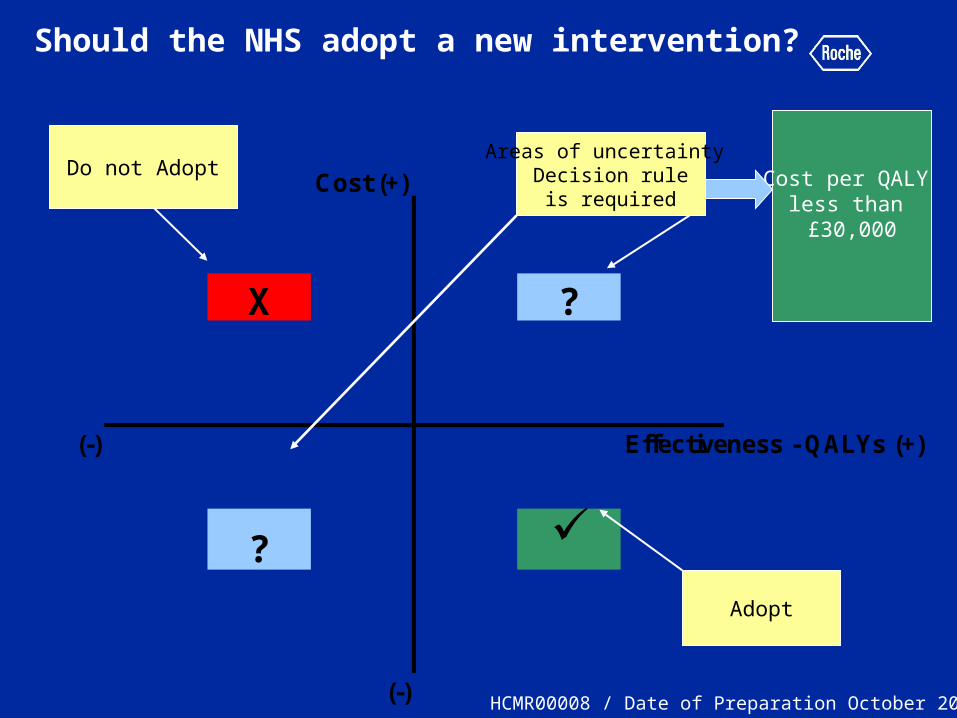
Should the NHS adopt a new intervention?
Cost (+)
X ?
(-) Effectiveness - QALYs (+)
?
(-)
Areas of uncertainty Decision rule
is required
Do not Adopt
Adopt
Cost per QALY less than £30,000
HCMR00008 / Date of Preparation October 2009
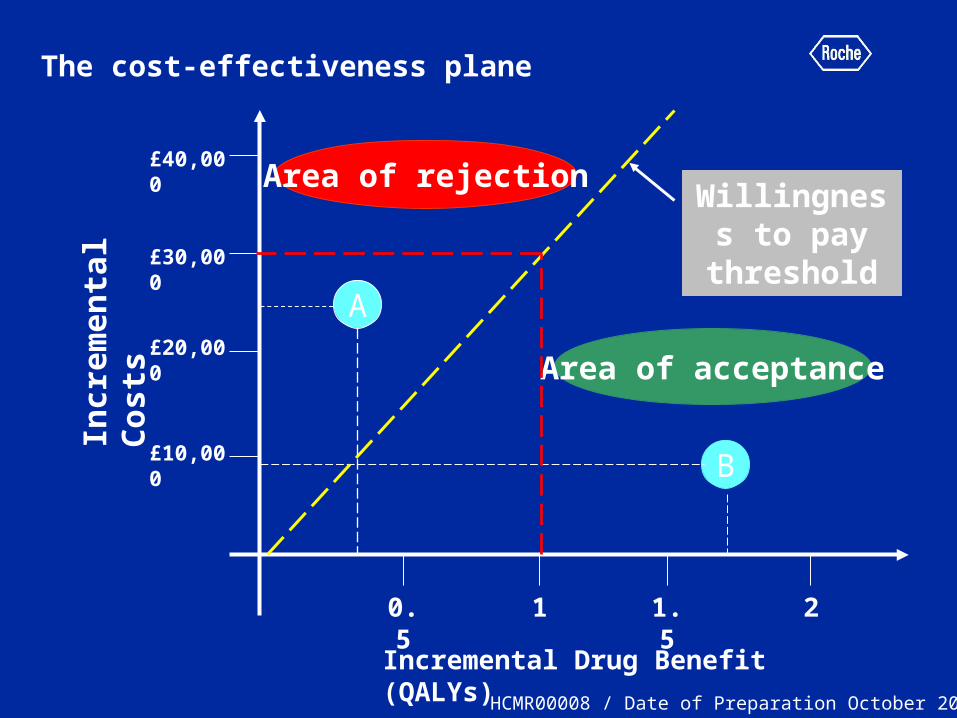
The cost-effectiveness plane
£20,000
Incr
emen
tal
Co
sts
£10,000
£30,000
£40,000
Incremental Drug Benefit (QALYs)
0.5 1 1.5 2
B
Willingness to pay
thresholdA
Area of acceptance
Area of rejection
HCMR00008 / Date of Preparation October 2009
Cost Effectiveness Threshold
• Currently defined as £20,000 - £30,000 by NICE
• No fixed threshold
• Poor evidence base behind threshold
• Subject to ongoing research
• Defines how much society is “willing to pay” to obtain a gain in health outcome (1 additional QALY)– Too high: displace more CE interventions with
greater health benefit for same money– Too low: inhibit health improvements /
innovation
HCMR00008 / Date of Preparation October 2009
What is a Cost per QALY?
HCMR00008 / Date of Preparation October 2009
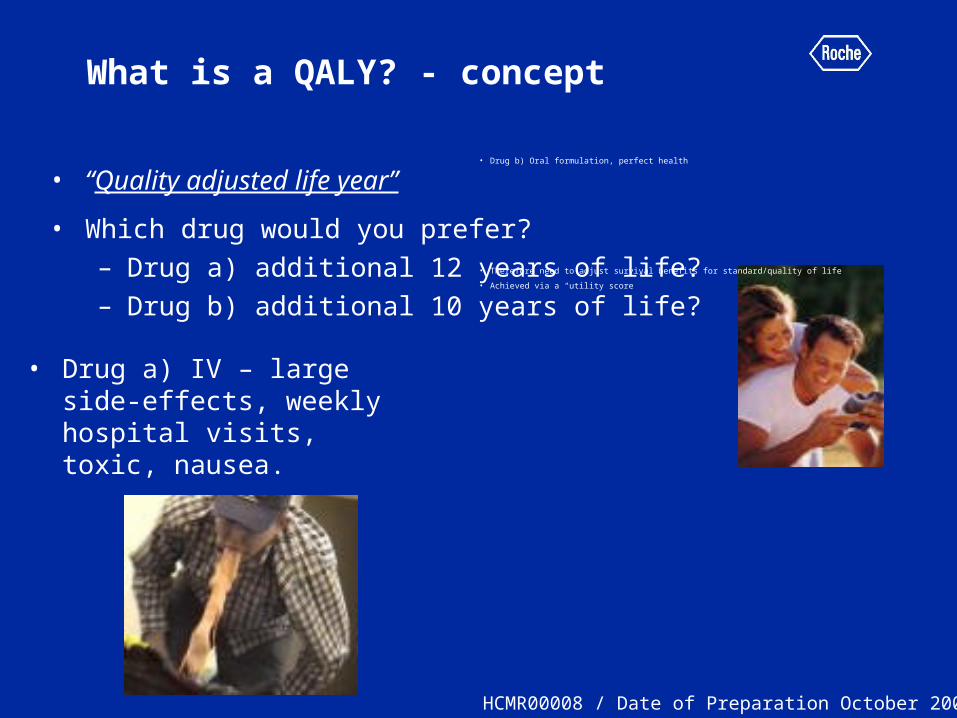
What is a QALY? - concept
• “Quality adjusted life year”
• Which drug would you prefer?– Drug a) additional 12 years of life?– Drug b) additional 10 years of life?
• Drug a) IV – large side-effects, weekly hospital visits, toxic, nausea.
• Drug b) Oral formulation, perfect health
• Therefore need to adjust survival benefits for standard/quality of life
• Achieved via a “utility score”
HCMR00008 / Date of Preparation October 2009

Utility Scores
• Way of capturing Quality of Life in Cost Effectiveness Analysis
• Measured on a scale of 0 to 1
• 1 = Perfect Health
• 0 = Death– Negative values possible
• Captured through patient reported generic quality of life instruments
– EQ-5D, SF-36
• Can be applied across all disease areas and variety of health states
By placing a tick in one box in each group below, please indicate which statements best describe your own health state today. Mobility I have no problems in walking about I have some problems in walking about I am confined to bed Self-Care I have no problems with self-care I have some problems washing or dressing myself I am unable to wash or dress myself Usual Activities (e.g. work, study, housework, family or leisure activities) I have no problems with performing my usual activities I have some problems with performing my usual activities I am unable to perform my usual activities Pain/Discomfort I have no pain or discomfort I have moderate pain or discomfort I have extreme pain or discomfort Anxiety/Depression I am not anxious or depressed I am moderately anxious or depressed I am extremely anxious or depressed
HCMR00008 / Date of Preparation October 2009
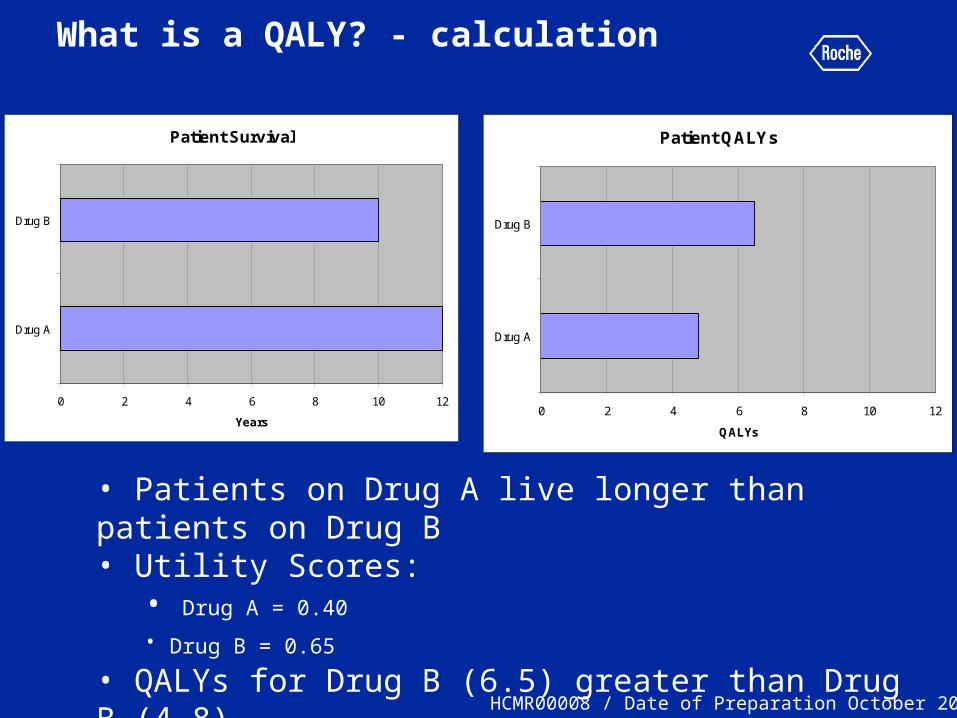
What is a QALY? - calculation
• Patients on Drug A live longer than patients on Drug B• Utility Scores:
• Drug A = 0.40
• Drug B = 0.65 • QALYs for Drug B (6.5) greater than Drug B (4.8)
Patient Survival
0 2 4 6 8 10 12
Drug A
Drug B
Years
Patient QALYs
0 2 4 6 8 10 12
Drug A
Drug B
QALYs
HCMR00008 / Date of Preparation October 2009
Cost per QALY
• Standardised measure to assess the value for money of a health intervention
• “How much additional NHS money is required to produce an additional QALY using the intervention under question?”
• Cost per QALY is therefore a COMPARATIVE measure– Additional costs and benefits relative to
chosen comparator
HCMR00008 / Date of Preparation October 2009
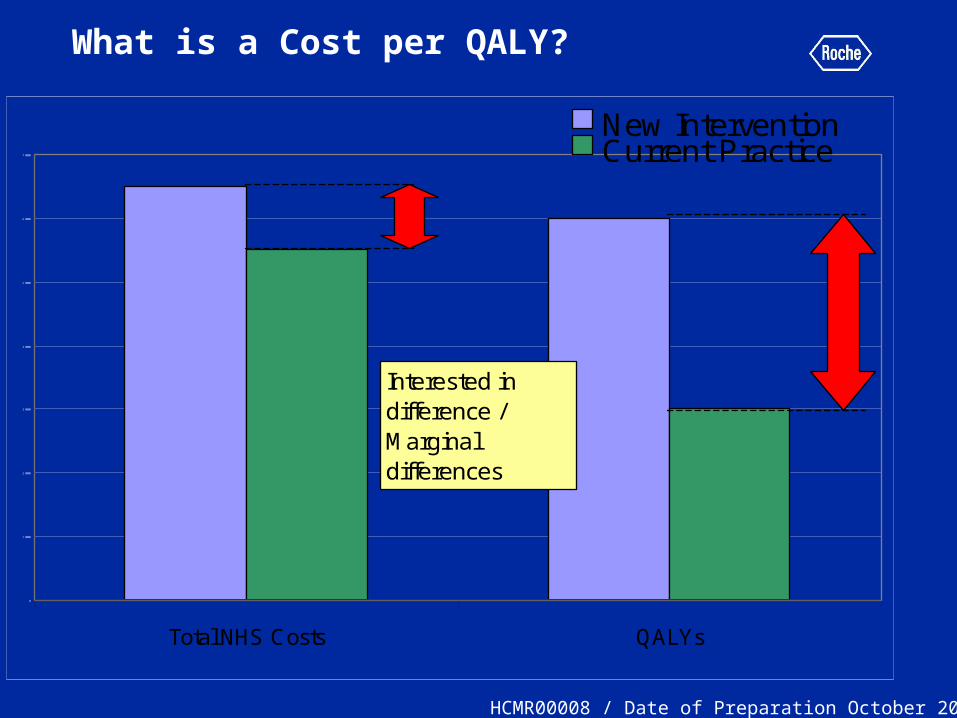
What is a Cost per QALY?
0
1 0000
2 0000
3 0000
4 0000
5 0000
6 0000
7 0000
Total NHS Costs QALYs
New InterventionCurrent Practice
Interested in difference / Marginal differences
HCMR00008 / Date of Preparation October 2009
How do you calculate a cost per QALY?
HCMR00008 / Date of Preparation October 2009
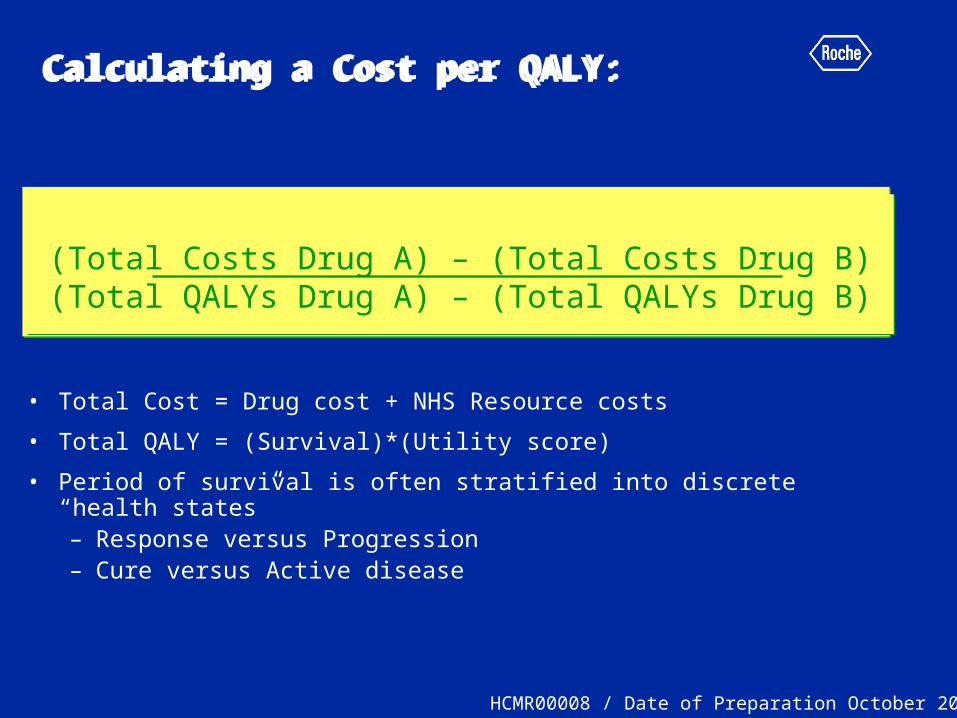
Calculating a Cost per QALY:
• Total Cost = Drug cost + NHS Resource costs
• Total QALY = (Survival)*(Utility score)
• Period of survival is often stratified into discrete “health states” – Response versus Progression– Cure versus Active disease
(Total Costs Drug A) – (Total Costs Drug B)(Total QALYs Drug A) – (Total QALYs Drug B)
(Total Costs Drug A) – (Total Costs Drug B)(Total QALYs Drug A) – (Total QALYs Drug B)
HCMR00008 / Date of Preparation October 2009
Calculating a Cost per QALY:
(Total Costs Drug A) – (Total Costs Drug B)(Total QALYs Drug A) – (Total QALYs Drug B)
(Total Costs Drug A) – (Total Costs Drug B)(Total QALYs Drug A) – (Total QALYs Drug B)
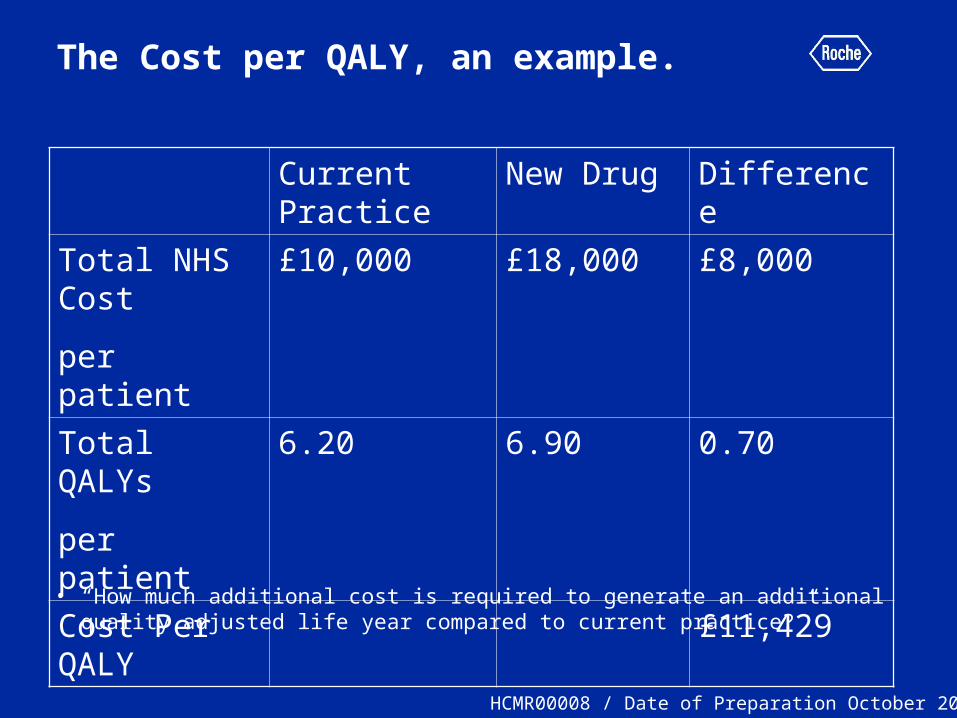
The Cost per QALY, an example.
• “How much additional cost is required to generate an additional quality adjusted life year compared to current practice?”
Current Practice
New Drug Difference
Total NHS Cost
per patient
£10,000 £18,000 £8,000
Total QALYs
per patient
6.20 6.90 0.70
Cost Per QALY
£11,429
HCMR00008 / Date of Preparation October 2009
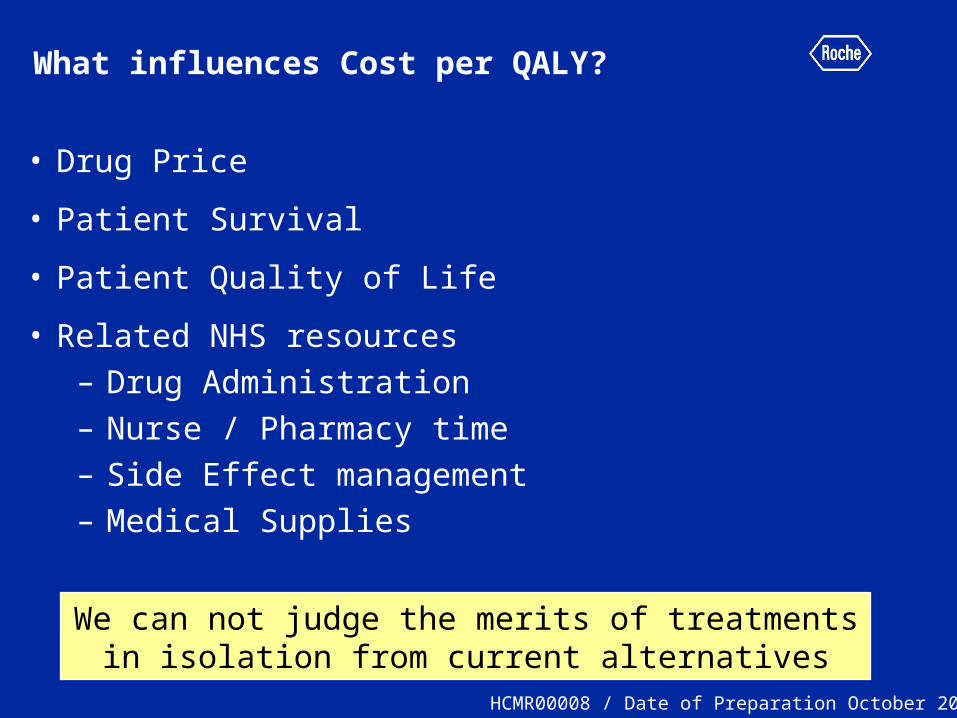
What influences Cost per QALY?
• Drug Price
• Patient Survival
• Patient Quality of Life
• Related NHS resources– Drug Administration– Nurse / Pharmacy time– Side Effect management– Medical Supplies
We can not judge the merits of treatments in isolation from current alternatives
HCMR00008 / Date of Preparation October 2009
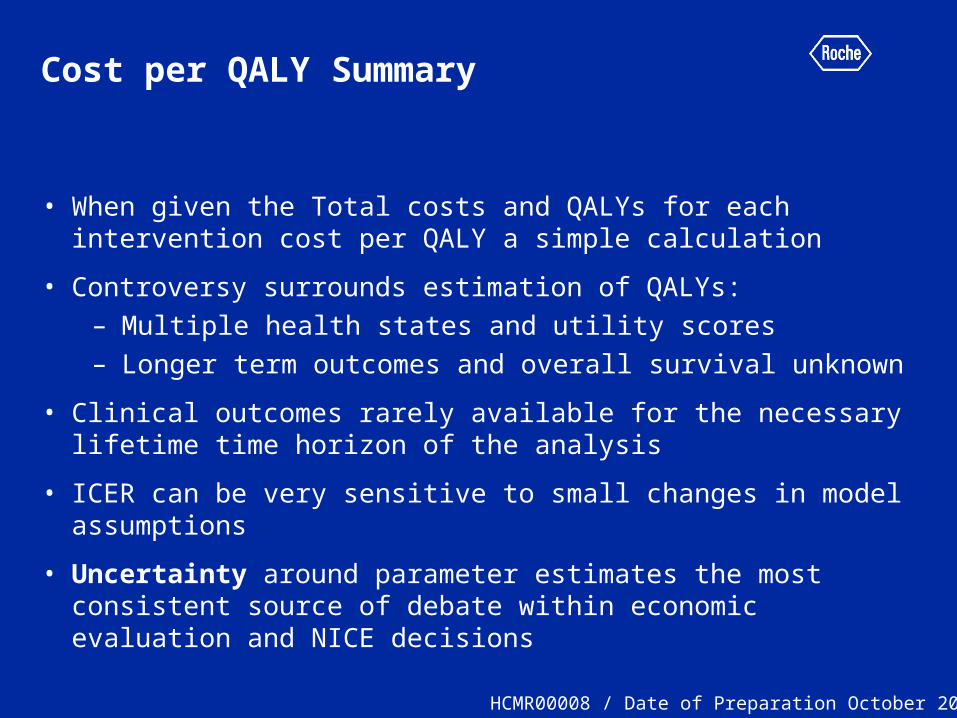
Cost per QALY Summary
• When given the Total costs and QALYs for each intervention cost per QALY a simple calculation
• Controversy surrounds estimation of QALYs:– Multiple health states and utility scores– Longer term outcomes and overall survival unknown
• Clinical outcomes rarely available for the necessary lifetime time horizon of the analysis
• ICER can be very sensitive to small changes in model assumptions
• Uncertainty around parameter estimates the most consistent source of debate within economic evaluation and NICE decisions
HCMR00008 / Date of Preparation October 2009
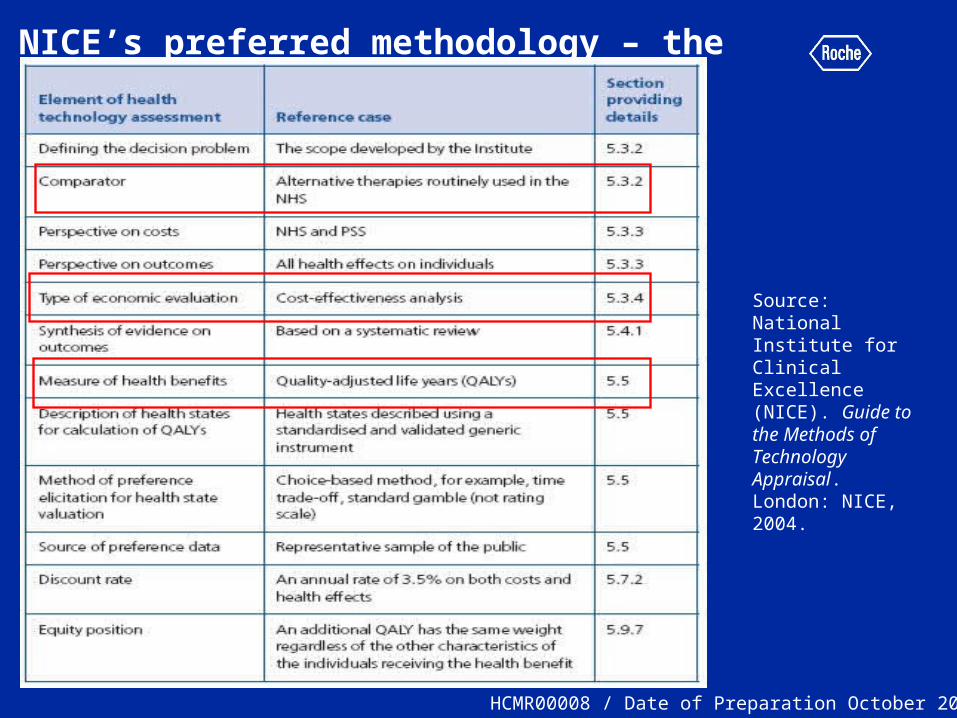
NICE’s preferred methodology – the Reference Case
Source: National Institute for Clinical Excellence (NICE). Guide to the Methods of Technology Appraisal. London: NICE, 2004.
HCMR00008 / Date of Preparation October 2009
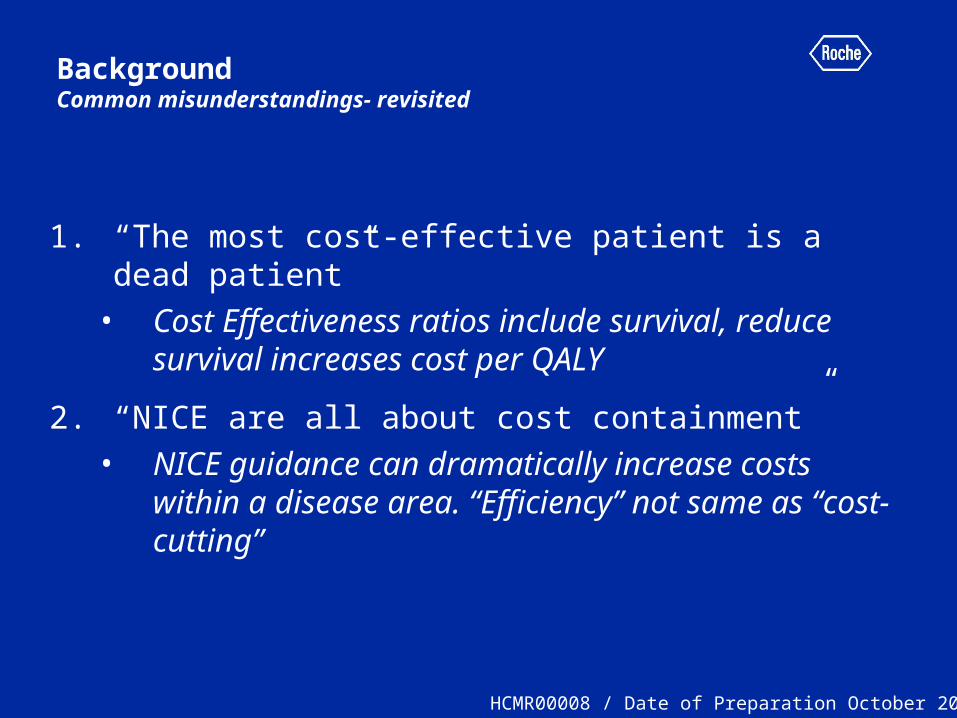
Background Common misunderstandings- revisited
1. “The most cost-effective patient is a dead patient”
• Cost Effectiveness ratios include survival, reduce survival increases cost per QALY
2. “NICE are all about cost containment”• NICE guidance can dramatically increase costs
within a disease area. “Efficiency” not same as “cost-cutting”
HCMR00008 / Date of Preparation October 2009
Background Health Economic Myths - Revisited
3. “Cheaper drugs are the more cost effective drugs”
• Cost Effectiveness takes into account the benefits generated by a given drug
4. “Cost Effectiveness analysis doesn't consider the patient’s quality of life”
• The “QALY” is the outcome measure of CE analysis
HCMR00008 / Date of Preparation October 2009

Health Economics and Oncology
HCMR00008 / Date of Preparation October 2009
Key Challenges
1. Methodology Limitations and Oncology– EQ-5D sensitivity– Dynamic CE ratio– Variation in threshold by patient characteristics
2. Oncology Clinical Trial Design– Comparator– PFS and OS relationship (Cross-over)– Quality of Life outcomes– Sub Groups / Personalised Medicine– Means and Medians– Resource Use
HCMR00008 / Date of Preparation October 2009

Recent Developments
1. HTA Policy developments:– NICE End of Life Criteria– Kennedy Review– Pharmaceutical Oncology Initiative (POI)– PPRS innovation package– Patient Access Schemes
2. Regionalised HTA– Pre-NICE Health Economics requirements
HCMR00008 / Date of Preparation October 2009

Thank you
HCMR00008 / Date of Preparation October 2009

Back Up
HCMR00008 / Date of Preparation October 2009
End of Life Criteria
• Patients with less than 24 months life expectancy
• Additional 3 months survival from new treatment
• “Small patient numbers” (approx 7,000?)
• No alternative with comparable benefits
• Single indication
HCMR00008 / Date of Preparation October 2009