Embed Size (px)
Citation preview

Bachelor Thesis
Mélanie Feurer, Agronomy, International Agriculture, HAFL, Zollikofen Submitted to: Dr. Jürgen Blaser
Dr. Christoph Studer
Land use systems in Ghana's Central Region and their
potential for REDD+
Zollikofen, 29.11.2013

Land use systems in Ghana's Central Region and their potential for REDD+
1
Non-plagiarism Declaration I hereby declare that
I have read and understood the ‘SHL Code of Behaviour on the Use of Information Sources’
and am aware of the consequences of not respecting this Code;
I have written this thesis in compliance with these principles;
this thesis is my own work and has not been written for me, in whole or in part, by any other
person(s).
Place, date ….……………………………………………………………………
Signature ………………………………………………………………………....
Land use systems in Ghana's Central Region and their potential for REDD+
2
Use of Semester Papers, Bachelor Theses and Minor Reports

Land use systems in Ghana's Central Region and their potential for REDD+
3
Acknowledgement First of all I would like to thank my advisors Dr. Jürgen Blaser and Dr. Christoph Studer for
their support and technical counsel. My gratitude also to Angela Deppeler and Kwame A.
Oduro for the organization of my stay and general support during my field assignment. Many
thanks to Dr. Victor Agyeman for his encouragement during my stay in Ghana. Special
thanks go to Lydia Afriyie for all the hard work on the field, introduction to the Ghanaian cul-
ture and friendship. My appreciation for Samson Adonteng for all the assistance on the field
and with the communities. I would especially like to thank Forster Amofah and Joseph
Amoako for their help with information on essential oil crops and support during my visits at
the Portal Plantation and Wellington Baiden for his cooperativeness and patience for my
questions. My gratitude to the chief of Bedum and all the farmers in the AOB district for their
time and good collaboration. Thanks also go to Emmanuel Appiah-Kubi for providing me with
contacts and to all the researchers at FORIG who helped me with technical information: Dr.
Stephen Adu-Bredu, Dr. Luke Anglaare, Jonathan Dabo, Dr. Ernest Foli and Dr. Lawrence
Damnyag.
Thanks also to Dr. Boateng Kyereh as well as to my fellow students Jacob Amoako and An-
gella Darko from KNUST. Additional thanks to Oliver Gardi and Christoph Kopp from HAFL
for giving me direction. Last but not least I would like to thank Lilith Treindl for correcting my
thesis.

Land use systems in Ghana's Central Region and their potential for REDD+
4
Contents
Non-plagiarism Declaration .............................................................................................................................. 1
Use of Semester Papers, Bachelor Theses and Minor Reports .......................................................................... 2
Acknowledgement ........................................................................................................................................... 3
Contents........................................................................................................................................................... 4
Abbreviations and Acronyms ........................................................................................................................... 6
List of tables ..................................................................................................................................................... 7
List of figures .................................................................................................................................................... 7
Abstract ........................................................................................................................................................... 8
1 Introduction ............................................................................................................................................. 9
2 Methodology ......................................................................................................................................... 10
2.1 Secondary Data .............................................................................................................................. 10
2.2 Primary Data .................................................................................................................................. 10
2.2.1 Key informant interviews ........................................................................................................... 10
2.2.2 Field measurements ................................................................................................................... 10
2.2.3 Carbon calculations .................................................................................................................... 11
2.2.4 Questionnaires........................................................................................................................... 12
2.2.5 Income calculations ................................................................................................................... 13
3 Background ............................................................................................................................................ 14
3.1 Ghana ............................................................................................................................................ 14
3.2 Asikuma-Odoben-Brakwa District ................................................................................................... 16
3.3 REDD+ ............................................................................................................................................ 17
3.3.1 Definition ................................................................................................................................... 17
3.3.2 Off-reserve REDD and the role of agroforestry............................................................................ 18
3.3.3 REDD+ in Ghana ......................................................................................................................... 19
3.4 Business as usual (BAU) .................................................................................................................. 19
4 Results and Discussion ........................................................................................................................... 20
Land use systems in Ghana's Central Region and their potential for REDD+
5
4.1 Classification of traditional land use systems .................................................................................. 20
4.2 Trees on farms ............................................................................................................................... 22
4.3 Carbon stocks and economic performance in different systems ....................................................... 23
4.3.1 Cocoa plantation ........................................................................................................................ 23
4.3.2 Oil palm plantation .................................................................................................................... 27
4.3.3 Citrus plantation ........................................................................................................................ 30
4.3.4 Rubber plantation ...................................................................................................................... 33
4.3.5 Portal Plantation and essential oil crops ..................................................................................... 36
5 Main discussion ..................................................................................................................................... 44
5.1 Comparison of land use systems ..................................................................................................... 44
5.2 Proposed land use systems for smallholders.................................................................................... 45
6 Conclusion ............................................................................................................................................. 48
7 Literature ............................................................................................................................................... 50
Annex ............................................................................................................................................................. 55

Land use systems in Ghana's Central Region and their potential for REDD+
6
Abbreviations and Acronyms AGB Above Ground live dry Biomass
AOB Asikuma-Odoben-Brakwa
ARC Agricultural Research Centre
BAU Business As Usual
BGB Below Ground live dry Biomass
CRIG Cocoa Research Institute of Ghana
CTA Technical Centre for Agriculture and Rural Co-operation
DAFF Department for Agriculture, Forestry and Fisheries (South Africa)
DBH Diameter at Breast Height
FAO Food and Agriculture Organization of the United Nations
FCPF Forest Carbon Partnership Facility
FIP Forest Investment Program
FORIG Forestry Research Institute of Ghana
GHC Ghanaian Cedi
GLP Global Land Project
GREL Ghana Rubber Estates Limited
HDI Human Development Index
ICRAF International Centre for Research in Agroforestry (World Agroforestry Centre)
INSEDA Integrated Sustainable Energy and Ecological Development Association
KNUST Kwame Nkrumah University of Science and Technology
MLNR Ministry of Lands and Natural Resources
MOFA Ministry of Food and Agriculture
MRV Measurement, Recording and Verification
NTFP Non-Timber Forest Products
PES Payment for Ecosystem Services
PET Potential Evapotranspiration
R-PIN Readiness Preparation Idea Note
R-PP Readiness Preparation Proposal
REDD+ Reducing Emissions from Deforestation and Forest Degradation and Enhanc-
ing Carbon Stocks
SECO State Secretariat for Economic Affairs
TNAU Tamil Nadu Agricultural University
UNDP United Nations Development Programme
UNIDO United Nations Industrial Development Organization
USD United States Dollar
Land use systems in Ghana's Central Region and their potential for REDD+
7
List of tables Table 1 Assumptions for income calculations for each crop ........................................................................... 14
Table 2 Top 10 tree species on plantation farms in the AOB district of Ghana................................................ 23
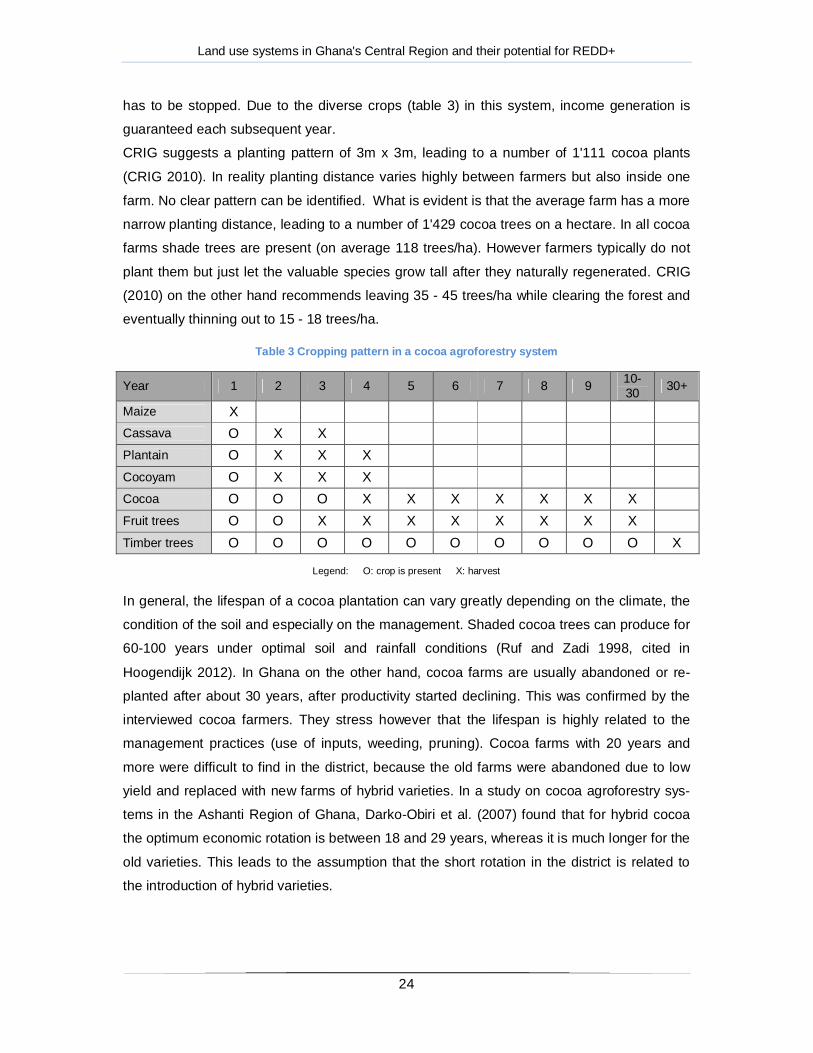
Table 3 Cropping pattern in a cocoa agroforestry system ............................................................................... 24
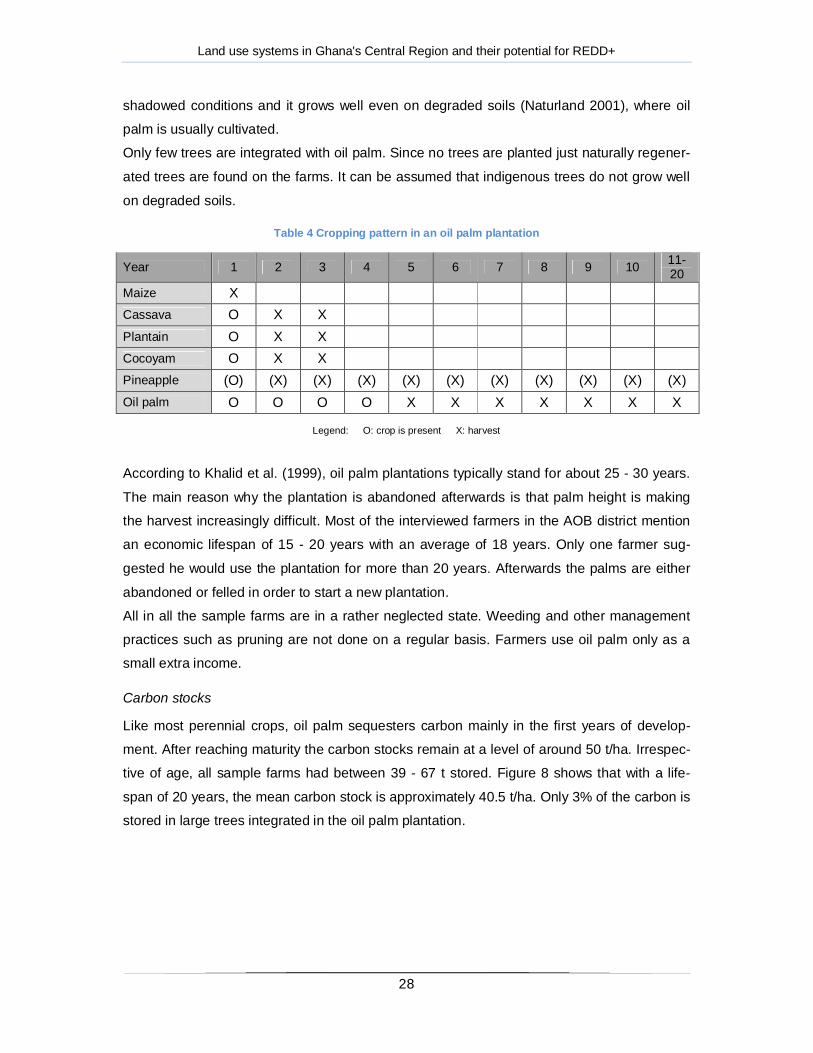
Table 4 Cropping pattern in an oil palm plantation ........................................................................................ 28
Table 5 Cropping pattern in a citrus plantation .............................................................................................. 31
Table 6 Cropping pattern in a rubber plantation ............................................................................................ 34
Table 7 Cropping systems at the Portal Plantation ......................................................................................... 38
Table 8 Advantages and disadvantages of selected essential oil crops (Nair 1980; Thankamani et al. 1994;
Nelson and Cannon-Eger 2011; Chandy no date; Bapat et al. 2012) ....................................................... 39
Table 9 Average carbon stocks at the Portal Plantation ................................................................................. 40
Table 10 Income at the Portal Plantation ....................................................................................................... 41
Table 11 Ranking of the different land use systems........................................................................................ 46
List of figures Figure 1 Characteristics of the sample population .......................................................................................... 13
Figure 2 Ecological zones of Ghana (Source: Stanturf et al. 2011) ................................................................... 15
Figure 3 Climate diagram, Asikuma ................................................................................................................ 16
Figure 4 The influence of land use systems on carbon stocks over time (Source: White 2011) ....................... 18
Figure 5 Mixed Cropping Systems in the AOB district ..................................................................................... 20
Figure 6 Percentage of farmers buying different foodstuffs on the market .................................................... 21
Figure 7 Carbon stocks in cocoa plantations ................................................................................................... 25
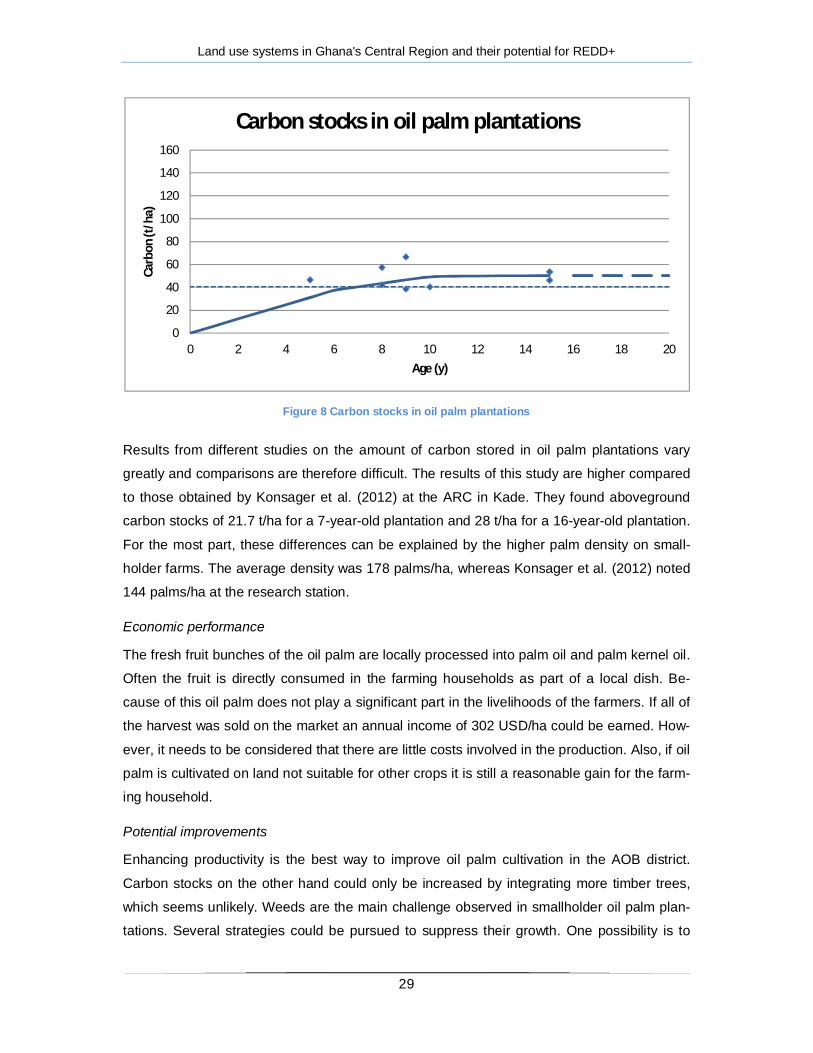
Figure 8 Carbon stocks in oil palm plantations ............................................................................................... 29
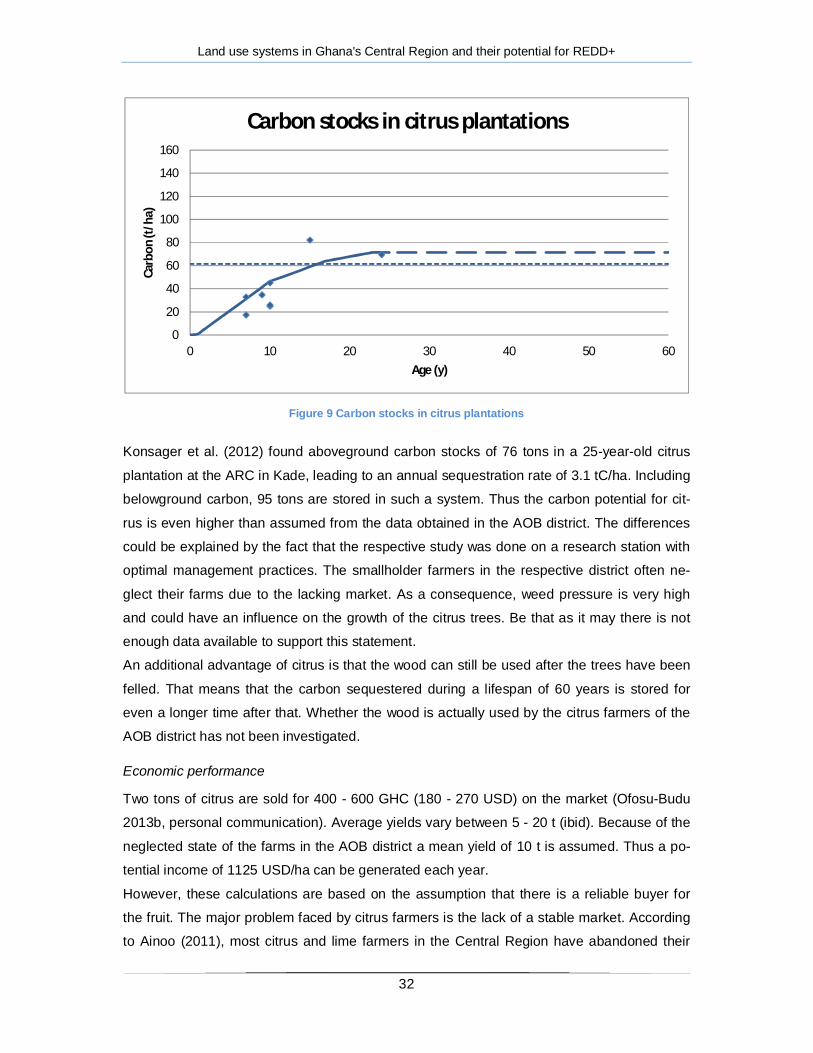
Figure 9 Carbon stocks in citrus plantations ................................................................................................... 32
Figure 10 Carbon stocks in rubber plantations ............................................................................................... 35
Figure 11 Map of the Portal Plantation, own illustration ................................................................................ 36
Figure 12 Carbon stocks at the Portal Plantation (approximate curve) ........................................................... 40
Figure 13 Comparison of the performance of different farm types................................................................. 44
Figure 14 Comparison of the performance of different land use systems ....................................................... 45
Land use systems in Ghana's Central Region and their potential for REDD+
8
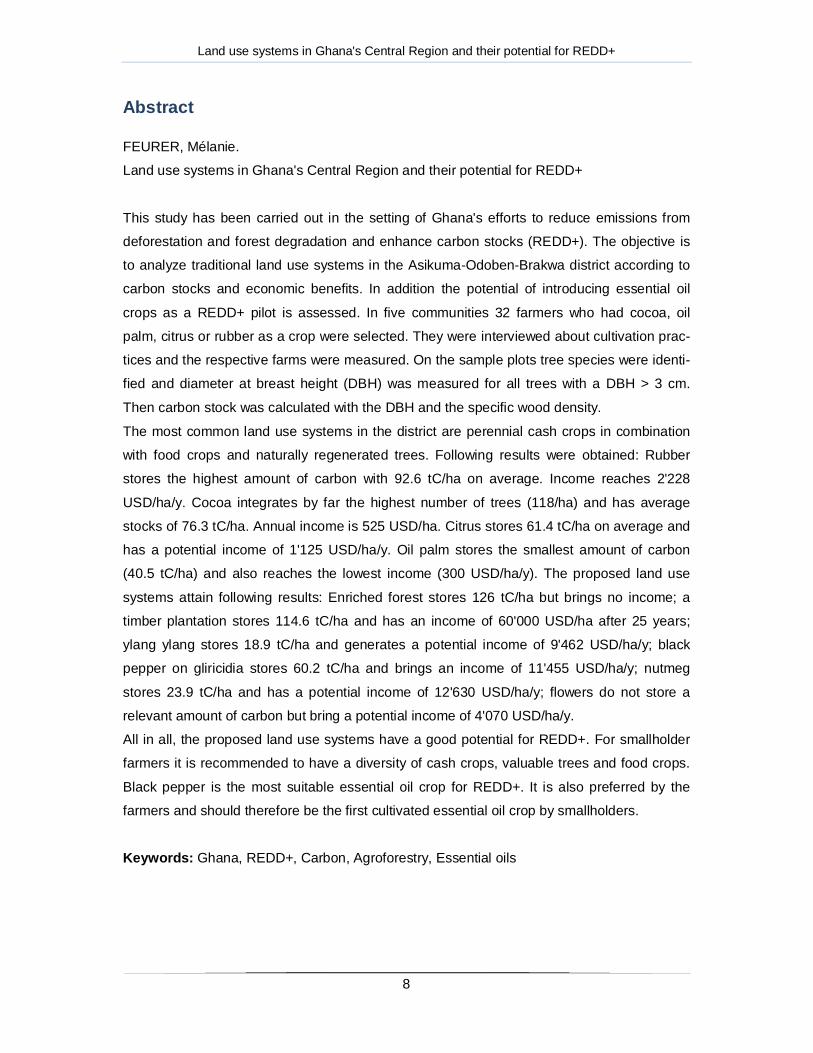
Abstract
FEURER, Mélanie.
Land use systems in Ghana's Central Region and their potential for REDD+
This study has been carried out in the setting of Ghana's efforts to reduce emissions from
deforestation and forest degradation and enhance carbon stocks (REDD+). The objective is
to analyze traditional land use systems in the Asikuma-Odoben-Brakwa district according to
carbon stocks and economic benefits. In addition the potential of introducing essential oil
crops as a REDD+ pilot is assessed. In five communities 32 farmers who had cocoa, oil
palm, citrus or rubber as a crop were selected. They were interviewed about cultivation prac-
tices and the respective farms were measured. On the sample plots tree species were identi-
fied and diameter at breast height (DBH) was measured for all trees with a DBH > 3 cm.
Then carbon stock was calculated with the DBH and the specific wood density.
The most common land use systems in the district are perennial cash crops in combination
with food crops and naturally regenerated trees. Following results were obtained: Rubber
stores the highest amount of carbon with 92.6 tC/ha on average. Income reaches 2'228
USD/ha/y. Cocoa integrates by far the highest number of trees (118/ha) and has average
stocks of 76.3 tC/ha. Annual income is 525 USD/ha. Citrus stores 61.4 tC/ha on average and
has a potential income of 1'125 USD/ha/y. Oil palm stores the smallest amount of carbon
(40.5 tC/ha) and also reaches the lowest income (300 USD/ha/y). The proposed land use
systems attain following results: Enriched forest stores 126 tC/ha but brings no income; a
timber plantation stores 114.6 tC/ha and has an income of 60'000 USD/ha after 25 years;
ylang ylang stores 18.9 tC/ha and generates a potential income of 9'462 USD/ha/y; black
pepper on gliricidia stores 60.2 tC/ha and brings an income of 11'455 USD/ha/y; nutmeg
stores 23.9 tC/ha and has a potential income of 12'630 USD/ha/y; flowers do not store a
relevant amount of carbon but bring a potential income of 4'070 USD/ha/y.
All in all, the proposed land use systems have a good potential for REDD+. For smallholder
farmers it is recommended to have a diversity of cash crops, valuable trees and food crops.
Black pepper is the most suitable essential oil crop for REDD+. It is also preferred by the
farmers and should therefore be the first cultivated essential oil crop by smallholders.
Keywords: Ghana, REDD+, Carbon, Agroforestry, Essential oils

Land use systems in Ghana's Central Region and their potential for REDD+
9
1 Introduction Climate change is one of the major challenges the world is facing in the 21st century. In
tropical countries deforestation is the most significant factor for the emission of greenhouse
gases. At the same time, these countries are the most vulnerable towards the effects of cli-
mate change. In Ghana, the annual deforestation rate is estimated at an average of 2% with
an increasing trend between 1990 and 2010 (FAO 2010). Major drivers of deforestation and
forest degradation are agricultural expansion, logging, and mining (MLNR 2012).
In this setting several mitigation initiatives have been developed. One of them is REDD+, a
strategy to reduce emissions from deforestation and forest degradation and enhance carbon
stocks. Agroforestry production systems play a crucial role in this initiative. On the one hand
trees in agricultural landscapes serve as carbon sinks while at the same time improving the
microclimate. On the other hand they lead to a diversified income for the farmer. This leads
to a reduced vulnerability towards climatic changes. Ghana has been preparing for REDD+
since 2008. As part of the preparatory phase, seven pilot projects have been selected. One
of these pilots is the production of essential oils in the Asikuma-Odoben-Brakwa (AOB) dis-
trict in Central Region. The REDDES project, financed by the Swiss State Secretariat for
Economic Affairs (SECO), is a preparatory step to support the development and enhance-
ment of climate-smart production systems in the off-reserve area of Ghana. This study is
done in the framework of REDDES and aims to assess the existing land use systems in the
AOB district as well as the proposed system with the essential oil crops and to rate them ac-
cording to their potential as carbon sinks and their economic performance. The research
questions are the following:
- Which are the existing land use systems in the AOB district?
- What are the carbon stocks and the economic performance of each land use system?
- Which are possible improvements in the land use and what is their impact?
- What is the potential of the essential oils project as a REDD+ pilot?
The hypothesis is that the cultivation of essential oil crops is more profitable for farmers than
the existing crops. Carbon stocks are expected to increase if essential oil crops are cultivated
in agroforestry production systems. The paper is structured as follows: First, the methods
and the research design are described in detail. Second, background information on the
study area and REDD+ is given. Third, the existing land use systems in the area are classi-
fied. Fourth, the results for each identified production system are presented and discussed.
Fifth, possible improvements for the land use in the AOB district are analyzed according to
their carbon and economic potential and recommendations for farmers are given. At the end
all findings are discussed and a conclusion is drawn for the potential for REDD+.
Land use systems in Ghana's Central Region and their potential for REDD+
10
2 Methodology
2.1 Secondary Data The literature review was done with documents from three different sources: The REDD+
project and collaborators, the FORIG library as well as the internet.
The climate diagram was based upon data from the program New_LocClim_1.10, which had
been developed by the Food and Agriculture Organization of the United Nations (FAO). As
reference for the concerned district served the meteorological station in Asikuma.
2.2 Primary Data
2.2.1 Key informant interviews Semi-structured key informant interviews were held in order to identify the traditional land
use systems in the area. Key informants were the chief deputy assistants for cocoa in the
region, the district agricultural officer from the Ministry Of Agriculture (MOFA), the assembly
man in Bedum as well as several farmers in the AOB district.
2.2.2 Field measurements For the carbon estimates only the living plant biomass was determined. An exact measure-
ment of all carbon pools (aboveground live biomass, belowground live biomass, dead bio-
mass and soil) was not possible with the resources available for this study. As suggested by
White (2011), priority was given to tree biomass, given that this is the biggest carbon pool in
agroforestry production systems. However, the most common cropping systems are planta-
tions, so the crop trees were included in the calculated carbon stock. The sample farms were
chosen in a convenience sampling design, using the snowball sampling method. In order to
make it more representative, the plots were distributed over the major communities (Asi-
kuma, Brakwa, Odoben) in the district. Additional sample plots were chosen in Bedum be-
cause of the location of the pilot as well as in Bonsunyina, a small community in the western
part of the district close to the district's forest reserves. Each plot was set as convenient as
possible inside a farm, which was influenced by the small and irregular farm size. Border
rows were left out. For measuring oil palm and citrus plantations, the plot size was 50m x
50m. A smaller plot size would not have been representative due to the wide planting dis-
tances. A larger plot size was not possible as most of the plantations are on a small scale
basis. For the cocoa and rubber farms the plot size was 20m x 20m because the planting
distance is smaller. This plot size allowed to do two replications per farm. For each of the
land use systems there were 8 replications altogether. The cocoa system was grouped into
three age categories: young (2 - 3 years), young mature (6 - 10 years) and mature (15 - 20

Land use systems in Ghana's Central Region and their potential for REDD+
11
years). In the youngest category not many trees can be found. That is why the research de-
sign was adjusted. Measurements were taken on the whole field. Afterwards the field size
was determined with a GPS device. For this category, four replications were made. For the
Portal Plantation, the plot size was 20m x 20m with two replications for each of the elements
(cedrela, ylang ylang, black pepper, nutmeg, conservation area). As for the system with black
pepper, only the stems of Gliricidia sepium were measured.
On the sample plots existing trees were identified and the diameter at breast height (DBH)
was measured for all trees with a minimum DBH of 3 cm. For the oil palm, tree height was
measured instead of the DBH. In each plot the number of oil palm trees was counted and five
trees were selected for the measurement. The stem height was estimated by holding a stick
with the length of 3 m next to the palm tree.
2.2.3 Carbon calculations
Biomass of trees
Total aboveground live dry tree biomass (AGB) was calculated using an allometric equation
with the DBH and the wood density. The model of Chave et al. (2005), also suggested in the
Field Guide for Forest Biomass and Carbon Estimation from the Woods Hole Research Cen-
tre (Walker et al. 2011) was used for this purpose:
AGBtree = (ρ*exp(-1.499+(2.148*ln(D))+(0.207*ln(D)2 - (0.0281*ln(D)3))*0.001
where p is the wood density in g/cm3 and D is the diameter at breast height in cm.
Where available, wood density parameters of the different species were taken from the wood
library of the Forestry Research Institute of Ghana (FORIG). Several species have not been
analyzed according to their wood properties by FORIG. For these species the mean density
was calculated from data of the Global Wood Density Database (Zanne et al. 2009). For all
species where no data was found (e.g. fruit trees), an average wood density of 0.5 was as-
sumed.
Biomass of oil palm
Concerning palm trees the biomass is more closely related to height than to diameter (Pear-
son et al. 2005, cited in Kongsager et al. 2012). Observations on the sample plots also indi-
cate that the height does not only depend on the age of the plantation but rather on the man-
agement and assumingly the condition of the soil. Therefore it was decided to use an al-
lometric equation with height instead of age. The allometric equation suggested by Khalid et
al. (1999) was used for this purpose:
W = 725 + (197 * H)
where W is the total fresh weight in kg and H is the palm height in m.

Land use systems in Ghana's Central Region and their potential for REDD+
12
The function is based on a palm density of 136 stands/ha (Khalid et al. 1999). Even though
the planting distance on the sample plots is a bit shorter, the influence on the biomass of a
single tree is assumed to be insignificant and can therefore be ignored. As the equation cal-
culates the fresh weight, a ratio of 0.27 still has to be applied to arrive at the aboveground
live dry biomass, as suggested by Konsager et al. (2012).
Total Carbon
Total AGB/ha is calculated by adding the biomass of all single trees in a plot and then multi-
plying the result by 25 or 4 for the 20m x 20m and the 50m x 50m plot, respectively. As soon
as the AGB is known, the below ground biomass (BGB) can be estimated for all farms. For
this calculation a root-shoot ratio of 1:4 was used. Cairns et al. (1997) found that the mean
ratio for forests is around 0.26. A conversion factor of 0.5 from biomass to C is also recom-
mended by Asare (2013). Both aboveground and belowground biomass were added and
divided by 2 to receive the amount of carbon stored in a system.
At the end mean carbon stocks during a lifespan were calculated for each land use. For this
purpose an approximate growth curve was drawn for the respective crops. As reference
served the data collected on the field and literature of growth rates during different age cate-
gories.
All calculations and diagrams were done with Microsoft Excel. Due to the small sample size
as well as high variation a statistical analysis was not reasonable.
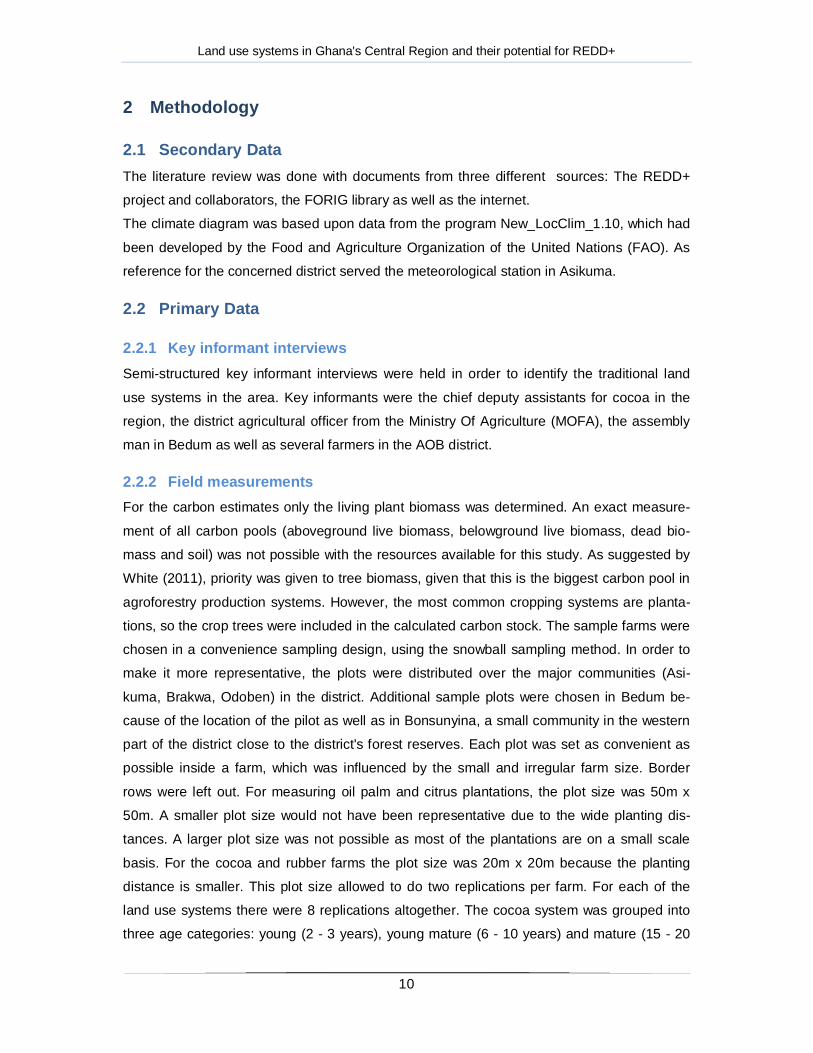
2.2.4 Questionnaires For the socio-economic part of the analysis a questionnaire was filled in for each farm. A total
of 32 farmers (26 male and 6 female) were interviewed. Out of these, 12 had cocoa, 8 citrus,
8 oil palm and 4 rubber. However, most of the interviewed people had several farmlands of
the respective crop as well as other crops. The questions were answered for the farm that
was also measured. Remarkable about the characteristics of the sample population (figure 1)
is the good education level. Almost all farmers had visited school and most of them even
went to junior high or have a higher degree of education. On the other hand, it is assumed
that through the sampling method mostly better educated farmers were chosen for the ques-
tionnaires, so the 32 farmers should not be considered representative for the entire district.
Land use systems in Ghana's Central Region and their potential for REDD+
13
Figure 1 Characteristics of the sample population
2.2.5 Income calculations The farmers' statements concerning yield, costs and prices of the crops were used to get an
overview of the situation in the district. They also served as a reference. To calculate the
income of the main crops standard yields and prices were used. Assumptions are depicted in
table 1. Costs were not included for comparison. Instead it is assumed that they are similar
for the four most common farming systems. The exchange rate as of November 8th 2013
was applied, where 1 Ghanaian Cedi (GHC) is 0.45 United States Dollars (USD) (CoinMill
2013).
Portal Ltd is the company which started with the production of essential oil crops in Bedum.
For Portal Ltd different sources were consulted to find out average yields (Nelson and Can-
non-Eger 2011; Manner and Elevitch 2006; Anandaraj no date; Lemmens 2008). In addition,
the company's estimated production is used as a reference. Oil prices were taken from the
two different companies Aqua Oleum and NHR organic oils (Baiden no date). It is assumed
that Portal Ltd receives 60% of the end price. If farmers were to produce essential oil crops
or flowers and sell them to Portal Ltd, it is assumed that they get 50% off the price that the
company receives.
The assumptions for yield and price of each crop are illustrated in table 1.
Land use systems in Ghana's Central Region and their potential for REDD+
14
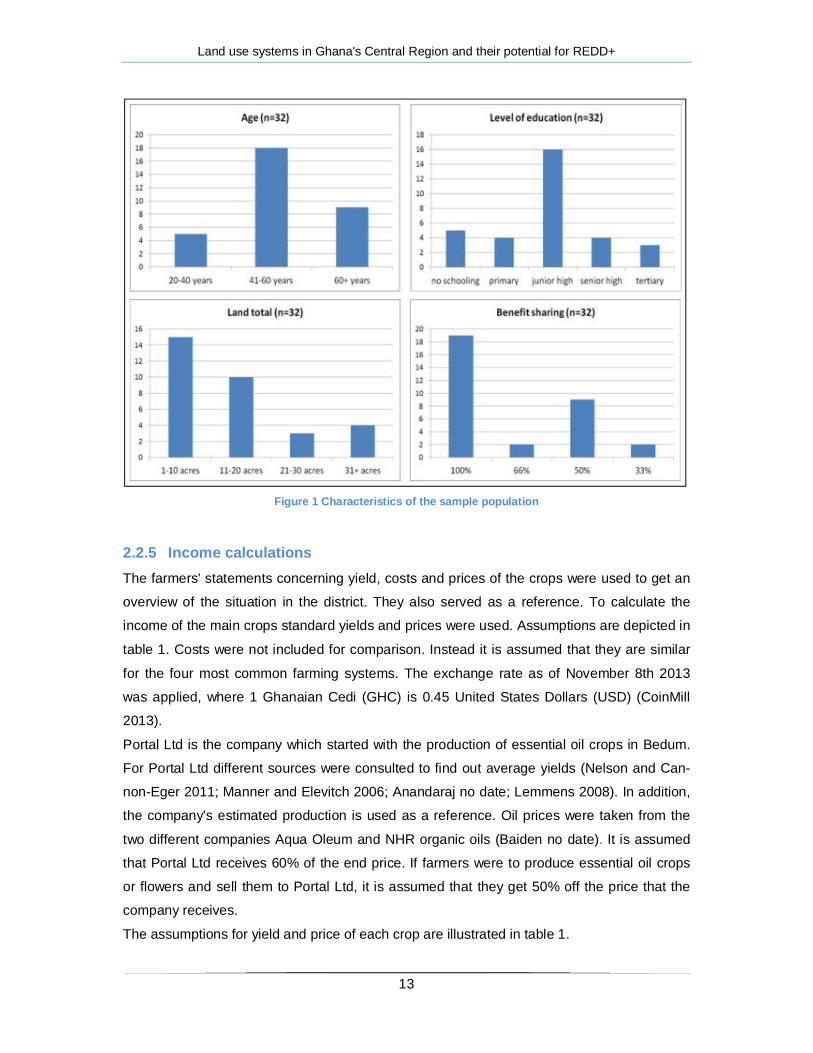
Table 1 Assumptions for income calculations for each crop
Crop Yield/ha/y Oil Yield
Price Comments Sources GHC USD
Cocoa 355 kg - 3.31/kg 1.48/kg 212 GHC/bag à 64kg
Hainmueller et al. 2011
Oil palm 5.6 t - 120/t 53.57/t Factfish 2013; Darko and Klossner 2013
Citrus 10 t - 250/t 112.5/t Ofosu-Budu 2013b, personal communication
Rubber 2'931 kg - 1.68/kg 0.76/kg
GREL 2013; Ofosu-Budu 2013a, personal communication
Cedrela 11.5 m3 - 463.69/m3 207/m3 Lemmens 2008
Ylang ylang 6'000 kg 1% 1178/kg 525.88/kg
Baiden 2009; Manner and Elevitch 2006; Baiden no date
Black pepper 3'930 kg 1.8% 1226/kg 547.30/kg Nelson and Can-non-Eger 2011; Baiden no date
Nutmeg 1'625 kg 11% 505/kg 225.44/kg TNAU 2013, Baiden no date
Lemongrass 4'091 kg 0.55% 413/kg 184.37/kg - yield for inter-cropping
Chandy no date, Baiden no date
Patchouli 900 kg 2.5% 652/kg 291.06/kg - yield for inter-cropping
Chandy no date; Baiden no date
Citronella 10'000 kg 1% 326/kg 145.53 - yield for inter-cropping
Chandy no date; Baiden no date
Cinnamon 470 kg - 3360.10/kg 1500/kg - yield for inter-cropping
UNIDO and FAO 2005
Flowers 11'970 units - 1.5/unit 0.2/unit
Forster 2013b, personal communication
3 Background
3.1 Ghana
Country profile
Ghana is a West African country, bordering the Ivory Coast in the West, Burkina Faso in the
north and Togo in the east. The country is divided into ten administrative regions, which are
further divided into districts. Accra is the capital and Kumasi is the second largest city. Al-
most all of the area is lowland, with less than 10% being above 300 m (Allotey 2004).
The population reached 25.37 million in 2012 (World Bank 2013).
Ghana belongs to the lower middle income countries and had a GDP of 40.71 billion USD in
2012 (World Bank 2013). With a Human Development Index (HDI) of 0.558 the country is on

Land use systems in Ghana's Central Region and their potential for REDD+
15
rank 135 worldwide (UNDP 2013). The main economic activities are oil, agriculture, timber
processing and mining (MLNR 2012). Whereas the cultivation of cocoa, cassava, plantain,
cocoyam, oil palm and rubber as well as the processing of timber and mining predominate in
the high forest zone, the savannah zones are dominated by the cultivation of yam, maize and
cassava, plantation forestry, fuel wood production, shea nut collection and processing and
mineral exploitation (ibid).
Ghana can be broadly divided into three cli-
matic zones. Stanturf et al. (2011) divided it
further into six ecological zones (figure 2). The
humid zone is in the southwest of the country
with a natural vegetation of mainly deciduous
forest and a small part of evergreen forest.
The main agricultural crops in this area are
cocoa, cassava, plantain and maize. The tran-
sitional zone between the forest and the sa-
vannah has a subhumid climate. Here addi-
tionally to cocoa fruit like citrus and mango
and numerous food crops (yam, cassava,
plantain, groundnuts, maize) are produced.
Then in northern Ghana as well as in the
coastal areas the climate is semiarid and the
natural vegetation is savannah. The main agri-
cultural crops are cereals (maize, sorghum,
millet) and groundnuts.
Deforestation and Forest Degradation
In Ghana, several types of forest areas are distinguished: Off-reserve areas, protected areas,
forest reserves and others such as wetland sites, wildlife sanctuaries or dedicated forests
(World Bank 2006). Forest reserves are areas of primary and secondary forests as well as
forest plantations, which are under a management plan. Only admitted farms are allowed
(World Bank 2006). According to Tufuor (2012), there are a total of 266 forest reserves, out
of which 216 occur in the high-forest zone. Deforestation and forest degradation is a major
problem in Ghana. Timber contract areas cover both on- and off-reserve forests. FAO (2010)
estimated an annual deforestation rate of 2%. As a result there is not much intact forest left
outside the permanently protected forests (Tufuor 2012).
At present, Ghana's terrestrial carbon stocks have been estimated to be around 2 Gt,
whereby 1.7 Gt of total carbon is stored in above- and below-ground biomass while the rest
Figure 2 Ecological zones of Ghana (Source: Stanturf et al. 2011)
Land use systems in Ghana's Central Region and their potential for REDD+
16
is in the soils (MLNR 2012). The highest carbon density is found in natural forests of the
moist forest zones. There it can reach up to 200 tC/ha (ibid).
3.2 Asikuma-Odoben-Brakwa District
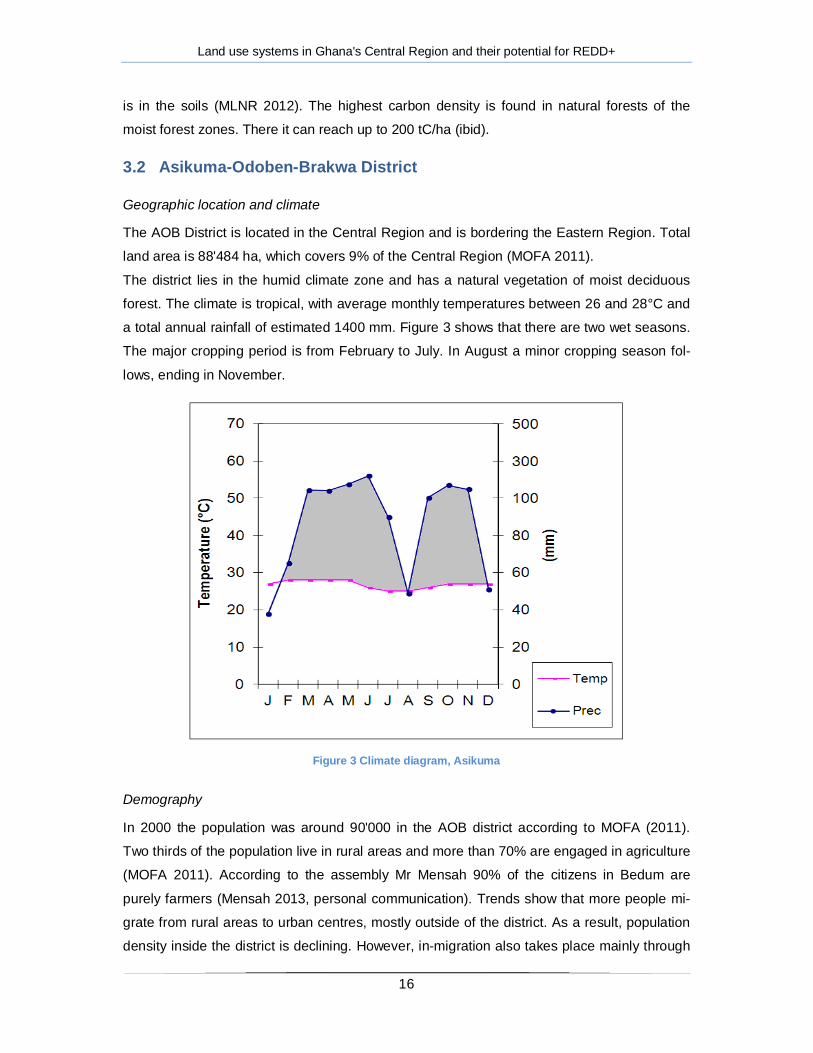
Geographic location and climate
The AOB District is located in the Central Region and is bordering the Eastern Region. Total
land area is 88'484 ha, which covers 9% of the Central Region (MOFA 2011).
The district lies in the humid climate zone and has a natural vegetation of moist deciduous
forest. The climate is tropical, with average monthly temperatures between 26 and 28°C and
a total annual rainfall of estimated 1400 mm. Figure 3 shows that there are two wet seasons.
The major cropping period is from February to July. In August a minor cropping season fol-
lows, ending in November.
Figure 3 Climate diagram, Asikuma
Demography
In 2000 the population was around 90'000 in the AOB district according to MOFA (2011).
Two thirds of the population live in rural areas and more than 70% are engaged in agriculture
(MOFA 2011). According to the assembly Mr Mensah 90% of the citizens in Bedum are
purely farmers (Mensah 2013, personal communication). Trends show that more people mi-
grate from rural areas to urban centres, mostly outside of the district. As a result, population
density inside the district is declining. However, in-migration also takes place mainly through

Land use systems in Ghana's Central Region and their potential for REDD+
17
cocoa farmers. It is estimated that 60-70% of the cocoa farmers in the district are migrants
(MOFA 2011).
Agriculture and Forestry
There are four forest reserves in the district, covering an area of almost 10'000 ha (MOFA
2011). Off-reserve forest is gradually lost through the conversion to agricultural land use, with
cocoa as the main crop.
The agricultural land area is 57'515 ha, out of which 35'394 ha are under cultivation (MOFA
2011). According to different sources (Mensah 2013, personal communication; Entwi and
Bernert 2013, personal communication), the land in the district is very fertile and suitable for
several different crops. Agriculture is purely rainfed, as is the case in all of Ghana. Mechani-
zation is in general very low.
Existing land tenure systems in the AOB district are leaseholds and sharecropping. Lease-
holds are usually given for 30 or 99 years. As a rule, sharecropping agreements are made for
the duration of a plantation, i.e. 20 to 60 years. Tenants either receive half (abunu) or one
third (abusa) of the harvest, while the land owner receives the rest.
3.3 REDD+
3.3.1 Definition Climate change mitigation is the overall goal behind REDD+. The assumption is that CO2-
emissions can be mitigated through the conservation or planting of trees which sequester
carbon during their lifespan. The Forest Carbon Partnership Facility (FCPF 2013) defines
REDD+ as "countries' efforts to reduce emissions from deforestation and forest degradation,
and foster conservation, sustainable management of forests, and enhancement of forest car-
bon stocks." The objective of REDD+ is to reverse the trend of forest conversion to other
land uses, mainly agriculture, and to encourage forest conservation in developing countries
by rewarding participating individuals, communities and governments with carbon finance
originating from developed countries (Mantlana 2011). It is thus a form of payment for eco-
system services (PES). These payments will come in the form of incentives for the communi-
ties to reduce the rate of forest conversion and degradation and to change land use man-
agement (Asare 2013).
The emphasis is not only on climate change mitigation actions but also on adaptation strate-
gies for the forest communities and the farmers. Climate change issues are linked with pro-
poor development in tropical countries. It is seen as a "win-win approach to reducing defores-
tation while also alleviating poverty of vulnerable communities" (Mbow et al. 2012).
Land use systems in Ghana's Central Region and their potential for REDD+
18
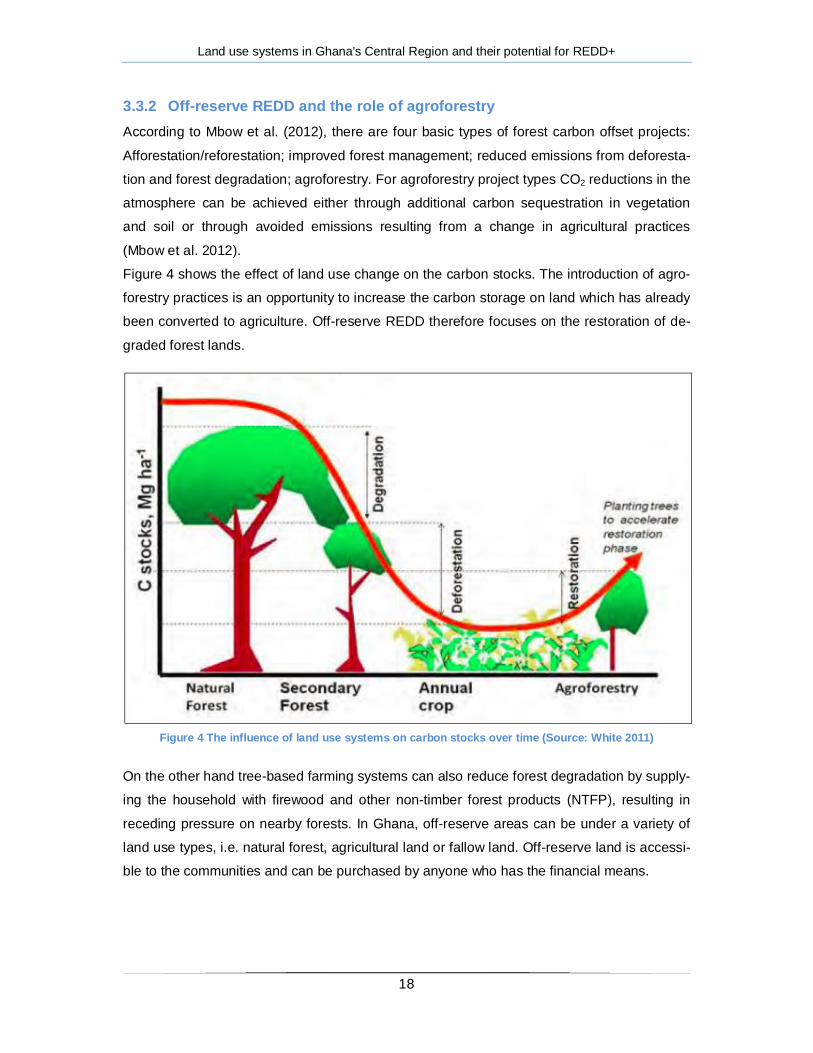
3.3.2 Off-reserve REDD and the role of agroforestry According to Mbow et al. (2012), there are four basic types of forest carbon offset projects:
Afforestation/reforestation; improved forest management; reduced emissions from deforesta-
tion and forest degradation; agroforestry. For agroforestry project types CO2 reductions in the
atmosphere can be achieved either through additional carbon sequestration in vegetation
and soil or through avoided emissions resulting from a change in agricultural practices
(Mbow et al. 2012).
Figure 4 shows the effect of land use change on the carbon stocks. The introduction of agro-
forestry practices is an opportunity to increase the carbon storage on land which has already
been converted to agriculture. Off-reserve REDD therefore focuses on the restoration of de-
graded forest lands.
Figure 4 The influence of land use systems on carbon stocks over time (Source: White 2011)
On the other hand tree-based farming systems can also reduce forest degradation by supply-
ing the household with firewood and other non-timber forest products (NTFP), resulting in
receding pressure on nearby forests. In Ghana, off-reserve areas can be under a variety of
land use types, i.e. natural forest, agricultural land or fallow land. Off-reserve land is accessi-
ble to the communities and can be purchased by anyone who has the financial means.

Land use systems in Ghana's Central Region and their potential for REDD+
19
3.3.3 REDD+ in Ghana Ghana has engaged in the REDD process since Bali 2007 (Kwakye 2011). The first official
steps were in 2008, when the FCPF approved of the country's REDD+ Readiness Prepara-
tion Idea Note (R-PIN). Afterwards the Readiness Preparation Proposal (R-PP) was submit-
ted to FCPF and approved in 2010. An FCPF Readiness Grant of 3.6 Mio USD was signed
(Kwakye 2011) and in 2012 the REDD+ Readiness Programme was officially started. The
framework for the programme implementation is divided in three phases. Phase 1 started in
2010. In phase 1 the national REDD+ strategy, policies and measures are defined. Capacity
building is also taking place in this phase. In Phase 2 (2012 - 2013) the REDD+ strategy and
the policies and measures are established. Further capacity building, technology develop-
ment and transfer as well as demonstration activities and pilots are implemented. Phase 3 is
starting in 2013 with the implementation of specific actions. In this phase full measurement,
reporting and verification (MRV) is required.
3.4 Business as usual (BAU) In the AOB district the primary driver of deforestation is the expansion of smallholder agricul-
ture. Secondary drivers are population pressure, low agricultural productivity and the promo-
tion of plantation crops which cannot accommodate food crops after canopy closure.
The BAU scenario for the AOB district is that all of the off-reserve land is gradually converted
to agricultural land uses. Most of the forest land has been cleared already in order to culti-
vate cocoa or other cash crops. This means that most of the land available for purchase are
farms that had been abandoned after their productive cycle. Seeing that farmers try to ex-
pand their land in order to plant food crops as well as increase the production of economic
crops, all of the land will be used for agricultural purposes in the future. The result is that the
highest share of land will be occupied by tree crop plantations whereas a small part of the
area will be set aside for the cultivation of food crops. In this scenario, only few forest trees
would be left on the farmland.
In a separate study the carbon stocks on abandoned farms, secondary forests as well as
sacred groves in the AOB district were assessed. Amoako (2013b) found average carbon
stocks of 66.6 t/ha, whereas big differences between the types of vegetation were observed.
By far the highest amount of carbon is stored in sacred groves (206.9 t/ha). Degraded sec-
ondary forest has only 36.9 tC/ha stored on average. From the abandoned farms, cocoa
stored 52.4 tC/ha, oil palm 32.3 tC/ha and food crops only 4.3 tC/ha.
Due to the absence of a clear forest frontier and the composition of the landscape with inter-
spersed patches of agriculture or agroforestry with only few remnants of natural forest, a
strategy to increase carbon stocks and biodiversity on the existing farmland needs to be
Land use systems in Ghana's Central Region and their potential for REDD+
20
adopted (Kumar and Nair 2011). Complex agroforests are the most promising alternative. In
a REDD+ perspective the remaining degraded forestland should be restored.
4 Results and Discussion
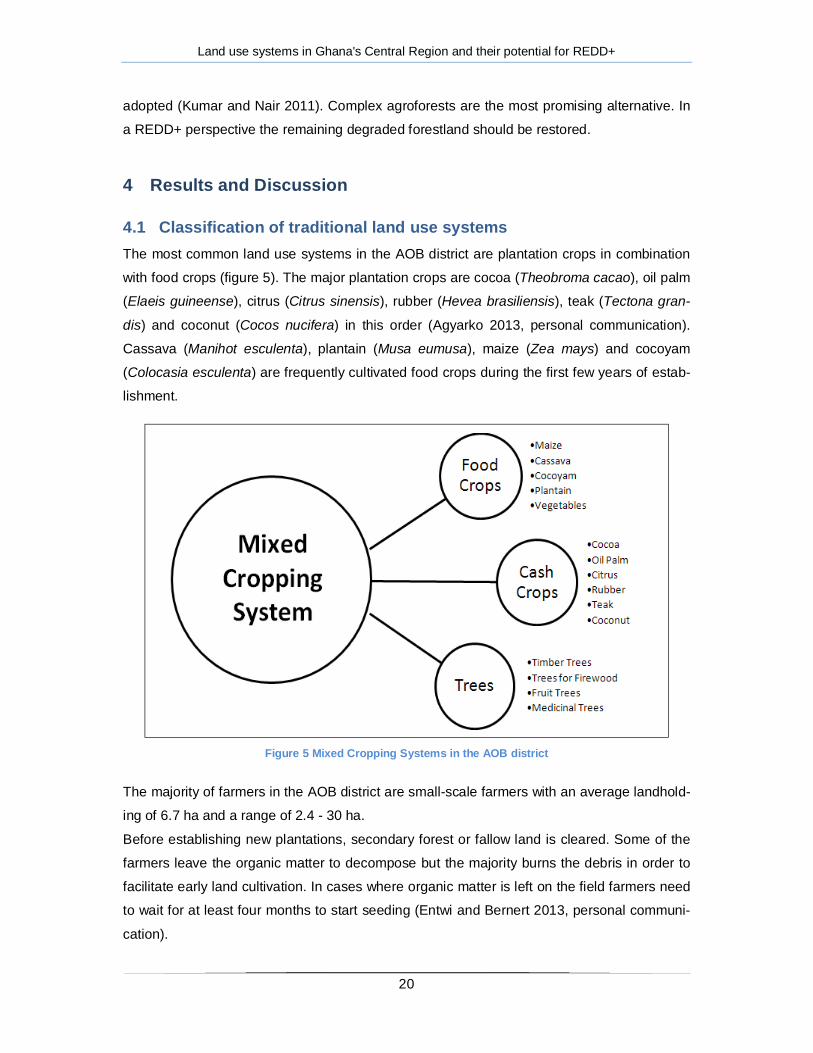
4.1 Classification of traditional land use systems The most common land use systems in the AOB district are plantation crops in combination
with food crops (figure 5). The major plantation crops are cocoa (Theobroma cacao), oil palm
(Elaeis guineense), citrus (Citrus sinensis), rubber (Hevea brasiliensis), teak (Tectona gran-
dis) and coconut (Cocos nucifera) in this order (Agyarko 2013, personal communication).
Cassava (Manihot esculenta), plantain (Musa eumusa), maize (Zea mays) and cocoyam
(Colocasia esculenta) are frequently cultivated food crops during the first few years of estab-
lishment.
Figure 5 Mixed Cropping Systems in the AOB district
The majority of farmers in the AOB district are small-scale farmers with an average landhold-
ing of 6.7 ha and a range of 2.4 - 30 ha.
Before establishing new plantations, secondary forest or fallow land is cleared. Some of the
farmers leave the organic matter to decompose but the majority burns the debris in order to
facilitate early land cultivation. In cases where organic matter is left on the field farmers need
to wait for at least four months to start seeding (Entwi and Bernert 2013, personal communi-
cation).

Land use systems in Ghana's Central Region and their potential for REDD+
21
A big difference between the plantation crops concerning the presence of timber trees can be
observed. In cocoa plantations a significantly higher amount of timber and fruit trees was
found compared to all of the other cropping systems. However, all of the plantations were
very heterogeneous concerning the planting distance of the tree crops and the number of
large trees integrated in the system.
Usually a household owns several farms, often with different types of plantation crops. La-
bour requirements do not interfere much between the two most common crops, cocoa and oil
palm. While the highest labour requirements for cocoa are between September and March,
most of the labour for oil palm is needed between February and July (Amoah et al. 1995).
Almost every farmer has at least one cocoa farm because of the stable market and fixed
price. The plantations usually differ in age, so that a household is able to plant food crops on
at least one of the farms each year. Yam on the other hand is commonly grown on small
plots separate from the other crops. A minority cultivates all food crops separately. Trends in
show that presently less land is used for the purpose of growing food crops than in the past.
Many farmers see this as a potential problem in the future. They observed an increase of
food prices in the last few years.
Figure 6 Percentage of farmers buying different foodstuffs on the market
Figure 6 indicates that mainly staple food crops which do not grow well in the AOB district
(rice, yam and beans) are bought on the market. Additionally, every fourth of the interviewed
farmers has to buy cassava and every fifth purchases maize on the market. These two are
the major crops associated with tree crops in the first years of the plantation. Vegetables (in-
Land use systems in Ghana's Central Region and their potential for REDD+
22
cluding cocoyam leaves) and fruit are only bought from time to time. Meat or fish is an impor-
tant part of the diet in Ghana, but in most cases in the AOB district the animals are not raised
by the consuming households themselves. Even though several farmers keep livestock
(mainly goats, sheep or chicken), they usually sell the live animals and in turn buy meat and
fish for consumption on the market. Only on special occasions an own animal is slaughtered.
Apart from the mixed plantation food crops system there is also small-scale vegetable pro-
duction with okra, garden eggs and tomatoes taking place in the district. A few farmers culti-
vate sugarcane as a cash crop or rice where the conditions are suitable.
In this study only the four most widespread traditional cropping systems are analyzed in de-
tail: Cocoa, oil palm, citrus and rubber.
4.2 Trees on farms As indicated by several studies concerning cocoa (Hirsbrunner 2012; Wade et al. 2010;
Asase et al. 2008) the most significant amount of carbon stored in mixed systems derives
from large trees such as old timber trees.
Most farmers keep some trees on their farms irrespective of the land use system. The num-
ber of trees per hectare however differs between the cropping systems. From the mature
sample farms, cocoa plantations integrate by far the highest number of timber and fruit trees
with an average of 118 trees/ha. The share of large trees with a DBH of 30 cm and more is
with 22% also the highest for cocoa. Citrus plantations rank second with 43 trees/ha (7%
large trees). Rubber and oil palm plantations integrate 25 and 17 trees/ha respectively. The
share of large trees is 12% for rubber and 6% for oil palm. The majority of trees are naturally
regenerated, since tree planting is not very common. Nevertheless, if cocoa farmers are pro-
vided with seedlings they are willing to plant them for shade. The preferred species for plant-
ing are Milicia excelsa, Terminalia superba and Terminalia ivorensis. They are characterized
by their fast growth rate as well as their value in the timber market. These are also the spe-
cies that are found the most desirable by the Cocoa Research Institute of Ghana (CRIG
2010).
In all sample plots a total of 48 different species were found. Because they were not planted
it shows that farmers are aware of the uses of different indigenous species. Even though the
diversity is high, there are a few dominant tree species. By far the most popular is Morinda
lucida, followed by Carica papaya and Rauvolfia vomitoria. Table 2 lists the most common
species as well as their prevalence in the sample plots and their uses. A table with all the
identified species can be found in the annex.
Land use systems in Ghana's Central Region and their potential for REDD+
23
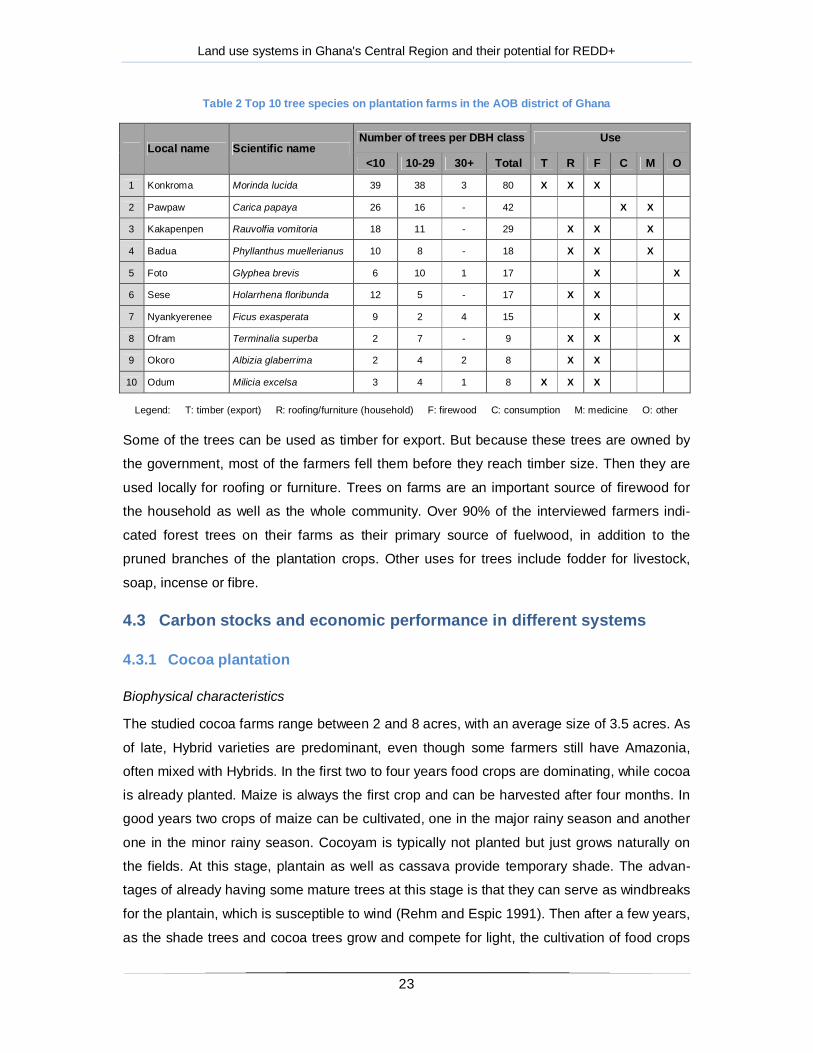
Table 2 Top 10 tree species on plantation farms in the AOB district of Ghana
Local name Scientific name Number of trees per DBH class Use
<10 10-29 30+ Total T R F C M O
1 Konkroma Morinda lucida 39 38 3 80 X X X
2 Pawpaw Carica papaya 26 16 - 42 X X
3 Kakapenpen Rauvolfia vomitoria 18 11 - 29 X X X
4 Badua Phyllanthus muellerianus 10 8 - 18 X X X
5 Foto Glyphea brevis 6 10 1 17 X X
6 Sese Holarrhena floribunda 12 5 - 17 X X
7 Nyankyerenee Ficus exasperata 9 2 4 15 X X
8 Ofram Terminalia superba 2 7 - 9 X X X
9 Okoro Albizia glaberrima 2 4 2 8 X X
10 Odum Milicia excelsa 3 4 1 8 X X X
Legend: T: timber (export) R: roofing/furniture (household) F: firewood C: consumption M: medicine O: other
Some of the trees can be used as timber for export. But because these trees are owned by
the government, most of the farmers fell them before they reach timber size. Then they are
used locally for roofing or furniture. Trees on farms are an important source of firewood for
the household as well as the whole community. Over 90% of the interviewed farmers indi-
cated forest trees on their farms as their primary source of fuelwood, in addition to the
pruned branches of the plantation crops. Other uses for trees include fodder for livestock,
soap, incense or fibre.
4.3 Carbon stocks and economic performance in different systems
4.3.1 Cocoa plantation
Biophysical characteristics
The studied cocoa farms range between 2 and 8 acres, with an average size of 3.5 acres. As
of late, Hybrid varieties are predominant, even though some farmers still have Amazonia,
often mixed with Hybrids. In the first two to four years food crops are dominating, while cocoa
is already planted. Maize is always the first crop and can be harvested after four months. In
good years two crops of maize can be cultivated, one in the major rainy season and another
one in the minor rainy season. Cocoyam is typically not planted but just grows naturally on
the fields. At this stage, plantain as well as cassava provide temporary shade. The advan-
tages of already having some mature trees at this stage is that they can serve as windbreaks
for the plantain, which is susceptible to wind (Rehm and Espic 1991). Then after a few years,
as the shade trees and cocoa trees grow and compete for light, the cultivation of food crops
Land use systems in Ghana's Central Region and their potential for REDD+
24
has to be stopped. Due to the diverse crops (table 3) in this system, income generation is
guaranteed each subsequent year.
CRIG suggests a planting pattern of 3m x 3m, leading to a number of 1'111 cocoa plants
(CRIG 2010). In reality planting distance varies highly between farmers but also inside one
farm. No clear pattern can be identified. What is evident is that the average farm has a more
narrow planting distance, leading to a number of 1'429 cocoa trees on a hectare. In all cocoa
farms shade trees are present (on average 118 trees/ha). However farmers typically do not
plant them but just let the valuable species grow tall after they naturally regenerated. CRIG
(2010) on the other hand recommends leaving 35 - 45 trees/ha while clearing the forest and
eventually thinning out to 15 - 18 trees/ha.
Table 3 Cropping pattern in a cocoa agroforestry system
Year 1 2 3 4 5 6 7 8 9 10-30 30+
Maize X Cassava O X X Plantain O X X X Cocoyam O X X X Cocoa O O O X X X X X X X Fruit trees O O X X X X X X X X Timber trees O O O O O O O O O O X
Legend: O: crop is present X: harvest
In general, the lifespan of a cocoa plantation can vary greatly depending on the climate, the
condition of the soil and especially on the management. Shaded cocoa trees can produce for
60-100 years under optimal soil and rainfall conditions (Ruf and Zadi 1998, cited in
Hoogendijk 2012). In Ghana on the other hand, cocoa farms are usually abandoned or re-
planted after about 30 years, after productivity started declining. This was confirmed by the
interviewed cocoa farmers. They stress however that the lifespan is highly related to the
management practices (use of inputs, weeding, pruning). Cocoa farms with 20 years and
more were difficult to find in the district, because the old farms were abandoned due to low
yield and replaced with new farms of hybrid varieties. In a study on cocoa agroforestry sys-
tems in the Ashanti Region of Ghana, Darko-Obiri et al. (2007) found that for hybrid cocoa
the optimum economic rotation is between 18 and 29 years, whereas it is much longer for the
old varieties. This leads to the assumption that the short rotation in the district is related to
the introduction of hybrid varieties.
Land use systems in Ghana's Central Region and their potential for REDD+
25
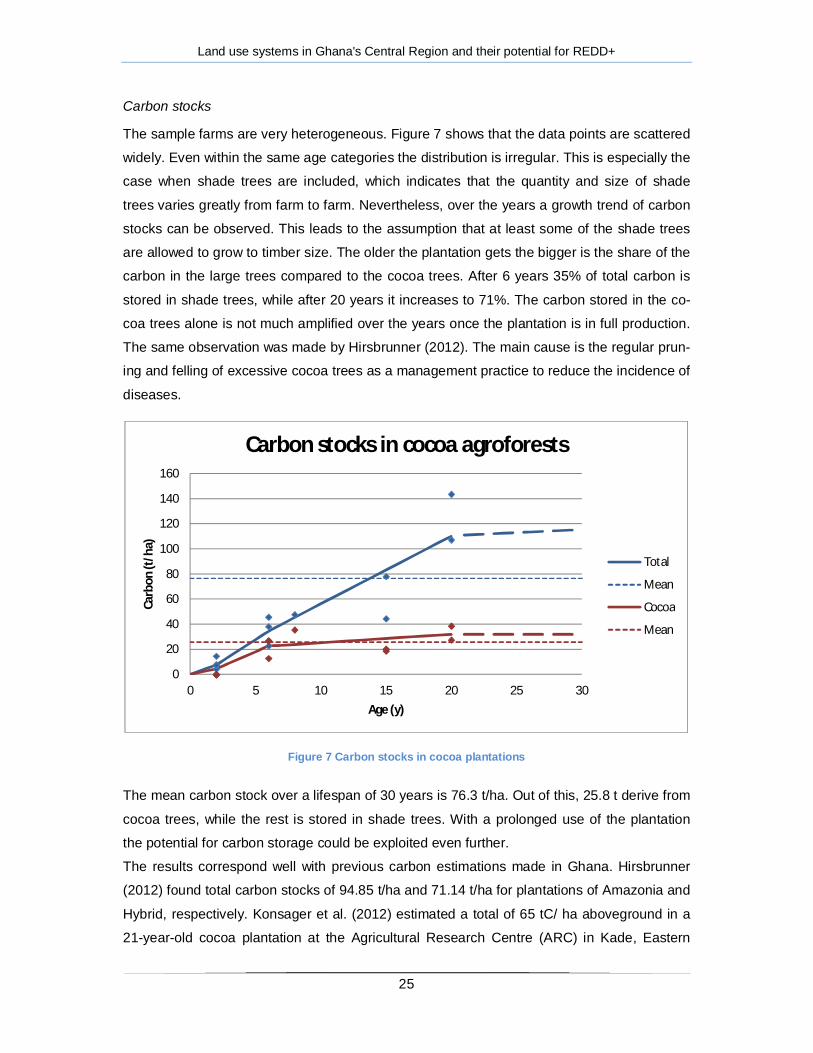
Carbon stocks
The sample farms are very heterogeneous. Figure 7 shows that the data points are scattered
widely. Even within the same age categories the distribution is irregular. This is especially the
case when shade trees are included, which indicates that the quantity and size of shade
trees varies greatly from farm to farm. Nevertheless, over the years a growth trend of carbon
stocks can be observed. This leads to the assumption that at least some of the shade trees
are allowed to grow to timber size. The older the plantation gets the bigger is the share of the
carbon in the large trees compared to the cocoa trees. After 6 years 35% of total carbon is
stored in shade trees, while after 20 years it increases to 71%. The carbon stored in the co-
coa trees alone is not much amplified over the years once the plantation is in full production.
The same observation was made by Hirsbrunner (2012). The main cause is the regular prun-
ing and felling of excessive cocoa trees as a management practice to reduce the incidence of
diseases.
Figure 7 Carbon stocks in cocoa plantations
The mean carbon stock over a lifespan of 30 years is 76.3 t/ha. Out of this, 25.8 t derive from
cocoa trees, while the rest is stored in shade trees. With a prolonged use of the plantation
the potential for carbon storage could be exploited even further.
The results correspond well with previous carbon estimations made in Ghana. Hirsbrunner
(2012) found total carbon stocks of 94.85 t/ha and 71.14 t/ha for plantations of Amazonia and
Hybrid, respectively. Konsager et al. (2012) estimated a total of 65 tC/ ha aboveground in a
21-year-old cocoa plantation at the Agricultural Research Centre (ARC) in Kade, Eastern
0
20
40
60
80
100
120
140
160
0 5 10 15 20 25 30
Carb
on (t
/ha)
Age (y)
Carbon stocks in cocoa agroforests
Total
Mean
Cocoa
Mean
Land use systems in Ghana's Central Region and their potential for REDD+
26
Region. Adding belowground carbon, the total would be 81 t. Isaac et al. (2007) found 20.55
tC/ha aboveground for 8-year-old cocoa under Milicia excelsa.
Economic performance
Generally cocoa yields in Ghana are very low compared to other countries. Hainmueller et al.
(2011) found a median yield of 355 kg/ha, which was confirmed by the farmers in the AOB
district. With a price of 212 GHC per bag of 64 kg, which was paid to them in 2012, the an-
nual income is 1176 GHC (529 USD).
Support from the government, a sure market and stable prices are the main reasons for
farmers to favour cocoa production over other cash crops. For small-scale farmers this is a
risk reduction strategy. Other motivations are the extension services provided by the Cocoa
Board or the cocoa farmers' association which has been formed in the district.
Potential improvements
For cocoa agroforestry systems there are basically two strategies for improvement, which are
not mutually exclusive: improving carbon stocks and raising productivity.
The farms have a high potential to improve carbon stocks through shade management. As
mentioned before, cocoa trees alone do not contribute much to the carbon stocks. Carbon
stock enhancement therefore has to come from large trees. If more shade is provided, the
planting distance of the cocoa trees needs to be adjusted in order to avoid too much humidity
and therefore high disease pressure. Possibilities are the retention of valuable timber species
or the systematic planting of other perennials such as fruit trees. Fruit trees have several
advantages over timber trees: A much earlier income opportunity is possible, if consumed in
the household fruit can help improve the family's diet and the produce can be sold on local
markets. In case the essential oils project is implemented in Bedum, tourism would also be
increasing. As a result the demand for local fresh fruit will rise and ensure a higher price for
the farmers. Possible local types are mango, papaya, citrus or guave. Exotic fruit species
could also be introduced. Ghanaian cocoa farmers appear to be very interested and willing to
try them out provided the seedlings are available (Deppeler and Feurer 2013). However,
more research has to be done on the effect of those trees on cocoa. To achieve a higher
shade level in the farms, other issues like tree tenure and capacity building in tree manage-
ment need to be addressed simultaneously.
Cocoa farms in the AOB district have considerably low yields. This means that the potential
for improvement is very high. With a strategy to overcome this gap, the income per hectare
could be raised significantly. The high number of cocoa trees on the farms are a possible
explanation for the low yield. With such a close spacing between the crop trees humidity in
the plantations is very high. As a result, disease pressure and the prevalence of fungi are

Land use systems in Ghana's Central Region and their potential for REDD+
27
amplified. It seems that humidity is primarily supported by the high density of cocoa trees and
less so by the few shade trees present in the system. As a measure to avoid this farmers
should reduce planting distances and thereby improve the yield of the remaining trees. This
procedure could at the same time be an incentive to leave more of the large trees on the
land, resulting in enhanced carbon sequestration. An additional benefit of healthier cocoa
plants is the prolonged lifespan. This is particularly for tenant farmers an incentive, since
their arrangement with the land owners lasts for as long as the perennial crop is productive.
When land is getting scarce and land prices are increasing it can be assumed that achieving
a long economic lifespan will become even more important.
Major constraints to achieving higher yields are low financial means for inputs as well as the
lack of communication between researchers and extension agents.
Potential for REDD+
The results highlight the importance of shade trees for carbon sequestration.
At the moment cocoa farms are acceptable but not very sustainable with a lifespan of 30
years. On the other hand, the potential is extremely high. With the integration of more large
trees this land use system is a promising alternative for REDD+. The focus needs to be on
complex agroforestry systems, where both carbon stocks and productivity can be increased
in the long term. Additional trees would also have the potential to prolong the lifespan of co-
coa plantations. These improvements require a close collaboration between researchers,
extension services and farmers.
4.3.2 Oil palm plantation
Biophysical characteristics
The entire oil palm production in the AOB district is carried out by smallholders. Not only the
cultivation but also the processing is done locally on a small-scale basis. None of the bigger
processing facilities in Ghana are within reach of the district. Farm sizes of the interviewed
farmers vary between 2 and 4 acres, with one exception of 17 acres.
Oil palm is often cultivated in swampy areas or on degraded lands where other crops do not
grow well. In these cases, food crops are not integrated in the farming system. Under normal
conditions, according to Nuertey (2000, cited in Nuertey et al. 2009) smallholders cultivate
food and cash crops in the initial three years of the oil palm establishment. In the AOB dis-
trict, where oil palm is grown on fertile land, maize, cassava, plantain and cocoyam are culti-
vated for up to five years (table 4). In addition, on the sample plots it was observed that pine-
apple is often found scattered on oil palm farms and irrespective of the age of the plantation.
Pineapple is suitable for intercropping with oil palm for two reasons: It prefers semi-
Land use systems in Ghana's Central Region and their potential for REDD+
28
shadowed conditions and it grows well even on degraded soils (Naturland 2001), where oil
palm is usually cultivated.
Only few trees are integrated with oil palm. Since no trees are planted just naturally regener-
ated trees are found on the farms. It can be assumed that indigenous trees do not grow well
on degraded soils.
Table 4 Cropping pattern in an oil palm plantation
Year 1 2 3 4 5 6 7 8 9 10 11-20
Maize X Cassava O X X Plantain O X X Cocoyam O X X Pineapple (O) (X) (X) (X) (X) (X) (X) (X) (X) (X) (X) Oil palm O O O O X X X X X X X
Legend: O: crop is present X: harvest
According to Khalid et al. (1999), oil palm plantations typically stand for about 25 - 30 years.
The main reason why the plantation is abandoned afterwards is that palm height is making
the harvest increasingly difficult. Most of the interviewed farmers in the AOB district mention
an economic lifespan of 15 - 20 years with an average of 18 years. Only one farmer sug-
gested he would use the plantation for more than 20 years. Afterwards the palms are either
abandoned or felled in order to start a new plantation.
All in all the sample farms are in a rather neglected state. Weeding and other management
practices such as pruning are not done on a regular basis. Farmers use oil palm only as a
small extra income.
Carbon stocks
Like most perennial crops, oil palm sequesters carbon mainly in the first years of develop-
ment. After reaching maturity the carbon stocks remain at a level of around 50 t/ha. Irrespec-
tive of age, all sample farms had between 39 - 67 t stored. Figure 8 shows that with a life-
span of 20 years, the mean carbon stock is approximately 40.5 t/ha. Only 3% of the carbon is
stored in large trees integrated in the oil palm plantation.
Land use systems in Ghana's Central Region and their potential for REDD+
29
Figure 8 Carbon stocks in oil palm plantations
Results from different studies on the amount of carbon stored in oil palm plantations vary
greatly and comparisons are therefore difficult. The results of this study are higher compared
to those obtained by Konsager et al. (2012) at the ARC in Kade. They found aboveground
carbon stocks of 21.7 t/ha for a 7-year-old plantation and 28 t/ha for a 16-year-old plantation.
For the most part, these differences can be explained by the higher palm density on small-
holder farms. The average density was 178 palms/ha, whereas Konsager et al. (2012) noted
144 palms/ha at the research station.
Economic performance
The fresh fruit bunches of the oil palm are locally processed into palm oil and palm kernel oil.
Often the fruit is directly consumed in the farming households as part of a local dish. Be-
cause of this oil palm does not play a significant part in the livelihoods of the farmers. If all of
the harvest was sold on the market an annual income of 302 USD/ha could be earned. How-
ever, it needs to be considered that there are little costs involved in the production. Also, if oil
palm is cultivated on land not suitable for other crops it is still a reasonable gain for the farm-
ing household.
Potential improvements
Enhancing productivity is the best way to improve oil palm cultivation in the AOB district.
Carbon stocks on the other hand could only be increased by integrating more timber trees,
which seems unlikely. Weeds are the main challenge observed in smallholder oil palm plan-
tations. Several strategies could be pursued to suppress their growth. One possibility is to
0
20
40
60
80
100
120
140
160
0 2 4 6 8 10 12 14 16 18 20
Carb
on (t
/ha)
Age (y)
Carbon stocks in oil palm plantations
Land use systems in Ghana's Central Region and their potential for REDD+
30
sow a (leguminous) cover crop between the oil palm (Nuertey et al. 2009). This would en-
hance soil fertility while at the same time suppress the growth of weeds. Providing farmers
with technical knowledge on cover crops and their management would be necessary. An-
other possibility is to introduce small ruminants in this system. Sheep rearing under tree crop
plantations is already practiced by some of the farmers and on research stations with a
stocking rate between 3 and 18 sheep/ha (Fianu et al. no date). For this purpose grass or
herb species can be sown under the oil palm and serve as fodder for the sheep. Advantages
are additional income generation, diversification of livelihoods, weed control and manure as
natural fertilizer. Constraints for adoption by the farmers are among others the absence of
fences and therefore damages to arable crops, lack of technical knowhow in livestock rear-
ing, lack of credit and limited access to breeding stock (Fianu et al. no date). A third option to
improve the yields is the use of mineral fertilizer, as oil palm needs a high amount of nutri-
ents to produce well (Nair 1980).
In any case, the importance of oil palm for the farmers still needs to be further assessed.
Seeing that oil palm is not a commercial crop in the district and typically grown on marginal
soils, it seems that improving cultivation practices is not the first priority of the farmers. As
long as oil palm is not sold on the market, the incentive to increase production is low. Also,
intensification is difficult on such a small scale.
Potential for REDD+
Oil palm is of little significance for REDD+ because of the low carbon sequestration and short
life cycle. In the AOB district the production is not yet commercialized, which is also a reason
for the low income possibilities. Therefore the emphasis should be laid on other crops. Nev-
ertheless, oil palm will continue to be important for smallholders due to its adaptability to less
fertile soils as well as its use in the local diet.
4.3.3 Citrus plantation
Biophysical characteristics
In the AOB district two Citrus spp are cultivated, usually on the same field: Citrus sinensis
(sweet orange) and Citrus nobilis (tangerine). The prevalence of sweet orange however is
much higher. The interviewed farmers' plantation size is between 1 - 4 acres except for one
farmer who had 11 acres of citrus.
In the first few years of plantation establishment the common food crops are cultivated, as
illustrated in table 5. A few farmers had plantain even in later stages with mature citrus, de-
pending on the planting distance of the tree crops. Between the citrus farmers, the number of
years the food crops stay on the field varies to a great extent.

Land use systems in Ghana's Central Region and their potential for REDD+
31
Table 5 Cropping pattern in a citrus plantation
Year 1 2 3 4 5 6 7 8 9 10-40
40-60
Maize X Cocoyam O X X X Cassava O X X X (X) Plantain O X X X (X) (X) Citrus O O O O O X X X X X (X)
Legend: O: crop is present X: harvest
All of the interviewed Citrus farmers stated that trees negatively affect the yield of the planta-
tion. Even though shade can be tolerated, maximum flowering occurs when citrus is grown in
full sun (Zekri 2011). Because of this not many timber trees are found on citrus farms. In any
case, they are not kept intentionally for a specific purpose. Most trees found on the sample
plots were on farms that were not actively managed. In general the majority of the citrus
farms have been neglected and are infested with weeds.
Even though some farmers said that a citrus plantation can produce for up to 100 years,
most trees have an economic lifespan of around 30 years (ICRAF no date). In the AOB dis-
trict plantations are normally kept for around 60 years.
After the citrus' economic lifespan the wood can still be used for planes (Irvine 1961). It is not
known however whether it is actually used in the district.
Carbon stocks
While tree growth rates are high from the second year onwards and then slow down after
fruiting becomes regular, typical tree size is reached after about 14 years (Manner et al.
2006). This prediction in relation with data obtained in the AOB district suggest that after
around 20 years a maximum of 71.5 tC are stored in the plantation. Due to the long eco-
nomic lifespan of 60 years, mean carbon stocks are 61.4 t/ha (figure 9). There are some
large trees found in the sample farms, forming part of the biomass. In fact 12% of total car-
bon is stored in trees other than citrus. The percentage is higher than in oil palm or rubber
plantations, but significantly lower than in cocoa farms.
Land use systems in Ghana's Central Region and their potential for REDD+
32
Figure 9 Carbon stocks in citrus plantations
Konsager et al. (2012) found aboveground carbon stocks of 76 tons in a 25-year-old citrus
plantation at the ARC in Kade, leading to an annual sequestration rate of 3.1 tC/ha. Including
belowground carbon, 95 tons are stored in such a system. Thus the carbon potential for cit-
rus is even higher than assumed from the data obtained in the AOB district. The differences
could be explained by the fact that the respective study was done on a research station with
optimal management practices. The smallholder farmers in the respective district often ne-
glect their farms due to the lacking market. As a consequence, weed pressure is very high
and could have an influence on the growth of the citrus trees. Be that as it may there is not
enough data available to support this statement.
An additional advantage of citrus is that the wood can still be used after the trees have been
felled. That means that the carbon sequestered during a lifespan of 60 years is stored for
even a longer time after that. Whether the wood is actually used by the citrus farmers of the
AOB district has not been investigated.
Economic performance
Two tons of citrus are sold for 400 - 600 GHC (180 - 270 USD) on the market (Ofosu-Budu
2013b, personal communication). Average yields vary between 5 - 20 t (ibid). Because of the
neglected state of the farms in the AOB district a mean yield of 10 t is assumed. Thus a po-
tential income of 1125 USD/ha can be generated each year.
However, these calculations are based on the assumption that there is a reliable buyer for
the fruit. The major problem faced by citrus farmers is the lack of a stable market. According
to Ainoo (2011), most citrus and lime farmers in the Central Region have abandoned their
0
20
40
60
80
100
120
140
160
0 10 20 30 40 50 60
Carb
on (t
/ha)
Age (y)
Carbon stocks in citrus plantations

Land use systems in Ghana's Central Region and their potential for REDD+
33
farms due to a lack of interested buyers and no managing unit for the sector. In earlier years
there used to be a processing facility close to the AOB district, but according to some of the
farmers, the timing of the transport caused problems. A big part of the produce got spoilt be-
cause of this. At present, farmers try selling to middlemen who bring the fresh fruit to sellers
on local markets. In these cases, there are no clear arrangements and the farm gate price is
very low.
Potential improvements
Citrus production in West Africa has not received much attention in research. Therefore, not
many possibilities to improve cultivation practices have been thoroughly studied. This is par-
ticularly the case for small-scale production in Ghana and any other country in West Africa.
Nonetheless, it is clear that physical access to markets should be pursued even before con-
ducting research on cultivation practices. Steps to improve market access include the follow-
ing: Grouping citrus farmers in an association, organizing transport to the nearest processing
facility in Assin Fosu or encouraging the formation of a new processing facility in the district.
Additionally, the buyers' market needs to be analyzed in detail. The results can help identify-
ing new potential consumers and their requirements. Afterwards the farming practices can be
adjusted if necessary.
According to Manner et al. (2006) citrus oil can be used in cosmetics, soaps, cleaners, can-
dles or as medicinals in aromatherapy. Therefore another possibility that needs to be further
explored is whether the orange peels could be sold to Portal Ltd for distillation in order to
produce essential oil.
Potential for REDD+
The major advantage of citrus is that its economic lifespan exceeds all other crops. As the
improvement of livelihoods is an important aspect of REDD+, the future potential of this land
use system highly depends on the development of the citrus market.
4.3.4 Rubber plantation
Biophysical characteristics
Rubber is the newest of the existing land use systems. It has been introduced to the AOB
district only recently. Thus only young plantations with a maximum age of seven years were
considered in the research. Rubber production is set up in an outgrower scheme (Agyarko
2013, personal communication). Race and Desmond (2001) define an outgrower scheme as
"a contractual partnership between growers or landholders and a company for the production
of commercial forest products". Related to this arrangement, rubber plantations are generally
bigger in size than the other agricultural plantations in the AOB district. Compared to the

Land use systems in Ghana's Central Region and their potential for REDD+
34
other farms, rubber plantations were also better managed. The conditions (prevalence of
weeds, soil structure, tree management) were good on all sample plots except one. This
could also be linked with the fact that rubber farmers meet an extension agent several times
a year and are relatively satisfied by the services.
Rubber is planted gradually. Every other year more land is cleared to expand the plantation
until it has reached its intended extent. During the years of establishment, all of the traditional
food crops with the exception of cassava are cultivated (table 6). Harvesting cassava could
uproot the trees, whose side roots are 7 - 10 m long (Rehm and Espic 1991). Plantain is
planted in rows between the rubber and is used for as long as it produces fruit. Sometimes it
can even be found in mature plantations if the lighting conditions allow it.
Table 6 Cropping pattern in a rubber plantation
Year 1 2 3 4 5 6 7 8 9 10-40
40-60
Maize X Cocoyam O X X X Plantain O X X X (X) (X) (X) (X) Rubber O O O O O X X X X X (X)
Legend: O: crop is present X: harvest
Seeing that rubber plantations follow a strict planting pattern, usually all of the land is cleared
at the beginning and no other trees are left standing. Only on one of the farms a large timber
tree was conserved between the rows of rubber trees. It is however an exception rather than
common practice.
If managed well, the economic lifespan of a plantation can be 30-35 years (Rehm and Espic
1991). In the district it is yet to be experienced whether such a lifespan can be achieved un-
der the prevalent conditions. For now it is assumed that rubber will stand for 40 years before
it is replanted. After that, the wood can still be used locally as construction material.
Carbon stocks
Figure 10 illustrates how rubber trees already sequester a high amount of carbon during
early years of establishment. The annual sequestration rate during the first 15 years is ap-
proximately 6 t/ha. Experience with other trees show that the growth rate eventually slows
down and then remains at a low level after around 20 years. Hence for rubber it is also as-
sumed that maximum carbon storage is reached after 20 years. Average stocks are 92.6
tC/ha. On the sample farms only 6% of the carbon is stored in trees other than rubber.

Land use systems in Ghana's Central Region and their potential for REDD+
35
Figure 10 Carbon stocks in rubber plantations
Saengruksawong et al. (2012) found comparable results in early years and a maximum of
122 t/ha in a 20-year-old plantation. In younger plantations they found 12, 31, 58 and 80 t/ha
after 1, 5 10 and 15 years respectively. Konsager et al. (2012) found a comparable above-
ground carbon stock of 61.5 t/ha in a 12-year-old plantation. Another study done by Wauters
et al. (2008) in Western Ghana came to a similar conclusion with an amount of 76.3 tC/ha
aboveground for 14-year-old rubber plantations.
Given the fact that rubberwood can still be used after felling, carbon stocks potentially remain
for a longer time after the economic lifespan of a plantation has ended.
Economic performance
The labour costs which are not included in this calculation are higher than for other systems,
especially for the harvest. A tapper needs to be hired permanently so that the trees are har-
vested regularly during nine months. One of the disadvantages of rubber production is that
from March to May no income is generated (Owusu 2013, personal communication). The
outgrowers are provided with seedlings and other inputs and sell their produce to the proc-
essing company for a fixed price. On average a yearly income of 2228 USD is achieved.
Potential improvements
In the setting of the AOB district the planting distance is predetermined. To improve the sys-
tems the planting pattern would have to be adjusted. One approach is to plant the tree crops
in wide rows 20 m apart and keep a distance of 1 - 2 m within the rows in order to reduce
0
20
40
60
80
100
120
140
160
0 5 10 15 20 25 30 35 40
Carb
on (t
/ha)
Age (y)
Carbon stocks in rubber plantations
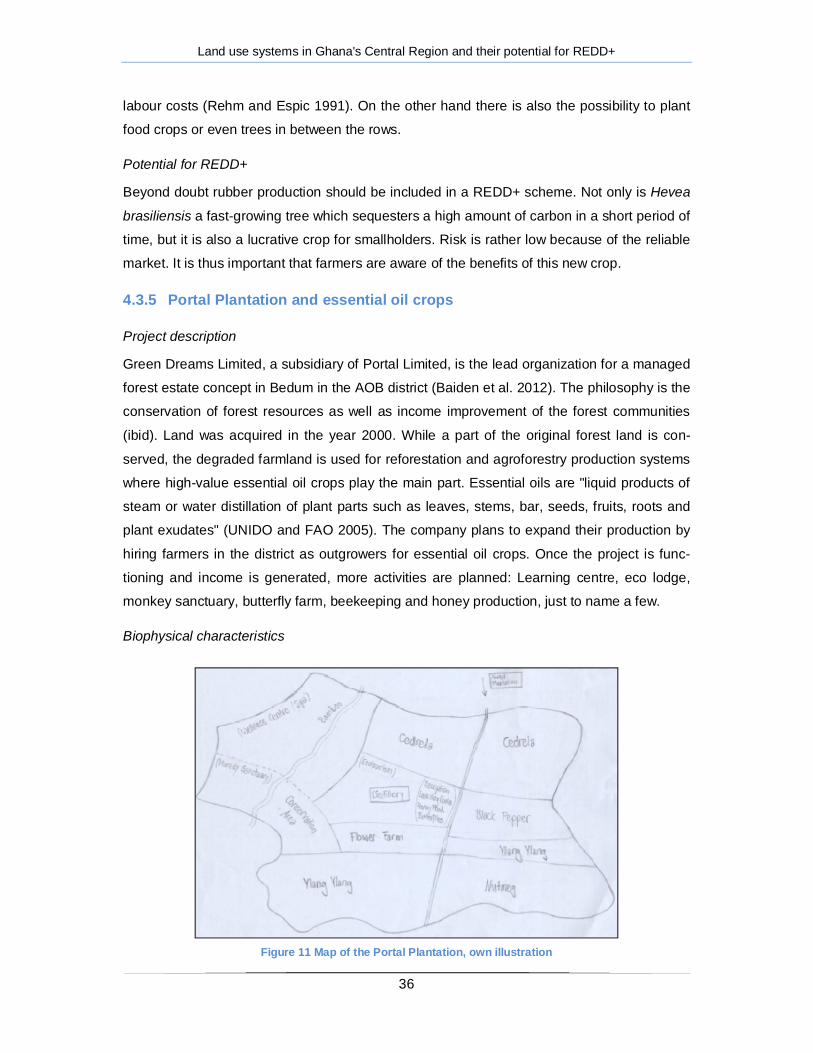
Land use systems in Ghana's Central Region and their potential for REDD+
36
labour costs (Rehm and Espic 1991). On the other hand there is also the possibility to plant
food crops or even trees in between the rows.
Potential for REDD+
Beyond doubt rubber production should be included in a REDD+ scheme. Not only is Hevea
brasiliensis a fast-growing tree which sequesters a high amount of carbon in a short period of
time, but it is also a lucrative crop for smallholders. Risk is rather low because of the reliable
market. It is thus important that farmers are aware of the benefits of this new crop.
4.3.5 Portal Plantation and essential oil crops
Project description
Green Dreams Limited, a subsidiary of Portal Limited, is the lead organization for a managed
forest estate concept in Bedum in the AOB district (Baiden et al. 2012). The philosophy is the
conservation of forest resources as well as income improvement of the forest communities
(ibid). Land was acquired in the year 2000. While a part of the original forest land is con-
served, the degraded farmland is used for reforestation and agroforestry production systems
where high-value essential oil crops play the main part. Essential oils are "liquid products of
steam or water distillation of plant parts such as leaves, stems, bar, seeds, fruits, roots and
plant exudates" (UNIDO and FAO 2005). The company plans to expand their production by
hiring farmers in the district as outgrowers for essential oil crops. Once the project is func-
tioning and income is generated, more activities are planned: Learning centre, eco lodge,
monkey sanctuary, butterfly farm, beekeeping and honey production, just to name a few.
Biophysical characteristics
Figure 11 Map of the Portal Plantation, own illustration
Land use systems in Ghana's Central Region and their potential for REDD+
37
The land is divided into six zones for different crops (figure 11): 30 ha conservation area with
natural forest, 20 ha timber plantation, 15 ha ylang ylang (Cananga odorata), 8 ha flower
farm, and 5 ha each for nutmeg (Myristica fragrans) and black pepper (Piper nigrum) (Baiden
2013b, personal communication).
System 1: In the conservation area, the existing forest had been degraded at the beginning
of the project in 2000. It was restocked through strip planting of indigenous tree
species in order to build up carbon stocks and support biodiversity.
System 2: The timber plantation has been established at the beginning of the project and is
now about 10 years old. Cedrela odorata is a fast-growing timber species and is
commonly produced as a monoculture during 20-25 years.
System 3: Ylang ylang (Cananga odorata) is a small tree with strongly scented flowers.
They are often used in the cosmetics industry, mainly for perfumes. In order to
have an optimal output the trees are cut at a height of about 2 m. This leads to
coppicing and an elevated formation of flowers. On the Portal Plantation, lemon-
grass, citronella and patchouli are grown in an agroforestry production system
under the ylang ylang. Some timber trees are currently present on the land. How-
ever, these are planned to be felled because the crop yields better under full sun
(Amoako 2013a, personal communication).
System 4: Black pepper is a climber and is grown in association with Gliricidia sepium at the
Portal Plantation, whereas the pollards serve as firewood supply and potentially
forage for livestock. When coppices are ready for harvest the trees are cut at
about 2.2 m height (Baiden et al. 2012) and the firewood is sold. In the near fu-
ture the intention is to further process it into charcoal, which has a better market
price. Together with black pepper it is also planned to intercrop lemongrass, cit-
ronella and patchouli. Even though it grows well under light shade (Nelson and
Cannon-Eger 2011), too much shade from timber trees should be avoided.
System 5: Nutmeg trees are long-lived spice trees which can be productive for up to 60
years (FAO 1995). At the Portal Plantation they were planted in 2010 (Amoako
2013a, personal communication). Because of maintenance problems the survival
rate of the seedlings was small. Strip planting is now used as a method to put to-
gether the nutmeg plantation. Cinnamon is planned to form part of this system.
Early-yielding crops (lemongrass, citronella, patchouli) will also be intercropped.
System 6: The flower farm was established in 2010. Orchids and Heliconia spp are culti-
vated for the purpose of cut flower production. Heliconia requires a shade level of
30-50% (Orchids Asia 2006), even though at the moment there are no large trees
present in this system.
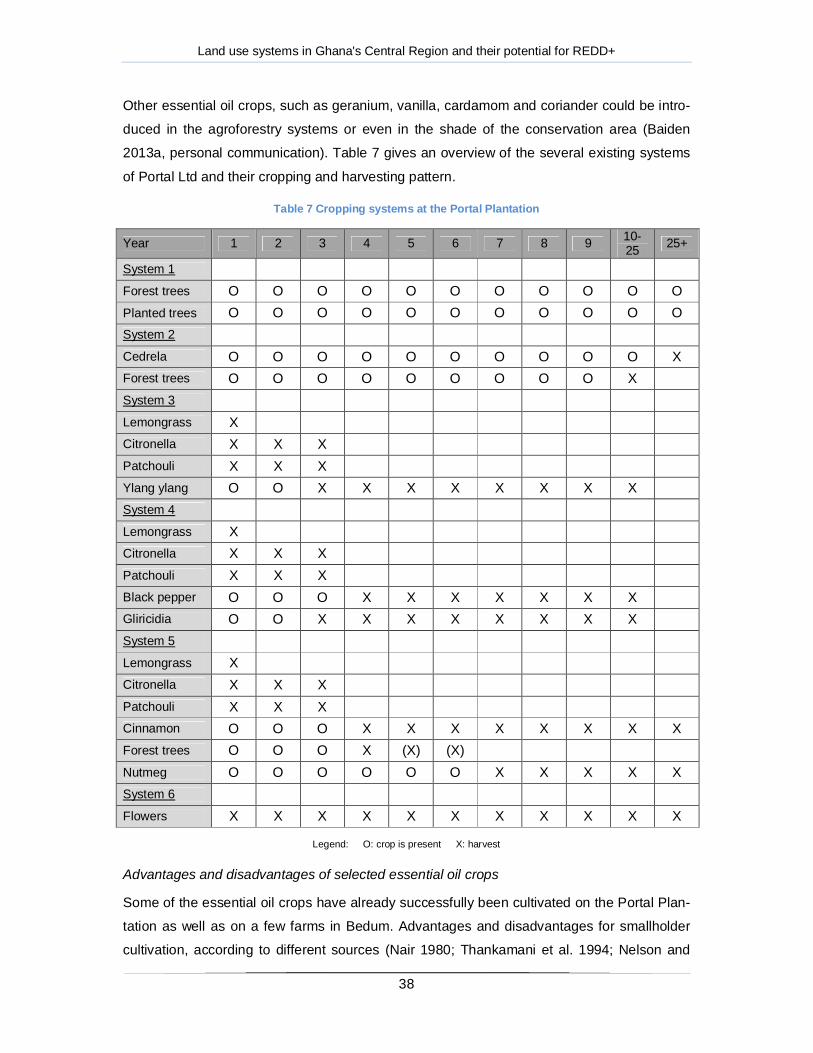
Land use systems in Ghana's Central Region and their potential for REDD+
38
Other essential oil crops, such as geranium, vanilla, cardamom and coriander could be intro-
duced in the agroforestry systems or even in the shade of the conservation area (Baiden
2013a, personal communication). Table 7 gives an overview of the several existing systems
of Portal Ltd and their cropping and harvesting pattern.
Table 7 Cropping systems at the Portal Plantation
Year 1 2 3 4 5 6 7 8 9 10-25 25+
System 1 Forest trees O O O O O O O O O O O Planted trees O O O O O O O O O O O System 2 Cedrela O O O O O O O O O O X Forest trees O O O O O O O O O X System 3 Lemongrass X Citronella X X X Patchouli X X X Ylang ylang O O X X X X X X X X System 4 Lemongrass X Citronella X X X Patchouli X X X Black pepper O O O X X X X X X X Gliricidia O O X X X X X X X X System 5 Lemongrass X Citronella X X X Patchouli X X X Cinnamon O O O X X X X X X X X Forest trees O O O X (X) (X) Nutmeg O O O O O O X X X X X System 6 Flowers X X X X X X X X X X X
Legend: O: crop is present X: harvest
Advantages and disadvantages of selected essential oil crops
Some of the essential oil crops have already successfully been cultivated on the Portal Plan-
tation as well as on a few farms in Bedum. Advantages and disadvantages for smallholder
cultivation, according to different sources (Nair 1980; Thankamani et al. 1994; Nelson and
Land use systems in Ghana's Central Region and their potential for REDD+
39
Cannon-Eger 2011; Chandy no date; Bapat et al. 2012) and own observations, are illustrated
in table 8.
Table 8 Advantages and disadvantages of selected essential oil crops (Nair 1980; Thankamani et al. 1994; Nelson and Cannon-Eger 2011; Chandy no date; Bapat et al. 2012)
Crop Advantages Disadvantages
Black Pepper
- already known by the farmers - tolerates shade - cultivation with live supports (e.g. coffee, cocoa, forest trees) - can be sold as spice
- no quick economic returns - high labour costs
Cardamom - partial shade preferred - first harvest after 3 years
Cinnamon - adaptable to shade - suitable for marginal areas - suitable for low-input systems
- no early income
Citronella - early economic returns - low market price
Lemongrass
- simple cultivation techniques - disease and pest resistant - soil conservation in marginal areas and on degraded lands - high market demand
- low-value oil
Nutmeg - high oil yield - long-term investment
Patchouli - early economic returns
Ylang Ylang - already known by the farmers - maximum flower production be-tween november and march
- rapid harvest & transport necessary
Carbon stocks
The conservation forest, which has been standing for numerous years, is at a stable level of
126 tC/ha. Over a lifespan of 25 years Cedrela odorata supposedly reaches a maximum of
over 150 tC/ha with a mean of 114.7 tC/ha. Average carbon storage of timber plantations can
be increased if the trees were sold at a later stage. The agroforestry systems with the essen-
tial oil crops on the other hand only sequester carbon during the first years. After coppicing at
a height of 2 m tree diameter stops increasing and growth is limited to coppices, which are
regularly used as fuelwood. Therefore the carbon stocks of these systems remain stable af-
ter the initial build-up. Out of all essential oil crops, the black pepper agroforestry system se-
questers by far the highest amount of carbon (figure 12). With an average storage capacity of
60.2 tC/ha its potential as carbon sink is more or less three times as high as that of ylang
ylang (18.9 tC/ha) and nutmeg (23.9 tC/ha).

Land use systems in Ghana's Central Region and their potential for REDD+
40
Figure 12 Carbon stocks at the Portal Plantation (approximate curve)
Considering the average carbon stocks in all systems as well as their prevalence on the land
of Portal Ltd, a total amount of 81.3 tC/ha are stored (table 9).
Table 9 Average carbon stocks at the Portal Plantation
At the flower farm there are no shade trees present. Heliconia spp do however require a
shade level of 60%, which is why it is intended to plant fruit trees such as papaya (Carica
papaya) in a pattern of 5 m planting distance (Forster 2013a, personal communication). Pre-
suming the average biomass of all papaya trees found in the sample farms and a number of
400 trees/ha an additional 9.1 tC/ha would be stored on the flower area. With that, total car-
bon stored at the Portal Plantation could reach 82.2 t/ha.
Economic performance
An assessment of the potential income from essential oils production is difficult for several
reasons. First, nowadays most of the suggested crops are cultivated in Asian countries
0
20
40
60
80
100
120
140
160
180
0 5 10 15 20 25
Carb
on /t
/ha)
Age (y)
Cedrela
Forest
Cedrela Mean
Pepper
Pepper Mean
Nutmeg
Nutmeg mean
Ylang
Ylang Mean
Flowers
Carbon (t/ha) Area (ha) Total (tC) Forest 126 30.4 3824.1
Cedrela 114.6 20.2 2318.4
Ylang ylang 18.9 15.4 290.7
Black pepper 60.2 5.3 316.7
Nutmeg 23.9 5.3 125.7
Flowers 0 8.1 0
Average 81.3 84.6 6875.5

Land use systems in Ghana's Central Region and their potential for REDD+
41
where growing conditions are different. Second, the reliability of the market is unclear. Third,
there is not much information available concerning the costs of the production (especially
labour costs) which farmers would have to put in. Also, the investment costs are supposedly
very high, considering that the outgrowers would adopt a completely new production system.
Investment costs include land purchase, land preparation, training and inputs.
For most crops only a small amount of oil can be extracted from the harvested and dried
produce. The oil yield lies between <1 - 15%. This means that a lot of organic waste will be
produced during the distillation process. Portal Ltd intends to use those leftovers as mulch for
flowers and other crops.
Table 10 Income at the Portal Plantation
Prices for a kilogram of essential oil differ highly among the crops. The highest amount is
paid for black pepper and ylang ylang. All in all an annual income of 7'785.6 USD/ha is gen-
erated at the Portal Plantation (table 10)
It is assumed that farmers can deliver their harvest from the essential oil crops as well as
from flowers to Portal Ltd for half the price the company receives when they sell the proc-
essed products. For outgrowers, both nutmeg and black pepper bring a very high annual
income with 12'629.5 USD/ha and 11'455.4 USD/ha respectively. Ylang ylang generates
9'462.4 USD/ha/y. Comparable results can be obtained with flowers (8'139.6 USD/ha/y). For
cedrela 59'512.5 USD/ha are paid, which are 2380.5 USD/ha for each year. Even though
income is lower than for essential oils labour costs are in general rather low. For small-
holders timber plantations have the disadvantage that long-term investments are necessary.
Another influencing aspect is land tenure. The conservation area does not generate any in-
come at the moment. Nonetheless in the future possible income could either come from tour-
istic activities (eco lodge) or from essential oil crops which are cultivated under the forest
canopy.
IncomePortal Ltd (USD/ha/y) Area (ha) Total
(USD/ha/y) Forest 0 30.4 0
Cedrela 2380.5 20.2 48'167.0
Ylang ylang 18'924.8 15.4 291'025.0
Black pepper 22'910.9 5.3 120'534.2
Nutmeg 25'259.1 5.3 132'888.0
Flowers 8'139.6 8.1 65'881.9
Average 7'785.6 84.6 658'496.1

Land use systems in Ghana's Central Region and their potential for REDD+
42
Potential improvements
Portal Ltd has gained a lot of experience in cultivating essential oil crops during the last 10
years. But in general not much knowledge is available, especially in the West African con-
text. Adjustments to the cultivation practices and crop combinations are still being made.
Some experience with producing and marketing essential oil crops has been made in Mada-
gascar, Mozambique and South Africa.
In addition to the existing crops it is planned to cultivate further essential oil plants (e.g. va-
nilla, cardamom, coriander) underneath the conservation forest. This is another good oppor-
tunity for farmers to produce high-value crops while also safeguarding forest land.
Farmers' perception
Out of the 32 interviewed farmers in the AOB district, 84% are interested in the essential oil
crops. Their main interest lies in black pepper, because they already know the plant. They
would be willing to start out on a small plot of land (around half a hectare) with this crop.
Apart from black pepper mainly short rotation crops such as lemongrass, citronella and
patchouli are of interest for the people. Early economic returns are very important especially
in the beginning of the project. The company therefore has to accept that farmers will not
invest in long-lived crops, at least not in the first few years. Then if they see there is a good
market for essential oils they would start with other proposed crops on additional land. 47%
of the farmers already have enough land at their disposal, while the rest of them would have
to purchase new land. However, at present land appears to be easily accessible in most
communities of the district. Only 19% believe they have enough labour capacity for a new
crop, but all of them are willing to hire more labourers. This leads to the assumption that
there is no shortage of labour in the district. Cost of labour in the AOB district is around 5
USD per worker per day (Owusu 2013, personal communication) even though these ar-
rangements may differ depending on the work.
The biggest concern from the farmers' perspective is their lack of knowledge about the pro-
posed crops. Although 6 farmers (19%) mentioned they have some experience with part of
the essential oil crops, none of them have ever cultivated them on a commercial basis. This
is why training of farmers and hired workers should be a key activity.
A further worry is the dependence on one buyer. There are major trust issues mainly be-
tween farmers of the Bedum community and Portal Ltd. Ten years ago those farmers had
already been involved in the cultivation of essential oils and were disappointed when they
could not sell their produce do to the absence of a distillery at the Portal Plantation. These
farmers are now sceptical towards the company and not willing to cultivate those crops
unless they have a secure market access.
Land use systems in Ghana's Central Region and their potential for REDD+
43
Potential for REDD+
The project fits well in a REDD+ mechanism. On the one hand carbon is conserved in forest
trees as well as fast-growing timber species. Furthermore, cultivating essential oil crops in
agroforestry systems serve as an additional carbon sink. On the other hand there is a very
high income potential for the farmers as well as employment opportunities for the other
members of the community. For the project as well as the individuals it is crucial that the land
use is profitable and sustainable even without potential carbon credits. Payments for ecosys-
tem services would just serve as an additional source of income.
Further constraints
The project faces different challenges at the moment. Lack of finance for investments is the
number one hindering factor. One concern is the poor condition of the roads. For essential oil
crops it is crucial to have a quick and efficient mode of transport between the farmers' fields
and the processing facility. If transport takes too long the oil inside the plant parts can either
evaporate or decline in quality (DAFF 2011). Ylang ylang for example should be distilled as
soon as possible to avoid fermentation (UNIDO and FAO 2005). The same goes for the other
spice crops. In order to reduce post-harvest losses, a functioning transportation system
needs to be in place. In addition, other necessary infrastructure such as storage and drying
facilities should be set up before starting the production on a larger scale. Due to the limited
knowledge of the farmers and workers, good training is critical. Not only the farmers but also
the labourers at the distillery need to be instructed on how to handle essential oil crops. This
work requires a high level of technical skills, which should not be underestimated. The De-
partment for Agriculture, Forestry and Fisheries (DAFF 2011) mentions the necessity for
highly focused field maintenance for high-quality produce as well as the requirement of tech-
nical support such as inputs and good-quality planting material as the major production con-
straints. All in all, the production of essential oils will generate a lot of employment opportuni-
ties. As a result labour costs are very high and should be considered accordingly.
A very important matter in the essential oils industry are quality standards. According to MBB
Consulting Services South Ltd (2006) consumers are not willing to buy products from a sup-
plier whose sustainability is not recognized by means of certification. If possible, organic pro-
duction should be pursued in order to satisfy global market demands. Time and effort for cer-
tification is typically fairly high, especially for small companies. An additional obstacle is the
mistrust coming from European and North American market actors. Studies found that those
consumers have the general perception that African producers are not reliable when it comes
to delivering goods which are conform to international standards of quality (MBB Consulting
Services South Ltd 2006). Accordingly, there is a strong request for traceability. It is thus a
Land use systems in Ghana's Central Region and their potential for REDD+
44
key goal to keep the essential oils value chain transparent from the farmers to the processing
company.
5 Main discussion
5.1 Comparison of land use systems
Figure 13 Comparison of the performance of different farm types
It is evident from figure 13 that the potential income of Portal Ltd is much higher than the one
from farms with traditional crops. With an average income of 7785.6 USD/ha the economic
benefits are several times higher than for all of the traditional crops.
On the other hand, production costs are also significantly higher than for the usual crops. A
more accurate cost-benefit-analysis of the farming systems is necessary to compare the
profitability of each land use. As for carbon benefits the differences are not immense. None-
theless it is apparent that rubber has the highest carbon stocks with 92.6 t/ha, followed by
Portal Ltd (81.3 t/ha) and cocoa (76.3 t/ha). Citrus also has acceptable carbon storage with
an average of 61.4 t/ha. The smallest amount of carbon is stored in oil palm plantations (40.5
t/ha). In general it can be said that both Portal Ltd and rubber plantations have the best po-
tential for REDD+.
Figure 14 indicates that in the AOB district there are two main types of land use systems:
carbon intensive systems with low- or middle-value crops and low-carbon systems with high-

Land use systems in Ghana's Central Region and their potential for REDD+
45
value crops for export. For small-scale farmers, the decision which crops they will cultivate
depends on the economic benefits rather than carbon storage.
Figure 14 Comparison of the performance of different land use systems
The individual systems of the Portal Plantation have widely different potentials. The carbon
intensive structures (conservation area and cedrela plantation) are less lucrative. The essen-
tial oil crops on the other hand have a high market price but only sequester a limited amount
of carbon. It seems that from all the essential oil cropping systems, the most appropriate one
in terms of REDD+ is agroforestry with black pepper.
5.2 Proposed land use systems for smallholders In table 11 scores from 1 - 10 are given according to the systems' rank concerning carbon
storage and income generation. This outline is meant as a guideline for farmers to help
choose the land use systems which are suitable from their prospective and profitable in a
REDD+ mechanism. Cedrela reaches by far the highest score. From the essential oil crops
black pepper is the most promising alternative, followed by nutmeg. Out of the traditional tree
crops rubber is the one with the highest carbon storage as well as the biggest income. Citrus
and cocoa are similar while oil palm is clearly the crop with the least potential for REDD+.

Land use systems in Ghana's Central Region and their potential for REDD+
46
Table 11 Ranking of the different land use systems
Legend: ++ very high potential + high potential +/- moderate potential - low potential
Seeing that minimizing risks is a key tactic for smallholders, a diversified farming strategy
should be promoted. Judging from table 11, the best investment is having at least one timber
plantation of around 1 ha, be it Cedrela odorata or any other fast-growing species. In addition
to that it is suggested to plant approximately 1 ha with essential oil crops, guaranteeing a
high income even in early years. The most appropriate of these is black pepper in combina-
tion with annual crops (lemongrass, citronella, patchouli). Apart from the good carbon and
economic performance black pepper is also known by the farmers plus the risk of market
failure is smaller than for the other crops because it can be sold unprocessed as a spice.
When the essential oils value chain is well established farmers can choose to invest in an-
other crop like nutmeg or ylang ylang. Further cultivation of traditional crops is also recom-
mended (1 - 2 ha). If a farmer wants to keep producing the existing crops rubber has the
highest potential. On the other hand, cocoa production with improved cultivation practices
could be very lucrative too. With better market opportunities, citrus farms have a good poten-
tial as well. Finally, it is strongly recommended that each farmer has a small plot of land
which is solely used for the cultivation of food crops (0.5 - 1 ha depending on household
size). In case the soil does not support intensive food cropping a form of shifting cultivation
with fallows should be practiced on this land. The consequence is that a larger plot of at least
2 ha should be set aside for this cause.
In any case, this is not a fixed recommendation and can be adjusted for each farmer. Seeing
that usually farm plots have a size of around 2 acres, it is most likely that each system will be
Crop Advantages Disadvantages Score Rank C $ tot
++ Cedrela - low labour costs - excellent carbon sink - no income for 25 years 9 6 15 1
+
Black pepper - local market for spices - firewood from live stakes 5 9 14 2
Rubber - growing market - good carbon sink
- no cassava intercropping - dependence on buyer 8 5 13 3
Nutmeg - high price for oil - long economic lifespan - late maturity 3 10 13 3
+/-
Forest - diverse forest products - no income 10 1 11 4
Citrus - long economic lifespan - insecure market 6 4 10 5
Cocoa - good market conditions - a lot of research done - low price 7 3 10 5
Ylang ylang - yields all year round - critical harvest - high labour requirement 2 7 9 6
Flowers - very high market price - poor carbon sink 1 7 8 7
- Oil palm - grows on marginal soils - home consumption
- low market price - short economic lifespan 4 2 6 8

Land use systems in Ghana's Central Region and their potential for REDD+
47
practiced on less than 1 ha of total landholding. It should also be mentioned that due to the
requirements for the sample plots the visited farms were probably slightly bigger than the
average farm in the district. Smallholders are important stakeholders in the REDD+ mecha-
nism and should not be disregarded. Nevertheless, a diversified farming strategy is also for
them the main recommendation. It is assumed that a smallholder farmer is not willing to crop
1 ha of his land with a timber species. Therefore the most practical solution would be to
manage a timber plantation on the community level.
Instead of having separate lands for each system, combinations of the individual crops are
possible. One example is to plant cinnamon between rows of rubber (Pathiratna and Perera
2006) as an alternative to intercropping with nutmeg. Other likely combinations are citrus with
flowers or annual essential oil crops, cocoa under forest shade or black pepper with timber
trees as live stakes. It is evident that more studies need to be done on the potential of such
combined land use systems.
On the district level, when comparing the carbon in the agricultural land use systems with the
carbon stored in abandoned farms and secondary forest it seems that there is a slight gain
when converting to agricultural land use. Sacred groves with stocks of 206.9 tC/ha (Amoako
2013b) are not subject to conversion (World Bank 2006). On the other hand carbon stocks
increase if any other land in the district (secondary forest with 36.9 tC/ha, abandoned cocoa
farm with 52.4 tC/ha, abandoned oil palm farm with 32.3 tC/ha or abandoned food crop farm
with 4.3 tC/ha (Amoako 2013b) is converted. The increase is especially high if any of that
land is converted to a cocoa, rubber or timber plantation. In perspective of an implementation
of REDD+ in the entire district the suggestion is to improve the carbon stocks in secondary
forests through enrichment planting of indigenous tree species and possibly produce shade-
loving essential oil crops underneath the canopy. Eventually carbon stocks similar to the
conservation area of Portal Ltd (126 t/ha) could be achieved. Abandoned farms on the other
hand should be replanted with any of the above suggested crops.
Key to success seems to be a well-functioning extension service. Most of the interviewed
farmers said that they do not have much information about adequate cultivation practices for
their traditional crops. They added that for them to include new crops would require a lot of
support from extension agents. For high-value crops it makes all the more sense to pass on
as much knowledge as possible in order to avoid yield gaps as well as post-harvest losses. It
is thus highly recommended that farmers are involved from the beginning of the process. In
addition, the formation of farmers' groups should be encouraged to reach a better flow of
information.
Land use systems in Ghana's Central Region and their potential for REDD+
48
Other issues that have not been solved yet are land and tree tenure. Small-scale farmers will
not make long-term investments when they are unsure about the ownership of the land. Also
they will not conserve trees when not getting monetary benefits for them.
6 Conclusion The major land use systems in the AOB district are perennial cash crops such as cocoa, oil
palm, citrus and rubber in combination with food crops during 2 - 5 years. The most important
food crops are maize, cassava, plantain and cocoyam. In all of these systems some naturally
regenerated trees are present.
Out of all traditional land use systems, rubber stores the highest amount of carbon with a
mean stock of 92.6 tC/ha and should therefore be promoted. The annual income of 2'228
USD/ha is underlining the importance of this crop. The second highest amount of carbon is
stored in cocoa agroforests (76.3 tC/ha). Improvement of shade management is crucial to
increase carbon sequestration as well as productivity and reach a higher income than the
current 525 USD/ha/y. The potential for REDD+ is also good. The third highest amount of
carbon is stored in citrus plantations (61.4 tC/ha). Potential yearly income is 1'125 USD/ha,
but access to a processing facility is the key factor in order to be suitable for REDD+. The
least carbon is stored in smallholder oil palm plantations (40.5 tC/ha), which are mainly used
for household consumption and bring little additional income (300 USD/ha/y). Oil palm is thus
of minor importance for REDD+. Portal Ltd with their six land use systems have comparably
high carbon stocks (81.3 t/ha) and a much higher annual income (7'786 USD/ha). The results
confirm that overall the proposed land use systems have a very high potential for REDD+.
It seems the pilot will have great benefits for the communities of the AOB district. As a con-
clusion, combinations of fast-growing trees with a high carbon sequestration rate and high-
value essential oil crops are suitable for REDD+. For smallholder farmers a risk reduction
strategy with a diversity of cash crops, timber trees and food crops is recommended. An ideal
combination would be: 2 ha traditional crops (rubber, citrus or cocoa), 1 ha timber plantation,
1 ha essential oil crops (preferably black pepper) and 1 ha food crops. Where the original
land is degraded secondary forest, enrichment planting with indigenous tree species should
be carried out. In a later stage, shade loving essential oil crops such as vanilla can be culti-
vated underneath the forest canopy.
In contrast issues such as tree tenure, market access and the improvement of extension ser-
vices need to be addressed in order for the pilot to be successful. Further research needs to
be done on the composition of the agroforestry systems, interactions between different
crops, suitable tree species as well as market opportunities of essential oils. Also the produc-
tion costs of each land use system need to be included in a further analysis in order to give

Land use systems in Ghana's Central Region and their potential for REDD+
49
accurate information on the profitability. Another important aspect that has not been regarded
so far are soil properties and the effect of the different crops on soil structure and availability
of nutrients.
For future research in the AOB district it is important to include all stakeholders. In order for
the pilot to be successful the different interests should be clear and addressed from the be-
ginning. The communities as well as community leaders, extension agents and the company
Portal Ltd should be involved.

Land use systems in Ghana's Central Region and their potential for REDD+
50
7 Literature
Agyarko F, 2013. Agricultural land use systems in the AOB district on 21.05.2013.
Ainoo P, 2011. Citrus farmers abandoned the trade due to lack of market, accessed on 08.08.2013, http://vibeghana.com/2011/11/30/citrus-farmers-abandoned-the-trade-due-to-lack-of-market/
Allotey JA, 2004. Ghana national report. Gateway to Land and Water Information, accessed on 11.08.2013, http://www.apipnm.org/swlwpnr/reports/y_sf/z_gh/gh.htm
Amoah FM, Nuertey BN, Baidoo-Addo K, Oppong FK, Osei-Bonsu K, Asamoah TE, 1995. Underplanting oil palm with cocoa in Ghana, Netherlands.
Amoako J, 2013a. Production systems for essential oil crops on 29.07.2013.
Amoako J, 2013b. Secondary Forest Studies: Advancing REDD+ in Ghana: Preparation of REDD+ pilot schemes in off-reserve forests and agroforests, KNUST, Kumasi, Ghana.
Anandaraj M, no date. Perennial spice crops: black pepper, cinnamon, clove and nutmeg, Calicut, India.
Asare R, 2013. A guide to implement REDD+ in Ghana: Criteria and modalities for develop-ing a REDD+ project, Accra, Ghana.
Asase A, Ofori-Frimpong K, Hadly P, Norris K, 2008. Carbon storage and the health of cocoa agroforestry ecosystems in Ghana, Accra.
Baiden W, 2009. Bedum projected oil production, Portal Ltd.
Baiden W, 2013a. Farming systems at the Portal Plantation on 09.07.2013.
Baiden W, 2013b. Land use on the Portal Plantation. Phone call on 14.07.2013.
Baiden W, Likimani K, Gohoho S, 2012. Bedum REDD+ project: Pre-feasibility template, Bedum, Ghana.
Bapat P, Cavallo G, Conway E, Fransius A, Naegele J, Saleman Y, Subhash H, 2012. Rwanda's essential oils value chain: A diagnostic.
Cairns MA, Brown S, Helmer EH, Baumgardner GA, 1997. Root biomass allocation in the world's upland forests. Oecologia 111 (1-11).
Chandy KT, no date. Medicinal plants: Lemon Grass.
Chandy KT, no date. Medicinal plants. Java citronella.
Chandy KT, no date. Medicinal plants. Patchouli.
Chave J, Andalo C, Brown S, Cairns MA, Chambers JY, Eamus D, Folster H, Fromard F, Higuchi N, Kira T, Lescure JP, Nelson BW, Ogawa H, Puig H, Riera B, Yamakura T, 2005. Tree allometry and improved estimation of carbon stocks and balance in tropical forests. Oecologia 145, 87–99.

Land use systems in Ghana's Central Region and their potential for REDD+
51
CoinMill, 2013. Ghanaian Cedi (GHS) and United States Dollar (USD) Currency exchange rate conversion calculator. CoinMill, accessed on 09.11.2013, http://coin-mill.com/GHS_USD.html#GHS=1
CRIG (Cocoa Research Institute of Ghana), 2010. Cocoa manual. A source book for sus-tainable cocoa production, Tafo, Ghana.
DAFF (Department for Agriculture, Forestry and Fisheries), 2011. A profile of the south afri-can essential oils market value chain.
Darko A, Klossner M, 2013. Report on financial viability and benefit sharing options of the Bedum and Nkoranzaman REDD+ pilot projects, HAFL, Zollikofen, Switzerland.
Darko-Obiri B, Bright GA, McDonald MA, Anglaaere LC, Cobbina J, 2007. Financial analysis of shaded cocoa in Ghana. Agroforestry Systems Nr. 71, 139–149.
Deppeler A, Feurer M, 2013. Trees on cocoa farms, Enchi, Ghana. Interview material
Entwi MK, Bernert A, 2013. Cocoa cultivation practices in the Central Region on 21.05.2013.
Factfish, 2013. Ghana: Oil palm fruit, yield (hectogram per hectare). Factfish, accessed on 27.09.2013, http://www.factfish.com/statistic-country/ghana/oil%20palm%20fruit,%20yield
FAO (Food and Agricultural Organization of the United Nations), 1995. Production, handling and processing of nutmeg and mace and their culinary uses: Section II - Nutmeg cultiva-tion. FAO, accessed on 21.08.2013, http://www.fao.org/docrep/x5047e/x5047e05.htm
FAO, 2010. Global forest resources assessment 2010, Rome, 378 p.
FCPF (Forest Carbon Partnership Facility), 2013. What is REDD+? FCPF, accessed on 31.05.2013, http://www.forestcarbonpartnership.org/what-redd
Fianu FK, Addae PC, Adjorlolo L, no date. Sheep rearing under tree crop plantation in Gha-na's forest zone: Problems and prospects. University of Ghana, Legon, accessed on 19.08.2013, http://www.ilri.org/InfoServ/Webpub/fulldocs/X5473B/x5473b0p.htm
Forster A, 2013a. Progress at the Portal Plantation on 08.10.2013.
Forster A, 2013b. Yield and price of Heliconia flowers on 16.11.2013.
GREL (Ghana Rubber Estates Limited), 2013. Rubber outgrowers plantation project. GREL, accessed on 24.09.2013, http://www.grelgh.com
Hainmueller J, Hiscox M, Tampe M, 2011. Sustainable development for cocoa farmers in Ghana: Baseline survey: Preliminary report.
Hirsbrunner M, 2012. Financial attractiveness of carbon offset certification for smallholder farmers in Ghanaian cacao agroforestry systems. Msc, HAFL, Zollikofen.
Hoogendijk T, 2012. Motivations for shade-grown cocoa production in Ghana. Bsc, University of Applied Sciences van Hall Larenstein, Velp, Netherlands.
ICRAF (International Centre for Research in Agroforestry), no date. AgroForestryTree Data-base: Citrus sinensis. ICRAF, http://www.worldagroforestry.org/SEA/Pro-ducts/AFDbases/AF/asp/SpeciesInfo.asp?SpID=537
Land use systems in Ghana's Central Region and their potential for REDD+
52
Irvine FR, 1961. Woody plants of Ghana: with special reference to their uses. Oxford Univer-sity Press, London, England.
Isaac ME, Timmer VR, Quashie-Sam SJ, 2007. Shade tree effects in an 8-year-old cocoa agroforestry system: Biomass and nutrient diagnosis of Theobroma cacao by vector analysis. Nutr Cycl Agroecosyst Nr. 78, 155–165.
Khalid H, Zin ZZ, Anderson JM, 1999. Quantification of oil palm biomass and nutrient value in a mature plantation: Above-ground biomass. Oil Palm Research 2 (1), 23–32.
Kongsager R, Napier J, Mertz O, 2012. The carbon sequestration potential of tree crop plan-tations. Mitigation Adaptation Strategies Global Change.
Kumar BM, Nair PK (eds.), 2011. Carbon sequestration potential of agroforestry systems: Opportunities and challenges. Springer, Dordrecht, 307 p.
Kwakye Y, 2011. Update on REDD+ in Ghana, Accra, Ghana.
Lemmens R, 2008. Cedrela odorata L. PROTA, accessed on 27.09.2013, http://www.prota4u.org/protav8.asp?h=M1,M11,M12,M15,M16,M18,M19,M23,M25,M26,M27,M34,M36,M4,M6,M7,M8,M9&t=Cedrela,odorata&p=Cedrela+odorata#Protologue
Manner H, Elevitch C, 2006. Cananga odorata (ylang-ylang).
Manner H, Buker R, Easton Smith V, Ward D, Elevitch C, 2006. Citrus (citrus) and fortunella (kumquat). Traditional Tree, accessed on 08.11.2013, http://agroforestry.net/tti/Citrus-citrus.pdf
Mantlana B, 2011. Readying africa for REDD+, accessed on 15.11.2012, http://www.za.boell.org/web/cop17-767.html
MBB Consulting Services South Ltd, 2006. A study into the potential of aromatic plants for essential oils in Mozambique, Stellenbosch, South Africa.
Mbow C, Skole D, Dieng M, Justice C, Kwesha D, Mane L, El Gamri M, Vordzogbe V von, Virji H, 2012. Challenges and prospects for REDD+ in Africa: Desk review of REDD+ im-plementation in Africa, Copenhagen.
Mensah M, 2013. Agricultural land use systems around Bedum on 23.05.2013.
MLNR (Ministry of Lands and Natural Resources), 2012. Ghana - Forest Investment Program (FIP) plan. Final draft.
MOFA (Ministry of Agriculture), 2011. Asikuma/Odoben/Brakwa: Asikuma-Odoben-Brakwa district agricultural situation, accessed on 03.05.2013, http://mo-fa.gov.gh/site/?page_id=1445
Nair PK, 1980. Agroforestry Species: A crop sheets manual, Nairobi, Kenya.
Naturland, 2001. Organic Farming in the Tropics and Subtropics - Exemplary Description of 20 Crops: Pineapple. Naturland, accessed on 18.08.2013, http://www.naturland.de/file-admin/MDB/documents/Publication/English/pineapple.pdf
Nelson SC, Cannon-Eger KT, 2011. Farm and forestry production and marketing profile for black pepper (Piper nigrum), Holualoa, Hawaii.
Land use systems in Ghana's Central Region and their potential for REDD+
53
Nuertey BN, 2000. Studies into oil palm-based cropping systems in Ghana. PhD.
Nuertey BN, Ofori IK, Tetteh FM, 2009. Intercropping oil palm with food crops in Ghana: 1. Effect on nutrient dynamics, soil moisture retention and light interception. Ghana Journal of Agricultural Science 42, 43–54.
Ofosu-Budu KG, 2013a. Average yields of tree crops in central region. Mail on 15.11.2013.
Ofosu-Budu KG, 2013b. Information on rubber and citrus (yields ad market prices). Mail on 19.11.2013.
Orchids Asia, 2006. Heliconias, accessed on 01.10.2013, http://www.orchidsasia.com/heli-conias.htm
Owusu B, 2013. Rubber plantation on 23.05.2013.
Pathiratna LS, Perera MK, 2006. Effect of plant density on bark yield of cinnamon inter-cropped under mature rubber. Agroforestry Systems Nr. 68, 123–131.
Pearson T, Walker S, Brown S, 2005. Sourcebook for land use, land-use change and forest-ry projects. Winrock International.
Race D, Desmond H, 2001. Forestry out-grower schemes: A global wood: Forest plantations thematic paper. FAO, accessed on 27.05.2013, http://www.fao.org/doc-rep/004/ac131e/ac131e03.htm
Rehm S, Espic G, 1991. The cultivated plants of the tropics and subtropics: Cultivation, eco-nomic value, utilization, Stuttgart, Germany.
Ruf F, Zadi H, 1998. Cocoa: from deforestation to reforestation: Workshop on shade grown cocoa in Panama, Washington D.C., USA.
Saengruksawong C, Khamyong S, Anongrak N, Pinthong J, 2012. Growths and carbon stocks of para rubber plantations on Phonpisai soil series in Northeastern Thailand. Rub-ber Thai Journal Nr. 1, 1–18.
Stanturf J, Warren M, Charnley S, Polasky S, Goodrick S, Armah FNY, 2011. Ghana climate change vulnerability and adaption assessment, Washington.
Thankamani CK, Sivaraman K, Kandiannan K, Peter KV, 1994. Agronomy of tree spices (clove, nutmeg, cinnamon and allspice) - a review. Journal of Spices & Aromatic Crops 3 (2), 105–123.
TNAU (Tamil Nadu Agricultural University, 2013. Nutmeg (Myristica fragrans Hoult.): Myristicaceae. TNAU, accessed on 11.11.2013, http://agritech.tnau.ac.in/horti-culture/horti_spice%20crops_nutmeg.html
Tufuor K, 2012. Ghana forestry report - Draft: Towards Ecowas forest convergence plan, Accra, Ghana.
UNDP (United Nations Development Programme), 2013. International human development indicators: Ghana. Country profile. UNDP, accessed on 25.11.2013, http://hdrstats.un-dp.org/en/countries/profiles/GHA.html
Land use systems in Ghana's Central Region and their potential for REDD+
54
UNIDO (United Nations Industrial Development Organization), FAO, 2005. Herbs, spices and essential oils: Post-harvest operations in developing countries.
Wade A, Asase A, Hadley P, Mason J, Ofori-Frimpong K, Preece D, Spring N, Norris K, 2010. Agriculture, ecosystems and environment 138: Management strategies for maximiz-ing carbon storage and tree species diversity in cocoa-growing landscapes.
Walker W, Baccini A, Nepstad M, Horning N, Knight D, Braun E, Bausch A, 2011. Field guide for forest biomass and carbon estimation, Falmouth.
Wauters JB, Coudert S, Grallien E, Jonard M, Ponette Q, 2008. Carbon stock in rubber tree plantations in Western Ghana and Mato Grosso (Brazil), accessed on 23.08.2013, http://www.sciencedirect.com/science/article/pii/S0378112708000224?np=y
White D, 2011. Estimating the opportunity costs of REDD+: A training manual, 262 p.
World Bank, 2006. Ghana: Country environmental analysis, Africa Region.
World Bank, 2013. Data: Ghana. World Bank, accessed on 11.08.2013, http://data.world-bank.org/country/ghana
Zanne AE, Lopez-Gonzales G, Coomes DA, Ilic J, Jansen S, Lewis SL, Miller RB, Swenson N, 2009. Global wood density database, datadryad.org/bitstream/handle/10255/…/Glo-balWoodDensityDatabase.xls
Zekri M, 2011. Factors affecting citrus production and quality.
Land use systems in Ghana's Central Region and their potential for REDD+
55
Annex
Annex 1: Map Asikuma-Odoben-Brakwa district .......................................................................................... 56
Annex 2: Map sample plots ......................................................................................................................... 57
Annex 3: Pictures Cocoa .............................................................................................................................. 58
Annex 4: Pictures oil palm ........................................................................................................................... 58
Annex 5: Pictures citrus ............................................................................................................................... 59
Annex 6: Pictures rubber ............................................................................................................................. 60
Annex 7: Pictures Portal Plantation ............................................................................................................. 61
Annex 8: Field protocol ............................................................................................................................... 62
Annex 9: Prevalence of tree species ............................................................................................................. 66
Annex 10: Results questionnaires ................................................................................................................ 68
Annex 11: Results carbon calculations ......................................................................................................... 72

Land use systems in Ghana's Central Region and their potential for REDD+
56
Annex 1: Map Asikuma-Odoben-Brakwa district
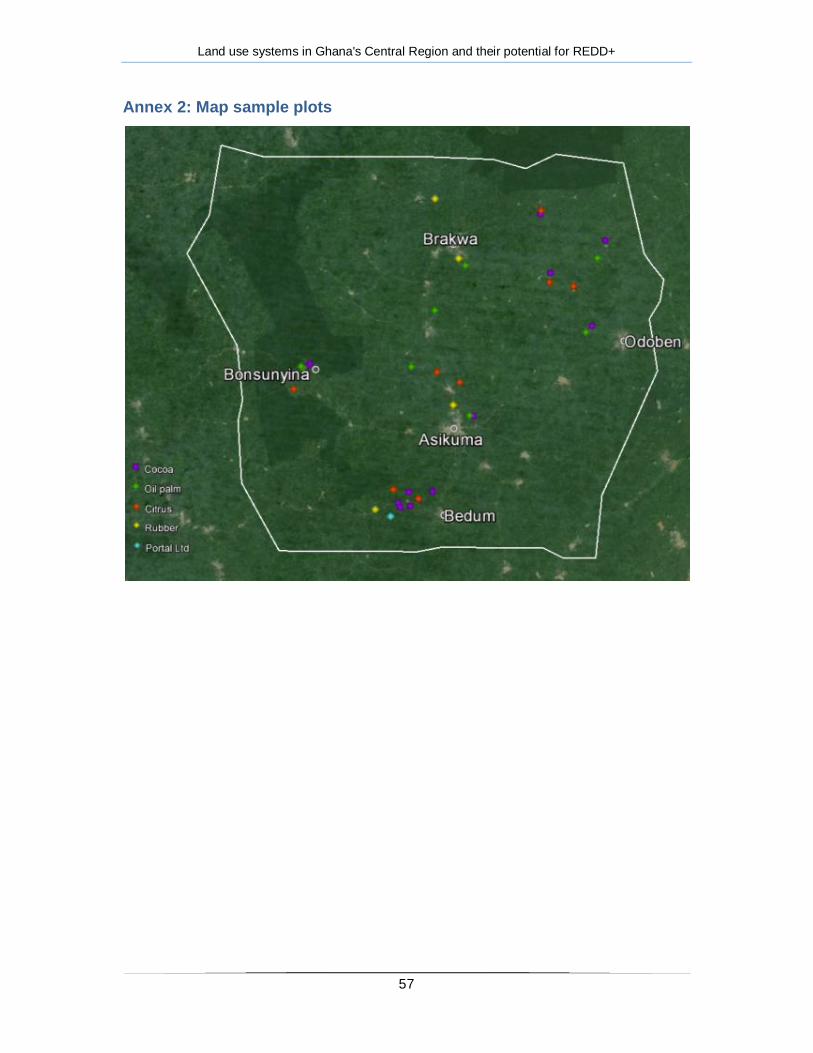
Land use systems in Ghana's Central Region and their potential for REDD+
57
Annex 2: Map sample plots
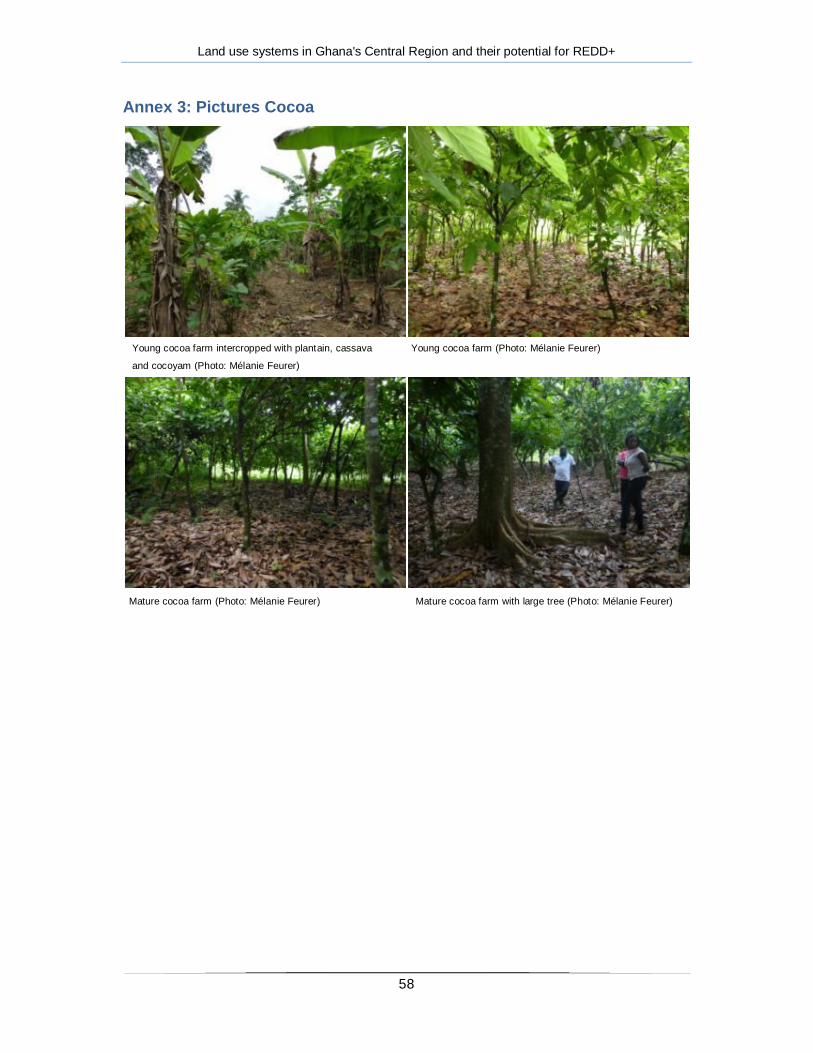
Land use systems in Ghana's Central Region and their potential for REDD+
58
Annex 3: Pictures Cocoa
Young cocoa farm intercropped with plantain, cassava
and cocoyam (Photo: Mélanie Feurer)
Young cocoa farm (Photo: Mélanie Feurer)
Mature cocoa farm (Photo: Mélanie Feurer) Mature cocoa farm with large tree (Photo: Mélanie Feurer)
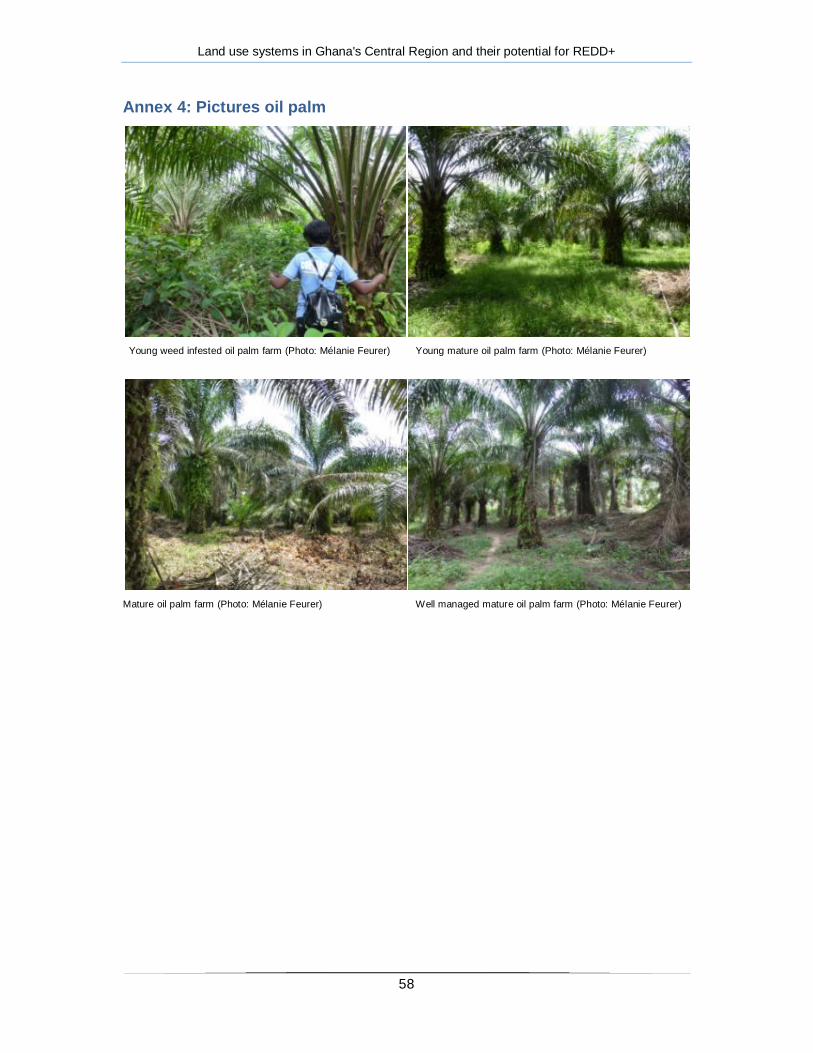
Land use systems in Ghana's Central Region and their potential for REDD+
58
Annex 4: Pictures oil palm
Young weed infested oil palm farm (Photo: Mélanie Feurer) Young mature oil palm farm (Photo: Mélanie Feurer)
Mature oil palm farm (Photo: Mélanie Feurer) Well managed mature oil palm farm (Photo: Mélanie Feurer)
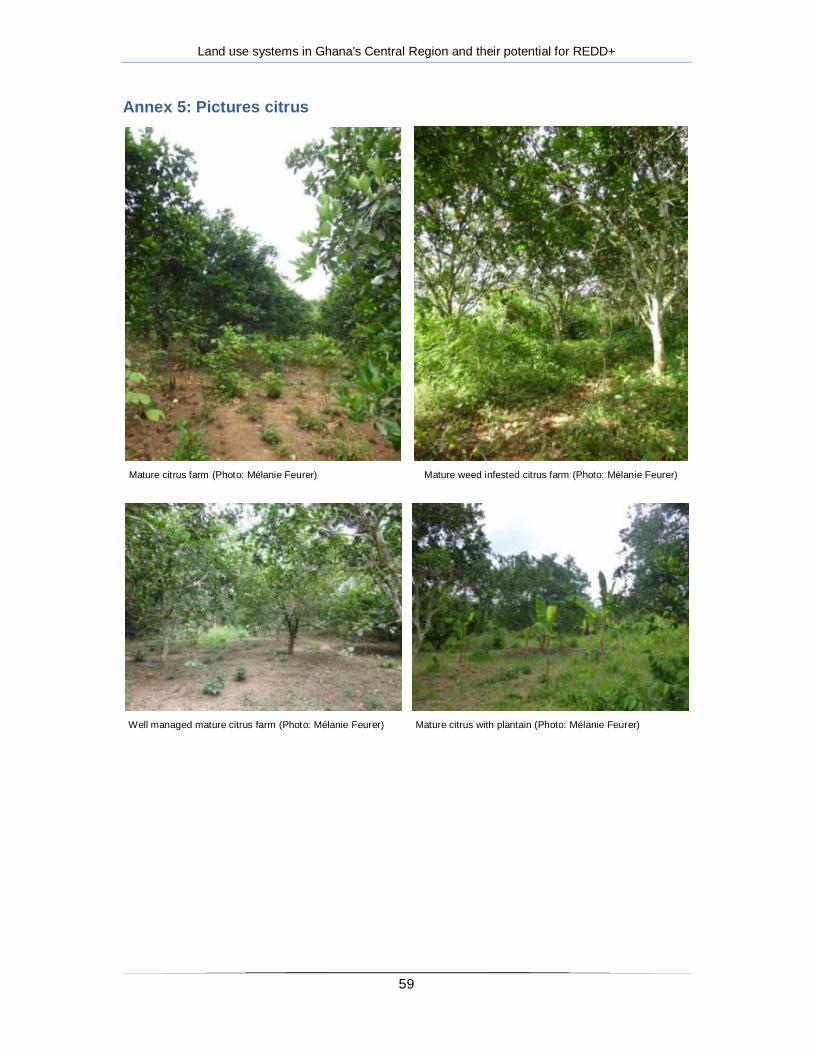
Land use systems in Ghana's Central Region and their potential for REDD+
59
Annex 5: Pictures citrus
Mature citrus farm (Photo: Mélanie Feurer) Mature weed infested citrus farm (Photo: Mélanie Feurer)
Well managed mature citrus farm (Photo: Mélanie Feurer) Mature citrus with plantain (Photo: Mélanie Feurer)
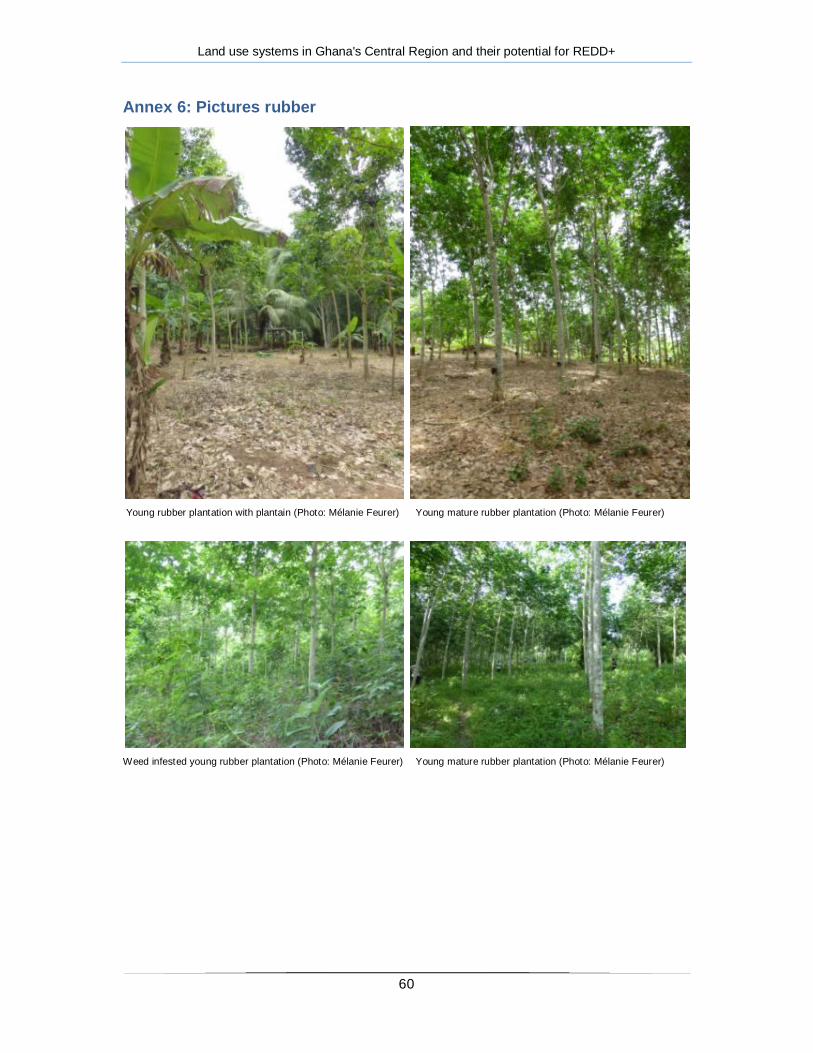
Land use systems in Ghana's Central Region and their potential for REDD+
60
Annex 6: Pictures rubber
Young rubber plantation with plantain (Photo: Mélanie Feurer) Young mature rubber plantation (Photo: Mélanie Feurer)
Weed infested young rubber plantation (Photo: Mélanie Feurer) Young mature rubber plantation (Photo: Mélanie Feurer)
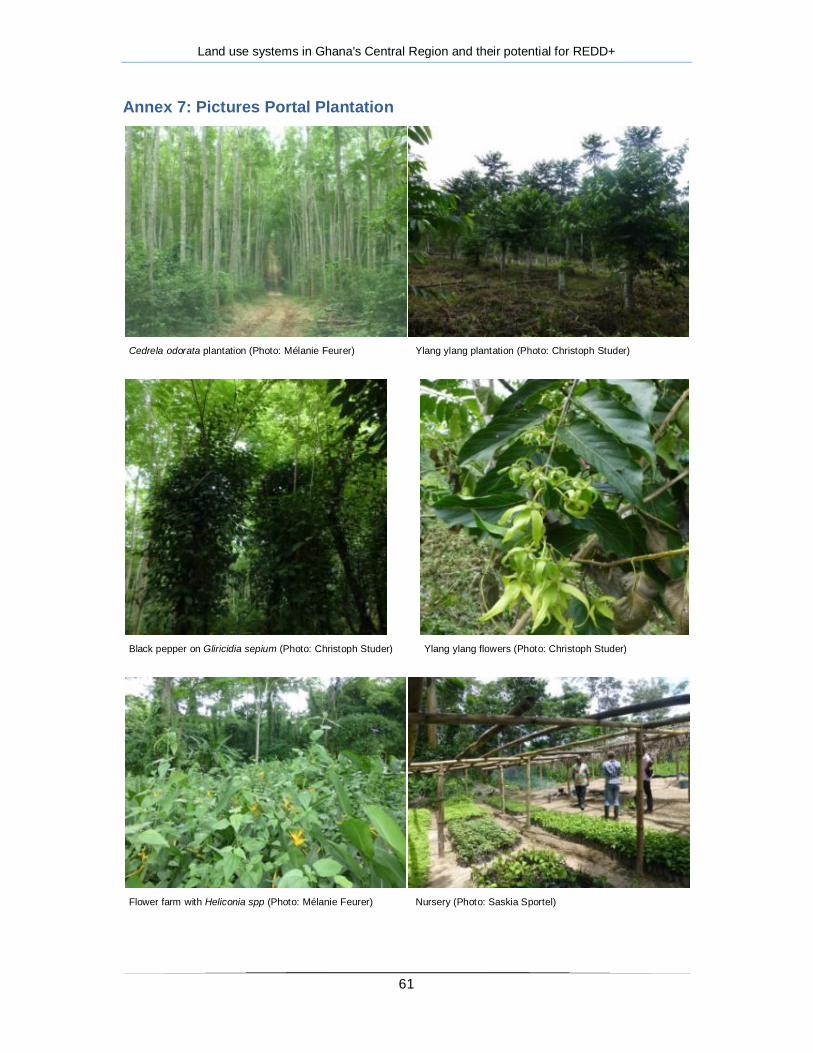
Land use systems in Ghana's Central Region and their potential for REDD+
61
Annex 7: Pictures Portal Plantation
Cedrela odorata plantation (Photo: Mélanie Feurer) Ylang ylang plantation (Photo: Christoph Studer)
Black pepper on Gliricidia sepium (Photo: Christoph Studer) Ylang ylang flowers (Photo: Christoph Studer)
Flower farm with Heliconia spp (Photo: Mélanie Feurer) Nursery (Photo: Saskia Sportel)
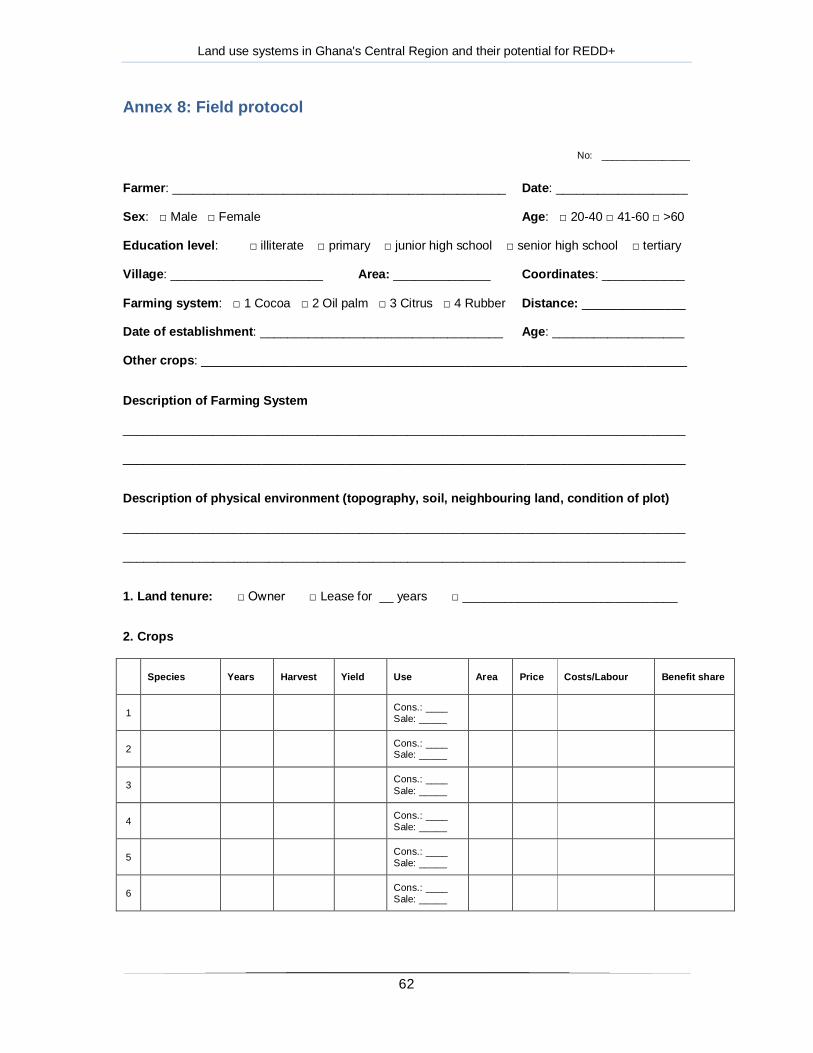
Land use systems in Ghana's Central Region and their potential for REDD+
62
Annex 8: Field protocol
No: ________________
Farmer: ________________________________________________ Date: ___________________
Sex: □ Male □ Female Age: □ 20-40 □ 41-60 □ >60
Education level: □ illiterate □ primary □ junior high school □ senior high school □ tertiary
Village: ______________________ Area: ______________ Coordinates: ____________
Farming system: □ 1 Cocoa □ 2 Oil palm □ 3 Citrus □ 4 Rubber Distance: _______________
Date of establishment: ___________________________________ Age: ___________________
Other crops: ______________________________________________________________________
Description of Farming System
_________________________________________________________________________________
_________________________________________________________________________________
Description of physical environment (topography, soil, neighbouring land, condition of plot)
_________________________________________________________________________________
_________________________________________________________________________________
1. Land tenure: □ Owner □ Lease for __ years □ _______________________________
2. Crops
Species Years Harvest Yield Use Area Price Costs/Labour Benefit share
1 Cons.: ____ Sale: _____
2 Cons.: ____ Sale: _____
3 Cons.: ____ Sale: _____
4 Cons.: ____ Sale: _____
5 Cons.: ____ Sale: _____
6 Cons.: ____ Sale: _____
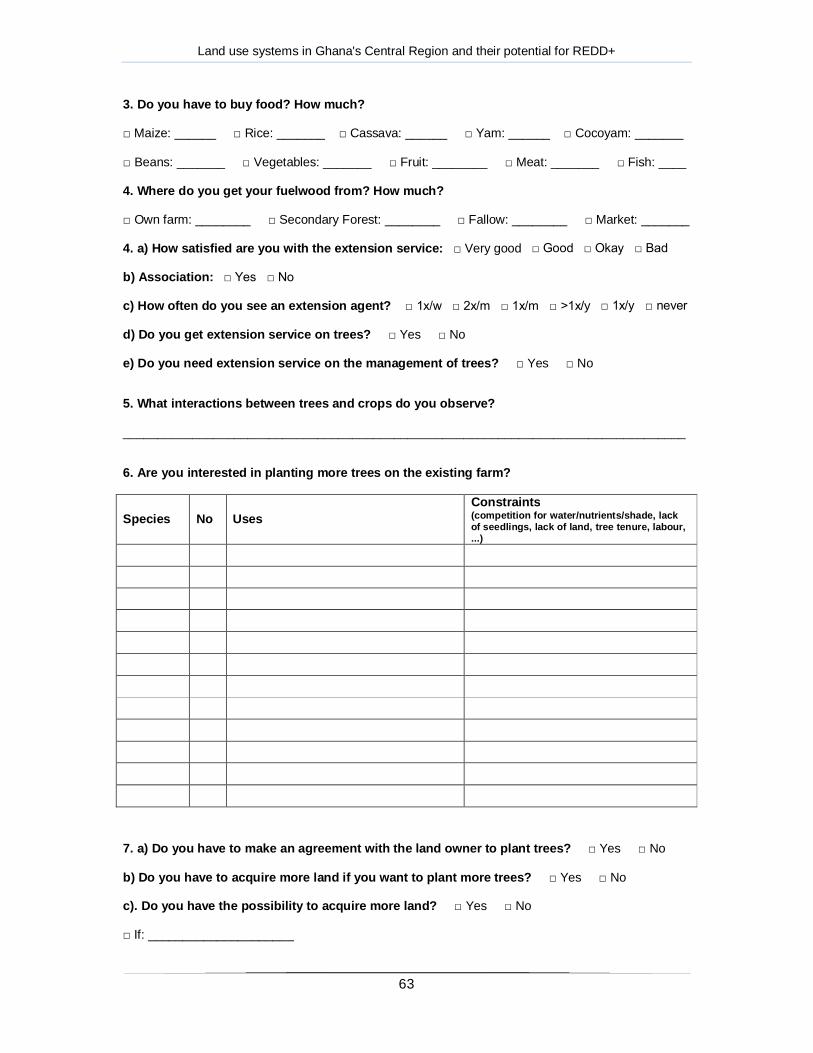
Land use systems in Ghana's Central Region and their potential for REDD+
63
3. Do you have to buy food? How much?
□ Maize: ______ □ Rice: _______ □ Cassava: ______ □ Yam: ______ □ Cocoyam: _______
□ Beans: _______ □ Vegetables: _______ □ Fruit: ________ □ Meat: _______ □ Fish: ____
4. Where do you get your fuelwood from? How much?
□ Own farm: ________ □ Secondary Forest: ________ □ Fallow: ________ □ Market: _______
4. a) How satisfied are you with the extension service: □ Very good □ Good □ Okay □ Bad
b) Association: □ Yes □ No
c) How often do you see an extension agent? □ 1x/w □ 2x/m □ 1x/m □ >1x/y □ 1x/y □ never
d) Do you get extension service on trees? □ Yes □ No
e) Do you need extension service on the management of trees? □ Yes □ No
5. What interactions between trees and crops do you observe?
_________________________________________________________________________________
6. Are you interested in planting more trees on the existing farm?
Species No Uses Constraints (competition for water/nutrients/shade, lack of seedlings, lack of land, tree tenure, labour, ...)
7. a) Do you have to make an agreement with the land owner to plant trees? □ Yes □ No
b) Do you have to acquire more land if you want to plant more trees? □ Yes □ No
c). Do you have the possibility to acquire more land? □ Yes □ No
□ If: _____________________
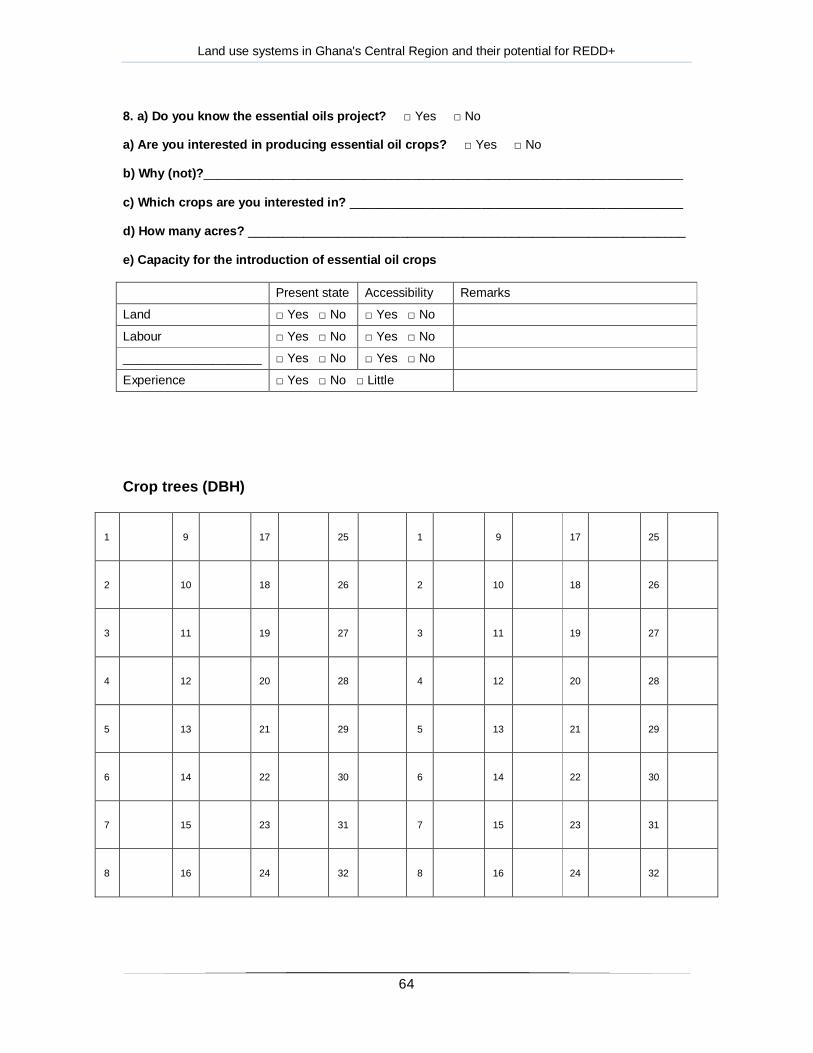
Land use systems in Ghana's Central Region and their potential for REDD+
64
8. a) Do you know the essential oils project? □ Yes □ No
a) Are you interested in producing essential oil crops? □ Yes □ No
b) Why (not)?_____________________________________________________________________
c) Which crops are you interested in? ________________________________________________
d) How many acres? _______________________________________________________________
e) Capacity for the introduction of essential oil crops
Present state Accessibility Remarks
Land □ Yes □ No □ Yes □ No
Labour □ Yes □ No □ Yes □ No
____________________ □ Yes □ No □ Yes □ No
Experience □ Yes □ No □ Little
Crop trees (DBH)
1 9 17 25 1 9 17 25
2 10 18 26 2 10 18 26
3 11 19 27 3 11 19 27
4 12 20 28 4 12 20 28
5 13 21 29 5 13 21 29
6 14 22 30 6 14 22 30
7 15 23 31 7 15 23 31
8 16 24 32 8 16 24 32
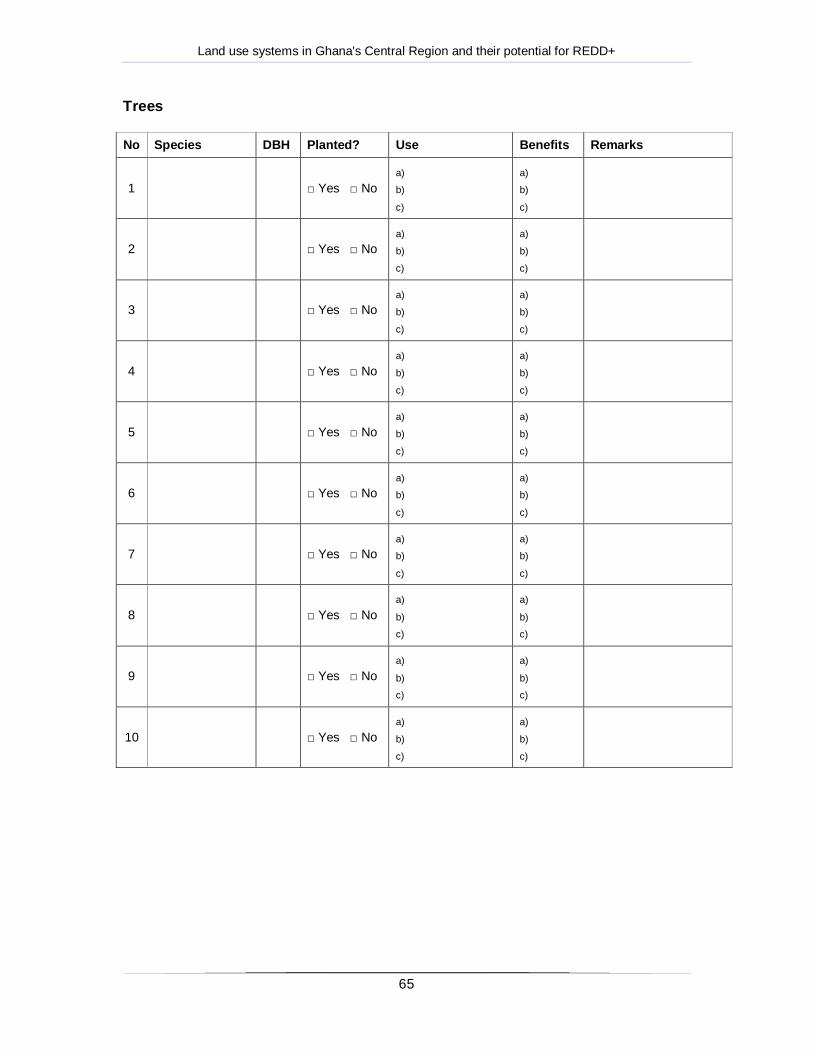
Land use systems in Ghana's Central Region and their potential for REDD+
65
Trees
No Species DBH Planted? Use Benefits Remarks
1 □ Yes □ No
a)
b)
c)
a)
b)
c)
2 □ Yes □ No
a)
b)
c)
a)
b)
c)
3 □ Yes □ No
a)
b)
c)
a)
b)
c)
4 □ Yes □ No
a)
b)
c)
a)
b)
c)
5 □ Yes □ No
a)
b)
c)
a)
b)
c)
6 □ Yes □ No
a)
b)
c)
a)
b)
c)
7 □ Yes □ No
a)
b)
c)
a)
b)
c)
8 □ Yes □ No
a)
b)
c)
a)
b)
c)
9 □ Yes □ No
a)
b)
c)
a)
b)
c)
10 □ Yes □ No
a)
b)
c)
a)
b)
c)

Land use systems in Ghana's Central Region and their potential for REDD+
66
Annex 9: Prevalence of tree species
Local name Scientific name Number of trees Use
<10 10-29 30+ Total T R F C M O
1 Konkroma Morinda lucida 39 38 3 80 X X X
2 Pawpaw Carica papaya 26 16 - 42 X X
3 Kakapenpen Rauvolfia vomitoria 18 11 - 29 X X X
4 Badua Phyllanthus muellerianus 10 8 - 18 X X X
5 Foto Glyphea brevis 6 10 1 17 X X
6 Sese Holarrhena floribunda 12 5 - 17 X X
7 Nyankyerenee Ficus exasperata 9 2 4 15 X X
8 Ofram Terminalia superba 2 7 - 9 X X X
9 Okoro Albizia glaberrima 2 4 2 8 X X
10 Odum Milicia excelsa 3 4 1 8 X X X
11 Sweet Apple Annona squamosa 7 1 - 8 X X
12 Funtum Funtumia elastica 4 1 2 7 X X X
13 Nwaduaba Ficus sur 7 - - 7 X X
14 Cassia Cassia simea 6 - - 6 X
15 Pear Persea americana 2 3 - 5 X X
16 Nyamedua Alstonia boonei 3 2 - 5 X X X
17 Akye Blighia sapida 5 - - 5 X X X
18 Citrus Citrus sinensis - 3 1 4 X X
19 Odom Erythrophleum suaveolens 2 1 1 4 X
20 Gyama Alchornea cordifolia 4 - - 4 X X
21 Kube Cocos nucifera - 2 1 3 X X
22 Onyina Ceiba pentandra 1 1 1 3 X
23 Pampena Albizia adianthifolia 2 1 - 3 X X X
24 Atoa Spondias mombin 1 2 - 3 X X
25 Pepediwuo Solanum erianthum 3 - - 3 X X
26 Mahogany Khaya ivorensis - - 2 2 X
27 Esa Celtis mildbraedii 1 - 1 2 X X
28 Otwere Diospyros mobutensis 1 - 1 2 X
29 Obontoriwa - 1 - 1 2 X X X
30 Frafraho Dalbergiella welwitschii 2 - - 2 X X X
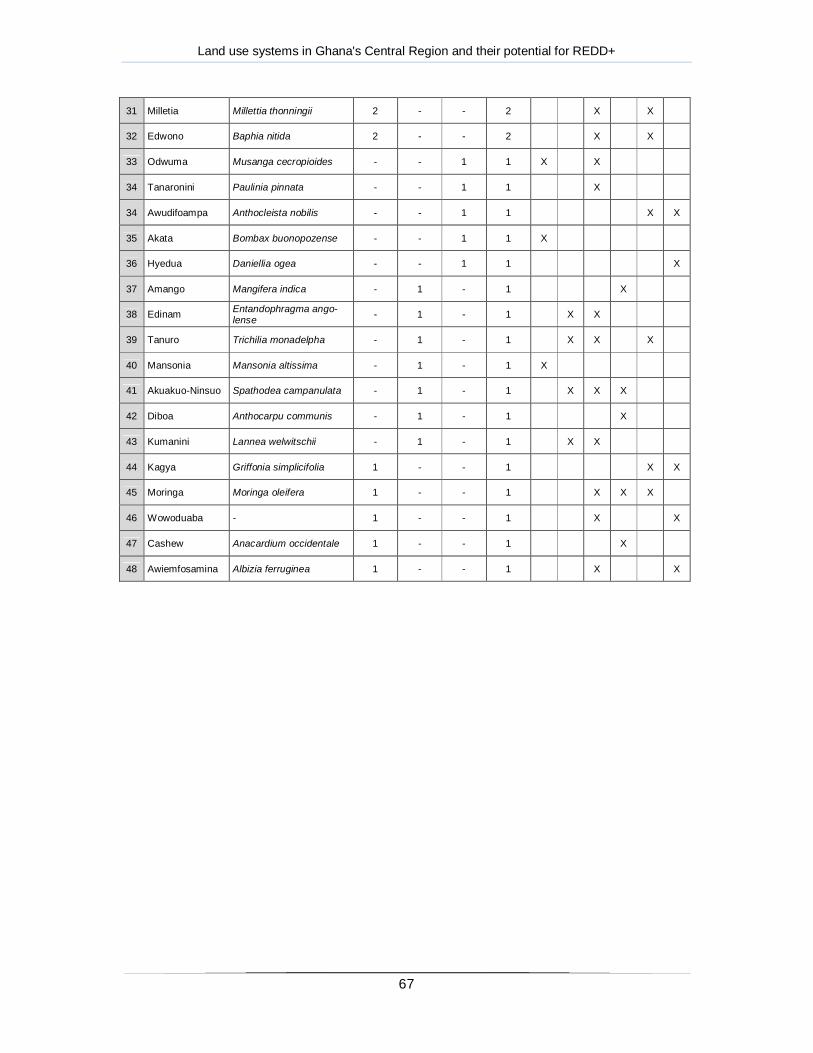
Land use systems in Ghana's Central Region and their potential for REDD+
67
31 Milletia Millettia thonningii 2 - - 2 X X
32 Edwono Baphia nitida 2 - - 2 X X
33 Odwuma Musanga cecropioides - - 1 1 X X
34 Tanaronini Paulinia pinnata - - 1 1 X
34 Awudifoampa Anthocleista nobilis - - 1 1 X X
35 Akata Bombax buonopozense - - 1 1 X
36 Hyedua Daniellia ogea - - 1 1 X
37 Amango Mangifera indica - 1 - 1 X
38 Edinam Entandophragma ango-lense - 1 - 1 X X
39 Tanuro Trichilia monadelpha - 1 - 1 X X X
40 Mansonia Mansonia altissima - 1 - 1 X
41 Akuakuo-Ninsuo Spathodea campanulata - 1 - 1 X X X
42 Diboa Anthocarpu communis - 1 - 1 X
43 Kumanini Lannea welwitschii - 1 - 1 X X
44 Kagya Griffonia simplicifolia 1 - - 1 X X
45 Moringa Moringa oleifera 1 - - 1 X X X
46 Wowoduaba - 1 - - 1 X X
47 Cashew Anacardium occidentale 1 - - 1 X
48 Awiemfosamina Albizia ferruginea 1 - - 1 X X
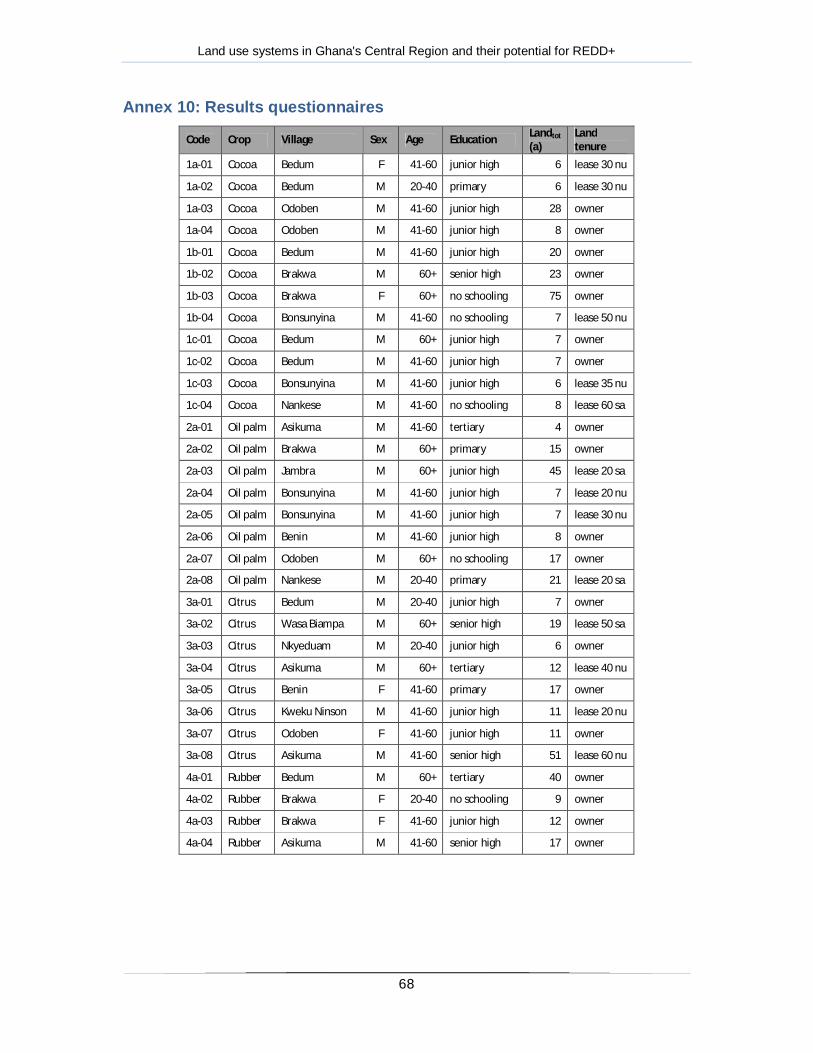
Land use systems in Ghana's Central Region and their potential for REDD+
68
Annex 10: Results questionnaires
Code Crop Village Sex Age Education Landtot
(a) Land tenure
1a-01 Cocoa Bedum F 41-60 junior high 6 lease 30 nu
1a-02 Cocoa Bedum M 20-40 primary 6 lease 30 nu
1a-03 Cocoa Odoben M 41-60 junior high 28 owner
1a-04 Cocoa Odoben M 41-60 junior high 8 owner
1b-01 Cocoa Bedum M 41-60 junior high 20 owner
1b-02 Cocoa Brakwa M 60+ senior high 23 owner
1b-03 Cocoa Brakwa F 60+ no schooling 75 owner
1b-04 Cocoa Bonsunyina M 41-60 no schooling 7 lease 50 nu
1c-01 Cocoa Bedum M 60+ junior high 7 owner
1c-02 Cocoa Bedum M 41-60 junior high 7 owner
1c-03 Cocoa Bonsunyina M 41-60 junior high 6 lease 35 nu
1c-04 Cocoa Nankese M 41-60 no schooling 8 lease 60 sa
2a-01 Oil palm Asikuma M 41-60 tertiary 4 owner
2a-02 Oil palm Brakwa M 60+ primary 15 owner
2a-03 Oil palm Jambra M 60+ junior high 45 lease 20 sa
2a-04 Oil palm Bonsunyina M 41-60 junior high 7 lease 20 nu
2a-05 Oil palm Bonsunyina M 41-60 junior high 7 lease 30 nu
2a-06 Oil palm Benin M 41-60 junior high 8 owner
2a-07 Oil palm Odoben M 60+ no schooling 17 owner
2a-08 Oil palm Nankese M 20-40 primary 21 lease 20 sa
3a-01 Citrus Bedum M 20-40 junior high 7 owner
3a-02 Citrus Wasa Biampa M 60+ senior high 19 lease 50 sa
3a-03 Citrus Nkyeduam M 20-40 junior high 6 owner
3a-04 Citrus Asikuma M 60+ tertiary 12 lease 40 nu
3a-05 Citrus Benin F 41-60 primary 17 owner
3a-06 Citrus Kweku Ninson M 41-60 junior high 11 lease 20 nu
3a-07 Citrus Odoben F 41-60 junior high 11 owner
3a-08 Citrus Asikuma M 41-60 senior high 51 lease 60 nu
4a-01 Rubber Bedum M 60+ tertiary 40 owner
4a-02 Rubber Brakwa F 20-40 no schooling 9 owner
4a-03 Rubber Brakwa F 41-60 junior high 12 owner
4a-04 Rubber Asikuma M 41-60 senior high 17 owner
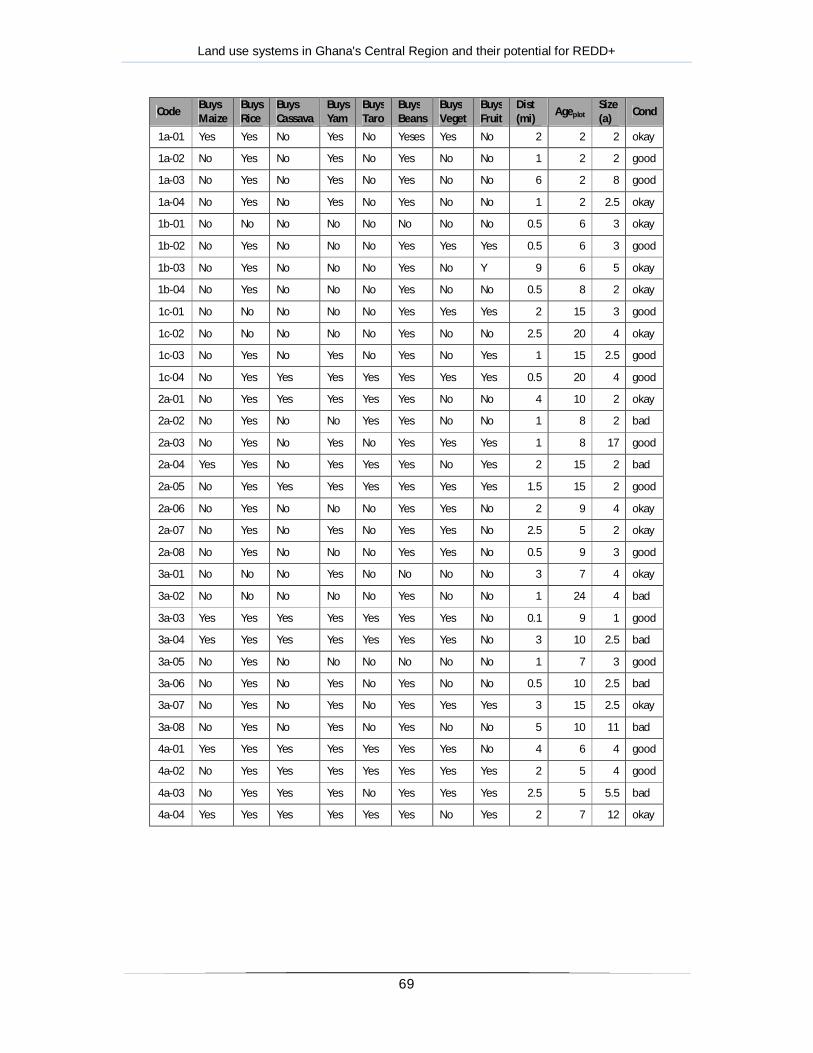
Land use systems in Ghana's Central Region and their potential for REDD+
69
Code Buys Maize
Buys Rice
Buys Cassava
Buys Yam
Buys Taro
Buys Beans
Buys Veget
Buys Fruit
Dist (mi) Ageplot
Size (a) Cond
1a-01 Yes Yes No Yes No Yeses Yes No 2 2 2 okay
1a-02 No Yes No Yes No Yes No No 1 2 2 good
1a-03 No Yes No Yes No Yes No No 6 2 8 good
1a-04 No Yes No Yes No Yes No No 1 2 2.5 okay
1b-01 No No No No No No No No 0.5 6 3 okay
1b-02 No Yes No No No Yes Yes Yes 0.5 6 3 good
1b-03 No Yes No No No Yes No Y 9 6 5 okay
1b-04 No Yes No No No Yes No No 0.5 8 2 okay
1c-01 No No No No No Yes Yes Yes 2 15 3 good
1c-02 No No No No No Yes No No 2.5 20 4 okay
1c-03 No Yes No Yes No Yes No Yes 1 15 2.5 good
1c-04 No Yes Yes Yes Yes Yes Yes Yes 0.5 20 4 good
2a-01 No Yes Yes Yes Yes Yes No No 4 10 2 okay
2a-02 No Yes No No Yes Yes No No 1 8 2 bad
2a-03 No Yes No Yes No Yes Yes Yes 1 8 17 good
2a-04 Yes Yes No Yes Yes Yes No Yes 2 15 2 bad
2a-05 No Yes Yes Yes Yes Yes Yes Yes 1.5 15 2 good
2a-06 No Yes No No No Yes Yes No 2 9 4 okay
2a-07 No Yes No Yes No Yes Yes No 2.5 5 2 okay
2a-08 No Yes No No No Yes Yes No 0.5 9 3 good
3a-01 No No No Yes No No No No 3 7 4 okay
3a-02 No No No No No Yes No No 1 24 4 bad
3a-03 Yes Yes Yes Yes Yes Yes Yes No 0.1 9 1 good
3a-04 Yes Yes Yes Yes Yes Yes Yes No 3 10 2.5 bad
3a-05 No Yes No No No No No No 1 7 3 good
3a-06 No Yes No Yes No Yes No No 0.5 10 2.5 bad
3a-07 No Yes No Yes No Yes Yes Yes 3 15 2.5 okay
3a-08 No Yes No Yes No Yes No No 5 10 11 bad
4a-01 Yes Yes Yes Yes Yes Yes Yes No 4 6 4 good
4a-02 No Yes Yes Yes Yes Yes Yes Yes 2 5 4 good
4a-03 No Yes Yes Yes No Yes Yes Yes 2.5 5 5.5 bad
4a-04 Yes Yes Yes Yes Yes Yes No Yes 2 7 12 okay
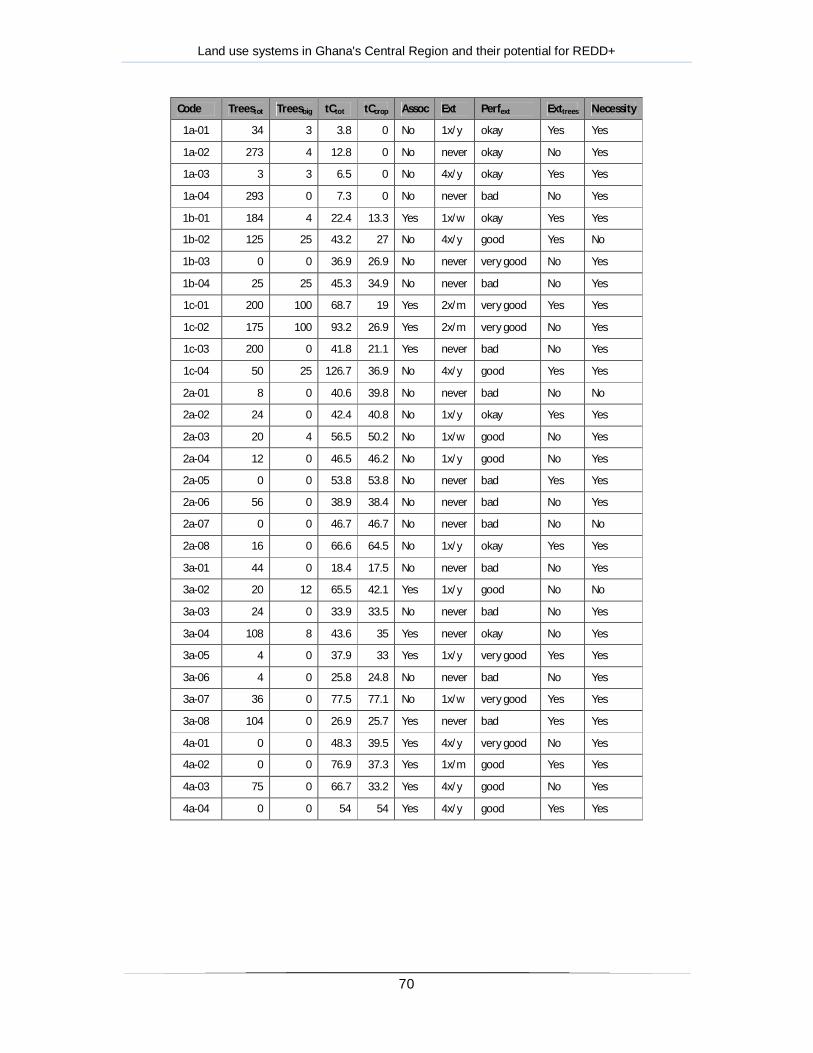
Land use systems in Ghana's Central Region and their potential for REDD+
70
Code Treestot Treesbig tCtot tCcrop Assoc Ext Perfext Exttrees Necessity
1a-01 34 3 3.8 0 No 1x/y okay Yes Yes
1a-02 273 4 12.8 0 No never okay No Yes
1a-03 3 3 6.5 0 No 4x/y okay Yes Yes
1a-04 293 0 7.3 0 No never bad No Yes
1b-01 184 4 22.4 13.3 Yes 1x/w okay Yes Yes
1b-02 125 25 43.2 27 No 4x/y good Yes No
1b-03 0 0 36.9 26.9 No never very good No Yes
1b-04 25 25 45.3 34.9 No never bad No Yes
1c-01 200 100 68.7 19 Yes 2x/m very good Yes Yes
1c-02 175 100 93.2 26.9 Yes 2x/m very good No Yes
1c-03 200 0 41.8 21.1 Yes never bad No Yes
1c-04 50 25 126.7 36.9 No 4x/y good Yes Yes
2a-01 8 0 40.6 39.8 No never bad No No
2a-02 24 0 42.4 40.8 No 1x/y okay Yes Yes
2a-03 20 4 56.5 50.2 No 1x/w good No Yes
2a-04 12 0 46.5 46.2 No 1x/y good No Yes
2a-05 0 0 53.8 53.8 No never bad Yes Yes
2a-06 56 0 38.9 38.4 No never bad No Yes
2a-07 0 0 46.7 46.7 No never bad No No
2a-08 16 0 66.6 64.5 No 1x/y okay Yes Yes
3a-01 44 0 18.4 17.5 No never bad No Yes
3a-02 20 12 65.5 42.1 Yes 1x/y good No No
3a-03 24 0 33.9 33.5 No never bad No Yes
3a-04 108 8 43.6 35 Yes never okay No Yes
3a-05 4 0 37.9 33 Yes 1x/y very good Yes Yes
3a-06 4 0 25.8 24.8 No never bad No Yes
3a-07 36 0 77.5 77.1 No 1x/w very good Yes Yes
3a-08 104 0 26.9 25.7 Yes never bad Yes Yes
4a-01 0 0 48.3 39.5 Yes 4x/y very good No Yes
4a-02 0 0 76.9 37.3 Yes 1x/m good Yes Yes
4a-03 75 0 66.7 33.2 Yes 4x/y good No Yes
4a-04 0 0 54 54 Yes 4x/y good Yes Yes
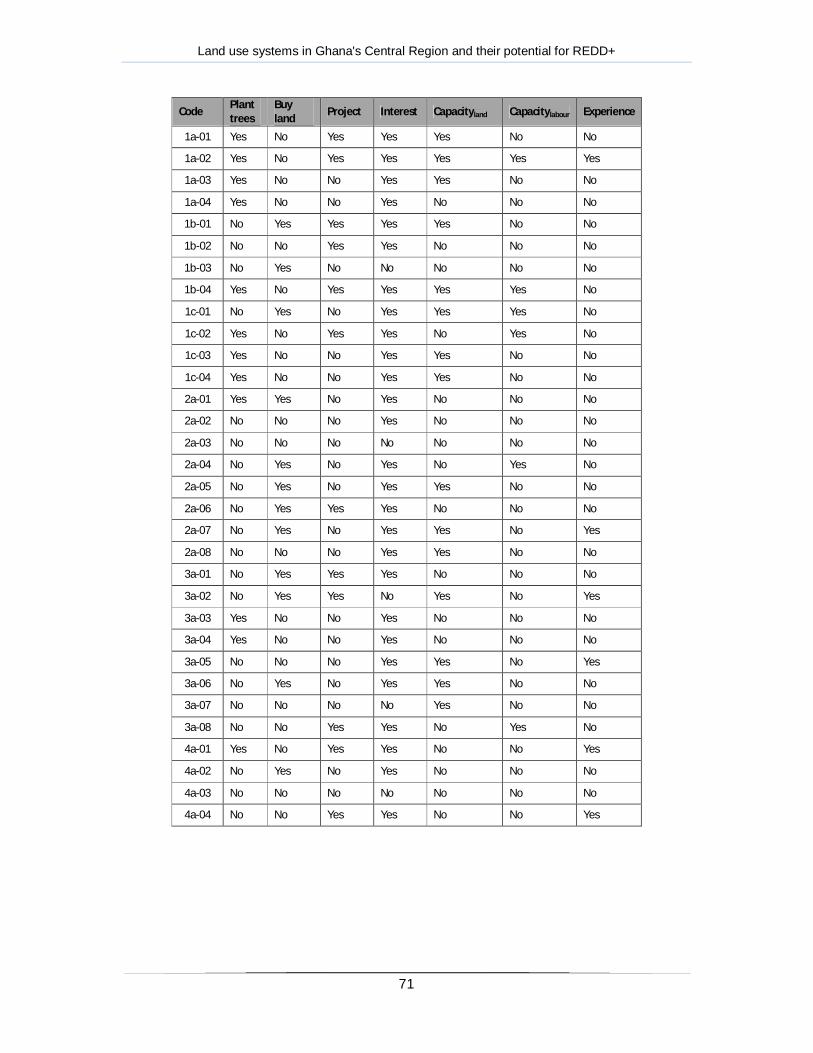
Land use systems in Ghana's Central Region and their potential for REDD+
71
Code Plant trees
Buy land Project Interest Capacityland Capacitylabour Experience
1a-01 Yes No Yes Yes Yes No No
1a-02 Yes No Yes Yes Yes Yes Yes
1a-03 Yes No No Yes Yes No No
1a-04 Yes No No Yes No No No
1b-01 No Yes Yes Yes Yes No No
1b-02 No No Yes Yes No No No
1b-03 No Yes No No No No No
1b-04 Yes No Yes Yes Yes Yes No
1c-01 No Yes No Yes Yes Yes No
1c-02 Yes No Yes Yes No Yes No
1c-03 Yes No No Yes Yes No No
1c-04 Yes No No Yes Yes No No
2a-01 Yes Yes No Yes No No No
2a-02 No No No Yes No No No
2a-03 No No No No No No No
2a-04 No Yes No Yes No Yes No
2a-05 No Yes No Yes Yes No No
2a-06 No Yes Yes Yes No No No
2a-07 No Yes No Yes Yes No Yes
2a-08 No No No Yes Yes No No
3a-01 No Yes Yes Yes No No No
3a-02 No Yes Yes No Yes No Yes
3a-03 Yes No No Yes No No No
3a-04 Yes No No Yes No No No
3a-05 No No No Yes Yes No Yes
3a-06 No Yes No Yes Yes No No
3a-07 No No No No Yes No No
3a-08 No No Yes Yes No Yes No
4a-01 Yes No Yes Yes No No Yes
4a-02 No Yes No Yes No No No
4a-03 No No No No No No No
4a-04 No No Yes Yes No No Yes
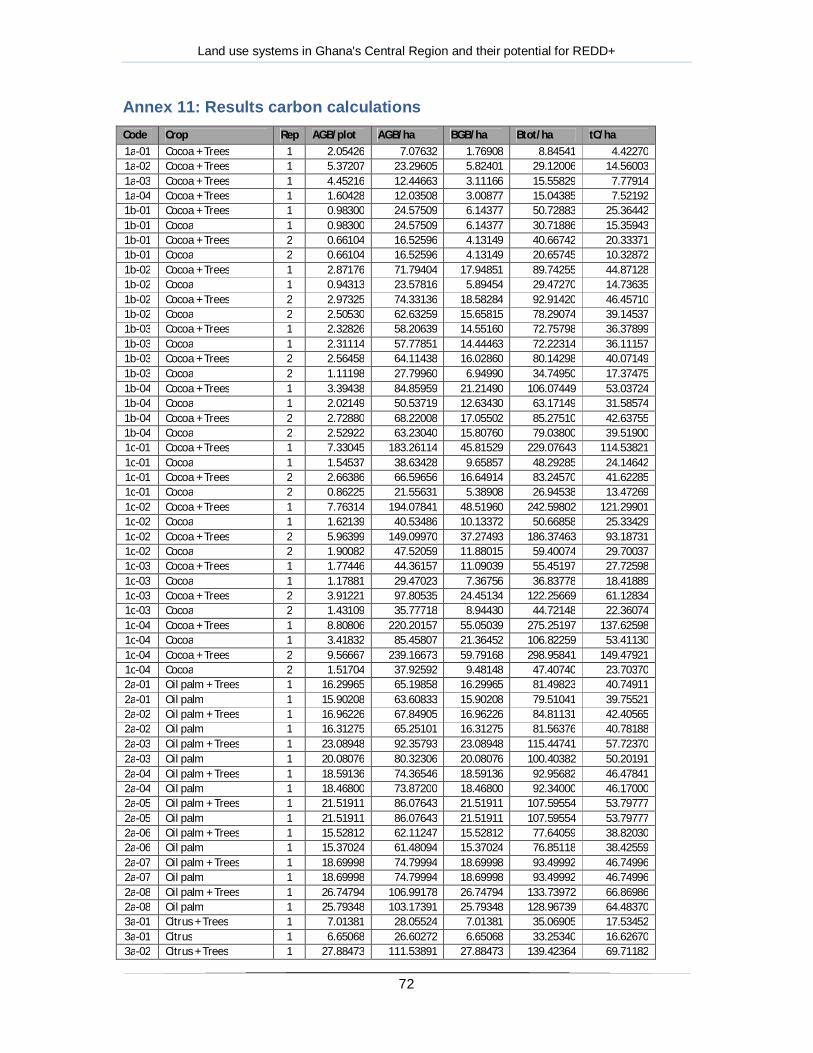
Land use systems in Ghana's Central Region and their potential for REDD+
72
Annex 11: Results carbon calculations Code Crop Rep AGB/plot AGB/ha BGB/ha Btot/ha tC/ha 1a-01 Cocoa + Trees 1 2.05426 7.07632 1.76908 8.84541 4.42270 1a-02 Cocoa + Trees 1 5.37207 23.29605 5.82401 29.12006 14.56003 1a-03 Cocoa + Trees 1 4.45216 12.44663 3.11166 15.55829 7.77914 1a-04 Cocoa + Trees 1 1.60428 12.03508 3.00877 15.04385 7.52192 1b-01 Cocoa + Trees 1 0.98300 24.57509 6.14377 50.72883 25.36442 1b-01 Cocoa 1 0.98300 24.57509 6.14377 30.71886 15.35943 1b-01 Cocoa + Trees 2 0.66104 16.52596 4.13149 40.66742 20.33371 1b-01 Cocoa 2 0.66104 16.52596 4.13149 20.65745 10.32872 1b-02 Cocoa + Trees 1 2.87176 71.79404 17.94851 89.74255 44.87128 1b-02 Cocoa 1 0.94313 23.57816 5.89454 29.47270 14.73635 1b-02 Cocoa + Trees 2 2.97325 74.33136 18.58284 92.91420 46.45710 1b-02 Cocoa 2 2.50530 62.63259 15.65815 78.29074 39.14537 1b-03 Cocoa + Trees 1 2.32826 58.20639 14.55160 72.75798 36.37899 1b-03 Cocoa 1 2.31114 57.77851 14.44463 72.22314 36.11157 1b-03 Cocoa + Trees 2 2.56458 64.11438 16.02860 80.14298 40.07149 1b-03 Cocoa 2 1.11198 27.79960 6.94990 34.74950 17.37475 1b-04 Cocoa + Trees 1 3.39438 84.85959 21.21490 106.07449 53.03724 1b-04 Cocoa 1 2.02149 50.53719 12.63430 63.17149 31.58574 1b-04 Cocoa + Trees 2 2.72880 68.22008 17.05502 85.27510 42.63755 1b-04 Cocoa 2 2.52922 63.23040 15.80760 79.03800 39.51900 1c-01 Cocoa + Trees 1 7.33045 183.26114 45.81529 229.07643 114.53821 1c-01 Cocoa 1 1.54537 38.63428 9.65857 48.29285 24.14642 1c-01 Cocoa + Trees 2 2.66386 66.59656 16.64914 83.24570 41.62285 1c-01 Cocoa 2 0.86225 21.55631 5.38908 26.94538 13.47269 1c-02 Cocoa + Trees 1 7.76314 194.07841 48.51960 242.59802 121.29901 1c-02 Cocoa 1 1.62139 40.53486 10.13372 50.66858 25.33429 1c-02 Cocoa + Trees 2 5.96399 149.09970 37.27493 186.37463 93.18731 1c-02 Cocoa 2 1.90082 47.52059 11.88015 59.40074 29.70037 1c-03 Cocoa + Trees 1 1.77446 44.36157 11.09039 55.45197 27.72598 1c-03 Cocoa 1 1.17881 29.47023 7.36756 36.83778 18.41889 1c-03 Cocoa + Trees 2 3.91221 97.80535 24.45134 122.25669 61.12834 1c-03 Cocoa 2 1.43109 35.77718 8.94430 44.72148 22.36074 1c-04 Cocoa + Trees 1 8.80806 220.20157 55.05039 275.25197 137.62598 1c-04 Cocoa 1 3.41832 85.45807 21.36452 106.82259 53.41130 1c-04 Cocoa + Trees 2 9.56667 239.16673 59.79168 298.95841 149.47921 1c-04 Cocoa 2 1.51704 37.92592 9.48148 47.40740 23.70370 2a-01 Oil palm + Trees 1 16.29965 65.19858 16.29965 81.49823 40.74911 2a-01 Oil palm 1 15.90208 63.60833 15.90208 79.51041 39.75521 2a-02 Oil palm + Trees 1 16.96226 67.84905 16.96226 84.81131 42.40565 2a-02 Oil palm 1 16.31275 65.25101 16.31275 81.56376 40.78188 2a-03 Oil palm + Trees 1 23.08948 92.35793 23.08948 115.44741 57.72370 2a-03 Oil palm 1 20.08076 80.32306 20.08076 100.40382 50.20191 2a-04 Oil palm + Trees 1 18.59136 74.36546 18.59136 92.95682 46.47841 2a-04 Oil palm 1 18.46800 73.87200 18.46800 92.34000 46.17000 2a-05 Oil palm + Trees 1 21.51911 86.07643 21.51911 107.59554 53.79777 2a-05 Oil palm 1 21.51911 86.07643 21.51911 107.59554 53.79777 2a-06 Oil palm + Trees 1 15.52812 62.11247 15.52812 77.64059 38.82030 2a-06 Oil palm 1 15.37024 61.48094 15.37024 76.85118 38.42559 2a-07 Oil palm + Trees 1 18.69998 74.79994 18.69998 93.49992 46.74996 2a-07 Oil palm 1 18.69998 74.79994 18.69998 93.49992 46.74996 2a-08 Oil palm + Trees 1 26.74794 106.99178 26.74794 133.73972 66.86986 2a-08 Oil palm 1 25.79348 103.17391 25.79348 128.96739 64.48370 3a-01 Citrus + Trees 1 7.01381 28.05524 7.01381 35.06905 17.53452 3a-01 Citrus 1 6.65068 26.60272 6.65068 33.25340 16.62670 3a-02 Citrus + Trees 1 27.88473 111.53891 27.88473 139.42364 69.71182
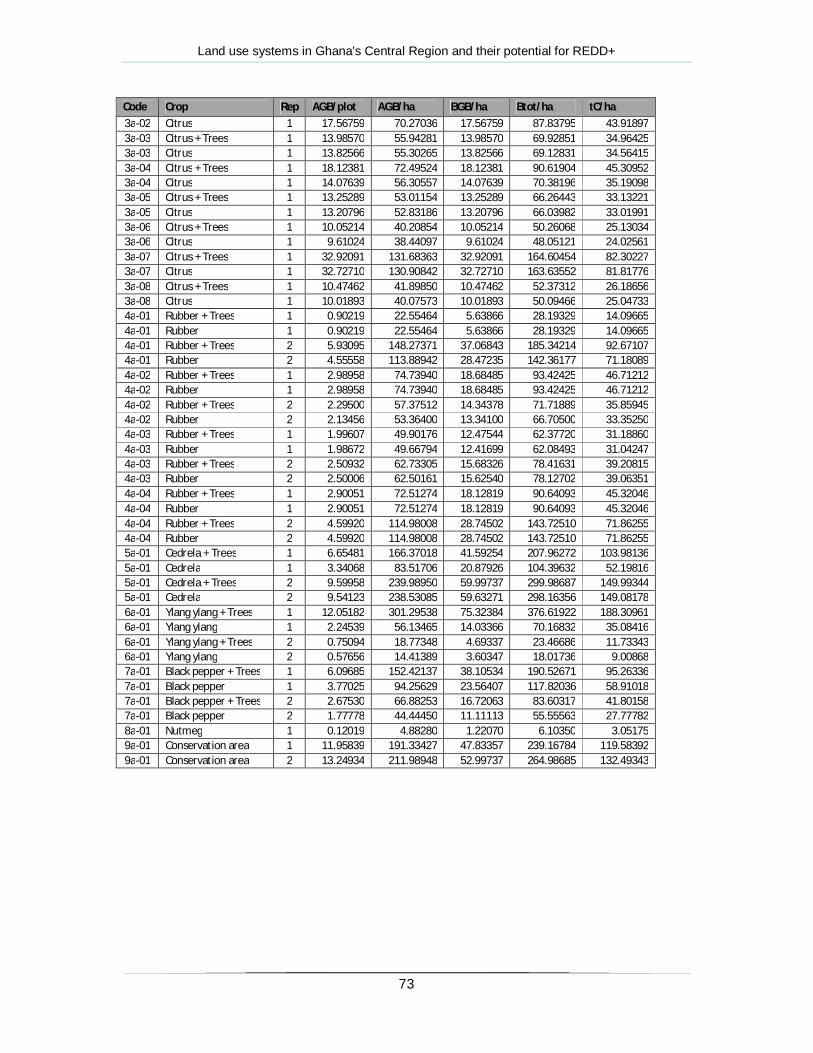
Land use systems in Ghana's Central Region and their potential for REDD+
73
Code Crop Rep AGB/plot AGB/ha BGB/ha Btot/ha tC/ha 3a-02 Citrus 1 17.56759 70.27036 17.56759 87.83795 43.91897 3a-03 Citrus + Trees 1 13.98570 55.94281 13.98570 69.92851 34.96425 3a-03 Citrus 1 13.82566 55.30265 13.82566 69.12831 34.56415 3a-04 Citrus + Trees 1 18.12381 72.49524 18.12381 90.61904 45.30952 3a-04 Citrus 1 14.07639 56.30557 14.07639 70.38196 35.19098 3a-05 Citrus + Trees 1 13.25289 53.01154 13.25289 66.26443 33.13221 3a-05 Citrus 1 13.20796 52.83186 13.20796 66.03982 33.01991 3a-06 Citrus + Trees 1 10.05214 40.20854 10.05214 50.26068 25.13034 3a-06 Citrus 1 9.61024 38.44097 9.61024 48.05121 24.02561 3a-07 Citrus + Trees 1 32.92091 131.68363 32.92091 164.60454 82.30227 3a-07 Citrus 1 32.72710 130.90842 32.72710 163.63552 81.81776 3a-08 Citrus + Trees 1 10.47462 41.89850 10.47462 52.37312 26.18656 3a-08 Citrus 1 10.01893 40.07573 10.01893 50.09466 25.04733 4a-01 Rubber + Trees 1 0.90219 22.55464 5.63866 28.19329 14.09665 4a-01 Rubber 1 0.90219 22.55464 5.63866 28.19329 14.09665 4a-01 Rubber + Trees 2 5.93095 148.27371 37.06843 185.34214 92.67107 4a-01 Rubber 2 4.55558 113.88942 28.47235 142.36177 71.18089 4a-02 Rubber + Trees 1 2.98958 74.73940 18.68485 93.42425 46.71212 4a-02 Rubber 1 2.98958 74.73940 18.68485 93.42425 46.71212 4a-02 Rubber + Trees 2 2.29500 57.37512 14.34378 71.71889 35.85945 4a-02 Rubber 2 2.13456 53.36400 13.34100 66.70500 33.35250 4a-03 Rubber + Trees 1 1.99607 49.90176 12.47544 62.37720 31.18860 4a-03 Rubber 1 1.98672 49.66794 12.41699 62.08493 31.04247 4a-03 Rubber + Trees 2 2.50932 62.73305 15.68326 78.41631 39.20815 4a-03 Rubber 2 2.50006 62.50161 15.62540 78.12702 39.06351 4a-04 Rubber + Trees 1 2.90051 72.51274 18.12819 90.64093 45.32046 4a-04 Rubber 1 2.90051 72.51274 18.12819 90.64093 45.32046 4a-04 Rubber + Trees 2 4.59920 114.98008 28.74502 143.72510 71.86255 4a-04 Rubber 2 4.59920 114.98008 28.74502 143.72510 71.86255 5a-01 Cedrela + Trees 1 6.65481 166.37018 41.59254 207.96272 103.98136 5a-01 Cedrela 1 3.34068 83.51706 20.87926 104.39632 52.19816 5a-01 Cedrela + Trees 2 9.59958 239.98950 59.99737 299.98687 149.99344 5a-01 Cedrela 2 9.54123 238.53085 59.63271 298.16356 149.08178 6a-01 Ylang ylang + Trees 1 12.05182 301.29538 75.32384 376.61922 188.30961 6a-01 Ylang ylang 1 2.24539 56.13465 14.03366 70.16832 35.08416 6a-01 Ylang ylang + Trees 2 0.75094 18.77348 4.69337 23.46686 11.73343 6a-01 Ylang ylang 2 0.57656 14.41389 3.60347 18.01736 9.00868 7a-01 Black pepper + Trees 1 6.09685 152.42137 38.10534 190.52671 95.26336 7a-01 Black pepper 1 3.77025 94.25629 23.56407 117.82036 58.91018 7a-01 Black pepper + Trees 2 2.67530 66.88253 16.72063 83.60317 41.80158 7a-01 Black pepper 2 1.77778 44.44450 11.11113 55.55563 27.77782 8a-01 Nutmeg 1 0.12019 4.88280 1.22070 6.10350 3.05175 9a-01 Conservation area 1 11.95839 191.33427 47.83357 239.16784 119.58392 9a-01 Conservation area 2 13.24934 211.98948 52.99737 264.98685 132.49343