Embed Size (px)
Citation preview

Freie Universität Berlin • Institute of Chemistry and Biochemistry
Genetic diversity in green algae (Hydrodictyaceae) obtained from modern and ancient
sedimentary DNA of Siberian lakes
Bachelor thesis
Submitted by
Jan Patrick Lütje
September 2014
Supervisor: Prof. Dr. Ulrike Herzschuh,
Alfred Wegener Institute for Polar and
Marine Research, Potsdam
Second Referee: Dr. Jens Peter Fürste,
Institute of Chemistry and
Biochemistry, Freie Universität Berlin

The present work was written between the 4th of August and 29th of September 2014. By
submitting this work, I declare that it was solely undertaken by me and that no help was
provided from other sources as those allowed. All source material that was used is listed
in part 6 “References”. Furthermore, I declare no competing financial interests or any
other conflict of interest.
Potsdam, 29th of September 2014
Jan Lütje

Bachelor thesis
3
Note of thanks
I wish to thank Prof. Dr. Ulrike Herzschuh (Alfred Wegener Institute for Polar and
Marine Research, Potsdam) and Dr. Jens Peter Fürste (Freie Universität Berlin) for their
willingness to review my work as supervisor and second referee, and Bastian Niemeyer
(AWI) for cartographic and algae pictures. In particular, my gratitude goes to Dr.
Kathleen Stoof-Leichsenring (AWI) for her supervision of my lab work and her
constant help and support during the process of data analysis, writing and review of my
thesis. Thank you also to the whole lab group at the AWI; your help and the pleasant
working atmosphere is greatly appreciated.

Bachelor thesis
4
Index
Abstract ............................................................................................................................. 6
Zusammenfassung ............................................................................................................ 7
1. Introduction ............................................................................................................... 9
1.1. Hydrodictyaceae ................................................................................................. 9
1.2. Pediastrum as bioindicator ............................................................................... 10
1.3. RbcL as genetic marker .................................................................................... 11
1.4. Environmental DNA and metabarcoding ......................................................... 11
1.5. Study area ......................................................................................................... 12
2. Objective .................................................................................................................. 14
3. Materials and Methods ............................................................................................ 15
3.1. Materials ........................................................................................................... 15
3.1.1. Chemicals and buffers .............................................................................. 15
3.1.2. Kits and other materials ............................................................................ 15
3.1.3. Laboratory equipment ............................................................................... 16
3.1.4. Samples ..................................................................................................... 17
3.2. Methods ............................................................................................................ 19
3.2.1. Security and decontamination measures ................................................... 19
3.2.2. DNA isolation ........................................................................................... 19
3.2.3. Preliminary experiment: primer test and PCR .......................................... 21
3.2.4. PCR ........................................................................................................... 22
3.2.5. Gel electrophoresis ................................................................................... 23
3.2.6. Purification ................................................................................................ 24
3.2.7. Cloning ...................................................................................................... 24
3.2.8. Sanger sequencing .................................................................................... 26
3.2.9. Sequence alignment and verification ........................................................ 27
3.2.10. Phylogenetic analyses ............................................................................... 28
4. Results ..................................................................................................................... 29
4.1. DNA isolation and quantification .................................................................... 29
4.2. Preliminary experiment: primer test ................................................................. 29
4.3. Sequence verification ....................................................................................... 32

Bachelor thesis
5
4.4. Diversity, distribution and classification of Hydrodictyaceae lineages ........... 32
4.4.1. Diversity and distribution of Hydrodictyaceae lineages ........................... 32
4.4.2. Taxonomic assignment (NCBI BLAST) .................................................. 36
4.5. Phylogenetic analyses ...................................................................................... 37
4.5.1. Bayesian phylogenetic tree based on the 82 bp rbcL fragment ................ 37
4.5.2. Bayesian phylogenetic tree based on a 1052 bp rbcL fragment ............... 37
5. Discussion ................................................................................................................ 40
5.1. Specificity and reliability of tested primers ..................................................... 40
5.2. Distribution of lineages obtained from surface and core sediments ................ 40
5.3. Phylogenetic analyses and comparison of 82 bp and 1052 bp fragments ........ 42
5.4. Indications for the use of sedDNA analyses in paleoecological studies .......... 43
6. References ............................................................................................................... 45
7. List of figures and tables ......................................................................................... 47
8. List of symbols and abbreviations ........................................................................... 48
9. Appendix ................................................................................................................. 49

Bachelor thesis Abstract
6
Abstract
Pediastrum and other representatives of the green algae family Hydrodictyaceae
(Chlorophyta), commonly found in freshwater environments, are potential bioindicators
for paleolimnological studies as they are preserved in sediments and morphologically
classified as non-pollen palynomorphs obtained along with pollen spectra.
The aim of this study was to examine the diversity in Hydrodictyaceae obtained from
modern and ancient Siberian lake sediments following a molecular genetic approach.
Environmental samples were obtained from lakes across the arctic-boreal tree line in
Siberia. Modern sedimentary DNA (sedDNA) was isolated from the samples and a
selected fragment of the rbcL gene, encoding the large subunit of the enzyme RuBisCO
(ribulose-1,5-bisphosphate carboxylase/oxygenase), was amplified via polymerase
chain reaction (PCR). The respective primer pairs were specifically developed
beforehand and optimized for the desired target fragment in Hydrodictyaceae. Four
primer combinations were tested on two modern sediment samples and the most
suitable primer combination was selected and applied to additional modern and core
samples. The PCR products were cloned and sequenced by Sanger sequencing; the
sequences were aligned and verified and taxonomic identification was conducted based
on BLAST nucleotide search. 71.2 % of the obtained sequences were assigned to
Hydrodictyaceae in ten out of eleven samples and 28.8 % to unknown algae strains in
nine out of eleven samples. In total, thirteen different rbcL lineages were detected,
among them twelve lineages of Pediastrum and Pseudopediastrum in modern sediments
and six in ancient core sediments, including a single Stauridium lineage in one core
sample. Five different lineages were detected in both sample types. One sample did not
yield any Hydrodictyaceae lineage.
Although the preliminary results of this study indicated that the distribution of lineages
was fairly heterogeneous, we recognized a general tendency in terms of sample type
(surface/core) and vegetation type (tundra/forest tundra/forest), but could not identify
distinct preferences of single lineages. Phylogenetic inferences of the lineages indicated
that a resolution down to species and strain level is not possible for most of the
examined lineages.

Bachelor thesis Zusammenfassung
7
However, this study showed that Pediastrum DNA was reliably amplified from modern
lake sediments and from core depths of up to 62 cm, the latter of which yielded ancient
DNA (aDNA) with an age of approximately 3000 years. Possibly further studies
covering larger datasets and additional genetic markers will give better resolution in
terms of quantification, taxonomic coverage and identification.
Zusammenfassung
Pediastrum und andere in Süßwasser-Ökosystemen verbreitete Vertreter der Familie
Hydrodictyaceae (Grünalgen, Chlorophyta) sind potentielle Bioindikatoren für
paläolimnologische Studien und lassen sich in Oberflächensedimenten und
Sedimentkernen, aber auch im Pollenspektrum morphologisch als sog. Nicht-Pollen-
Palynomorphe bzw. organisches Mikrofossil detektieren.
In der vorliegenden Arbeit wurde die Diversität von Hydrodictyaceen in Sedimenten
und Bohrkernen aus sibirischen Seen anhand eines molekulargenetischen Ansatzes
untersucht. Umweltproben wurden aus Seen entlang der arktisch-borealen Baumgrenze
Sibiriens erhalten. Rezente und alte sedimentäre DNA (sedDNA) wurde aus den Proben
isoliert und ein ausgewähltes Fragment des Gens rbcL, das die große Untereinheit des
Enzyms RuBisCO (Ribulose-1,5-bisphosphat-carboxylase/oxygenase) codiert, via
Polymerase-Kettenreaktion (PCR) mit Hilfe zuvor spezifisch entwickelter, auf das
Zielfragment optimierter Primer amplifiziert. Vier Primerkombinationen wurden an
zwei rezenten Sedimentproben getestet und die geeignetste für die folgenden Versuche
an weiteren Oberflächen- und Kernsedimenten ausgewählt. Die PCR-Produkte wurden
kloniert und mittels Sanger-Sequenzierung sequenziert. Die erhaltenen Sequenzen
wurden aligniert, verifiziert und eine taxonomische Identifikation wurde mittels BLAST
nucleotide search ermöglicht. 71.2 % der erhaltenen Sequenzen in zehn von elf Proben
konnten den Hydrodictyaceen zugeordnet werden, 28.8% in neun von elf Proben
entsprachen nicht identifizierten Algenarten. Insgesamt konnten dreizehn
unterschiedliche, verifizierte rbcL-Linien ermittelt werden, darunter zwölf Pediastrum-
und Pseudopediastrum-Linien in Oberflächensedimenten und sechs in Kernsedimenten
sowie eine Stauridium-Linie, die ausschließlich in einer einzelnen Kernprobe ermittelt
Bachelor thesis Zusammenfassung
8
wurde. Fünf Linien wurden in beiden Sedimenttypen gefunden; nur in einer Probe
konnten keine Hydrodictyaceen detektiert werden.
Die Verteilung der detektierten Hydrodictyaceae-Linien stellte sich dabei als
uneinheitlich dar; zwar konnte eine allgemeine Tendenz hinsichtlich Probentyp
(Oberflächen- und Kernsediment) und Vegetationstyp (Tundra/Waldtundra/Wald)
beobachtet werden, deutliche Präferenzen einzelner Linien bestätigten sich jedoch nicht.
Phylogenetische Analysen zeigten, dass eine Auflösung auf Artniveau und darunter für
die meisten der untersuchten Linien nicht möglich ist. Dennoch konnte im Rahmen der
vorliegenden Arbeit gezeigt werden, dass sich Pediastrum-DNA zuverlässig aus
Oberflächensedimenten und aus Sedimentkerntiefen von bis zu 62 cm (entspricht ca.
3000 Jahre alter DNA) isolieren ließ. Weiterführende Studien mit umfassenderer
Datenerhebung und Nutzung zusätzlicher genetischer Marker könnten eine bessere
Auflösung hinsichtlich Quantifizierung und taxonomischer Einordnung ermöglichen.

Bachelor thesis Introduction
9
1. Introduction
1.1. Hydrodictyaceae
Hydrodictyaceae is a family of green algae in the order Sphaeropleales, including some
of the most common freshwater planktonic algae such as the genera Pediastrum,
Stauridium and the eponymous Hydrodictyon. The name means “water net” (1),
deriving from the Greek words hydor = water and diktyon = net, and was introduced by
Swiss botanist Jean-Pierre Vaucher in the 19th century (2) because of its characteristic
mesh-like colony structure (also called coenobium), where each individual is connected
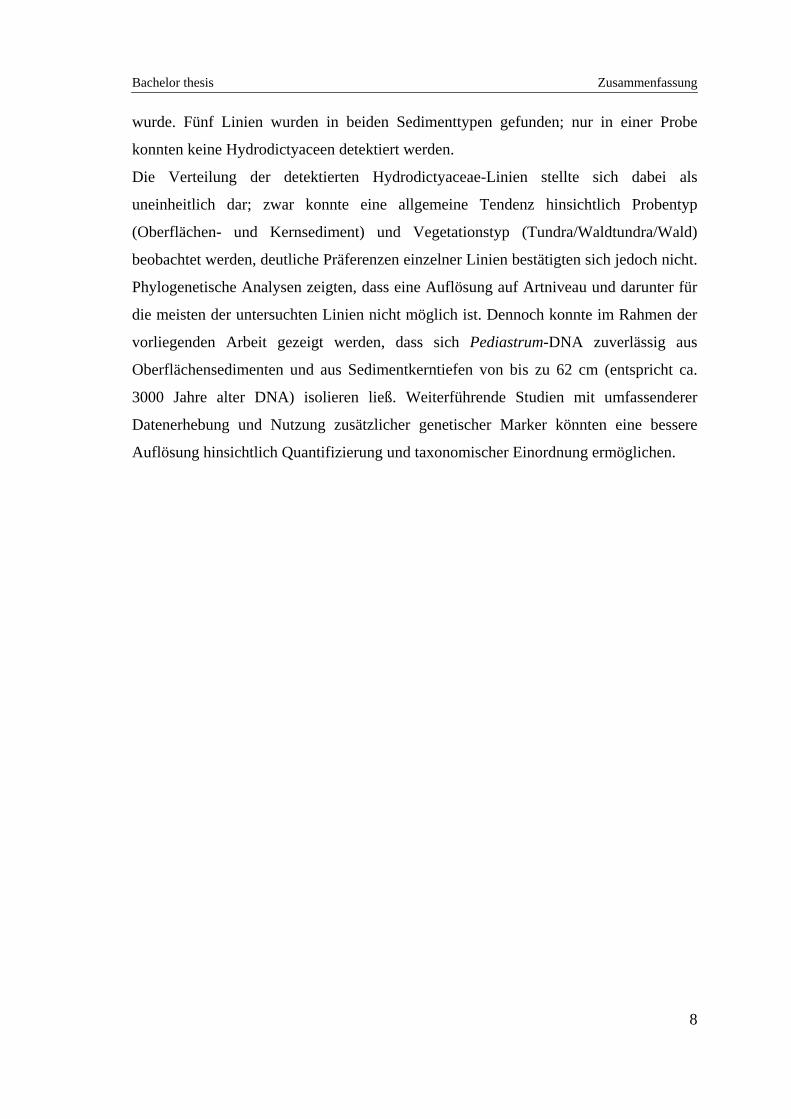
to other algae, forming a net (Fig. 1).
A B C 20 µm
D E F
G H I
Fig. 1: Different morphotypes of Pediastrum. (A) Pediastrum boryanum type-1, (B) P.
boryanum type-2, (C) P. integrum, (D) P. duplex, (E) P. boryanum var. brevicorne, (F) P.
boryanum var. longicorne (G) P. angulosum, (H) P. kawraisky, (I) P. orientale. Pictures and
taxonomic determination: Bastian Niemeyer, AWI

Bachelor thesis Introduction
10
Reproduction of Hydrodictyaceae occurs both asexually, by separation of a mother cell
into zoospores that join together to a daughter coenobium, and sexually, by fusion of
haploid gametes to a diploid zygote. However, sexual reproduction is characteristic for
Hydrodictyon and has only rarely been observed in species of Pediastrum (3).
1.2. Pediastrum as bioindicator
The worldwide abundance of Hydrodictyaceae in freshwater ecosystem supports their
role as potential (paleo)bioindicators, particularly as proxies (indirect characteristics)
for paleolimnological studies and climate research (3). Pediastrum can also be detected
as organic microfossil or non-pollen palynomorph (NPP) along with pollen spectra as
the cells are usually preserved despite harsh pollen processing conditions (e.g. chemical
treatment with hydrochloric acid or sulfuric acid), representing an additional
bioindicator (4). Similar NPPs have been used regularly combined with palynofacies
analyses (i.e. pollen studies in sediments) for paleoenvironmental and paleoclimatic
reconstructions (5).
Typical criteria for morphological identification of Pediastrum in a light microscope
include the arrangement of coenobia and single cells as well as the structure of the outer
cell wall layer (3). According to Jankovská and Komárek (6), it is both possible and
feasible to improve the precision of paleoecological reconstruction of environments in
the past utilizing the information from a great number of examined localities and
identified algal taxa. The possibility of utilizing the indicative value of green algae, e.g.
for reconstruction of past climatic conditions, has been shown by Jankovská and
Komárek on examples of algal communities from modern and ancient sediments
obtained from different longitudes, latitudes and altitudes (6). Implementation of
Pediastrum species as supportive paleobioindicators enables reconstruction of changes
in vegetation and aquatic environments, but also takes into account climatic influences
such as warm and cold periods (7). However, only few paleolimnological studies from
the Arctic have used Pediastrum as proxy (8), although they can be reliably detected,
classified morphologically and identified to species level both in surface sediments and
sediment cores (4).
Bachelor thesis Introduction
11
1.3. RbcL as genetic marker
Next to the general metabarcoding approach, primers used for amplifying
environmental DNA depend on the target organism group; they can be generic or more
group-specific as long as they are able to amplify diagnostic sequences.
The primers used in the context of this study had previously been designed and
optimized for short fragment lengths within the rbcL gene of Hydrodictyaceae in order
to enable taxa-specific amplification of the target group and to minimize possible
amplification of algae from other families. Located on the chloroplast genome
(cpDNA), rbcL encodes the large subunit of the enzyme ribulose-1,5-bisphosphate
carboxylase/oxygenase (RuBisCO) (13), which is the essential enzyme responsible for
carbon fixation in photosynthesis and hence can be found in all phototrophic organisms
including plants, algae and cyanobacteria. The major advantage of rbcL over other
genetic markers (such as nuclear ribosomal genes present in nearly all organisms) is that
the use of cpDNA as a marker greatly reduces the amplification of undesired organisms
without chloroplasts, while ribosomal markers may target other highly abundant taxa
like bacteria and fungi. Recent studies confirmed rbcL as a short region barcoding
marker for phototrophic algae such as diatoms (Bacillariophyta) obtained from sediment
and core samples (14) (15).
1.4. Environmental DNA and metabarcoding
A different approach to investigate biodiversity is to obtain the DNA of targeted
organisms directly from environmental samples, such as lake sediments.
Hydrodictyaceae and specifically Pediastrum are expected to be abundant in modern
and ancient lake sediments and are potentially well-suited candidates for environmental
DNA analyses. One common approach using environmental DNA is metabarcoding.
This technique enables direct diversity analyses of environmental samples based on the
combination of amplification of diagnostic DNA fragments and sequencing of PCR
products and offers a fairly straightforward procedure: DNA is isolated from
environmental samples and a characteristic section of the targeted gene out of a mixture

Bachelor thesis Introduction
12
of total genomic DNA is amplified by PCR. It has to be considered though that in order
to reliably amplify ancient DNA (aDNA) from core sediment samples, only very short
fragments (~150 bp) can be selected due to heavy degradation of the DNA (9) (10) (11).
A general metabarcoding approach usually requires more universal markers to cover a
broad taxonomic range.
Sequencing of PCR products is facilitated by conventional Sanger sequencing of clones
or parallel high-throughput next-generation sequencing, like Illumina® or 454 (Roche)
sequencing technologies which enable sequence reads on a considerably larger scale.
Next-generation sequencing is recommended for samples with high species diversity if
established markers are available and more detailed data is desired. The sequences can
then be compared with a public database.
Metabarcoding efficiently generates comprehensive data sets and is also applicable by
scientists with less expertise in taxonomy and morphological characterization.
Compared to a traditional pollen-based or morphological analysis, metabarcoding
allows identification of more taxa at lower taxonomic level, which has been shown on
ancient permafrost soil samples from Arctic regions with other chloroplast markers (12).
However, the results are strongly affected by the grade of DNA decay and the
specificity of the implemented primers for certain taxa (11) (12). It was suggested to
complement general metabarcoding approaches with group-specific primers, supported
by a morphological background and on-site studies to obtain reliable results (12).
1.5. Study area
The environmental samples used in this study were collected on field expeditions in
2011 (Chatanga expedition, CH) and 2013 (Taymyr expedition, TY) south of Khatanga
Gulf and Taymyr Peninsula, in the northeastern part of Krasnoyarsk Krai, Russian
Federation. The region, located between 70° and 73° north latitude and 97° and 106°
east longitude, extends over an area of approximately 55.000 km2 and is very sparsely
populated (on average less than 1 inhabitant per km2). Thus, human impact on the
sample area can be considered as low.

Bachelor thesis Introduction
13
The surface and core sediments were obtained from lakes located along a latitudinal
transect in the ecotone (transition area) between tundra, forest tundra and forest (light
northern taiga) in the Khatanga region. Apart from summer temperatures, the expansion
of the tree line is also affected by global climate and is responding to recent global
warming, resulting in a northward shift and an approximation of the boundary to former
maximum positions like the Holocene Climate Optimum about 10000-6000 years ago
(16). Furthermore, a vegetation gradient is connected to a general ecological gradient
that may also affect chemistry and biodiversity in the embedded lakes: it has been
shown for other Siberian regions that lake-water chemistry is correlated with vegetation
(e.g. higher forest density leading to increased lake alkalinity), and postulated a local
salt aggregation in soils due to a lack of continuous groundwater flow within permafrost
soils (17). Therefore, a general correlation with the vegetation gradient in the examined
area is assumed for the diversity of Pediastrum in lake sediments.

Bachelor thesis Objective
14
2. Objective
The aim of this study is to identify Hydrodictyaceae DNA, especially Pediastrum, in
surface sediments and different layers of a sediment core from Siberian lakes and to
examine their genetic diversity. In this context, the following questions were raised:
Is it possible to reliably amplify Hydrodictyaceae DNA from modern and
ancient lake sediment samples?
Are patterns detectable in the distribution of Hydrodictyaceae lineages in lakes
across the Siberian tree line ecotone?
Is rbcL a suitable marker to display diversity in Hydrodictyaceae?
What are possible (preliminary) indications that can be drawn from sedDNA-
based analyses of Hydrodictyaceae regarding paleolimnological applications?

Bachelor thesis Materials and Methods
15
3. Materials and Methods
3.1. Materials
3.1.1. Chemicals and buffers
BSA (UV, 20 mg/ml) VWR International, Darmstadt, Germany
6x DNA loading dye Thermo Scientific, Dreieich, Germany
DNA Polymerase: Sigma-Taq Sigma-Aldrich, St. Louis, MO, USA
dNTP mix, 2.5 mmol/l Qiagen, Hilden, Germany
GelRed DNA staining Biotium, Hayward, CA, USA
H2O (DEPC treated) GBiosciences, St. Louis, MO, USA
Kanamycin A, 50 mg/ml Sigma-Aldrich, St. Louis, MO, USA
LB agar Sigma-Aldrich, St. Louis, MO, USA
SOC culture medium Invitrogen/Life Corp., Carlsbad, CA, USA
LiChrosolv® H2O for chromatography Merck, Darmstadt, Germany
MgSO4 (UV, 50 mmol/l) Invitrogen/Life Corp., Carlsbad, CA, USA
O’range Ruler 50 bp DNA ladder Thermo Scientific, Dreieich, Germany
10x PCR reaction buffer Sigma-Aldrich, St. Louis, MO, USA
Rotigarose® agarose Carl Roth, Karlsruhe, Germany
10x TAE buffer AppliChem, Darmstadt, Germany
3.1.2. Kits and other materials
50 ml Falcon® tubes Becton Dickinson Labware, Franklin
Lakes, NJ, USA
MinElute® PCR Purification Kit Qiagen, Hilden, Germany
PeqLab Electroporation Cuvettes, sterile PeqLab GmbH, Erlangen, Germany
Platinum® Taq DNA Polymerase HiFi Invitrogen/Life Corp., Carlsbad, CA, USA
PowerMax Soil DNA Isolation Kit MoBio Labs, Carlsbad, CA, USA
TOPO® TA Cloning® Kit for Sequencing Invitrogen/Life Corp., Carlsbad, CA, USA

Bachelor thesis Materials and Methods
16
3.1.3. Laboratory equipment
Biometra BioDocAnalyze® Analytik Jena, Jena, Germany
FastPrep®-24 homogenizer MP Biomedicals, Irvine, CA, USA
GFL-7601 incubator GFL Gesellschaft für Labortechnik mbH,
Burgwedel, Germany
Heraeus BioFuge™ Pico™ centrifuge Thermo Scientific, Dreieich, Germany
Heraeus Fresco™ 17 centrifuge Thermo Scientific, Dreieich, Germany
MicroPulser™ Electroporator Bio-Rad, Munich, Germany
PCR hood: DNA/RNA UV Cleaner biosan, Riga, Latvia
Qubit® 2.0 Fluorometer Invitrogen/Life Corp., Carlsbad, CA, USA
Sartorius BL310 scale Sartorius AG, Göttingen, Germany
SIGMA 6K15 high capacity refrigerated Sigma Laborzentrifugen GmbH,
laboratory centrifuge Osterode am Harz, Germany
Sprout® small table centrifuge Heathrow Scientific, Vernon Hills, IL, USA
Thermal cycler: Bio-Rad iCycler® Bio-Rad, Munich, Germany
Thermal cycler: Biometra Professional Analytik Jena, Jena, Germany
Thermal cycler: Techne® TC-Plus Bibby Scientific Ltd, Stone, Staffordshire, UK

Bachelor thesis Materials and Methods
17
3.1.4. Samples
After on-site sampling, the sediment samples were transported to Germany and kept in a
cold storage room (4 °C) at the AWI’s Research Unit Potsdam until further use.
The lakes are labeled by the year and name of the respective expedition and a
consecutive number, e.g. 11-CH-12 for the 2011 Khatanga expedition and 13-TY-02 for
the 2013 Taymyr expedition. Sample 11-CH-12A indicates the sediment core obtained
from lake 11-CH-12. As mentioned in part 1.4, the lakes are located within the tree line
ecotone between tundra, forest tundra and forest; they were assigned to either vegetation
type by estimate based on nearby vegetation sampling and satellite images. While both
lakes 13-TY-02 and 11-CH-12 are located in the tundra area, 13-TY-21 and 11-CH-06
are mostly surrounded by Betula and Alnus trees as well as dense shrubs, hence
representing a typical forest (light northern taiga) lake. Lakes 11-CH-17 and 13-TY-27
are classified as “forest tundra” as they are located on the transition between both
biomes and surrounded by smaller trees and shrubs.
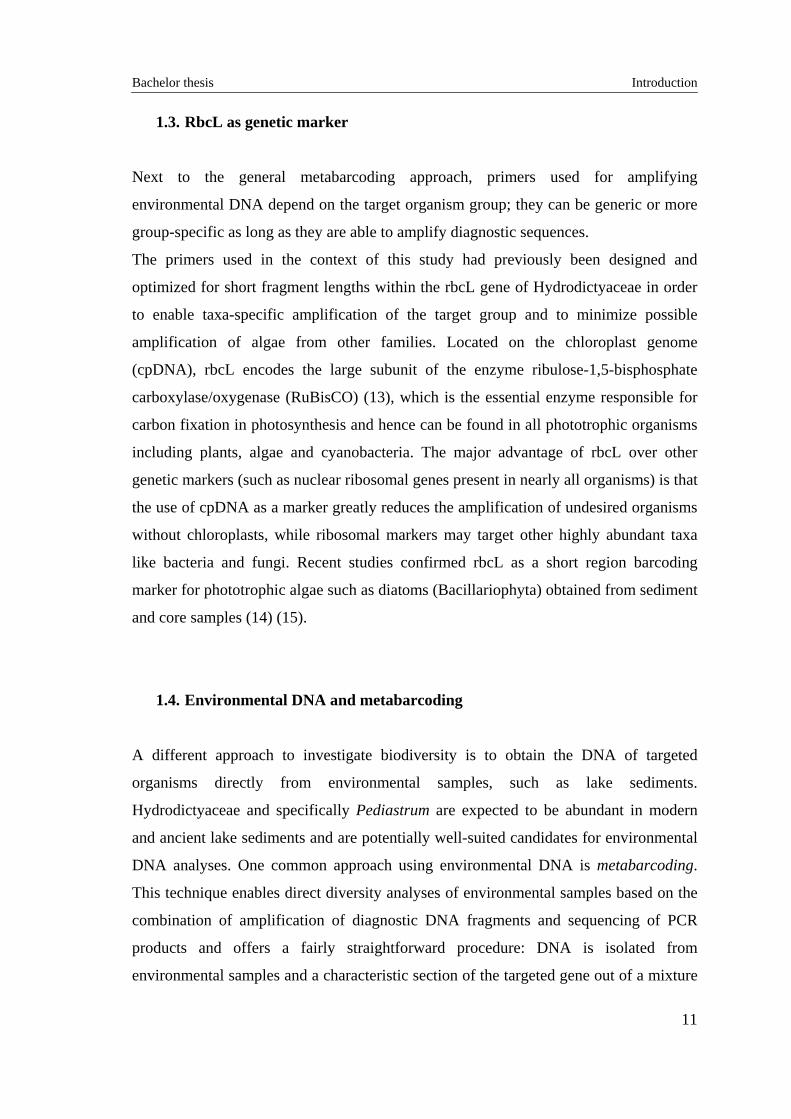
Fig. 2: Study area in the Khatanga region. The lakes from the 2011 (green) and 2013 (red) AWI
expeditions follow a northeast-southwest transect and cover tundra, forest tundra and forest area. The
sediment core (A) was obtained from lake 11-CH-12.

Bachelor thesis Materials and Methods
18
The sediment core 11-CH-12-A has a total length of 132 cm and dates back
approximately 7000 years BP (unpublished data). DNA samples from the core sections
had been extracted and processed beforehand. In this study, DNA samples from the
following core sections were used: 0-1 cm, 6-7 cm, 20-21 cm, 42-43 cm, 61-62 cm and
65-66 cm core depth.
Along with field data such as geographic position and lake depth, hydrochemical data
was also recorded during the expeditions (Table 1).
Table 1: Sample overview with field data, comprising geographic position, maximum and Secchi1 depth
of the lakes, and hydrochemical data, comprising conductivity, pH value and alkalinity. Lakes are sorted
by vegetation type (tundra/forest tundra/forest).
Lakes Field data
Latitude [°] Longitude [°] Max. depth [m] Secchi depth [m] 13-TY-02 72.553 105.717 3.4 1.4513-TY-10 72.406 105.442 7.9 5.511-CH-12 72.399 102.289 14.3 5.011-CH-17 72.245 102.235 3.4 1.713-TY-27 72.153 102.075 2.7 1.813-TY-21 71.107 100.823 6.4 3.811-CH-06 70.667 97.716 4.8 2.5
Lakes Hydrochemical data Vegetation type
Conductivity [μS/cm] pH Alkalinity [mg/l HCO3-]
13-TY-02 69.0 8.53 38.4 tundra 13-TY-10 180.0 7.85 32.2 tundra 11-CH-12 34.9 7.50 31.3 tundra 11-CH-17 64.2 7.87 25.0 forest tundra 13-TY-27 59.0 7.82 28.4 forest tundra 13-TY-21 46.0 8.08 24.6 forest 11-CH-06 35.3 6.42 23.0 forest
1 Secchi depth: an approximate measurement for the transparency/turbidity of waters. In freshwaters, a
black-and-white Secchi disk is lowered in the water; when the disk is no longer visible, the according
depth is measured. Higher Secchi depths indicate clearer waters.

Bachelor thesis Materials and Methods
19
3.2. Methods
3.2.1. Security and decontamination measures
All the necessary laboratory work was carried out in security class S1 molecular biology
laboratories at the Alfred Wegener Institute for Polar and Marine Research, Potsdam,
Germany. In order to minimize the risk of contamination, all steps were carried out in
assigned workplaces in two spatially separated laboratories: one for isolation and other
pre-PCR steps and one for post-PCR work and cloning. Consequently, transfer of
samples and materials between the labs occurred strictly one-directional (pre-PCR to
post-PCR). In addition, disinfection and cleaning of benches and surfaces as well as UV
decontamination of laminar flow hoods/cabinets and inorganic reagents was mandatory
before and after each step.
3.2.2. DNA isolation
Unlike DNA isolation from individual samples (e.g. algae cultures), sedDNA includes
total genomic DNA from a variety of taxa and considerable amounts of PCR inhibitors,
such as humic acids, that need to be removed during the extraction process to facilitate
PCR amplification. SedDNA and particularly aDNA fragments are very small due to
decay, which limits the size of the applied genetic markers (9).
DNA isolation was performed following the PowerMax Soil DNA Isolation Kit (MoBio
Labs, Carlsbad, CA, USA) protocol with 8 to 8.35 g of sediment at room temperature.
400 µg proteinase K was added to each sample to remove possible protein
contaminations before shaking with 1.2 ml bead solution (C1) on a FastPrep®-24
homogenizer (MP Biomedicals, Irvine, CA, USA) for 30 sec, followed by over-night
incubation on a rocking shaker at 56° C.
After centrifuging at 2300 g for 3 min at room temperature (RT), non-DNA organic and
inorganic material, including humic substances (e.g. humic acid) and cell debris, were
precipitated with buffer C2 while incubating for 10 min in the refrigerator at 4° C. Due

Bachelor thesis Materials and Methods
20
to mixed results, the purification process could be improved by centrifuging for another
7-8 min and repeating the precipitation step. The above step was then repeated again
with a different precipitation solution (C3), incubation on ice and centrifugation for 4
min. Subsequently, the samples were transferred to a Spin Filter column and a high
concentrated salt solution (C4) was added, allowing the DNA to bind to the silica of the
column while all non-DNA organic and inorganic material stays in solution. Remaining
contaminants and debris were removed and DNA binding was improved by triple
centrifugation for 2 min at 2300 g each, always discarding the flow-through. However,
some samples required additional DNA binding/washing steps until the brown/yellow
color of the solution disappeared. The final washing step was performed with 10 ml
washing buffer (C5) and centrifugation for 3 min; residual EtOH from buffer C5 was
then removed by centrifugation for another 5 min. DNA Elution with a sterile elution
buffer (C6) was performed in two steps and resulted in a final elution volume of about
1.0-1.2 ml, which was transferred into new reaction tubes.
Eventually the DNA concentration was quantified with a Qubit® 2.0 Fluorometer
(Invitrogen/Life Corp., Carlsbad, CA, USA). This procedure utilizes a fluorometric
concentration measurement which is well-suited for precise assessment of low DNA or
RNA quantities in samples that are difficult to process, and samples that are processed
in downstream applications like conventional PCR or real-time (quantitative) PCR
(qPCR), transformation/ transfection and sequencing. The fluorescent dye provided with
the fluorometer (Molecular Probes®) emits signals only when bound to specific target
biomolecules and enables quantitation even at low concentrations.
The sedDNA samples of the sediment core had already been isolated beforehand in an
external laboratory (University of Potsdam) and were processed directly in the
subsequent steps.

Bachelor thesis Materials and Methods
21
3.2.3. Preliminary experiment: primer test and PCR
The specific Hydrodictyaceae rbcL primers were designed beforehand and were
synthesized by IDT (Integrated DNA Technologies Inc., Leuven, Belgium).
In a preliminary experiment, primers were tested in silico (see part 4.2.) and in vitro for
their target sequence specificity using single and nested PCR. Five different primers
were available, named Hydr-rbcL for this study (Table 2).
The primers cover a length of 20-22 bp with a mean guanine-cytosine (GC) ratio of
40.3% and a mean melting temperature (TM) of 55.3 °C.
Table 2: Primers used in this study, named according to their binding positions on the rbcL gene. TM
refers to their melting temperature and GC indicates the guanine-cytosine ratio in percent.
Primers
Name Sequence (5ʼ→3ʼ) Length [bp] TM [°C] GC [%]
Hydr-rbcL_185F GGACAGATGGTTTAACTAGCT 21 55.03 42.86
Hydr-rbcL_203F GCTTAGACCGTTATAAAGGACG 22 56.71 45.45
Hydr-rbcL_295R GGTCAATTGGGTAAGCAACA 20 56.22 45.00
Hydr-rbcL_307R CTTCTTCAAAAAGGTCAATTGG 22 54.12 36.36
Hydr-rbcL_309R ACCTTCTTCAAAAAGGTCAATT 22 54.35 31.82
The primers were combined to 4 forward/reverse pairs, resulting in different amplicon
(excluding primers) and total fragment lengths (Table 3). The appropriate primer
annealing temperature (TA) is dependent on the ratio of each base in the sequence
(commonly referred to as Wallace rule) and is usually a few degrees below their
melting temperature; therefore, TA was set to 53 °C. Elongation of the strands was
carried out at 68 °C by a heat-resistant Taq DNA polymerase (see part 3.2.4.).
Table 3: Primer pairs (forward and reverse), combined from the primers in Table 2.
Primer pairs
# Forward primer Reverse primer Amplicon name
Amplicon length [bp]
Total fragment length [bp]
TA [°C]
1 Hydr-rbcL_185F Hydr-rbcL_309R 82bp 82 125 53
2 Hydr-rbcL_203F Hydr-rbcL_307R 61bp 61 105 53
3 Hydr-rbcL_185F Hydr-rbcL_307R 80bp 80 123 53
4 Hydr-rbcL_203F Hydr-rbcL_295R 51bp 51 93 53

Bachelor thesis Materials and Methods
22
In order to test and confirm the primer specificity, a PCR was run with two samples,
one extraction blank as first negative control (later displaying possible contamination
during the extraction of DNA), and a second negative control to check for
contamination in PCR chemicals., A third negative control was used in the nested PCR
to check for contamination in PCR chemicals used in the nested PCR. The primer
combination with the best results was selected for all following experiments.
Nested PCR is a two-step PCR approach, using the PCR products from the first PCR as
template DNA, intended to increase the amount of PCR product and reduce unspecific
primer binding, resulting in a higher concentration of the expected products. Therefore,
a nested PCR requires two sets of primers; the first set consisted of primer pairs 1 and 2
and the second consisted of pairs 3 and 4 (Table 3).
Both PCRs were run with 2.5 µl reaction buffer (10x), 2.5 µl dNTP mix (2.5 mmol/l), 1
µl BSA (20 mg/ml), 1 µl MgSO4 (50 mmol/l), 0.25 µl Taq polymerase (Platinum® Taq
DNA Polymerase HiFi kit, Invitrogen/Life Corp., Carlsbad, CA, USA) and 1 µl of each
primer (10 µmol/l) per reaction, filled up with diethyl pyrocarbonate (DEPC) treated
water to a final volume of 22 µl and 24 µl, respectively. For the first PCR, 3 µl of
template DNA was applied and for the second PCR, 1 µl of the previously obtained
PCR product was added to the reaction. Subsequent cloning and sequencing was carried
out as described in parts 3.2.4 to 3.2.8.
Table 4: PCR conditions for the first and nested PCR.
T [°C] Duration Description Cycles
94 5 min Initial denaturation 1x 94 30 sec Denaturation
35x 53 30 sec Annealing 68 30 sec Elongation 72 10 min Final elongation 1x 15 ∞ Stand-by
3.2.4. PCR
PCR is an efficient method for mass-reproduction of desired DNA fragments and was
introduced by Mullis et al. in 1983 (18). The general procedure is as follows: the DNA
template strands are denatured at high temperature, and then the temperature is lowered

Bachelor thesis Materials and Methods
23
to the annealing temperature which enables the primers to bind to the template.
Elongation of the strands using provided dNTPs is facilitated by a thermophile DNA
polymerase from T. aquaticus (Taq) and the reaction cycle is repeated in order to
amplify exponentially.
The specific PCR conditions used in this study are displayed in Table 5. In contrast to
the primer test, all surface sediment and core samples were used and the nested PCR
approach was replaced by single PCRs because PCR products were already present in
the first run (see results in part 4.2). Since nested PCR always increases the risk of
cross-contamination it was decided to omit the nested PCR step and to increase the
reaction cycles to 50 in order to maximize the concentration of PCR products. The
result of each PCR was made visible with agarose gel electrophoresis.
Table 5: PCR conditions for 50 cycles.
T [°C] Duration Description Cycles
94 5 min Initial denaturation 1x 94 30 sec Denaturation
50x 53 30 sec Annealing 68 20 sec Elongation 72 10 min Final elongation 1x 15 ∞ Stand-by
3.2.5. Gel electrophoresis
Agarose gel electrophoresis is a standard method used to separate nucleic acids
according to their fragment length and structure. The applied voltage causes the overall
negatively charged DNA to run through the gel into the direction of the positive pole.
The separation speed is dependent on physical factors like voltage, ionic strength of the
buffer and pH. In order to improve visibility of the samples, assess their running speed
and prevent diffusion into the buffer, their weight is increased by addition of DNA
loading dye which contains glycerol. When finished, the gel can be photographed under
UV light, showing the separated bands due to the fluorescent dye that was mixed into
the gel and that intercalates with DNA. All gels were prepared with 2 g agarose
(equivalent to 2 % w/v) and 8 µl non-carcinogenic GelRed® (Biotium, Hayward, CA,
USA) DNA staining per 100 ml volume of 1x Tris/Acetate/EDTA (TAE) buffer.

Bachelor thesis Materials and Methods
24
3.2.6. Purification
Before cloning, any single nucleotides, residual polymerase and small DNA fragments
like primers and have to be eliminated from the PCR products. Purification was
performed with the MinElute® PCR Purification Kit (Qiagen, Hilden, Germany) using
a micro centrifuge. Each centrifugation step was carried out at maximum speed and RT
for 1 min. 20 µl of each PCR product were first resuspended with 100 µl buffer PBI
containing an indicator for determination of the optimal pH for DNA binding on the
silica-membrane-based spin column. After binding, the samples were washed with 750
µl washing buffer PE per sample, followed by an additional centrifugation step to
remove residual ethanol and two elution steps with 10 µl elution buffer (EB) each.
Eventually, 20 µl of purified DNA were obtained. Successful purification was verified
by agarose gel electrophoresis with 5 µl purified DNA and 1 µl loading buffer.
3.2.7. Cloning
Prior to sequencing, the rbcL amplicons obtained in the PCRs have to be reproduced in
a vector in order to obtain clean and separated DNA sequences. Cloning of TOP10 One
Shot® electrocompetent E. coli bacteria was performed using the TOPO® TA
Cloning® Kit for Sequencing (Invitrogen/Life Corp., Carlsbad, CA, USA) following the
standard protocol.
The plasmid vector of the bacteria contains an insertion site flanked by single 3’ T
overhangs and is activated by a type I topoisomerase bound to the vector. In order to
ligate efficiently with the vector, PCR inserts must have complementary single A
overhangs; incubation with Sigma Taq polymerase (Sigma-Aldrich, St. Louis, MO,
USA) in a thermal cycler at 72 °C for 10 min creates such overhangs at the 3’ end of
each PCR product utilizing the polymerase’s terminal transferase activity (Fig. 3).

Bachelor thesis Materials and Methods
25
Fig. 3: pCRTM 4-TOPO® vector with PCR product (target sequence). Single A overhang on the 3’ end of
both strands is required for optimal insertion of the fragment into the vector. Picture: TOPO® TA
Cloning® Kit for Sequencing User Guide Rev. A.0, Invitrogen/Life Corp.
The procedure is briefly summarized as follows:
A. Topoisomerase reaction. The reaction was prepared on ice with 2 µl purified DNA,
0.5 µl NaCl/MgCl2 salt solution and 0.5 µl pCRTM 4-TOPO® vector, and incubated
at RT for 10-15 min. The insertion is catalyzed by the type I topoisomerase linked
to the vector.
B. Transformation. For each sample, 25 µl of E. coli cell solution and 1.5 µl of the
topoisomerase solution were carefully mixed and transferred into a sterile
Electroporation Cuvette (PeqLab GmbH, Erlangen, Germany). The cells were then
transformed by electroporation with a single electronic pulse in a MicroPulser™
(Bio-Rad, Munich, Germany) and quickly transferred into 125 µl SOC culture
medium (warmed up to RT), followed by horizontal incubation on a shaker (200
rpm) for 60 min at 37° C.

Bachelor thesis Materials and Methods
26
C. Cultivation of cells. In a laminar flow cabinet, approximately 75 µl of each sample
solution were spread on prepared LB agar plates using a glass spatula. Antibiotic
kanamycin A (final concentration of 50 mg/l of growth medium) had been added to
the plates, inhibiting all other bacterial growth while leaving the resistant E. coli
cells unaffected. Bacterial growth at 37 °C occurred over night.
After colonization of the plates, 16 to 48 clones were picked from each plate with
pipette tips and transferred to 96 well plates with 30 µl H2O per well. The bacteria were
subsequently denatured by heating in a thermo cycler at 95 °C for 10 min. In order to
re-amplify the inserted fragment a standard PCR with T3/T7 primers was run, which
binds to the according sites in the vector (Fig. 3). T3/T7 PCR was run with 0.75 µl of
each primer, 1.5 µl dNTP mix (Qiagen, Hilden, Germany), 0.15 µl Sigma Taq and 1.5
µl reaction buffer (Sigma-Aldrich, St. Louis, MO, USA), filled up to a volume of 15 µl
with DEPC-treated H2O and supplemented with 4 µl clone DNA. Table 6 shows the
PCR conditions. PCR products obtained from the vector DNA are about 100 bp longer
as the respective inserts because of a part of the vector sequence. Following the PCR,
products were checked on an agarose gel and bands deviating from the expected length
were excluded prior to sequencing.
Table 6: PCR conditions for standard T3/T7 PCR.
T [°C] Duration Description Cycles
95 4 min Initial denaturation 1x 95 30 sec Denaturation
35x 52 30 sec Annealing 72 45 sec Elongation 72 7 min Final elongation 1x 15 ∞ Stand-by
3.2.8. Sanger sequencing
Sanger sequencing, also referred to as chain-termination sequencing, is based on in vitro
DNA replication (similar to PCR) and was established in 1977 (19).
A primer binds to the template DNA strand and a DNA polymerase synthesizes the
complementary sequence. In contrast to PCR, dideoxy nucleotides (ddNTPs) are added

Bachelor thesis Materials and Methods
27
to the reaction; elongation is stopped as soon as a ddNTP is inserted since it lacks the 3’
hydroxyl group, making it impossible to form the next phosphodiester bond. The start of
the synthesis is determined by the primer and the end is variable, so the resulting
fragments have different length and can be read with capillary gel electrophoresis. For
each sample, 4 sequencing reactions are run separately (one for each ddNTP type). In
automated detection, the ddNTPs are usually labeled with a fluorophor so that their
complementary sequence can be saved as an electropherogram.
External sequencing following standardized protocols allows high numbers of samples
to be processed simultaneously and increases both throughput and reliability.
Purification of the T3/T7 PCR products and conventional Sanger sequencing was
performed at LGC Genomics, Berlin, Germany in an ABI3730XL DNA analyzer
(Applied Biosystems). All sequences were collected in a data file.
3.2.9. Sequence alignment and verification
The sequences were aligned and edited with BioEdit Sequence Alignment Editor 7.2.5
(20), MEGA 6.06 (21) and Geneious® 7.1.7 and saved in an alignment file (FASTA
format). In a first step, sequences shorter than the expected amplicon length and
sequences containing overlaps in the electropherogram (i.e. where a base was not
clearly identified) or sequencing errors were considered ambiguous and sorted out
accordingly.
An initial BLAST nucleotide search (http://www.ncbi.nlm.nih.gov/blast/Blast.cgi, last
access on 20.09.2014) was conducted to gain a general overview over the diversity and
taxonomic identity of the obtained sequences. Sequences are considered to be real if
they occurred several times in independent PCRs; single sequences are considered
reliable if they showed only one nucleotide substitution to abundant sequences at a non-
polymorphic site, evaluated by comparison to known sequences from GenBank (United
States National Center of Biotechnology Information, ncbi.nlm.nih.gov). As those
substitutions are produced by polymerase errors during PCR, they were merged to the
according sequences. Sequences that occurred at least twice in only one sample were
Bachelor thesis Materials and Methods
28
considered reliable if nucleotide substitutions occurred at polymorphic sites (again
evaluated by comparison to known sequences from GenBank).
Sequences were removed from the dataset if they occurred only once in the entire
dataset or were present in at least two clones but showed more than one substitution to
abundant sequences. Those sequences are considered to be artifacts resulting from
polymerase errors and/or from the formation of DNA chimeras during PCR (22).
3.2.10. Phylogenetic analyses
Molecular evolutionary analyses were performed with Geneious® 7.1.7 using Bayesian
inference of phylogenetic trees. The Bayesian approach uses an algorithm called
"Metropolis-coupled Markov chain Monte Carlo" or MC3 to infer phylogenetic trees
based on approximation of posterior probabilities; the mathematical background was
described by Huelsenbeck and Ronquist (23). Basically, the process calculates the
probability of single-base mutations based on a given sequence alignment and a selected
evolution model. Thus, Bayesian inference facilitates estimations of species phylogeny
and divergence times.
Best-fitting nucleotide-substitution models were determined beforehand with
jModelTest 2 (24), but not all of these models were available in Geneious®. Therefore,
HKY85, ranging in the first 10 of 88 evaluated algorithms, was used as algorithm for the
Bayesian analyses in Geneious. The first phylogenetic tree was based on an alignment
file with the sequences obtained in part 3.2.9. and a number of reference sequences of
the same DNA fragment in Hydrodictyaceae obtained from GenBank. The second was
calculated with a longer rbcL fragment (1052 bp) and only comprised GenBank
reference entries. GenBank entries are usually based on in vitro cells (e.g. algae
cultures) and not from environmental samples. The resulting trees were displayed in
Geneious and TreeView (25) and exported as graphics.

Bachelor thesis Results
29
4. Results
4.1. DNA isolation and quantification
Following the extraction protocol, around 8 g of thawed sediment were used for DNA
isolation. The amounts of sediments used and the resulting DNA concentrations
(measured with the Qubit® fluorometer) are displayed in Table 7. Each concentration
was confirmed with a second measurement. Where data is not available, the isolation
had been performed beforehand in an external laboratory (University of Potsdam).
Table 7: Weight of the sediments prior to isolation and resulting concentration of genomic DNA.
Sample Sediment weight [g] c1(DNA) [ng/µl] c2(DNA) [ng/µl]
13-TY-02 7.987 68 68 13-TY-10 8.349 67 64 11-CH-12 n/a n/a n/a 11-CH-17 n/a n/a n/a 13-TY-27 8,068 158 154
13-TY-21 8.015 40 38.4 11-CH-06 n/a n/a n/a
4.2. Preliminary experiment: primer test
In addition to the following preliminary experiment, a theoretical evaluation of the
primer specificity was performed with ecoPCR (26). This software estimates the
specificity of the primers for a defined taxa group by performing an in silico PCR on the
EMBL Nucleotide Sequence Database (ftp://ftp.ebi.ac.uk/pub/databases/embl/release;
release embl_117, September 2013) using the tested primer combinations. Regarding
the parameters for the in silico PCR, a maximum of two to three mismatches between
query and primer sequences was allowed, except for the last two nucleotides of the 3’
end which had to be matching. The results were provided beforehand and are presented
in Table 8. With more than 87 % specificity to Hydrodictyaceae, the pair 185F/309R
delivered the highest value while e.g. 203F/307R showed only little specificity
(approximately 10 %).

Bachelor thesis Results
30
Table 8: Primer specificity calculated by ecoPCR; Nseq indicates the total number of entries found in the
database, NHydr indicates those assigned to Hydrodictyaceae, complemented by a percentage value.
Primer pairs Ampl. lenght [bp] ecoPCR (2 mismatches) ecoPCR (3 mismatches)
Nseq NHydr Hydr (%) Nseq NHydr Hydr (%)
Hydr-rbcL_185F 82 100 88 88 101 88 87,13
Hydr-rbcL_309R
Hydr-rbcL_203F 60 127 100 78,74 999 100 10,01
Hydr-rbcL_307R
Hydr-rbcL_185F 80 111 99 89,19 135 99 73,33
Hydr-rbcL_307R
Hydr-rbcL_203F 50 112 97 86,61 261 99 37,93
Hydr-rbcL_295R
The PCR result showed products already in the first run (Fig. 4); it was therefore
decided to follow a single PCR approach in the main experiment, but to increase the
reaction cycles from 35 to 50 since the DNA concentration was assumed fairly low.
Fig. 4: Gel photography (colors inverted) of the single PCR (left) and subsequent nested PCR (right). The
expected fragment length is between 100 and 150 bp (desired amplicon and primer sequence). L: Ladder
(O’range Ruler 50 bp, Thermo Scientific). Blank and NTC: extraction blank and negative controls.
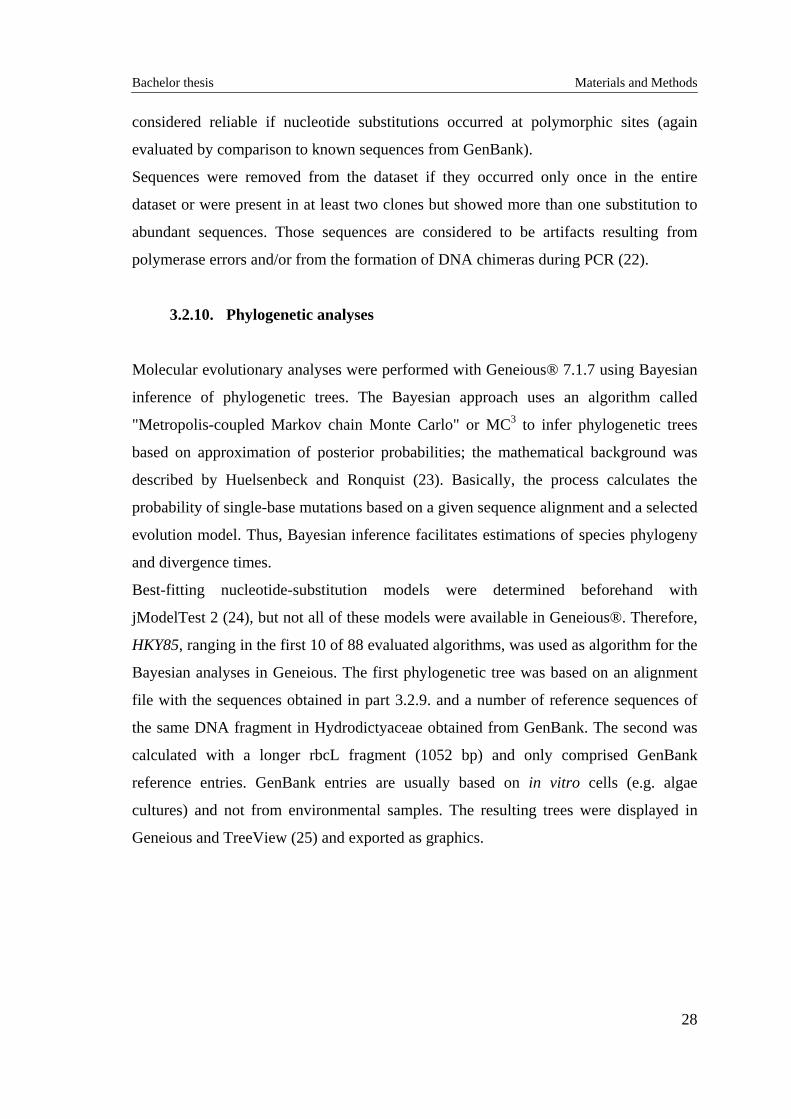
One exemplary gel photography for the subsequent T3/T/ PCR is shown in Fig. 5.
After sequencing, seven different Hydrodictyaceae lineages were detected (Table 9) in a
total of 92 clones (9 clones delivered erroneous sequences). The primer pair 185F/309R
detected most lineages; hence, the practical results are consistent with the theoretical
estimation in the ecoPCR approach. Consequently, the main experiment focused on this
Ladd
er
1 2 Bla
nk
1 2 Bla
nk
1 2 Bla
nk
L
1 2 Bla
nk
NT
C
1 2 Bla
nk
NT
C
1 2 B
lank
N
TC
L
bp 500- 200-
50- single PCR nested PCR
Bachelor thesis Results
31
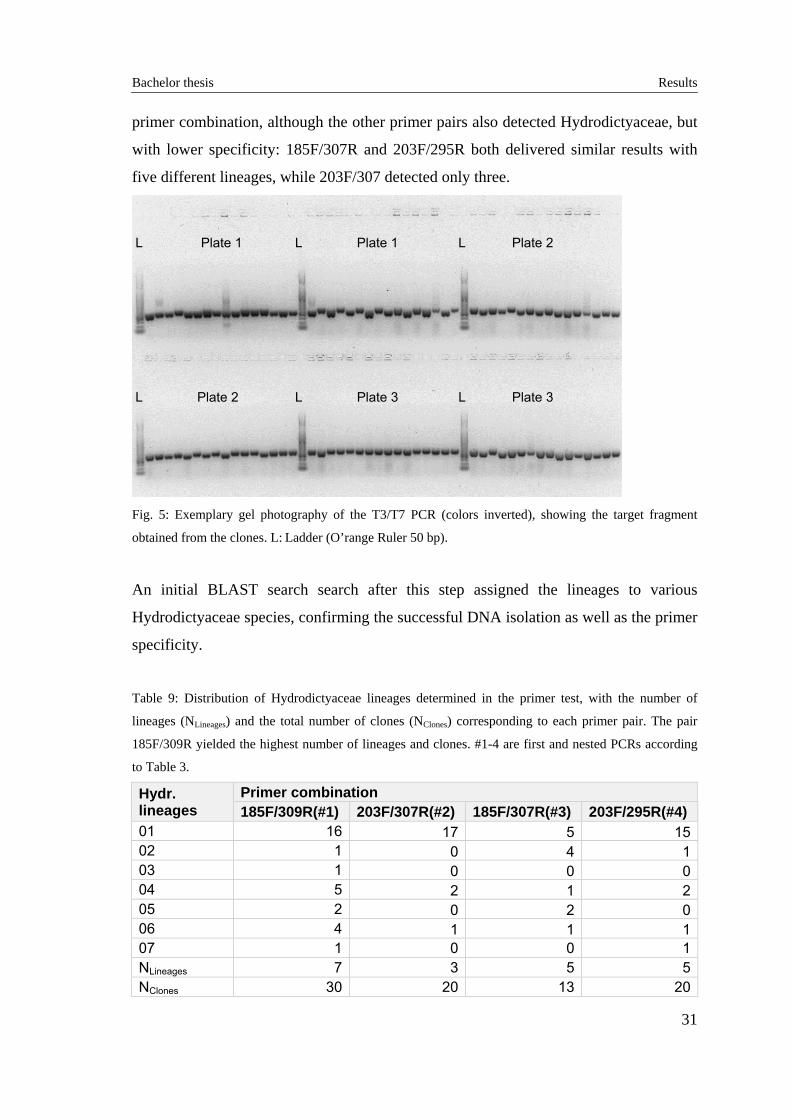
primer combination, although the other primer pairs also detected Hydrodictyaceae, but
with lower specificity: 185F/307R and 203F/295R both delivered similar results with
five different lineages, while 203F/307 detected only three.
Fig. 5: Exemplary gel photography of the T3/T7 PCR (colors inverted), showing the target fragment
obtained from the clones. L: Ladder (O’range Ruler 50 bp).
An initial BLAST search search after this step assigned the lineages to various
Hydrodictyaceae species, confirming the successful DNA isolation as well as the primer
specificity.
Table 9: Distribution of Hydrodictyaceae lineages determined in the primer test, with the number of
lineages (NLineages) and the total number of clones (NClones) corresponding to each primer pair. The pair
185F/309R yielded the highest number of lineages and clones. #1-4 are first and nested PCRs according
to Table 3.
Hydr. lineages
Primer combination 185F/309R(#1) 203F/307R(#2) 185F/307R(#3) 203F/295R(#4)
01 16 17 5 1502 1 0 4 103 1 0 0 004 5 2 1 205 2 0 2 006 4 1 1 107 1 0 0 1NLineages 7 3 5 5NClones 30 20 13 20
L Plate 1 L Plate 1 L Plate 2
L Plate 2 L Plate 3 L Plate 3

Bachelor thesis Results
32
4.3. Sequence verification
In total, 92 sequences were obtained in the preliminary primer test and 190 in the main
experiment, including identical sequences that were merged together. Reduction of the
data set to thirteen unique and verified Hydrodictyaceae lineages of the 82bp amplicon
(185F/309R) required a merge of all ambiguous sequences (see part 3.2.9).
Fig. 6: Alignment of verified lineages as annotated sequences. Each primer combination produced
different amplicon lengths (51, 61, 80 and 82 bp) according to their binding positions. Identical bases
were replaced with colored periods to improve readability and to better highlight variable positions.
4.4. Diversity, distribution and classification of Hydrodictyaceae lineages
4.4.1. Diversity and distribution of Hydrodictyaceae lineages
Lineage diversity was assessed for surface and core samples and collected in a data file
(Table 10). Subsequently, the data was displayed graphically with C2, a software for
(paleo)ecological data analysis and visualization (Fig. 7).

Bachelor thesis Results
33
Table 10: Overview over lineages found in sediment and core samples. NClones indicates the total number
of clones obtained; NHydr and NUnid.algae refer to the number of sequences that were assigned to
Hydrodictyaceae and unidentified algae taxa respectively, followed by the according percentage values.
82bp_01 to 82bp_13 cover the thirteen verified lineages (see part 4.3.).
In total, 312 clones were obtained from all examined samples, thereof 220 clones in the
seven surface sediment samples (average of 31 clones per sample) and 92 clones from
the four core sections (average of 23 clones per sample). A total of thirteen unique and
verified lineages with an amplicon length of 82 bp were identified and assigned to
Hydrodictyaceae by BLAST nucleotide search, consecutively labeled 82bp_01 to
82bp_13. These lineages were detected in ten out of the eleven examined samples, in
which they made up between 33 % and 100 % of all lineages detected. In contrast,
unidentified algae were found in nine out of eleven samples, with the highest ratio in the
surface sediment from lake 11-CH-12 (66.7 %) and the core sections from 6-7 cm
(65.2 %) and 42-43 cm depth (100 %), all obtained from the same lake 11-CH-12.
The samples 13-TY-10 and 13-TY-27 feature the highest diversity within the
Hydrodictyaceae lineages, with seven of thirteen different lineages. Apparently, the
lineages 82bp_01 and 02 are predominant in all vegetation types (tundra, forest/tundra,
forest) as they were detected in eight and six out of eleven samples, respectively. In
contrast, three lineages (04, 06, 10) were present in only one lake. These lakes are
Sample NClones NHydr NUnid. algae Hydr (%) Unid. algae (%) 82bp_01 82bp_02 82bp_03 82bp_04
13-TY-02 30 30 0 100 0 28 0 0 013-TY-10 31 25 6 80,65 19,35 8 10 0 011-CH-12 33 11 22 33,33 66,67 0 0 0 1111-CH-17 32 30 2 93,75 6,25 15 13 0 013-TY-27 30 30 0 100 0 16 1 0 113-TY-21 32 26 6 81,25 18,75 18 1 0 111-CH-06 32 30 2 93,75 6,25 27 1 0 00-1 cm 22 10 12 45,45 54,55 3 3 0 0
6-7 cm 23 8 15 34,78 65,22 8 0 0 0
42-43 cm 24 0 24 0 100 0 0 0 0
61-62 cm 23 22 1 95,65 4,35 0 0 22 0
Sample 82bp_05 82bp_06 82bp_07 82bp_08 82bp_09 82bp_10 82bp_11 82bp_12 82bp_13
13-TY-02 0 0 0 2 0 0 0 0 013-TY-10 0 1 0 2 1 0 2 0 111-CH-12 0 0 0 0 0 0 0 0 011-CH-17 0 0 0 0 0 0 1 1 013-TY-27 5 2 4 1 0 0 0 0 013-TY-21 0 1 0 0 1 4 0 0 011-CH-06 0 0 0 0 1 0 0 0 10-1 cm 0 0 0 0 2 0 1 1 0
6-7 cm 0 0 0 0 0 0 0 0 0
42-43 cm 0 0 0 0 0 0 0 0 0
61-62 cm 0 0 0 0 0 0 0 0 0
La
ke
se
dim
en
tsC
ore
11
-CH
-12
AL
ak
e s
ed
ime
nts
Co
re1
1-C
H-1
2A

Bachelor thesis Results
34
assigned to forest/tundra and forested vegetation types. Lineage 82bp_03 appears as the
predominant lineage in the tundra area, though only found in modern sediment of lake
11-CH-12.
With regard to the distribution in the core samples, six lineages were found in the
uppermost section (0-1 cm, modern sediment) and only one was detected in each of the
sections. In section 6-7 cm the predominant lineages 82bp_01 was found and in the
deepest sample at 61-62 cm the lineage 82bp_08, referring to Stauridium, was detected.
The core sample taken from 42-43 cm depth did not yield any Hydrodictyaceae lineage.
It should be noted that the core, originating from lake 11-CH-12, shows remarkable
differences compared to the according surface sediment: while the predominant lineage
in the lake (82bp_03) was not found in any core sample, none of the lineages found in
the core samples were detected in the surface samples. In addition, the core samples
feature greater lineage diversity, but also a higher ratio of unidentified algae compared
to the surface sediment.

Bachelor thesis Results
35
Fig. 7: Graph comparing Hydrodictyaceae lineages and unidentified algae (A) in surface and core
samples; showing absolute number of clones (B) and percentage of clones of lineages (C) per lineage and
sample. The lakes are sorted by vegetation type (tundra: brown; forest tundra: light yellow; forest: green).

Bachelor thesis Results
36
4.4.2. Taxonomic assignment (NCBI BLAST)
The sequences resulting from the initial BLAST public database comparison could be
assigned to Hydrodictyaceae genera with high identification values (>95 %),
particularly Pediastrum and Pseudopediastrum, but also to other species, e.g. Gonium
(Volvocales), with identities below 90 %. Apart from Hydrodictyaceae representatives,
Auxenochlorella and Parachlorella (both Chlorellales) species were also present in the
main experiment. The following Hydrodictyaceae were assigned to the lineages found
in the main experiment: Pseudopediastrum boryanum, Pseudopediastrum kawraiskyi,
Pediastrum angulosum, Pediastrum duplex and Stauridium tetras (Table 11). Please
note that only the first entry with the highest identification (between 96 % and 100 %)
was selected, while subsequent species may have equal or slightly lower identification.
Overall, Pseudopediastrum boryanum features the greatest abundance in all examined
samples, followed by P. kawraiskyi.
Table 11: Taxa assigned to the lineages by NCBI BLAST nucleotide search including accession numbers.
For each lineage, the first hit with the highest sequence identity is displayed.
Lineage NCBI BLAST (first hit) Accession no. Sequence Identity
82bp_01 Pseudopediastrum boryanum EF078347.2 100%82bp_02 Pseudopediastrum kawraiskyi EF078338.2 100%82bp_03 Pediastrum angulosum EF078399.1 100%82bp_04 Pediastrum duplex var. duplex EF078390.2 100%82bp_05 Pediastrum duplex EF078404.1 100%82bp_06 Pediastrum duplex strain EF078404.1 99%82bp_07 Pseudopediastrum boryanum EF078347.2 99%82bp_08 Stauridium tetras EF078391.2 100%82bp_09 Pseudopediastrum boryanum EF078347.2 99%82bp_10 Pediastrum angulosum EF078399.1 99%82bp_11 Pseudopediastrum kawraiskyi EF078338.2 96%82bp_12 Pseudopediastrum boryanum EF078347.2 99%82bp_13 Pseudopediastrum kawraiskyi EF078338.2 96%

Bachelor thesis Results
37
4.5. Phylogenetic analyses
4.5.1. Bayesian phylogenetic tree based on the 82 bp rbcL fragment
Bayesian analyses were conducted several times with chain lengths of 2 and 4 million
iterations and subsampling frequencies of 200 and 400. This means that e.g. the
algorithm was executed 2 million times yielding the same amount of trees in total, but
only each 200th was adopted, resulting in 10,000 trees for the final tree generation.
The input data for phylogenetic analyses is an alignment including the thirteen verified
Hydrodictyaceae lineages and 33 reference sequences from related species obtained
from a database. Furthermore, a less related green algae species is added as outgroup.
Fig. 7 shows the final phylogenetic tree featuring the 13 lineages, related
Hydrodictyaceae reference species and one outgroup, Volvox ovalis.
.
4.5.2. Bayesian phylogenetic tree based on a 1052 bp rbcL fragment
For comparison, a second bayesian phylogenetic tree was calculated using a longer
(1052 bp) rbcL fragment of the same reference sequences as in the former tree (Fig. 8).
Again, V. ovalis was selected as outgroup. Compared to the former tree, the 1052 bp
fragment yielded a better resolution on species level and even separated different strains
of the same species. The results are supported by overall higher posterior probabilities
(see node values) of up to 100 %.

Bachelor thesis Results
38
Fig. 8: Sorted tree showing the calculated phylogeny of the 13 lineages and related species. The node
values indicate statistical support (posterior probabilities in percent) as determined by Bayesian analysis.

Bachelor thesis Results
39
Fig. 9: Reference tree showing the phylogeny of related Hydrodictyaceae species based on a 1052 bp
rbcL fragment obtained from GenBank. The node values indicate statistical support (posterior
probabilities in percent) as determined by Bayesian analysis.

Bachelor thesis Discussion
40
5. Discussion
5.1. Specificity and reliability of tested primers
In a preliminary primer test with five different primers primers combined to four primer
pairs, the combination of the primers Hydr-rbcL_185F and 309R showed the greatest
specificity with seven different lineages in 30 clones. The results confirm the prior
expectations based on ecoPCR, which estimated a target specificity of approximately
87 % for this primer pair and suggest that the complementary positions of the primers
Hydr-rbcL_185F and 309R in the rbcL gene are fairly specific target sites to detect
Hydrodictyaceae. However, a number of non-Hydrodictyaceae green algae were also
detected to a lesser degree, as a consequence of non-variable positions within different
algae taxa in the primer binding regions and/or the ability of the primers to bind rather
unspecifically if the amount of targeted DNA is very low in the investigated sample.
Primer specificity was assessed on two modern samples and detected similar sequences
with all applied primer combinations, supporting the reliability of our results with
regard to the amplification of Hydrodictyaceae DNA. Complemented by all tested
samples, the approach was successfully applied for modern and ancient lake sediment
samples. Similar to prior studies on diatoms in Siberian lake sediments, the results
confirmed a reliable detection of diverse modern and ancient algae lineages from
different sediments using a group-specific approach (15).
5.2. Distribution of lineages obtained from surface and core sediments
Sedimentary DNA was successfully isolated from modern surface sediment and ancient
core samples and could be assigned to the Hydrodictyaceae taxa Pediastrum,
Pseudopediastrum and Stauridium with sufficiently high identity. Although
amplification and detection of lineages was successful for both types of samples, their
genetic diversity focused on the surface sediments and the upper core sections.
Stauridium was confined to the core sections of 61-62 cm depth and was not present in
more recent samples. The results are assumed to be affected by additional factors like

Bachelor thesis Discussion
41
sample age and the applied isolation method. Isolation of DNA from the 2011 lakes and
the core sediments was performed externally about two years prior to this study, in
2012, and with a different isolation protocol that allowed only a smaller amount of
sediment sample. In general, fresh extractions with more sediment used are therefore
expected to deliver better results.
Due to the method of sampling, a surface sample can include up to 4 cm of sediment
layer and integrates over a longer time period than 1 cm core sections. Thus, it is
notable that amplification of sample 11-CH-12 (surface sediment, integrates
approximately over the first four centimeters of sediment) and 11-CH-12A (core, 0-1
cm) yielded remarkably different lineages. It is assumed that particularly in the case of
low template DNA concentrations, results of different PCRs may be inconsistent due to
random and sequence-dependent fluctuations in the primer efficiency, resulting in a
selectivity for certain template DNA. Because of the exponential amplification of DNA
material, irregularities in early PCR cycles may be reinforced to considerable extent.
This PCR amplification bias makes it difficult to obtain reproducible results (22).
Prior to the study, a pattern in the diversity concerning the latitudinal (north-south)
transect of the lakes was assumed, particularly a correlation of Pediastrum diversity
with the vegetation type and hydrochemical characteristics of the examined lakes, such
as a preference of a lineage for a specific vegetation type (tundra, forest tundra or
forest). The preliminary results indicated a general tendency that single lineages
occurred in certain vegetation types. The two predominant lineages in the entire data set
were present in all vegetation types as well as in core sediments, while those lineages
that were overall less abundant showed a more distinct preference, including one
tundra-preferring lineage, two apparently specific to forest tundra and one linked to
forest lakes. Other lineages did not display any clear preference for a vegetation type.
No striking correlation with lake hydrochemistry, e.g. alkalinity or pH, could be derived
from the available data either, but this was not confirmed statistically.
One lake (11-CH-12) and the corresponding core samples included a notably high ratio
of unidentified algae lineages relative to the whole data set. Since this lake (including
core samples) also yielded the highest total number of clones, it is possible that this lake

Bachelor thesis Discussion
42
features a higher diversity in other algae species, causing the primers to detect other
green algae taxa as well.
It should be noted though that the limited extent of this study and the lack of
comparable data from the examined region makes it difficult to formulate a distinct
statement. It is therefore suggested to complement the data sets with further studies on a
larger scale; more accurate results can possibly be obtained with more samples from a
greater spectrum of lake and particularly core sediments. Further studies may then be
complemented with data from other polar and subpolar areas. In spite of the limited
number of examined lakes, we assume that genetic lineages of Pediastrum, as suggested
in prior morphological studies (7) (10), might be able to indicate vegetation changes or
related environmental changes across tree line ecotones. For example, a multi-proxy
study conducted on sediment cores in Alaska indicated that changes in local Pediastrum
populations correlate with lake-level fluctuations and that temperature shifts of only a
few degrees are linked to changes in aquatic ecosystems and the tree line, demonstrating
the sensitivity of the ecotone to climatic influence. However, in contrast to previous
model simulations, the study could not identify tree line fluctuations in concrete
response to general climatic changes in the Holocene (7).
5.3. Phylogenetic analyses and comparison of 82 bp and 1052 bp fragments
Bayesian phylogenetic inference of the lineages showed an outline of the phylogeny of
the examined taxa, but could not provide sufficient resolution down to species and
strain level of Pediastrum with the available sample material. Despite a decent
statistical support (i.e. posterior probabilities greater than 50 %) for the tree branches,
the tree only confirmed genetic similarity, but could not separate most of the lineages
(Fig. 7). One exception is the lineage 82bp_08, which was assigned to Stauridium tetras
in the database comparison and located on the corresponding branch by the
phylogenetic analysis. Furthermore, both lineages 82bp_02 and 82bp_11, which were
previously assigned to Pseudopediastrum kawraiskyi, share the same branch in the tree,
but 82bp_13, which was also assigned to P. kawraiskyi is not located on this branch.
The reference sequence of Pseudopediastrum kawraiskyi was too short to facilitate
calculations with the 1052bp fragment length and thus was excluded from the data set.

Bachelor thesis Discussion
43
Therefore, this reference could not cluster with the 82bp_02 and 82bp_11 branch. The
phylogenetic analyses were performed several times with changing parameters (e.g.
different chain lengths, subsampling frequencies and outgroup species), but overall
yielded similar results.
The results show that in general, rbcL is a suitable group-specific marker for
Hydrodictyaceae, but the selected fragment may be too short and/or too conserved to
display phylogenetic relations with reasonable accuracy and to provide sufficient
resolution on species and subspecies level, leaving the software unable to assign
sequences with little variability to the corresponding taxa. Bayesian phylogenetic
inference of reference sequences of a longer (1052 bp) rbcL fragment improved both
resolution and statistical support since a longer fragment usually features more
divergence between sequences. However, working with ancient environmental DNA
limits the length of the used markers, as degradation causes the fragmentation of DNA
resulting in only very short fragments.
Eventually, the fact that some lineages were assigned to different taxa with equal or
similar identity, might indicate that database entries relying on previous morphological
classification might be inaccurate in individual cases. The set-up of an own reference
data based on taxa from the examined locations would help to identify the obtained
genetic lineages more precisely and would facilitate the design of more specific primers
adjusted to Siberian lineages.
5.4. Indications for the use of sedDNA analyses in paleoecological studies
This study showed that a group-specific approach based on sedimentary DNA analysis
is feasible, but the results are considerably influenced by the grade of decay of sedDNA
and especially aDNA (i.e. the concentration of available template DNA) and the
specificity of the implemented primers towards certain taxa. In comparison to a
traditional pollen-based or morphological analysis, a general metabarcoding approach
allows identification at a lower taxonomic level, but may not detect all present taxa as
reliable as with species- or group-specific primers, as demonstrated before on ancient
permafrost soil samples from the Taymyr Peninsula with other (more universal)

Bachelor thesis Discussion
44
chloroplast barcodes (12). Hence, metabarcoding was suggested as a complementary
tool, but not an alternative, to morphological studies and it was recommended to
combine traditional biodiversity examinations (e.g. morphological and on-site species
examination), wide-ranged metabarcoding and targeted diversity analyses, particularly
the use of specific primers following a general metabarcoding approach in order to
improve the results (12).
RbcL has so far been confirmed as a suitable genetic marker to specifically target
Hydrodictyaceae, but the selected 82 bp fragment could not display a detailed
phylogeny. It is therefore suggested to evaluate other regions of the rbcL gene for their
potential as genetic markers. However, any genetic marker is heavily dependent on the
availability of reference sequences in public databases. So far, reference data in
GenBank is limited to rbcL and ribosomal genes from the nuclear genome; considering
other group- or taxa-specific cpDNA markers is therefore currently not possible due to
the lack of reference data. Ribosomal markers, on the other hand, are considered less
suitable for such analyses as they have less variable regions and will probably not
increase the taxonomic resolution; additionally nuclear markers will likely increase the
amplification of non-targeted organisms. In order to establish new markers, reference
sequences need to be obtained (e.g. by cultivation of algae strains from environmental
samples) and added to the databases, and corresponding primers have to be designed
and tested for their specificity as demonstrated in this study. In addition, we propose the
use of next-generation sequencing techniques in further studies to obtain a more
comprehensive data set and a better resolution of genetic diversity in soil sediments.

Bachelor thesis References
45
6. References
1. Chou JY, Chang JS, Wang WL. Hydrodictyon reticulatum (Hydrodictyaceae, Chlorophyta), A New Recorded Genus and Species of Freshwater Macroalga in Taiwan. BioFormosa. 2006, Vol. 41, 1, pp. 1-8.
2. Vaucher JP. Histoire des Conferves d'eau douce. Geneva : J.J. Paschoud, 1803.
3. Komárek J, Jankovská V. Review of the Green Algal Genus Pediastrum; Implication for Pollen-analytical Research. [ed.] Kies L and Schnetter R. Berlin : Gebr. Borntraeger Verlagsbuchhandlung, 2001. Vol. 108.
4. Whitney BS, Mayle FE. Pediastrum species as potential indicators of lake-level change in tropical South America. Journal of Paleolimnology. 2012, Vol. 47, pp. 601–615.
5. Medeanic S, Silva MB. Indicative value of non-pollen palynomorphs (NPPs) and palynofacies for palaeoreconstructions: Holocene Peat, Brazil. International Journal of Coal Geology. 2010, Vol. 84, pp. 248–257.
6. Komárek J, Jankovská V. Indicative value of Pediastrum and other coccal green algae in palaeoecology. Folia Geobotanica. 2000, Vol. 35, pp. 59-82.
7. Tinner W et al. A 700-year paleoecological record of boreal ecosystem responses to climatic variation from Alaska. Ecology. 2008, Vol. 89, 3, pp. 729-743.
8. Weckström K et al. The ecology of Pediastrum (Chlorophyceae) in subarctic lakes and their potential as paleobioindicators. Journal of Paleolimnology. 2010, Vol. 43, pp. 61-73.
9. Pääbo S et al. Genetic analyses from ancient DNA. Annual Review of Genetics. 2004, Vol. 38, pp. 645-679.
10. Willerslev E et al. Diverse Plant and Animal Genetic Records from Holocene and Pleistocene Sediments. Science. 2003, Vol. 300, pp. 791-795.
11. Epp LS et al. New environmental metabarcodes for analysing soil DNA: potential for studying past and present ecosystems. Molecular Ecology. 2012, Vol. 21, 8, pp. 1821–1833.
12. Parducci L et al. Molecular- and pollen-based vegetation analysis in lake sediments from central Scandinavia. Molecular Ecology. 2013, Vol. 22, 13, pp. 3511-3524.
13. Calie PJ, Manhart JR. Extensive sequence divergence in the 3' inverted repeat of the chloroplast rbcL gene in non-flowering land plants and algae. Gene. 1994, Vol. 146, 2, pp. 251-256.

Bachelor thesis References
46
14. Stoof-Leichsenring KR et al. Hidden diversity in diatoms of Kenyan Lake Naivasha: a genetic approach detects temporal variation. Molecular Ecology. 2012, Vol. 21, 8, pp. 1918-1930.
15. Stoof-Leichsenring KR et al. A combined paleolimnological/genetic analysis of diatoms reveals divergent evolutionary lineages of Staurosira and Staurosirella (Bacillariophyta) in Siberian lake sediments along a latitudinal transect. Journal of Paleolimnology. 2014, 1.
16. MacDonald GM, Kremenetski KV, Beilman DW. Climate Change and the Northern Russian Treeline Zone. Philosophical Transactions of The Royal Society: Biological Sciences. 2008, Vol. 363, 1501, pp. 2285-2299.
17. Herzschuh U et al. Siberian larch forests and the ion content of thaw lakes form a geochemically functional entity. Nature Communications. 2013, Vol. 4, 2408.
18. Mullis KB et al. Primer-Directed Enzymatic Amplification of DNA with a Thermostable DNA Polymerase. Science. 1988, Vol. 239, pp. 487-491.
19. Sanger F, Nicklen S, Coulson AR. DNA sequencing with chain-terminating inhibitors. PNAS. 1977, Vol. 74, 12, pp. 5463-5467.
20. Hall TA. BioEdit: a user-friendly biological sequence alignment editor and analysis program for Windows 95/98/NT. Nucleic Acids Symposium Series. 1999, Vol. 41, pp. 95-98.
21. Tamura K et al. MEGA6: Molecular Evolutionary Genetics Analysis version 6.0. Molecular Biology and Evolution. 2013, Vol. 30, pp. 2725-2729.
22. Chandler DP, Fredrickson JK, Brockman FJ. Effect of PCR template concentration on the composition and distribution of total community 16S rDNA clone libraries. Molecular Ecology. 1997, Vol. 6, 5, pp. 475-482.
23. Huelsenbeck JP, Ronquist F. MRBAYES: Bayesian inference of phylogenetic trees. Bioinformatics. 2001, Vol. 17, 8, pp. 754-755.
24. Darriba D et al. jModelTest 2: more models, new heuristics and parallel computing. Nature Methods. 2012, Vol. 9, 8, p. 772.
25. Page RD. TreeView: An application to display phylogenetic trees on personal computers. Computer Applications in the Biosciences. 1996, Vol. 12, 4, pp. 357-358.
26. Ficetola GF et al. An In silico approach for the evaluation of DNA barcodes. BMC Genomics. 2010, Vol. 11, 434.

Bachelor thesis List of figures and tables
47
7. List of figures and tables
Page
Fig. 1: Different morphotypes of Pediastrum 9
Fig. 2: Study area in the Khatanga region 17
Fig. 3: Schematic overview 25
Fig. 4: Gel photography of the primer test (single and nested PCR) 30
Fig. 5: Exemplary gel photography of clones (T3/T7 PCR) 31
Fig. 6: Alignment of verified lineages as annotated sequences 32
Fig. 7: C2 graph displaying the results 35
Fig. 8: Bayesian phylogenetic tree (82 bp rbcL amplicon) 38
Fig. 9: Bayesian phylogenetic tree (1052 bp rbcL fragment from GenBank) 39
Fig. 10: Amplification of DNA from 2011 and 2013 lake sediment samples 49
Fig. 11: Gel photography of clones (T3/T7 PCR) 49
Table 1: Sample overview: field data, geochemical data, vegetation type 18
Table 2: Primer overview: name, sequence, length and properties 21
Table 3: Primer combinations and amplicon properties 21
Table 4: PCR conditions for the single and nested PCR 22
Table 5: PCR conditions for the single PCR with 50 cycles 23
Table 6: PCR conditions for standard T3/T7 PCR 26
Table 7: Sediment weight prior to isolation and concentration of genomic DNA 29
Table 8: Primer specificity calculated by ecoPCR 30
Table 9: Distribution of Hydrodictyaceae lineages in the primer test 31
Table 10: Overview over lineages found in sediment and core samples 33
Table 11: Taxa assigned to the lineages by NCBI BLAST nucleotide search 36

Bachelor thesis List of symbols and abbreviations
48
8. List of symbols and abbreviations
A Adenine
bp Base pairs
BLAST Basic Local Alignment Search Tool
BSA Bovine serum albumin
C Cytosine
DEPC diethyl pyrocarbonate
DNA Deoxyribonucleic acid
- aDNA ancient DNA
- cpDNA chloroplast DNA
- sedDNA sedimentary DNA
dNTPs Deoxyribonucleoside triphosphates
EtOH Ethanol
G Guanine
PCR Polymerase chain reaction
- qPCR Real-time (quantitative) PCR
RNA ribonucleic acid
- rRNA ribosomal RNA
RT room temperature (25° C)
SOC Super Optimal broth with Catabolite repression
T Thymine
TA Annealing temperature
TM Melting temperature
TAE Tris/Acetate/EDTA buffer
Tris Tris(hydroxymethyl)aminomethane
UV ultraviolet light

Bachelor thesis Appendix
49
9. Appendix
Fig. 10: Amplification of DNA from (A) 2011 and (B) 2013 lake sediment samples; gel photography with
inverted colors. The signal in both negative controls (~50 bp) is possibly a result of remaining primers
and primer dimers. Ladder: O’range Ruler 50 bp
Fig. 11: Gel photography (colors inverted) of a T3/T7 PCR, showing the target fragment obtained from
the clones (82 bp amplicon and primer sequence, all with 185F/309R primers). Clones with incorrect
fragment length or indistinct signal (arrows) were excluded from sequencing.
L
200----
50----
L
200
50 200
50
A B
L
200- 50-
13-T
Y-0
2 13
-TY
-06
Bla
nk
13-T
Y-2
1 13
-TY
-10
Bla
nk
13-T
Y-2
9
Bla
nk
NT
C