Embed Size (px)
Citation preview
Baburao Kamble (Ph.D)University of Nebraska-Lincoln
Data Analysis Using RWeek3: Data Input/Output (Import/Export) in R
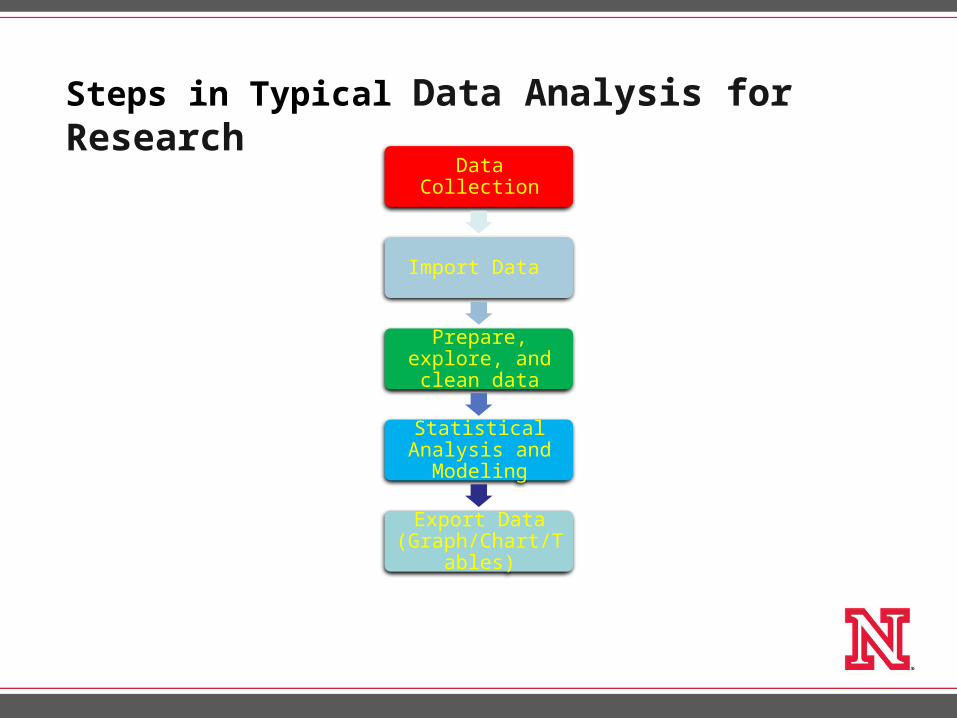
Steps in Typical Data Analysis for Research
Data Collection
Import Data
Prepare, explore, and clean data
Statistical Analysis and Modeling
Export Data (Graph/Chart/Tables)
Data Import/Export in R
• Importing and Exporting data into R is very simple.
• Everyone conducts variety of experiments and collects data in variety of data formats.
• Your task is to import the data into your tools, analyze the data.
• Importing and Exporting data into R is very simple.
• Several methods available to import and export data files into R based on data file formats such as txt, csv, shape, images, databases, data loggers, json, etc.
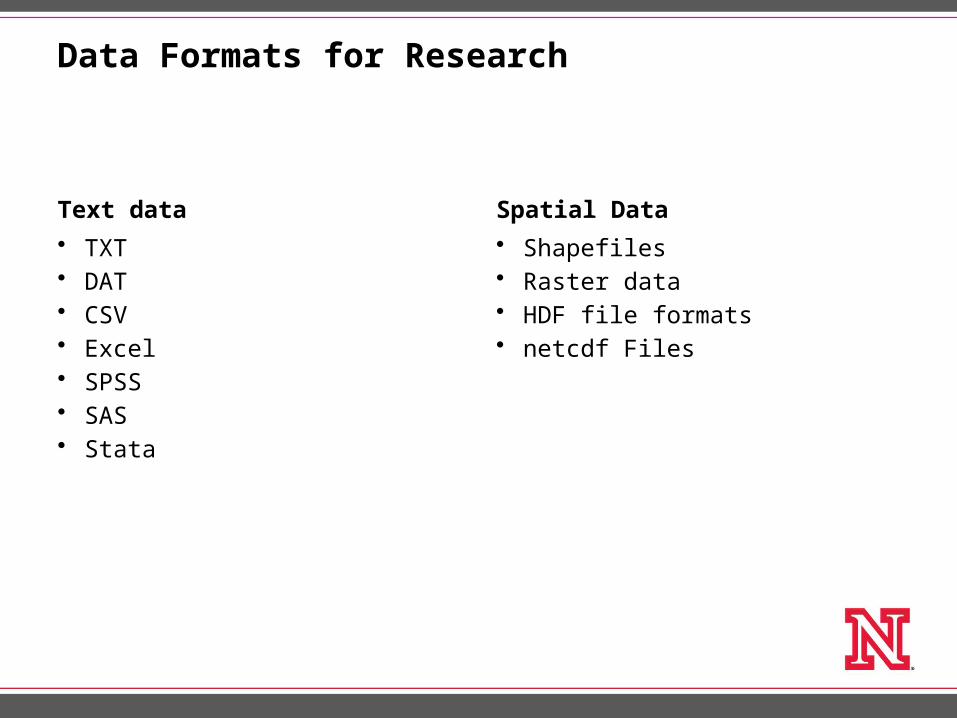
Data Formats for Research
Text data
• TXT• DAT• CSV• Excel• SPSS• SAS• Stata
Spatial Data
• Shapefiles• Raster data • HDF file formats • netcdf Files
*.TXT Data
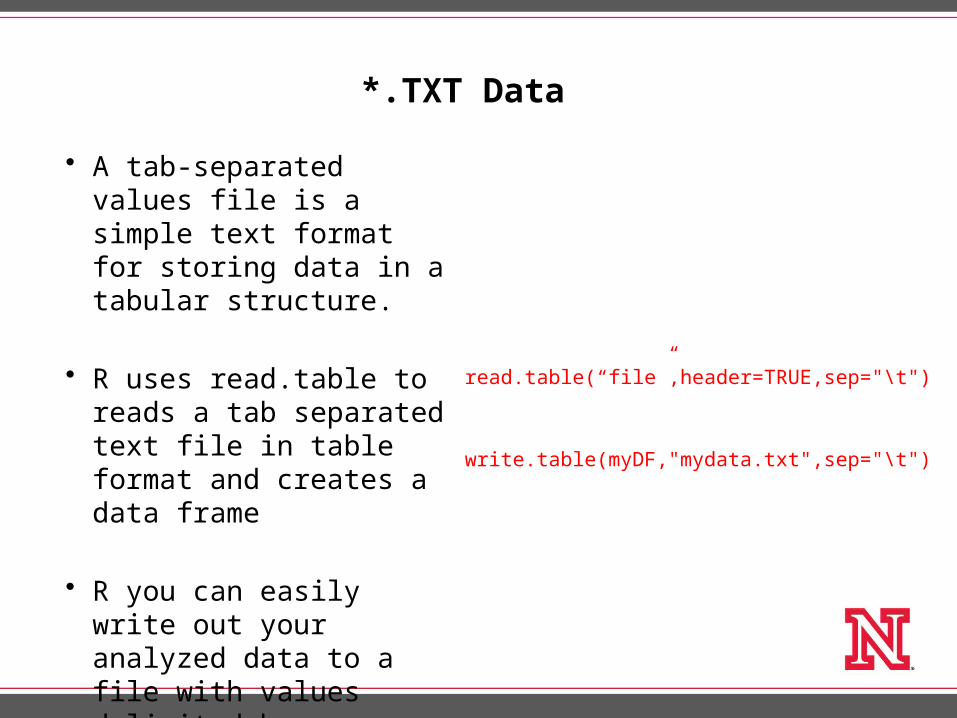
• A tab-separated values file is a simple text format for storing data in a tabular structure.
• R uses read.table to reads a tab separated text file in table format and creates a data frame
• R you can easily write out your analyzed data to a file with values delimited by commas, tabs, spaces, or other characters.
read.table(“file”,header=TRUE,sep="\t")
write.table(myDF,"mydata.txt",sep="\t")
*.CSV Data
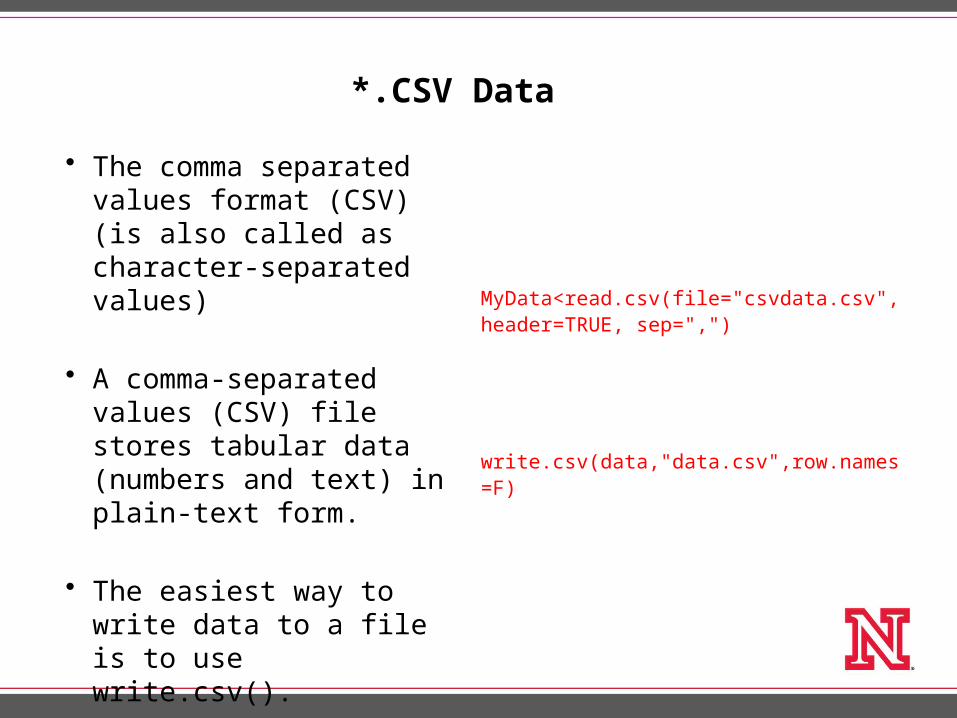
• The comma separated values format (CSV) (is also called as character-separated values)
• A comma-separated values (CSV) file stores tabular data (numbers and text) in plain-text form.
• The easiest way to write data to a file is to use write.csv().
MyData<read.csv(file="csvdata.csv", header=TRUE, sep=",")
write.csv(data,"data.csv",row.names=F)
*.XLS or XLSX Data
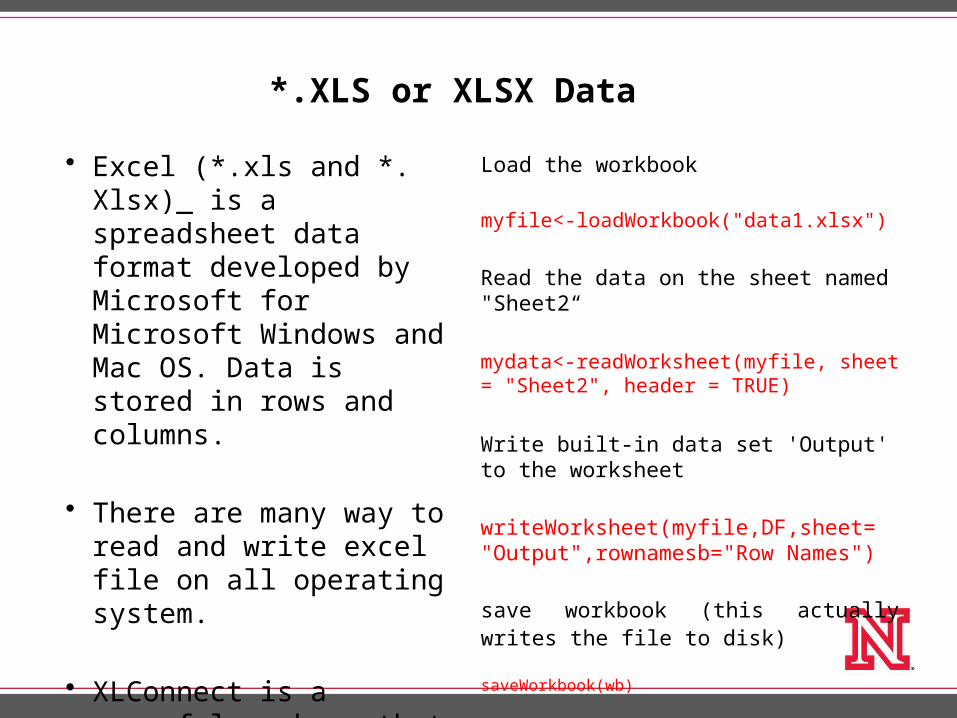
• Excel (*.xls and *. Xlsx)_ is a spreadsheet data format developed by Microsoft for Microsoft Windows and Mac OS. Data is stored in rows and columns.
• There are many way to read and write excel file on all operating system.
• XLConnect is a powerful package that allows R users to read and write Excel
Load the workbook
myfile<-loadWorkbook("data1.xlsx")
Read the data on the sheet named "Sheet2“
mydata<-readWorksheet(myfile, sheet = "Sheet2", header = TRUE)
Write built-in data set 'Output' to the worksheet
writeWorksheet(myfile,DF,sheet= "Output",rownamesb="Row Names")
save workbook (this actually writes the file to disk)
saveWorkbook(wb)
SPSS, Stata and SAS Data
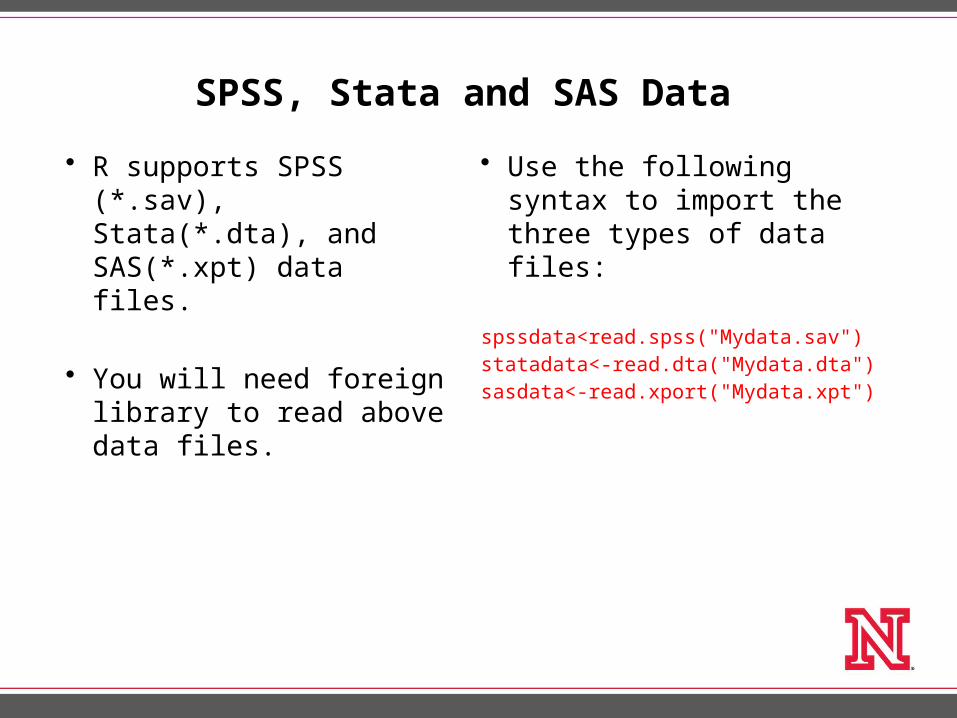
• R supports SPSS (*.sav), Stata(*.dta), and SAS(*.xpt) data files.
• You will need foreign library to read above data files.
• Use the following syntax to import the three types of data files:
spssdata<read.spss("Mydata.sav")statadata<-read.dta("Mydata.dta")sasdata<-read.xport("Mydata.xpt")
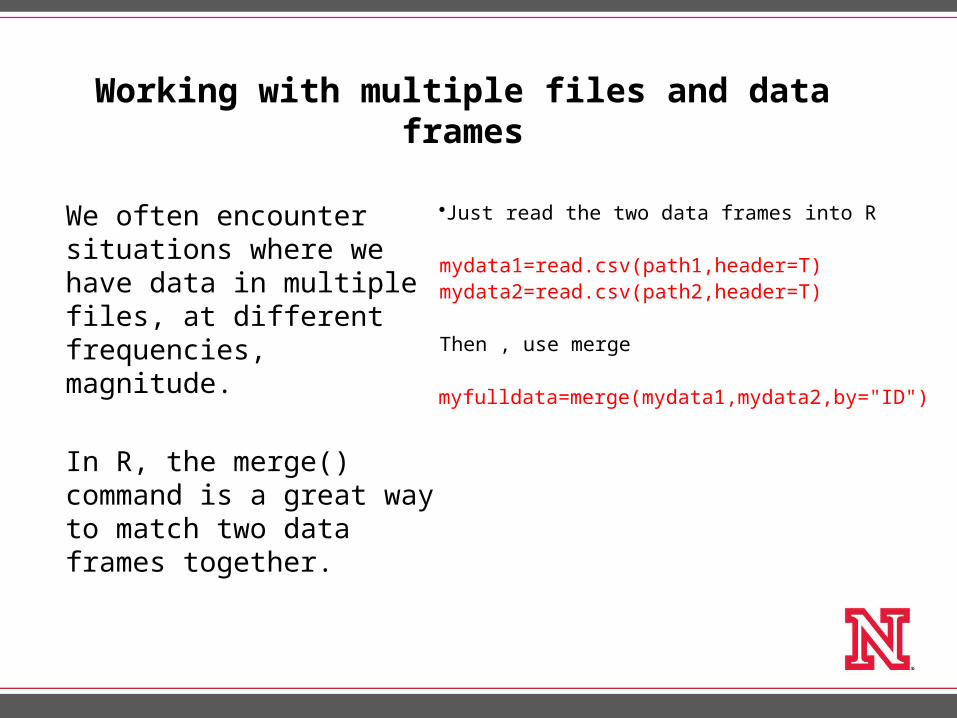
Working with multiple files and data frames
We often encounter situations where we have data in multiple files, at different frequencies, magnitude.
In R, the merge() command is a great way to match two data frames together.
•Just read the two data frames into R
mydata1=read.csv(path1,header=T)mydata2=read.csv(path2,header=T)
Then , use merge
myfulldata=merge(mydata1,mydata2,by="ID")
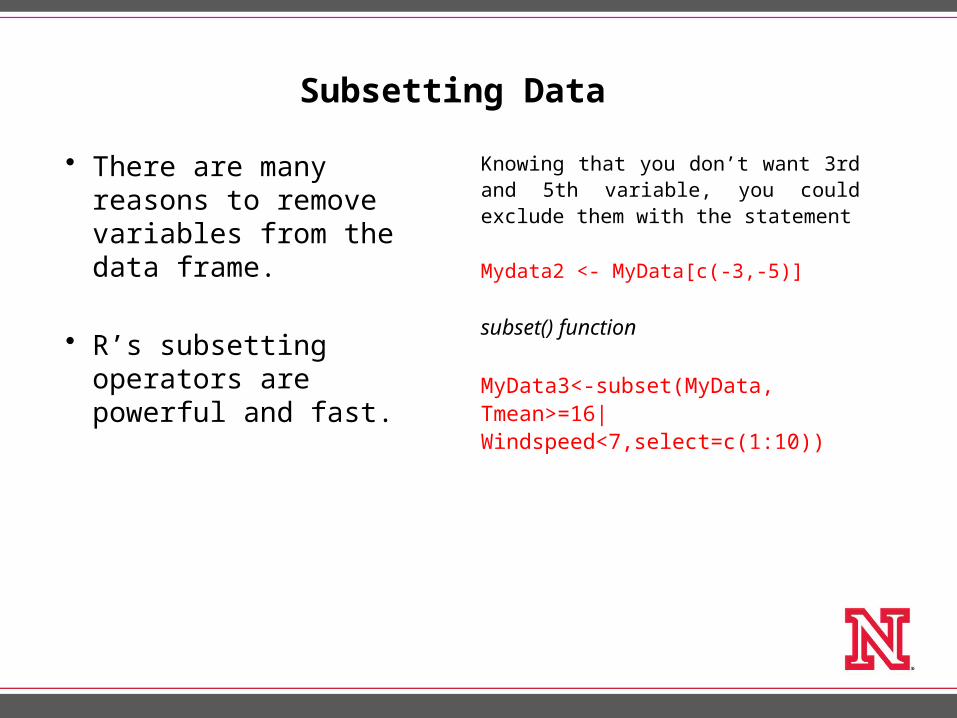
Subsetting Data
• There are many reasons to remove variables from the data frame.
• R’s subsetting operators are powerful and fast.
Knowing that you don’t want 3rd and 5th variable, you could exclude them with the statement
Mydata2 <- MyData[c(-3,-5)]
subset() function
MyData3<-subset(MyData, Tmean>=16|Windspeed<7,select=c(1:10))
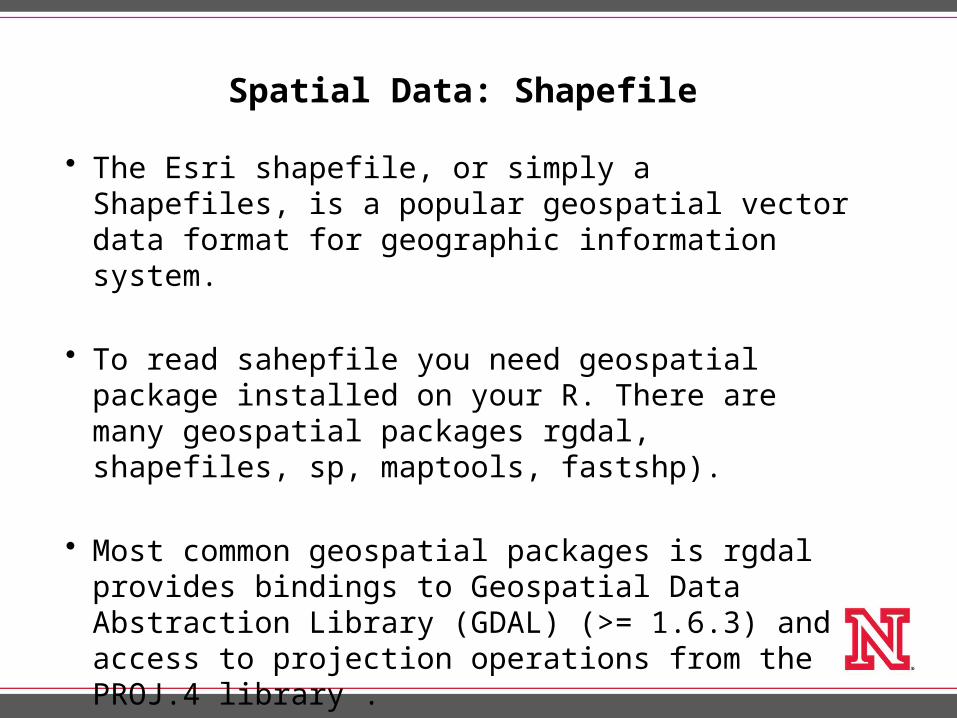
Spatial Data: Shapefile
• The Esri shapefile, or simply a Shapefiles, is a popular geospatial vector data format for geographic information system.
• To read sahepfile you need geospatial package installed on your R. There are many geospatial packages rgdal, shapefiles, sp, maptools, fastshp).
• Most common geospatial packages is rgdal provides bindings to Geospatial Data Abstraction Library (GDAL) (>= 1.6.3) and access to projection operations from the PROJ.4 library .
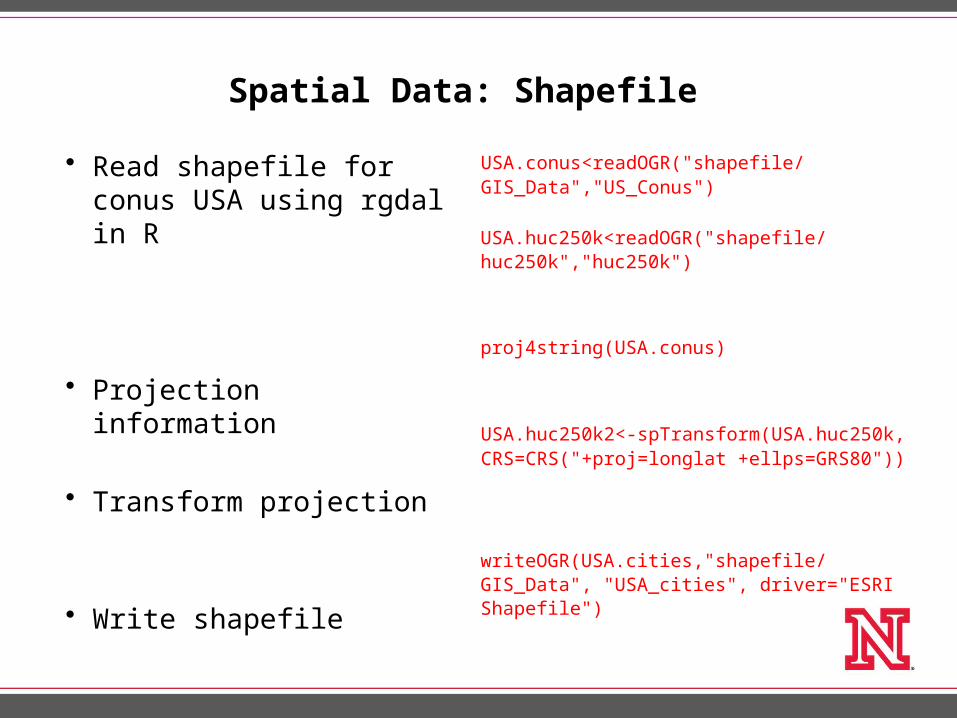
Spatial Data: Shapefile
• Read shapefile for conus USA using rgdal in R
• Projection information
• Transform projection
• Write shapefile
USA.conus<readOGR("shapefile/GIS_Data","US_Conus")
USA.huc250k<readOGR("shapefile/huc250k","huc250k")
proj4string(USA.conus)
USA.huc250k2<-spTransform(USA.huc250k, CRS=CRS("+proj=longlat +ellps=GRS80"))
writeOGR(USA.cities,"shapefile/GIS_Data", "USA_cities", driver="ESRI Shapefile")
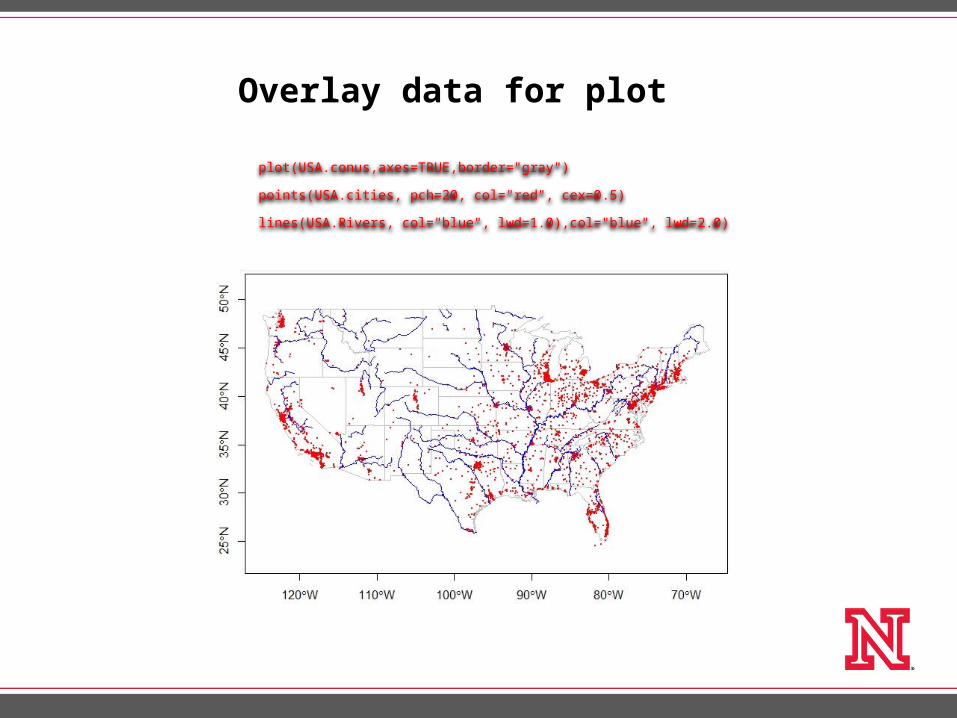
Overlay data for plot
plot(USA.conus,axes=TRUE,border="gray")
points(USA.cities, pch=20, col="red", cex=0.5)
lines(USA.Rivers, col="blue", lwd=1.0),col="blue", lwd=2.0)
Spatial Data: Raster
• In its simplest form, a raster consists of a matrix of cells (or pixels) organized into rows and columns (or a grid) where each cell contains a value representing information, such as temperature, elevation etc.
• R supports reading writing geospatial and non-geospatial raster data.
• The raster package has functions for creating, reading, manipulating, and writing raster data. The package provides, among other things, general raster data manipulation functions that can easily be used to develop more specific functions
Spatial Data: Raster
Read elevation data from USGS
MyDEM= raster("DEM.tif")
plot(MyDEM,col=(terrain.colors(1000)))
Psychometric constant calculation from elevation
psy <-(0.0673645*((293-0.0065* MyDEM)/293)^5.26)
You can write an entire Raster* object to a file
outputraster<-writeRaster(psy, filename="psychrometric.tif", overwrite=TRUE)
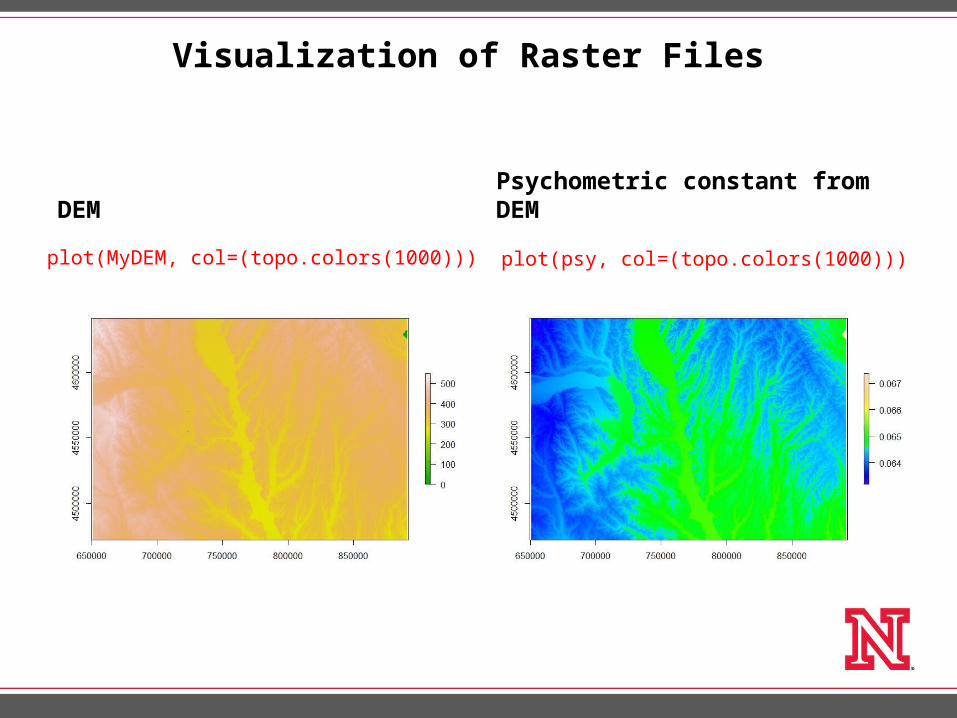
Visualization of Raster Files
DEM Psychometric constant from DEM
plot(MyDEM, col=(topo.colors(1000))) plot(psy, col=(topo.colors(1000)))
Assignment
Text Data Spatial Data
• Use Landsat Band3 and Band4 to calculate NDVI from website
NDVI=(band4-band3)/(band4+band3)
• Output NDVI as plot use any color
• Submission (plot and R script)
• Import your own data (two files) in R system in any format (csv, excel or text)
• Use subset operation on the data. • Do some scientific calculation related
to your research. • Output data and calculations as csv or
excel file
• Submission (sample data, write up about data and R script)

• Questions ?