Embed Size (px)
DESCRIPTION
http://banda.ie/assets/files/BA%20Consumer%20Confidence%20Bar%20November%202012%20pres.pdf
Citation preview

IMAGE HERE INTO GREY AREA.Consumer
Confidence
Tracker
November 2012
Prepared by Luke Reaper
J.3613
“At least we’ve
turned the
corner”

2
Introduction
This report presents the findings of the latest phase of the Behaviour & Attitudes’
Consumer Confidence Tracker.
Survey results for this phase are based on a sample of 1,001 adults aged 16+, quota
controlled in terms of age, gender, socio-economic class and region to reflect the
profile of the adult population of the Republic of Ireland.
All interviewing on the survey is conducted on our fortnightly face-to-face Barometer
by trained members of the B&A field force working under ESOMAR guidelines.
Fieldwork on the latest wave was carried out between 17th November to 27th
November 2012.
The figures contained within the B&A Consumer Confidence Barometer have an
estimated margin of error of plus or minus 3.2 percentage points.

3
About Behaviour & Attitudes
Behaviour and Attitudes is Ireland’s largest and most experienced independently
owned research company.
We pride ourselves on having the most experienced director team in Ireland.
All projects have a director involved.
Established over 25 years ago, Behaviour and Attitudes provides a full range of
market research services, ranging from CAPI, CATI, online and of course qualitative.
Specialist sectors include: Retail & Shopper, Technology & Telecoms, Financial,
Political & Social, Polling, Automotive, Healthcare and Public Sector & Utilities.
For more information please visit our website at: www.banda.ie or contact us on
+353 1 2057500.

4
Findings
5
Summary
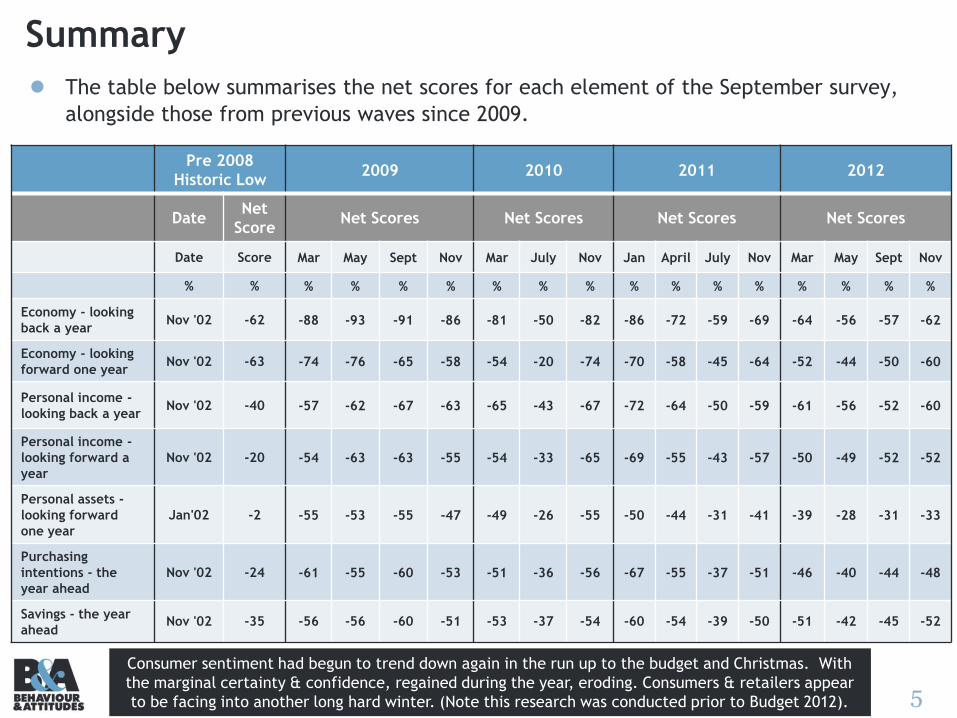
The table below summarises the net scores for each element of the September survey,
alongside those from previous waves since 2009.
Pre 2008
Historic Low2009 2010 2011 2012
DateNet
ScoreNet Scores Net Scores Net Scores Net Scores
Date Score Mar May Sept Nov Mar July Nov Jan April July Nov Mar May Sept Nov
% % % % % % % % % % % % % % % % %
Economy - looking
back a yearNov '02 -62 -88 -93 -91 -86 -81 -50 -82 -86 -72 -59 -69 -64 -56 -57 -62
Economy - looking
forward one yearNov '02 -63 -74 -76 -65 -58 -54 -20 -74 -70 -58 -45 -64 -52 -44 -50 -60
Personal income -
looking back a yearNov '02 -40 -57 -62 -67 -63 -65 -43 -67 -72 -64 -50 -59 -61 -56 -52 -60
Personal income -
looking forward a
year
Nov '02 -20 -54 -63 -63 -55 -54 -33 -65 -69 -55 -43 -57 -50 -49 -52 -52
Personal assets -
looking forward
one year
Jan'02 -2 -55 -53 -55 -47 -49 -26 -55 -50 -44 -31 -41 -39 -28 -31 -33
Purchasing
intentions - the
year ahead
Nov '02 -24 -61 -55 -60 -53 -51 -36 -56 -67 -55 -37 -51 -46 -40 -44 -48
Savings - the year
aheadNov '02 -35 -56 -56 -60 -51 -53 -37 -54 -60 -54 -39 -50 -51 -42 -45 -52
Consumer sentiment had begun to trend down again in the run up to the budget and Christmas. With
the marginal certainty & confidence, regained during the year, eroding. Consumers & retailers appear
to be facing into another long hard winter. (Note this research was conducted prior to Budget 2012).

6Q.1 Thinking about the economy as a whole, do you think that the country is better off,
worse off, or about the same as last year?
Economy – Looking Back
Better off
Same
Worse off
COUNTRY
IS NOW …
0%
53%
66%
35%
26% 23%28%
70%
91%
76% 76%84%
61%
84%88%
77%
66%
75%70%
62% 64% 67%
0%
34%
27%
42%
45%46%
50%
23%
7%
18% 19%
13%
28%
14%10%
17%
27%
19%24%
29% 28%28%
0%
13%7%
23%29% 31%
22%
6%2% 5% 5% 3%
11%
2% 2% 5% 7% 6% 6% 8% 8% 5%
LONG TERM
2002 20052003 2004 2006 2007 2008
2010
Mar2009 July Nov2010
2011
Jan Apr July Nov
2012
Mar May 2011 Sept
Gap -40 -59 -13 +3 +8 -6 -64 -89 -71 -71 -81 -50 -82 -86 -72 -59 -69 -64 -56 -57 -62
Nov
Fears over the economy continue to escalate. Given that we are entering the sixth year of recession some uplift
should be observable, if consumers held a genuine belief in the strength of the Irish recovery. While the
Government may believe we have turned the corner, consumers are perceiving it as more of an economic maze.

7
Economy – Looking Forward
Better off
Same
Worse off
Country
will be …
Q.2 And what about the coming year, do you think that the country will be better off, worse off or about the same as this year?
49%
59%
37%
27% 26%34%
67%74%
61%67%
63%
42%
78% 76%
66%
57%
72%
61%55%
61%66%
38%
32%
43%
48% 48%
47%
25%
20%
27%
24%28%
36%
17%18%
25%
31%
20%
30%33%
28%
28%
13%9%
20%25% 26%
19%
8% 6%12% 9% 9%
22%
4% 6% 8%12%
8% 9% 11% 11%6%
Gap -36 -50 -17 -2 = -15 -59 -68 -49 -58 -54 -20 -74 -70 -58 -45 -64 -52 -44 -50 -60
LONG TERM
2002 20052003 2004 2006 2007 2008
2010
Mar2009 July Nov2010
2011
Jan Apr July Nov
2012
Mar May 2011 Sept Nov
Perceptions of short/medium term recovery are considerably weaker at the end of 2012. Belief and optimism in the
fate of the economy is waning. The further impositions from the budget (removal of €3.5 billion) from the domestic
economy can only deflate this further. Where belief in the wider economy fuels consumer spending, continuous
uncertainty only further stagnates spending intent. Following from these trends we would anticipate a weaker
consumer spend for Q1 2013.

8
Balance Of Opinion - Economy
Balance +/-
-40
-59
-13
38
-6
-64
-89
-71 -71
-86
-72
-59
-69-64
-56 -57-62
-36
-50
-17
-2 0
-15
-59
-68
-49
-58
-70
-58
-45
-64
-52
-44-50
-60
-100
-90
-80
-70
-60
-50
-40
-30
-20
-10
0
10
2002 2003 2004 2005 2006 2007 2008 2009 2010 2011 Jan Apr July Nov Mar May Sept Nov
Looking Back
Looking Forward
YEARLY AVERAGES 2011 2012
Long Term Short Term
Belief in economic recovery is becoming more negative again. While not at a nadir point for all
consumers, hope and certainty are definitely waning. A tipping point may be reached in 2013 as middle
income consumers further retrench spending due to and in anticipation of further cuts and impositions.
Domestic retail and service providers would be well advised to review the value basis of products and
estimated stocking requirements now in anticipation of Q1 and Q2.

9
-41
-55
-69-73
-77 -79
-88
-93
-91-86
-81
-50
-82-86
-72
-59
-69-64
-56 -57-62
-42
-56
-66 -67 -65-69
-74 -76
-65-58
-54
-20
-74-70
-58
-45
-64
-52-44
-50
-60
-100
-90
-80
-70
-60
-50
-40
-30
-20
-10
0
10
Jan Mar July Sept Oct Dec Mar May Sept Nov Mar July Nov Jan Apr July Nov Mar May Sept Nov
Looking Back
Looking Forward
Irish Consumer Confidence has been on a Psychological
Journey
2008
Balance +/-
Generally a depressing state of affairs, with consumers reacting sharply to media events.
Shock Anger Acceptance Despair Despondence
Shock as we head
for recession
The economy is in a
worse state than we
thought
And it’s mostly all our
own fault!
Things have been bad, but we seem to have hit the
bottom
IMF bailout: absolute despair
We may have just about hit
the bottom, but we are likely to remain there for
some time.
Source: B & A Consumer
Confidence Monitor
2009 2010 2011 2012
Depression
A fugue state in which all actions have negligible
rewards.

10Q.3 Do you feel better off financially, worse off financially or about the same compared to last year?
Personal Finances – Looking Back
Better off
Same
Worse off
Now feel …
38%44%
32%
24% 22% 20%
44%
65% 62% 66% 67%
50%
69%75%
69%
57%64% 66%
61% 59%64%
47%
45%
47%
51% 52% 56%
46%
32%33% 30%
31%
43%
28%21%
26%
36%
31% 29%34%
35%
32%
15%11%
21%25% 26% 24%
9% 2% 4% 5% 2%7%
2% 3% 5% 7% 5% 5% 5% 7% 4%
Gap -23 -34 -11 +1 +4 +4 -35 -63 -58 -61 -65 -43 -67 -72 -64 -50 -59 -61 -56 -52 -60
LONG TERM
2002 20052003 2004 2006 2007 2008
2010
Mar2009 July Nov2010
2011
Jan Apr July Nov
2012
Mar May 2011 Sept Nov
Consumer real income values continue to decline. Between wage stagnation, inflation, and
direct and indirect taxation there has been a five year undermining of wage levels.

11
Q.5 Do you expect your income in the next year, after inflation and taxes,
to be higher, lower or the same as in the last twelve months?
Personal Finances – Looking Forward
Higher
The same
Lower
Expect it
to be …
24% 27%
17%13% 12% 13%
34%
64%57%
63%58%
44%
70%74%
63%
52%
64%58% 56% 59% 59%
54% 54%
58%58%
58% 59%
52%
30%
35%31% 38%
46%
24%20%
28%
39%
29%35% 37% 34% 34%
22% 22%25% 25%
30% 28%
13%
5% 7% 7% 4%11%
5% 5% 8% 9% 7% 8% 7% 7% 7%
Gap -2 -8 +8 +16 +18 +15 -21 -59 -50 -56 -54 -33 -65 -69 -55 -43 -57 -50 -49 -52 -52
No sign of positive change in personal financial position – and this is before the real budget activity.
LONG TERM
2002 20052003 2004 2006 2007 2008
2010
Mar2009 July Nov2010
2011
Jan Apr July Nov
2012
Mar May 2011 Sept Nov

12
Balance Of Opinion - Personal Finances
Balance +/-
-23
-34
-11
14 4
-35
-63-58
-61-72
-64
-50
-59 -61-56
-52
-59
-2-8
8
16 1815
-21
-59
-50-56
-69
-55
-43
-57
-50 -49 -52 -52
-75
-65
-55
-45
-35
-25
-15
-5
5
15
2002 2003 2004 2005 2006 2007 2008 2009 2010 2011 Jan Apr July Nov Mar May Sept Nov
Looking Back
Looking Forward
Long Term Short Term
YEARLY AVERAGES 2011 2012
Consumers are financially worse off now than in 2011 and this will be exacerbated by budgetary
measures. Inflation and direct/indirect taxation are removing discretionary spend. For those employed,
the demand for wage increases to match inflation may soon become, by necessity, a real requirement.
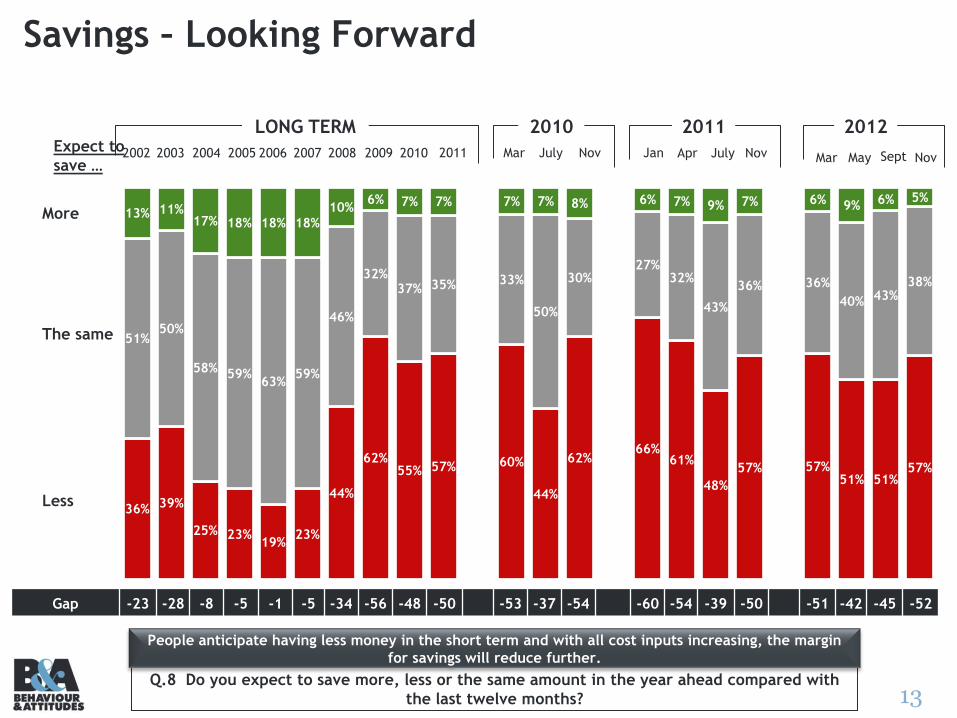
13Q.8 Do you expect to save more, less or the same amount in the year ahead compared with
the last twelve months?
Savings – Looking Forward
More
The same
Less
Expect to
save …
36% 39%
25% 23%19%
23%
44%
62%55% 57% 60%
44%
62%66%
61%
48%
57% 57%51% 51%
57%
51%50%
58% 59%63%
59%
46%
32%37% 35% 33%
50%
30%27%
32%
43%
36% 36%
40% 43%38%
13% 11%17% 18% 18% 18%
10%6% 7% 7% 7% 7% 8% 6% 7% 9% 7% 6% 9% 6% 5%
Gap -23 -28 -8 -5 -1 -5 -34 -56 -48 -50 -53 -37 -54 -60 -54 -39 -50 -51 -42 -45 -52
People anticipate having less money in the short term and with all cost inputs increasing, the margin
for savings will reduce further.
LONG TERM
2002 20052003 2004 2006 2007 2008
2010
Mar2009 July Nov2010
2011
Jan Apr July Nov
2012
Mar May 2011 Sept Nov

14Q.6 Do you expect your assets (your house, shares, pension entitlements, savings)
In the next year to be higher, lower or the same as in the past year?
Personal Assets– Looking Forward
Higher
No change
Lower
Expect them
to be …
13% 13%7% 5% 5% 8%
35%
55%47% 47%
52%
33%
57%52%
49%
38%
48%40%
36% 38% 39%
68% 65%
65%
59% 57%
64%
55%
42%
47% 46%45%
60%
40%43%
45%
54%
45%
51% 56% 55% 55%
19% 22%28%
36% 38%
28%
10%2% 4% 5% 3%
7%2% 2% 5%
7% 7% 9% 8% 7% 6%
Gap +6 +9 +21 +31 +33 +20 -25 -53 -43 -41 -49 -26 -55 -50 -44 -31 -41 -39 -28 -31 -33
LONG TERM
2002 20052003 2004 2006 2007 2008
2010
Mar2009 July Nov2010
2011
Jan Apr July Nov
2012
Mar May 2011 Sept Nov
Asset values are, in the main, so low that further reductions would have negligible real impact. People do not expect
this to change or values to rise. They now appear almost ambivalent to the possibility of further decline.

15Q.7 In the year ahead, do you expect to purchase more, less or the same amount of goods and services as in the past year?
Purchasing Goods And Services – Looking Forward
More
The same
Less
Expect to
purchase …
26% 27%
18% 16% 14% 15%
39%
66%
52%56% 55%
42%
60%
69%
60%
44%
55%51%
45%49%
53%
58% 58%
64%64% 65% 65%
50%
31%
42%39% 40%
52%
36%
29%
34%
50%
41%44%
50%46%
42%
16% 15% 18% 20% 21% 20%
10%3% 5% 4% 4% 6% 4% 2% 5% 7% 4% 5% 5% 5% 5%
Gap -10 -12 = +4 +7 +5 -29 -63 -47 -52 -51 -36 -56 -67 -55 -37 -51 -46 -40 -44 -48
The quantity and value of real income (pre budget) was already anticipated to decline by consumers. For a fifth year the
anticipation is for less spending, driven primarily by inability rather than desire.
LONG TERM
2002 20052003 2004 2006 2007 2008
2010
Mar2009 July Nov2010
2011
Jan Apr July Nov
2012
Mar May 2011 Sept Nov

16
Balance Of Opinion – The Year AheadExpectations in regard to assets value, purchases, and savings
Balance +/-
69
21
31 33
20
-25
-53-43 -41
-50
-44
-31
-41 -39
-28-31 -33
-10 -12
-12
47 5
-29
-63
-47
-52
-67
-55
-37
-51
-46
-40-44
-48
-23-28
-8
-5-1
-5
-34
-56
-48 -50
-60 -54
-39 -50
-51
-42-45
-52
-70
-60
-50
-40
-30
-20
-10
0
10
20
30
40
2002 2003 2004 2005 2006 2007 2008 2009 2010 2011 Jan Apr Jul Nov Mar May Sept Nov
Assets Value
Purchase
Savings
Long Term Short Term
Saving and spend intentions continue to be driven down. This appears to be externally
rather than internally instigated.
YEARLY AVERAGES 2011 2012

17
J.xxxx
Thank youThank you