Embed Size (px)
DESCRIPTION
http://www.banda.ie/assets/files/B&A%20Consumer%20Confidence%20Bar%20January%202011.pdf
Citation preview

IMAGE HERE INTO GREY AREA.Consumer
Confidence
Tracker
January 2011
Prepared by Luke Reaper &
John Clarke
J.2360

2J.1814
Introduction
This report presents the findings of the latest phase of the Behaviour & Attitudes’
Consumer Confidence Tracker.
Survey results for this phase are based on a sample of 1004 adults aged 16+, quota
controlled in terms of age, gender, socio-economic class and region to reflect the
profile of the adult population of the Republic of Ireland.
All interviewing on the survey is conducted on our fortnightly face-to-face Barometer
by trained members of the B&A field force working under ESOMAR guidelines.
Fieldwork on the latest wave was carried out between 12th January to 21st January
2011.
At the end of this report we have also included some of the latest CSO data on GNP,
retail sales, unemployment and inflation.
The figures contained within the B&A Consumer Confidence Barometer have an
estimated margin of error 3.2%.

3J.1814
About Behaviour & Attitudes
Behaviour and Attitudes is Ireland’s largest and most experienced independently
owned research company. We have 30 permanent staff members which includes 10
directors, the most experienced team in the Irish market. In addition, we have a
team of over 150 experienced, fully trained face-to-face interviewers nationwide.
Our Dublin CATI (telephone) Unit is based in our offices in Milltown and has a
capacity for over 60 interviewers.
Established 25 years ago, Behaviour and Attitudes provides a full range of market
research services, ranging from CAPI (Computer Aided Personal Interviewing),
through to standard face-to-face interviewing surveys, CATI (Computer Aided
Telephone Interviewing), central location interviewing, as well as an in-house CAWI
(Computer Aided Web Interviewing) Unit. The company would be well known for
having pioneered the development of qualitative research in Ireland.
Despite being the second largest market research company in Ireland, Behaviour &
Attitudes has a very well defined and tight company structure which is built around
excellent client service delivery principles.
Behaviour & Attitudes is fully owned by Research Directors. These Directors are fully
involved in day-to-day research on behalf of their clients. Hence our clients have
access to the most senior team in the Irish marketplace.
For more information please visit our website at: www.banda.ie
4J.1814
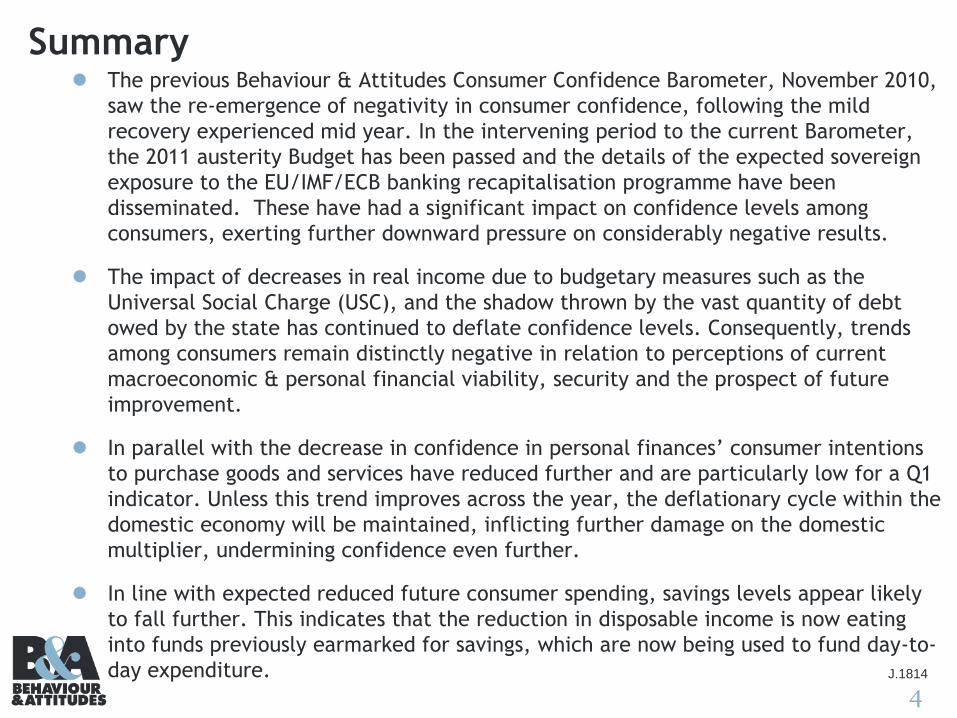
Summary The previous Behaviour & Attitudes Consumer Confidence Barometer, November 2010,
saw the re-emergence of negativity in consumer confidence, following the mild
recovery experienced mid year. In the intervening period to the current Barometer,
the 2011 austerity Budget has been passed and the details of the expected sovereign
exposure to the EU/IMF/ECB banking recapitalisation programme have been
disseminated. These have had a significant impact on confidence levels among
consumers, exerting further downward pressure on considerably negative results.
The impact of decreases in real income due to budgetary measures such as the
Universal Social Charge (USC), and the shadow thrown by the vast quantity of debt
owed by the state has continued to deflate confidence levels. Consequently, trends
among consumers remain distinctly negative in relation to perceptions of current
macroeconomic & personal financial viability, security and the prospect of future
improvement.
In parallel with the decrease in confidence in personal finances’ consumer intentions
to purchase goods and services have reduced further and are particularly low for a Q1
indicator. Unless this trend improves across the year, the deflationary cycle within the
domestic economy will be maintained, inflicting further damage on the domestic
multiplier, undermining confidence even further.
In line with expected reduced future consumer spending, savings levels appear likely
to fall further. This indicates that the reduction in disposable income is now eating
into funds previously earmarked for savings, which are now being used to fund day-to-
day expenditure.

5J.1814
Summary
The table below summarises the net scores for each element of the January survey,
alongside those from previous waves since 2009.
Pre 2008
Historic Low2009 2010 2011
DateNet
ScoreNet Scores Net Scores Net Scores
UNWTD. SAMPLE Date Score Mar May Sept Nov March July November January
% % % % % % % % % %
Economy - looking
back a yearNov '02 -62 -88 -93 -91 -86 -81 -50 -82 -86
Economy - looking
forward one yearNov '02 -63 -74 -76 -65 -58 -54 -20 -74 -70
Personal finance -
looking back a yearNov '02 -40 -57 -62 -67 -63 -65 -43 -67 -72
Personal income -
looking forward a yearNov '02 -20 -54 -63 -63 -55 -54 -33 -65 -69
Personal assets -
looking forward one
year
Jan'02 -2 -55 -53 -55 -47 -49 -26 -55 -50
Purchasing intentions
- the year aheadNov '02 -24 -61 -55 -60 -53 -51 -36 -56 -67
Savings - the year
aheadNov '02 -35 -56 -56 -60 -51 -53 -37 -54 -60
Consumer confidence remains distinctively negative particularly in terms of future
purchase intentions and personal financial stability.

6J.1814Q.1 Thinking about the economy as a whole, do you think that the country is better off,
worse off, or about the same as last year?
Economy – Looking Back
Better off
Same
Worse off
COUNTRY
IS NOW …
GAP -40 -59 -13 +3 +8 -6 -64 -89 -71 -88 -93 -91 -86 -81 -50 -82 -86
LONG TERM 2009
2002 20052003 2004 2006 2007 2008 Mar May Sept Nov
2010
Mar2009
July
0%
53%
66%
35%26% 23%
28%
70%
91%
76%
90% 94% 92% 88% 84%
61%
84% 88%
0%
34%
27%
42%
45%46%
50%
23%
7%
18%
8%5% 7%
10%13%
28%
14% 10%
0%
13%7%
23%29% 31%
22%
6% 2% 5% 2% 1% 1% 2% 3%11%
2% 2%
Nov2010
2011
Jan

7J.1814
Economy – Looking Forward
Better off
Same
Worse off
GAP -36 -50 -17 -2 = -15 -59 -68 -49 -74 -76 -65 -58 -54 -20 -74 -70
Country
will be …
Q.2 And what about the coming year, do you think that the country will be better off, worse
off or about the same as this year?
49%59%
37%27% 26%
34%
67%74%
61%
77% 80%73%
66% 63%
42%
78% 76%
38%
32%
43%
48% 48%
47%
25%20%
27%
20% 16%
19%25%
28%
36%
17%18%
13% 9%
20%25% 26%
19%
8% 6%12%
3% 4% 8% 8% 9%
22%
4% 6%
LONG TERM 2009
2002 20052003 2004 2006 2007 2008 Mar May Sept Nov
2010
Mar2009
July Nov2010
2011
Jan
8J.1814
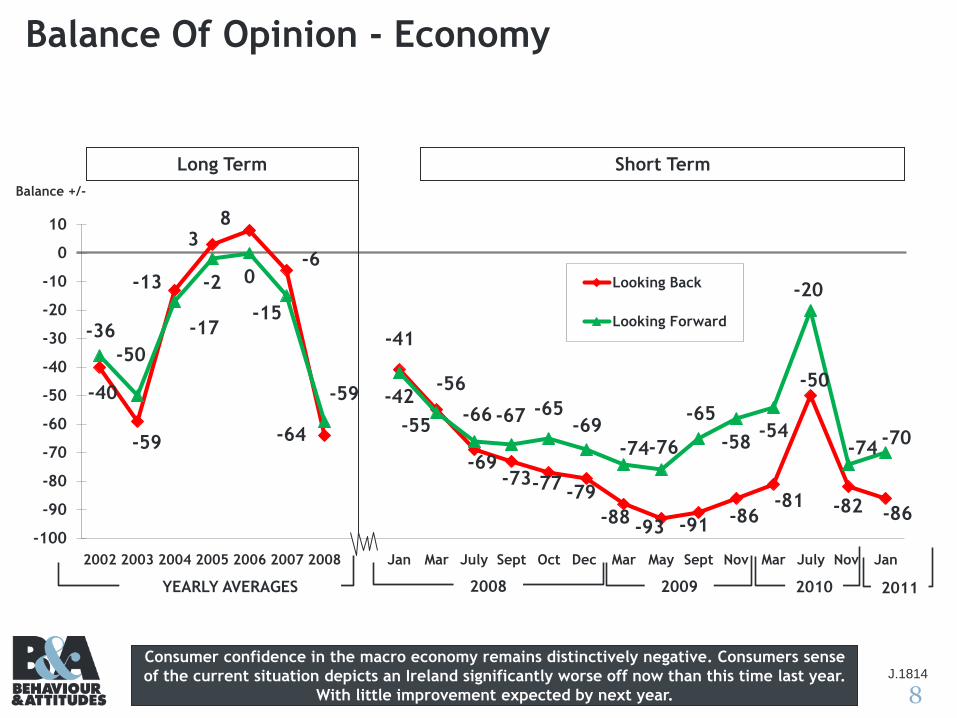
Balance Of Opinion - Economy
Long Term Short Term
Balance +/-
-40
-59
-13
38
-6
-64
-41
-55
-69-73-77 -79
-88-93 -91 -86
-81
-50
-82 -86
-36
-50
-17
-2 0
-15
-59 -42-56
-66 -67 -65-69
-74-76
-65
-58-54
-20
-74-70
-100
-90
-80
-70
-60
-50
-40
-30
-20
-10
0
10
2002 2003 2004 2005 2006 2007 2008 Jan Mar July Sept Oct Dec Mar May Sept Nov Mar July Nov Jan
Looking Back
Looking Forward
YEARLY AVERAGES 20092008 2010
Consumer confidence in the macro economy remains distinctively negative. Consumers sense
of the current situation depicts an Ireland significantly worse off now than this time last year.
With little improvement expected by next year.
2011

9J.1814
Q.3 Do you feel better off financially, worse off financially or about the same compared to
last year?
Personal Finances – Looking Back
Better off
Same
Worse off
Now feel …
GAP -23 -34 -11 +1 +4 +4 -35 -63 -58 -57 -62 -67 -63 -65 -43 -67 -72
38%44%
32%24% 22% 20%
44%
65% 62% 60%64%
69%66% 67%
50%
69%75%
47%
45%
47%
51% 52% 56%
46%
32%33% 37%
34%28%
31% 31%
43%
28%21%
15%11%
21%25% 26% 24%
9% 2% 4% 3% 2% 2% 3% 2%7%
2% 3%
LONG TERM 2009
2002 20052003 2004 2006 2007 2008 Mar May Sept Nov
2010
Mar2009
July Nov2010
2011
Jan

10J.1814
Q.5 Do you expect your income in the next year, after inflation and taxes,
to be higher, lower or the same as in the last twelve months?
Personal Finances – Looking Forward
Higher
The same
Lower
Expect it to
be …
GAP -2 -8 +8 +16 +18 +15 -21 -59 -50 -54 -63 -63 -55 -54 -33 -65 -69
24% 27%
17% 13% 12% 13%
34%
64%57% 60%
67% 67%62%
58%
44%
70%74%
54% 54%
58%58%
58% 59%
52%
30%
35% 34%
29% 29%31% 38%
46%
24%20%
22% 22%25% 25%
30% 28%
13%5% 7% 6% 4% 4% 7% 4%
11%5% 5%
LONG TERM 2009
2002 20052003 2004 2006 2007 2008 Mar May Sept Nov
2010
Mar2009
July Nov2010
2011
Jan
11J.1814
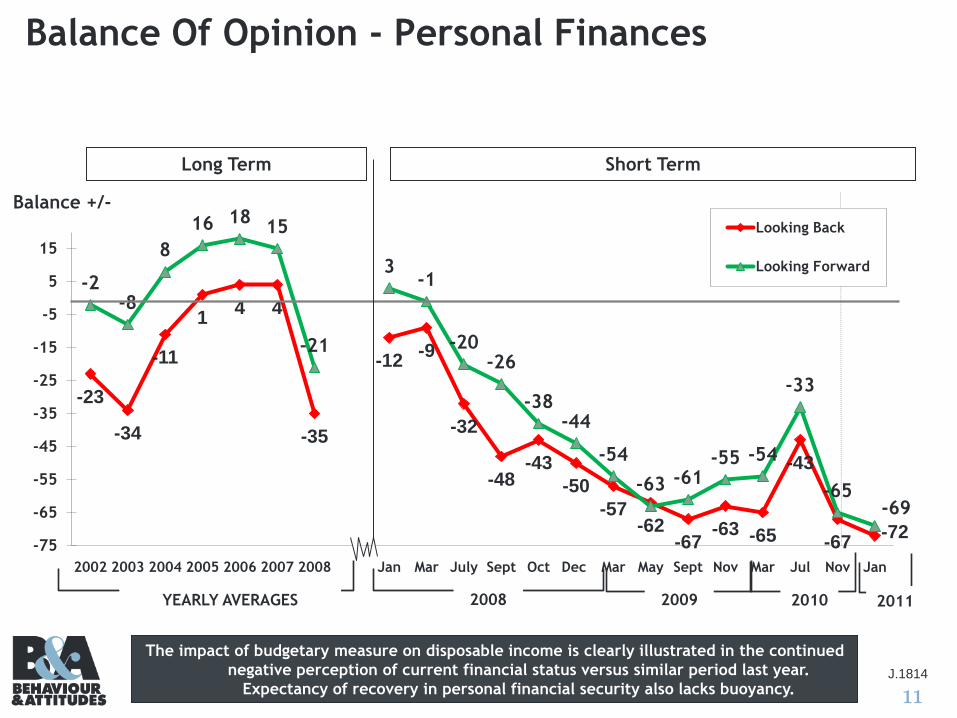
Balance Of Opinion - Personal Finances
Balance +/-
-23
-34
-11
14 4
-35
-12-9
-32
-48-43
-50
-57-62
-67-63 -65
-43
-67-72
-2-8
8
16 1815
-21
3-1
-20-26
-38-44
-54
-63 -61-55 -54
-33
-65-69
-75
-65
-55
-45
-35
-25
-15
-5
5
15
2002 2003 2004 2005 2006 2007 2008 Jan Mar July Sept Oct Dec Mar May Sept Nov Mar Jul Nov Jan
Looking Back
Looking Forward
Long Term Short Term
The impact of budgetary measure on disposable income is clearly illustrated in the continued
negative perception of current financial status versus similar period last year.
Expectancy of recovery in personal financial security also lacks buoyancy.
YEARLY AVERAGES 20092008 2010 2011

12J.1814
Q.6 Do you expect your assets (your house, shares, pension entitlements, savings)
In the next year to be higher, lower or the same as in the past year?
Personal Assets– Looking Forward
More
No change
Less
Expect them to
be …
Difference +6 +9 +21 +31 +33 +20 -20 -53 -43 -55 -53 -55 -47 -49 -26 -55 -50
13% 13%7% 5% 5% 8%
35%
55%47%
57% 55% 57%50% 52%
33%
57%52%
68% 65%
65%
59% 57%
64%
55%
42%
47%
41% 43% 41%47% 45%
60%
40%43%
19% 22%28%
36% 38%
28%
10%2% 4% 2% 2% 2% 3% 3%
7% 2% 2%
LONG TERM 2009
2002 20052003 2004 2006 2007 2008 Mar May Sept Nov
2010
Mar2009
July Nov2010
2011
Jan

13J.1814
Q.7 In the year ahead, do you expect to purchase more, less or the same amount of goods
and services as in the past year?
Purchasing Goods And Services – Looking Forward
More
The same
Less
Expect to
purchase …
Difference -10 -12 = +4 +7 +5 -29 -63 -47 -61 -55 -60 -53 -51-36 -56 -67
26% 27%
18% 16% 14% 15%
39%
66%
52%
64%59% 63%
57% 55%
42%
60%
69%
58% 58%
64%64% 65% 65%
50%
31%
42%
33%37%
35%39% 40%
52%
36%
29%
16% 15% 18% 20% 21% 20%
10%3% 5% 3% 4% 3% 4% 4% 6% 4% 2%
LONG TERM 2009
2002 20052003 2004 2006 2007 2008 Mar May Sept Nov
2010
Mar2009
July Nov2010
2011
Jan
14J.1814
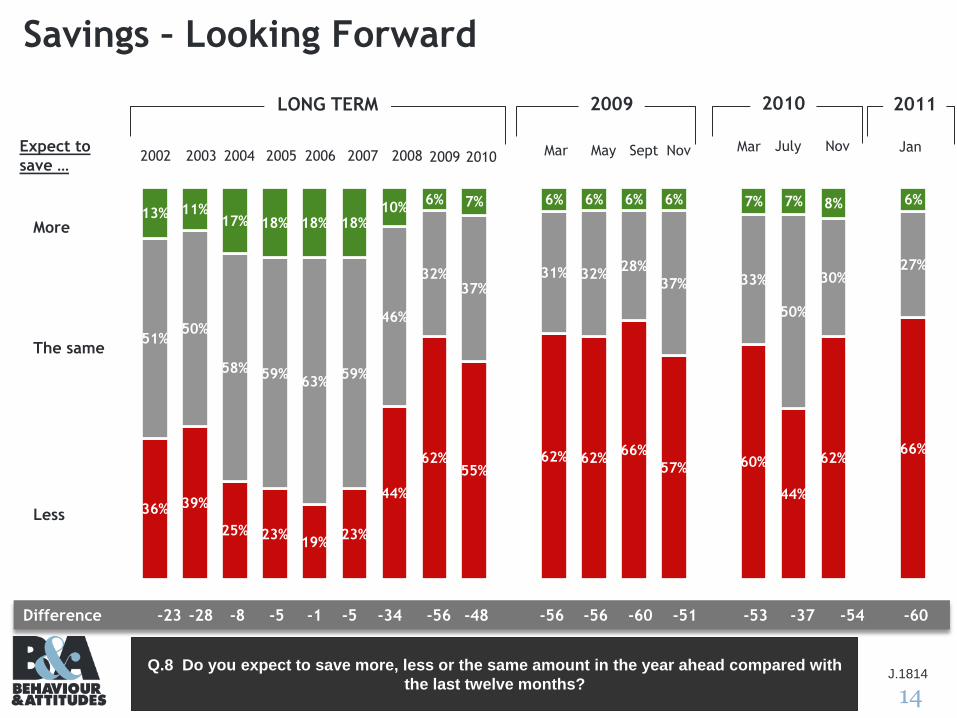
Q.8 Do you expect to save more, less or the same amount in the year ahead compared with
the last twelve months?
Savings – Looking Forward
More
The same
Less
Expect to
save …
Difference -23 -28 -8 -5 -1 -5 -34 -56 -48 -56 -56 -60 -51 -53 -37 -54 -60
36% 39%
25% 23%19%
23%
44%
62%55%
62% 62%66%
57% 60%
44%
62%66%
51%50%
58% 59%63%
59%
46%
32%37%
31% 32%28%
37% 33%
50%
30%27%
13% 11%17% 18% 18% 18%
10%6% 7% 6% 6% 6% 6% 7% 7% 8% 6%
LONG TERM 2009
2002 20052003 2004 2006 2007 2008 Mar May Sept Nov
2010
Mar2009
July Nov2010
2011
Jan

15J.1814
Balance Of Opinion – The Year AheadExpectations in regard to assets value, purchases, and savings
Balance +/-
69
21
3133
20
-25
-4
-20
-19
-27
-38-39
-55 -53-55
-47 -49
-26
-55-50
-10
-12
-12
4 7 5
-29
-5-13
-28-34
-43-51
-61
-55
-60
-53-51
-36
-56-67
-23-28
-8
-5-1
-5
-34
-13
-4
-35 -34
-50 -52-56
-56 -60
-51
-53
-37
-54
-60
-70
-60
-50
-40
-30
-20
-10
0
10
20
30
40
2002 2003 2004 2005 2006 2007 2008 Jan Mar July Sept Oct Dec Mar May Sept Nov Mar Jul Nov Jan
Assets Value
Purchase
Savings
Long Term Short Term
YEARLY AVERAGES 20092008 2010 2011
Expectations of future purchase levels continue to diminish steadily, due to continued decreases in real income
levels. This will in turn place renewed pressure on expected sales volumes and maintain a degree of deflationary
pressure. Of note is the continued decline in expectations of consumer savings levels. These findings, in line with
the reduced expected spend, indicate that disposable income once earmarked for savings is now being diverted to
cover day to day expenditure.
16J.1814
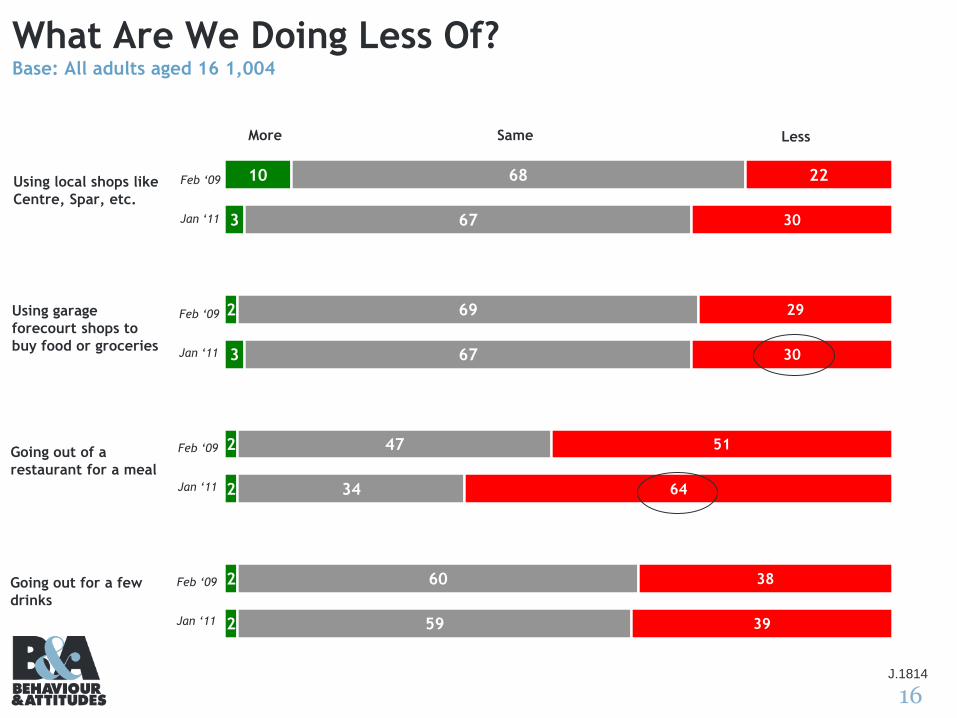
What Are We Doing Less Of?Base: All adults aged 16 1,004
More
10
3
2
3
2
2
2
2
68
67
69
67
47
34
60
59
22
30
29
30
51
64
38
39
Same
Using local shops like
Centre, Spar, etc.
Using garage
forecourt shops to
buy food or groceries
Going out of a
restaurant for a meal
Going out for a few
drinks
Less
Feb ‘09
Jan ‘11
Feb ‘09
Jan ‘11
Feb ‘09
Jan ‘11
Feb ‘09
Jan ‘11

17J.1814
What Are We Doing More Of?Base: All adults aged 16, 1,000
More
55
68
47
51
43
50
26
30
21
14
14
8
43
30
51
47
53
48
65
65
70
69
81
82
2
2
2
2
4
2
9
5
9
17
5
10
Same
Buying items on
special offer
Using discount stores
like Aldi and Lidi
Buying shops own
label products
Using major
supermarkets like
Dunnes and Tesco
Less
Feb ‘09
Jan ‘11
Feb ‘09
Jan ‘11
Feb ‘09
Jan ‘11
Feb ‘09
Jan ‘11
Feb ‘09
Jan ‘11
Feb ‘09
Jan ‘11
Drinking at home
Using public transport
Not surprisingly we see an increase in own label usage, on both promotional ‘searching’ and discounter
attraction. Major supermarkets are also performing well in these times.

18J.1814
How Else is the Current Economic Climate Impacting
Consumers?
Having to work longer hours
Giving less to charity
Spending less on gifts
Withdrawing from savings or
retirement accounts
21
43
60
28
21
59
74
34
Feb '09
Jan' 11
19J.1814
CSO DATA(latest estimates 2011)

20J.1814
Initial Estimates: Quarterly Increase in GDP but
GNP down slightly% Change on previous quarter
-6
-5
-4
-3
-2
-1
0
1
2
3
4
GDP
GNP
2008
Q1
2008
Q3
2008
Q2
2008
Q4
2009
Q1
2009
Q2
2009
Q3
*Source: CSO Estimates as of 16th December 2010
%
Initial estimates for the third quarter of 2010 show an increase, on a seasonally adjusted basis, of 0.5 per cent in GDP and an increase of 1.1 per cent in GNP compared with the previous quarter. This is the first quarter since Q4 2007 where both GDP and GNP have shown a level of increase at the same time.
2009
Q4*
2008 2009 2010
2010
Q1
Figures – GDP and GNP at constant market prices seasonally adjusted.
2010
Q2
2010
Q3

21J.1814
Unemployment Rate – Continues to StabliseSeasonally adjusted
% of labour force
2008
The unemployment rate does not take into account reduced working hours up to 3 days a
week, etc as does the Live Register
2008Average for ’08 was 6.3
2009Average for ‘09 was 11.6%
*Source: Line chart relates to CSO latest estimates published December 2010 (seasonally adjusted standardised unemployed rates (SUR)
2009
4.4 4.4 4.6 4.8 4.95.2 5.2
5.55.9
6.36.8
7.17.6
8.18.6
9.5
10.210.8
11.211.6
11.912.212.3
12.712.913.313.113.112.9 13 13 13.2
13.513.713.613.413.313.2
0
2
4
6
8
10
12
14
16
18
20
2010
2010
QNHS July – Sept 09 = 12.3%
QNHS Oct – Dec ‘09 = 13.3%
QNHS Jan-Mar ’10 = 12.9%
QNHS Apr-Jun ’10 = 13.2%
QNHS July-Sept ’10 = 13.6%

22J.1814
162,700
166,000
167,000
171,300
173,200
179,300186,300
197,900
198,400
205,900
215,100225,900
236,100
245,800
261,800
278,300
294,300
325,700
351,000
371,000
387,200
400,900
412,900
423,400
426,200427,400
425,400
426,800
428,900434,400
430,600
430,600
435,100
440,300442,000446,100
449,200449,400
448,700
446,100446,700
440,900
439,200
150,000
200,000
250,000
300,000
350,000
400,000
450,000
Aug Sept Oct Nov Dec Jan Feb Mar Apr May Jun Jul Aug Sept Oct Nov Dec Jan Feb Mar Apr May Jun Jul Aug Sept Oct Nov Dec Jan Feb Mar Apr MayJuneJuly Aug Sept Oct Nov Dec Jan Feb
The Live Register Seasonally adjusted
* The Live Register is not designed to measure unemployment. It includes part-time work e.g. seasonal & casual workers who work up to 3 days per week
Total PersonsPersons on live
Register
Month
*Source: CSO latest estimates February 2011
20092007 20102008
Live Register figures
have modestly reduced
in the last two months.
2011
23J.1814
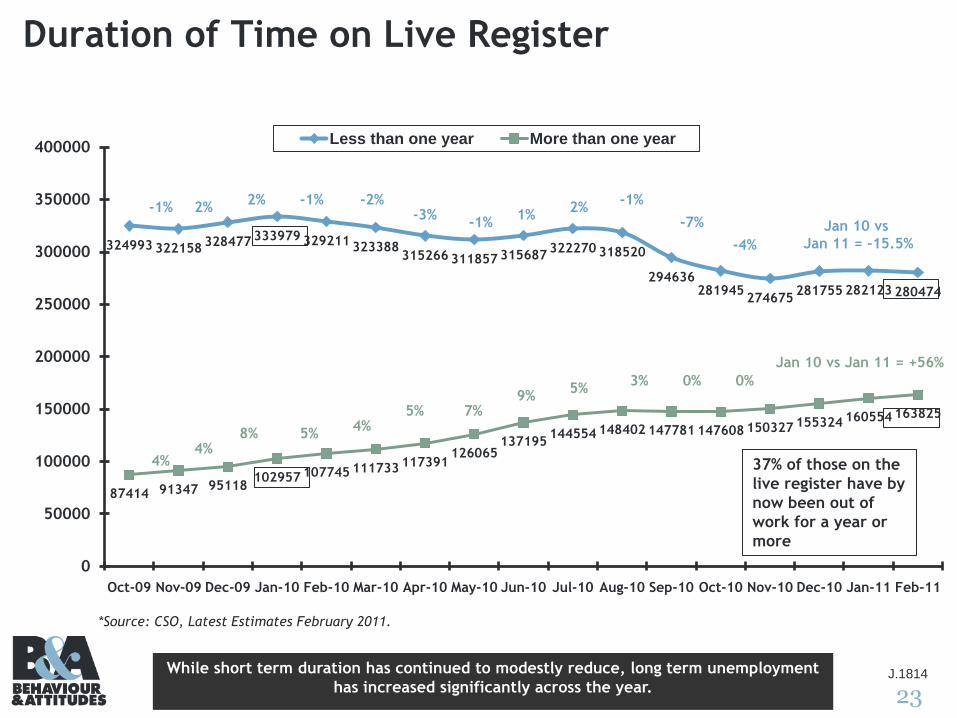
324993 322158328477 333979 329211 323388
315266 311857 315687322270 318520
294636281945
274675281755 282123 280474
87414 91347 95118102957 107745 111733 117391
126065137195
144554 148402 147781 147608 150327 155324 160554 163825
0
50000
100000
150000
200000
250000
300000
350000
400000
Oct-09 Nov-09 Dec-09 Jan-10 Feb-10 Mar-10 Apr-10 May-10 Jun-10 Jul-10 Aug-10 Sep-10 Oct-10 Nov-10 Dec-10 Jan-11 Feb-11
Less than one year More than one year
-1% 2%2% -1% -2%
-3%-1%
1%2%
-1%
-7%
-4%
4%4%
8% 5%4%
5% 7%9%
5%3% 0% 0%
Jan 10 vs
Jan 11 = -15.5%
Jan 10 vs Jan 11 = +56%
Duration of Time on Live Register
*Source: CSO, Latest Estimates February 2011.
While short term duration has continued to modestly reduce, long term unemployment
has increased significantly across the year.
37% of those on the
live register have by
now been out of
work for a year or
more

24J.1814
Actual Redundancies January - December 2010 Monthly Redundancy comparison 2011 vs 2010/ 2009
% diff10-11 -25.5 -44.2%
% diff.09-10 -0.3% -9.7% -29.5% -20.1% -37.5% -22.3% -16.4% -25.0% -29.7% -40.6% -21.8% -30.4%
6588
6212
7680
7131
7948
6764
6285
58315989
6561
5891
4121
6571
56125415
5697
4967
5257 5257
43694212
3696
4608
2870
4893
3134
0
1000
2000
3000
4000
5000
6000
7000
8000
9000
Jan Feb Mar Apr May Jun Jul Aug Sep Oct Nov Dec
*Source: DETI, Redundancy Statistics February 2011.
Key
’09
‘10
‘11
Redundancy levels continue to decline.

25J.1814
Total annual redundancy figures 1995 to 2010
1995 1996 1997 1998 1999 2000 2001 2002 2003 2004 2005 20006 2007 2008 2009 2010
At work '000 (April) 1281.8 1328.5 1380 1494 1589.1 1671.4 1721.9 1760.6 1790.01 1834.6 1931.6 2021.1 2101.6 2108.5 1938.5 1859.5
Increase/Decrease in
working population 4% 4% 8% 6% 5% 3% 2% 2% 2% 5% 5% 4% 0% -8% -4%
Actual redundancies 2010The annual total redundancy rate peaked in 2009 at 77,001 redundancies for the year end. Total reducdancy figures for 2010 were 53,731. While this constitutes a significant reduction over the 2009 peak year, it remains a staggering number for a small open economy. The impact of these job losses on the domestic economy will remain considerable across 2011.
110577973
11031 11986 12249 10799
16085
24432 25769 2504123156 23684
25459
40607
77001
53731
0
10000
20000
30000
40000
50000
60000
70000
80000
90000
1995 1996 1997 1998 1999 2000 2001 2002 2003 2004 2005 2006 2007 2008 2009 2010
*Source: DETI, Redundancy Statistics January 2011.

26J.1814
Actual Redundancies January 2010 – January 2011 Cumulative Redundancy comparison 2010 vs 2011
% diff 2011 v 2010 -25.5% -34.2%
The rate of redundancies has reduced year on year by a third. While the level has reduced it remains considerably high for an economy in its third year of recession. The continued level of redundancies indicates a domestic economy which is continuing to contract regardless of policy interventions and cost reductions within work places. Stagnant domestic consumer demand is a
key driver of this continued contraction in employment levels.
6571
12183
17598
23295
28262
33519
38776
43145
47357
51253
5586158731
48938016
0
10000
20000
30000
40000
50000
60000
70000
80000
90000
Jan Feb Mar Apr May Jun Jul Aug Sep Oct Nov Dec
2010
2011
*Source: DETI, Redundancy Statistics February 2011.

27J.1814
Note the value of retail sales
decreased annually by
3.3% to December 2010.
Value of Retail Sales (Excluding Motor Trade)
Seasonally Adjusted Annual % ChargeBase: Year 2005 = 100
%
* Source: CSO latest estimates January 2011. Base year : 2005 = 100
-9.5 -9.8
-10.7
-12.2
-13.2
-10.8
-11.4
-10.2
-11.6-12.0
-11.2-11.3
-8.1-7.7
-4.7
-3.1-3.5
-5.0 -4.9
-3.9 -3.8
-1.8 -1.9
-3.3
-1.0
-15
-10
-5
0
5
10
15
Jan-08 Feb '08
Mar '08Apr '08 May '08
June '08
Jul '08 Aug '08 Sept '08
Oct '08 Nov '08
Dec '08Jan '09 Feb '09
Mar '09Apr '09 May '09
Jun '09 Jul '09 Aug '09 Sept '09
Oct '09 Nov '09
Dec '09Jan '10 Feb '10
Mar '10Apr '10 May '10
Jun '10 Jul '10 Aug '10 Sept '10
Oct '10 Nov '10
Dec '10 Jan'11
2008 2009 2010 2011

28J.1814
Retail SalesValue & Volume Growth: 2010 vs 2005 (= 100). Seasonally adjusted.
*Source: CSO latest estimates Jan 2011 (seasonally adjusted).
Retail Business – NACE REV 2
Value Volume
Period December 2010
Index
Annual
% Ch Index
Most recent %
annual vol.
Change
Motor Trades 60.1 -11.8 64.8 -8
Department Stores 88.1 2.3 114.4 5.3
Food beverages & Tobacco 87.9 -6.4 87.4 -4.6
Fuel 96.2 -9.1 70.8 -21.7
Pharmaceuticals Medical & Cosmetic Articles 105.6 -2.8 115.0 -0.4
Clothing, footwear & textiles 85.2 -4.2 114.4 -0.8
Furniture and Lighting 47.6 -25.8 62.6 -21.5
Hardware, Paints and Glass 78.2 -9 81.9 -7.4
Electrical Goods 76.4 -2.3 127.2 5.1
Books, Newspapers and Stationery 74.4 -9.3 68.2 -10.7
Other retail sales 78.8 -8.3 93.4 -10.0
Bars 77.3 -11.7 71.3 -9.9
The bar trade and the home improvement sectors continue to deteriorate. Retail sales of newspapers/books and ancillary goods also declining dramatically in terms of value & volume. Indications of considerable reduction in disposable income are evident. Of particular note are areas such as electrical, furniture and other retail where volume indexes eclipse value indexes considerably. Lack of real income levels and fiscally conservative approaches to personal spend
are driving a deflationary domestic market.
29J.1814
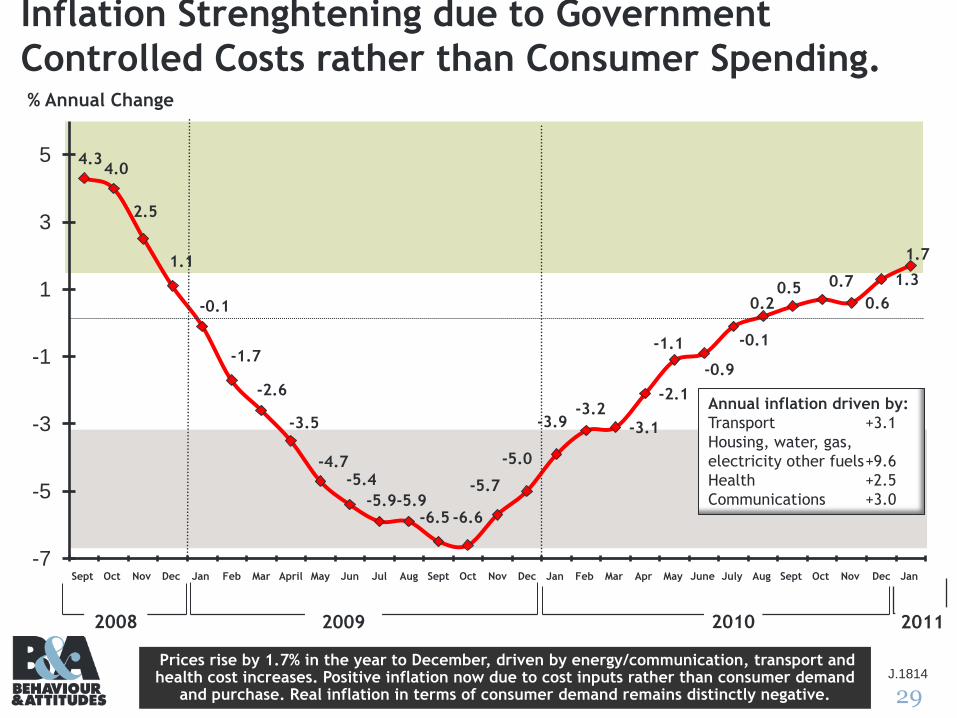
Inflation Strenghtening due to Government
Controlled Costs rather than Consumer Spending.
4.34.0
2.5
1.1
-0.1
-1.7
-2.6
-3.5
-4.7-5.4
-5.9-5.9-6.5 -6.6
-5.7
-5.0
-3.9-3.2
-3.1
-2.1
-1.1
-0.9
-0.1
0.20.5 0.7
0.6
1.3
1.7
-7
-5
-3
-1
1
3
5
Sept Oct Nov Dec Jan Feb Mar April May Jun Jul Aug Sept Oct Nov Dec Jan Feb Mar Apr May June July Aug Sept Oct Nov Dec Jan
% Annual Change
Prices rise by 1.7% in the year to December, driven by energy/communication, transport and health cost increases. Positive inflation now due to cost inputs rather than consumer demand
and purchase. Real inflation in terms of consumer demand remains distinctly negative.
2009 20102008 2011
Annual inflation driven by:
Transport +3.1
Housing, water, gas,
electricity other fuels+9.6
Health +2.5
Communications +3.0

30J.1814
Growth Rate in Extended Consumer Credit
8.7
7.3
5.1
2.72.2
-0.6
-2.7-3.6 -3.6
-6.2-7.0
-5.4-6.0
-7.0 -7.3
-9.7-10.8 -10.6 -10.5
-10.1
-13.1
-14.3-14.1
-14.9-15.8
-17.0
-20
-17
-14
-11
-8
-5
-2
1
4
7
10
Oct Nov Dec Jan Feb Mar Apr May Jun Jul Aug Sept Oct Nov Dec Jan Feb Mar Apr Jun Jul Aug Sept Oct Nov Dec
% Annual Change
2008 2009 2010
Source: Central Bank
The consistent negative trend in extended consumer credit from financial institutions over the past two years has undermined possible economic growth based on domestic consumption. This reduction in accessible credit has decreased capacity to spend and has also driven saving requirements. As the rate decreases, consumer spend will remain stagnant as excess disposable income will be required to pay for increased cost inputs (insurance, mortgage etc.). As wage rates remain depressed due to constrained employment prospects, the shortfall, usually maintained by short term credit will continue to undermine consumer confidence.
*Source: Central Bank of Ireland.

31J.1814
APPENDICESThe Questionnaire

32J.1814
SECTION ‘F’ - ECONOMY
ASK ALL RESPONDENTS aged 16+
Better off 1
Worse off 2
The same 3
Q.1 Thinking about the economy as a whole, do you think
that the country is better off, worse off, or about the
same as last year?
Q.2 And what about the coming year, do you think that the
country will be better off, worse off or about the same
as this year?Better off 1
Worse off 2
The same 3
Better off 1
Worse off 2
The same 3
Q.3 Do you yourself feel better off financially, worse off
financially or about the same compared to last year?
More confident 1
Less confident 2
No change 3
Q.4 In terms of your own economic well-being over the
year ahead, are you more confident, less confident or
is your confidence about the same as last year?
Higher 1
Lower 2
The same 3
Q.5 Do you expect your income in the next year, after
inflation and taxes, to be higher, lower or the same as
in the last twelve months?
A lot higher 1
A little higher 2
No change 3
A little lower 4
A lot lower 5
Q.6 Do you expect your assets (your house, shares,
pension entitlements, savings) In the next year to be
higher, lower or the same as in the past year?
PROBE: A lot or a little
More 1
Less 2
The same 3
Q.7 In the year ahead, do you expect to purchase more,
less or the same amount of goods and services as in
the past year?
More 1
Less 2
The same 3
Q.8 Do you expect to save more, less or the same amount
in the year ahead compared with the last twelve
months?