Embed Size (px)
Citation preview

Ba
Eu
Ag
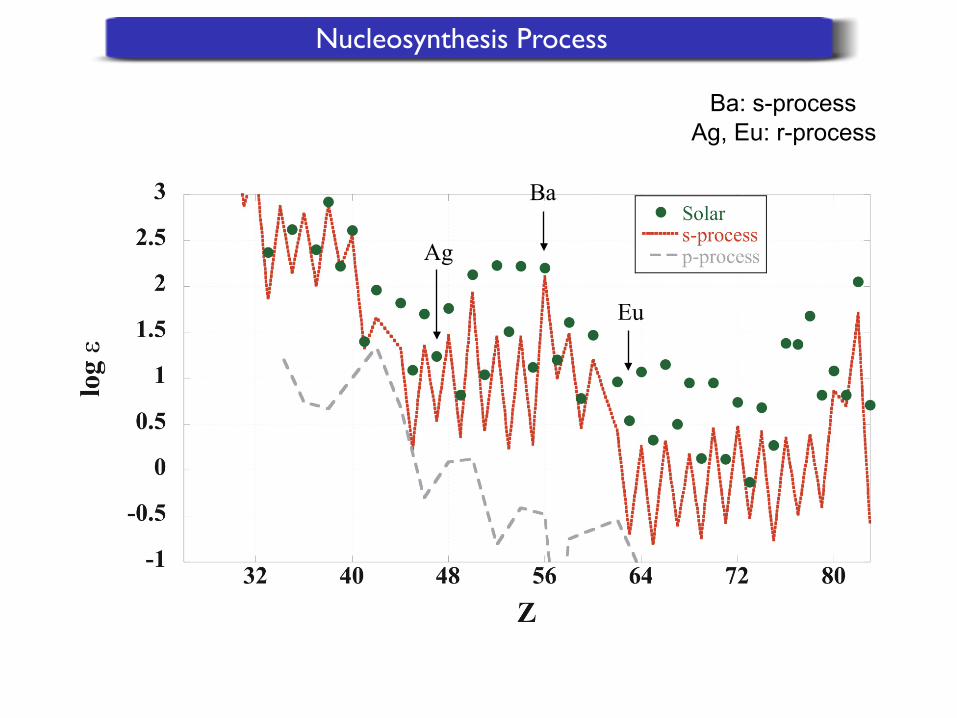
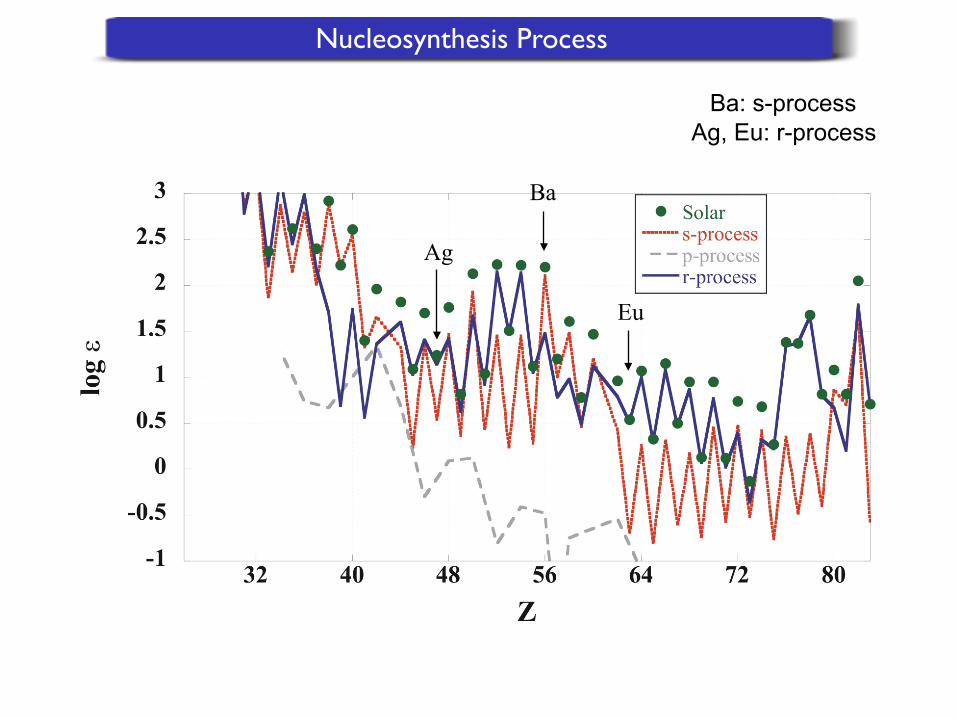
Ba: s-process Ag, Eu: r-process
Nucleosynthesis Process
Ba
Eu
Ag
Ba: s-process Ag, Eu: r-process
Nucleosynthesis Process
Ba
Eu
Ag
Ba: s-process Ag, Eu: r-process
Nucleosynthesis Process
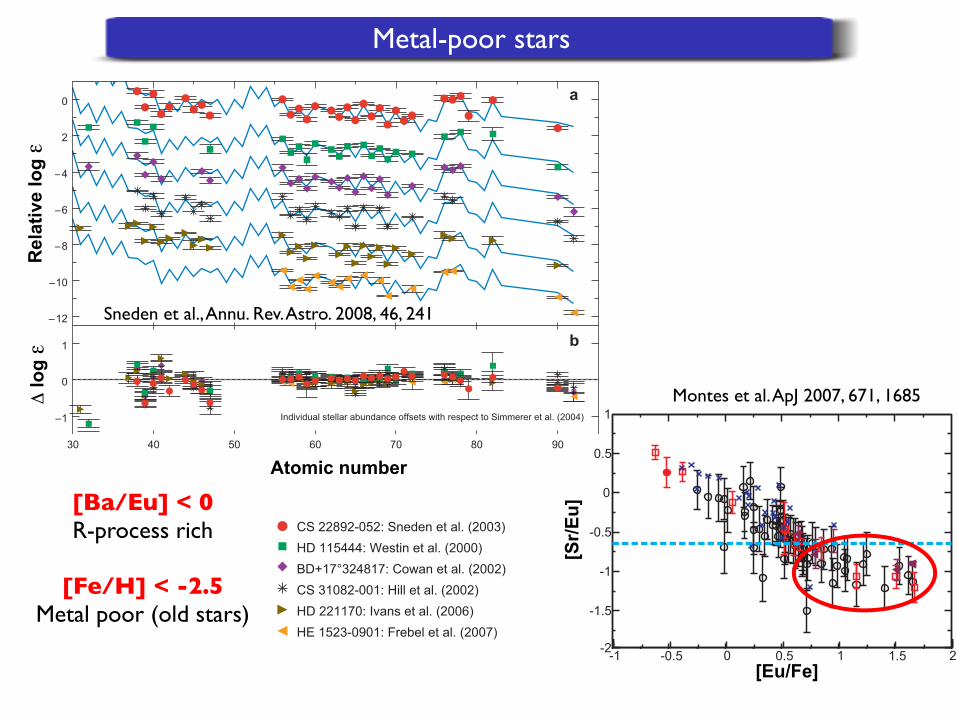
Metal-poor stars
[Ba/Eu] < 0R-process rich
[Fe/H] < -2.5Metal poor (old stars)
ANRV352-AA46-08 ARI 15 July 2008 11:46
Atomic number
a
b
c
lo
g
Rel
ativ
e lo
g
lo
g
–1
0
1
–12
–10
–8
–6
– 4
2
0
30 40 50 60 70 80 90
–1
0
1
Average abundance offsets with respect to Arlandini et al. (1999) ‘‘stellar model’’
CS 22892-052: Sneden et al. (2003)
HD 115444: Westin et al. (2000)
BD+17°324817: Cowan et al. (2002)
CS 31082-001: Hill et al. (2002)
HD 221170: Ivans et al. (2006)
HE 1523-0901: Frebel et al. (2007)
Individual stellar abundance offsets with respect to Simmerer et al. (2004)
Figure 11(a) Comparisons of n-capture abundances in six r-process-rich Galactic halo stars with the Solar-system r-only abundance distribution.The abundance data of all stars except CS 22892-052 have been vertically displaced downward for display purposes. The solid lightblue lines are the scaled r-only Solar-system elemental abundance curves (Simmerer et al. 2004, Cowan et al. 2006), normalized to theEu abundance of each star. (b) Difference plot showing the individual elemental abundance offsets; abundance differences arenormalized to zero at Eu (see Table 1 and Table 2) for each of the six stars with respect to the Solar-system r-process-only abundances.Zero offset is indicated by the dashed horizontal line. Symbols for the stars are the same as in panel a. (c) Average stellar abundanceoffsets. For individual stars all elemental abundances were first scaled to their Eu values, then averaged for all six stars, and finallycompared to the Solar-system r-only distribution.
262 Sneden · Cowan · Gallino
Ann
u. R
ev. A
stro
. Ast
roph
ys. 2
008.
46:2
41-2
88. D
ownl
oade
d fr
om a
rjour
nals
.ann
ualre
view
s.org
by M
ichi
gan
Stat
e U
nive
rsity
Lib
rary
on
06/2
9/10
. For
per
sona
l use
onl
y.
Atomic number
Δ lo
g ε
Rel
ativ
e lo
g ε
-1.5
-1
-0.5
0
0.5
[Nd
/Eu
]
-1.5
-1
-0.5
0
0.5
[Ce
/Eu
]
-1.5
-1
-0.5
0
0.5
[Zr/
Eu
]
-1.5
-1
-0.5
0
0.5
[Y/E
u]
-1.5
-1
-0.5
0
0.5
1
[Sr/
Eu
]
-1.5
-1
-0.5
0
0.5
1
[Ba
/Eu
]
-1.5
-1
-0.5
0
0.5
[La
/Eu
]
-1 -0.5 0 0.5 1 1.5 2[Eu/Fe]
-2
-1.5
-1
-0.5
0
0.5
[Ag
/Eu
]
-1 -0.5 0 0.5 1 1.5 2[Eu/Fe]
-2
-1.5
-1
-0.5
0
0.5
[Sm
/Eu
]
HD122563
CS22892-052
CS31082-001
BD+17 3248
HD221170
HD115444
-1.5
-1
-0.5
0
0.5
[Pd
/Eu
]
-1.5
-1
-0.5
0
0.5
[Nd
/Eu
]
-1.5
-1
-0.5
0
0.5
[Ce
/Eu
]
-1.5
-1
-0.5
0
0.5
[Zr/
Eu]
-1.5
-1
-0.5
0
0.5
[Y/E
u]
-1.5
-1
-0.5
0
0.5
1
[Sr/
Eu
]
-1.5
-1
-0.5
0
0.5
1
[Ba
/Eu
]
-1.5
-1
-0.5
0
0.5
[La
/Eu
]
-1 -0.5 0 0.5 1 1.5 2[Eu/Fe]
-2
-1.5
-1
-0.5
0
0.5
[Ag/E
u]
-1 -0.5 0 0.5 1 1.5 2[Eu/Fe]
-2
-1.5
-1
-0.5
0
0.5
[Sm
/Eu
]
HD122563
CS22892-052
CS31082-001
BD+17 3248
HD221170
HD115444
-1.5
-1
-0.5
0
0.5
[Pd
/Eu
][S
r/Eu]
[Eu/Fe]
Sneden et al., Annu. Rev. Astro. 2008, 46, 241
Montes et al. ApJ 2007, 671, 1685
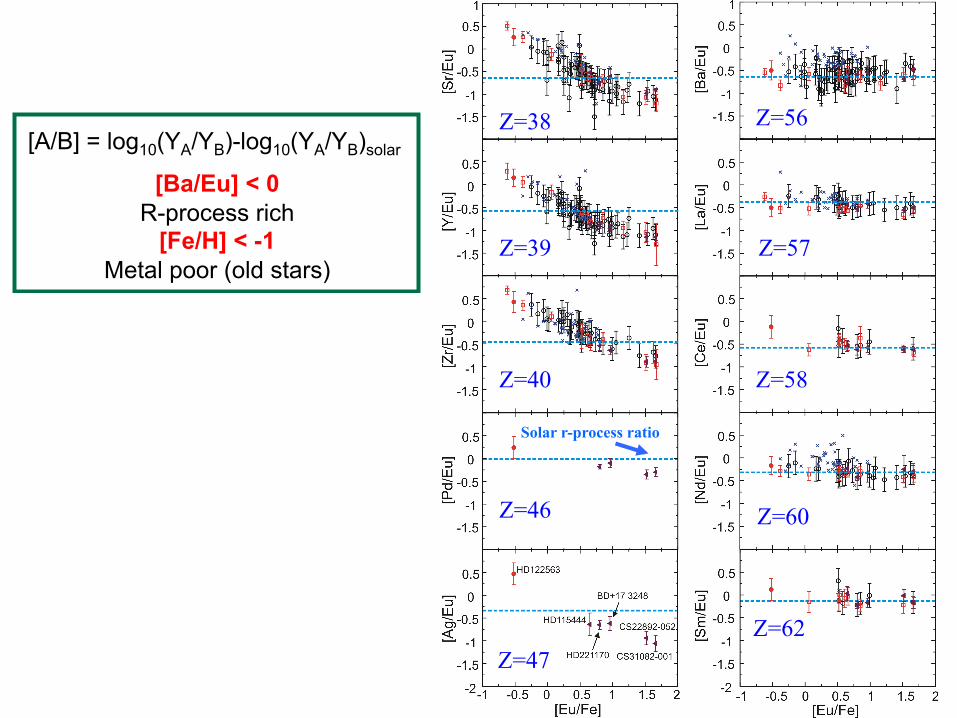
Solar r-process ratio
Z=38
Z=39
Z=40
Z=46
Z=47
Z=56
Z=57
Z=58
Z=60
Z=62
[Ba/Eu] < 0 R-process rich
[Fe/H] < -1 Metal poor (old stars)
[A/B] = log10(YA/YB)-log10(YA/YB)solar
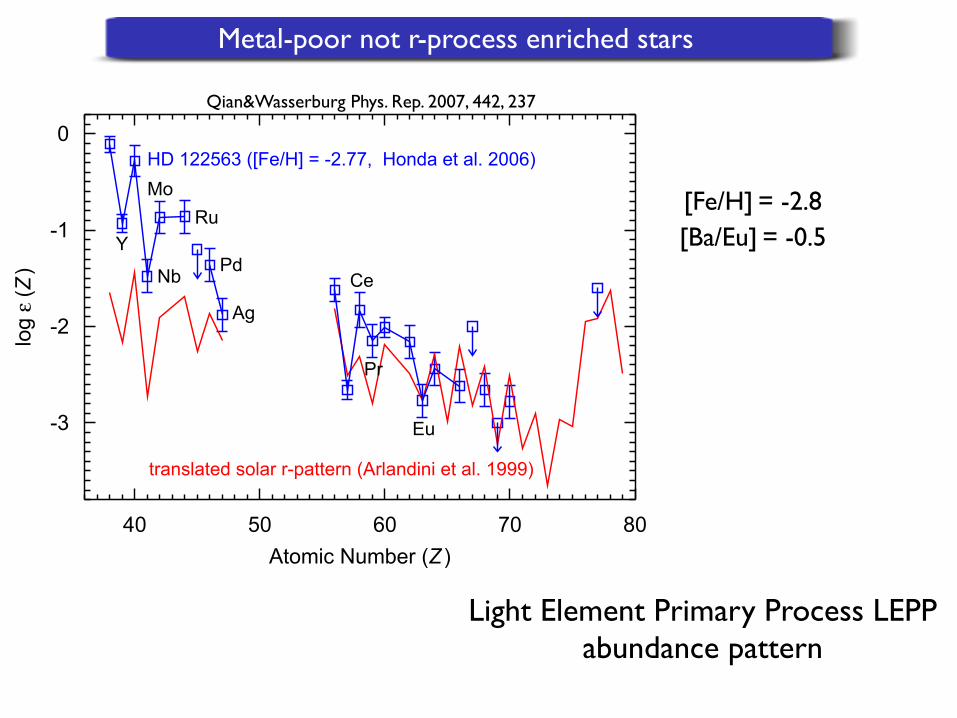
[Fe/H] = -2.8[Ba/Eu] = -0.5
Light Element Primary Process LEPP abundance pattern
Y.-Z. Qian, G.J. Wasserburg / Physics Reports 442 (2007) 237– 268 249
40 50 60 70 80
Atomic Number (Z)
-3.5
-3
-2.5
-2
-1.5
-1
-0.5
0
0.5
log !
(Z)
EuHD 122563 (Honda et al. 2006)
translated pattern of CS 22892-052 (Sneden et al. 2003)
Ag
Y
PdMo
Ru
Nb
Sr Zr
40 50 60 70 80
Atomic Number (Z)
-3
-2
-1
0
log !
(Z)
Eu
HD 122563 ([Fe/H] = -2.77, Honda et al. 2006)
translated solar r-pattern (Arlandini et al. 1999)
Ag
YPd
Mo
Ru
Nb Ce
Pr
Fig. 8. (a) Data on HD 122563 [squares (Honda et al., 2006)] compared with the solar “r”-pattern translated to pass through the Eu data (red curves).The squares are connected with blue line segments as a guide. Squares with downward arrows indicate upper limits. The abundance pattern of heavyr-elements [Ba (Z = 56) and above] in HD 122563 shown in (a) is similar to the corresponding part of the solar “r”-pattern but with substantialdifferences, especially for Ce and Pr. Note that (Ba/Eu)HD122563 ! (Ba/Eu)",r . There are also gross differences between the data and the translatedsolar “r”-pattern for the CPR elements. Specifically, HD 122563 has much larger proportions of CPR elements relative to heavy r-nuclei as comparedto the solar “r”-pattern. (b) Comparison of the data on HD 122563 [squares (Honda et al., 2006)] with those on CS 22892-052 [red curves (Snedenet al. (2003b))] normalized to the same log !(Y) as for HD 122563. The large difference (by a factor of # 20) in the production of heavy r-nucleirelative to CPR elements shown in (b) suggests that only some sources for CPR elements can also produce heavy r-nuclei.
identical for the three stars with very different enrichments of heavy r-elements shown in Fig. 6. This suggests that theheavy r-nuclei cannot be produced by massive stars of > 11 M", which result in Fe core-collapse SNe and are sourcesfor the elements from O to Ge [see the review by Woosley et al. (2002) and Section 4.4].
4.2. Regularity and variability of the yield pattern of heavy r-nuclei
It appears that the heavy r-elements Ba and above exhibit an abundance pattern close to the corresponding part ofthe solar r-pattern. This was recognized in all of the observational studies cited above. Two stars discussed above,CS 22892-052 and CS 31082-001, have [Fe/H] # $ 3 but extremely high enrichments of heavy r-elements [(Eu/H)
# (1/30.1/20)(Eu/H)"]. These stars must represent contributions from single r-process sources. However, there isno observational basis for believing that there is a single universal yield pattern even for the heavy r-nuclei. In fact,observations show that CS 22892-052 and CS 31082-001 have log(Th/Eu)=$0.62 (Sneden et al. (2003b)) and $0.22(Hill et al., 2002), respectively. This difference of 0.4 dex is much larger than the observational error of # 0.05 dex(Hill et al., 2002). Further, it cannot be attributed to the possible difference in age between the two stars as 232Th(the only long-lived isotope of Th) has an extremely long lifetime of !232 = 20.3 Gyr—even if the two stars were born13.5 Gyr (age of the universe) apart, this would only give a difference of 0.3 dex in log(Th/Eu). Therefore, there isgood reason to believe that the yields of Th and U relative to those of heavy r-elements (e.g., Eu) below A # 195 shouldbe variable. This variation renders calculations of stellar ages from (Th/Eu) rather uncertain. Even a 30% shift in theyield ratio of Th to Eu would give a shift of 6.1 Gyr in age due to the long lifetime of 232Th.
Further evidence for variations in the yield pattern of heavy r-nuclei has been found in HD 122563 with [Fe/H] =$2.77 (Honda et al., 2006). The data on this star (squares) are compared with the solar “r”-pattern (red curves) translatedto pass through the Eu data in Fig. 8a. It can be seen that there is approximate accord between the data and the solarr-pattern for the heavy r-elements (Z!56), but there are also large discrepancies, especially for Ce and Pr (see alsothe comparison between the squares and the dashed curve in Fig. 6b). Clearly, it is important for future measurementsto determine whether such discrepancies extend to other heavy r-elements in HD 122563, particularly Os, Ir, and Ptin the peak at A # 195 of the solar r-pattern. Discovery of other stars of this kind would help establish the range ofvariations in the yield pattern of heavy r-nuclei.
Metal-poor not r-process enriched stars
Qian&Wasserburg Phys. Rep. 2007, 442, 237
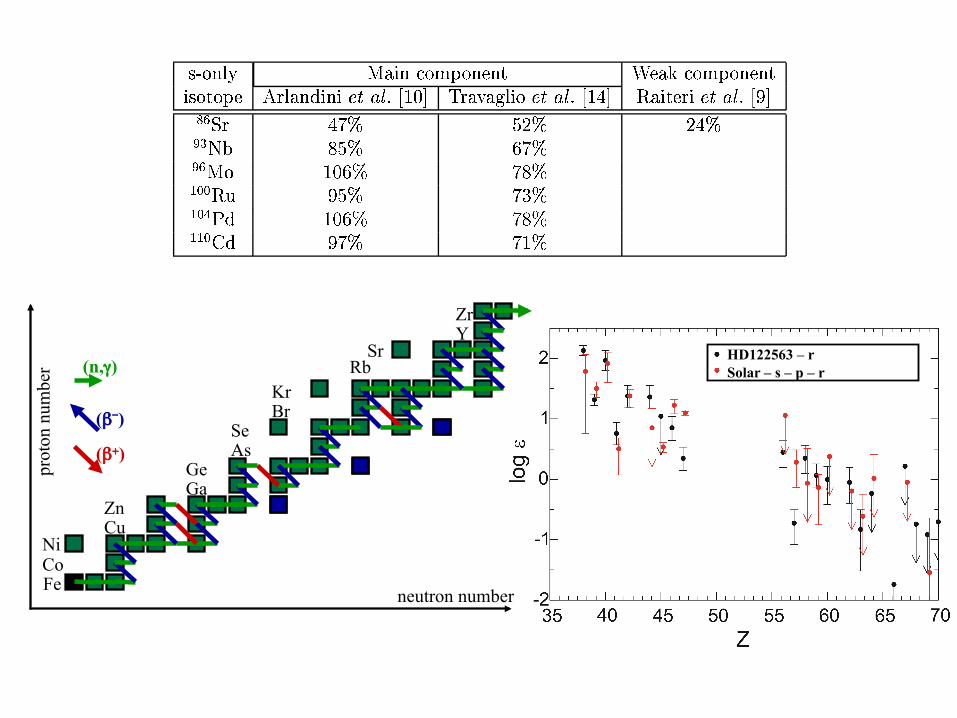
HD122563 – r Solar – s – p – r
Fe Co Ni
Rb
Ga Ge
Zn Cu
Se Br
As
Zr Y
Sr
Kr (n,!)
("-)
("+)
neutron number
prot
on n
umbe
r
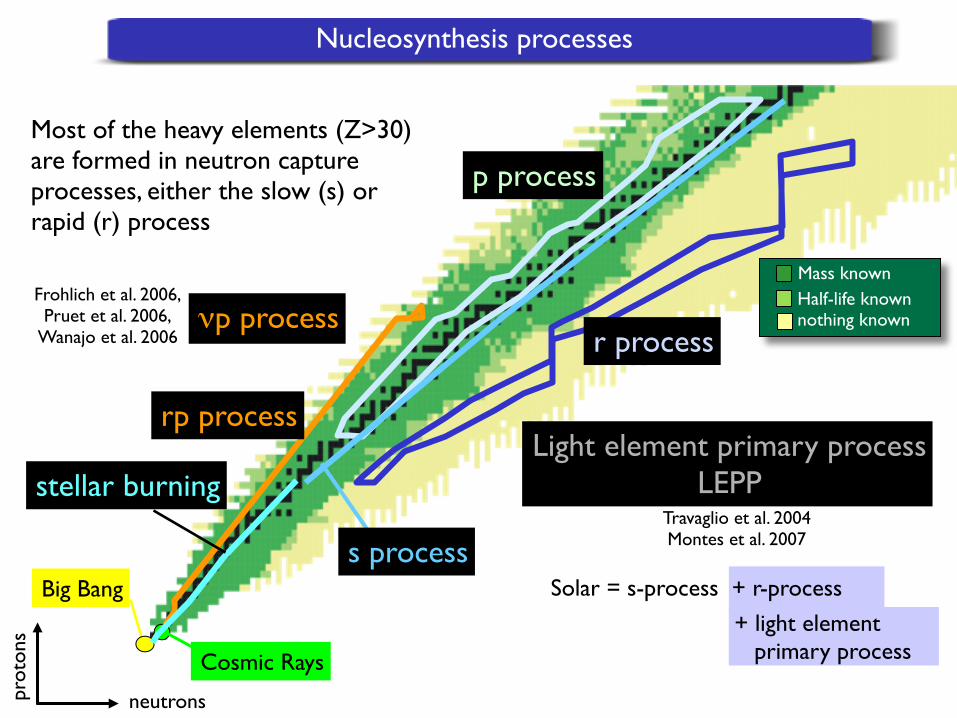
+ light element primary process
prot
ons
neutrons
Mass knownHalf-life knownnothing known
Big Bang
Cosmic Rays
stellar burning
rp process
p process
s process
r process
Most of the heavy elements (Z>30) are formed in neutron capture processes, either the slow (s) or rapid (r) process
νp process
Light element primary processLEPP
Nucleosynthesis processes
Frohlich et al. 2006,Pruet et al. 2006,
Wanajo et al. 2006
Travaglio et al. 2004Montes et al. 2007
Solar = s-process + r-process
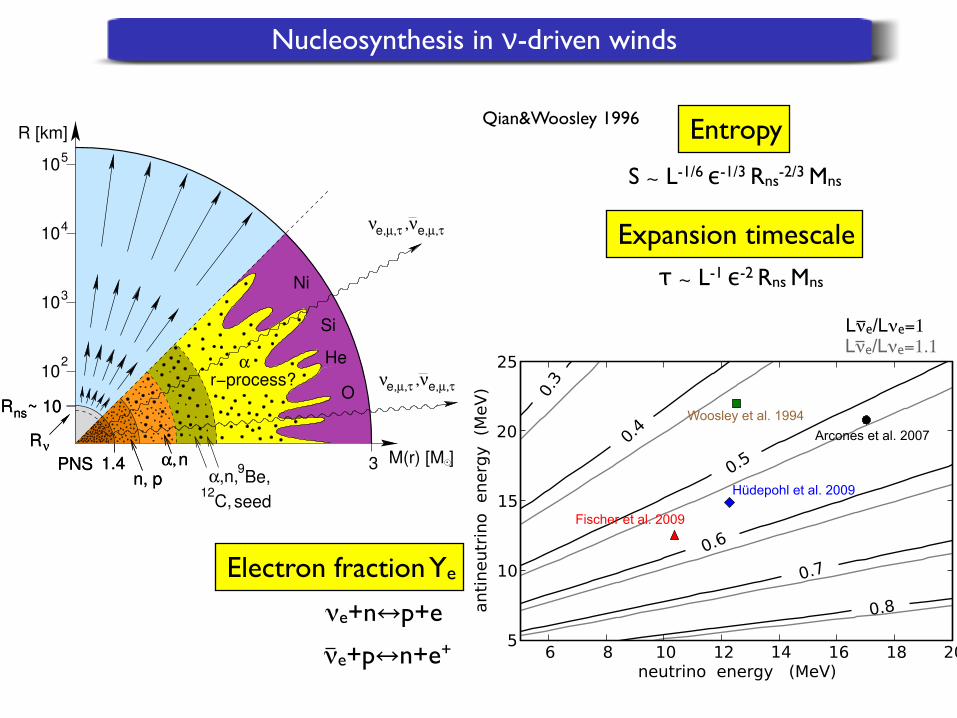
Nucleosynthesis in ν-driven winds
Electron fraction Ye
Lνe/Lνe=1.1
νe+n↔p+e
νe+p↔n+e+Almudena Arcones (Uni Basel) ACP seminar, IPMU (June 22, 2010)
Neutrino-driven winds
Necessary conditions for the production of heavy elements (A>130) by the r-process (Yn/Yseed !):
•fast expansion inhibits the alpha-process and thus the formation of seed nuclei
•Ye = np/(nn+np) < 0.5 (neutron rich)
•high entropy is equivalent to high photon-to-baryon ratio. Photons dissociate seed nuclei into nucleons.
0.5
R [km]
e!
e!
1.00.5
Si
M(r) [M ]
e!
e!
e!
M(r) [M ]
e!
e!
e!
e!
e!
Fe, Ni
M(r) [M ]
R ~ 3000
e!
e!
e!
!e
ChM(r) [M ]~ M
Fe, Ni
Si
0.5 1.0
R [km]
Si
R [km]
M(r) [M ]
Fe, Ni
0.5 1.0
Si
R [km]
R [km]
R [km]
Si
1.0M(r) [M ]
Si!burning shell Si!burning shell
Si!burning shellSi!burning shell
!e,µ," ,!e,µ,"
R ~ 100g
Fe
,µ,"e,!,µ,"e!
#,n
,µ,"e,!,µ,"e!
RFe
RFe
( $>%
$
&)
RFe
$
c o)2%
$<
formationshock
radius of
gR ~ 100
#,n#,n,
seed12
9Be,C,
e!RFe
position ofshock
formation
RFe
!
Neutrino Trapping
Shock Stagnation and Heating,
,µ,"e,!,µ,"e!
~ 10
free n, p
!!e
e
1.3 1.5
R ~ 50!
p
n
sR ~ 200
FeR
10
10
10
10
2
3
4
5
R ~ 10ns
R31.4
!
He
Ni
#
Si
PNS
r!process?
n, p
O
pfree n,
Fe
Ni
R!
hcM
~ 100
Bounce and Shock Formation
nuclear matter
~ 10
nuclei
(t ~ 0.11s,
1.3 1.5
R ~ 50!
Explosion (t ~ 0.2s)sR ~ 200
PNS gain layercooling layer
R ~ 10ns
R1.4
!
Neutrino Cooling and Neutrino!
PNS
Driven Wind (t ~ 10s)
n, p
nuclear matter nuclei
Shock Propagation and Burst
R ~ 100 kms
R!
(t ~ 0.12s)
heavy nucleihcM
$
c(t ~ 0.1s, ~10"# g/cm$)(t ~ 0)Initial Phase of Collapse
Figure 2. Schematic representation of the processes that occur in a collapsing stellar iron core on the way to thesupernova explosion. The diagrams (from top left to bottom right) visualize the physical conditions at the onset ofcore collapse, neutrino trapping, shock formation, propagation of the prompt shock, shock stagnation and revivalby neutrino heating, and r-process nucleosynthesis in the neutrino-driven wind of the newly formed neutron star,respectively, as suggested by current computer simulations. In the upper parts of the figures the dynamical stateis shown, with arrows indicating the flow of the stellar fluid. The lower parts of the figures contain informationabout the nuclear composition of the stellar plasma and the role of neutrinos during the different phases.
41
Lνe/Lνe=1
Entropy
Expansion timescale
S ∼ L-1/6 ϵ-1/3 Rns-2/3 Mns
τ ∼ L-1 ϵ-2 Rns Mns
Woosley et al. 1994Arcones et al. 2007
Hüdepohl et al. 2009
Fischer et al. 2009
Qian&Woosley 1996
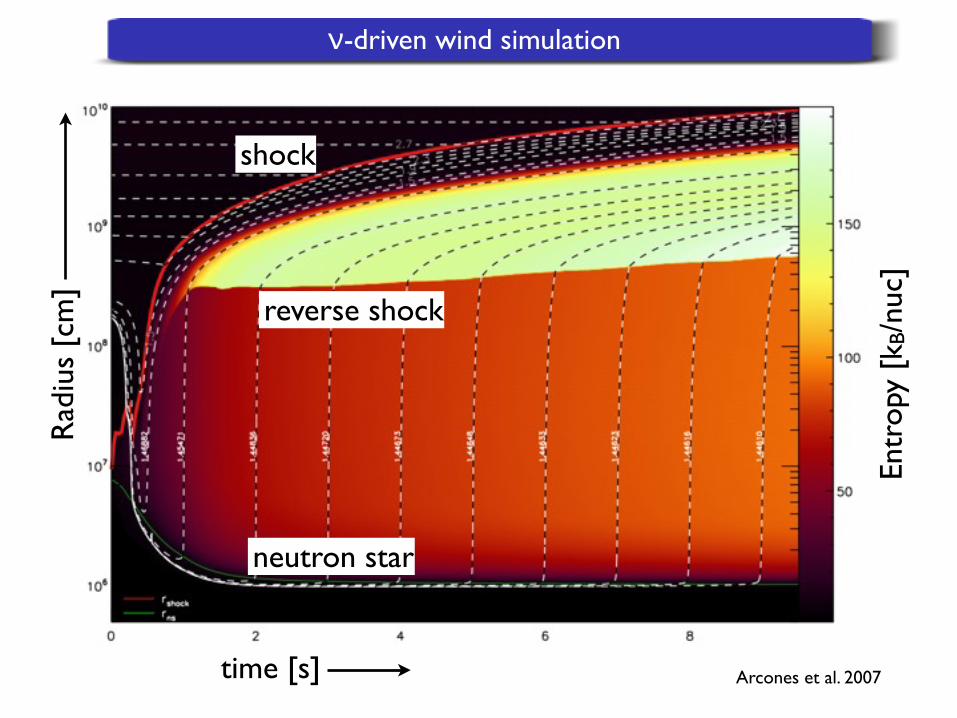
Rad
ius
[cm
]
time [s]
neutron star
shock
ν-driven wind simulation
reverse shock
Entr
opy
[kB/
nuc]
Arcones et al. 2007
Rad
ius
[cm
]
time [s]
neutron star
shock
ν-driven wind simulation
reverse shock
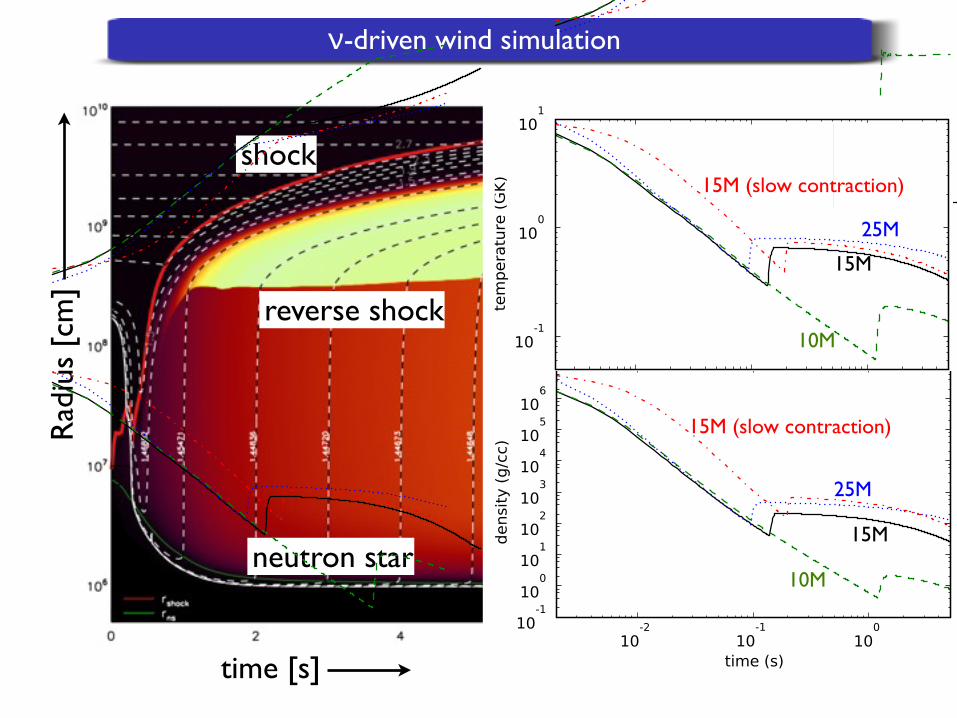
– 8 –
duces the results of Boltzmann transport simulations qualitatively. The neutrino spectra
are assumed to follow Fermi-Dirac distributions with spectral temperatures di!erent fromthe local matter temperature in general. The central part (! ! 1013 g/cm3) of the proto-neutron star is replaced by a Lagrangian inner boundary placed below the neutrinosphere.
This reduces the computational time and is justified in part due to the uncertainties in thehigh-density EoS. Models M10-l1-r1 for a 10M! progenitor star, M15-l1-r1 and M15-l1-r6
both for a 15M!, and M25-l5-r4 for a 25M! case (Arcones et al. 2007). Hereafter, thesemodels are referred as 10M, 15M, 15M(s), and 25M, respectively. Note that these models
were selected to cover a wide range of wind entropies and timescales.
Fig. 2.— Evolution of radius, entropy, temperature, and density of a mass element ejected
5s after the explosion for the models 10M, 15M, 15M(s), and 25M.
The evolution of radius, entropy, temperature, and density is shown in Fig. 2 for amass elements ejected at 5 s after the explosion. The proto-neutron start in 10M, 15M,
and 25M follows a very similar contraction and neutrino cooling evolution. As discussedin Sect. 2.1, these models show almost identical evolution of density and temperature in
the wind, although their progenitor stars are rather di!erent. Their wind profiles di!er
15M (slow contraction)
15M (slow contraction)
10M
10M
15M
15M
25M
25M
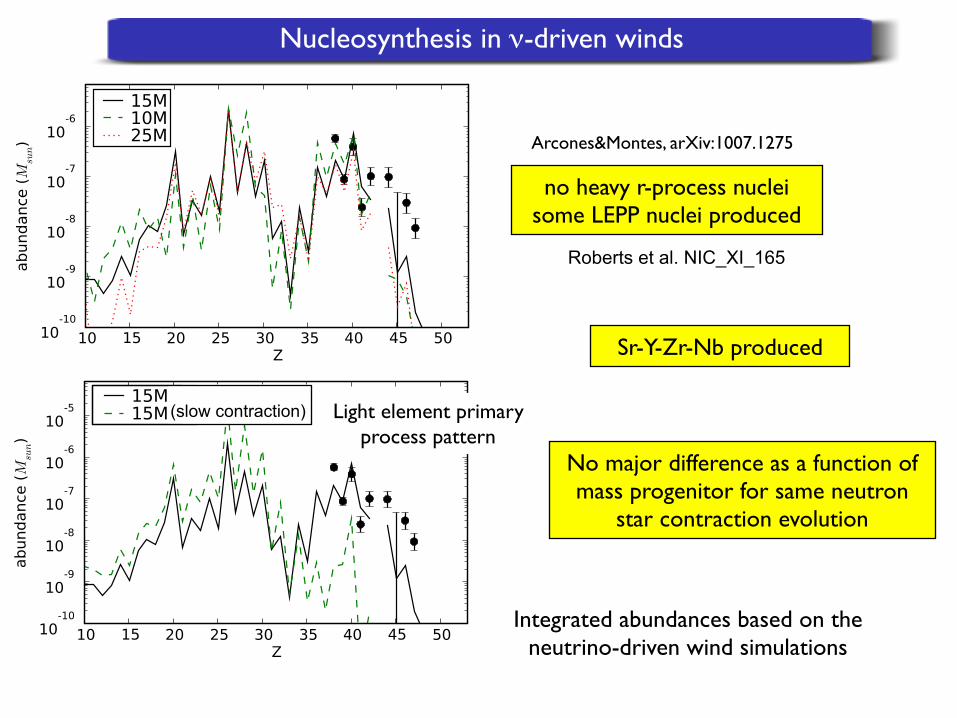
Nucleosynthesis in ν-driven winds
Integrated abundances based on the neutrino-driven wind simulations
no heavy r-process nucleisome LEPP nuclei produced
(slow contraction)
Arcones&Montes, arXiv:1007.1275
Light element primary process pattern
No major difference as a function of mass progenitor for same neutron
star contraction evolution
Sr-Y-Zr-Nb produced
Roberts et al. NIC_XI_165
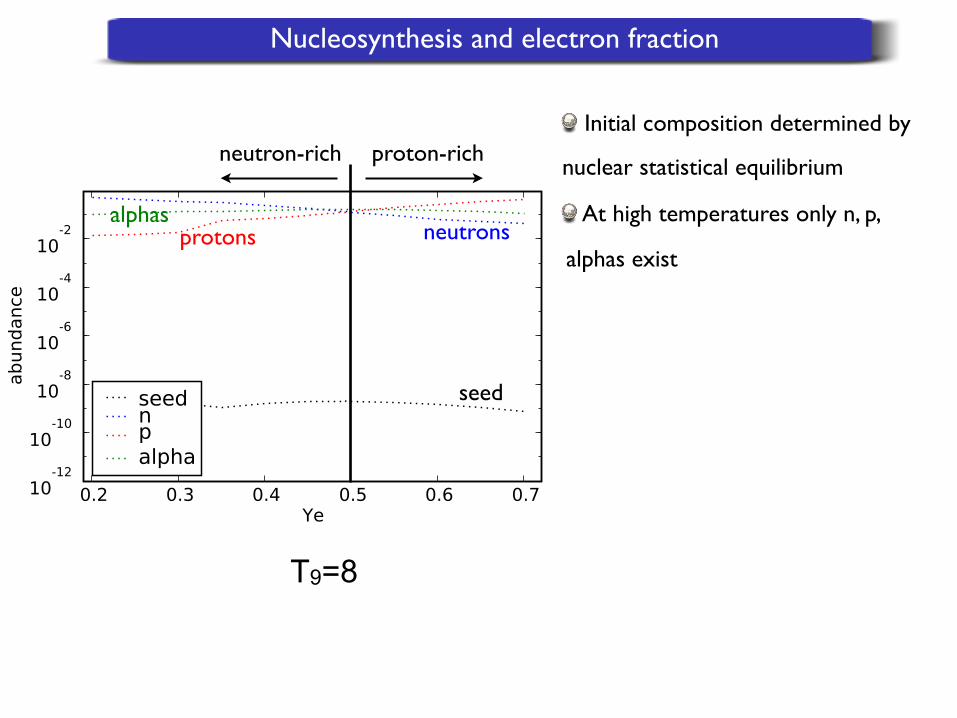
Nucleosynthesis and electron fraction
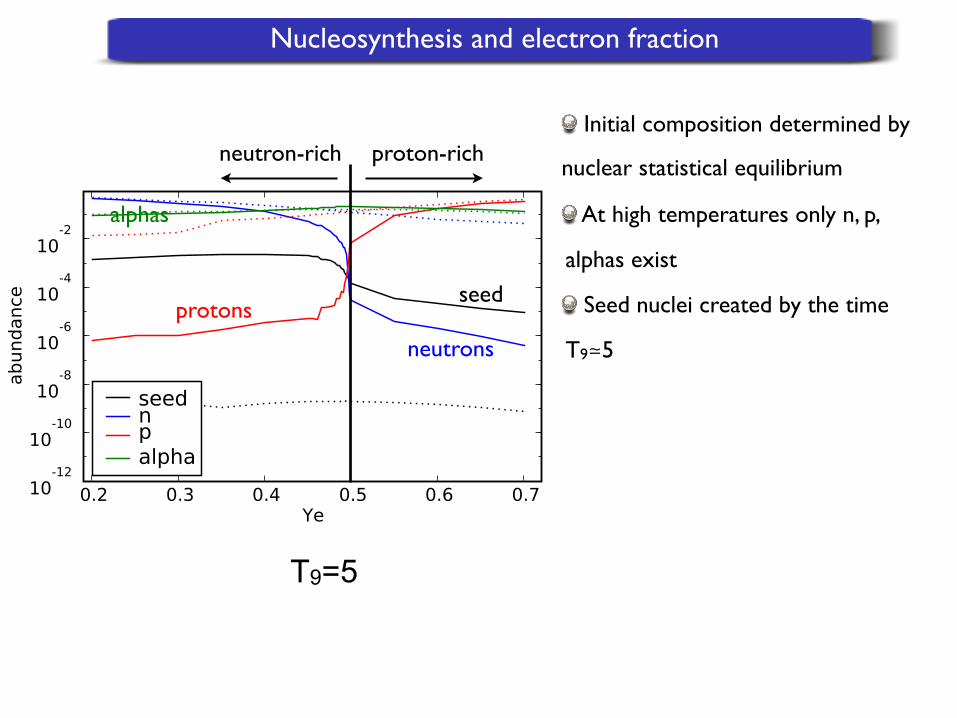
Initial composition determined by
nuclear statistical equilibrium
At high temperatures only n, p,
alphas exist
seed
neutronsprotons
proton-richneutron-rich
T9=8
alphas
Nucleosynthesis and electron fraction
Initial composition determined by
nuclear statistical equilibrium
At high temperatures only n, p,
alphas exist
Seed nuclei created by the time
T9≃5
alphas
neutrons
protonsseed
proton-richneutron-rich
T9=5
Nucleosynthesis and electron fraction
Initial composition determined by
nuclear statistical equilibrium
At high temperatures only n, p,
alphas exist
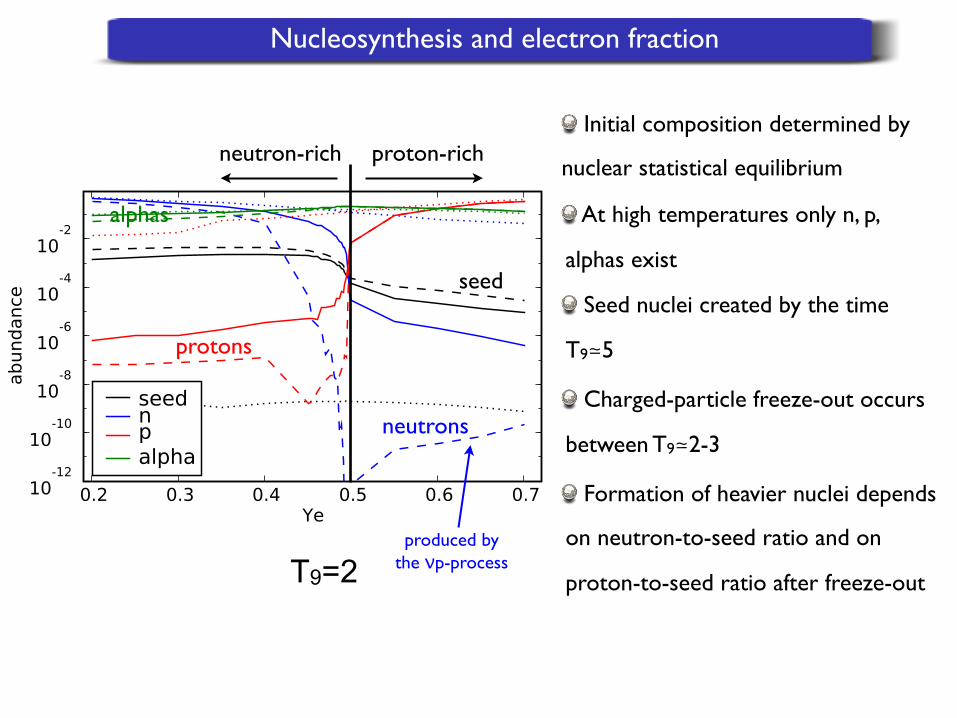
Seed nuclei created by the time
T9≃5
Charged-particle freeze-out occurs
between T9≃2-3
Formation of heavier nuclei depends
on neutron-to-seed ratio and on
proton-to-seed ratio after freeze-out
neutrons
protons
seed
produced by the νp-process
proton-richneutron-rich
T9=2
alphas
Nucleosynthesis and electron fraction
– 14 –
Fig. 6.— Seed nuclei (i.e., nuclei heavier than 4He), neutron, proton and alpha abundancesas a function of Ye based on the mass element ejected at 5s after the explosion in model 15M.
Dotted, solid and dashed lines correspond to temperatures of 8, 5 and 2 GK, respectively.
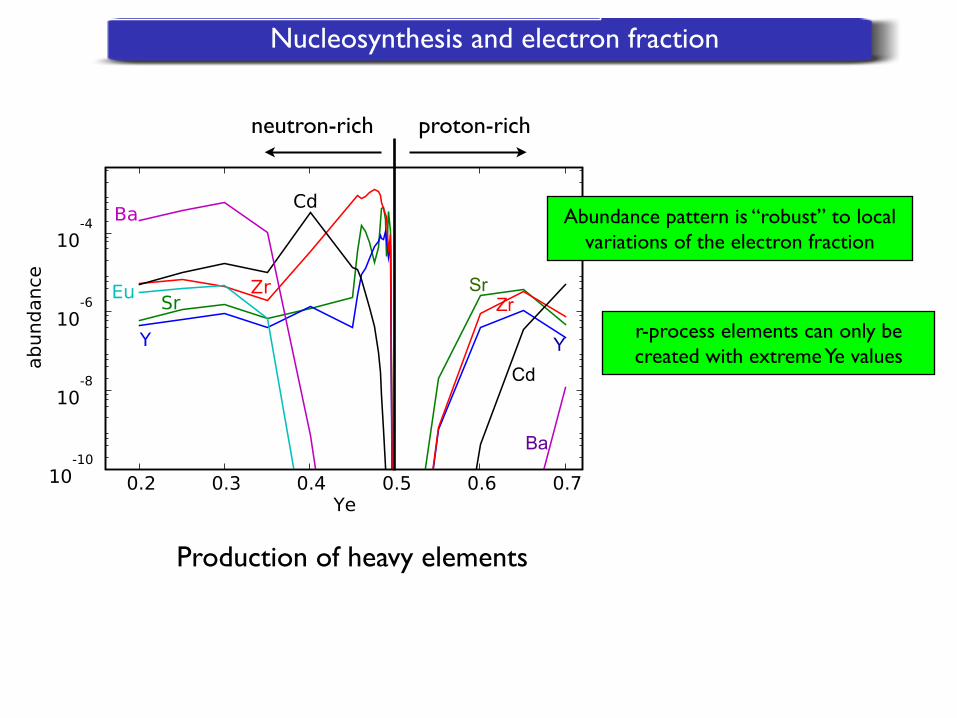
Fig. 7.— Dependence of the abundances of representative elements (Sr, Y, Zr, Cd, Ba andEu) on the electron fraction. These abundances result from a mass element ejected at 5s
after the explosion in model 15M.
Abundance pattern is “robust” to local variations of the electron fraction
Production of heavy elements
CdY
Ba
SrZr
proton-richneutron-rich
r-process elements can only be created with extreme Ye values
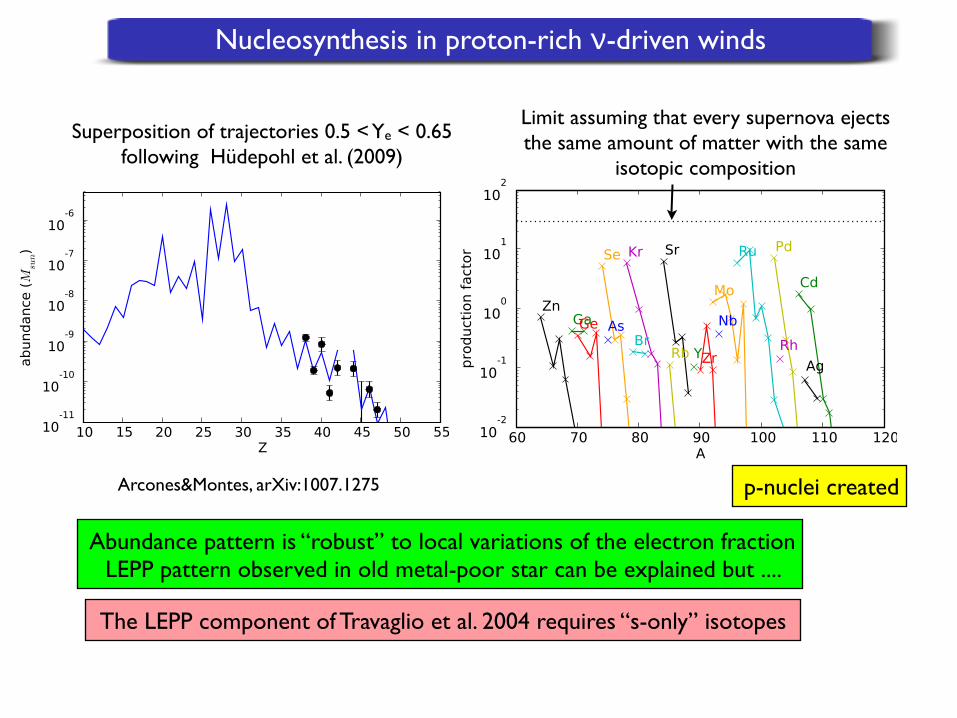
Nucleosynthesis in proton-rich ν-driven winds
The LEPP component of Travaglio et al. 2004 requires “s-only” isotopes
Superposition of trajectories 0.5 < Ye < 0.65 following Hüdepohl et al. (2009)
Limit assuming that every supernova ejects the same amount of matter with the same
isotopic composition
Abundance pattern is “robust” to local variations of the electron fractionLEPP pattern observed in old metal-poor star can be explained but ....
p-nuclei createdArcones&Montes, arXiv:1007.1275
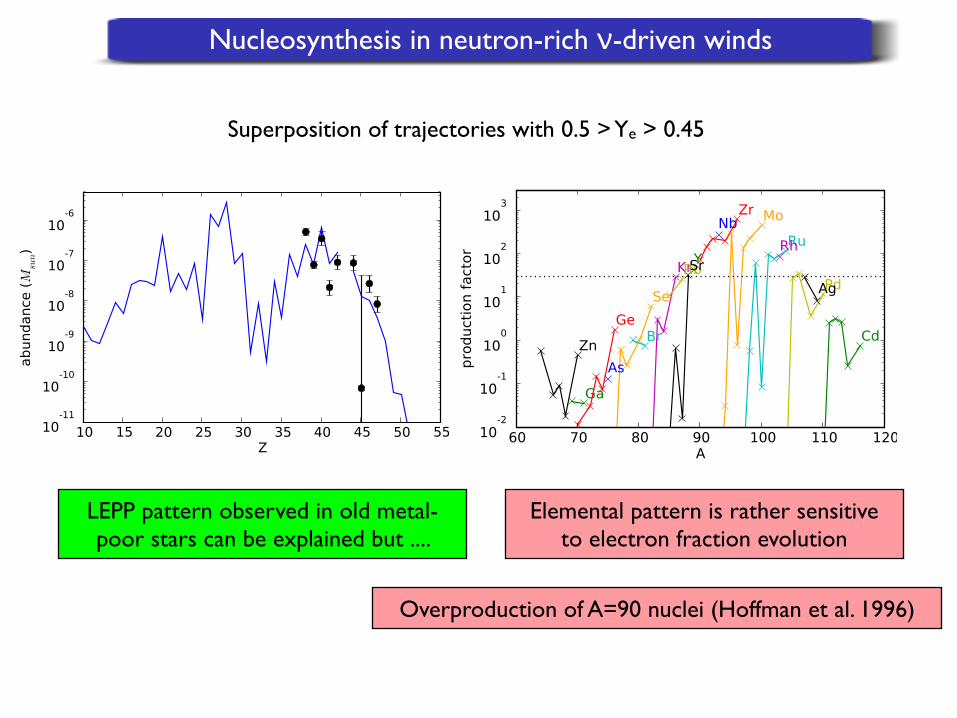
Nucleosynthesis in neutron-rich ν-driven winds
Superposition of trajectories with 0.5 > Ye > 0.45
Overproduction of A=90 nuclei (Hoffman et al. 1996)
LEPP pattern observed in old metal-poor stars can be explained but ....
Elemental pattern is rather sensitive to electron fraction evolution
Conclusions
First comparison of the light element primary process pattern observed in metal-poor stars
and nucleosynthesis in realistic neutrino driven-wind simulations
Electron fraction has an important effect on final abundances and depends on the uncertain
composition and interaction in the outer layers of the proton-neutron star
Abundance pattern can be reproduced by neutron and proton -rich winds
Proton-rich winds show a rather robust pattern but produce p-nuclei and not in enough
quantities
Neutron-rich winds overproduce A=90 nuclei
A combination of both types of winds is likely and may be able to explain the LEPP solar
system contribution
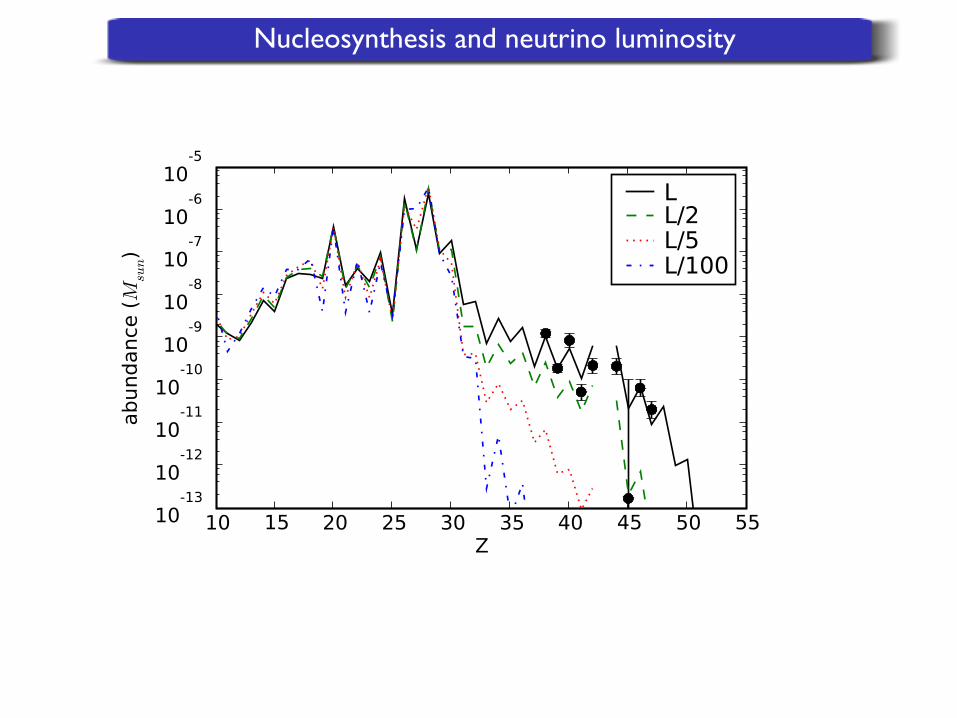
Nucleosynthesis and neutrino luminosity
– 20 –
Fig. 11.— Same as Fig. 8 but varying the neutrino luminosities. The luminosity of the
simulation is given by the solid black line labeled as “L”. For the other cases this luminosityhas been dived by di!erent factors as indicated by the labels.
3.2.2. Neutron-rich winds
In neutron-rich winds (0.45 ! Ye < 0.5) the amount of ejected LEPP elements is higherthan for the proton-rich case (Fig. 7). However, we do not find a robust LEPP pattern for
neutron-rich winds. In Fig. 12, the abundances and production factors are shown for twopossible evolutions of the electron fraction, which decreases almost linearly with time. Inthe upper panels, the ejecta become only slightly neutron rich with the electron fraction
decreasing from Ye = 0.5 at 1s to Ye = 0.486 at 10s. In this case only the light part of theLEPP (Sr, Y, Zr) can be synthesized. The bottom panels correspond to an initial electron
fraction that evolves from Ye = 0.5 down to Ye = 0.45 at 10s. These more neutron-richconditions lead to elements up to around Silver (Z=47).
The abundances of Sr, Y, and Zr depend on the electron fraction in a non-linear way asshown in Fig. 13. Therefore, slightly di!erent evolutions of the electron fraction are found to
lead to significant changes in this pattern. Moreover, small variations of the entropy and theexpansion timescales have a substantial impact on the neutron-to-seed ratio and thereforeon the abundances, making it even more di"cult to get a robust pattern. This sensitivity in
the final abundances is due to the abrupt drop of the neutron abundances towards Ye = 0.5as shown in Fig. 6.


![Lect12.8.ppt - web.pa.msu.edu€¦ · Title: Microsoft PowerPoint - Lect12.8.ppt [Compatibility Mode] Author: stump Created Date: 4/5/2010 11:18:37 AM](https://img.pdfslide.us/doc/110x75/5fe691d5b19a10335d0075f6/lect128ppt-webpamsuedu-title-microsoft-powerpoint-lect128ppt-compatibility.jpg)
![Two Chord - web.pa.msu.edu · Two Chord Song Workshop Download this document at: punchdrunkband.com . Cornbread and Butterbeans Carolina Chocolate Drops [G] …](https://img.pdfslide.us/doc/110x75/5b4022ec7f8b9a5e2c8cfeb9/two-chord-webpamsuedu-two-chord-song-workshop-download-this-document-at.jpg)


![web.pa.msu.edu · Author: nagy_t [ SCANNER-PA ] Created Date: 11/25/2008 4:53:35 PM](https://img.pdfslide.us/doc/110x75/5f064a637e708231d41740b2/webpamsuedu-author-nagyt-scanner-pa-created-date-11252008-45335-pm.jpg)