Embed Size (px)
Citation preview

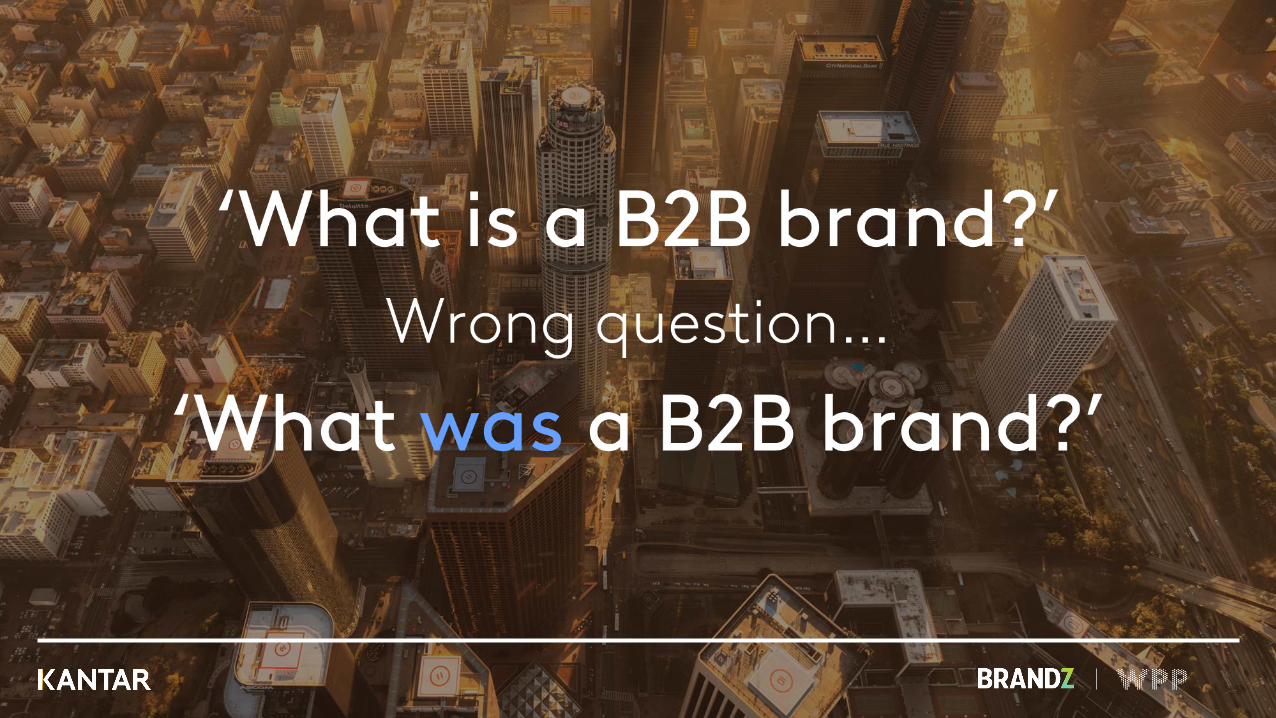
B2B?
Think ‘brand’ to build!
Unlocking growth in B2B
Martin Guerrieria
Global Head of Research, BrandZ
October 2020
The largest brand building
platform in the worldEst. 1998
17kUnique brands
51Markets
512Categories
3.9mConsumers
5.3BData points
2
3
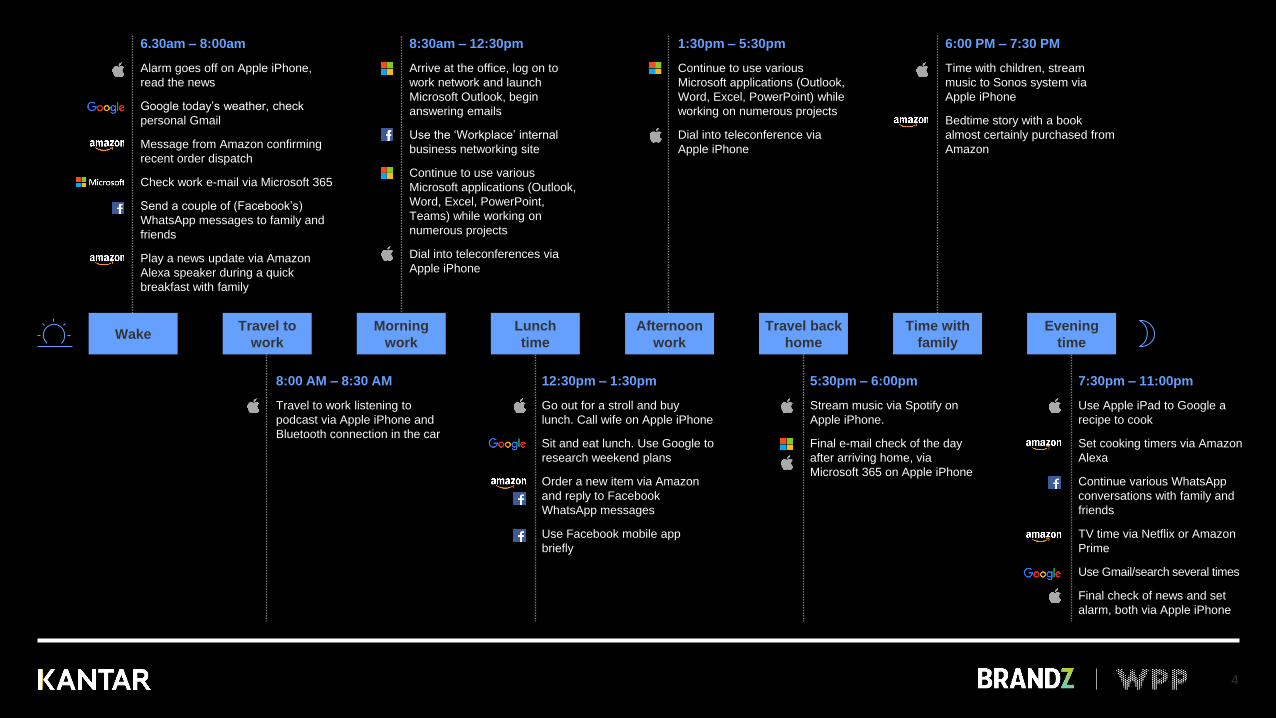
6:00 PM – 7:30 PM
Time with children, stream
music to Sonos system via
Apple iPhone
Bedtime story with a book
almost certainly purchased from
Amazon
1:30pm – 5:30pm
Continue to use various
Microsoft applications (Outlook,
Word, Excel, PowerPoint) while
working on numerous projects
Dial into teleconference via
Apple iPhone
8:30am – 12:30pm
Arrive at the office, log on to
work network and launch
Microsoft Outlook, begin
answering emails
Use the ‘Workplace’ internal
business networking site
Continue to use various
Microsoft applications (Outlook,
Word, Excel, PowerPoint,
Teams) while working on
numerous projects
Dial into teleconferences via
Apple iPhone
6.30am – 8:00am
Alarm goes off on Apple iPhone,
read the news
Google today’s weather, check
personal Gmail
Message from Amazon confirming
recent order dispatch
Check work e-mail via Microsoft 365
Send a couple of (Facebook’s)
WhatsApp messages to family and
friends
Play a news update via Amazon
Alexa speaker during a quick
breakfast with family
7:30pm – 11:00pm
Use Apple iPad to Google a
recipe to cook
Set cooking timers via Amazon
Alexa
Continue various WhatsApp
conversations with family and
friends
TV time via Netflix or Amazon
Prime
Use Gmail/search several times
Final check of news and set
alarm, both via Apple iPhone
5:30pm – 6:00pm
Stream music via Spotify on
Apple iPhone.
Final e-mail check of the day
after arriving home, via
Microsoft 365 on Apple iPhone
12:30pm – 1:30pm
Go out for a stroll and buy
lunch. Call wife on Apple iPhone
Sit and eat lunch. Use Google to
research weekend plans
Order a new item via Amazon
and reply to Facebook
WhatsApp messages
Use Facebook mobile app
briefly
8:00 AM – 8:30 AM
Travel to work listening to
podcast via Apple iPhone and
Bluetooth connection in the car
WakeTravel to
work
Morning
work
Lunch
time
Afternoon
work
Travel back
home
Time with
family
Evening
time
4
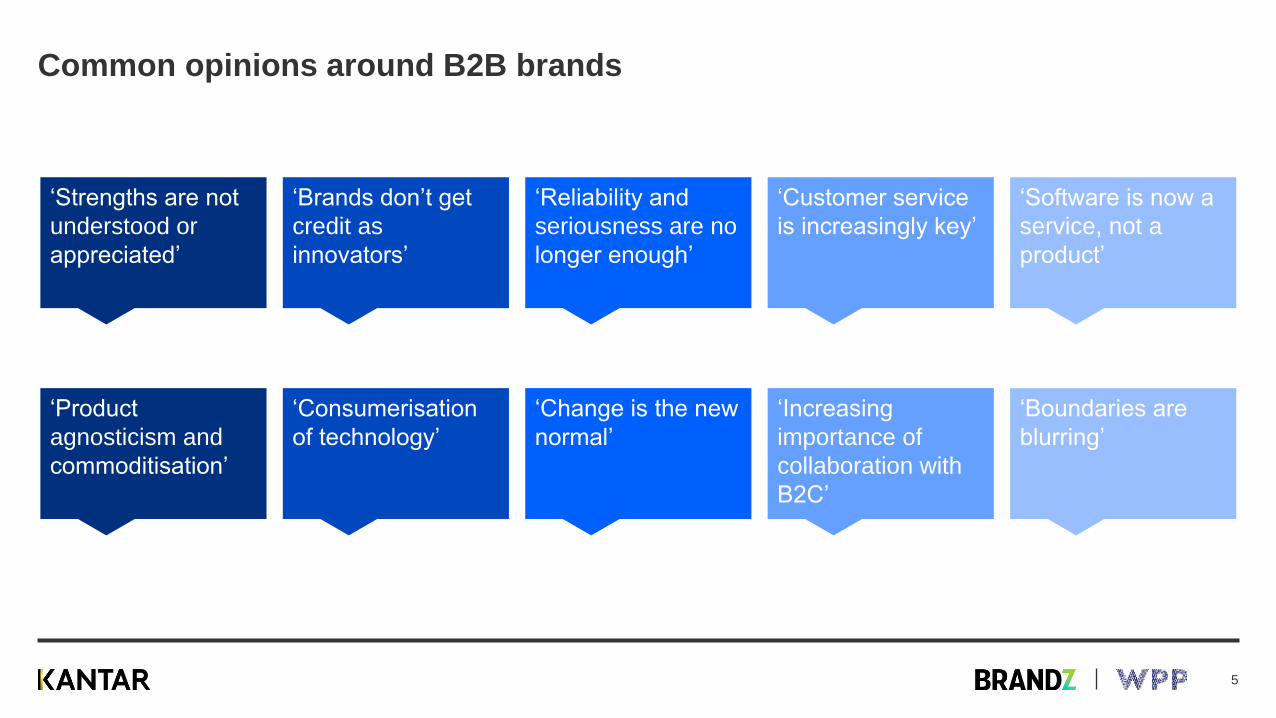
Common opinions around B2B brands
‘Brands don’t get
credit as
innovators’
‘Strengths are not
understood or
appreciated’
‘Reliability and
seriousness are no
longer enough’
‘Customer service
is increasingly key’
‘Software is now a
service, not a
product’
‘Consumerisation
of technology’
‘Product
agnosticism and
commoditisation’
‘Change is the new
normal’
‘Increasing
importance of
collaboration with
B2C’
‘Boundaries are
blurring’
5
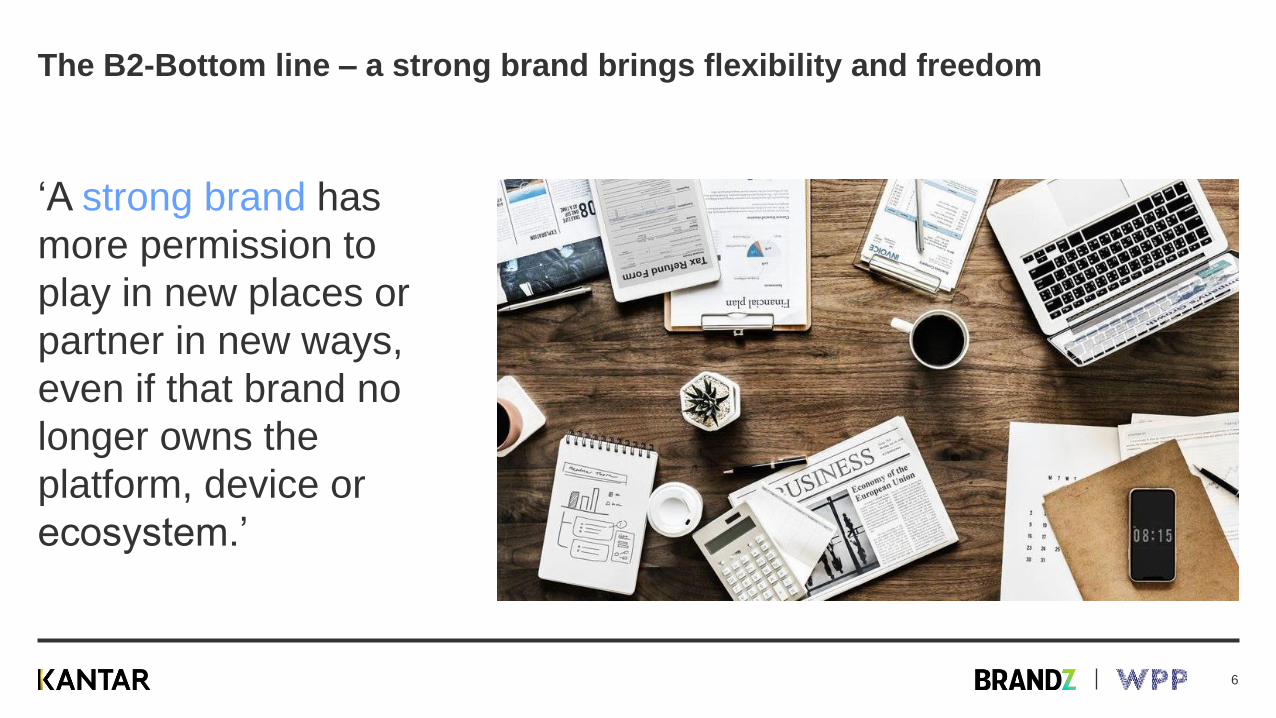
The B2-Bottom line – a strong brand brings flexibility and freedom
‘A strong brand has
more permission to
play in new places or
partner in new ways,
even if that brand no
longer owns the
platform, device or
ecosystem.’
6
1
Why is building a strong brand important?
7
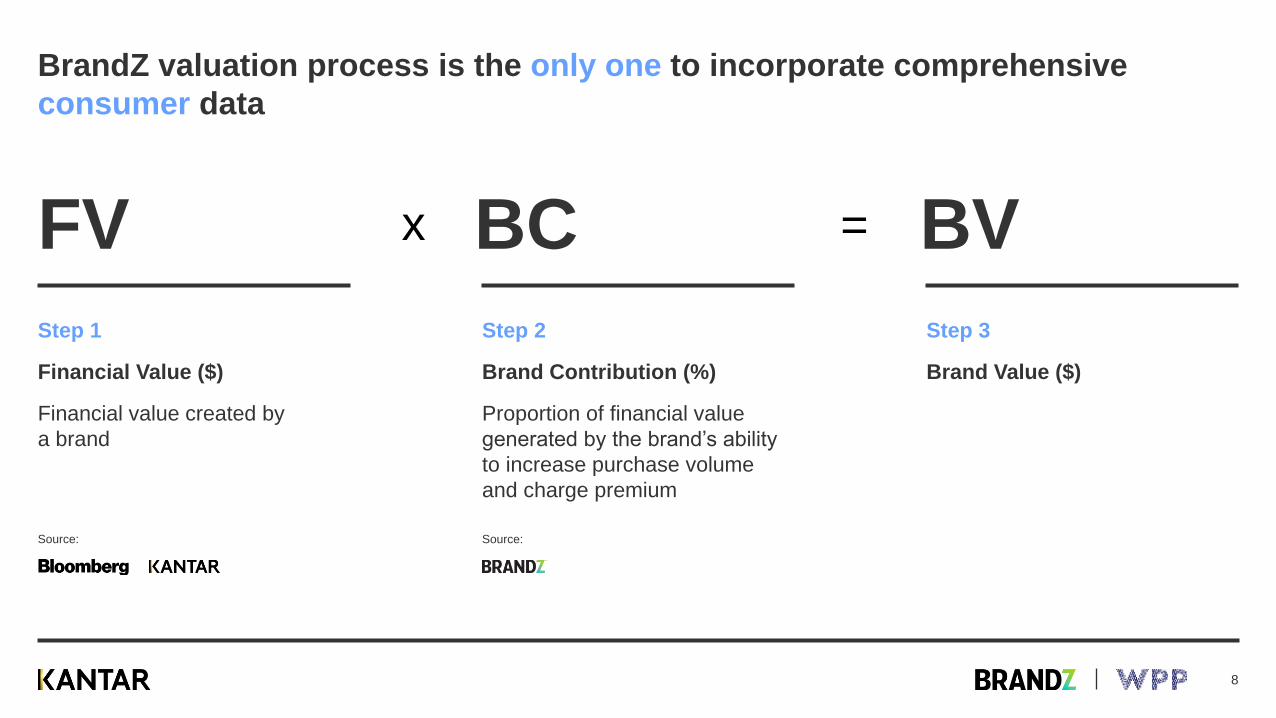
BrandZ valuation process is the only one to incorporate comprehensive
consumer data
FV
Step 1
Financial Value ($)
Financial value created by
a brand
BC
Step 2
Brand Contribution (%)
Proportion of financial value
generated by the brand’s ability
to increase purchase volume
and charge premium
BV
Step 3
Brand Value ($)
x =
Source: Source:
8
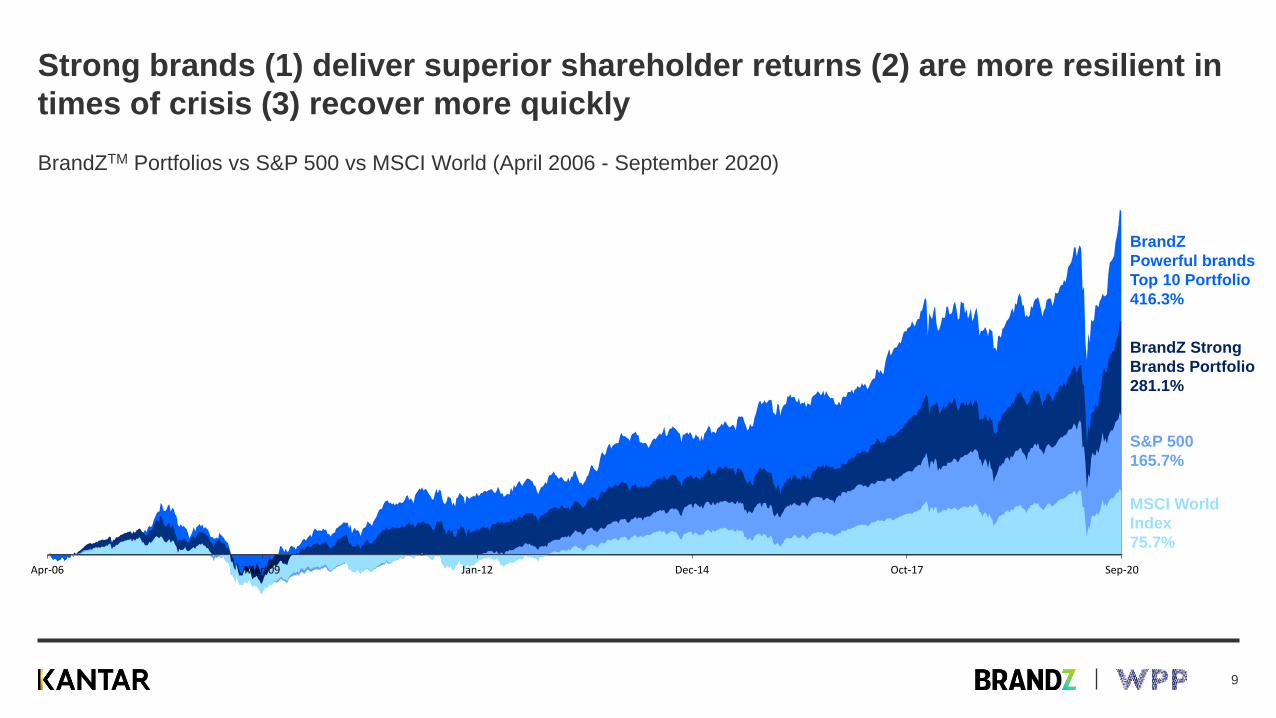
Strong brands (1) deliver superior shareholder returns (2) are more resilient in
times of crisis (3) recover more quickly
BrandZTM Portfolios vs S&P 500 vs MSCI World (April 2006 - September 2020)
Apr-06 Mar-09 Jan-12 Dec-14 Oct-17 Sep-20
BrandZ
Powerful brands
Top 10 Portfolio
416.3%
BrandZ Strong
Brands Portfolio
281.1%
S&P 500
165.7%
MSCI World
Index
75.7%
9
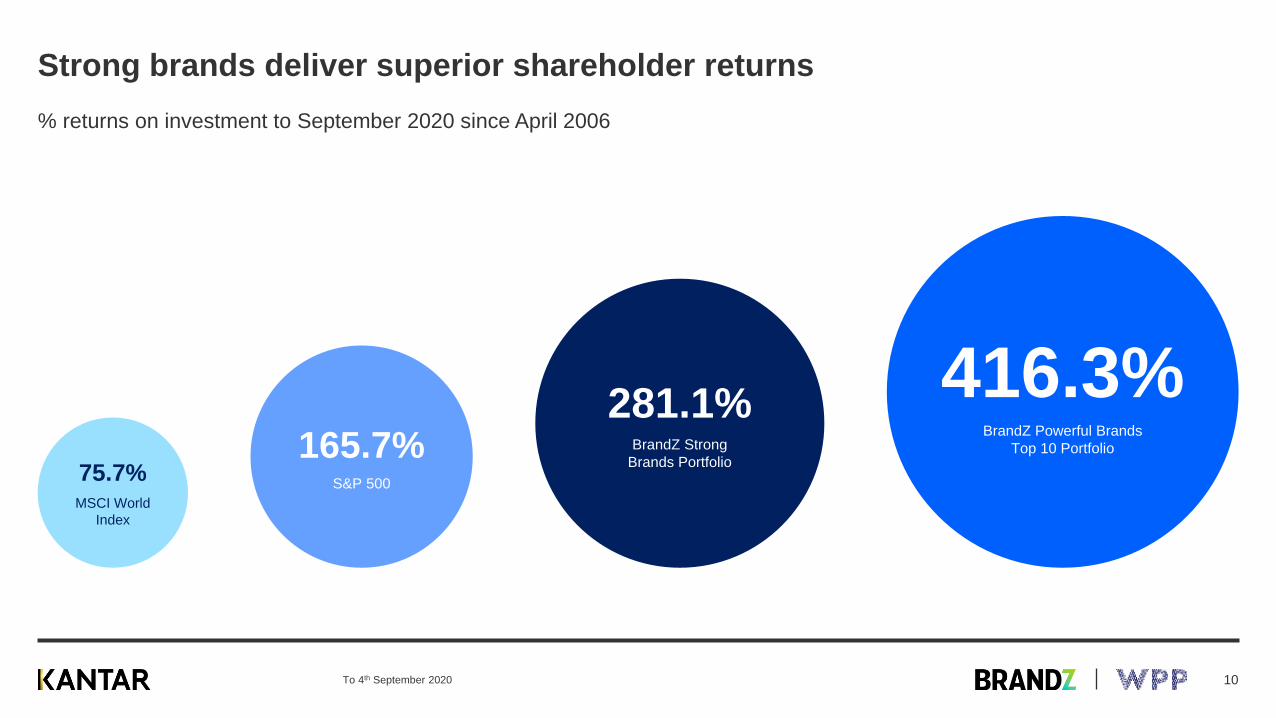
Strong brands deliver superior shareholder returns
% returns on investment to September 2020 since April 2006
75.7%MSCI World
Index
165.7%S&P 500
281.1%BrandZ Strong
Brands Portfolio
416.3%BrandZ Powerful Brands
Top 10 Portfolio
To 4th September 2020 10
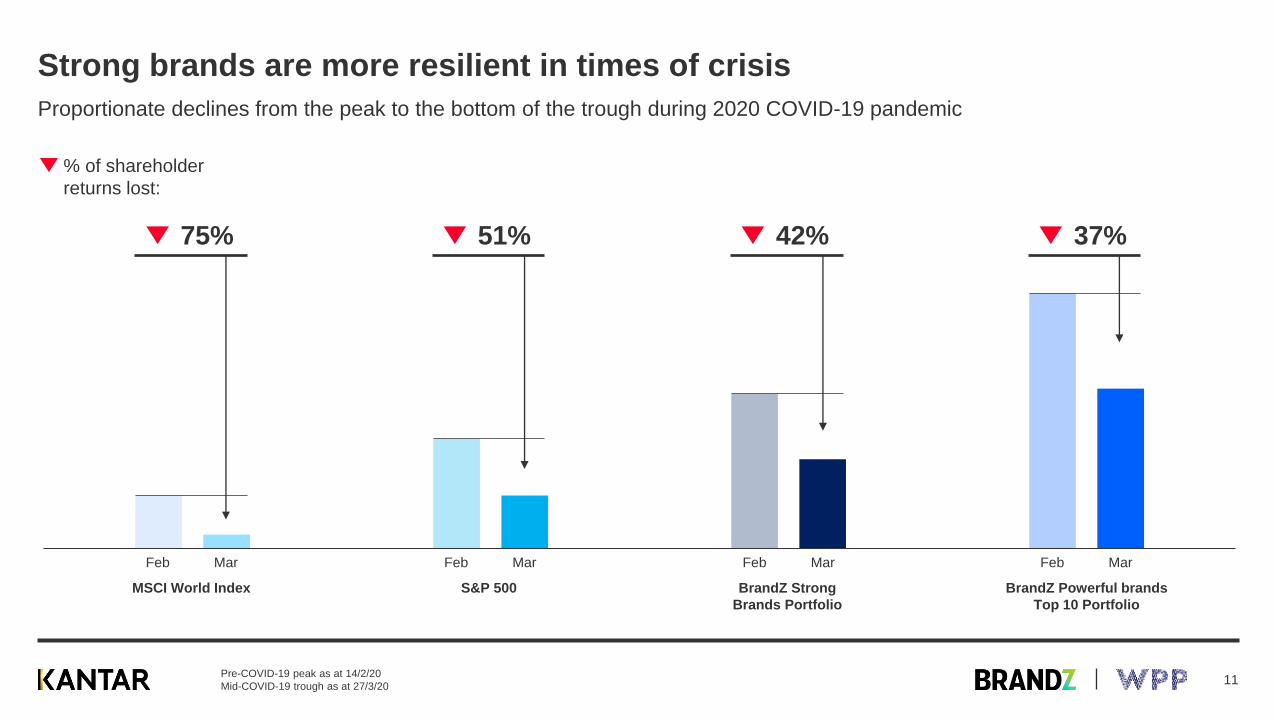
Strong brands are more resilient in times of crisis
Proportionate declines from the peak to the bottom of the trough during 2020 COVID-19 pandemic
MSCI World Index S&P 500 BrandZ Strong Brands Portfolio BrandZ Powerful brands Top 10 Portfolio
42% 37%75% 51%
% of shareholder
returns lost:
BrandZ Powerful brands
Top 10 Portfolio
BrandZ Strong
Brands Portfolio
S&P 500MSCI World Index
Feb Mar Feb Mar Feb Mar Feb Mar
Pre-COVID-19 peak as at 14/2/20
Mid-COVID-19 trough as at 27/3/2011
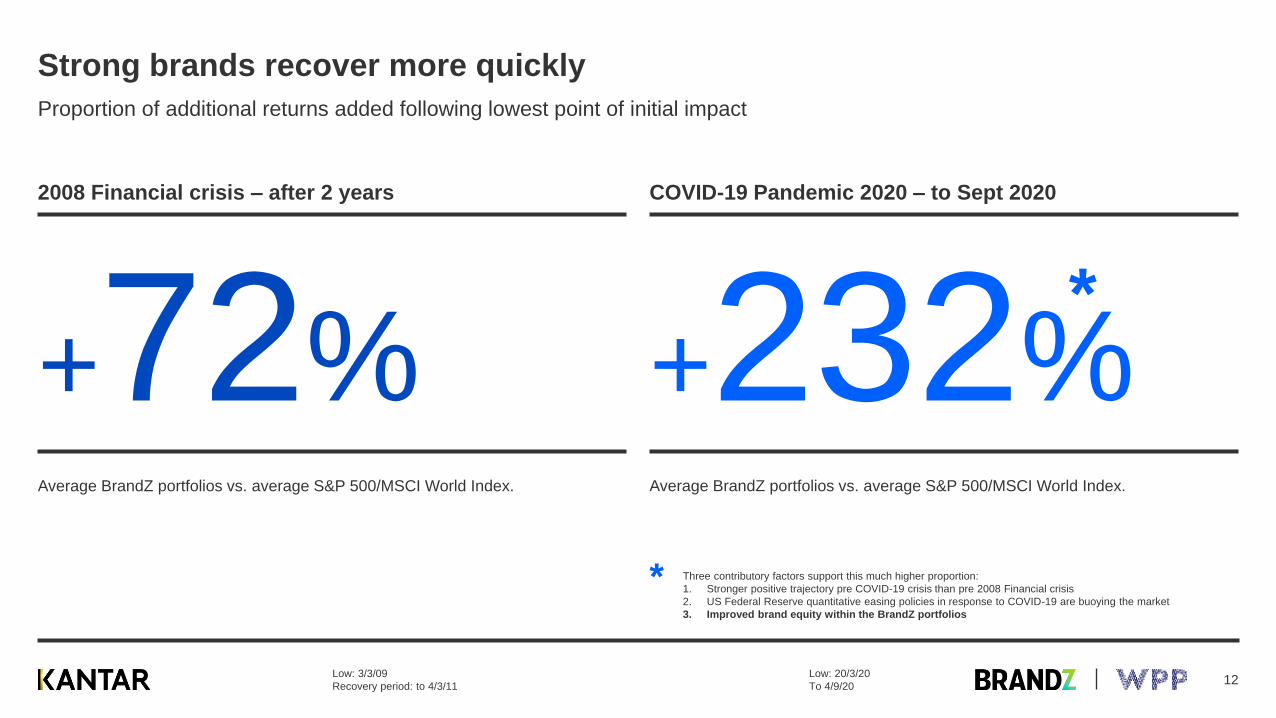
Strong brands recover more quickly
2008 Financial crisis – after 2 years COVID-19 Pandemic 2020 – to Sept 2020
Proportion of additional returns added following lowest point of initial impact
Low: 3/3/09
Recovery period: to 4/3/11
Average BrandZ portfolios vs. average S&P 500/MSCI World Index. Average BrandZ portfolios vs. average S&P 500/MSCI World Index.
Three contributory factors support this much higher proportion:
1. Stronger positive trajectory pre COVID-19 crisis than pre 2008 Financial crisis
2. US Federal Reserve quantitative easing policies in response to COVID-19 are buoying the market
3. Improved brand equity within the BrandZ portfolios
*
+72% +232%*
Low: 20/3/20
To 4/9/2012
2
What are the key ingredients for
successful brand building?
Where can B2B brands improve?
13
415,855
352,206
323,601
186,809
152,525
150,978
147,190
129,321
108,129
105,833
94,662
84,022
58,247
57,585
53,755
49,962
48,802
48,453
47,753
47,214
Amazon
Apple
Visa
Alibaba
Tencent/QQ
McDonald’s
Mastercard
AT&T
Verizon
Coca-Cola
Marlboro
The Home Depot
Moutai
Nike
Disney
Paypal
Starbucks
Louis Vuitton
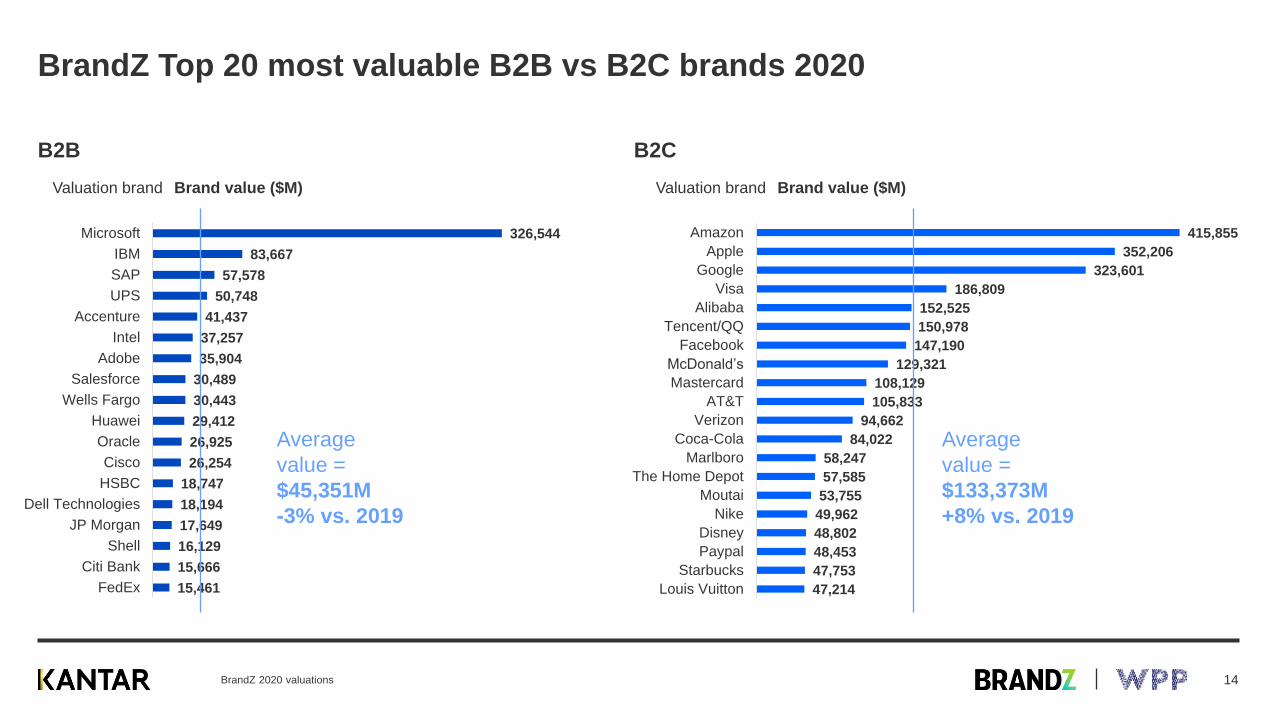
BrandZ Top 20 most valuable B2B vs B2C brands 2020
BrandZ 2020 valuations
B2B
326,544
83,667
57,578
50,748
41,437
37,257
35,904
30,489
30,443
29,412
26,925
26,254
18,747
18,194
17,649
16,129
15,666
15,461
Microsoft
IBM
SAP
UPS
Accenture
Intel
Adobe
Salesforce
Wells Fargo
Huawei
Oracle
Cisco
HSBC
Dell Technologies
JP Morgan
Shell
Citi Bank
FedEx
B2C
Brand value ($M)Valuation brand
Average
value =
$133,373M
+8% vs. 2019
Brand value ($M)Valuation brand
Average
value =
$45,351M
-3% vs. 2019
14
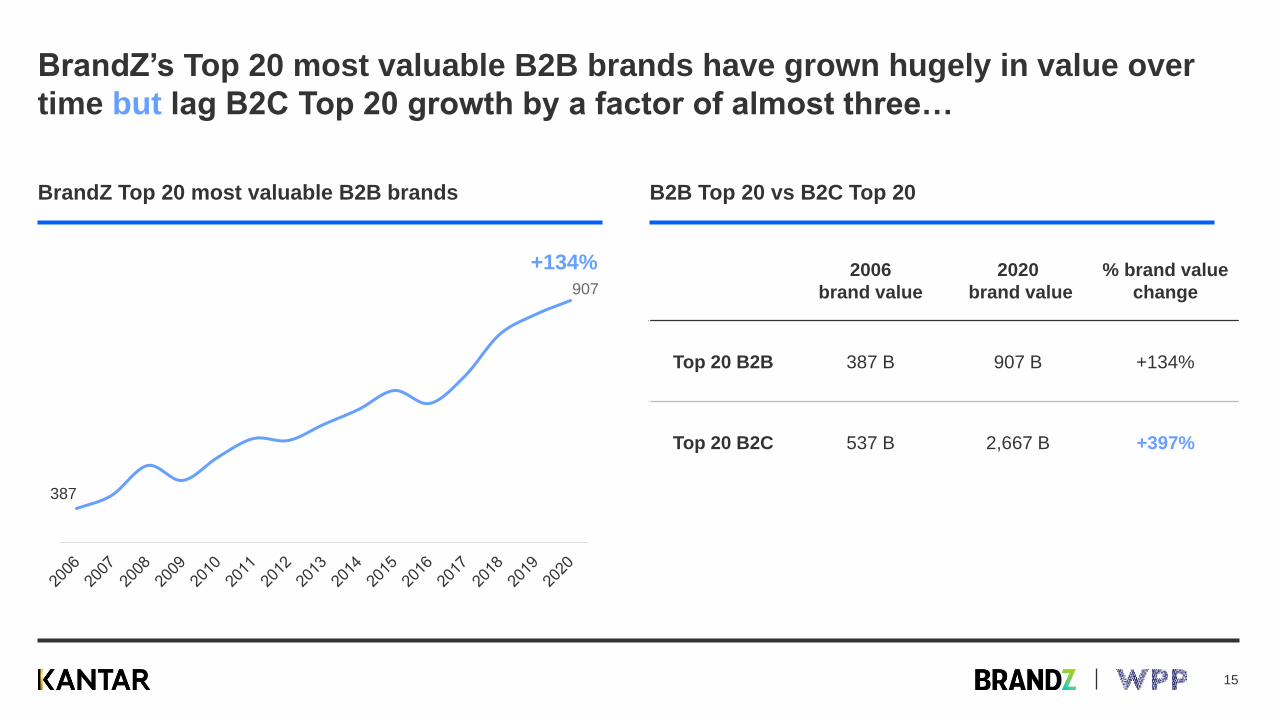
BrandZ’s Top 20 most valuable B2B brands have grown hugely in value over
time but lag B2C Top 20 growth by a factor of almost three…
BrandZ Top 20 most valuable B2B brands B2B Top 20 vs B2C Top 20
2006
brand value
2020
brand value
% brand value
change
Top 20 B2B 387 B 907 B +134%
Top 20 B2C 537 B 2,667 B +397%
387
907
+134%
15
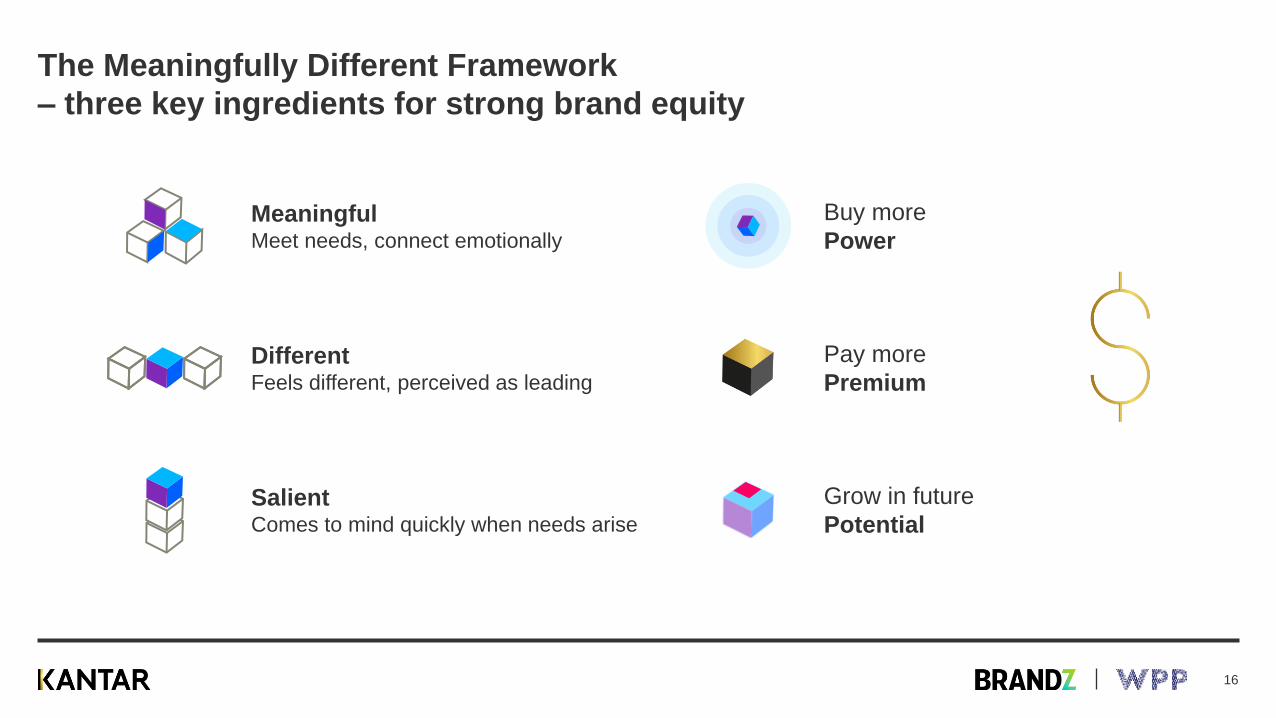
The Meaningfully Different Framework
– three key ingredients for strong brand equity
MeaningfulMeet needs, connect emotionally
DifferentFeels different, perceived as leading
Buy more
Power
Pay more
Premium
Grow in future
PotentialSalientComes to mind quickly when needs arise
16
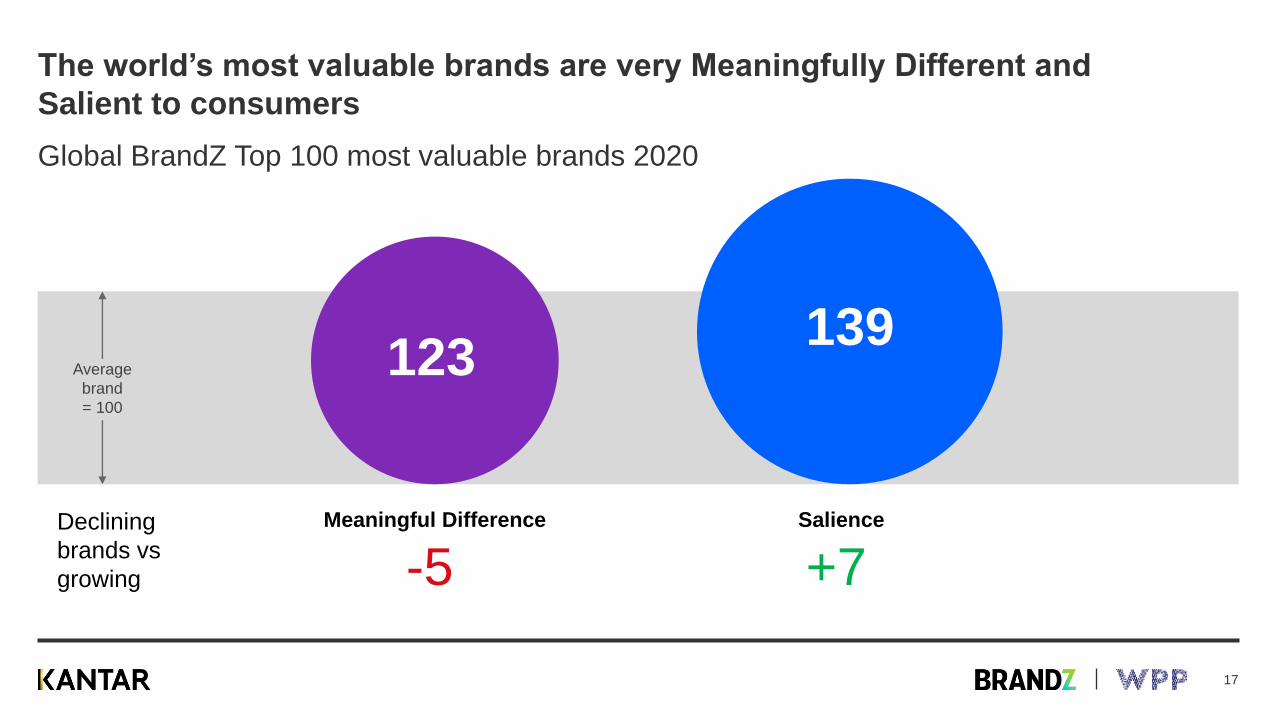
The world’s most valuable brands are very Meaningfully Different and
Salient to consumers
Global BrandZ Top 100 most valuable brands 2020
Meaningful Difference Salience
123139
+7-5Declining
brands vs
growing
Average
brand
= 100
17
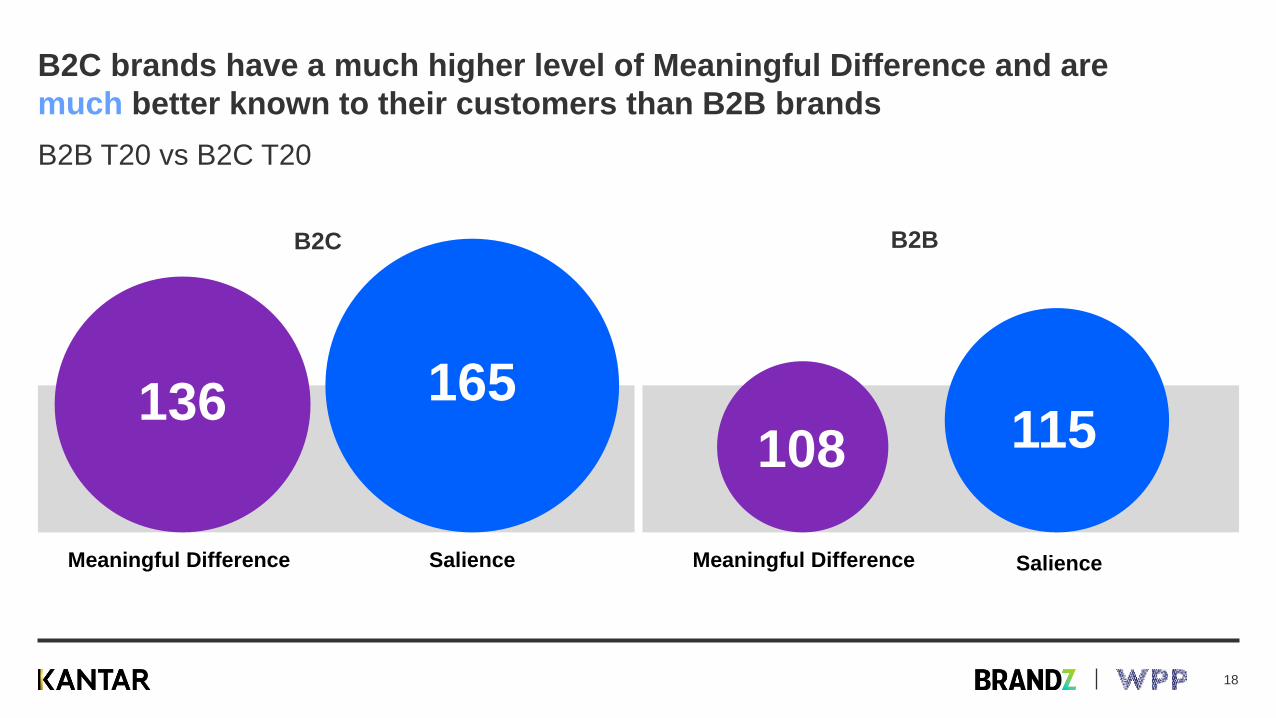
Meaningful Difference Salience
136 165
Meaningful Difference Salience
108 115
B2C brands have a much higher level of Meaningful Difference and are
much better known to their customers than B2B brands
B2B T20 vs B2C T20
B2BB2C
18
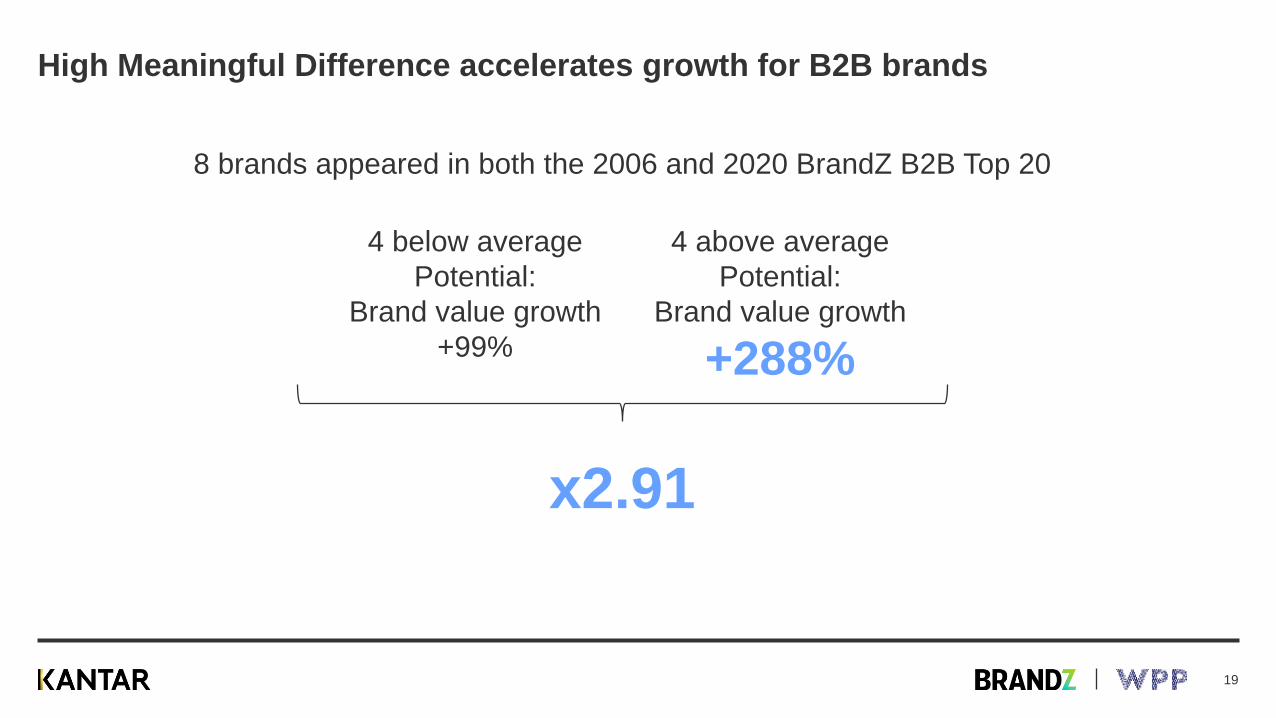
High Meaningful Difference accelerates growth for B2B brands
8 brands appeared in both the 2006 and 2020 BrandZ B2B Top 20
4 below average
Potential:
Brand value growth
+99%
4 above average
Potential:
Brand value growth
+288%
x2.91
19
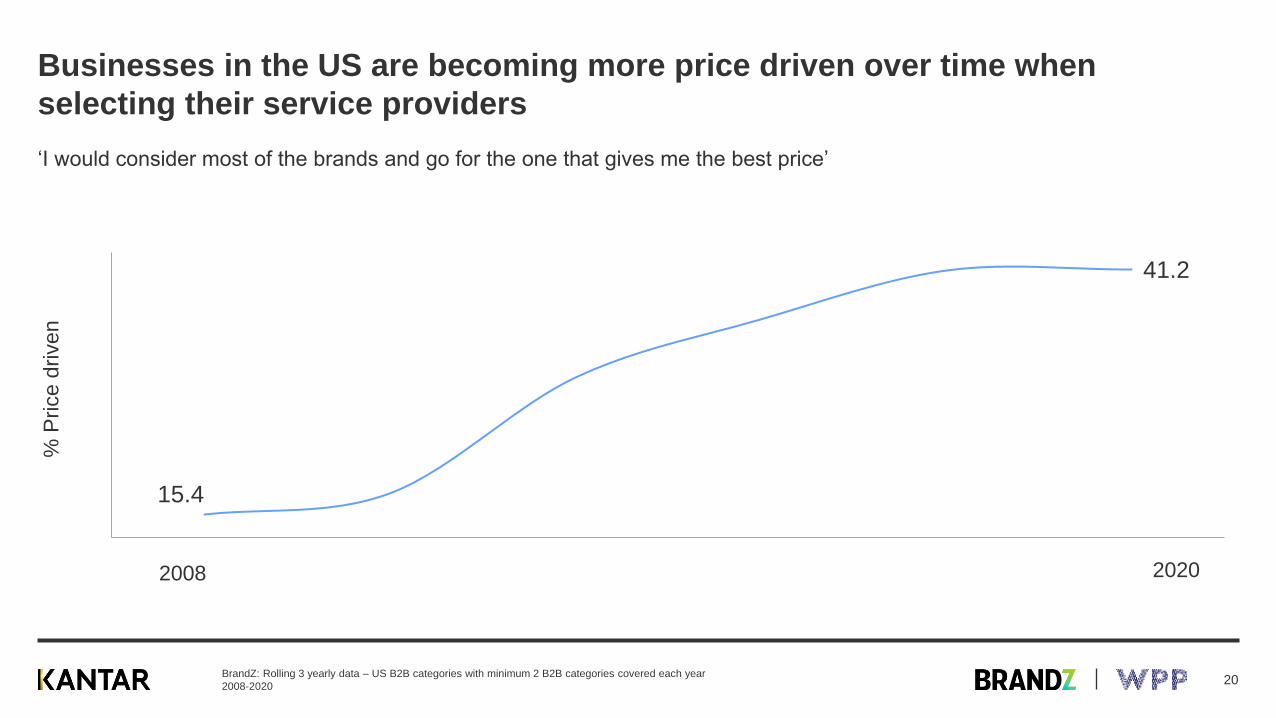
Businesses in the US are becoming more price driven over time when
selecting their service providers
BrandZ: Rolling 3 yearly data – US B2B categories with minimum 2 B2B categories covered each year
2008-2020
‘I would consider most of the brands and go for the one that gives me the best price’
15.4
41.2
2008 2020
% P
rice
drive
n
20
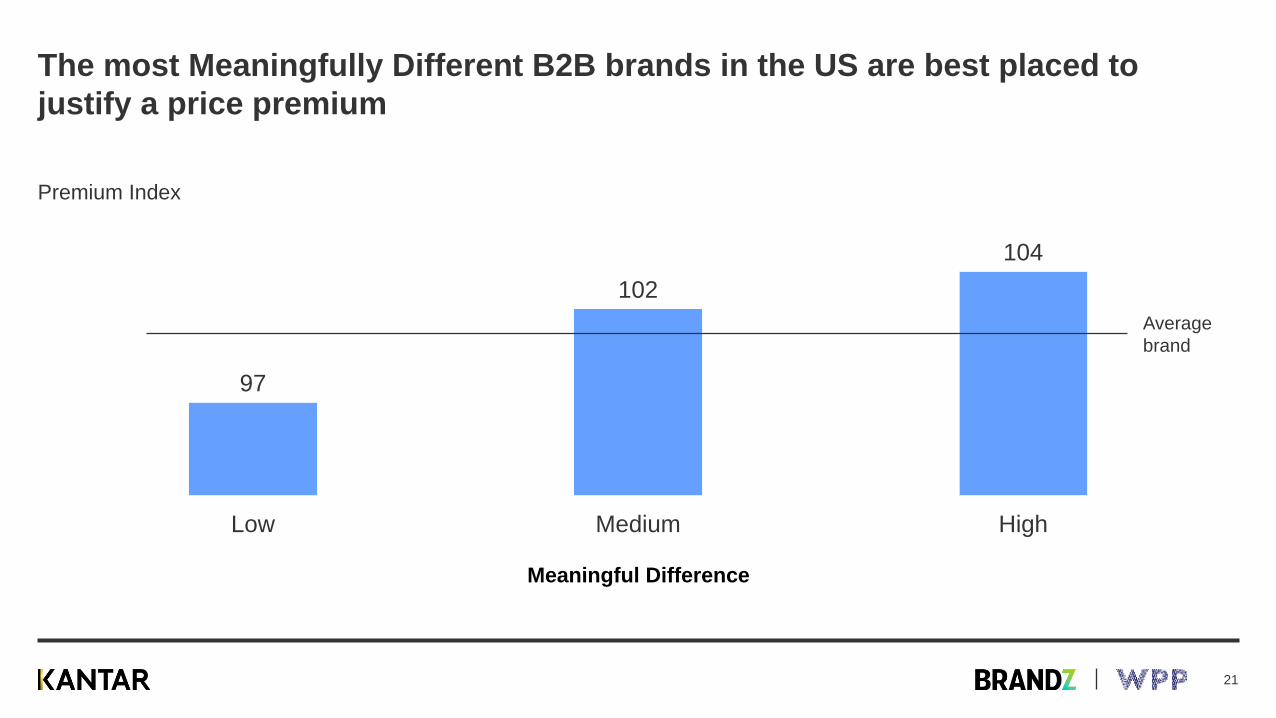
The most Meaningfully Different B2B brands in the US are best placed to
justify a price premium
Premium Index
Average
brand
104
102
97
HighMediumLow
Meaningful Difference
21
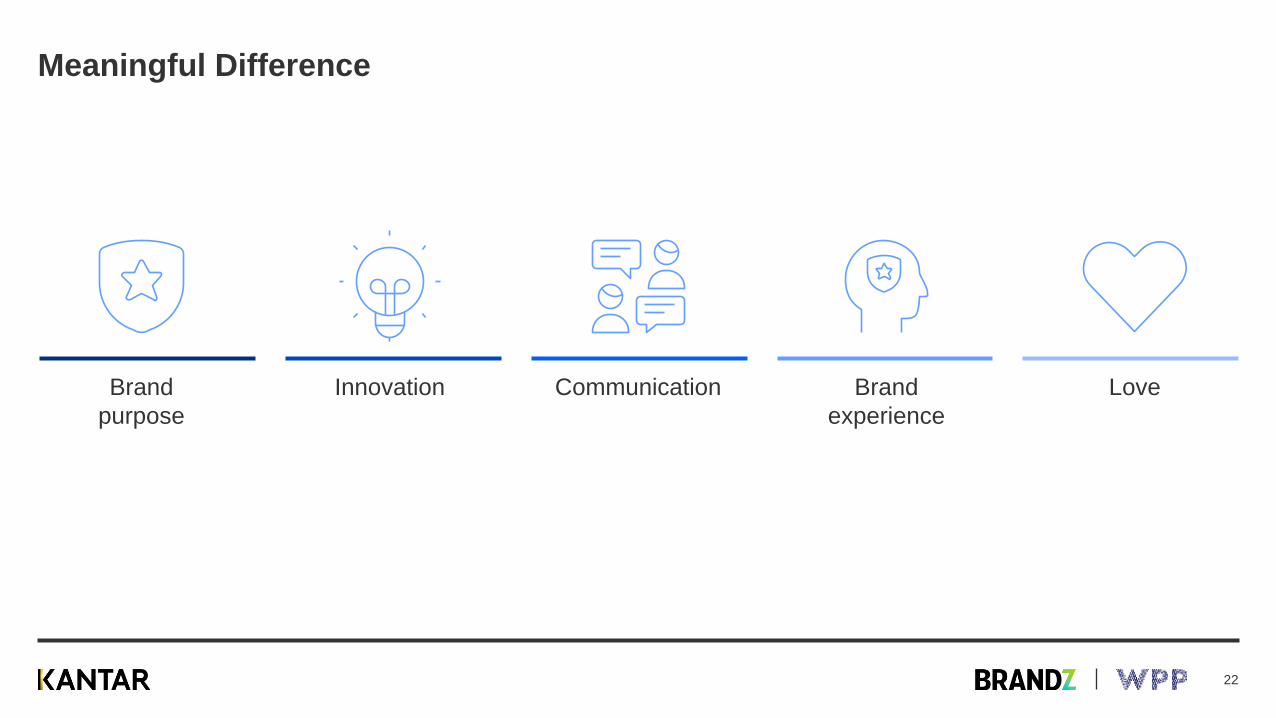
Meaningful Difference
Brand
purpose
Innovation Communication Brand
experience
Love
22
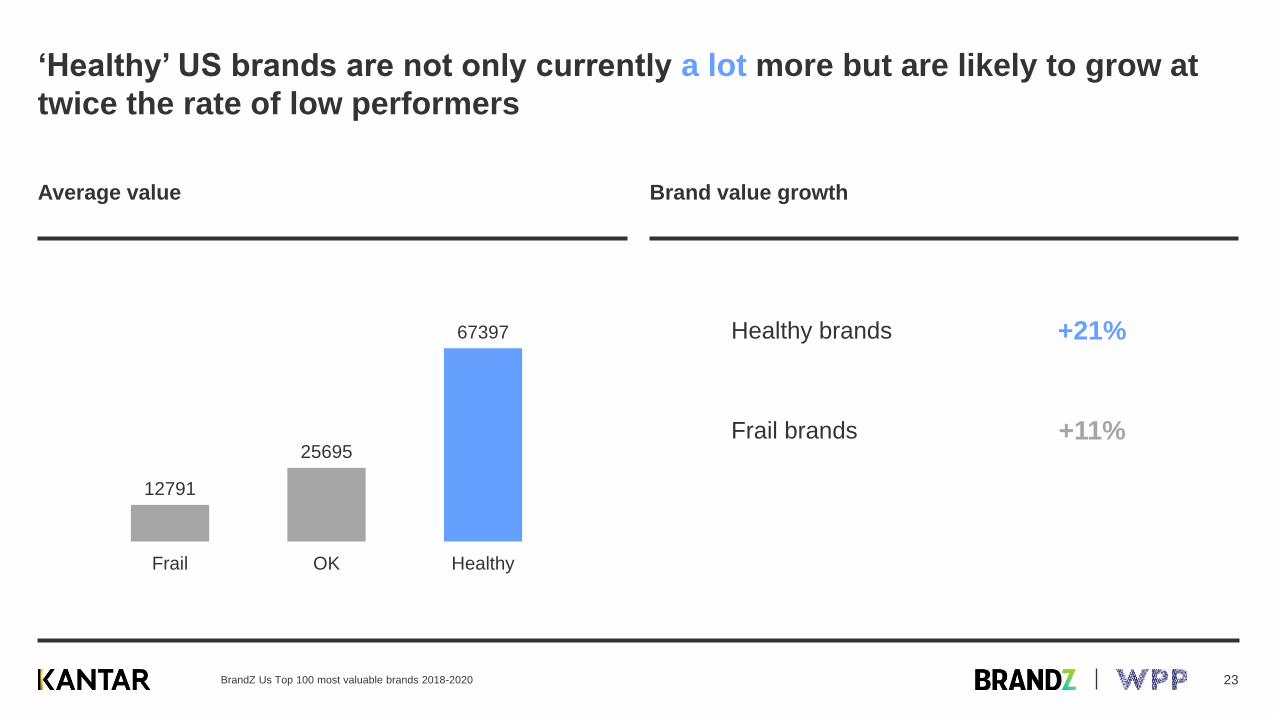
‘Healthy’ US brands are not only currently a lot more but are likely to grow at
twice the rate of low performers
Average value Brand value growth
12791
25695
67397
Frail OK Healthy
Healthy brands
Frail brands
+21%
+11%
BrandZ Us Top 100 most valuable brands 2018-2020 23
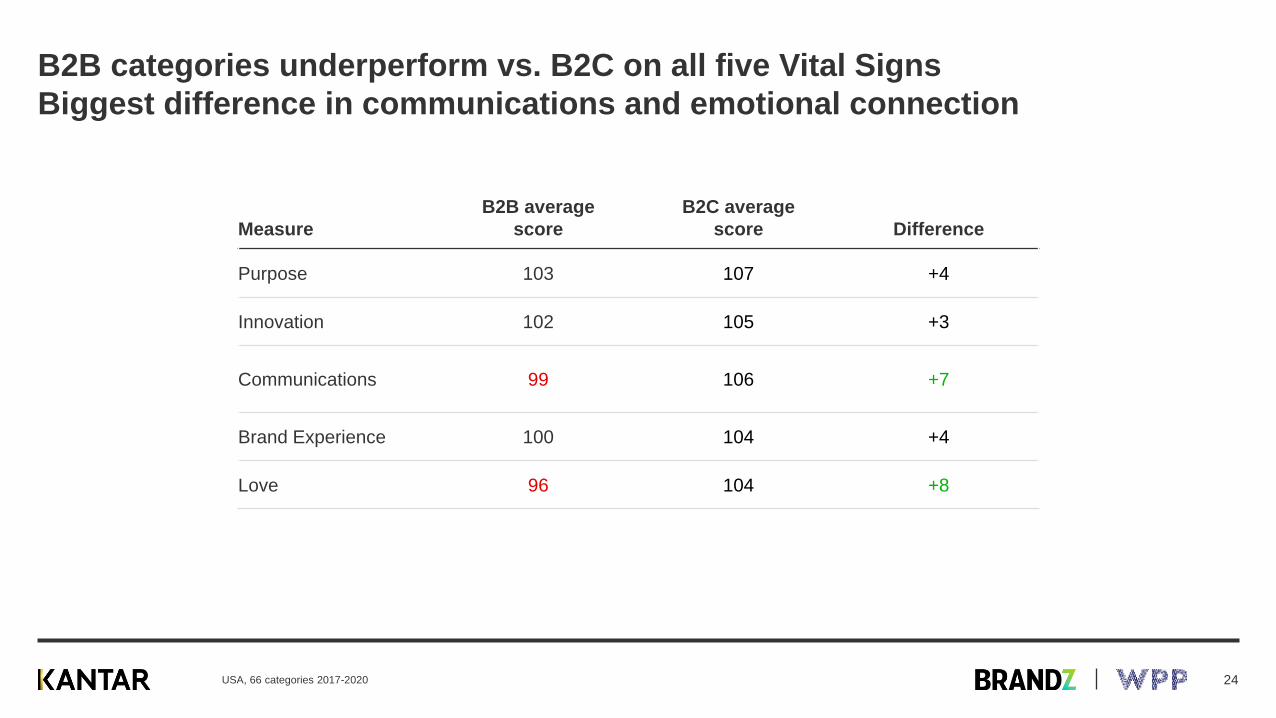
B2B categories underperform vs. B2C on all five Vital Signs
Biggest difference in communications and emotional connection
Measure
B2B average
score
B2C average
score Difference
Purpose 103 107 +4
Innovation 102 105 +3
Communications 99 106 +7
Brand Experience 100 104 +4
Love 96 104 +8
USA, 66 categories 2017-2020 24
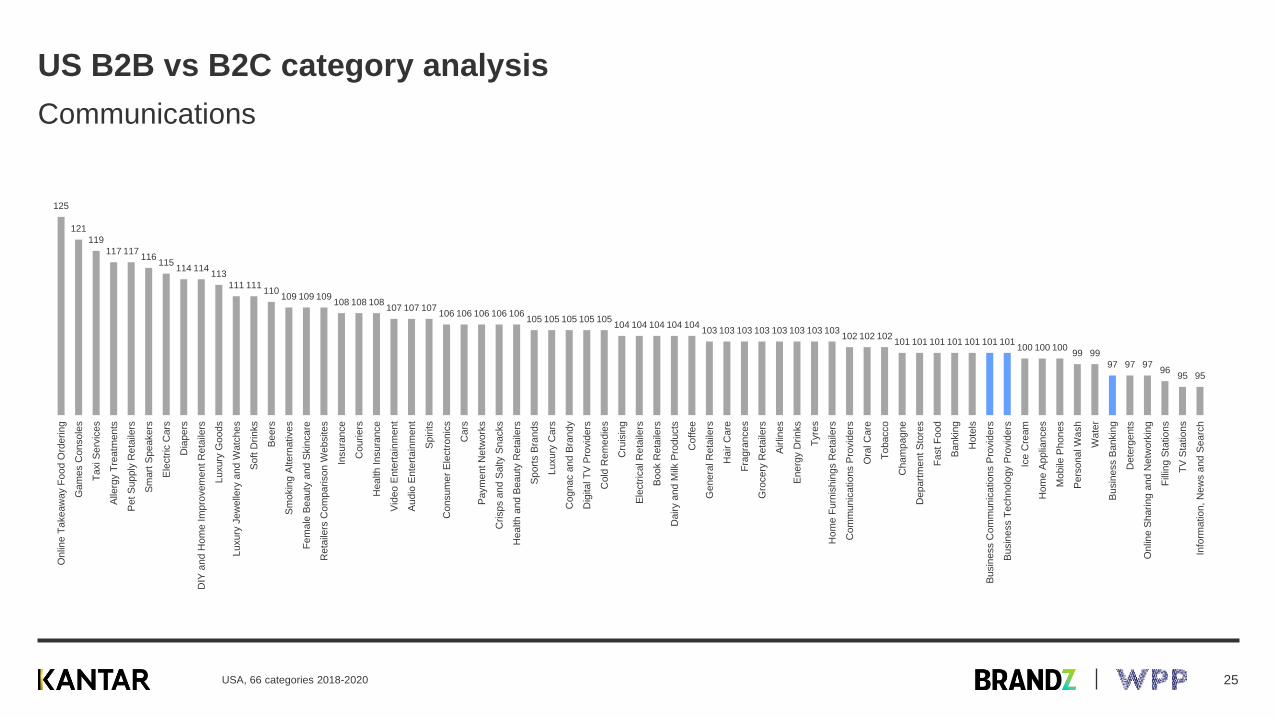
US B2B vs B2C category analysis
Communications
USA, 66 categories 2018-2020
125
121
119
117 117116
115114 114
113
111 111110
109 109 109108 108 108
107 107 107106 106 106 106 106
105 105 105 105 105104 104 104 104 104
103 103 103 103 103 103 103 103102 102 102
101 101 101 101 101 101 101100 100 100
99 99
97 97 9796
95 95
Onlin
e T
ake
aw
ay F
oo
d O
rde
ring
Gam
es C
on
so
les
Ta
xi S
erv
ices
Alle
rgy T
reatm
en
ts
Pe
t S
up
ply
Reta
ilers
Sm
art
Spe
akers
Ele
ctr
ic C
ars
Dia
pe
rs
DIY
and
Hom
e Im
pro
vem
ent
Reta
ilers
Luxury
Goods
Luxury
Je
welle
ry a
nd W
atc
he
s
So
ft D
rinks
Be
ers
Sm
okin
g A
ltern
ative
s
Fe
ma
le B
ea
uty
and
Skin
ca
re
Reta
ilers
Co
mpa
rison
Websites
Insura
nce
Couri
ers
Health I
nsura
nce
Vid
eo
Ente
rtain
men
t
Au
dio
Ente
rtain
men
t
Sp
irits
Consum
er
Ele
ctr
on
ics
Cars
Pa
ym
en
t N
etw
ork
s
Crisps a
nd S
alty S
nacks
Health a
nd
Bea
uty
Reta
ilers
Sp
ort
s B
rand
s
Luxury
Ca
rs
Cognac a
nd B
randy
Dig
ita
l T
V P
rovid
ers
Cold
Re
med
ies
Cru
isin
g
Ele
ctr
ical R
eta
ilers
Bo
ok R
eta
ilers
Dairy a
nd
Milk
Pro
ducts
Coffe
e
Genera
l R
eta
ilers
Hair C
are
Fra
gra
nce
s
Gro
cery
Reta
ilers
Air
lines
En
erg
y D
rin
ks
Tyre
s
Hom
e F
urn
ish
ings R
eta
ilers
Com
mu
nic
atio
ns P
rovid
ers
Ora
l C
are
To
ba
cco
Cham
pag
ne
Depart
ment
Sto
res
Fa
st
Fo
od
Ba
nkin
g
Hote
ls
Bu
sin
ess C
om
mun
icatio
ns P
rovid
ers
Bu
sin
ess T
ech
no
logy P
rovid
ers
Ice C
ream
Hom
e A
pp
liances
Mo
bile
Ph
on
es
Pe
rso
na
l W
ash
Wa
ter
Bu
sin
ess B
ankin
g
Dete
rge
nts
Onlin
e S
hari
ng
and N
etw
ork
ing
Fill
ing S
tatio
ns
TV
Sta
tions
Info
rma
tio
n,
New
s a
nd
Sea
rch
25
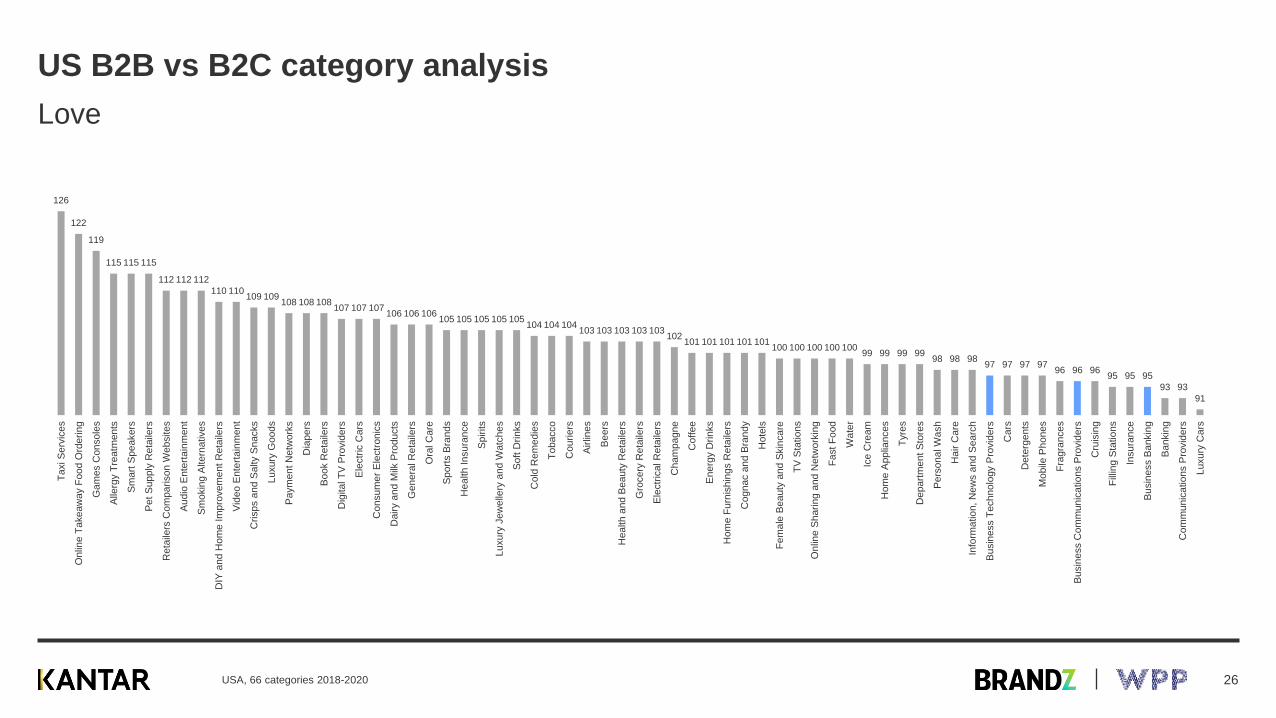
US B2B vs B2C category analysis
Love
USA, 66 categories 2018-2020
126
122
119
115 115 115
112 112 112
110 110109 109
108 108 108107 107 107
106 106 106105 105 105 105 105
104 104 104103 103 103 103 103
102101 101 101 101 101
100 100 100 100 10099 99 99 99
98 98 9897 97 97 97
96 96 9695 95 95
93 93
91
Ta
xi S
erv
ices
Onlin
e T
ake
aw
ay F
oo
d O
rde
ring
Gam
es C
on
so
les
Alle
rgy T
reatm
en
ts
Sm
art
Spe
akers
Pe
t S
up
ply
Reta
ilers
Reta
ilers
Co
mpa
rison
Websites
Au
dio
Ente
rtain
men
t
Sm
okin
g A
ltern
ative
s
DIY
and
Hom
e Im
pro
vem
ent
Reta
ilers
Vid
eo
Ente
rtain
men
t
Crisps a
nd S
alty S
nacks
Luxury
Goods
Pa
ym
en
t N
etw
ork
s
Dia
pe
rs
Bo
ok R
eta
ilers
Dig
ita
l T
V P
rovid
ers
Ele
ctr
ic C
ars
Consum
er
Ele
ctr
on
ics
Dairy a
nd
Milk
Pro
ducts
Genera
l R
eta
ilers
Ora
l C
are
Sp
ort
s B
rand
s
Health I
nsura
nce
Sp
irits
Luxury
Je
welle
ry a
nd W
atc
he
s
So
ft D
rinks
Cold
Re
med
ies
To
ba
cco
Couri
ers
Air
lines
Be
ers
Health a
nd
Bea
uty
Reta
ilers
Gro
cery
Reta
ilers
Ele
ctr
ical R
eta
ilers
Cham
pag
ne
Coffe
e
En
erg
y D
rin
ks
Hom
e F
urn
ish
ings R
eta
ilers
Cognac a
nd B
randy
Hote
ls
Fe
ma
le B
ea
uty
and
Skin
ca
re
TV
Sta
tions
Onlin
e S
hari
ng
and N
etw
ork
ing
Fa
st
Fo
od
Wa
ter
Ice C
ream
Hom
e A
pp
liances
Tyre
s
Depart
ment
Sto
res
Pe
rso
na
l W
ash
Hair C
are
Info
rma
tio
n,
New
s a
nd
Sea
rch
Bu
sin
ess T
ech
no
logy P
rovid
ers
Cars
Dete
rge
nts
Mo
bile
Ph
on
es
Fra
gra
nce
s
Bu
sin
ess C
om
mun
icatio
ns P
rovid
ers
Cru
isin
g
Fill
ing S
tatio
ns
Insura
nce
Bu
sin
ess B
ankin
g
Ba
nkin
g
Com
mu
nic
atio
ns P
rovid
ers
Luxury
Ca
rs
26

4
Summing up
27
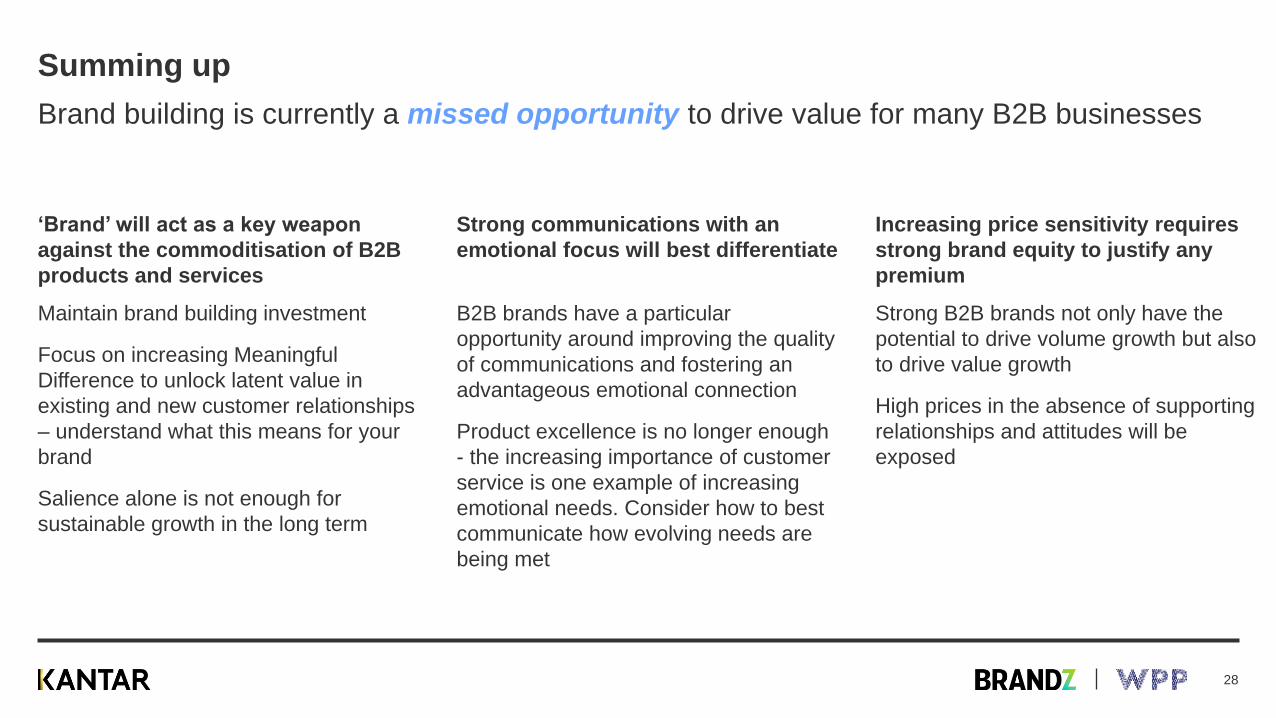
Summing up
‘Brand’ will act as a key weapon
against the commoditisation of B2B
products and services
Maintain brand building investment
Focus on increasing Meaningful
Difference to unlock latent value in
existing and new customer relationships
– understand what this means for your
brand
Salience alone is not enough for
sustainable growth in the long term
Strong communications with an
emotional focus will best differentiate
B2B brands have a particular
opportunity around improving the quality
of communications and fostering an
advantageous emotional connection
Product excellence is no longer enough
- the increasing importance of customer
service is one example of increasing
emotional needs. Consider how to best
communicate how evolving needs are
being met
Increasing price sensitivity requires
strong brand equity to justify any
premium
Strong B2B brands not only have the
potential to drive volume growth but also
to drive value growth
High prices in the absence of supporting
relationships and attitudes will be
exposed
Brand building is currently a missed opportunity to drive value for many B2B businesses
28
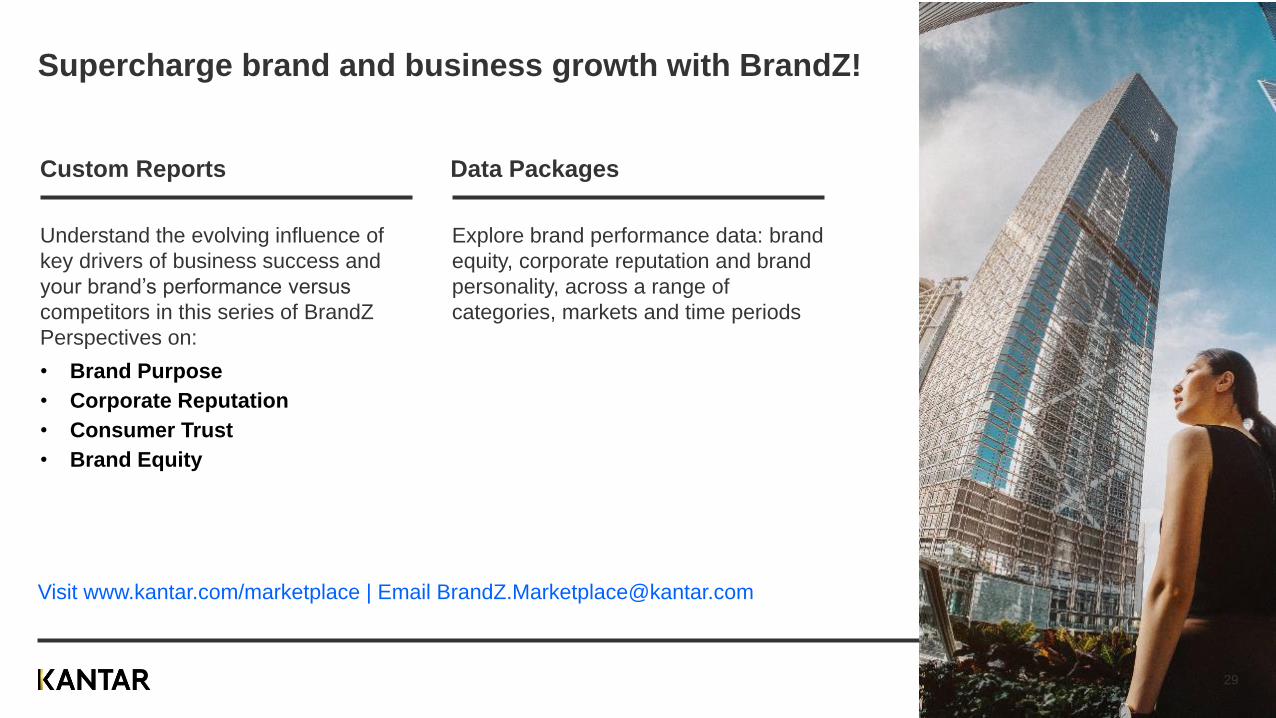
Supercharge brand and business growth with BrandZ!
Custom Reports
Understand the evolving influence of
key drivers of business success and
your brand’s performance versus
competitors in this series of BrandZ
Perspectives on:
• Brand Purpose
• Corporate Reputation
• Consumer Trust
• Brand Equity
Data Packages
Explore brand performance data: brand
equity, corporate reputation and brand
personality, across a range of
categories, markets and time periods
Visit www.kantar.com/marketplace | Email [email protected]
29

B2B?
Think ‘brand’ to build!
Unlocking growth in B2B
Martin Guerrieria
Global Head of Research, BrandZ
October 2020