Embed Size (px)
Citation preview

B16001 LANGUAGE SPOKEN AT HOME BY ABILITY TO SPEAK ENGLISH FOR THE POPULATION 5 YEARS AND OVER Universe: Population 5 years and over 2011-2015 American Community Survey 5-Year Estimates
Supporting documentation on code lists, subject definitions, data accuracy, and statistical testing can be found on the American Community Survey website in the Data and Documentation section.
Sample size and data quality measures (including coverage rates, allocation rates, and response rates) can be found on the American Community Survey website in the Methodology section.
Tell us what you think. Provide feedback to help make American Community Survey data more useful for you.
Although the American Community Survey (ACS) produces population, demographic and housing unit estimates, it is the Census Bureau's Population Estimates Program that produces and disseminates the official estimates of the population for the nation, states, counties, cities and towns and estimates of housing units for states and counties.
Adams County, Wisconsin
Estimate Margin of Error Total: 19,707 +/-29 Speak only English 18,818 +/-102 Spanish or Spanish Creole: 497 +/-75 Speak English "very well" 303 +/-59 Speak English less than "very well" 194 +/-67
French (incl. Patois, Cajun): 12 +/-10 Speak English "very well" 10 +/-9 Speak English less than "very well" 2 +/-4
French Creole: 0 +/-16 Speak English "very well" 0 +/-16 Speak English less than "very well" 0 +/-16
Italian: 4 +/-5 Speak English "very well" 4 +/-5 Speak English less than "very well" 0 +/-16
Portuguese or Portuguese Creole: 12 +/-18 Speak English "very well" 12 +/-18 Speak English less than "very well" 0 +/-16
German: 83 +/-33 Speak English "very well" 70 +/-31 Speak English less than "very well" 13 +/-12
Yiddish: 0 +/-16 Speak English "very well" 0 +/-16 Speak English less than "very well" 0 +/-16
Other West Germanic languages: 0 +/-16 Speak English "very well" 0 +/-16 Speak English less than "very well" 0 +/-16
Scandinavian languages: 0 +/-16 Speak English "very well" 0 +/-16 Speak English less than "very well" 0 +/-16
Greek: 0 +/-16 Speak English "very well" 0 +/-16 Speak English less than "very well" 0 +/-16
1 of 4 12/16/2016

Adams County, Wisconsin
Estimate Margin of Error Russian: 18 +/-16 Speak English "very well" 3 +/-4 Speak English less than "very well" 15 +/-15
Polish: 128 +/-43 Speak English "very well" 54 +/-28 Speak English less than "very well" 74 +/-26
Serbo-Croatian: 41 +/-26 Speak English "very well" 14 +/-11 Speak English less than "very well" 27 +/-20
Other Slavic languages: 14 +/-10 Speak English "very well" 11 +/-9 Speak English less than "very well" 3 +/-4
Armenian: 0 +/-16 Speak English "very well" 0 +/-16 Speak English less than "very well" 0 +/-16
Persian: 0 +/-16 Speak English "very well" 0 +/-16 Speak English less than "very well" 0 +/-16
Gujarati: 0 +/-16 Speak English "very well" 0 +/-16 Speak English less than "very well" 0 +/-16
Hindi: 4 +/-6 Speak English "very well" 4 +/-6 Speak English less than "very well" 0 +/-16
Urdu: 0 +/-16 Speak English "very well" 0 +/-16 Speak English less than "very well" 0 +/-16
Other Indic languages: 0 +/-16 Speak English "very well" 0 +/-16 Speak English less than "very well" 0 +/-16
Other Indo-European languages: 0 +/-16 Speak English "very well" 0 +/-16 Speak English less than "very well" 0 +/-16
Chinese: 0 +/-16 Speak English "very well" 0 +/-16 Speak English less than "very well" 0 +/-16
Japanese: 4 +/-5 Speak English "very well" 4 +/-5 Speak English less than "very well" 0 +/-16
Korean: 6 +/-5 Speak English "very well" 3 +/-4 Speak English less than "very well" 3 +/-4
Mon-Khmer, Cambodian: 0 +/-16 Speak English "very well" 0 +/-16 Speak English less than "very well" 0 +/-16
Hmong: 0 +/-16 Speak English "very well" 0 +/-16 Speak English less than "very well" 0 +/-16
Thai: 0 +/-16 Speak English "very well" 0 +/-16 Speak English less than "very well" 0 +/-16
Laotian: 0 +/-16 Speak English "very well" 0 +/-16 Speak English less than "very well" 0 +/-16
Vietnamese: 0 +/-16 Speak English "very well" 0 +/-16 Speak English less than "very well" 0 +/-16
Other Asian languages: 19 +/-27 Speak English "very well" 19 +/-27
2 of 4 12/16/2016

Adams County, Wisconsin
Estimate Margin of Error Speak English less than "very well" 0 +/-16
Tagalog: 1 +/-2 Speak English "very well" 1 +/-2 Speak English less than "very well" 0 +/-16
Other Pacific Island languages: 0 +/-16 Speak English "very well" 0 +/-16 Speak English less than "very well" 0 +/-16
Navajo: 0 +/-16 Speak English "very well" 0 +/-16 Speak English less than "very well" 0 +/-16
Other Native North American languages: 39 +/-34 Speak English "very well" 39 +/-34 Speak English less than "very well" 0 +/-16
Hungarian: 0 +/-16 Speak English "very well" 0 +/-16 Speak English less than "very well" 0 +/-16
Arabic: 0 +/-16 Speak English "very well" 0 +/-16 Speak English less than "very well" 0 +/-16
Hebrew: 0 +/-16 Speak English "very well" 0 +/-16 Speak English less than "very well" 0 +/-16
African languages: 0 +/-16 Speak English "very well" 0 +/-16 Speak English less than "very well" 0 +/-16
Other and unspecified languages: 7 +/-7 Speak English "very well" 7 +/-7 Speak English less than "very well" 0 +/-16
Data are based on a sample and are subject to sampling variability. The degree of uncertainty for an estimate arising from sampling variability is represented through the use of a margin of error. The value shown here is the 90 percent margin of error. The margin of error can be interpreted roughly as providing a 90 percent probability that the interval defined by the estimate minus the margin of error and the estimate plus the margin of error (the lower and upper confidence bounds) contains the true value. In addition to sampling variability, the ACS estimates are subject to nonsampling error (for a discussion of nonsampling variability, see Accuracy of the Data). The effect of nonsampling error is not represented in these tables.
Methodological changes to data collection in 2013 may have affected language data for 2013. Users should be aware of these changes when using multi-year data containing data from 2013. For more information, see: Language User Note.
While the 2011-2015 American Community Survey (ACS) data generally reflect the February 2013 Office of Management and Budget (OMB) definitions of metropolitan and micropolitan statistical areas; in certain instances the names, codes, and boundaries of the principal cities shown in ACS tables may differ from the OMB definitions due to differences in the effective dates of the geographic entities.
Estimates of urban and rural population, housing units, and characteristics reflect boundaries of urban areas defined based on Census 2010 data. As a result, data for urban and rural areas from the ACS do not necessarily reflect the results of ongoing urbanization.
Source: U.S. Census Bureau, 2011-2015 American Community Survey 5-Year Estimates
Explanation of Symbols:
1. An '**' entry in the margin of error column indicates that either no sample observations or too few sample observations were available to compute a standard error and thus the margin of error. A statistical test is not appropriate.
2. An '-' entry in the estimate column indicates that either no sample observations or too few sample observations were available to compute an estimate, or a ratio of medians cannot be calculated because one or both of the median estimates falls in the lowest interval or upper interval of an open-ended distribution.
3. An '-' following a median estimate means the median falls in the lowest interval of an open-ended distribution. 4. An '+' following a median estimate means the median falls in the upper interval of an open-ended distribution. 5. An '***' entry in the margin of error column indicates that the median falls in the lowest interval or upper interval of an open-ended distribution. A
statistical test is not appropriate. 6. An '*****' entry in the margin of error column indicates that the estimate is controlled. A statistical test for sampling variability is not appropriate.
3 of 4 12/16/2016

7. An 'N' entry in the estimate and margin of error columns indicates that data for this geographic area cannot be displayed because the number of sample cases is too small.
8. An '(X)' means that the estimate is not applicable or not available.

B16001 LANGUAGE SPOKEN AT HOME BY ABILITY TO SPEAK ENGLISH FOR THE POPULATION 5 YEARS AND OVER Universe: Population 5 years and over 2011-2015 American Community Survey 5-Year Estimates
Supporting documentation on code lists, subject definitions, data accuracy, and statistical testing can be found on the American Community Survey website in the Data and Documentation section.
Sample size and data quality measures (including coverage rates, allocation rates, and response rates) can be found on the American Community Survey website in the Methodology section.
Tell us what you think. Provide feedback to help make American Community Survey data more useful for you.
Although the American Community Survey (ACS) produces population, demographic and housing unit estimates, it is the Census Bureau's Population Estimates Program that produces and disseminates the official estimates of the population for the nation, states, counties, cities and towns and estimates of housing units for states and counties.
Ashland County, Wisconsin
Estimate Margin of Error Total: 15,073 +/-23 Speak only English 14,643 +/-97 Spanish or Spanish Creole: 152 +/-57 Speak English "very well" 107 +/-45 Speak English less than "very well" 45 +/-33
French (incl. Patois, Cajun): 0 +/-14 Speak English "very well" 0 +/-14 Speak English less than "very well" 0 +/-14
French Creole: 0 +/-14 Speak English "very well" 0 +/-14 Speak English less than "very well" 0 +/-14
Italian: 11 +/-16 Speak English "very well" 11 +/-16 Speak English less than "very well" 0 +/-14
Portuguese or Portuguese Creole: 9 +/-15 Speak English "very well" 9 +/-15 Speak English less than "very well" 0 +/-14
German: 46 +/-33 Speak English "very well" 46 +/-33 Speak English less than "very well" 0 +/-14
Yiddish: 0 +/-14 Speak English "very well" 0 +/-14 Speak English less than "very well" 0 +/-14
Other West Germanic languages: 0 +/-14 Speak English "very well" 0 +/-14 Speak English less than "very well" 0 +/-14
Scandinavian languages: 0 +/-14 Speak English "very well" 0 +/-14 Speak English less than "very well" 0 +/-14
Greek: 0 +/-14 Speak English "very well" 0 +/-14 Speak English less than "very well" 0 +/-14
1 of 4 12/16/2016

Ashland County, Wisconsin
Estimate Margin of Error Russian: 1 +/-2 Speak English "very well" 1 +/-2 Speak English less than "very well" 0 +/-14
Polish: 6 +/-5 Speak English "very well" 6 +/-5 Speak English less than "very well" 0 +/-14
Serbo-Croatian: 2 +/-3 Speak English "very well" 2 +/-3 Speak English less than "very well" 0 +/-14
Other Slavic languages: 2 +/-2 Speak English "very well" 2 +/-2 Speak English less than "very well" 0 +/-14
Armenian: 0 +/-14 Speak English "very well" 0 +/-14 Speak English less than "very well" 0 +/-14
Persian: 0 +/-14 Speak English "very well" 0 +/-14 Speak English less than "very well" 0 +/-14
Gujarati: 0 +/-14 Speak English "very well" 0 +/-14 Speak English less than "very well" 0 +/-14
Hindi: 0 +/-14 Speak English "very well" 0 +/-14 Speak English less than "very well" 0 +/-14
Urdu: 0 +/-14 Speak English "very well" 0 +/-14 Speak English less than "very well" 0 +/-14
Other Indic languages: 0 +/-14 Speak English "very well" 0 +/-14 Speak English less than "very well" 0 +/-14
Other Indo-European languages: 0 +/-14 Speak English "very well" 0 +/-14 Speak English less than "very well" 0 +/-14
Chinese: 5 +/-9 Speak English "very well" 5 +/-9 Speak English less than "very well" 0 +/-14
Japanese: 4 +/-5 Speak English "very well" 4 +/-5 Speak English less than "very well" 0 +/-14
Korean: 5 +/-5 Speak English "very well" 5 +/-5 Speak English less than "very well" 0 +/-14
Mon-Khmer, Cambodian: 0 +/-14 Speak English "very well" 0 +/-14 Speak English less than "very well" 0 +/-14
Hmong: 2 +/-5 Speak English "very well" 2 +/-5 Speak English less than "very well" 0 +/-14
Thai: 0 +/-14 Speak English "very well" 0 +/-14 Speak English less than "very well" 0 +/-14
Laotian: 28 +/-27 Speak English "very well" 23 +/-29 Speak English less than "very well" 5 +/-8
Vietnamese: 11 +/-15 Speak English "very well" 11 +/-15 Speak English less than "very well" 0 +/-14
Other Asian languages: 3 +/-6 Speak English "very well" 3 +/-6
2 of 4 12/16/2016

Ashland County, Wisconsin
Estimate Margin of Error Speak English less than "very well" 0 +/-14
Tagalog: 1 +/-2 Speak English "very well" 1 +/-2 Speak English less than "very well" 0 +/-14
Other Pacific Island languages: 0 +/-14 Speak English "very well" 0 +/-14 Speak English less than "very well" 0 +/-14
Navajo: 0 +/-14 Speak English "very well" 0 +/-14 Speak English less than "very well" 0 +/-14
Other Native North American languages: 127 +/-54 Speak English "very well" 110 +/-51 Speak English less than "very well" 17 +/-23
Hungarian: 0 +/-14 Speak English "very well" 0 +/-14 Speak English less than "very well" 0 +/-14
Arabic: 2 +/-3 Speak English "very well" 2 +/-3 Speak English less than "very well" 0 +/-14
Hebrew: 0 +/-14 Speak English "very well" 0 +/-14 Speak English less than "very well" 0 +/-14
African languages: 0 +/-14 Speak English "very well" 0 +/-14 Speak English less than "very well" 0 +/-14
Other and unspecified languages: 13 +/-8 Speak English "very well" 11 +/-8 Speak English less than "very well" 2 +/-3
Data are based on a sample and are subject to sampling variability. The degree of uncertainty for an estimate arising from sampling variability is represented through the use of a margin of error. The value shown here is the 90 percent margin of error. The margin of error can be interpreted roughly as providing a 90 percent probability that the interval defined by the estimate minus the margin of error and the estimate plus the margin of error (the lower and upper confidence bounds) contains the true value. In addition to sampling variability, the ACS estimates are subject to nonsampling error (for a discussion of nonsampling variability, see Accuracy of the Data). The effect of nonsampling error is not represented in these tables.
Methodological changes to data collection in 2013 may have affected language data for 2013. Users should be aware of these changes when using multi-year data containing data from 2013. For more information, see: Language User Note.
While the 2011-2015 American Community Survey (ACS) data generally reflect the February 2013 Office of Management and Budget (OMB) definitions of metropolitan and micropolitan statistical areas; in certain instances the names, codes, and boundaries of the principal cities shown in ACS tables may differ from the OMB definitions due to differences in the effective dates of the geographic entities.
Estimates of urban and rural population, housing units, and characteristics reflect boundaries of urban areas defined based on Census 2010 data. As a result, data for urban and rural areas from the ACS do not necessarily reflect the results of ongoing urbanization.
Source: U.S. Census Bureau, 2011-2015 American Community Survey 5-Year Estimates
Explanation of Symbols:
1. An '**' entry in the margin of error column indicates that either no sample observations or too few sample observations were available to compute a standard error and thus the margin of error. A statistical test is not appropriate.
2. An '-' entry in the estimate column indicates that either no sample observations or too few sample observations were available to compute an estimate, or a ratio of medians cannot be calculated because one or both of the median estimates falls in the lowest interval or upper interval of an open-ended distribution.
3. An '-' following a median estimate means the median falls in the lowest interval of an open-ended distribution. 4. An '+' following a median estimate means the median falls in the upper interval of an open-ended distribution. 5. An '***' entry in the margin of error column indicates that the median falls in the lowest interval or upper interval of an open-ended distribution. A
statistical test is not appropriate. 6. An '*****' entry in the margin of error column indicates that the estimate is controlled. A statistical test for sampling variability is not appropriate.
3 of 4 12/16/2016

7. An 'N' entry in the estimate and margin of error columns indicates that data for this geographic area cannot be displayed because the number of sample cases is too small.
8. An '(X)' means that the estimate is not applicable or not available.

B16001 LANGUAGE SPOKEN AT HOME BY ABILITY TO SPEAK ENGLISH FOR THE POPULATION 5 YEARS AND OVER Universe: Population 5 years and over 2011-2015 American Community Survey 5-Year Estimates
Supporting documentation on code lists, subject definitions, data accuracy, and statistical testing can be found on the American Community Survey website in the Data and Documentation section.
Sample size and data quality measures (including coverage rates, allocation rates, and response rates) can be found on the American Community Survey website in the Methodology section.
Tell us what you think. Provide feedback to help make American Community Survey data more useful for you.
Although the American Community Survey (ACS) produces population, demographic and housing unit estimates, it is the Census Bureau's Population Estimates Program that produces and disseminates the official estimates of the population for the nation, states, counties, cities and towns and estimates of housing units for states and counties.
Barron County, Wisconsin
Estimate Margin of Error Total: 43,111 +/-54 Speak only English 41,203 +/-395 Spanish or Spanish Creole: 737 +/-127 Speak English "very well" 443 +/-133 Speak English less than "very well" 294 +/-110
French (incl. Patois, Cajun): 53 +/-32 Speak English "very well" 25 +/-19 Speak English less than "very well" 28 +/-26
French Creole: 0 +/-18 Speak English "very well" 0 +/-18 Speak English less than "very well" 0 +/-18
Italian: 34 +/-32 Speak English "very well" 15 +/-21 Speak English less than "very well" 19 +/-26
Portuguese or Portuguese Creole: 0 +/-18 Speak English "very well" 0 +/-18 Speak English less than "very well" 0 +/-18
German: 356 +/-151 Speak English "very well" 276 +/-140 Speak English less than "very well" 80 +/-43
Yiddish: 0 +/-18 Speak English "very well" 0 +/-18 Speak English less than "very well" 0 +/-18
Other West Germanic languages: 56 +/-36 Speak English "very well" 33 +/-25 Speak English less than "very well" 23 +/-24
Scandinavian languages: 28 +/-12 Speak English "very well" 23 +/-13 Speak English less than "very well" 5 +/-7
Greek: 0 +/-18 Speak English "very well" 0 +/-18 Speak English less than "very well" 0 +/-18
1 of 4 12/16/2016
Barron County, Wisconsin
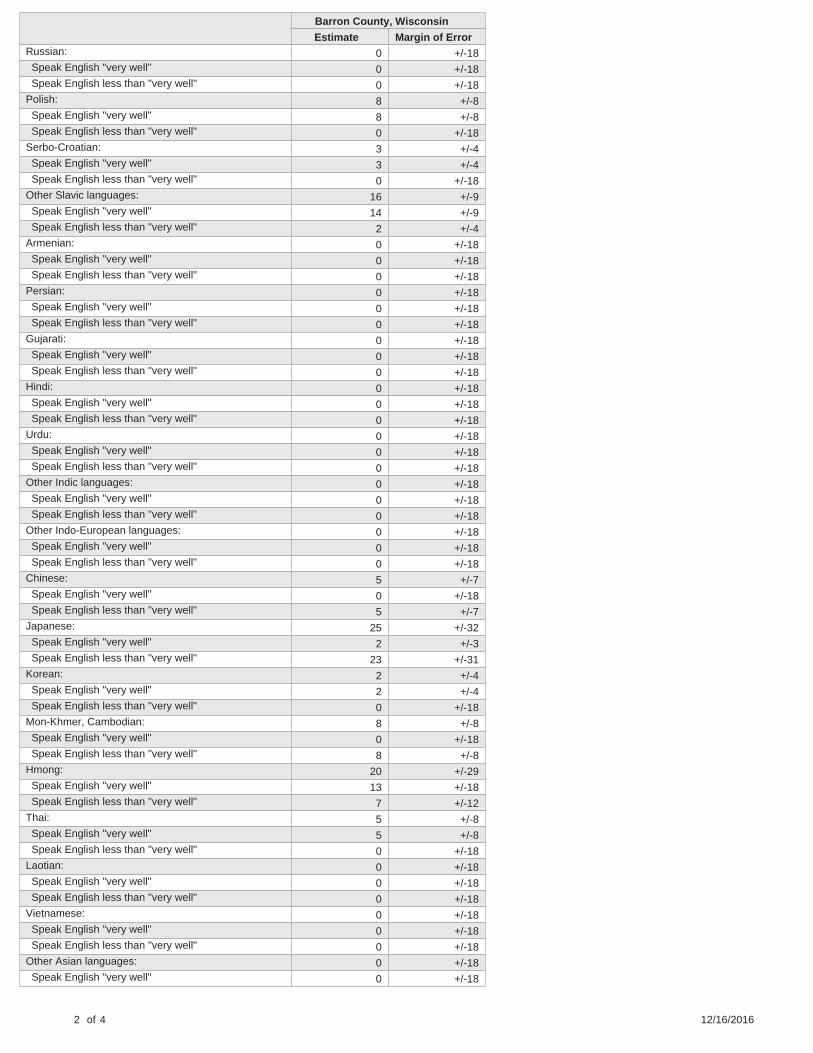
Estimate Margin of Error Russian: 0 +/-18 Speak English "very well" 0 +/-18 Speak English less than "very well" 0 +/-18
Polish: 8 +/-8 Speak English "very well" 8 +/-8 Speak English less than "very well" 0 +/-18
Serbo-Croatian: 3 +/-4 Speak English "very well" 3 +/-4 Speak English less than "very well" 0 +/-18
Other Slavic languages: 16 +/-9 Speak English "very well" 14 +/-9 Speak English less than "very well" 2 +/-4
Armenian: 0 +/-18 Speak English "very well" 0 +/-18 Speak English less than "very well" 0 +/-18
Persian: 0 +/-18 Speak English "very well" 0 +/-18 Speak English less than "very well" 0 +/-18
Gujarati: 0 +/-18 Speak English "very well" 0 +/-18 Speak English less than "very well" 0 +/-18
Hindi: 0 +/-18 Speak English "very well" 0 +/-18 Speak English less than "very well" 0 +/-18
Urdu: 0 +/-18 Speak English "very well" 0 +/-18 Speak English less than "very well" 0 +/-18
Other Indic languages: 0 +/-18 Speak English "very well" 0 +/-18 Speak English less than "very well" 0 +/-18
Other Indo-European languages: 0 +/-18 Speak English "very well" 0 +/-18 Speak English less than "very well" 0 +/-18
Chinese: 5 +/-7 Speak English "very well" 0 +/-18 Speak English less than "very well" 5 +/-7
Japanese: 25 +/-32 Speak English "very well" 2 +/-3 Speak English less than "very well" 23 +/-31
Korean: 2 +/-4 Speak English "very well" 2 +/-4 Speak English less than "very well" 0 +/-18
Mon-Khmer, Cambodian: 8 +/-8 Speak English "very well" 0 +/-18 Speak English less than "very well" 8 +/-8
Hmong: 20 +/-29 Speak English "very well" 13 +/-18 Speak English less than "very well" 7 +/-12
Thai: 5 +/-8 Speak English "very well" 5 +/-8 Speak English less than "very well" 0 +/-18
Laotian: 0 +/-18 Speak English "very well" 0 +/-18 Speak English less than "very well" 0 +/-18
Vietnamese: 0 +/-18 Speak English "very well" 0 +/-18 Speak English less than "very well" 0 +/-18
Other Asian languages: 0 +/-18 Speak English "very well" 0 +/-18
2 of 4 12/16/2016

Barron County, Wisconsin
Estimate Margin of Error Speak English less than "very well" 0 +/-18
Tagalog: 49 +/-36 Speak English "very well" 26 +/-19 Speak English less than "very well" 23 +/-20
Other Pacific Island languages: 7 +/-7 Speak English "very well" 5 +/-6 Speak English less than "very well" 2 +/-4
Navajo: 0 +/-18 Speak English "very well" 0 +/-18 Speak English less than "very well" 0 +/-18
Other Native North American languages: 57 +/-34 Speak English "very well" 52 +/-35 Speak English less than "very well" 5 +/-5
Hungarian: 2 +/-4 Speak English "very well" 2 +/-4 Speak English less than "very well" 0 +/-18
Arabic: 26 +/-23 Speak English "very well" 24 +/-21 Speak English less than "very well" 2 +/-4
Hebrew: 0 +/-18 Speak English "very well" 0 +/-18 Speak English less than "very well" 0 +/-18
African languages: 411 +/-286 Speak English "very well" 0 +/-18 Speak English less than "very well" 411 +/-286
Other and unspecified languages: 0 +/-18 Speak English "very well" 0 +/-18 Speak English less than "very well" 0 +/-18
Data are based on a sample and are subject to sampling variability. The degree of uncertainty for an estimate arising from sampling variability is represented through the use of a margin of error. The value shown here is the 90 percent margin of error. The margin of error can be interpreted roughly as providing a 90 percent probability that the interval defined by the estimate minus the margin of error and the estimate plus the margin of error (the lower and upper confidence bounds) contains the true value. In addition to sampling variability, the ACS estimates are subject to nonsampling error (for a discussion of nonsampling variability, see Accuracy of the Data). The effect of nonsampling error is not represented in these tables.
Methodological changes to data collection in 2013 may have affected language data for 2013. Users should be aware of these changes when using multi-year data containing data from 2013. For more information, see: Language User Note.
While the 2011-2015 American Community Survey (ACS) data generally reflect the February 2013 Office of Management and Budget (OMB) definitions of metropolitan and micropolitan statistical areas; in certain instances the names, codes, and boundaries of the principal cities shown in ACS tables may differ from the OMB definitions due to differences in the effective dates of the geographic entities.
Estimates of urban and rural population, housing units, and characteristics reflect boundaries of urban areas defined based on Census 2010 data. As a result, data for urban and rural areas from the ACS do not necessarily reflect the results of ongoing urbanization.
Source: U.S. Census Bureau, 2011-2015 American Community Survey 5-Year Estimates
Explanation of Symbols:
1. An '**' entry in the margin of error column indicates that either no sample observations or too few sample observations were available to compute a standard error and thus the margin of error. A statistical test is not appropriate.
2. An '-' entry in the estimate column indicates that either no sample observations or too few sample observations were available to compute an estimate, or a ratio of medians cannot be calculated because one or both of the median estimates falls in the lowest interval or upper interval of an open-ended distribution.
3. An '-' following a median estimate means the median falls in the lowest interval of an open-ended distribution. 4. An '+' following a median estimate means the median falls in the upper interval of an open-ended distribution. 5. An '***' entry in the margin of error column indicates that the median falls in the lowest interval or upper interval of an open-ended distribution. A
statistical test is not appropriate. 6. An '*****' entry in the margin of error column indicates that the estimate is controlled. A statistical test for sampling variability is not appropriate.
3 of 4 12/16/2016

7. An 'N' entry in the estimate and margin of error columns indicates that data for this geographic area cannot be displayed because the number of sample cases is too small.
8. An '(X)' means that the estimate is not applicable or not available.

B16001 LANGUAGE SPOKEN AT HOME BY ABILITY TO SPEAK ENGLISH FOR THE POPULATION 5 YEARS AND OVER Universe: Population 5 years and over 2011-2015 American Community Survey 5-Year Estimates
Supporting documentation on code lists, subject definitions, data accuracy, and statistical testing can be found on the American Community Survey website in the Data and Documentation section.
Sample size and data quality measures (including coverage rates, allocation rates, and response rates) can be found on the American Community Survey website in the Methodology section.
Tell us what you think. Provide feedback to help make American Community Survey data more useful for you.
Although the American Community Survey (ACS) produces population, demographic and housing unit estimates, it is the Census Bureau's Population Estimates Program that produces and disseminates the official estimates of the population for the nation, states, counties, cities and towns and estimates of housing units for states and counties.
Bayfield County, Wisconsin
Estimate Margin of Error Total: 14,431 +/-17 Speak only English 13,918 +/-69 Spanish or Spanish Creole: 178 +/-49 Speak English "very well" 109 +/-30 Speak English less than "very well" 69 +/-46
French (incl. Patois, Cajun): 30 +/-13 Speak English "very well" 29 +/-14 Speak English less than "very well" 1 +/-3
French Creole: 0 +/-14 Speak English "very well" 0 +/-14 Speak English less than "very well" 0 +/-14
Italian: 0 +/-14 Speak English "very well" 0 +/-14 Speak English less than "very well" 0 +/-14
Portuguese or Portuguese Creole: 6 +/-8 Speak English "very well" 6 +/-8 Speak English less than "very well" 0 +/-14
German: 85 +/-23 Speak English "very well" 69 +/-22 Speak English less than "very well" 16 +/-11
Yiddish: 0 +/-14 Speak English "very well" 0 +/-14 Speak English less than "very well" 0 +/-14
Other West Germanic languages: 1 +/-2 Speak English "very well" 0 +/-14 Speak English less than "very well" 1 +/-2
Scandinavian languages: 9 +/-9 Speak English "very well" 8 +/-7 Speak English less than "very well" 1 +/-4
Greek: 0 +/-14 Speak English "very well" 0 +/-14 Speak English less than "very well" 0 +/-14
1 of 4 12/16/2016
Bayfield County, Wisconsin
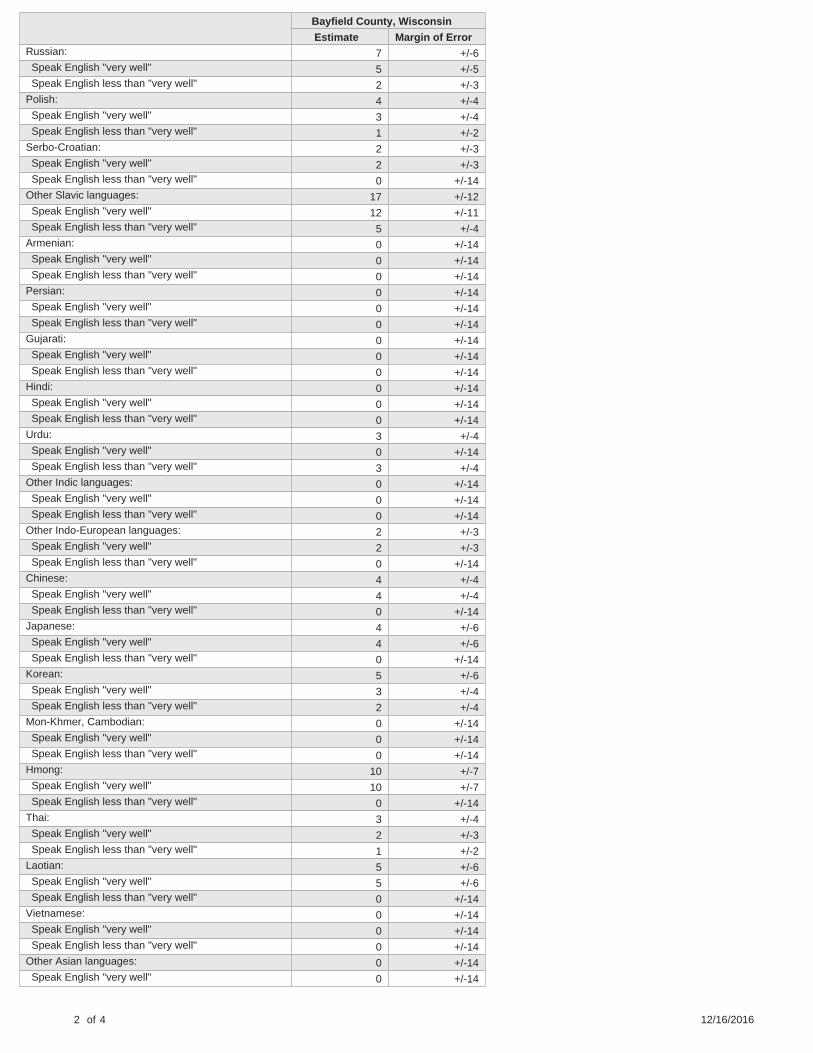
Estimate Margin of Error Russian: 7 +/-6 Speak English "very well" 5 +/-5 Speak English less than "very well" 2 +/-3
Polish: 4 +/-4 Speak English "very well" 3 +/-4 Speak English less than "very well" 1 +/-2
Serbo-Croatian: 2 +/-3 Speak English "very well" 2 +/-3 Speak English less than "very well" 0 +/-14
Other Slavic languages: 17 +/-12 Speak English "very well" 12 +/-11 Speak English less than "very well" 5 +/-4
Armenian: 0 +/-14 Speak English "very well" 0 +/-14 Speak English less than "very well" 0 +/-14
Persian: 0 +/-14 Speak English "very well" 0 +/-14 Speak English less than "very well" 0 +/-14
Gujarati: 0 +/-14 Speak English "very well" 0 +/-14 Speak English less than "very well" 0 +/-14
Hindi: 0 +/-14 Speak English "very well" 0 +/-14 Speak English less than "very well" 0 +/-14
Urdu: 3 +/-4 Speak English "very well" 0 +/-14 Speak English less than "very well" 3 +/-4
Other Indic languages: 0 +/-14 Speak English "very well" 0 +/-14 Speak English less than "very well" 0 +/-14
Other Indo-European languages: 2 +/-3 Speak English "very well" 2 +/-3 Speak English less than "very well" 0 +/-14
Chinese: 4 +/-4 Speak English "very well" 4 +/-4 Speak English less than "very well" 0 +/-14
Japanese: 4 +/-6 Speak English "very well" 4 +/-6 Speak English less than "very well" 0 +/-14
Korean: 5 +/-6 Speak English "very well" 3 +/-4 Speak English less than "very well" 2 +/-4
Mon-Khmer, Cambodian: 0 +/-14 Speak English "very well" 0 +/-14 Speak English less than "very well" 0 +/-14
Hmong: 10 +/-7 Speak English "very well" 10 +/-7 Speak English less than "very well" 0 +/-14
Thai: 3 +/-4 Speak English "very well" 2 +/-3 Speak English less than "very well" 1 +/-2
Laotian: 5 +/-6 Speak English "very well" 5 +/-6 Speak English less than "very well" 0 +/-14
Vietnamese: 0 +/-14 Speak English "very well" 0 +/-14 Speak English less than "very well" 0 +/-14
Other Asian languages: 0 +/-14 Speak English "very well" 0 +/-14
2 of 4 12/16/2016

Bayfield County, Wisconsin
Estimate Margin of Error Speak English less than "very well" 0 +/-14
Tagalog: 18 +/-7 Speak English "very well" 12 +/-7 Speak English less than "very well" 6 +/-7
Other Pacific Island languages: 6 +/-4 Speak English "very well" 0 +/-14 Speak English less than "very well" 6 +/-4
Navajo: 0 +/-14 Speak English "very well" 0 +/-14 Speak English less than "very well" 0 +/-14
Other Native North American languages: 74 +/-31 Speak English "very well" 68 +/-30 Speak English less than "very well" 6 +/-6
Hungarian: 0 +/-14 Speak English "very well" 0 +/-14 Speak English less than "very well" 0 +/-14
Arabic: 3 +/-5 Speak English "very well" 0 +/-14 Speak English less than "very well" 3 +/-5
Hebrew: 0 +/-14 Speak English "very well" 0 +/-14 Speak English less than "very well" 0 +/-14
African languages: 0 +/-14 Speak English "very well" 0 +/-14 Speak English less than "very well" 0 +/-14
Other and unspecified languages: 37 +/-15 Speak English "very well" 35 +/-15 Speak English less than "very well" 2 +/-3
Data are based on a sample and are subject to sampling variability. The degree of uncertainty for an estimate arising from sampling variability is represented through the use of a margin of error. The value shown here is the 90 percent margin of error. The margin of error can be interpreted roughly as providing a 90 percent probability that the interval defined by the estimate minus the margin of error and the estimate plus the margin of error (the lower and upper confidence bounds) contains the true value. In addition to sampling variability, the ACS estimates are subject to nonsampling error (for a discussion of nonsampling variability, see Accuracy of the Data). The effect of nonsampling error is not represented in these tables.
Methodological changes to data collection in 2013 may have affected language data for 2013. Users should be aware of these changes when using multi-year data containing data from 2013. For more information, see: Language User Note.
While the 2011-2015 American Community Survey (ACS) data generally reflect the February 2013 Office of Management and Budget (OMB) definitions of metropolitan and micropolitan statistical areas; in certain instances the names, codes, and boundaries of the principal cities shown in ACS tables may differ from the OMB definitions due to differences in the effective dates of the geographic entities.
Estimates of urban and rural population, housing units, and characteristics reflect boundaries of urban areas defined based on Census 2010 data. As a result, data for urban and rural areas from the ACS do not necessarily reflect the results of ongoing urbanization.
Source: U.S. Census Bureau, 2011-2015 American Community Survey 5-Year Estimates
Explanation of Symbols:
1. An '**' entry in the margin of error column indicates that either no sample observations or too few sample observations were available to compute a standard error and thus the margin of error. A statistical test is not appropriate.
2. An '-' entry in the estimate column indicates that either no sample observations or too few sample observations were available to compute an estimate, or a ratio of medians cannot be calculated because one or both of the median estimates falls in the lowest interval or upper interval of an open-ended distribution.
3. An '-' following a median estimate means the median falls in the lowest interval of an open-ended distribution. 4. An '+' following a median estimate means the median falls in the upper interval of an open-ended distribution. 5. An '***' entry in the margin of error column indicates that the median falls in the lowest interval or upper interval of an open-ended distribution. A
statistical test is not appropriate. 6. An '*****' entry in the margin of error column indicates that the estimate is controlled. A statistical test for sampling variability is not appropriate.
3 of 4 12/16/2016

7. An 'N' entry in the estimate and margin of error columns indicates that data for this geographic area cannot be displayed because the number of sample cases is too small.
8. An '(X)' means that the estimate is not applicable or not available.

B16001 LANGUAGE SPOKEN AT HOME BY ABILITY TO SPEAK ENGLISH FOR THE POPULATION 5 YEARS AND OVER Universe: Population 5 years and over 2011-2015 American Community Survey 5-Year Estimates
Supporting documentation on code lists, subject definitions, data accuracy, and statistical testing can be found on the American Community Survey website in the Data and Documentation section.
Sample size and data quality measures (including coverage rates, allocation rates, and response rates) can be found on the American Community Survey website in the Methodology section.
Tell us what you think. Provide feedback to help make American Community Survey data more useful for you.
Although the American Community Survey (ACS) produces population, demographic and housing unit estimates, it is the Census Bureau's Population Estimates Program that produces and disseminates the official estimates of the population for the nation, states, counties, cities and towns and estimates of housing units for states and counties.
Brown County, Wisconsin
Estimate Margin of Error Total: 237,479 +/-31 Speak only English 212,438 +/-974 Spanish or Spanish Creole: 15,498 +/-600 Speak English "very well" 8,299 +/-680 Speak English less than "very well" 7,199 +/-646
French (incl. Patois, Cajun): 410 +/-146 Speak English "very well" 321 +/-136 Speak English less than "very well" 89 +/-52
French Creole: 17 +/-22 Speak English "very well" 17 +/-22 Speak English less than "very well" 0 +/-20
Italian: 157 +/-116 Speak English "very well" 123 +/-107 Speak English less than "very well" 34 +/-33
Portuguese or Portuguese Creole: 29 +/-40 Speak English "very well" 29 +/-40 Speak English less than "very well" 0 +/-20
German: 886 +/-213 Speak English "very well" 767 +/-192 Speak English less than "very well" 119 +/-64
Yiddish: 18 +/-23 Speak English "very well" 18 +/-23 Speak English less than "very well" 0 +/-20
Other West Germanic languages: 115 +/-63 Speak English "very well" 96 +/-57 Speak English less than "very well" 19 +/-22
Scandinavian languages: 116 +/-66 Speak English "very well" 116 +/-66 Speak English less than "very well" 0 +/-20
Greek: 0 +/-20 Speak English "very well" 0 +/-20 Speak English less than "very well" 0 +/-20
1 of 4 12/16/2016

Brown County, Wisconsin
Estimate Margin of Error Russian: 188 +/-139 Speak English "very well" 141 +/-107 Speak English less than "very well" 47 +/-48
Polish: 119 +/-87 Speak English "very well" 98 +/-80 Speak English less than "very well" 21 +/-31
Serbo-Croatian: 33 +/-38 Speak English "very well" 13 +/-20 Speak English less than "very well" 20 +/-33
Other Slavic languages: 168 +/-168 Speak English "very well" 124 +/-147 Speak English less than "very well" 44 +/-32
Armenian: 0 +/-20 Speak English "very well" 0 +/-20 Speak English less than "very well" 0 +/-20
Persian: 0 +/-20 Speak English "very well" 0 +/-20 Speak English less than "very well" 0 +/-20
Gujarati: 42 +/-53 Speak English "very well" 33 +/-42 Speak English less than "very well" 9 +/-16
Hindi: 97 +/-89 Speak English "very well" 71 +/-86 Speak English less than "very well" 26 +/-32
Urdu: 179 +/-167 Speak English "very well" 122 +/-126 Speak English less than "very well" 57 +/-101
Other Indic languages: 37 +/-31 Speak English "very well" 19 +/-22 Speak English less than "very well" 18 +/-16
Other Indo-European languages: 171 +/-165 Speak English "very well" 164 +/-164 Speak English less than "very well" 7 +/-11
Chinese: 638 +/-303 Speak English "very well" 330 +/-168 Speak English less than "very well" 308 +/-187
Japanese: 105 +/-74 Speak English "very well" 75 +/-60 Speak English less than "very well" 30 +/-32
Korean: 42 +/-37 Speak English "very well" 10 +/-14 Speak English less than "very well" 32 +/-35
Mon-Khmer, Cambodian: 0 +/-20 Speak English "very well" 0 +/-20 Speak English less than "very well" 0 +/-20
Hmong: 3,965 +/-537 Speak English "very well" 2,622 +/-427 Speak English less than "very well" 1,343 +/-285
Thai: 83 +/-122 Speak English "very well" 83 +/-122 Speak English less than "very well" 0 +/-20
Laotian: 260 +/-148 Speak English "very well" 106 +/-91 Speak English less than "very well" 154 +/-113
Vietnamese: 112 +/-117 Speak English "very well" 59 +/-58 Speak English less than "very well" 53 +/-94
Other Asian languages: 370 +/-199 Speak English "very well" 239 +/-132
2 of 4 12/16/2016

Brown County, Wisconsin
Estimate Margin of Error Speak English less than "very well" 131 +/-100
Tagalog: 129 +/-80 Speak English "very well" 97 +/-60 Speak English less than "very well" 32 +/-54
Other Pacific Island languages: 8 +/-15 Speak English "very well" 8 +/-15 Speak English less than "very well" 0 +/-20
Navajo: 6 +/-10 Speak English "very well" 6 +/-10 Speak English less than "very well" 0 +/-20
Other Native North American languages: 377 +/-224 Speak English "very well" 294 +/-155 Speak English less than "very well" 83 +/-124
Hungarian: 0 +/-20 Speak English "very well" 0 +/-20 Speak English less than "very well" 0 +/-20
Arabic: 44 +/-43 Speak English "very well" 36 +/-42 Speak English less than "very well" 8 +/-12
Hebrew: 46 +/-41 Speak English "very well" 28 +/-29 Speak English less than "very well" 18 +/-30
African languages: 534 +/-268 Speak English "very well" 465 +/-233 Speak English less than "very well" 69 +/-65
Other and unspecified languages: 42 +/-32 Speak English "very well" 33 +/-29 Speak English less than "very well" 9 +/-14
Data are based on a sample and are subject to sampling variability. The degree of uncertainty for an estimate arising from sampling variability is represented through the use of a margin of error. The value shown here is the 90 percent margin of error. The margin of error can be interpreted roughly as providing a 90 percent probability that the interval defined by the estimate minus the margin of error and the estimate plus the margin of error (the lower and upper confidence bounds) contains the true value. In addition to sampling variability, the ACS estimates are subject to nonsampling error (for a discussion of nonsampling variability, see Accuracy of the Data). The effect of nonsampling error is not represented in these tables.
Methodological changes to data collection in 2013 may have affected language data for 2013. Users should be aware of these changes when using multi-year data containing data from 2013. For more information, see: Language User Note.
While the 2011-2015 American Community Survey (ACS) data generally reflect the February 2013 Office of Management and Budget (OMB) definitions of metropolitan and micropolitan statistical areas; in certain instances the names, codes, and boundaries of the principal cities shown in ACS tables may differ from the OMB definitions due to differences in the effective dates of the geographic entities.
Estimates of urban and rural population, housing units, and characteristics reflect boundaries of urban areas defined based on Census 2010 data. As a result, data for urban and rural areas from the ACS do not necessarily reflect the results of ongoing urbanization.
Source: U.S. Census Bureau, 2011-2015 American Community Survey 5-Year Estimates
Explanation of Symbols:
1. An '**' entry in the margin of error column indicates that either no sample observations or too few sample observations were available to compute a standard error and thus the margin of error. A statistical test is not appropriate.
2. An '-' entry in the estimate column indicates that either no sample observations or too few sample observations were available to compute an estimate, or a ratio of medians cannot be calculated because one or both of the median estimates falls in the lowest interval or upper interval of an open-ended distribution.
3. An '-' following a median estimate means the median falls in the lowest interval of an open-ended distribution. 4. An '+' following a median estimate means the median falls in the upper interval of an open-ended distribution. 5. An '***' entry in the margin of error column indicates that the median falls in the lowest interval or upper interval of an open-ended distribution. A
statistical test is not appropriate. 6. An '*****' entry in the margin of error column indicates that the estimate is controlled. A statistical test for sampling variability is not appropriate.
3 of 4 12/16/2016

7. An 'N' entry in the estimate and margin of error columns indicates that data for this geographic area cannot be displayed because the number of sample cases is too small.
8. An '(X)' means that the estimate is not applicable or not available.

B16001 LANGUAGE SPOKEN AT HOME BY ABILITY TO SPEAK ENGLISH FOR THE POPULATION 5 YEARS AND OVER Universe: Population 5 years and over 2011-2015 American Community Survey 5-Year Estimates
Supporting documentation on code lists, subject definitions, data accuracy, and statistical testing can be found on the American Community Survey website in the Data and Documentation section.
Sample size and data quality measures (including coverage rates, allocation rates, and response rates) can be found on the American Community Survey website in the Methodology section.
Tell us what you think. Provide feedback to help make American Community Survey data more useful for you.
Although the American Community Survey (ACS) produces population, demographic and housing unit estimates, it is the Census Bureau's Population Estimates Program that produces and disseminates the official estimates of the population for the nation, states, counties, cities and towns and estimates of housing units for states and counties.
Buffalo County, Wisconsin
Estimate Margin of Error Total: 12,597 +/-24 Speak only English 12,234 +/-62 Spanish or Spanish Creole: 202 +/-49 Speak English "very well" 59 +/-24 Speak English less than "very well" 143 +/-39
French (incl. Patois, Cajun): 13 +/-7 Speak English "very well" 7 +/-7 Speak English less than "very well" 6 +/-4
French Creole: 0 +/-14 Speak English "very well" 0 +/-14 Speak English less than "very well" 0 +/-14
Italian: 8 +/-7 Speak English "very well" 8 +/-7 Speak English less than "very well" 0 +/-14
Portuguese or Portuguese Creole: 0 +/-14 Speak English "very well" 0 +/-14 Speak English less than "very well" 0 +/-14
German: 92 +/-44 Speak English "very well" 63 +/-20 Speak English less than "very well" 29 +/-32
Yiddish: 0 +/-14 Speak English "very well" 0 +/-14 Speak English less than "very well" 0 +/-14
Other West Germanic languages: 20 +/-11 Speak English "very well" 6 +/-5 Speak English less than "very well" 14 +/-13
Scandinavian languages: 5 +/-3 Speak English "very well" 5 +/-3 Speak English less than "very well" 0 +/-14
Greek: 0 +/-14 Speak English "very well" 0 +/-14 Speak English less than "very well" 0 +/-14
1 of 4 12/16/2016

Buffalo County, Wisconsin
Estimate Margin of Error Russian: 1 +/-3 Speak English "very well" 1 +/-3 Speak English less than "very well" 0 +/-14
Polish: 9 +/-5 Speak English "very well" 6 +/-5 Speak English less than "very well" 3 +/-6
Serbo-Croatian: 0 +/-14 Speak English "very well" 0 +/-14 Speak English less than "very well" 0 +/-14
Other Slavic languages: 0 +/-14 Speak English "very well" 0 +/-14 Speak English less than "very well" 0 +/-14
Armenian: 0 +/-14 Speak English "very well" 0 +/-14 Speak English less than "very well" 0 +/-14
Persian: 0 +/-14 Speak English "very well" 0 +/-14 Speak English less than "very well" 0 +/-14
Gujarati: 0 +/-14 Speak English "very well" 0 +/-14 Speak English less than "very well" 0 +/-14
Hindi: 0 +/-14 Speak English "very well" 0 +/-14 Speak English less than "very well" 0 +/-14
Urdu: 0 +/-14 Speak English "very well" 0 +/-14 Speak English less than "very well" 0 +/-14
Other Indic languages: 8 +/-7 Speak English "very well" 8 +/-7 Speak English less than "very well" 0 +/-14
Other Indo-European languages: 0 +/-14 Speak English "very well" 0 +/-14 Speak English less than "very well" 0 +/-14
Chinese: 0 +/-14 Speak English "very well" 0 +/-14 Speak English less than "very well" 0 +/-14
Japanese: 0 +/-14 Speak English "very well" 0 +/-14 Speak English less than "very well" 0 +/-14
Korean: 0 +/-14 Speak English "very well" 0 +/-14 Speak English less than "very well" 0 +/-14
Mon-Khmer, Cambodian: 0 +/-14 Speak English "very well" 0 +/-14 Speak English less than "very well" 0 +/-14
Hmong: 0 +/-14 Speak English "very well" 0 +/-14 Speak English less than "very well" 0 +/-14
Thai: 0 +/-14 Speak English "very well" 0 +/-14 Speak English less than "very well" 0 +/-14
Laotian: 0 +/-14 Speak English "very well" 0 +/-14 Speak English less than "very well" 0 +/-14
Vietnamese: 0 +/-14 Speak English "very well" 0 +/-14 Speak English less than "very well" 0 +/-14
Other Asian languages: 0 +/-14 Speak English "very well" 0 +/-14
2 of 4 12/16/2016

Buffalo County, Wisconsin
Estimate Margin of Error Speak English less than "very well" 0 +/-14
Tagalog: 0 +/-14 Speak English "very well" 0 +/-14 Speak English less than "very well" 0 +/-14
Other Pacific Island languages: 0 +/-14 Speak English "very well" 0 +/-14 Speak English less than "very well" 0 +/-14
Navajo: 0 +/-14 Speak English "very well" 0 +/-14 Speak English less than "very well" 0 +/-14
Other Native North American languages: 5 +/-11 Speak English "very well" 5 +/-11 Speak English less than "very well" 0 +/-14
Hungarian: 0 +/-14 Speak English "very well" 0 +/-14 Speak English less than "very well" 0 +/-14
Arabic: 0 +/-14 Speak English "very well" 0 +/-14 Speak English less than "very well" 0 +/-14
Hebrew: 0 +/-14 Speak English "very well" 0 +/-14 Speak English less than "very well" 0 +/-14
African languages: 0 +/-14 Speak English "very well" 0 +/-14 Speak English less than "very well" 0 +/-14
Other and unspecified languages: 0 +/-14 Speak English "very well" 0 +/-14 Speak English less than "very well" 0 +/-14
Data are based on a sample and are subject to sampling variability. The degree of uncertainty for an estimate arising from sampling variability is represented through the use of a margin of error. The value shown here is the 90 percent margin of error. The margin of error can be interpreted roughly as providing a 90 percent probability that the interval defined by the estimate minus the margin of error and the estimate plus the margin of error (the lower and upper confidence bounds) contains the true value. In addition to sampling variability, the ACS estimates are subject to nonsampling error (for a discussion of nonsampling variability, see Accuracy of the Data). The effect of nonsampling error is not represented in these tables.
Methodological changes to data collection in 2013 may have affected language data for 2013. Users should be aware of these changes when using multi-year data containing data from 2013. For more information, see: Language User Note.
While the 2011-2015 American Community Survey (ACS) data generally reflect the February 2013 Office of Management and Budget (OMB) definitions of metropolitan and micropolitan statistical areas; in certain instances the names, codes, and boundaries of the principal cities shown in ACS tables may differ from the OMB definitions due to differences in the effective dates of the geographic entities.
Estimates of urban and rural population, housing units, and characteristics reflect boundaries of urban areas defined based on Census 2010 data. As a result, data for urban and rural areas from the ACS do not necessarily reflect the results of ongoing urbanization.
Source: U.S. Census Bureau, 2011-2015 American Community Survey 5-Year Estimates
Explanation of Symbols:
1. An '**' entry in the margin of error column indicates that either no sample observations or too few sample observations were available to compute a standard error and thus the margin of error. A statistical test is not appropriate.
2. An '-' entry in the estimate column indicates that either no sample observations or too few sample observations were available to compute an estimate, or a ratio of medians cannot be calculated because one or both of the median estimates falls in the lowest interval or upper interval of an open-ended distribution.
3. An '-' following a median estimate means the median falls in the lowest interval of an open-ended distribution. 4. An '+' following a median estimate means the median falls in the upper interval of an open-ended distribution. 5. An '***' entry in the margin of error column indicates that the median falls in the lowest interval or upper interval of an open-ended distribution. A
statistical test is not appropriate. 6. An '*****' entry in the margin of error column indicates that the estimate is controlled. A statistical test for sampling variability is not appropriate.
3 of 4 12/16/2016

7. An 'N' entry in the estimate and margin of error columns indicates that data for this geographic area cannot be displayed because the number of sample cases is too small.
8. An '(X)' means that the estimate is not applicable or not available.

B16001 LANGUAGE SPOKEN AT HOME BY ABILITY TO SPEAK ENGLISH FOR THE POPULATION 5 YEARS AND OVER Universe: Population 5 years and over 2011-2015 American Community Survey 5-Year Estimates
Supporting documentation on code lists, subject definitions, data accuracy, and statistical testing can be found on the American Community Survey website in the Data and Documentation section.
Sample size and data quality measures (including coverage rates, allocation rates, and response rates) can be found on the American Community Survey website in the Methodology section.
Tell us what you think. Provide feedback to help make American Community Survey data more useful for you.
Although the American Community Survey (ACS) produces population, demographic and housing unit estimates, it is the Census Bureau's Population Estimates Program that produces and disseminates the official estimates of the population for the nation, states, counties, cities and towns and estimates of housing units for states and counties.
Burnett County, Wisconsin
Estimate Margin of Error Total: 14,656 +/-15 Speak only English 14,241 +/-77 Spanish or Spanish Creole: 120 +/-57 Speak English "very well" 80 +/-34 Speak English less than "very well" 40 +/-29
French (incl. Patois, Cajun): 22 +/-13 Speak English "very well" 16 +/-13 Speak English less than "very well" 6 +/-6
French Creole: 0 +/-14 Speak English "very well" 0 +/-14 Speak English less than "very well" 0 +/-14
Italian: 0 +/-14 Speak English "very well" 0 +/-14 Speak English less than "very well" 0 +/-14
Portuguese or Portuguese Creole: 4 +/-8 Speak English "very well" 2 +/-7 Speak English less than "very well" 2 +/-2
German: 49 +/-23 Speak English "very well" 48 +/-23 Speak English less than "very well" 1 +/-3
Yiddish: 0 +/-14 Speak English "very well" 0 +/-14 Speak English less than "very well" 0 +/-14
Other West Germanic languages: 10 +/-9 Speak English "very well" 5 +/-5 Speak English less than "very well" 5 +/-6
Scandinavian languages: 20 +/-13 Speak English "very well" 20 +/-13 Speak English less than "very well" 0 +/-14
Greek: 0 +/-14 Speak English "very well" 0 +/-14 Speak English less than "very well" 0 +/-14
1 of 4 12/16/2016

Burnett County, Wisconsin
Estimate Margin of Error Russian: 0 +/-14 Speak English "very well" 0 +/-14 Speak English less than "very well" 0 +/-14
Polish: 0 +/-14 Speak English "very well" 0 +/-14 Speak English less than "very well" 0 +/-14
Serbo-Croatian: 0 +/-14 Speak English "very well" 0 +/-14 Speak English less than "very well" 0 +/-14
Other Slavic languages: 0 +/-14 Speak English "very well" 0 +/-14 Speak English less than "very well" 0 +/-14
Armenian: 0 +/-14 Speak English "very well" 0 +/-14 Speak English less than "very well" 0 +/-14
Persian: 0 +/-14 Speak English "very well" 0 +/-14 Speak English less than "very well" 0 +/-14
Gujarati: 0 +/-14 Speak English "very well" 0 +/-14 Speak English less than "very well" 0 +/-14
Hindi: 0 +/-14 Speak English "very well" 0 +/-14 Speak English less than "very well" 0 +/-14
Urdu: 0 +/-14 Speak English "very well" 0 +/-14 Speak English less than "very well" 0 +/-14
Other Indic languages: 0 +/-14 Speak English "very well" 0 +/-14 Speak English less than "very well" 0 +/-14
Other Indo-European languages: 2 +/-4 Speak English "very well" 2 +/-4 Speak English less than "very well" 0 +/-14
Chinese: 3 +/-4 Speak English "very well" 1 +/-2 Speak English less than "very well" 2 +/-4
Japanese: 5 +/-5 Speak English "very well" 5 +/-5 Speak English less than "very well" 0 +/-14
Korean: 6 +/-7 Speak English "very well" 1 +/-2 Speak English less than "very well" 5 +/-6
Mon-Khmer, Cambodian: 0 +/-14 Speak English "very well" 0 +/-14 Speak English less than "very well" 0 +/-14
Hmong: 7 +/-10 Speak English "very well" 4 +/-6 Speak English less than "very well" 3 +/-4
Thai: 8 +/-9 Speak English "very well" 0 +/-14 Speak English less than "very well" 8 +/-9
Laotian: 0 +/-14 Speak English "very well" 0 +/-14 Speak English less than "very well" 0 +/-14
Vietnamese: 0 +/-14 Speak English "very well" 0 +/-14 Speak English less than "very well" 0 +/-14
Other Asian languages: 0 +/-14 Speak English "very well" 0 +/-14
2 of 4 12/16/2016

Burnett County, Wisconsin
Estimate Margin of Error Speak English less than "very well" 0 +/-14
Tagalog: 6 +/-6 Speak English "very well" 6 +/-6 Speak English less than "very well" 0 +/-14
Other Pacific Island languages: 3 +/-5 Speak English "very well" 3 +/-5 Speak English less than "very well" 0 +/-14
Navajo: 0 +/-14 Speak English "very well" 0 +/-14 Speak English less than "very well" 0 +/-14
Other Native North American languages: 140 +/-40 Speak English "very well" 129 +/-39 Speak English less than "very well" 11 +/-9
Hungarian: 5 +/-8 Speak English "very well" 5 +/-8 Speak English less than "very well" 0 +/-14
Arabic: 0 +/-14 Speak English "very well" 0 +/-14 Speak English less than "very well" 0 +/-14
Hebrew: 0 +/-14 Speak English "very well" 0 +/-14 Speak English less than "very well" 0 +/-14
African languages: 0 +/-14 Speak English "very well" 0 +/-14 Speak English less than "very well" 0 +/-14
Other and unspecified languages: 5 +/-5 Speak English "very well" 5 +/-5 Speak English less than "very well" 0 +/-14
Data are based on a sample and are subject to sampling variability. The degree of uncertainty for an estimate arising from sampling variability is represented through the use of a margin of error. The value shown here is the 90 percent margin of error. The margin of error can be interpreted roughly as providing a 90 percent probability that the interval defined by the estimate minus the margin of error and the estimate plus the margin of error (the lower and upper confidence bounds) contains the true value. In addition to sampling variability, the ACS estimates are subject to nonsampling error (for a discussion of nonsampling variability, see Accuracy of the Data). The effect of nonsampling error is not represented in these tables.
Methodological changes to data collection in 2013 may have affected language data for 2013. Users should be aware of these changes when using multi-year data containing data from 2013. For more information, see: Language User Note.
While the 2011-2015 American Community Survey (ACS) data generally reflect the February 2013 Office of Management and Budget (OMB) definitions of metropolitan and micropolitan statistical areas; in certain instances the names, codes, and boundaries of the principal cities shown in ACS tables may differ from the OMB definitions due to differences in the effective dates of the geographic entities.
Estimates of urban and rural population, housing units, and characteristics reflect boundaries of urban areas defined based on Census 2010 data. As a result, data for urban and rural areas from the ACS do not necessarily reflect the results of ongoing urbanization.
Source: U.S. Census Bureau, 2011-2015 American Community Survey 5-Year Estimates
Explanation of Symbols:
1. An '**' entry in the margin of error column indicates that either no sample observations or too few sample observations were available to compute a standard error and thus the margin of error. A statistical test is not appropriate.
2. An '-' entry in the estimate column indicates that either no sample observations or too few sample observations were available to compute an estimate, or a ratio of medians cannot be calculated because one or both of the median estimates falls in the lowest interval or upper interval of an open-ended distribution.
3. An '-' following a median estimate means the median falls in the lowest interval of an open-ended distribution. 4. An '+' following a median estimate means the median falls in the upper interval of an open-ended distribution. 5. An '***' entry in the margin of error column indicates that the median falls in the lowest interval or upper interval of an open-ended distribution. A
statistical test is not appropriate. 6. An '*****' entry in the margin of error column indicates that the estimate is controlled. A statistical test for sampling variability is not appropriate.
3 of 4 12/16/2016

7. An 'N' entry in the estimate and margin of error columns indicates that data for this geographic area cannot be displayed because the number of sample cases is too small.
8. An '(X)' means that the estimate is not applicable or not available.

B16001 LANGUAGE SPOKEN AT HOME BY ABILITY TO SPEAK ENGLISH FOR THE POPULATION 5 YEARS AND OVER Universe: Population 5 years and over 2011-2015 American Community Survey 5-Year Estimates
Supporting documentation on code lists, subject definitions, data accuracy, and statistical testing can be found on the American Community Survey website in the Data and Documentation section.
Sample size and data quality measures (including coverage rates, allocation rates, and response rates) can be found on the American Community Survey website in the Methodology section.
Tell us what you think. Provide feedback to help make American Community Survey data more useful for you.
Although the American Community Survey (ACS) produces population, demographic and housing unit estimates, it is the Census Bureau's Population Estimates Program that produces and disseminates the official estimates of the population for the nation, states, counties, cities and towns and estimates of housing units for states and counties.
Calumet County, Wisconsin
Estimate Margin of Error Total: 46,560 +/-108 Speak only English 43,550 +/-301 Spanish or Spanish Creole: 1,467 +/-230 Speak English "very well" 675 +/-186 Speak English less than "very well" 792 +/-165
French (incl. Patois, Cajun): 63 +/-58 Speak English "very well" 47 +/-53 Speak English less than "very well" 16 +/-25
French Creole: 0 +/-18 Speak English "very well" 0 +/-18 Speak English less than "very well" 0 +/-18
Italian: 33 +/-39 Speak English "very well" 0 +/-18 Speak English less than "very well" 33 +/-39
Portuguese or Portuguese Creole: 2 +/-3 Speak English "very well" 2 +/-3 Speak English less than "very well" 0 +/-18
German: 230 +/-106 Speak English "very well" 196 +/-101 Speak English less than "very well" 34 +/-23
Yiddish: 0 +/-18 Speak English "very well" 0 +/-18 Speak English less than "very well" 0 +/-18
Other West Germanic languages: 52 +/-71 Speak English "very well" 13 +/-13 Speak English less than "very well" 39 +/-61
Scandinavian languages: 5 +/-10 Speak English "very well" 0 +/-18 Speak English less than "very well" 5 +/-10
Greek: 0 +/-18 Speak English "very well" 0 +/-18 Speak English less than "very well" 0 +/-18
1 of 4 12/16/2016

Calumet County, Wisconsin
Estimate Margin of Error Russian: 0 +/-18 Speak English "very well" 0 +/-18 Speak English less than "very well" 0 +/-18
Polish: 0 +/-18 Speak English "very well" 0 +/-18 Speak English less than "very well" 0 +/-18
Serbo-Croatian: 62 +/-101 Speak English "very well" 62 +/-101 Speak English less than "very well" 0 +/-18
Other Slavic languages: 3 +/-4 Speak English "very well" 3 +/-4 Speak English less than "very well" 0 +/-18
Armenian: 0 +/-18 Speak English "very well" 0 +/-18 Speak English less than "very well" 0 +/-18
Persian: 9 +/-14 Speak English "very well" 9 +/-14 Speak English less than "very well" 0 +/-18
Gujarati: 4 +/-6 Speak English "very well" 4 +/-6 Speak English less than "very well" 0 +/-18
Hindi: 0 +/-18 Speak English "very well" 0 +/-18 Speak English less than "very well" 0 +/-18
Urdu: 193 +/-206 Speak English "very well" 193 +/-206 Speak English less than "very well" 0 +/-18
Other Indic languages: 0 +/-18 Speak English "very well" 0 +/-18 Speak English less than "very well" 0 +/-18
Other Indo-European languages: 95 +/-103 Speak English "very well" 65 +/-80 Speak English less than "very well" 30 +/-25
Chinese: 25 +/-27 Speak English "very well" 13 +/-13 Speak English less than "very well" 12 +/-18
Japanese: 0 +/-18 Speak English "very well" 0 +/-18 Speak English less than "very well" 0 +/-18
Korean: 108 +/-123 Speak English "very well" 5 +/-8 Speak English less than "very well" 103 +/-122
Mon-Khmer, Cambodian: 0 +/-18 Speak English "very well" 0 +/-18 Speak English less than "very well" 0 +/-18
Hmong: 594 +/-254 Speak English "very well" 145 +/-111 Speak English less than "very well" 449 +/-270
Thai: 0 +/-18 Speak English "very well" 0 +/-18 Speak English less than "very well" 0 +/-18
Laotian: 0 +/-18 Speak English "very well" 0 +/-18 Speak English less than "very well" 0 +/-18
Vietnamese: 29 +/-37 Speak English "very well" 10 +/-16 Speak English less than "very well" 19 +/-32
Other Asian languages: 15 +/-23 Speak English "very well" 0 +/-18
2 of 4 12/16/2016

Calumet County, Wisconsin
Estimate Margin of Error Speak English less than "very well" 15 +/-23
Tagalog: 14 +/-17 Speak English "very well" 11 +/-18 Speak English less than "very well" 3 +/-4
Other Pacific Island languages: 0 +/-18 Speak English "very well" 0 +/-18 Speak English less than "very well" 0 +/-18
Navajo: 0 +/-18 Speak English "very well" 0 +/-18 Speak English less than "very well" 0 +/-18
Other Native North American languages: 7 +/-13 Speak English "very well" 0 +/-18 Speak English less than "very well" 7 +/-13
Hungarian: 0 +/-18 Speak English "very well" 0 +/-18 Speak English less than "very well" 0 +/-18
Arabic: 0 +/-18 Speak English "very well" 0 +/-18 Speak English less than "very well" 0 +/-18
Hebrew: 0 +/-18 Speak English "very well" 0 +/-18 Speak English less than "very well" 0 +/-18
African languages: 0 +/-18 Speak English "very well" 0 +/-18 Speak English less than "very well" 0 +/-18
Other and unspecified languages: 0 +/-18 Speak English "very well" 0 +/-18 Speak English less than "very well" 0 +/-18
Data are based on a sample and are subject to sampling variability. The degree of uncertainty for an estimate arising from sampling variability is represented through the use of a margin of error. The value shown here is the 90 percent margin of error. The margin of error can be interpreted roughly as providing a 90 percent probability that the interval defined by the estimate minus the margin of error and the estimate plus the margin of error (the lower and upper confidence bounds) contains the true value. In addition to sampling variability, the ACS estimates are subject to nonsampling error (for a discussion of nonsampling variability, see Accuracy of the Data). The effect of nonsampling error is not represented in these tables.
Methodological changes to data collection in 2013 may have affected language data for 2013. Users should be aware of these changes when using multi-year data containing data from 2013. For more information, see: Language User Note.
While the 2011-2015 American Community Survey (ACS) data generally reflect the February 2013 Office of Management and Budget (OMB) definitions of metropolitan and micropolitan statistical areas; in certain instances the names, codes, and boundaries of the principal cities shown in ACS tables may differ from the OMB definitions due to differences in the effective dates of the geographic entities.
Estimates of urban and rural population, housing units, and characteristics reflect boundaries of urban areas defined based on Census 2010 data. As a result, data for urban and rural areas from the ACS do not necessarily reflect the results of ongoing urbanization.
Source: U.S. Census Bureau, 2011-2015 American Community Survey 5-Year Estimates
Explanation of Symbols:
1. An '**' entry in the margin of error column indicates that either no sample observations or too few sample observations were available to compute a standard error and thus the margin of error. A statistical test is not appropriate.
2. An '-' entry in the estimate column indicates that either no sample observations or too few sample observations were available to compute an estimate, or a ratio of medians cannot be calculated because one or both of the median estimates falls in the lowest interval or upper interval of an open-ended distribution.
3. An '-' following a median estimate means the median falls in the lowest interval of an open-ended distribution. 4. An '+' following a median estimate means the median falls in the upper interval of an open-ended distribution. 5. An '***' entry in the margin of error column indicates that the median falls in the lowest interval or upper interval of an open-ended distribution. A
statistical test is not appropriate. 6. An '*****' entry in the margin of error column indicates that the estimate is controlled. A statistical test for sampling variability is not appropriate.
3 of 4 12/16/2016

7. An 'N' entry in the estimate and margin of error columns indicates that data for this geographic area cannot be displayed because the number of sample cases is too small.
8. An '(X)' means that the estimate is not applicable or not available.

B16001 LANGUAGE SPOKEN AT HOME BY ABILITY TO SPEAK ENGLISH FOR THE POPULATION 5 YEARS AND OVER Universe: Population 5 years and over 2011-2015 American Community Survey 5-Year Estimates
Supporting documentation on code lists, subject definitions, data accuracy, and statistical testing can be found on the American Community Survey website in the Data and Documentation section.
Sample size and data quality measures (including coverage rates, allocation rates, and response rates) can be found on the American Community Survey website in the Methodology section.
Tell us what you think. Provide feedback to help make American Community Survey data more useful for you.
Although the American Community Survey (ACS) produces population, demographic and housing unit estimates, it is the Census Bureau's Population Estimates Program that produces and disseminates the official estimates of the population for the nation, states, counties, cities and towns and estimates of housing units for states and counties.
Chippewa County, Wisconsin
Estimate Margin of Error Total: 59,573 +/-64 Speak only English 57,644 +/-239 Spanish or Spanish Creole: 441 +/-139 Speak English "very well" 236 +/-112 Speak English less than "very well" 205 +/-81
French (incl. Patois, Cajun): 178 +/-103 Speak English "very well" 154 +/-97 Speak English less than "very well" 24 +/-34
French Creole: 0 +/-20 Speak English "very well" 0 +/-20 Speak English less than "very well" 0 +/-20
Italian: 14 +/-14 Speak English "very well" 14 +/-14 Speak English less than "very well" 0 +/-20
Portuguese or Portuguese Creole: 3 +/-4 Speak English "very well" 3 +/-4 Speak English less than "very well" 0 +/-20
German: 295 +/-120 Speak English "very well" 236 +/-110 Speak English less than "very well" 59 +/-47
Yiddish: 0 +/-20 Speak English "very well" 0 +/-20 Speak English less than "very well" 0 +/-20
Other West Germanic languages: 221 +/-73 Speak English "very well" 137 +/-55 Speak English less than "very well" 84 +/-40
Scandinavian languages: 48 +/-45 Speak English "very well" 29 +/-40 Speak English less than "very well" 19 +/-21
Greek: 0 +/-20 Speak English "very well" 0 +/-20 Speak English less than "very well" 0 +/-20
1 of 4 12/16/2016
Chippewa County, Wisconsin
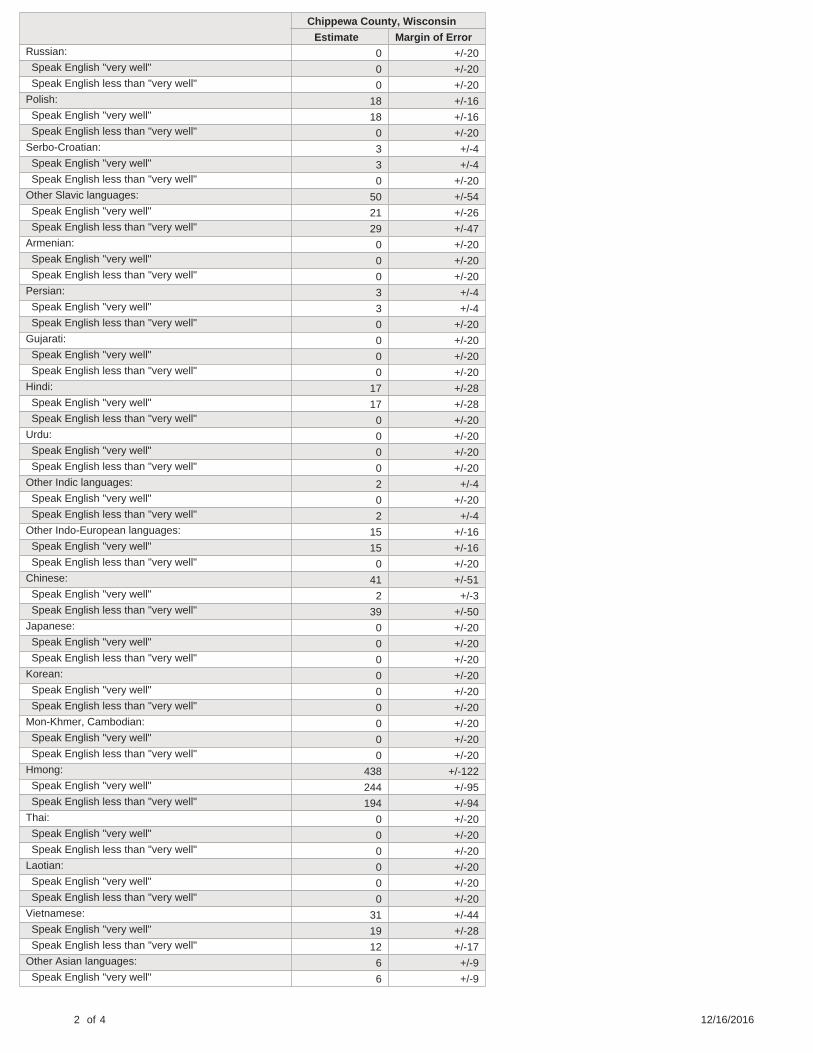
Estimate Margin of Error Russian: 0 +/-20 Speak English "very well" 0 +/-20 Speak English less than "very well" 0 +/-20
Polish: 18 +/-16 Speak English "very well" 18 +/-16 Speak English less than "very well" 0 +/-20
Serbo-Croatian: 3 +/-4 Speak English "very well" 3 +/-4 Speak English less than "very well" 0 +/-20
Other Slavic languages: 50 +/-54 Speak English "very well" 21 +/-26 Speak English less than "very well" 29 +/-47
Armenian: 0 +/-20 Speak English "very well" 0 +/-20 Speak English less than "very well" 0 +/-20
Persian: 3 +/-4 Speak English "very well" 3 +/-4 Speak English less than "very well" 0 +/-20
Gujarati: 0 +/-20 Speak English "very well" 0 +/-20 Speak English less than "very well" 0 +/-20
Hindi: 17 +/-28 Speak English "very well" 17 +/-28 Speak English less than "very well" 0 +/-20
Urdu: 0 +/-20 Speak English "very well" 0 +/-20 Speak English less than "very well" 0 +/-20
Other Indic languages: 2 +/-4 Speak English "very well" 0 +/-20 Speak English less than "very well" 2 +/-4
Other Indo-European languages: 15 +/-16 Speak English "very well" 15 +/-16 Speak English less than "very well" 0 +/-20
Chinese: 41 +/-51 Speak English "very well" 2 +/-3 Speak English less than "very well" 39 +/-50
Japanese: 0 +/-20 Speak English "very well" 0 +/-20 Speak English less than "very well" 0 +/-20
Korean: 0 +/-20 Speak English "very well" 0 +/-20 Speak English less than "very well" 0 +/-20
Mon-Khmer, Cambodian: 0 +/-20 Speak English "very well" 0 +/-20 Speak English less than "very well" 0 +/-20
Hmong: 438 +/-122 Speak English "very well" 244 +/-95 Speak English less than "very well" 194 +/-94
Thai: 0 +/-20 Speak English "very well" 0 +/-20 Speak English less than "very well" 0 +/-20
Laotian: 0 +/-20 Speak English "very well" 0 +/-20 Speak English less than "very well" 0 +/-20
Vietnamese: 31 +/-44 Speak English "very well" 19 +/-28 Speak English less than "very well" 12 +/-17
Other Asian languages: 6 +/-9 Speak English "very well" 6 +/-9
2 of 4 12/16/2016

Chippewa County, Wisconsin
Estimate Margin of Error Speak English less than "very well" 0 +/-20
Tagalog: 55 +/-26 Speak English "very well" 52 +/-25 Speak English less than "very well" 3 +/-5
Other Pacific Island languages: 0 +/-20 Speak English "very well" 0 +/-20 Speak English less than "very well" 0 +/-20
Navajo: 0 +/-20 Speak English "very well" 0 +/-20 Speak English less than "very well" 0 +/-20
Other Native North American languages: 40 +/-28 Speak English "very well" 40 +/-28 Speak English less than "very well" 0 +/-20
Hungarian: 0 +/-20 Speak English "very well" 0 +/-20 Speak English less than "very well" 0 +/-20
Arabic: 0 +/-20 Speak English "very well" 0 +/-20 Speak English less than "very well" 0 +/-20
Hebrew: 10 +/-13 Speak English "very well" 10 +/-13 Speak English less than "very well" 0 +/-20
African languages: 0 +/-20 Speak English "very well" 0 +/-20 Speak English less than "very well" 0 +/-20
Other and unspecified languages: 0 +/-20 Speak English "very well" 0 +/-20 Speak English less than "very well" 0 +/-20
Data are based on a sample and are subject to sampling variability. The degree of uncertainty for an estimate arising from sampling variability is represented through the use of a margin of error. The value shown here is the 90 percent margin of error. The margin of error can be interpreted roughly as providing a 90 percent probability that the interval defined by the estimate minus the margin of error and the estimate plus the margin of error (the lower and upper confidence bounds) contains the true value. In addition to sampling variability, the ACS estimates are subject to nonsampling error (for a discussion of nonsampling variability, see Accuracy of the Data). The effect of nonsampling error is not represented in these tables.
Methodological changes to data collection in 2013 may have affected language data for 2013. Users should be aware of these changes when using multi-year data containing data from 2013. For more information, see: Language User Note.
While the 2011-2015 American Community Survey (ACS) data generally reflect the February 2013 Office of Management and Budget (OMB) definitions of metropolitan and micropolitan statistical areas; in certain instances the names, codes, and boundaries of the principal cities shown in ACS tables may differ from the OMB definitions due to differences in the effective dates of the geographic entities.
Estimates of urban and rural population, housing units, and characteristics reflect boundaries of urban areas defined based on Census 2010 data. As a result, data for urban and rural areas from the ACS do not necessarily reflect the results of ongoing urbanization.
Source: U.S. Census Bureau, 2011-2015 American Community Survey 5-Year Estimates
Explanation of Symbols:
1. An '**' entry in the margin of error column indicates that either no sample observations or too few sample observations were available to compute a standard error and thus the margin of error. A statistical test is not appropriate.
2. An '-' entry in the estimate column indicates that either no sample observations or too few sample observations were available to compute an estimate, or a ratio of medians cannot be calculated because one or both of the median estimates falls in the lowest interval or upper interval of an open-ended distribution.
3. An '-' following a median estimate means the median falls in the lowest interval of an open-ended distribution. 4. An '+' following a median estimate means the median falls in the upper interval of an open-ended distribution. 5. An '***' entry in the margin of error column indicates that the median falls in the lowest interval or upper interval of an open-ended distribution. A
statistical test is not appropriate. 6. An '*****' entry in the margin of error column indicates that the estimate is controlled. A statistical test for sampling variability is not appropriate.
3 of 4 12/16/2016

7. An 'N' entry in the estimate and margin of error columns indicates that data for this geographic area cannot be displayed because the number of sample cases is too small.
8. An '(X)' means that the estimate is not applicable or not available.

B16001 LANGUAGE SPOKEN AT HOME BY ABILITY TO SPEAK ENGLISH FOR THE POPULATION 5 YEARS AND OVER Universe: Population 5 years and over 2011-2015 American Community Survey 5-Year Estimates
Supporting documentation on code lists, subject definitions, data accuracy, and statistical testing can be found on the American Community Survey website in the Data and Documentation section.
Sample size and data quality measures (including coverage rates, allocation rates, and response rates) can be found on the American Community Survey website in the Methodology section.
Tell us what you think. Provide feedback to help make American Community Survey data more useful for you.
Although the American Community Survey (ACS) produces population, demographic and housing unit estimates, it is the Census Bureau's Population Estimates Program that produces and disseminates the official estimates of the population for the nation, states, counties, cities and towns and estimates of housing units for states and counties.
Clark County, Wisconsin
Estimate Margin of Error Total: 31,732 +/-24 Speak only English 26,309 +/-319 Spanish or Spanish Creole: 1,119 +/-80 Speak English "very well" 757 +/-103 Speak English less than "very well" 362 +/-82
French (incl. Patois, Cajun): 22 +/-15 Speak English "very well" 19 +/-15 Speak English less than "very well" 3 +/-5
French Creole: 0 +/-18 Speak English "very well" 0 +/-18 Speak English less than "very well" 0 +/-18
Italian: 3 +/-4 Speak English "very well" 3 +/-4 Speak English less than "very well" 0 +/-18
Portuguese or Portuguese Creole: 0 +/-18 Speak English "very well" 0 +/-18 Speak English less than "very well" 0 +/-18
German: 1,257 +/-245 Speak English "very well" 829 +/-208 Speak English less than "very well" 428 +/-94
Yiddish: 0 +/-18 Speak English "very well" 0 +/-18 Speak English less than "very well" 0 +/-18
Other West Germanic languages: 2,821 +/-303 Speak English "very well" 1,853 +/-254 Speak English less than "very well" 968 +/-140
Scandinavian languages: 10 +/-9 Speak English "very well" 10 +/-9 Speak English less than "very well" 0 +/-18
Greek: 0 +/-18 Speak English "very well" 0 +/-18 Speak English less than "very well" 0 +/-18
1 of 4 12/16/2016

Clark County, Wisconsin
Estimate Margin of Error Russian: 0 +/-18 Speak English "very well" 0 +/-18 Speak English less than "very well" 0 +/-18
Polish: 30 +/-13 Speak English "very well" 25 +/-12 Speak English less than "very well" 5 +/-5
Serbo-Croatian: 0 +/-18 Speak English "very well" 0 +/-18 Speak English less than "very well" 0 +/-18
Other Slavic languages: 11 +/-8 Speak English "very well" 7 +/-6 Speak English less than "very well" 4 +/-4
Armenian: 0 +/-18 Speak English "very well" 0 +/-18 Speak English less than "very well" 0 +/-18
Persian: 0 +/-18 Speak English "very well" 0 +/-18 Speak English less than "very well" 0 +/-18
Gujarati: 0 +/-18 Speak English "very well" 0 +/-18 Speak English less than "very well" 0 +/-18
Hindi: 0 +/-18 Speak English "very well" 0 +/-18 Speak English less than "very well" 0 +/-18
Urdu: 13 +/-20 Speak English "very well" 13 +/-20 Speak English less than "very well" 0 +/-18
Other Indic languages: 0 +/-18 Speak English "very well" 0 +/-18 Speak English less than "very well" 0 +/-18
Other Indo-European languages: 7 +/-6 Speak English "very well" 5 +/-6 Speak English less than "very well" 2 +/-2
Chinese: 40 +/-46 Speak English "very well" 0 +/-18 Speak English less than "very well" 40 +/-46
Japanese: 5 +/-6 Speak English "very well" 5 +/-6 Speak English less than "very well" 0 +/-18
Korean: 5 +/-5 Speak English "very well" 3 +/-4 Speak English less than "very well" 2 +/-3
Mon-Khmer, Cambodian: 0 +/-18 Speak English "very well" 0 +/-18 Speak English less than "very well" 0 +/-18
Hmong: 0 +/-18 Speak English "very well" 0 +/-18 Speak English less than "very well" 0 +/-18
Thai: 19 +/-17 Speak English "very well" 16 +/-17 Speak English less than "very well" 3 +/-4
Laotian: 3 +/-4 Speak English "very well" 3 +/-4 Speak English less than "very well" 0 +/-18
Vietnamese: 2 +/-4 Speak English "very well" 2 +/-4 Speak English less than "very well" 0 +/-18
Other Asian languages: 0 +/-18 Speak English "very well" 0 +/-18
2 of 4 12/16/2016

Clark County, Wisconsin
Estimate Margin of Error Speak English less than "very well" 0 +/-18
Tagalog: 28 +/-15 Speak English "very well" 19 +/-16 Speak English less than "very well" 9 +/-8
Other Pacific Island languages: 0 +/-18 Speak English "very well" 0 +/-18 Speak English less than "very well" 0 +/-18
Navajo: 0 +/-18 Speak English "very well" 0 +/-18 Speak English less than "very well" 0 +/-18
Other Native North American languages: 20 +/-14 Speak English "very well" 20 +/-14 Speak English less than "very well" 0 +/-18
Hungarian: 2 +/-3 Speak English "very well" 2 +/-3 Speak English less than "very well" 0 +/-18
Arabic: 0 +/-18 Speak English "very well" 0 +/-18 Speak English less than "very well" 0 +/-18
Hebrew: 0 +/-18 Speak English "very well" 0 +/-18 Speak English less than "very well" 0 +/-18
African languages: 0 +/-18 Speak English "very well" 0 +/-18 Speak English less than "very well" 0 +/-18
Other and unspecified languages: 6 +/-6 Speak English "very well" 6 +/-6 Speak English less than "very well" 0 +/-18
Data are based on a sample and are subject to sampling variability. The degree of uncertainty for an estimate arising from sampling variability is represented through the use of a margin of error. The value shown here is the 90 percent margin of error. The margin of error can be interpreted roughly as providing a 90 percent probability that the interval defined by the estimate minus the margin of error and the estimate plus the margin of error (the lower and upper confidence bounds) contains the true value. In addition to sampling variability, the ACS estimates are subject to nonsampling error (for a discussion of nonsampling variability, see Accuracy of the Data). The effect of nonsampling error is not represented in these tables.
Methodological changes to data collection in 2013 may have affected language data for 2013. Users should be aware of these changes when using multi-year data containing data from 2013. For more information, see: Language User Note.
While the 2011-2015 American Community Survey (ACS) data generally reflect the February 2013 Office of Management and Budget (OMB) definitions of metropolitan and micropolitan statistical areas; in certain instances the names, codes, and boundaries of the principal cities shown in ACS tables may differ from the OMB definitions due to differences in the effective dates of the geographic entities.
Estimates of urban and rural population, housing units, and characteristics reflect boundaries of urban areas defined based on Census 2010 data. As a result, data for urban and rural areas from the ACS do not necessarily reflect the results of ongoing urbanization.
Source: U.S. Census Bureau, 2011-2015 American Community Survey 5-Year Estimates
Explanation of Symbols:
1. An '**' entry in the margin of error column indicates that either no sample observations or too few sample observations were available to compute a standard error and thus the margin of error. A statistical test is not appropriate.
2. An '-' entry in the estimate column indicates that either no sample observations or too few sample observations were available to compute an estimate, or a ratio of medians cannot be calculated because one or both of the median estimates falls in the lowest interval or upper interval of an open-ended distribution.
3. An '-' following a median estimate means the median falls in the lowest interval of an open-ended distribution. 4. An '+' following a median estimate means the median falls in the upper interval of an open-ended distribution. 5. An '***' entry in the margin of error column indicates that the median falls in the lowest interval or upper interval of an open-ended distribution. A
statistical test is not appropriate. 6. An '*****' entry in the margin of error column indicates that the estimate is controlled. A statistical test for sampling variability is not appropriate.
3 of 4 12/16/2016

7. An 'N' entry in the estimate and margin of error columns indicates that data for this geographic area cannot be displayed because the number of sample cases is too small.
8. An '(X)' means that the estimate is not applicable or not available.

B16001 LANGUAGE SPOKEN AT HOME BY ABILITY TO SPEAK ENGLISH FOR THE POPULATION 5 YEARS AND OVER Universe: Population 5 years and over 2011-2015 American Community Survey 5-Year Estimates
Supporting documentation on code lists, subject definitions, data accuracy, and statistical testing can be found on the American Community Survey website in the Data and Documentation section.
Sample size and data quality measures (including coverage rates, allocation rates, and response rates) can be found on the American Community Survey website in the Methodology section.
Tell us what you think. Provide feedback to help make American Community Survey data more useful for you.
Although the American Community Survey (ACS) produces population, demographic and housing unit estimates, it is the Census Bureau's Population Estimates Program that produces and disseminates the official estimates of the population for the nation, states, counties, cities and towns and estimates of housing units for states and counties.
Columbia County, Wisconsin
Estimate Margin of Error Total: 53,505 +/-31 Speak only English 51,244 +/-267 Spanish or Spanish Creole: 1,098 +/-147 Speak English "very well" 725 +/-119 Speak English less than "very well" 373 +/-88
French (incl. Patois, Cajun): 61 +/-34 Speak English "very well" 55 +/-33 Speak English less than "very well" 6 +/-8
French Creole: 0 +/-20 Speak English "very well" 0 +/-20 Speak English less than "very well" 0 +/-20
Italian: 12 +/-11 Speak English "very well" 12 +/-11 Speak English less than "very well" 0 +/-20
Portuguese or Portuguese Creole: 0 +/-20 Speak English "very well" 0 +/-20 Speak English less than "very well" 0 +/-20
German: 394 +/-130 Speak English "very well" 318 +/-125 Speak English less than "very well" 76 +/-28
Yiddish: 0 +/-20 Speak English "very well" 0 +/-20 Speak English less than "very well" 0 +/-20
Other West Germanic languages: 298 +/-130 Speak English "very well" 145 +/-84 Speak English less than "very well" 153 +/-58
Scandinavian languages: 2 +/-3 Speak English "very well" 2 +/-3 Speak English less than "very well" 0 +/-20
Greek: 0 +/-20 Speak English "very well" 0 +/-20 Speak English less than "very well" 0 +/-20
1 of 4 12/16/2016

Columbia County, Wisconsin
Estimate Margin of Error Russian: 7 +/-6 Speak English "very well" 7 +/-6 Speak English less than "very well" 0 +/-20
Polish: 116 +/-63 Speak English "very well" 51 +/-31 Speak English less than "very well" 65 +/-39
Serbo-Croatian: 0 +/-20 Speak English "very well" 0 +/-20 Speak English less than "very well" 0 +/-20
Other Slavic languages: 28 +/-33 Speak English "very well" 28 +/-33 Speak English less than "very well" 0 +/-20
Armenian: 0 +/-20 Speak English "very well" 0 +/-20 Speak English less than "very well" 0 +/-20
Persian: 0 +/-20 Speak English "very well" 0 +/-20 Speak English less than "very well" 0 +/-20
Gujarati: 0 +/-20 Speak English "very well" 0 +/-20 Speak English less than "very well" 0 +/-20
Hindi: 0 +/-20 Speak English "very well" 0 +/-20 Speak English less than "very well" 0 +/-20
Urdu: 0 +/-20 Speak English "very well" 0 +/-20 Speak English less than "very well" 0 +/-20
Other Indic languages: 6 +/-9 Speak English "very well" 3 +/-6 Speak English less than "very well" 3 +/-6
Other Indo-European languages: 38 +/-24 Speak English "very well" 36 +/-24 Speak English less than "very well" 2 +/-4
Chinese: 14 +/-14 Speak English "very well" 5 +/-6 Speak English less than "very well" 9 +/-9
Japanese: 19 +/-15 Speak English "very well" 16 +/-14 Speak English less than "very well" 3 +/-5
Korean: 8 +/-10 Speak English "very well" 4 +/-7 Speak English less than "very well" 4 +/-8
Mon-Khmer, Cambodian: 0 +/-20 Speak English "very well" 0 +/-20 Speak English less than "very well" 0 +/-20
Hmong: 16 +/-17 Speak English "very well" 10 +/-10 Speak English less than "very well" 6 +/-8
Thai: 0 +/-20 Speak English "very well" 0 +/-20 Speak English less than "very well" 0 +/-20
Laotian: 0 +/-20 Speak English "very well" 0 +/-20 Speak English less than "very well" 0 +/-20
Vietnamese: 0 +/-20 Speak English "very well" 0 +/-20 Speak English less than "very well" 0 +/-20
Other Asian languages: 4 +/-7 Speak English "very well" 4 +/-7
2 of 4 12/16/2016

Columbia County, Wisconsin
Estimate Margin of Error Speak English less than "very well" 0 +/-20
Tagalog: 67 +/-56 Speak English "very well" 37 +/-36 Speak English less than "very well" 30 +/-22
Other Pacific Island languages: 11 +/-15 Speak English "very well" 9 +/-14 Speak English less than "very well" 2 +/-4
Navajo: 0 +/-20 Speak English "very well" 0 +/-20 Speak English less than "very well" 0 +/-20
Other Native North American languages: 19 +/-23 Speak English "very well" 19 +/-23 Speak English less than "very well" 0 +/-20
Hungarian: 16 +/-12 Speak English "very well" 10 +/-9 Speak English less than "very well" 6 +/-6
Arabic: 10 +/-16 Speak English "very well" 3 +/-4 Speak English less than "very well" 7 +/-15
Hebrew: 2 +/-3 Speak English "very well" 2 +/-3 Speak English less than "very well" 0 +/-20
African languages: 12 +/-19 Speak English "very well" 12 +/-19 Speak English less than "very well" 0 +/-20
Other and unspecified languages: 3 +/-6 Speak English "very well" 3 +/-6 Speak English less than "very well" 0 +/-20
Data are based on a sample and are subject to sampling variability. The degree of uncertainty for an estimate arising from sampling variability is represented through the use of a margin of error. The value shown here is the 90 percent margin of error. The margin of error can be interpreted roughly as providing a 90 percent probability that the interval defined by the estimate minus the margin of error and the estimate plus the margin of error (the lower and upper confidence bounds) contains the true value. In addition to sampling variability, the ACS estimates are subject to nonsampling error (for a discussion of nonsampling variability, see Accuracy of the Data). The effect of nonsampling error is not represented in these tables.
Methodological changes to data collection in 2013 may have affected language data for 2013. Users should be aware of these changes when using multi-year data containing data from 2013. For more information, see: Language User Note.
While the 2011-2015 American Community Survey (ACS) data generally reflect the February 2013 Office of Management and Budget (OMB) definitions of metropolitan and micropolitan statistical areas; in certain instances the names, codes, and boundaries of the principal cities shown in ACS tables may differ from the OMB definitions due to differences in the effective dates of the geographic entities.
Estimates of urban and rural population, housing units, and characteristics reflect boundaries of urban areas defined based on Census 2010 data. As a result, data for urban and rural areas from the ACS do not necessarily reflect the results of ongoing urbanization.
Source: U.S. Census Bureau, 2011-2015 American Community Survey 5-Year Estimates
Explanation of Symbols:
1. An '**' entry in the margin of error column indicates that either no sample observations or too few sample observations were available to compute a standard error and thus the margin of error. A statistical test is not appropriate.
2. An '-' entry in the estimate column indicates that either no sample observations or too few sample observations were available to compute an estimate, or a ratio of medians cannot be calculated because one or both of the median estimates falls in the lowest interval or upper interval of an open-ended distribution.
3. An '-' following a median estimate means the median falls in the lowest interval of an open-ended distribution. 4. An '+' following a median estimate means the median falls in the upper interval of an open-ended distribution. 5. An '***' entry in the margin of error column indicates that the median falls in the lowest interval or upper interval of an open-ended distribution. A
statistical test is not appropriate. 6. An '*****' entry in the margin of error column indicates that the estimate is controlled. A statistical test for sampling variability is not appropriate.
3 of 4 12/16/2016

7. An 'N' entry in the estimate and margin of error columns indicates that data for this geographic area cannot be displayed because the number of sample cases is too small.
8. An '(X)' means that the estimate is not applicable or not available.

B16001 LANGUAGE SPOKEN AT HOME BY ABILITY TO SPEAK ENGLISH FOR THE POPULATION 5 YEARS AND OVER Universe: Population 5 years and over 2011-2015 American Community Survey 5-Year Estimates
Supporting documentation on code lists, subject definitions, data accuracy, and statistical testing can be found on the American Community Survey website in the Data and Documentation section.
Sample size and data quality measures (including coverage rates, allocation rates, and response rates) can be found on the American Community Survey website in the Methodology section.
Tell us what you think. Provide feedback to help make American Community Survey data more useful for you.
Although the American Community Survey (ACS) produces population, demographic and housing unit estimates, it is the Census Bureau's Population Estimates Program that produces and disseminates the official estimates of the population for the nation, states, counties, cities and towns and estimates of housing units for states and counties.
Crawford County, Wisconsin
Estimate Margin of Error Total: 15,644 +/-27 Speak only English 15,174 +/-102 Spanish or Spanish Creole: 159 +/-52 Speak English "very well" 106 +/-46 Speak English less than "very well" 53 +/-23
French (incl. Patois, Cajun): 33 +/-25 Speak English "very well" 3 +/-6 Speak English less than "very well" 30 +/-24
French Creole: 0 +/-14 Speak English "very well" 0 +/-14 Speak English less than "very well" 0 +/-14
Italian: 1 +/-2 Speak English "very well" 1 +/-2 Speak English less than "very well" 0 +/-14
Portuguese or Portuguese Creole: 2 +/-3 Speak English "very well" 0 +/-14 Speak English less than "very well" 2 +/-3
German: 102 +/-66 Speak English "very well" 88 +/-52 Speak English less than "very well" 14 +/-20
Yiddish: 0 +/-14 Speak English "very well" 0 +/-14 Speak English less than "very well" 0 +/-14
Other West Germanic languages: 15 +/-11 Speak English "very well" 6 +/-5 Speak English less than "very well" 9 +/-9
Scandinavian languages: 19 +/-10 Speak English "very well" 12 +/-7 Speak English less than "very well" 7 +/-6
Greek: 0 +/-14 Speak English "very well" 0 +/-14 Speak English less than "very well" 0 +/-14
1 of 4 12/16/2016

Crawford County, Wisconsin
Estimate Margin of Error Russian: 2 +/-3 Speak English "very well" 2 +/-3 Speak English less than "very well" 0 +/-14
Polish: 2 +/-3 Speak English "very well" 2 +/-3 Speak English less than "very well" 0 +/-14
Serbo-Croatian: 0 +/-14 Speak English "very well" 0 +/-14 Speak English less than "very well" 0 +/-14
Other Slavic languages: 27 +/-29 Speak English "very well" 20 +/-23 Speak English less than "very well" 7 +/-8
Armenian: 0 +/-14 Speak English "very well" 0 +/-14 Speak English less than "very well" 0 +/-14
Persian: 0 +/-14 Speak English "very well" 0 +/-14 Speak English less than "very well" 0 +/-14
Gujarati: 0 +/-14 Speak English "very well" 0 +/-14 Speak English less than "very well" 0 +/-14
Hindi: 0 +/-14 Speak English "very well" 0 +/-14 Speak English less than "very well" 0 +/-14
Urdu: 0 +/-14 Speak English "very well" 0 +/-14 Speak English less than "very well" 0 +/-14
Other Indic languages: 0 +/-14 Speak English "very well" 0 +/-14 Speak English less than "very well" 0 +/-14
Other Indo-European languages: 4 +/-5 Speak English "very well" 4 +/-5 Speak English less than "very well" 0 +/-14
Chinese: 8 +/-9 Speak English "very well" 2 +/-3 Speak English less than "very well" 6 +/-9
Japanese: 11 +/-11 Speak English "very well" 11 +/-11 Speak English less than "very well" 0 +/-14
Korean: 13 +/-16 Speak English "very well" 9 +/-12 Speak English less than "very well" 4 +/-5
Mon-Khmer, Cambodian: 0 +/-14 Speak English "very well" 0 +/-14 Speak English less than "very well" 0 +/-14
Hmong: 8 +/-15 Speak English "very well" 8 +/-15 Speak English less than "very well" 0 +/-14
Thai: 3 +/-4 Speak English "very well" 0 +/-14 Speak English less than "very well" 3 +/-4
Laotian: 0 +/-14 Speak English "very well" 0 +/-14 Speak English less than "very well" 0 +/-14
Vietnamese: 0 +/-14 Speak English "very well" 0 +/-14 Speak English less than "very well" 0 +/-14
Other Asian languages: 1 +/-3 Speak English "very well" 1 +/-3
2 of 4 12/16/2016

Crawford County, Wisconsin
Estimate Margin of Error Speak English less than "very well" 0 +/-14
Tagalog: 19 +/-17 Speak English "very well" 11 +/-12 Speak English less than "very well" 8 +/-10
Other Pacific Island languages: 0 +/-14 Speak English "very well" 0 +/-14 Speak English less than "very well" 0 +/-14
Navajo: 0 +/-14 Speak English "very well" 0 +/-14 Speak English less than "very well" 0 +/-14
Other Native North American languages: 28 +/-30 Speak English "very well" 7 +/-8 Speak English less than "very well" 21 +/-29
Hungarian: 0 +/-14 Speak English "very well" 0 +/-14 Speak English less than "very well" 0 +/-14
Arabic: 0 +/-14 Speak English "very well" 0 +/-14 Speak English less than "very well" 0 +/-14
Hebrew: 4 +/-5 Speak English "very well" 4 +/-5 Speak English less than "very well" 0 +/-14
African languages: 7 +/-15 Speak English "very well" 7 +/-15 Speak English less than "very well" 0 +/-14
Other and unspecified languages: 2 +/-4 Speak English "very well" 2 +/-4 Speak English less than "very well" 0 +/-14
Data are based on a sample and are subject to sampling variability. The degree of uncertainty for an estimate arising from sampling variability is represented through the use of a margin of error. The value shown here is the 90 percent margin of error. The margin of error can be interpreted roughly as providing a 90 percent probability that the interval defined by the estimate minus the margin of error and the estimate plus the margin of error (the lower and upper confidence bounds) contains the true value. In addition to sampling variability, the ACS estimates are subject to nonsampling error (for a discussion of nonsampling variability, see Accuracy of the Data). The effect of nonsampling error is not represented in these tables.
Methodological changes to data collection in 2013 may have affected language data for 2013. Users should be aware of these changes when using multi-year data containing data from 2013. For more information, see: Language User Note.
While the 2011-2015 American Community Survey (ACS) data generally reflect the February 2013 Office of Management and Budget (OMB) definitions of metropolitan and micropolitan statistical areas; in certain instances the names, codes, and boundaries of the principal cities shown in ACS tables may differ from the OMB definitions due to differences in the effective dates of the geographic entities.
Estimates of urban and rural population, housing units, and characteristics reflect boundaries of urban areas defined based on Census 2010 data. As a result, data for urban and rural areas from the ACS do not necessarily reflect the results of ongoing urbanization.
Source: U.S. Census Bureau, 2011-2015 American Community Survey 5-Year Estimates
Explanation of Symbols:
1. An '**' entry in the margin of error column indicates that either no sample observations or too few sample observations were available to compute a standard error and thus the margin of error. A statistical test is not appropriate.
2. An '-' entry in the estimate column indicates that either no sample observations or too few sample observations were available to compute an estimate, or a ratio of medians cannot be calculated because one or both of the median estimates falls in the lowest interval or upper interval of an open-ended distribution.
3. An '-' following a median estimate means the median falls in the lowest interval of an open-ended distribution. 4. An '+' following a median estimate means the median falls in the upper interval of an open-ended distribution. 5. An '***' entry in the margin of error column indicates that the median falls in the lowest interval or upper interval of an open-ended distribution. A
statistical test is not appropriate. 6. An '*****' entry in the margin of error column indicates that the estimate is controlled. A statistical test for sampling variability is not appropriate.
3 of 4 12/16/2016

7. An 'N' entry in the estimate and margin of error columns indicates that data for this geographic area cannot be displayed because the number of sample cases is too small.
8. An '(X)' means that the estimate is not applicable or not available.

B16001 LANGUAGE SPOKEN AT HOME BY ABILITY TO SPEAK ENGLISH FOR THE POPULATION 5 YEARS AND OVER Universe: Population 5 years and over 2011-2015 American Community Survey 5-Year Estimates
Supporting documentation on code lists, subject definitions, data accuracy, and statistical testing can be found on the American Community Survey website in the Data and Documentation section.
Sample size and data quality measures (including coverage rates, allocation rates, and response rates) can be found on the American Community Survey website in the Methodology section.
Tell us what you think. Provide feedback to help make American Community Survey data more useful for you.
Although the American Community Survey (ACS) produces population, demographic and housing unit estimates, it is the Census Bureau's Population Estimates Program that produces and disseminates the official estimates of the population for the nation, states, counties, cities and towns and estimates of housing units for states and counties.
Dane County, Wisconsin
Estimate Margin of Error Total: 479,462 +/-24 Speak only English 422,506 +/-1,449 Spanish or Spanish Creole: 24,821 +/-985 Speak English "very well" 14,015 +/-822 Speak English less than "very well" 10,806 +/-848
French (incl. Patois, Cajun): 1,824 +/-286 Speak English "very well" 1,585 +/-279 Speak English less than "very well" 239 +/-122
French Creole: 43 +/-51 Speak English "very well" 43 +/-51 Speak English less than "very well" 0 +/-20
Italian: 441 +/-233 Speak English "very well" 360 +/-218 Speak English less than "very well" 81 +/-71
Portuguese or Portuguese Creole: 348 +/-152 Speak English "very well" 263 +/-137 Speak English less than "very well" 85 +/-58
German: 2,377 +/-426 Speak English "very well" 2,071 +/-388 Speak English less than "very well" 306 +/-108
Yiddish: 50 +/-77 Speak English "very well" 50 +/-77 Speak English less than "very well" 0 +/-20
Other West Germanic languages: 413 +/-202 Speak English "very well" 380 +/-190 Speak English less than "very well" 33 +/-39
Scandinavian languages: 531 +/-203 Speak English "very well" 498 +/-199 Speak English less than "very well" 33 +/-31
Greek: 148 +/-68 Speak English "very well" 148 +/-68 Speak English less than "very well" 0 +/-20
1 of 4 12/16/2016
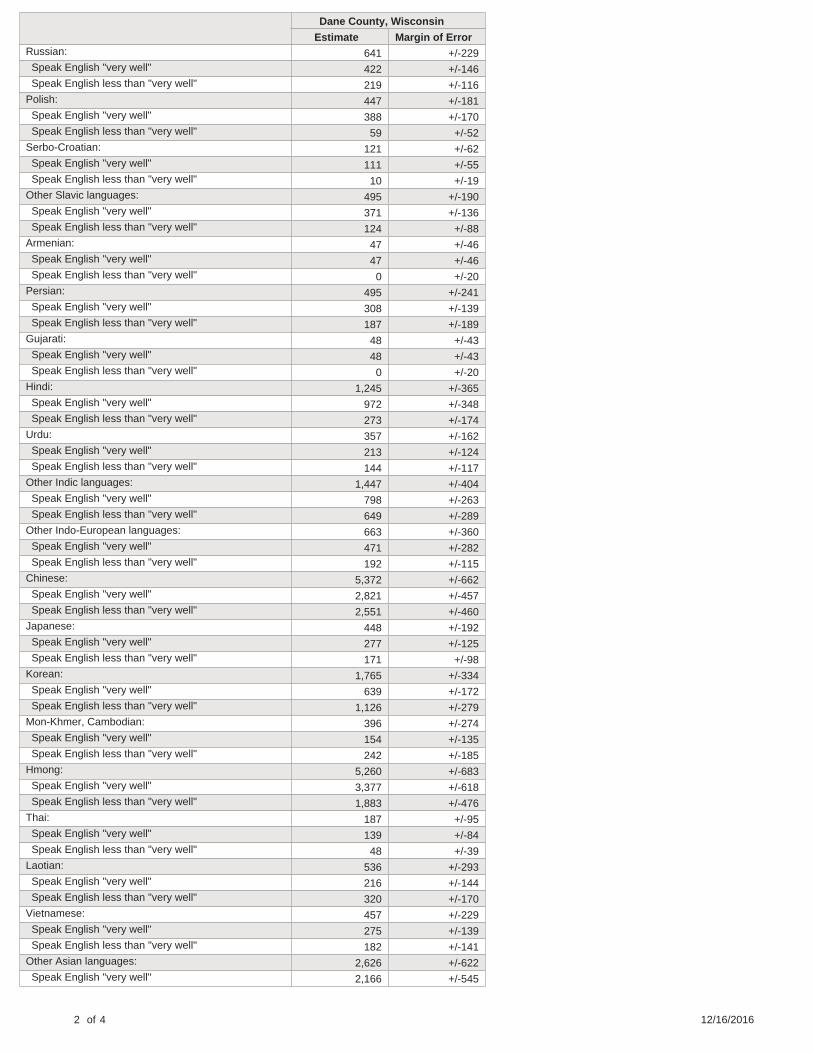
Dane County, Wisconsin
Estimate Margin of Error Russian: 641 +/-229 Speak English "very well" 422 +/-146 Speak English less than "very well" 219 +/-116
Polish: 447 +/-181 Speak English "very well" 388 +/-170 Speak English less than "very well" 59 +/-52
Serbo-Croatian: 121 +/-62 Speak English "very well" 111 +/-55 Speak English less than "very well" 10 +/-19
Other Slavic languages: 495 +/-190 Speak English "very well" 371 +/-136 Speak English less than "very well" 124 +/-88
Armenian: 47 +/-46 Speak English "very well" 47 +/-46 Speak English less than "very well" 0 +/-20
Persian: 495 +/-241 Speak English "very well" 308 +/-139 Speak English less than "very well" 187 +/-189
Gujarati: 48 +/-43 Speak English "very well" 48 +/-43 Speak English less than "very well" 0 +/-20
Hindi: 1,245 +/-365 Speak English "very well" 972 +/-348 Speak English less than "very well" 273 +/-174
Urdu: 357 +/-162 Speak English "very well" 213 +/-124 Speak English less than "very well" 144 +/-117
Other Indic languages: 1,447 +/-404 Speak English "very well" 798 +/-263 Speak English less than "very well" 649 +/-289
Other Indo-European languages: 663 +/-360 Speak English "very well" 471 +/-282 Speak English less than "very well" 192 +/-115
Chinese: 5,372 +/-662 Speak English "very well" 2,821 +/-457 Speak English less than "very well" 2,551 +/-460
Japanese: 448 +/-192 Speak English "very well" 277 +/-125 Speak English less than "very well" 171 +/-98
Korean: 1,765 +/-334 Speak English "very well" 639 +/-172 Speak English less than "very well" 1,126 +/-279
Mon-Khmer, Cambodian: 396 +/-274 Speak English "very well" 154 +/-135 Speak English less than "very well" 242 +/-185
Hmong: 5,260 +/-683 Speak English "very well" 3,377 +/-618 Speak English less than "very well" 1,883 +/-476
Thai: 187 +/-95 Speak English "very well" 139 +/-84 Speak English less than "very well" 48 +/-39
Laotian: 536 +/-293 Speak English "very well" 216 +/-144 Speak English less than "very well" 320 +/-170
Vietnamese: 457 +/-229 Speak English "very well" 275 +/-139 Speak English less than "very well" 182 +/-141
Other Asian languages: 2,626 +/-622 Speak English "very well" 2,166 +/-545
2 of 4 12/16/2016

Dane County, Wisconsin
Estimate Margin of Error Speak English less than "very well" 460 +/-186
Tagalog: 525 +/-184 Speak English "very well" 421 +/-174 Speak English less than "very well" 104 +/-72
Other Pacific Island languages: 288 +/-123 Speak English "very well" 173 +/-96 Speak English less than "very well" 115 +/-52
Navajo: 0 +/-20 Speak English "very well" 0 +/-20 Speak English less than "very well" 0 +/-20
Other Native North American languages: 42 +/-31 Speak English "very well" 42 +/-31 Speak English less than "very well" 0 +/-20
Hungarian: 102 +/-80 Speak English "very well" 102 +/-80 Speak English less than "very well" 0 +/-20
Arabic: 569 +/-211 Speak English "very well" 316 +/-153 Speak English less than "very well" 253 +/-126
Hebrew: 97 +/-56 Speak English "very well" 73 +/-44 Speak English less than "very well" 24 +/-25
African languages: 1,217 +/-432 Speak English "very well" 769 +/-297 Speak English less than "very well" 448 +/-223
Other and unspecified languages: 67 +/-43 Speak English "very well" 67 +/-43 Speak English less than "very well" 0 +/-20
Data are based on a sample and are subject to sampling variability. The degree of uncertainty for an estimate arising from sampling variability is represented through the use of a margin of error. The value shown here is the 90 percent margin of error. The margin of error can be interpreted roughly as providing a 90 percent probability that the interval defined by the estimate minus the margin of error and the estimate plus the margin of error (the lower and upper confidence bounds) contains the true value. In addition to sampling variability, the ACS estimates are subject to nonsampling error (for a discussion of nonsampling variability, see Accuracy of the Data). The effect of nonsampling error is not represented in these tables.
Methodological changes to data collection in 2013 may have affected language data for 2013. Users should be aware of these changes when using multi-year data containing data from 2013. For more information, see: Language User Note.
While the 2011-2015 American Community Survey (ACS) data generally reflect the February 2013 Office of Management and Budget (OMB) definitions of metropolitan and micropolitan statistical areas; in certain instances the names, codes, and boundaries of the principal cities shown in ACS tables may differ from the OMB definitions due to differences in the effective dates of the geographic entities.
Estimates of urban and rural population, housing units, and characteristics reflect boundaries of urban areas defined based on Census 2010 data. As a result, data for urban and rural areas from the ACS do not necessarily reflect the results of ongoing urbanization.
Source: U.S. Census Bureau, 2011-2015 American Community Survey 5-Year Estimates
Explanation of Symbols:
1. An '**' entry in the margin of error column indicates that either no sample observations or too few sample observations were available to compute a standard error and thus the margin of error. A statistical test is not appropriate.
2. An '-' entry in the estimate column indicates that either no sample observations or too few sample observations were available to compute an estimate, or a ratio of medians cannot be calculated because one or both of the median estimates falls in the lowest interval or upper interval of an open-ended distribution.
3. An '-' following a median estimate means the median falls in the lowest interval of an open-ended distribution. 4. An '+' following a median estimate means the median falls in the upper interval of an open-ended distribution. 5. An '***' entry in the margin of error column indicates that the median falls in the lowest interval or upper interval of an open-ended distribution. A
statistical test is not appropriate. 6. An '*****' entry in the margin of error column indicates that the estimate is controlled. A statistical test for sampling variability is not appropriate.
3 of 4 12/16/2016

7. An 'N' entry in the estimate and margin of error columns indicates that data for this geographic area cannot be displayed because the number of sample cases is too small.
8. An '(X)' means that the estimate is not applicable or not available.

B16001 LANGUAGE SPOKEN AT HOME BY ABILITY TO SPEAK ENGLISH FOR THE POPULATION 5 YEARS AND OVER Universe: Population 5 years and over 2011-2015 American Community Survey 5-Year Estimates
Supporting documentation on code lists, subject definitions, data accuracy, and statistical testing can be found on the American Community Survey website in the Data and Documentation section.
Sample size and data quality measures (including coverage rates, allocation rates, and response rates) can be found on the American Community Survey website in the Methodology section.
Tell us what you think. Provide feedback to help make American Community Survey data more useful for you.
Although the American Community Survey (ACS) produces population, demographic and housing unit estimates, it is the Census Bureau's Population Estimates Program that produces and disseminates the official estimates of the population for the nation, states, counties, cities and towns and estimates of housing units for states and counties.
Dodge County, Wisconsin
Estimate Margin of Error Total: 84,033 +/-56 Speak only English 80,317 +/-328 Spanish or Spanish Creole: 2,441 +/-267 Speak English "very well" 1,611 +/-251 Speak English less than "very well" 830 +/-139
French (incl. Patois, Cajun): 68 +/-43 Speak English "very well" 63 +/-42 Speak English less than "very well" 5 +/-9
French Creole: 0 +/-20 Speak English "very well" 0 +/-20 Speak English less than "very well" 0 +/-20
Italian: 18 +/-14 Speak English "very well" 18 +/-14 Speak English less than "very well" 0 +/-20
Portuguese or Portuguese Creole: 0 +/-20 Speak English "very well" 0 +/-20 Speak English less than "very well" 0 +/-20
German: 608 +/-174 Speak English "very well" 522 +/-174 Speak English less than "very well" 86 +/-33
Yiddish: 0 +/-20 Speak English "very well" 0 +/-20 Speak English less than "very well" 0 +/-20
Other West Germanic languages: 5 +/-4 Speak English "very well" 3 +/-4 Speak English less than "very well" 2 +/-3
Scandinavian languages: 6 +/-7 Speak English "very well" 6 +/-7 Speak English less than "very well" 0 +/-20
Greek: 35 +/-45 Speak English "very well" 35 +/-45 Speak English less than "very well" 0 +/-20
1 of 4 12/16/2016

Dodge County, Wisconsin
Estimate Margin of Error Russian: 23 +/-24 Speak English "very well" 19 +/-24 Speak English less than "very well" 4 +/-5
Polish: 58 +/-43 Speak English "very well" 49 +/-39 Speak English less than "very well" 9 +/-18
Serbo-Croatian: 0 +/-20 Speak English "very well" 0 +/-20 Speak English less than "very well" 0 +/-20
Other Slavic languages: 12 +/-11 Speak English "very well" 12 +/-11 Speak English less than "very well" 0 +/-20
Armenian: 0 +/-20 Speak English "very well" 0 +/-20 Speak English less than "very well" 0 +/-20
Persian: 0 +/-20 Speak English "very well" 0 +/-20 Speak English less than "very well" 0 +/-20
Gujarati: 0 +/-20 Speak English "very well" 0 +/-20 Speak English less than "very well" 0 +/-20
Hindi: 0 +/-20 Speak English "very well" 0 +/-20 Speak English less than "very well" 0 +/-20
Urdu: 0 +/-20 Speak English "very well" 0 +/-20 Speak English less than "very well" 0 +/-20
Other Indic languages: 0 +/-20 Speak English "very well" 0 +/-20 Speak English less than "very well" 0 +/-20
Other Indo-European languages: 32 +/-25 Speak English "very well" 32 +/-25 Speak English less than "very well" 0 +/-20
Chinese: 134 +/-96 Speak English "very well" 34 +/-30 Speak English less than "very well" 100 +/-77
Japanese: 12 +/-20 Speak English "very well" 12 +/-20 Speak English less than "very well" 0 +/-20
Korean: 13 +/-13 Speak English "very well" 11 +/-11 Speak English less than "very well" 2 +/-4
Mon-Khmer, Cambodian: 0 +/-20 Speak English "very well" 0 +/-20 Speak English less than "very well" 0 +/-20
Hmong: 86 +/-46 Speak English "very well" 61 +/-40 Speak English less than "very well" 25 +/-28
Thai: 0 +/-20 Speak English "very well" 0 +/-20 Speak English less than "very well" 0 +/-20
Laotian: 22 +/-23 Speak English "very well" 8 +/-11 Speak English less than "very well" 14 +/-20
Vietnamese: 4 +/-9 Speak English "very well" 4 +/-9 Speak English less than "very well" 0 +/-20
Other Asian languages: 0 +/-20 Speak English "very well" 0 +/-20
2 of 4 12/16/2016

Dodge County, Wisconsin
Estimate Margin of Error Speak English less than "very well" 0 +/-20
Tagalog: 35 +/-31 Speak English "very well" 4 +/-5 Speak English less than "very well" 31 +/-30
Other Pacific Island languages: 0 +/-20 Speak English "very well" 0 +/-20 Speak English less than "very well" 0 +/-20
Navajo: 0 +/-20 Speak English "very well" 0 +/-20 Speak English less than "very well" 0 +/-20
Other Native North American languages: 33 +/-24 Speak English "very well" 33 +/-24 Speak English less than "very well" 0 +/-20
Hungarian: 15 +/-23 Speak English "very well" 15 +/-23 Speak English less than "very well" 0 +/-20
Arabic: 11 +/-14 Speak English "very well" 1 +/-2 Speak English less than "very well" 10 +/-14
Hebrew: 24 +/-37 Speak English "very well" 24 +/-37 Speak English less than "very well" 0 +/-20
African languages: 21 +/-24 Speak English "very well" 16 +/-22 Speak English less than "very well" 5 +/-9
Other and unspecified languages: 0 +/-20 Speak English "very well" 0 +/-20 Speak English less than "very well" 0 +/-20
Data are based on a sample and are subject to sampling variability. The degree of uncertainty for an estimate arising from sampling variability is represented through the use of a margin of error. The value shown here is the 90 percent margin of error. The margin of error can be interpreted roughly as providing a 90 percent probability that the interval defined by the estimate minus the margin of error and the estimate plus the margin of error (the lower and upper confidence bounds) contains the true value. In addition to sampling variability, the ACS estimates are subject to nonsampling error (for a discussion of nonsampling variability, see Accuracy of the Data). The effect of nonsampling error is not represented in these tables.
Methodological changes to data collection in 2013 may have affected language data for 2013. Users should be aware of these changes when using multi-year data containing data from 2013. For more information, see: Language User Note.
While the 2011-2015 American Community Survey (ACS) data generally reflect the February 2013 Office of Management and Budget (OMB) definitions of metropolitan and micropolitan statistical areas; in certain instances the names, codes, and boundaries of the principal cities shown in ACS tables may differ from the OMB definitions due to differences in the effective dates of the geographic entities.
Estimates of urban and rural population, housing units, and characteristics reflect boundaries of urban areas defined based on Census 2010 data. As a result, data for urban and rural areas from the ACS do not necessarily reflect the results of ongoing urbanization.
Source: U.S. Census Bureau, 2011-2015 American Community Survey 5-Year Estimates
Explanation of Symbols:
1. An '**' entry in the margin of error column indicates that either no sample observations or too few sample observations were available to compute a standard error and thus the margin of error. A statistical test is not appropriate.
2. An '-' entry in the estimate column indicates that either no sample observations or too few sample observations were available to compute an estimate, or a ratio of medians cannot be calculated because one or both of the median estimates falls in the lowest interval or upper interval of an open-ended distribution.
3. An '-' following a median estimate means the median falls in the lowest interval of an open-ended distribution. 4. An '+' following a median estimate means the median falls in the upper interval of an open-ended distribution. 5. An '***' entry in the margin of error column indicates that the median falls in the lowest interval or upper interval of an open-ended distribution. A
statistical test is not appropriate. 6. An '*****' entry in the margin of error column indicates that the estimate is controlled. A statistical test for sampling variability is not appropriate.
3 of 4 12/16/2016

7. An 'N' entry in the estimate and margin of error columns indicates that data for this geographic area cannot be displayed because the number of sample cases is too small.
8. An '(X)' means that the estimate is not applicable or not available.

B16001 LANGUAGE SPOKEN AT HOME BY ABILITY TO SPEAK ENGLISH FOR THE POPULATION 5 YEARS AND OVER Universe: Population 5 years and over 2011-2015 American Community Survey 5-Year Estimates
Supporting documentation on code lists, subject definitions, data accuracy, and statistical testing can be found on the American Community Survey website in the Data and Documentation section.
Sample size and data quality measures (including coverage rates, allocation rates, and response rates) can be found on the American Community Survey website in the Methodology section.
Tell us what you think. Provide feedback to help make American Community Survey data more useful for you.
Although the American Community Survey (ACS) produces population, demographic and housing unit estimates, it is the Census Bureau's Population Estimates Program that produces and disseminates the official estimates of the population for the nation, states, counties, cities and towns and estimates of housing units for states and counties.
Door County, Wisconsin
Estimate Margin of Error Total: 26,636 +/-25 Speak only English 25,669 +/-147 Spanish or Spanish Creole: 531 +/-106 Speak English "very well" 398 +/-95 Speak English less than "very well" 133 +/-56
French (incl. Patois, Cajun): 53 +/-37 Speak English "very well" 47 +/-36 Speak English less than "very well" 6 +/-7
French Creole: 0 +/-16 Speak English "very well" 0 +/-16 Speak English less than "very well" 0 +/-16
Italian: 31 +/-36 Speak English "very well" 6 +/-12 Speak English less than "very well" 25 +/-33
Portuguese or Portuguese Creole: 9 +/-12 Speak English "very well" 0 +/-16 Speak English less than "very well" 9 +/-12
German: 150 +/-54 Speak English "very well" 135 +/-56 Speak English less than "very well" 15 +/-15
Yiddish: 8 +/-18 Speak English "very well" 8 +/-18 Speak English less than "very well" 0 +/-16
Other West Germanic languages: 52 +/-22 Speak English "very well" 34 +/-16 Speak English less than "very well" 18 +/-15
Scandinavian languages: 20 +/-19 Speak English "very well" 20 +/-19 Speak English less than "very well" 0 +/-16
Greek: 3 +/-6 Speak English "very well" 3 +/-6 Speak English less than "very well" 0 +/-16
1 of 4 12/16/2016

Door County, Wisconsin
Estimate Margin of Error Russian: 23 +/-24 Speak English "very well" 8 +/-8 Speak English less than "very well" 15 +/-23
Polish: 9 +/-9 Speak English "very well" 7 +/-8 Speak English less than "very well" 2 +/-3
Serbo-Croatian: 0 +/-16 Speak English "very well" 0 +/-16 Speak English less than "very well" 0 +/-16
Other Slavic languages: 8 +/-7 Speak English "very well" 7 +/-6 Speak English less than "very well" 1 +/-2
Armenian: 0 +/-16 Speak English "very well" 0 +/-16 Speak English less than "very well" 0 +/-16
Persian: 0 +/-16 Speak English "very well" 0 +/-16 Speak English less than "very well" 0 +/-16
Gujarati: 0 +/-16 Speak English "very well" 0 +/-16 Speak English less than "very well" 0 +/-16
Hindi: 0 +/-16 Speak English "very well" 0 +/-16 Speak English less than "very well" 0 +/-16
Urdu: 0 +/-16 Speak English "very well" 0 +/-16 Speak English less than "very well" 0 +/-16
Other Indic languages: 0 +/-16 Speak English "very well" 0 +/-16 Speak English less than "very well" 0 +/-16
Other Indo-European languages: 0 +/-16 Speak English "very well" 0 +/-16 Speak English less than "very well" 0 +/-16
Chinese: 44 +/-42 Speak English "very well" 1 +/-3 Speak English less than "very well" 43 +/-42
Japanese: 15 +/-27 Speak English "very well" 0 +/-16 Speak English less than "very well" 15 +/-27
Korean: 0 +/-16 Speak English "very well" 0 +/-16 Speak English less than "very well" 0 +/-16
Mon-Khmer, Cambodian: 0 +/-16 Speak English "very well" 0 +/-16 Speak English less than "very well" 0 +/-16
Hmong: 0 +/-16 Speak English "very well" 0 +/-16 Speak English less than "very well" 0 +/-16
Thai: 0 +/-16 Speak English "very well" 0 +/-16 Speak English less than "very well" 0 +/-16
Laotian: 0 +/-16 Speak English "very well" 0 +/-16 Speak English less than "very well" 0 +/-16
Vietnamese: 2 +/-5 Speak English "very well" 2 +/-5 Speak English less than "very well" 0 +/-16
Other Asian languages: 7 +/-15 Speak English "very well" 6 +/-14
2 of 4 12/16/2016

Door County, Wisconsin
Estimate Margin of Error Speak English less than "very well" 1 +/-3
Tagalog: 0 +/-16 Speak English "very well" 0 +/-16 Speak English less than "very well" 0 +/-16
Other Pacific Island languages: 0 +/-16 Speak English "very well" 0 +/-16 Speak English less than "very well" 0 +/-16
Navajo: 0 +/-16 Speak English "very well" 0 +/-16 Speak English less than "very well" 0 +/-16
Other Native North American languages: 0 +/-16 Speak English "very well" 0 +/-16 Speak English less than "very well" 0 +/-16
Hungarian: 2 +/-3 Speak English "very well" 2 +/-3 Speak English less than "very well" 0 +/-16
Arabic: 0 +/-16 Speak English "very well" 0 +/-16 Speak English less than "very well" 0 +/-16
Hebrew: 0 +/-16 Speak English "very well" 0 +/-16 Speak English less than "very well" 0 +/-16
African languages: 0 +/-16 Speak English "very well" 0 +/-16 Speak English less than "very well" 0 +/-16
Other and unspecified languages: 0 +/-16 Speak English "very well" 0 +/-16 Speak English less than "very well" 0 +/-16
Data are based on a sample and are subject to sampling variability. The degree of uncertainty for an estimate arising from sampling variability is represented through the use of a margin of error. The value shown here is the 90 percent margin of error. The margin of error can be interpreted roughly as providing a 90 percent probability that the interval defined by the estimate minus the margin of error and the estimate plus the margin of error (the lower and upper confidence bounds) contains the true value. In addition to sampling variability, the ACS estimates are subject to nonsampling error (for a discussion of nonsampling variability, see Accuracy of the Data). The effect of nonsampling error is not represented in these tables.
Methodological changes to data collection in 2013 may have affected language data for 2013. Users should be aware of these changes when using multi-year data containing data from 2013. For more information, see: Language User Note.
While the 2011-2015 American Community Survey (ACS) data generally reflect the February 2013 Office of Management and Budget (OMB) definitions of metropolitan and micropolitan statistical areas; in certain instances the names, codes, and boundaries of the principal cities shown in ACS tables may differ from the OMB definitions due to differences in the effective dates of the geographic entities.
Estimates of urban and rural population, housing units, and characteristics reflect boundaries of urban areas defined based on Census 2010 data. As a result, data for urban and rural areas from the ACS do not necessarily reflect the results of ongoing urbanization.
Source: U.S. Census Bureau, 2011-2015 American Community Survey 5-Year Estimates
Explanation of Symbols:
1. An '**' entry in the margin of error column indicates that either no sample observations or too few sample observations were available to compute a standard error and thus the margin of error. A statistical test is not appropriate.
2. An '-' entry in the estimate column indicates that either no sample observations or too few sample observations were available to compute an estimate, or a ratio of medians cannot be calculated because one or both of the median estimates falls in the lowest interval or upper interval of an open-ended distribution.
3. An '-' following a median estimate means the median falls in the lowest interval of an open-ended distribution. 4. An '+' following a median estimate means the median falls in the upper interval of an open-ended distribution. 5. An '***' entry in the margin of error column indicates that the median falls in the lowest interval or upper interval of an open-ended distribution. A
statistical test is not appropriate. 6. An '*****' entry in the margin of error column indicates that the estimate is controlled. A statistical test for sampling variability is not appropriate.
3 of 4 12/16/2016

7. An 'N' entry in the estimate and margin of error columns indicates that data for this geographic area cannot be displayed because the number of sample cases is too small.
8. An '(X)' means that the estimate is not applicable or not available.

B16001 LANGUAGE SPOKEN AT HOME BY ABILITY TO SPEAK ENGLISH FOR THE POPULATION 5 YEARS AND OVER Universe: Population 5 years and over 2011-2015 American Community Survey 5-Year Estimates
Supporting documentation on code lists, subject definitions, data accuracy, and statistical testing can be found on the American Community Survey website in the Data and Documentation section.
Sample size and data quality measures (including coverage rates, allocation rates, and response rates) can be found on the American Community Survey website in the Methodology section.
Tell us what you think. Provide feedback to help make American Community Survey data more useful for you.
Although the American Community Survey (ACS) produces population, demographic and housing unit estimates, it is the Census Bureau's Population Estimates Program that produces and disseminates the official estimates of the population for the nation, states, counties, cities and towns and estimates of housing units for states and counties.
Douglas County, Wisconsin
Estimate Margin of Error Total: 41,395 +/-37 Speak only English 40,115 +/-253 Spanish or Spanish Creole: 344 +/-98 Speak English "very well" 292 +/-91 Speak English less than "very well" 52 +/-36
French (incl. Patois, Cajun): 52 +/-36 Speak English "very well" 52 +/-36 Speak English less than "very well" 0 +/-18
French Creole: 0 +/-18 Speak English "very well" 0 +/-18 Speak English less than "very well" 0 +/-18
Italian: 11 +/-11 Speak English "very well" 11 +/-11 Speak English less than "very well" 0 +/-18
Portuguese or Portuguese Creole: 7 +/-10 Speak English "very well" 4 +/-7 Speak English less than "very well" 3 +/-4
German: 252 +/-158 Speak English "very well" 215 +/-154 Speak English less than "very well" 37 +/-22
Yiddish: 0 +/-18 Speak English "very well" 0 +/-18 Speak English less than "very well" 0 +/-18
Other West Germanic languages: 12 +/-12 Speak English "very well" 12 +/-12 Speak English less than "very well" 0 +/-18
Scandinavian languages: 12 +/-15 Speak English "very well" 5 +/-8 Speak English less than "very well" 7 +/-13
Greek: 7 +/-9 Speak English "very well" 4 +/-8 Speak English less than "very well" 3 +/-4
1 of 4 12/16/2016

Douglas County, Wisconsin
Estimate Margin of Error Russian: 15 +/-21 Speak English "very well" 15 +/-21 Speak English less than "very well" 0 +/-18
Polish: 24 +/-21 Speak English "very well" 17 +/-16 Speak English less than "very well" 7 +/-14
Serbo-Croatian: 0 +/-18 Speak English "very well" 0 +/-18 Speak English less than "very well" 0 +/-18
Other Slavic languages: 6 +/-8 Speak English "very well" 6 +/-8 Speak English less than "very well" 0 +/-18
Armenian: 0 +/-18 Speak English "very well" 0 +/-18 Speak English less than "very well" 0 +/-18
Persian: 20 +/-25 Speak English "very well" 20 +/-25 Speak English less than "very well" 0 +/-18
Gujarati: 0 +/-18 Speak English "very well" 0 +/-18 Speak English less than "very well" 0 +/-18
Hindi: 31 +/-48 Speak English "very well" 0 +/-18 Speak English less than "very well" 31 +/-48
Urdu: 28 +/-30 Speak English "very well" 28 +/-30 Speak English less than "very well" 0 +/-18
Other Indic languages: 27 +/-25 Speak English "very well" 23 +/-23 Speak English less than "very well" 4 +/-10
Other Indo-European languages: 0 +/-18 Speak English "very well" 0 +/-18 Speak English less than "very well" 0 +/-18
Chinese: 13 +/-14 Speak English "very well" 12 +/-14 Speak English less than "very well" 1 +/-4
Japanese: 15 +/-17 Speak English "very well" 3 +/-4 Speak English less than "very well" 12 +/-16
Korean: 48 +/-30 Speak English "very well" 28 +/-26 Speak English less than "very well" 20 +/-19
Mon-Khmer, Cambodian: 0 +/-18 Speak English "very well" 0 +/-18 Speak English less than "very well" 0 +/-18
Hmong: 120 +/-76 Speak English "very well" 86 +/-55 Speak English less than "very well" 34 +/-23
Thai: 0 +/-18 Speak English "very well" 0 +/-18 Speak English less than "very well" 0 +/-18
Laotian: 4 +/-5 Speak English "very well" 2 +/-4 Speak English less than "very well" 2 +/-3
Vietnamese: 32 +/-33 Speak English "very well" 6 +/-13 Speak English less than "very well" 26 +/-26
Other Asian languages: 0 +/-18 Speak English "very well" 0 +/-18
2 of 4 12/16/2016

Douglas County, Wisconsin
Estimate Margin of Error Speak English less than "very well" 0 +/-18
Tagalog: 20 +/-23 Speak English "very well" 20 +/-23 Speak English less than "very well" 0 +/-18
Other Pacific Island languages: 4 +/-8 Speak English "very well" 4 +/-8 Speak English less than "very well" 0 +/-18
Navajo: 0 +/-18 Speak English "very well" 0 +/-18 Speak English less than "very well" 0 +/-18
Other Native North American languages: 21 +/-15 Speak English "very well" 18 +/-14 Speak English less than "very well" 3 +/-5
Hungarian: 0 +/-18 Speak English "very well" 0 +/-18 Speak English less than "very well" 0 +/-18
Arabic: 22 +/-26 Speak English "very well" 14 +/-17 Speak English less than "very well" 8 +/-9
Hebrew: 0 +/-18 Speak English "very well" 0 +/-18 Speak English less than "very well" 0 +/-18
African languages: 64 +/-77 Speak English "very well" 64 +/-77 Speak English less than "very well" 0 +/-18
Other and unspecified languages: 69 +/-26 Speak English "very well" 49 +/-22 Speak English less than "very well" 20 +/-12
Data are based on a sample and are subject to sampling variability. The degree of uncertainty for an estimate arising from sampling variability is represented through the use of a margin of error. The value shown here is the 90 percent margin of error. The margin of error can be interpreted roughly as providing a 90 percent probability that the interval defined by the estimate minus the margin of error and the estimate plus the margin of error (the lower and upper confidence bounds) contains the true value. In addition to sampling variability, the ACS estimates are subject to nonsampling error (for a discussion of nonsampling variability, see Accuracy of the Data). The effect of nonsampling error is not represented in these tables.
Methodological changes to data collection in 2013 may have affected language data for 2013. Users should be aware of these changes when using multi-year data containing data from 2013. For more information, see: Language User Note.
While the 2011-2015 American Community Survey (ACS) data generally reflect the February 2013 Office of Management and Budget (OMB) definitions of metropolitan and micropolitan statistical areas; in certain instances the names, codes, and boundaries of the principal cities shown in ACS tables may differ from the OMB definitions due to differences in the effective dates of the geographic entities.
Estimates of urban and rural population, housing units, and characteristics reflect boundaries of urban areas defined based on Census 2010 data. As a result, data for urban and rural areas from the ACS do not necessarily reflect the results of ongoing urbanization.
Source: U.S. Census Bureau, 2011-2015 American Community Survey 5-Year Estimates
Explanation of Symbols:
1. An '**' entry in the margin of error column indicates that either no sample observations or too few sample observations were available to compute a standard error and thus the margin of error. A statistical test is not appropriate.
2. An '-' entry in the estimate column indicates that either no sample observations or too few sample observations were available to compute an estimate, or a ratio of medians cannot be calculated because one or both of the median estimates falls in the lowest interval or upper interval of an open-ended distribution.
3. An '-' following a median estimate means the median falls in the lowest interval of an open-ended distribution. 4. An '+' following a median estimate means the median falls in the upper interval of an open-ended distribution. 5. An '***' entry in the margin of error column indicates that the median falls in the lowest interval or upper interval of an open-ended distribution. A
statistical test is not appropriate. 6. An '*****' entry in the margin of error column indicates that the estimate is controlled. A statistical test for sampling variability is not appropriate.
3 of 4 12/16/2016

7. An 'N' entry in the estimate and margin of error columns indicates that data for this geographic area cannot be displayed because the number of sample cases is too small.
8. An '(X)' means that the estimate is not applicable or not available.

B16001 LANGUAGE SPOKEN AT HOME BY ABILITY TO SPEAK ENGLISH FOR THE POPULATION 5 YEARS AND OVER Universe: Population 5 years and over 2011-2015 American Community Survey 5-Year Estimates
Supporting documentation on code lists, subject definitions, data accuracy, and statistical testing can be found on the American Community Survey website in the Data and Documentation section.
Sample size and data quality measures (including coverage rates, allocation rates, and response rates) can be found on the American Community Survey website in the Methodology section.
Tell us what you think. Provide feedback to help make American Community Survey data more useful for you.
Although the American Community Survey (ACS) produces population, demographic and housing unit estimates, it is the Census Bureau's Population Estimates Program that produces and disseminates the official estimates of the population for the nation, states, counties, cities and towns and estimates of housing units for states and counties.
Dunn County, Wisconsin
Estimate Margin of Error Total: 41,904 +/-113 Speak only English 40,142 +/-351 Spanish or Spanish Creole: 653 +/-171 Speak English "very well" 471 +/-167 Speak English less than "very well" 182 +/-96
French (incl. Patois, Cajun): 21 +/-19 Speak English "very well" 6 +/-5 Speak English less than "very well" 15 +/-20
French Creole: 0 +/-18 Speak English "very well" 0 +/-18 Speak English less than "very well" 0 +/-18
Italian: 6 +/-5 Speak English "very well" 3 +/-4 Speak English less than "very well" 3 +/-4
Portuguese or Portuguese Creole: 10 +/-15 Speak English "very well" 0 +/-18 Speak English less than "very well" 10 +/-15
German: 93 +/-39 Speak English "very well" 83 +/-37 Speak English less than "very well" 10 +/-13
Yiddish: 0 +/-18 Speak English "very well" 0 +/-18 Speak English less than "very well" 0 +/-18
Other West Germanic languages: 39 +/-28 Speak English "very well" 19 +/-16 Speak English less than "very well" 20 +/-23
Scandinavian languages: 39 +/-29 Speak English "very well" 25 +/-20 Speak English less than "very well" 14 +/-21
Greek: 10 +/-10 Speak English "very well" 10 +/-10 Speak English less than "very well" 0 +/-18
1 of 4 12/16/2016

Dunn County, Wisconsin
Estimate Margin of Error Russian: 12 +/-19 Speak English "very well" 12 +/-19 Speak English less than "very well" 0 +/-18
Polish: 0 +/-18 Speak English "very well" 0 +/-18 Speak English less than "very well" 0 +/-18
Serbo-Croatian: 0 +/-18 Speak English "very well" 0 +/-18 Speak English less than "very well" 0 +/-18
Other Slavic languages: 3 +/-5 Speak English "very well" 3 +/-5 Speak English less than "very well" 0 +/-18
Armenian: 0 +/-18 Speak English "very well" 0 +/-18 Speak English less than "very well" 0 +/-18
Persian: 13 +/-11 Speak English "very well" 13 +/-11 Speak English less than "very well" 0 +/-18
Gujarati: 0 +/-18 Speak English "very well" 0 +/-18 Speak English less than "very well" 0 +/-18
Hindi: 0 +/-18 Speak English "very well" 0 +/-18 Speak English less than "very well" 0 +/-18
Urdu: 0 +/-18 Speak English "very well" 0 +/-18 Speak English less than "very well" 0 +/-18
Other Indic languages: 12 +/-16 Speak English "very well" 6 +/-8 Speak English less than "very well" 6 +/-9
Other Indo-European languages: 47 +/-45 Speak English "very well" 47 +/-45 Speak English less than "very well" 0 +/-18
Chinese: 155 +/-166 Speak English "very well" 38 +/-44 Speak English less than "very well" 117 +/-160
Japanese: 0 +/-18 Speak English "very well" 0 +/-18 Speak English less than "very well" 0 +/-18
Korean: 8 +/-13 Speak English "very well" 3 +/-5 Speak English less than "very well" 5 +/-10
Mon-Khmer, Cambodian: 0 +/-18 Speak English "very well" 0 +/-18 Speak English less than "very well" 0 +/-18
Hmong: 436 +/-170 Speak English "very well" 255 +/-128 Speak English less than "very well" 181 +/-94
Thai: 0 +/-18 Speak English "very well" 0 +/-18 Speak English less than "very well" 0 +/-18
Laotian: 0 +/-18 Speak English "very well" 0 +/-18 Speak English less than "very well" 0 +/-18
Vietnamese: 15 +/-20 Speak English "very well" 15 +/-20 Speak English less than "very well" 0 +/-18
Other Asian languages: 0 +/-18 Speak English "very well" 0 +/-18
2 of 4 12/16/2016

Dunn County, Wisconsin
Estimate Margin of Error Speak English less than "very well" 0 +/-18
Tagalog: 45 +/-42 Speak English "very well" 43 +/-41 Speak English less than "very well" 2 +/-5
Other Pacific Island languages: 0 +/-18 Speak English "very well" 0 +/-18 Speak English less than "very well" 0 +/-18
Navajo: 0 +/-18 Speak English "very well" 0 +/-18 Speak English less than "very well" 0 +/-18
Other Native North American languages: 5 +/-12 Speak English "very well" 5 +/-12 Speak English less than "very well" 0 +/-18
Hungarian: 0 +/-18 Speak English "very well" 0 +/-18 Speak English less than "very well" 0 +/-18
Arabic: 128 +/-157 Speak English "very well" 21 +/-32 Speak English less than "very well" 107 +/-153
Hebrew: 0 +/-18 Speak English "very well" 0 +/-18 Speak English less than "very well" 0 +/-18
African languages: 12 +/-16 Speak English "very well" 12 +/-16 Speak English less than "very well" 0 +/-18
Other and unspecified languages: 0 +/-18 Speak English "very well" 0 +/-18 Speak English less than "very well" 0 +/-18
Data are based on a sample and are subject to sampling variability. The degree of uncertainty for an estimate arising from sampling variability is represented through the use of a margin of error. The value shown here is the 90 percent margin of error. The margin of error can be interpreted roughly as providing a 90 percent probability that the interval defined by the estimate minus the margin of error and the estimate plus the margin of error (the lower and upper confidence bounds) contains the true value. In addition to sampling variability, the ACS estimates are subject to nonsampling error (for a discussion of nonsampling variability, see Accuracy of the Data). The effect of nonsampling error is not represented in these tables.
Methodological changes to data collection in 2013 may have affected language data for 2013. Users should be aware of these changes when using multi-year data containing data from 2013. For more information, see: Language User Note.
While the 2011-2015 American Community Survey (ACS) data generally reflect the February 2013 Office of Management and Budget (OMB) definitions of metropolitan and micropolitan statistical areas; in certain instances the names, codes, and boundaries of the principal cities shown in ACS tables may differ from the OMB definitions due to differences in the effective dates of the geographic entities.
Estimates of urban and rural population, housing units, and characteristics reflect boundaries of urban areas defined based on Census 2010 data. As a result, data for urban and rural areas from the ACS do not necessarily reflect the results of ongoing urbanization.
Source: U.S. Census Bureau, 2011-2015 American Community Survey 5-Year Estimates
Explanation of Symbols:
1. An '**' entry in the margin of error column indicates that either no sample observations or too few sample observations were available to compute a standard error and thus the margin of error. A statistical test is not appropriate.
2. An '-' entry in the estimate column indicates that either no sample observations or too few sample observations were available to compute an estimate, or a ratio of medians cannot be calculated because one or both of the median estimates falls in the lowest interval or upper interval of an open-ended distribution.
3. An '-' following a median estimate means the median falls in the lowest interval of an open-ended distribution. 4. An '+' following a median estimate means the median falls in the upper interval of an open-ended distribution. 5. An '***' entry in the margin of error column indicates that the median falls in the lowest interval or upper interval of an open-ended distribution. A
statistical test is not appropriate. 6. An '*****' entry in the margin of error column indicates that the estimate is controlled. A statistical test for sampling variability is not appropriate.
3 of 4 12/16/2016

7. An 'N' entry in the estimate and margin of error columns indicates that data for this geographic area cannot be displayed because the number of sample cases is too small.
8. An '(X)' means that the estimate is not applicable or not available.

B16001 LANGUAGE SPOKEN AT HOME BY ABILITY TO SPEAK ENGLISH FOR THE POPULATION 5 YEARS AND OVER Universe: Population 5 years and over 2011-2015 American Community Survey 5-Year Estimates
Supporting documentation on code lists, subject definitions, data accuracy, and statistical testing can be found on the American Community Survey website in the Data and Documentation section.
Sample size and data quality measures (including coverage rates, allocation rates, and response rates) can be found on the American Community Survey website in the Methodology section.
Tell us what you think. Provide feedback to help make American Community Survey data more useful for you.
Although the American Community Survey (ACS) produces population, demographic and housing unit estimates, it is the Census Bureau's Population Estimates Program that produces and disseminates the official estimates of the population for the nation, states, counties, cities and towns and estimates of housing units for states and counties.
Eau Claire County, Wisconsin
Estimate Margin of Error Total: 95,379 +/-58 Speak only English 89,406 +/-569 Spanish or Spanish Creole: 1,271 +/-284 Speak English "very well" 766 +/-241 Speak English less than "very well" 505 +/-168
French (incl. Patois, Cajun): 159 +/-103 Speak English "very well" 131 +/-97 Speak English less than "very well" 28 +/-25
French Creole: 0 +/-20 Speak English "very well" 0 +/-20 Speak English less than "very well" 0 +/-20
Italian: 58 +/-49 Speak English "very well" 17 +/-15 Speak English less than "very well" 41 +/-47
Portuguese or Portuguese Creole: 11 +/-12 Speak English "very well" 11 +/-12 Speak English less than "very well" 0 +/-20
German: 864 +/-305 Speak English "very well" 706 +/-266 Speak English less than "very well" 158 +/-91
Yiddish: 0 +/-20 Speak English "very well" 0 +/-20 Speak English less than "very well" 0 +/-20
Other West Germanic languages: 469 +/-192 Speak English "very well" 283 +/-134 Speak English less than "very well" 186 +/-106
Scandinavian languages: 64 +/-32 Speak English "very well" 63 +/-32 Speak English less than "very well" 1 +/-2
Greek: 42 +/-52 Speak English "very well" 42 +/-52 Speak English less than "very well" 0 +/-20
1 of 4 12/16/2016

Eau Claire County, Wisconsin
Estimate Margin of Error Russian: 19 +/-24 Speak English "very well" 0 +/-20 Speak English less than "very well" 19 +/-24
Polish: 63 +/-78 Speak English "very well" 63 +/-78 Speak English less than "very well" 0 +/-20
Serbo-Croatian: 47 +/-41 Speak English "very well" 38 +/-35 Speak English less than "very well" 9 +/-14
Other Slavic languages: 25 +/-29 Speak English "very well" 25 +/-29 Speak English less than "very well" 0 +/-20
Armenian: 0 +/-20 Speak English "very well" 0 +/-20 Speak English less than "very well" 0 +/-20
Persian: 0 +/-20 Speak English "very well" 0 +/-20 Speak English less than "very well" 0 +/-20
Gujarati: 10 +/-17 Speak English "very well" 0 +/-20 Speak English less than "very well" 10 +/-17
Hindi: 8 +/-16 Speak English "very well" 8 +/-16 Speak English less than "very well" 0 +/-20
Urdu: 131 +/-127 Speak English "very well" 36 +/-37 Speak English less than "very well" 95 +/-116
Other Indic languages: 164 +/-127 Speak English "very well" 139 +/-129 Speak English less than "very well" 25 +/-33
Other Indo-European languages: 38 +/-41 Speak English "very well" 38 +/-41 Speak English less than "very well" 0 +/-20
Chinese: 386 +/-172 Speak English "very well" 139 +/-88 Speak English less than "very well" 247 +/-131
Japanese: 40 +/-49 Speak English "very well" 39 +/-49 Speak English less than "very well" 1 +/-2
Korean: 80 +/-67 Speak English "very well" 23 +/-19 Speak English less than "very well" 57 +/-63
Mon-Khmer, Cambodian: 4 +/-8 Speak English "very well" 4 +/-8 Speak English less than "very well" 0 +/-20
Hmong: 1,593 +/-367 Speak English "very well" 822 +/-251 Speak English less than "very well" 771 +/-210
Thai: 44 +/-43 Speak English "very well" 4 +/-5 Speak English less than "very well" 40 +/-43
Laotian: 0 +/-20 Speak English "very well" 0 +/-20 Speak English less than "very well" 0 +/-20
Vietnamese: 10 +/-13 Speak English "very well" 0 +/-20 Speak English less than "very well" 10 +/-13
Other Asian languages: 0 +/-20 Speak English "very well" 0 +/-20
2 of 4 12/16/2016

Eau Claire County, Wisconsin
Estimate Margin of Error Speak English less than "very well" 0 +/-20
Tagalog: 135 +/-67 Speak English "very well" 100 +/-47 Speak English less than "very well" 35 +/-46
Other Pacific Island languages: 97 +/-102 Speak English "very well" 64 +/-63 Speak English less than "very well" 33 +/-48
Navajo: 2 +/-3 Speak English "very well" 2 +/-3 Speak English less than "very well" 0 +/-20
Other Native North American languages: 30 +/-26 Speak English "very well" 30 +/-26 Speak English less than "very well" 0 +/-20
Hungarian: 0 +/-20 Speak English "very well" 0 +/-20 Speak English less than "very well" 0 +/-20
Arabic: 25 +/-48 Speak English "very well" 25 +/-48 Speak English less than "very well" 0 +/-20
Hebrew: 8 +/-15 Speak English "very well" 8 +/-15 Speak English less than "very well" 0 +/-20
African languages: 76 +/-64 Speak English "very well" 55 +/-45 Speak English less than "very well" 21 +/-29
Other and unspecified languages: 0 +/-20 Speak English "very well" 0 +/-20 Speak English less than "very well" 0 +/-20
Data are based on a sample and are subject to sampling variability. The degree of uncertainty for an estimate arising from sampling variability is represented through the use of a margin of error. The value shown here is the 90 percent margin of error. The margin of error can be interpreted roughly as providing a 90 percent probability that the interval defined by the estimate minus the margin of error and the estimate plus the margin of error (the lower and upper confidence bounds) contains the true value. In addition to sampling variability, the ACS estimates are subject to nonsampling error (for a discussion of nonsampling variability, see Accuracy of the Data). The effect of nonsampling error is not represented in these tables.
Methodological changes to data collection in 2013 may have affected language data for 2013. Users should be aware of these changes when using multi-year data containing data from 2013. For more information, see: Language User Note.
While the 2011-2015 American Community Survey (ACS) data generally reflect the February 2013 Office of Management and Budget (OMB) definitions of metropolitan and micropolitan statistical areas; in certain instances the names, codes, and boundaries of the principal cities shown in ACS tables may differ from the OMB definitions due to differences in the effective dates of the geographic entities.
Estimates of urban and rural population, housing units, and characteristics reflect boundaries of urban areas defined based on Census 2010 data. As a result, data for urban and rural areas from the ACS do not necessarily reflect the results of ongoing urbanization.
Source: U.S. Census Bureau, 2011-2015 American Community Survey 5-Year Estimates
Explanation of Symbols:
1. An '**' entry in the margin of error column indicates that either no sample observations or too few sample observations were available to compute a standard error and thus the margin of error. A statistical test is not appropriate.
2. An '-' entry in the estimate column indicates that either no sample observations or too few sample observations were available to compute an estimate, or a ratio of medians cannot be calculated because one or both of the median estimates falls in the lowest interval or upper interval of an open-ended distribution.
3. An '-' following a median estimate means the median falls in the lowest interval of an open-ended distribution. 4. An '+' following a median estimate means the median falls in the upper interval of an open-ended distribution. 5. An '***' entry in the margin of error column indicates that the median falls in the lowest interval or upper interval of an open-ended distribution. A
statistical test is not appropriate. 6. An '*****' entry in the margin of error column indicates that the estimate is controlled. A statistical test for sampling variability is not appropriate.
3 of 4 12/16/2016

7. An 'N' entry in the estimate and margin of error columns indicates that data for this geographic area cannot be displayed because the number of sample cases is too small.
8. An '(X)' means that the estimate is not applicable or not available.

B16001 LANGUAGE SPOKEN AT HOME BY ABILITY TO SPEAK ENGLISH FOR THE POPULATION 5 YEARS AND OVER Universe: Population 5 years and over 2011-2015 American Community Survey 5-Year Estimates
Supporting documentation on code lists, subject definitions, data accuracy, and statistical testing can be found on the American Community Survey website in the Data and Documentation section.
Sample size and data quality measures (including coverage rates, allocation rates, and response rates) can be found on the American Community Survey website in the Methodology section.
Tell us what you think. Provide feedback to help make American Community Survey data more useful for you.
Although the American Community Survey (ACS) produces population, demographic and housing unit estimates, it is the Census Bureau's Population Estimates Program that produces and disseminates the official estimates of the population for the nation, states, counties, cities and towns and estimates of housing units for states and counties.
Florence County, Wisconsin
Estimate Margin of Error Total: 4,283 +/-19 Speak only English 4,175 +/-42 Spanish or Spanish Creole: 83 +/-34 Speak English "very well" 71 +/-32 Speak English less than "very well" 12 +/-11
French (incl. Patois, Cajun): 0 +/-9 Speak English "very well" 0 +/-9 Speak English less than "very well" 0 +/-9
French Creole: 0 +/-9 Speak English "very well" 0 +/-9 Speak English less than "very well" 0 +/-9
Italian: 2 +/-3 Speak English "very well" 2 +/-3 Speak English less than "very well" 0 +/-9
Portuguese or Portuguese Creole: 0 +/-9 Speak English "very well" 0 +/-9 Speak English less than "very well" 0 +/-9
German: 3 +/-5 Speak English "very well" 3 +/-5 Speak English less than "very well" 0 +/-9
Yiddish: 0 +/-9 Speak English "very well" 0 +/-9 Speak English less than "very well" 0 +/-9
Other West Germanic languages: 2 +/-4 Speak English "very well" 2 +/-4 Speak English less than "very well" 0 +/-9
Scandinavian languages: 7 +/-9 Speak English "very well" 7 +/-9 Speak English less than "very well" 0 +/-9
Greek: 0 +/-9 Speak English "very well" 0 +/-9 Speak English less than "very well" 0 +/-9
1 of 4 12/16/2016

Florence County, Wisconsin
Estimate Margin of Error Russian: 0 +/-9 Speak English "very well" 0 +/-9 Speak English less than "very well" 0 +/-9
Polish: 6 +/-7 Speak English "very well" 4 +/-7 Speak English less than "very well" 2 +/-3
Serbo-Croatian: 0 +/-9 Speak English "very well" 0 +/-9 Speak English less than "very well" 0 +/-9
Other Slavic languages: 0 +/-9 Speak English "very well" 0 +/-9 Speak English less than "very well" 0 +/-9
Armenian: 0 +/-9 Speak English "very well" 0 +/-9 Speak English less than "very well" 0 +/-9
Persian: 0 +/-9 Speak English "very well" 0 +/-9 Speak English less than "very well" 0 +/-9
Gujarati: 0 +/-9 Speak English "very well" 0 +/-9 Speak English less than "very well" 0 +/-9
Hindi: 0 +/-9 Speak English "very well" 0 +/-9 Speak English less than "very well" 0 +/-9
Urdu: 0 +/-9 Speak English "very well" 0 +/-9 Speak English less than "very well" 0 +/-9
Other Indic languages: 0 +/-9 Speak English "very well" 0 +/-9 Speak English less than "very well" 0 +/-9
Other Indo-European languages: 0 +/-9 Speak English "very well" 0 +/-9 Speak English less than "very well" 0 +/-9
Chinese: 0 +/-9 Speak English "very well" 0 +/-9 Speak English less than "very well" 0 +/-9
Japanese: 0 +/-9 Speak English "very well" 0 +/-9 Speak English less than "very well" 0 +/-9
Korean: 0 +/-9 Speak English "very well" 0 +/-9 Speak English less than "very well" 0 +/-9
Mon-Khmer, Cambodian: 0 +/-9 Speak English "very well" 0 +/-9 Speak English less than "very well" 0 +/-9
Hmong: 0 +/-9 Speak English "very well" 0 +/-9 Speak English less than "very well" 0 +/-9
Thai: 0 +/-9 Speak English "very well" 0 +/-9 Speak English less than "very well" 0 +/-9
Laotian: 0 +/-9 Speak English "very well" 0 +/-9 Speak English less than "very well" 0 +/-9
Vietnamese: 0 +/-9 Speak English "very well" 0 +/-9 Speak English less than "very well" 0 +/-9
Other Asian languages: 0 +/-9 Speak English "very well" 0 +/-9
2 of 4 12/16/2016

Florence County, Wisconsin
Estimate Margin of Error Speak English less than "very well" 0 +/-9
Tagalog: 0 +/-9 Speak English "very well" 0 +/-9 Speak English less than "very well" 0 +/-9
Other Pacific Island languages: 0 +/-9 Speak English "very well" 0 +/-9 Speak English less than "very well" 0 +/-9
Navajo: 0 +/-9 Speak English "very well" 0 +/-9 Speak English less than "very well" 0 +/-9
Other Native North American languages: 0 +/-9 Speak English "very well" 0 +/-9 Speak English less than "very well" 0 +/-9
Hungarian: 0 +/-9 Speak English "very well" 0 +/-9 Speak English less than "very well" 0 +/-9
Arabic: 0 +/-9 Speak English "very well" 0 +/-9 Speak English less than "very well" 0 +/-9
Hebrew: 0 +/-9 Speak English "very well" 0 +/-9 Speak English less than "very well" 0 +/-9
African languages: 5 +/-6 Speak English "very well" 5 +/-6 Speak English less than "very well" 0 +/-9
Other and unspecified languages: 0 +/-9 Speak English "very well" 0 +/-9 Speak English less than "very well" 0 +/-9
Data are based on a sample and are subject to sampling variability. The degree of uncertainty for an estimate arising from sampling variability is represented through the use of a margin of error. The value shown here is the 90 percent margin of error. The margin of error can be interpreted roughly as providing a 90 percent probability that the interval defined by the estimate minus the margin of error and the estimate plus the margin of error (the lower and upper confidence bounds) contains the true value. In addition to sampling variability, the ACS estimates are subject to nonsampling error (for a discussion of nonsampling variability, see Accuracy of the Data). The effect of nonsampling error is not represented in these tables.
Methodological changes to data collection in 2013 may have affected language data for 2013. Users should be aware of these changes when using multi-year data containing data from 2013. For more information, see: Language User Note.
While the 2011-2015 American Community Survey (ACS) data generally reflect the February 2013 Office of Management and Budget (OMB) definitions of metropolitan and micropolitan statistical areas; in certain instances the names, codes, and boundaries of the principal cities shown in ACS tables may differ from the OMB definitions due to differences in the effective dates of the geographic entities.
Estimates of urban and rural population, housing units, and characteristics reflect boundaries of urban areas defined based on Census 2010 data. As a result, data for urban and rural areas from the ACS do not necessarily reflect the results of ongoing urbanization.
Source: U.S. Census Bureau, 2011-2015 American Community Survey 5-Year Estimates
Explanation of Symbols:
1. An '**' entry in the margin of error column indicates that either no sample observations or too few sample observations were available to compute a standard error and thus the margin of error. A statistical test is not appropriate.
2. An '-' entry in the estimate column indicates that either no sample observations or too few sample observations were available to compute an estimate, or a ratio of medians cannot be calculated because one or both of the median estimates falls in the lowest interval or upper interval of an open-ended distribution.
3. An '-' following a median estimate means the median falls in the lowest interval of an open-ended distribution. 4. An '+' following a median estimate means the median falls in the upper interval of an open-ended distribution. 5. An '***' entry in the margin of error column indicates that the median falls in the lowest interval or upper interval of an open-ended distribution. A
statistical test is not appropriate. 6. An '*****' entry in the margin of error column indicates that the estimate is controlled. A statistical test for sampling variability is not appropriate.
3 of 4 12/16/2016

7. An 'N' entry in the estimate and margin of error columns indicates that data for this geographic area cannot be displayed because the number of sample cases is too small.
8. An '(X)' means that the estimate is not applicable or not available.

B16001 LANGUAGE SPOKEN AT HOME BY ABILITY TO SPEAK ENGLISH FOR THE POPULATION 5 YEARS AND OVER Universe: Population 5 years and over 2011-2015 American Community Survey 5-Year Estimates
Supporting documentation on code lists, subject definitions, data accuracy, and statistical testing can be found on the American Community Survey website in the Data and Documentation section.
Sample size and data quality measures (including coverage rates, allocation rates, and response rates) can be found on the American Community Survey website in the Methodology section.
Tell us what you think. Provide feedback to help make American Community Survey data more useful for you.
Although the American Community Survey (ACS) produces population, demographic and housing unit estimates, it is the Census Bureau's Population Estimates Program that produces and disseminates the official estimates of the population for the nation, states, counties, cities and towns and estimates of housing units for states and counties.
Fond du Lac County, Wisconsin
Estimate Margin of Error Total: 96,124 +/-19 Speak only English 90,429 +/-523 Spanish or Spanish Creole: 3,532 +/-388 Speak English "very well" 2,142 +/-306 Speak English less than "very well" 1,390 +/-297
French (incl. Patois, Cajun): 141 +/-75 Speak English "very well" 105 +/-67 Speak English less than "very well" 36 +/-38
French Creole: 34 +/-52 Speak English "very well" 34 +/-52 Speak English less than "very well" 0 +/-20
Italian: 19 +/-22 Speak English "very well" 14 +/-20 Speak English less than "very well" 5 +/-7
Portuguese or Portuguese Creole: 14 +/-12 Speak English "very well" 12 +/-11 Speak English less than "very well" 2 +/-3
German: 557 +/-118 Speak English "very well" 457 +/-111 Speak English less than "very well" 100 +/-50
Yiddish: 0 +/-20 Speak English "very well" 0 +/-20 Speak English less than "very well" 0 +/-20
Other West Germanic languages: 34 +/-26 Speak English "very well" 24 +/-20 Speak English less than "very well" 10 +/-17
Scandinavian languages: 2 +/-4 Speak English "very well" 2 +/-4 Speak English less than "very well" 0 +/-20
Greek: 63 +/-79 Speak English "very well" 27 +/-29 Speak English less than "very well" 36 +/-52
1 of 4 12/16/2016

Fond du Lac County, Wisconsin
Estimate Margin of Error Russian: 18 +/-24 Speak English "very well" 4 +/-5 Speak English less than "very well" 14 +/-23
Polish: 26 +/-32 Speak English "very well" 26 +/-32 Speak English less than "very well" 0 +/-20
Serbo-Croatian: 9 +/-13 Speak English "very well" 9 +/-13 Speak English less than "very well" 0 +/-20
Other Slavic languages: 47 +/-72 Speak English "very well" 24 +/-37 Speak English less than "very well" 23 +/-35
Armenian: 31 +/-46 Speak English "very well" 31 +/-46 Speak English less than "very well" 0 +/-20
Persian: 8 +/-14 Speak English "very well" 0 +/-20 Speak English less than "very well" 8 +/-14
Gujarati: 0 +/-20 Speak English "very well" 0 +/-20 Speak English less than "very well" 0 +/-20
Hindi: 56 +/-83 Speak English "very well" 56 +/-83 Speak English less than "very well" 0 +/-20
Urdu: 0 +/-20 Speak English "very well" 0 +/-20 Speak English less than "very well" 0 +/-20
Other Indic languages: 76 +/-82 Speak English "very well" 61 +/-76 Speak English less than "very well" 15 +/-22
Other Indo-European languages: 11 +/-17 Speak English "very well" 0 +/-20 Speak English less than "very well" 11 +/-17
Chinese: 117 +/-142 Speak English "very well" 43 +/-45 Speak English less than "very well" 74 +/-109
Japanese: 177 +/-145 Speak English "very well" 150 +/-143 Speak English less than "very well" 27 +/-29
Korean: 12 +/-18 Speak English "very well" 0 +/-20 Speak English less than "very well" 12 +/-18
Mon-Khmer, Cambodian: 16 +/-18 Speak English "very well" 7 +/-10 Speak English less than "very well" 9 +/-14
Hmong: 88 +/-101 Speak English "very well" 49 +/-61 Speak English less than "very well" 39 +/-50
Thai: 10 +/-11 Speak English "very well" 6 +/-8 Speak English less than "very well" 4 +/-7
Laotian: 0 +/-20 Speak English "very well" 0 +/-20 Speak English less than "very well" 0 +/-20
Vietnamese: 21 +/-28 Speak English "very well" 4 +/-8 Speak English less than "very well" 17 +/-28
Other Asian languages: 430 +/-347 Speak English "very well" 391 +/-346
2 of 4 12/16/2016

Fond du Lac County, Wisconsin
Estimate Margin of Error Speak English less than "very well" 39 +/-26
Tagalog: 39 +/-44 Speak English "very well" 28 +/-36 Speak English less than "very well" 11 +/-15
Other Pacific Island languages: 19 +/-33 Speak English "very well" 5 +/-12 Speak English less than "very well" 14 +/-28
Navajo: 42 +/-64 Speak English "very well" 42 +/-64 Speak English less than "very well" 0 +/-20
Other Native North American languages: 21 +/-18 Speak English "very well" 21 +/-18 Speak English less than "very well" 0 +/-20
Hungarian: 0 +/-20 Speak English "very well" 0 +/-20 Speak English less than "very well" 0 +/-20
Arabic: 17 +/-16 Speak English "very well" 11 +/-14 Speak English less than "very well" 6 +/-9
Hebrew: 0 +/-20 Speak English "very well" 0 +/-20 Speak English less than "very well" 0 +/-20
African languages: 8 +/-11 Speak English "very well" 8 +/-11 Speak English less than "very well" 0 +/-20
Other and unspecified languages: 0 +/-20 Speak English "very well" 0 +/-20 Speak English less than "very well" 0 +/-20
Data are based on a sample and are subject to sampling variability. The degree of uncertainty for an estimate arising from sampling variability is represented through the use of a margin of error. The value shown here is the 90 percent margin of error. The margin of error can be interpreted roughly as providing a 90 percent probability that the interval defined by the estimate minus the margin of error and the estimate plus the margin of error (the lower and upper confidence bounds) contains the true value. In addition to sampling variability, the ACS estimates are subject to nonsampling error (for a discussion of nonsampling variability, see Accuracy of the Data). The effect of nonsampling error is not represented in these tables.
Methodological changes to data collection in 2013 may have affected language data for 2013. Users should be aware of these changes when using multi-year data containing data from 2013. For more information, see: Language User Note.
While the 2011-2015 American Community Survey (ACS) data generally reflect the February 2013 Office of Management and Budget (OMB) definitions of metropolitan and micropolitan statistical areas; in certain instances the names, codes, and boundaries of the principal cities shown in ACS tables may differ from the OMB definitions due to differences in the effective dates of the geographic entities.
Estimates of urban and rural population, housing units, and characteristics reflect boundaries of urban areas defined based on Census 2010 data. As a result, data for urban and rural areas from the ACS do not necessarily reflect the results of ongoing urbanization.
Source: U.S. Census Bureau, 2011-2015 American Community Survey 5-Year Estimates
Explanation of Symbols:
1. An '**' entry in the margin of error column indicates that either no sample observations or too few sample observations were available to compute a standard error and thus the margin of error. A statistical test is not appropriate.
2. An '-' entry in the estimate column indicates that either no sample observations or too few sample observations were available to compute an estimate, or a ratio of medians cannot be calculated because one or both of the median estimates falls in the lowest interval or upper interval of an open-ended distribution.
3. An '-' following a median estimate means the median falls in the lowest interval of an open-ended distribution. 4. An '+' following a median estimate means the median falls in the upper interval of an open-ended distribution. 5. An '***' entry in the margin of error column indicates that the median falls in the lowest interval or upper interval of an open-ended distribution. A
statistical test is not appropriate. 6. An '*****' entry in the margin of error column indicates that the estimate is controlled. A statistical test for sampling variability is not appropriate.
3 of 4 12/16/2016

7. An 'N' entry in the estimate and margin of error columns indicates that data for this geographic area cannot be displayed because the number of sample cases is too small.
8. An '(X)' means that the estimate is not applicable or not available.
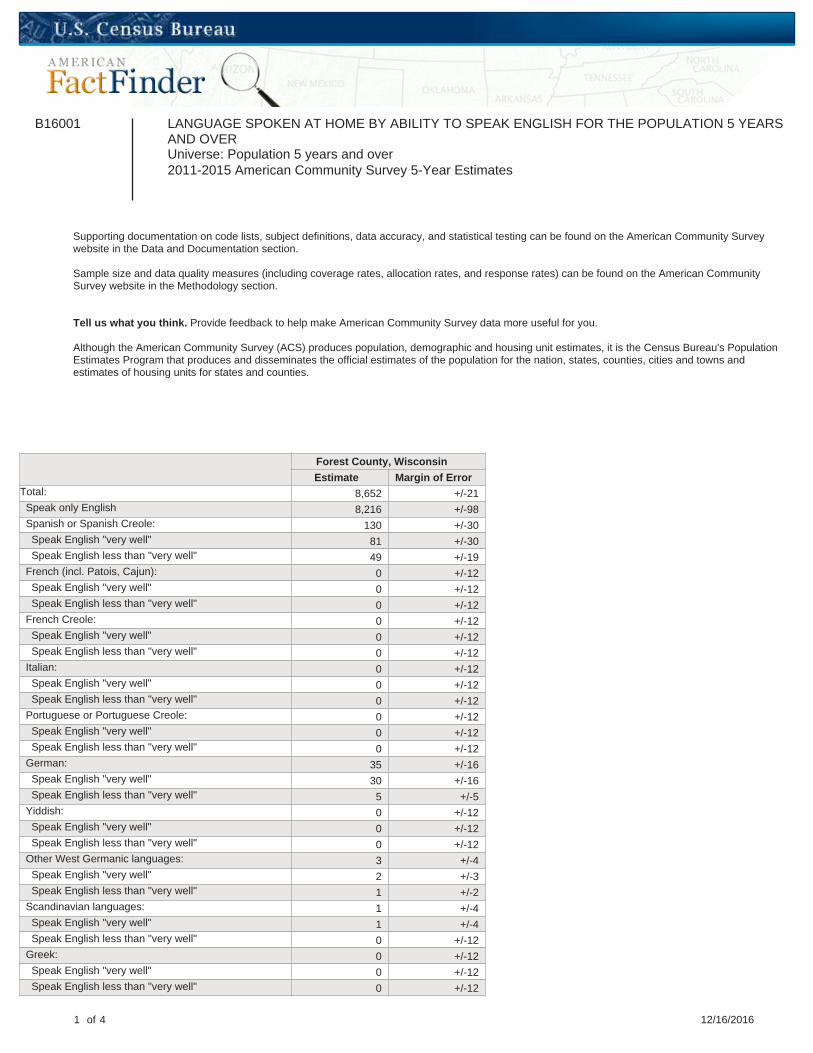
B16001 LANGUAGE SPOKEN AT HOME BY ABILITY TO SPEAK ENGLISH FOR THE POPULATION 5 YEARS AND OVER Universe: Population 5 years and over 2011-2015 American Community Survey 5-Year Estimates
Supporting documentation on code lists, subject definitions, data accuracy, and statistical testing can be found on the American Community Survey website in the Data and Documentation section.
Sample size and data quality measures (including coverage rates, allocation rates, and response rates) can be found on the American Community Survey website in the Methodology section.
Tell us what you think. Provide feedback to help make American Community Survey data more useful for you.
Although the American Community Survey (ACS) produces population, demographic and housing unit estimates, it is the Census Bureau's Population Estimates Program that produces and disseminates the official estimates of the population for the nation, states, counties, cities and towns and estimates of housing units for states and counties.
Forest County, Wisconsin
Estimate Margin of Error Total: 8,652 +/-21 Speak only English 8,216 +/-98 Spanish or Spanish Creole: 130 +/-30 Speak English "very well" 81 +/-30 Speak English less than "very well" 49 +/-19
French (incl. Patois, Cajun): 0 +/-12 Speak English "very well" 0 +/-12 Speak English less than "very well" 0 +/-12
French Creole: 0 +/-12 Speak English "very well" 0 +/-12 Speak English less than "very well" 0 +/-12
Italian: 0 +/-12 Speak English "very well" 0 +/-12 Speak English less than "very well" 0 +/-12
Portuguese or Portuguese Creole: 0 +/-12 Speak English "very well" 0 +/-12 Speak English less than "very well" 0 +/-12
German: 35 +/-16 Speak English "very well" 30 +/-16 Speak English less than "very well" 5 +/-5
Yiddish: 0 +/-12 Speak English "very well" 0 +/-12 Speak English less than "very well" 0 +/-12
Other West Germanic languages: 3 +/-4 Speak English "very well" 2 +/-3 Speak English less than "very well" 1 +/-2
Scandinavian languages: 1 +/-4 Speak English "very well" 1 +/-4 Speak English less than "very well" 0 +/-12
Greek: 0 +/-12 Speak English "very well" 0 +/-12 Speak English less than "very well" 0 +/-12
1 of 4 12/16/2016
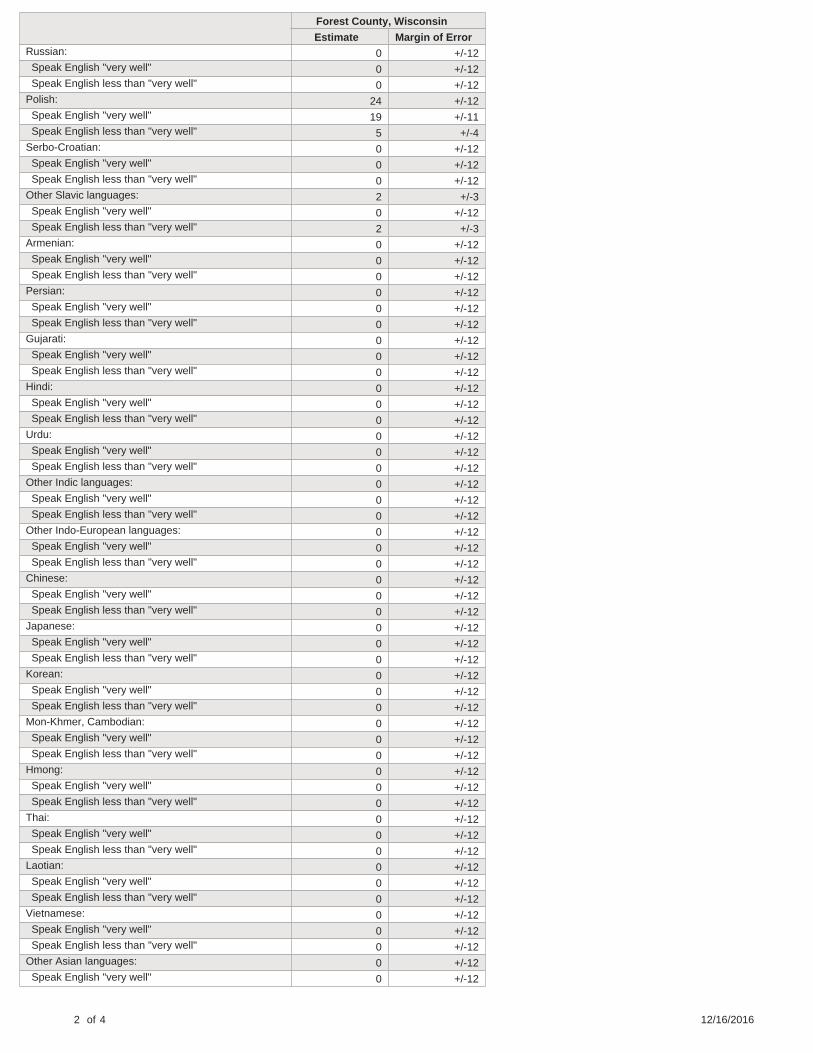
Forest County, Wisconsin
Estimate Margin of Error Russian: 0 +/-12 Speak English "very well" 0 +/-12 Speak English less than "very well" 0 +/-12
Polish: 24 +/-12 Speak English "very well" 19 +/-11 Speak English less than "very well" 5 +/-4
Serbo-Croatian: 0 +/-12 Speak English "very well" 0 +/-12 Speak English less than "very well" 0 +/-12
Other Slavic languages: 2 +/-3 Speak English "very well" 0 +/-12 Speak English less than "very well" 2 +/-3
Armenian: 0 +/-12 Speak English "very well" 0 +/-12 Speak English less than "very well" 0 +/-12
Persian: 0 +/-12 Speak English "very well" 0 +/-12 Speak English less than "very well" 0 +/-12
Gujarati: 0 +/-12 Speak English "very well" 0 +/-12 Speak English less than "very well" 0 +/-12
Hindi: 0 +/-12 Speak English "very well" 0 +/-12 Speak English less than "very well" 0 +/-12
Urdu: 0 +/-12 Speak English "very well" 0 +/-12 Speak English less than "very well" 0 +/-12
Other Indic languages: 0 +/-12 Speak English "very well" 0 +/-12 Speak English less than "very well" 0 +/-12
Other Indo-European languages: 0 +/-12 Speak English "very well" 0 +/-12 Speak English less than "very well" 0 +/-12
Chinese: 0 +/-12 Speak English "very well" 0 +/-12 Speak English less than "very well" 0 +/-12
Japanese: 0 +/-12 Speak English "very well" 0 +/-12 Speak English less than "very well" 0 +/-12
Korean: 0 +/-12 Speak English "very well" 0 +/-12 Speak English less than "very well" 0 +/-12
Mon-Khmer, Cambodian: 0 +/-12 Speak English "very well" 0 +/-12 Speak English less than "very well" 0 +/-12
Hmong: 0 +/-12 Speak English "very well" 0 +/-12 Speak English less than "very well" 0 +/-12
Thai: 0 +/-12 Speak English "very well" 0 +/-12 Speak English less than "very well" 0 +/-12
Laotian: 0 +/-12 Speak English "very well" 0 +/-12 Speak English less than "very well" 0 +/-12
Vietnamese: 0 +/-12 Speak English "very well" 0 +/-12 Speak English less than "very well" 0 +/-12
Other Asian languages: 0 +/-12 Speak English "very well" 0 +/-12
2 of 4 12/16/2016

Forest County, Wisconsin
Estimate Margin of Error Speak English less than "very well" 0 +/-12
Tagalog: 10 +/-8 Speak English "very well" 7 +/-6 Speak English less than "very well" 3 +/-3
Other Pacific Island languages: 0 +/-12 Speak English "very well" 0 +/-12 Speak English less than "very well" 0 +/-12
Navajo: 0 +/-12 Speak English "very well" 0 +/-12 Speak English less than "very well" 0 +/-12
Other Native North American languages: 228 +/-95 Speak English "very well" 219 +/-94 Speak English less than "very well" 9 +/-9
Hungarian: 3 +/-4 Speak English "very well" 0 +/-12 Speak English less than "very well" 3 +/-4
Arabic: 0 +/-12 Speak English "very well" 0 +/-12 Speak English less than "very well" 0 +/-12
Hebrew: 0 +/-12 Speak English "very well" 0 +/-12 Speak English less than "very well" 0 +/-12
African languages: 0 +/-12 Speak English "very well" 0 +/-12 Speak English less than "very well" 0 +/-12
Other and unspecified languages: 0 +/-12 Speak English "very well" 0 +/-12 Speak English less than "very well" 0 +/-12
Data are based on a sample and are subject to sampling variability. The degree of uncertainty for an estimate arising from sampling variability is represented through the use of a margin of error. The value shown here is the 90 percent margin of error. The margin of error can be interpreted roughly as providing a 90 percent probability that the interval defined by the estimate minus the margin of error and the estimate plus the margin of error (the lower and upper confidence bounds) contains the true value. In addition to sampling variability, the ACS estimates are subject to nonsampling error (for a discussion of nonsampling variability, see Accuracy of the Data). The effect of nonsampling error is not represented in these tables.
Methodological changes to data collection in 2013 may have affected language data for 2013. Users should be aware of these changes when using multi-year data containing data from 2013. For more information, see: Language User Note.
While the 2011-2015 American Community Survey (ACS) data generally reflect the February 2013 Office of Management and Budget (OMB) definitions of metropolitan and micropolitan statistical areas; in certain instances the names, codes, and boundaries of the principal cities shown in ACS tables may differ from the OMB definitions due to differences in the effective dates of the geographic entities.
Estimates of urban and rural population, housing units, and characteristics reflect boundaries of urban areas defined based on Census 2010 data. As a result, data for urban and rural areas from the ACS do not necessarily reflect the results of ongoing urbanization.
Source: U.S. Census Bureau, 2011-2015 American Community Survey 5-Year Estimates
Explanation of Symbols:
1. An '**' entry in the margin of error column indicates that either no sample observations or too few sample observations were available to compute a standard error and thus the margin of error. A statistical test is not appropriate.
2. An '-' entry in the estimate column indicates that either no sample observations or too few sample observations were available to compute an estimate, or a ratio of medians cannot be calculated because one or both of the median estimates falls in the lowest interval or upper interval of an open-ended distribution.
3. An '-' following a median estimate means the median falls in the lowest interval of an open-ended distribution. 4. An '+' following a median estimate means the median falls in the upper interval of an open-ended distribution. 5. An '***' entry in the margin of error column indicates that the median falls in the lowest interval or upper interval of an open-ended distribution. A
statistical test is not appropriate. 6. An '*****' entry in the margin of error column indicates that the estimate is controlled. A statistical test for sampling variability is not appropriate.
3 of 4 12/16/2016

7. An 'N' entry in the estimate and margin of error columns indicates that data for this geographic area cannot be displayed because the number of sample cases is too small.
8. An '(X)' means that the estimate is not applicable or not available.

B16001 LANGUAGE SPOKEN AT HOME BY ABILITY TO SPEAK ENGLISH FOR THE POPULATION 5 YEARS AND OVER Universe: Population 5 years and over 2011-2015 American Community Survey 5-Year Estimates
Supporting documentation on code lists, subject definitions, data accuracy, and statistical testing can be found on the American Community Survey website in the Data and Documentation section.
Sample size and data quality measures (including coverage rates, allocation rates, and response rates) can be found on the American Community Survey website in the Methodology section.
Tell us what you think. Provide feedback to help make American Community Survey data more useful for you.
Although the American Community Survey (ACS) produces population, demographic and housing unit estimates, it is the Census Bureau's Population Estimates Program that produces and disseminates the official estimates of the population for the nation, states, counties, cities and towns and estimates of housing units for states and counties.
Grant County, Wisconsin
Estimate Margin of Error Total: 48,754 +/-28 Speak only English 46,545 +/-314 Spanish or Spanish Creole: 529 +/-126 Speak English "very well" 374 +/-114 Speak English less than "very well" 155 +/-60
French (incl. Patois, Cajun): 58 +/-46 Speak English "very well" 28 +/-17 Speak English less than "very well" 30 +/-34
French Creole: 0 +/-20 Speak English "very well" 0 +/-20 Speak English less than "very well" 0 +/-20
Italian: 0 +/-20 Speak English "very well" 0 +/-20 Speak English less than "very well" 0 +/-20
Portuguese or Portuguese Creole: 8 +/-16 Speak English "very well" 0 +/-20 Speak English less than "very well" 8 +/-16
German: 522 +/-135 Speak English "very well" 299 +/-74 Speak English less than "very well" 223 +/-91
Yiddish: 0 +/-20 Speak English "very well" 0 +/-20 Speak English less than "very well" 0 +/-20
Other West Germanic languages: 649 +/-218 Speak English "very well" 397 +/-123 Speak English less than "very well" 252 +/-147
Scandinavian languages: 18 +/-16 Speak English "very well" 15 +/-15 Speak English less than "very well" 3 +/-4
Greek: 0 +/-20 Speak English "very well" 0 +/-20 Speak English less than "very well" 0 +/-20
1 of 4 12/16/2016

Grant County, Wisconsin
Estimate Margin of Error Russian: 12 +/-16 Speak English "very well" 6 +/-7 Speak English less than "very well" 6 +/-9
Polish: 32 +/-44 Speak English "very well" 22 +/-29 Speak English less than "very well" 10 +/-15
Serbo-Croatian: 4 +/-6 Speak English "very well" 4 +/-6 Speak English less than "very well" 0 +/-20
Other Slavic languages: 8 +/-13 Speak English "very well" 8 +/-13 Speak English less than "very well" 0 +/-20
Armenian: 0 +/-20 Speak English "very well" 0 +/-20 Speak English less than "very well" 0 +/-20
Persian: 0 +/-20 Speak English "very well" 0 +/-20 Speak English less than "very well" 0 +/-20
Gujarati: 0 +/-20 Speak English "very well" 0 +/-20 Speak English less than "very well" 0 +/-20
Hindi: 10 +/-17 Speak English "very well" 10 +/-17 Speak English less than "very well" 0 +/-20
Urdu: 0 +/-20 Speak English "very well" 0 +/-20 Speak English less than "very well" 0 +/-20
Other Indic languages: 11 +/-15 Speak English "very well" 5 +/-6 Speak English less than "very well" 6 +/-11
Other Indo-European languages: 9 +/-14 Speak English "very well" 9 +/-14 Speak English less than "very well" 0 +/-20
Chinese: 49 +/-41 Speak English "very well" 28 +/-23 Speak English less than "very well" 21 +/-20
Japanese: 5 +/-5 Speak English "very well" 2 +/-2 Speak English less than "very well" 3 +/-4
Korean: 72 +/-71 Speak English "very well" 47 +/-65 Speak English less than "very well" 25 +/-25
Mon-Khmer, Cambodian: 0 +/-20 Speak English "very well" 0 +/-20 Speak English less than "very well" 0 +/-20
Hmong: 29 +/-28 Speak English "very well" 22 +/-27 Speak English less than "very well" 7 +/-9
Thai: 0 +/-20 Speak English "very well" 0 +/-20 Speak English less than "very well" 0 +/-20
Laotian: 0 +/-20 Speak English "very well" 0 +/-20 Speak English less than "very well" 0 +/-20
Vietnamese: 14 +/-19 Speak English "very well" 14 +/-19 Speak English less than "very well" 0 +/-20
Other Asian languages: 5 +/-11 Speak English "very well" 5 +/-11
2 of 4 12/16/2016

Grant County, Wisconsin
Estimate Margin of Error Speak English less than "very well" 0 +/-20
Tagalog: 83 +/-49 Speak English "very well" 42 +/-35 Speak English less than "very well" 41 +/-43
Other Pacific Island languages: 11 +/-24 Speak English "very well" 0 +/-20 Speak English less than "very well" 11 +/-24
Navajo: 0 +/-20 Speak English "very well" 0 +/-20 Speak English less than "very well" 0 +/-20
Other Native North American languages: 5 +/-9 Speak English "very well" 5 +/-9 Speak English less than "very well" 0 +/-20
Hungarian: 3 +/-5 Speak English "very well" 1 +/-3 Speak English less than "very well" 2 +/-3
Arabic: 44 +/-42 Speak English "very well" 27 +/-33 Speak English less than "very well" 17 +/-26
Hebrew: 0 +/-20 Speak English "very well" 0 +/-20 Speak English less than "very well" 0 +/-20
African languages: 15 +/-13 Speak English "very well" 12 +/-11 Speak English less than "very well" 3 +/-4
Other and unspecified languages: 4 +/-5 Speak English "very well" 4 +/-5 Speak English less than "very well" 0 +/-20
Data are based on a sample and are subject to sampling variability. The degree of uncertainty for an estimate arising from sampling variability is represented through the use of a margin of error. The value shown here is the 90 percent margin of error. The margin of error can be interpreted roughly as providing a 90 percent probability that the interval defined by the estimate minus the margin of error and the estimate plus the margin of error (the lower and upper confidence bounds) contains the true value. In addition to sampling variability, the ACS estimates are subject to nonsampling error (for a discussion of nonsampling variability, see Accuracy of the Data). The effect of nonsampling error is not represented in these tables.
Methodological changes to data collection in 2013 may have affected language data for 2013. Users should be aware of these changes when using multi-year data containing data from 2013. For more information, see: Language User Note.
While the 2011-2015 American Community Survey (ACS) data generally reflect the February 2013 Office of Management and Budget (OMB) definitions of metropolitan and micropolitan statistical areas; in certain instances the names, codes, and boundaries of the principal cities shown in ACS tables may differ from the OMB definitions due to differences in the effective dates of the geographic entities.
Estimates of urban and rural population, housing units, and characteristics reflect boundaries of urban areas defined based on Census 2010 data. As a result, data for urban and rural areas from the ACS do not necessarily reflect the results of ongoing urbanization.
Source: U.S. Census Bureau, 2011-2015 American Community Survey 5-Year Estimates
Explanation of Symbols:
1. An '**' entry in the margin of error column indicates that either no sample observations or too few sample observations were available to compute a standard error and thus the margin of error. A statistical test is not appropriate.
2. An '-' entry in the estimate column indicates that either no sample observations or too few sample observations were available to compute an estimate, or a ratio of medians cannot be calculated because one or both of the median estimates falls in the lowest interval or upper interval of an open-ended distribution.
3. An '-' following a median estimate means the median falls in the lowest interval of an open-ended distribution. 4. An '+' following a median estimate means the median falls in the upper interval of an open-ended distribution. 5. An '***' entry in the margin of error column indicates that the median falls in the lowest interval or upper interval of an open-ended distribution. A
statistical test is not appropriate. 6. An '*****' entry in the margin of error column indicates that the estimate is controlled. A statistical test for sampling variability is not appropriate.
3 of 4 12/16/2016

7. An 'N' entry in the estimate and margin of error columns indicates that data for this geographic area cannot be displayed because the number of sample cases is too small.
8. An '(X)' means that the estimate is not applicable or not available.

B16001 LANGUAGE SPOKEN AT HOME BY ABILITY TO SPEAK ENGLISH FOR THE POPULATION 5 YEARS AND OVER Universe: Population 5 years and over 2011-2015 American Community Survey 5-Year Estimates
Supporting documentation on code lists, subject definitions, data accuracy, and statistical testing can be found on the American Community Survey website in the Data and Documentation section.
Sample size and data quality measures (including coverage rates, allocation rates, and response rates) can be found on the American Community Survey website in the Methodology section.
Tell us what you think. Provide feedback to help make American Community Survey data more useful for you.
Although the American Community Survey (ACS) produces population, demographic and housing unit estimates, it is the Census Bureau's Population Estimates Program that produces and disseminates the official estimates of the population for the nation, states, counties, cities and towns and estimates of housing units for states and counties.
Green County, Wisconsin
Estimate Margin of Error Total: 34,965 +/-26 Speak only English 33,377 +/-267 Spanish or Spanish Creole: 762 +/-131 Speak English "very well" 439 +/-130 Speak English less than "very well" 323 +/-88
French (incl. Patois, Cajun): 177 +/-189 Speak English "very well" 164 +/-186 Speak English less than "very well" 13 +/-16
French Creole: 0 +/-18 Speak English "very well" 0 +/-18 Speak English less than "very well" 0 +/-18
Italian: 3 +/-4 Speak English "very well" 3 +/-4 Speak English less than "very well" 0 +/-18
Portuguese or Portuguese Creole: 0 +/-18 Speak English "very well" 0 +/-18 Speak English less than "very well" 0 +/-18
German: 369 +/-107 Speak English "very well" 307 +/-101 Speak English less than "very well" 62 +/-32
Yiddish: 0 +/-18 Speak English "very well" 0 +/-18 Speak English less than "very well" 0 +/-18
Other West Germanic languages: 25 +/-22 Speak English "very well" 18 +/-19 Speak English less than "very well" 7 +/-10
Scandinavian languages: 33 +/-22 Speak English "very well" 21 +/-16 Speak English less than "very well" 12 +/-10
Greek: 0 +/-18 Speak English "very well" 0 +/-18 Speak English less than "very well" 0 +/-18
1 of 4 12/16/2016

Green County, Wisconsin
Estimate Margin of Error Russian: 10 +/-15 Speak English "very well" 0 +/-18 Speak English less than "very well" 10 +/-15
Polish: 8 +/-13 Speak English "very well" 8 +/-13 Speak English less than "very well" 0 +/-18
Serbo-Croatian: 0 +/-18 Speak English "very well" 0 +/-18 Speak English less than "very well" 0 +/-18
Other Slavic languages: 5 +/-7 Speak English "very well" 3 +/-5 Speak English less than "very well" 2 +/-4
Armenian: 0 +/-18 Speak English "very well" 0 +/-18 Speak English less than "very well" 0 +/-18
Persian: 0 +/-18 Speak English "very well" 0 +/-18 Speak English less than "very well" 0 +/-18
Gujarati: 0 +/-18 Speak English "very well" 0 +/-18 Speak English less than "very well" 0 +/-18
Hindi: 0 +/-18 Speak English "very well" 0 +/-18 Speak English less than "very well" 0 +/-18
Urdu: 0 +/-18 Speak English "very well" 0 +/-18 Speak English less than "very well" 0 +/-18
Other Indic languages: 26 +/-33 Speak English "very well" 26 +/-33 Speak English less than "very well" 0 +/-18
Other Indo-European languages: 31 +/-41 Speak English "very well" 5 +/-7 Speak English less than "very well" 26 +/-41
Chinese: 76 +/-70 Speak English "very well" 14 +/-15 Speak English less than "very well" 62 +/-74
Japanese: 0 +/-18 Speak English "very well" 0 +/-18 Speak English less than "very well" 0 +/-18
Korean: 0 +/-18 Speak English "very well" 0 +/-18 Speak English less than "very well" 0 +/-18
Mon-Khmer, Cambodian: 0 +/-18 Speak English "very well" 0 +/-18 Speak English less than "very well" 0 +/-18
Hmong: 0 +/-18 Speak English "very well" 0 +/-18 Speak English less than "very well" 0 +/-18
Thai: 0 +/-18 Speak English "very well" 0 +/-18 Speak English less than "very well" 0 +/-18
Laotian: 0 +/-18 Speak English "very well" 0 +/-18 Speak English less than "very well" 0 +/-18
Vietnamese: 11 +/-19 Speak English "very well" 6 +/-10 Speak English less than "very well" 5 +/-10
Other Asian languages: 2 +/-3 Speak English "very well" 0 +/-18
2 of 4 12/16/2016
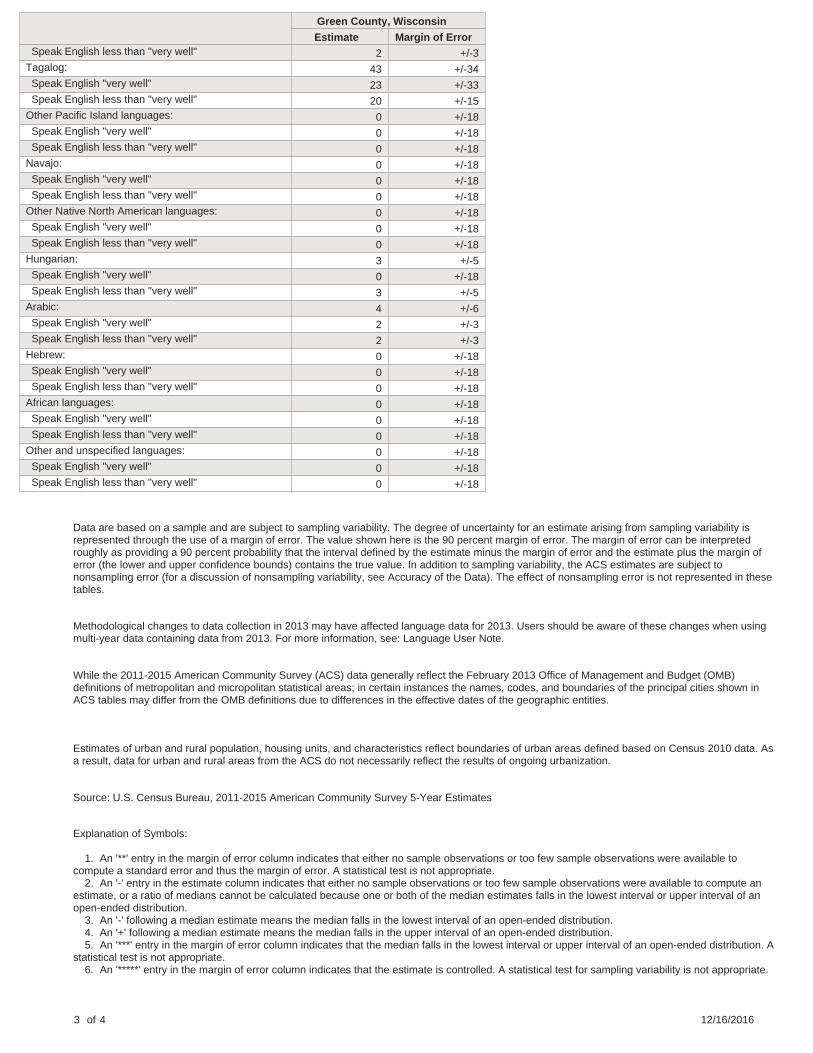
Green County, Wisconsin
Estimate Margin of Error Speak English less than "very well" 2 +/-3
Tagalog: 43 +/-34 Speak English "very well" 23 +/-33 Speak English less than "very well" 20 +/-15
Other Pacific Island languages: 0 +/-18 Speak English "very well" 0 +/-18 Speak English less than "very well" 0 +/-18
Navajo: 0 +/-18 Speak English "very well" 0 +/-18 Speak English less than "very well" 0 +/-18
Other Native North American languages: 0 +/-18 Speak English "very well" 0 +/-18 Speak English less than "very well" 0 +/-18
Hungarian: 3 +/-5 Speak English "very well" 0 +/-18 Speak English less than "very well" 3 +/-5
Arabic: 4 +/-6 Speak English "very well" 2 +/-3 Speak English less than "very well" 2 +/-3
Hebrew: 0 +/-18 Speak English "very well" 0 +/-18 Speak English less than "very well" 0 +/-18
African languages: 0 +/-18 Speak English "very well" 0 +/-18 Speak English less than "very well" 0 +/-18
Other and unspecified languages: 0 +/-18 Speak English "very well" 0 +/-18 Speak English less than "very well" 0 +/-18
Data are based on a sample and are subject to sampling variability. The degree of uncertainty for an estimate arising from sampling variability is represented through the use of a margin of error. The value shown here is the 90 percent margin of error. The margin of error can be interpreted roughly as providing a 90 percent probability that the interval defined by the estimate minus the margin of error and the estimate plus the margin of error (the lower and upper confidence bounds) contains the true value. In addition to sampling variability, the ACS estimates are subject to nonsampling error (for a discussion of nonsampling variability, see Accuracy of the Data). The effect of nonsampling error is not represented in these tables.
Methodological changes to data collection in 2013 may have affected language data for 2013. Users should be aware of these changes when using multi-year data containing data from 2013. For more information, see: Language User Note.
While the 2011-2015 American Community Survey (ACS) data generally reflect the February 2013 Office of Management and Budget (OMB) definitions of metropolitan and micropolitan statistical areas; in certain instances the names, codes, and boundaries of the principal cities shown in ACS tables may differ from the OMB definitions due to differences in the effective dates of the geographic entities.
Estimates of urban and rural population, housing units, and characteristics reflect boundaries of urban areas defined based on Census 2010 data. As a result, data for urban and rural areas from the ACS do not necessarily reflect the results of ongoing urbanization.
Source: U.S. Census Bureau, 2011-2015 American Community Survey 5-Year Estimates
Explanation of Symbols:
1. An '**' entry in the margin of error column indicates that either no sample observations or too few sample observations were available to compute a standard error and thus the margin of error. A statistical test is not appropriate.
2. An '-' entry in the estimate column indicates that either no sample observations or too few sample observations were available to compute an estimate, or a ratio of medians cannot be calculated because one or both of the median estimates falls in the lowest interval or upper interval of an open-ended distribution.
3. An '-' following a median estimate means the median falls in the lowest interval of an open-ended distribution. 4. An '+' following a median estimate means the median falls in the upper interval of an open-ended distribution. 5. An '***' entry in the margin of error column indicates that the median falls in the lowest interval or upper interval of an open-ended distribution. A
statistical test is not appropriate. 6. An '*****' entry in the margin of error column indicates that the estimate is controlled. A statistical test for sampling variability is not appropriate.
3 of 4 12/16/2016

7. An 'N' entry in the estimate and margin of error columns indicates that data for this geographic area cannot be displayed because the number of sample cases is too small.
8. An '(X)' means that the estimate is not applicable or not available.

B16001 LANGUAGE SPOKEN AT HOME BY ABILITY TO SPEAK ENGLISH FOR THE POPULATION 5 YEARS AND OVER Universe: Population 5 years and over 2011-2015 American Community Survey 5-Year Estimates
Supporting documentation on code lists, subject definitions, data accuracy, and statistical testing can be found on the American Community Survey website in the Data and Documentation section.
Sample size and data quality measures (including coverage rates, allocation rates, and response rates) can be found on the American Community Survey website in the Methodology section.
Tell us what you think. Provide feedback to help make American Community Survey data more useful for you.
Although the American Community Survey (ACS) produces population, demographic and housing unit estimates, it is the Census Bureau's Population Estimates Program that produces and disseminates the official estimates of the population for the nation, states, counties, cities and towns and estimates of housing units for states and counties.
Green Lake County, Wisconsin
Estimate Margin of Error Total: 17,986 +/-47 Speak only English 15,853 +/-335 Spanish or Spanish Creole: 1,100 +/-241 Speak English "very well" 753 +/-197 Speak English less than "very well" 347 +/-102
French (incl. Patois, Cajun): 8 +/-8 Speak English "very well" 5 +/-6 Speak English less than "very well" 3 +/-4
French Creole: 0 +/-14 Speak English "very well" 0 +/-14 Speak English less than "very well" 0 +/-14
Italian: 3 +/-4 Speak English "very well" 3 +/-4 Speak English less than "very well" 0 +/-14
Portuguese or Portuguese Creole: 0 +/-14 Speak English "very well" 0 +/-14 Speak English less than "very well" 0 +/-14
German: 482 +/-169 Speak English "very well" 371 +/-159 Speak English less than "very well" 111 +/-34
Yiddish: 0 +/-14 Speak English "very well" 0 +/-14 Speak English less than "very well" 0 +/-14
Other West Germanic languages: 367 +/-112 Speak English "very well" 165 +/-65 Speak English less than "very well" 202 +/-70
Scandinavian languages: 11 +/-13 Speak English "very well" 11 +/-13 Speak English less than "very well" 0 +/-14
Greek: 2 +/-4 Speak English "very well" 2 +/-4 Speak English less than "very well" 0 +/-14
1 of 4 12/16/2016

Green Lake County, Wisconsin
Estimate Margin of Error Russian: 9 +/-15 Speak English "very well" 9 +/-15 Speak English less than "very well" 0 +/-14
Polish: 15 +/-11 Speak English "very well" 6 +/-6 Speak English less than "very well" 9 +/-8
Serbo-Croatian: 0 +/-14 Speak English "very well" 0 +/-14 Speak English less than "very well" 0 +/-14
Other Slavic languages: 0 +/-14 Speak English "very well" 0 +/-14 Speak English less than "very well" 0 +/-14
Armenian: 0 +/-14 Speak English "very well" 0 +/-14 Speak English less than "very well" 0 +/-14
Persian: 0 +/-14 Speak English "very well" 0 +/-14 Speak English less than "very well" 0 +/-14
Gujarati: 0 +/-14 Speak English "very well" 0 +/-14 Speak English less than "very well" 0 +/-14
Hindi: 0 +/-14 Speak English "very well" 0 +/-14 Speak English less than "very well" 0 +/-14
Urdu: 0 +/-14 Speak English "very well" 0 +/-14 Speak English less than "very well" 0 +/-14
Other Indic languages: 6 +/-8 Speak English "very well" 6 +/-8 Speak English less than "very well" 0 +/-14
Other Indo-European languages: 56 +/-82 Speak English "very well" 56 +/-82 Speak English less than "very well" 0 +/-14
Chinese: 0 +/-14 Speak English "very well" 0 +/-14 Speak English less than "very well" 0 +/-14
Japanese: 0 +/-14 Speak English "very well" 0 +/-14 Speak English less than "very well" 0 +/-14
Korean: 0 +/-14 Speak English "very well" 0 +/-14 Speak English less than "very well" 0 +/-14
Mon-Khmer, Cambodian: 0 +/-14 Speak English "very well" 0 +/-14 Speak English less than "very well" 0 +/-14
Hmong: 19 +/-27 Speak English "very well" 15 +/-21 Speak English less than "very well" 4 +/-6
Thai: 10 +/-15 Speak English "very well" 3 +/-5 Speak English less than "very well" 7 +/-10
Laotian: 0 +/-14 Speak English "very well" 0 +/-14 Speak English less than "very well" 0 +/-14
Vietnamese: 0 +/-14 Speak English "very well" 0 +/-14 Speak English less than "very well" 0 +/-14
Other Asian languages: 0 +/-14 Speak English "very well" 0 +/-14
2 of 4 12/16/2016

Green Lake County, Wisconsin
Estimate Margin of Error Speak English less than "very well" 0 +/-14
Tagalog: 23 +/-23 Speak English "very well" 23 +/-23 Speak English less than "very well" 0 +/-14
Other Pacific Island languages: 22 +/-28 Speak English "very well" 7 +/-10 Speak English less than "very well" 15 +/-19
Navajo: 0 +/-14 Speak English "very well" 0 +/-14 Speak English less than "very well" 0 +/-14
Other Native North American languages: 0 +/-14 Speak English "very well" 0 +/-14 Speak English less than "very well" 0 +/-14
Hungarian: 0 +/-14 Speak English "very well" 0 +/-14 Speak English less than "very well" 0 +/-14
Arabic: 0 +/-14 Speak English "very well" 0 +/-14 Speak English less than "very well" 0 +/-14
Hebrew: 0 +/-14 Speak English "very well" 0 +/-14 Speak English less than "very well" 0 +/-14
African languages: 0 +/-14 Speak English "very well" 0 +/-14 Speak English less than "very well" 0 +/-14
Other and unspecified languages: 0 +/-14 Speak English "very well" 0 +/-14 Speak English less than "very well" 0 +/-14
Data are based on a sample and are subject to sampling variability. The degree of uncertainty for an estimate arising from sampling variability is represented through the use of a margin of error. The value shown here is the 90 percent margin of error. The margin of error can be interpreted roughly as providing a 90 percent probability that the interval defined by the estimate minus the margin of error and the estimate plus the margin of error (the lower and upper confidence bounds) contains the true value. In addition to sampling variability, the ACS estimates are subject to nonsampling error (for a discussion of nonsampling variability, see Accuracy of the Data). The effect of nonsampling error is not represented in these tables.
Methodological changes to data collection in 2013 may have affected language data for 2013. Users should be aware of these changes when using multi-year data containing data from 2013. For more information, see: Language User Note.
While the 2011-2015 American Community Survey (ACS) data generally reflect the February 2013 Office of Management and Budget (OMB) definitions of metropolitan and micropolitan statistical areas; in certain instances the names, codes, and boundaries of the principal cities shown in ACS tables may differ from the OMB definitions due to differences in the effective dates of the geographic entities.
Estimates of urban and rural population, housing units, and characteristics reflect boundaries of urban areas defined based on Census 2010 data. As a result, data for urban and rural areas from the ACS do not necessarily reflect the results of ongoing urbanization.
Source: U.S. Census Bureau, 2011-2015 American Community Survey 5-Year Estimates
Explanation of Symbols:
1. An '**' entry in the margin of error column indicates that either no sample observations or too few sample observations were available to compute a standard error and thus the margin of error. A statistical test is not appropriate.
2. An '-' entry in the estimate column indicates that either no sample observations or too few sample observations were available to compute an estimate, or a ratio of medians cannot be calculated because one or both of the median estimates falls in the lowest interval or upper interval of an open-ended distribution.
3. An '-' following a median estimate means the median falls in the lowest interval of an open-ended distribution. 4. An '+' following a median estimate means the median falls in the upper interval of an open-ended distribution. 5. An '***' entry in the margin of error column indicates that the median falls in the lowest interval or upper interval of an open-ended distribution. A
statistical test is not appropriate. 6. An '*****' entry in the margin of error column indicates that the estimate is controlled. A statistical test for sampling variability is not appropriate.
3 of 4 12/16/2016

7. An 'N' entry in the estimate and margin of error columns indicates that data for this geographic area cannot be displayed because the number of sample cases is too small.
8. An '(X)' means that the estimate is not applicable or not available.

B16001 LANGUAGE SPOKEN AT HOME BY ABILITY TO SPEAK ENGLISH FOR THE POPULATION 5 YEARS AND OVER Universe: Population 5 years and over 2011-2015 American Community Survey 5-Year Estimates
Supporting documentation on code lists, subject definitions, data accuracy, and statistical testing can be found on the American Community Survey website in the Data and Documentation section.
Sample size and data quality measures (including coverage rates, allocation rates, and response rates) can be found on the American Community Survey website in the Methodology section.
Tell us what you think. Provide feedback to help make American Community Survey data more useful for you.
Although the American Community Survey (ACS) produces population, demographic and housing unit estimates, it is the Census Bureau's Population Estimates Program that produces and disseminates the official estimates of the population for the nation, states, counties, cities and towns and estimates of housing units for states and counties.
Iowa County, Wisconsin
Estimate Margin of Error Total: 22,350 +/-26 Speak only English 21,490 +/-194 Spanish or Spanish Creole: 428 +/-100 Speak English "very well" 275 +/-72 Speak English less than "very well" 153 +/-65
French (incl. Patois, Cajun): 46 +/-30 Speak English "very well" 46 +/-30 Speak English less than "very well" 0 +/-16
French Creole: 0 +/-16 Speak English "very well" 0 +/-16 Speak English less than "very well" 0 +/-16
Italian: 16 +/-14 Speak English "very well" 14 +/-12 Speak English less than "very well" 2 +/-4
Portuguese or Portuguese Creole: 0 +/-16 Speak English "very well" 0 +/-16 Speak English less than "very well" 0 +/-16
German: 100 +/-40 Speak English "very well" 92 +/-41 Speak English less than "very well" 8 +/-6
Yiddish: 0 +/-16 Speak English "very well" 0 +/-16 Speak English less than "very well" 0 +/-16
Other West Germanic languages: 106 +/-117 Speak English "very well" 89 +/-115 Speak English less than "very well" 17 +/-13
Scandinavian languages: 41 +/-41 Speak English "very well" 41 +/-41 Speak English less than "very well" 0 +/-16
Greek: 0 +/-16 Speak English "very well" 0 +/-16 Speak English less than "very well" 0 +/-16
1 of 4 12/16/2016
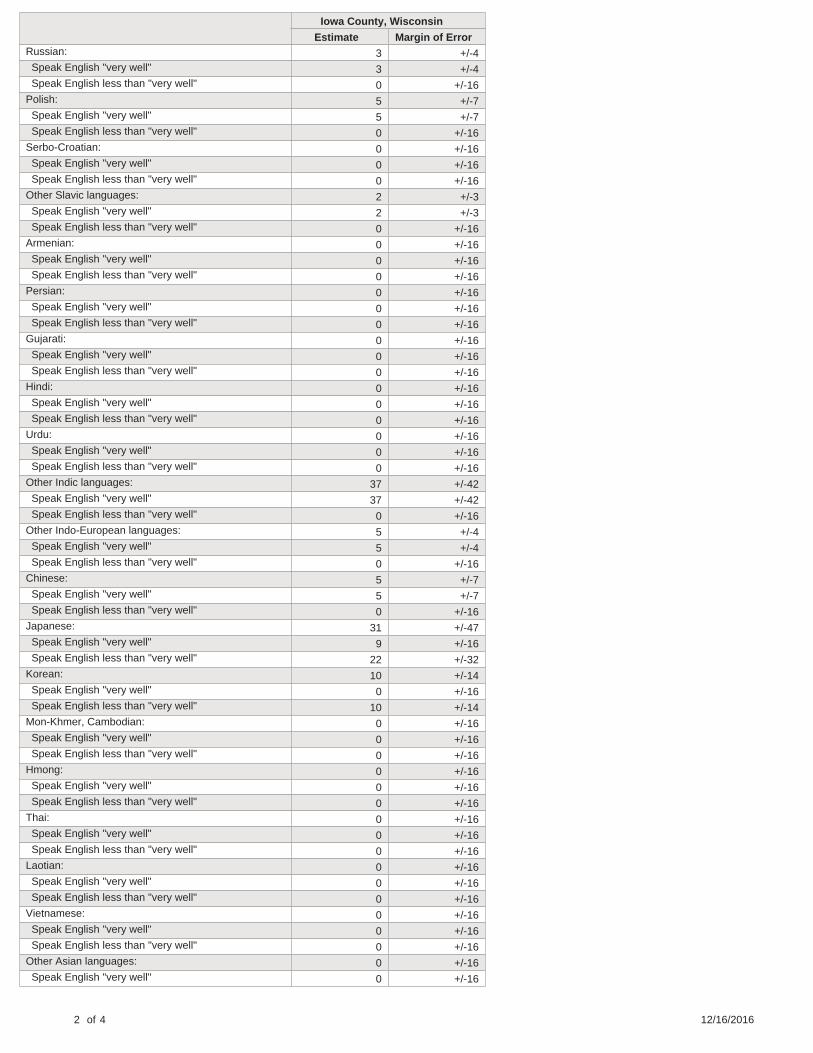
Iowa County, Wisconsin
Estimate Margin of Error Russian: 3 +/-4 Speak English "very well" 3 +/-4 Speak English less than "very well" 0 +/-16
Polish: 5 +/-7 Speak English "very well" 5 +/-7 Speak English less than "very well" 0 +/-16
Serbo-Croatian: 0 +/-16 Speak English "very well" 0 +/-16 Speak English less than "very well" 0 +/-16
Other Slavic languages: 2 +/-3 Speak English "very well" 2 +/-3 Speak English less than "very well" 0 +/-16
Armenian: 0 +/-16 Speak English "very well" 0 +/-16 Speak English less than "very well" 0 +/-16
Persian: 0 +/-16 Speak English "very well" 0 +/-16 Speak English less than "very well" 0 +/-16
Gujarati: 0 +/-16 Speak English "very well" 0 +/-16 Speak English less than "very well" 0 +/-16
Hindi: 0 +/-16 Speak English "very well" 0 +/-16 Speak English less than "very well" 0 +/-16
Urdu: 0 +/-16 Speak English "very well" 0 +/-16 Speak English less than "very well" 0 +/-16
Other Indic languages: 37 +/-42 Speak English "very well" 37 +/-42 Speak English less than "very well" 0 +/-16
Other Indo-European languages: 5 +/-4 Speak English "very well" 5 +/-4 Speak English less than "very well" 0 +/-16
Chinese: 5 +/-7 Speak English "very well" 5 +/-7 Speak English less than "very well" 0 +/-16
Japanese: 31 +/-47 Speak English "very well" 9 +/-16 Speak English less than "very well" 22 +/-32
Korean: 10 +/-14 Speak English "very well" 0 +/-16 Speak English less than "very well" 10 +/-14
Mon-Khmer, Cambodian: 0 +/-16 Speak English "very well" 0 +/-16 Speak English less than "very well" 0 +/-16
Hmong: 0 +/-16 Speak English "very well" 0 +/-16 Speak English less than "very well" 0 +/-16
Thai: 0 +/-16 Speak English "very well" 0 +/-16 Speak English less than "very well" 0 +/-16
Laotian: 0 +/-16 Speak English "very well" 0 +/-16 Speak English less than "very well" 0 +/-16
Vietnamese: 0 +/-16 Speak English "very well" 0 +/-16 Speak English less than "very well" 0 +/-16
Other Asian languages: 0 +/-16 Speak English "very well" 0 +/-16
2 of 4 12/16/2016

Iowa County, Wisconsin
Estimate Margin of Error Speak English less than "very well" 0 +/-16
Tagalog: 12 +/-15 Speak English "very well" 12 +/-15 Speak English less than "very well" 0 +/-16
Other Pacific Island languages: 0 +/-16 Speak English "very well" 0 +/-16 Speak English less than "very well" 0 +/-16
Navajo: 0 +/-16 Speak English "very well" 0 +/-16 Speak English less than "very well" 0 +/-16
Other Native North American languages: 12 +/-9 Speak English "very well" 12 +/-9 Speak English less than "very well" 0 +/-16
Hungarian: 0 +/-16 Speak English "very well" 0 +/-16 Speak English less than "very well" 0 +/-16
Arabic: 0 +/-16 Speak English "very well" 0 +/-16 Speak English less than "very well" 0 +/-16
Hebrew: 0 +/-16 Speak English "very well" 0 +/-16 Speak English less than "very well" 0 +/-16
African languages: 0 +/-16 Speak English "very well" 0 +/-16 Speak English less than "very well" 0 +/-16
Other and unspecified languages: 1 +/-3 Speak English "very well" 1 +/-3 Speak English less than "very well" 0 +/-16
Data are based on a sample and are subject to sampling variability. The degree of uncertainty for an estimate arising from sampling variability is represented through the use of a margin of error. The value shown here is the 90 percent margin of error. The margin of error can be interpreted roughly as providing a 90 percent probability that the interval defined by the estimate minus the margin of error and the estimate plus the margin of error (the lower and upper confidence bounds) contains the true value. In addition to sampling variability, the ACS estimates are subject to nonsampling error (for a discussion of nonsampling variability, see Accuracy of the Data). The effect of nonsampling error is not represented in these tables.
Methodological changes to data collection in 2013 may have affected language data for 2013. Users should be aware of these changes when using multi-year data containing data from 2013. For more information, see: Language User Note.
While the 2011-2015 American Community Survey (ACS) data generally reflect the February 2013 Office of Management and Budget (OMB) definitions of metropolitan and micropolitan statistical areas; in certain instances the names, codes, and boundaries of the principal cities shown in ACS tables may differ from the OMB definitions due to differences in the effective dates of the geographic entities.
Estimates of urban and rural population, housing units, and characteristics reflect boundaries of urban areas defined based on Census 2010 data. As a result, data for urban and rural areas from the ACS do not necessarily reflect the results of ongoing urbanization.
Source: U.S. Census Bureau, 2011-2015 American Community Survey 5-Year Estimates
Explanation of Symbols:
1. An '**' entry in the margin of error column indicates that either no sample observations or too few sample observations were available to compute a standard error and thus the margin of error. A statistical test is not appropriate.
2. An '-' entry in the estimate column indicates that either no sample observations or too few sample observations were available to compute an estimate, or a ratio of medians cannot be calculated because one or both of the median estimates falls in the lowest interval or upper interval of an open-ended distribution.
3. An '-' following a median estimate means the median falls in the lowest interval of an open-ended distribution. 4. An '+' following a median estimate means the median falls in the upper interval of an open-ended distribution. 5. An '***' entry in the margin of error column indicates that the median falls in the lowest interval or upper interval of an open-ended distribution. A
statistical test is not appropriate. 6. An '*****' entry in the margin of error column indicates that the estimate is controlled. A statistical test for sampling variability is not appropriate.
3 of 4 12/16/2016

7. An 'N' entry in the estimate and margin of error columns indicates that data for this geographic area cannot be displayed because the number of sample cases is too small.
8. An '(X)' means that the estimate is not applicable or not available.

B16001 LANGUAGE SPOKEN AT HOME BY ABILITY TO SPEAK ENGLISH FOR THE POPULATION 5 YEARS AND OVER Universe: Population 5 years and over 2011-2015 American Community Survey 5-Year Estimates
Supporting documentation on code lists, subject definitions, data accuracy, and statistical testing can be found on the American Community Survey website in the Data and Documentation section.
Sample size and data quality measures (including coverage rates, allocation rates, and response rates) can be found on the American Community Survey website in the Methodology section.
Tell us what you think. Provide feedback to help make American Community Survey data more useful for you.
Although the American Community Survey (ACS) produces population, demographic and housing unit estimates, it is the Census Bureau's Population Estimates Program that produces and disseminates the official estimates of the population for the nation, states, counties, cities and towns and estimates of housing units for states and counties.
Iron County, Wisconsin
Estimate Margin of Error Total: 5,695 +/-7 Speak only English 5,511 +/-48 Spanish or Spanish Creole: 101 +/-50 Speak English "very well" 90 +/-50 Speak English less than "very well" 11 +/-10
French (incl. Patois, Cajun): 4 +/-4 Speak English "very well" 4 +/-4 Speak English less than "very well" 0 +/-12
French Creole: 0 +/-12 Speak English "very well" 0 +/-12 Speak English less than "very well" 0 +/-12
Italian: 7 +/-6 Speak English "very well" 5 +/-5 Speak English less than "very well" 2 +/-3
Portuguese or Portuguese Creole: 0 +/-12 Speak English "very well" 0 +/-12 Speak English less than "very well" 0 +/-12
German: 20 +/-10 Speak English "very well" 10 +/-8 Speak English less than "very well" 10 +/-7
Yiddish: 0 +/-12 Speak English "very well" 0 +/-12 Speak English less than "very well" 0 +/-12
Other West Germanic languages: 3 +/-4 Speak English "very well" 3 +/-4 Speak English less than "very well" 0 +/-12
Scandinavian languages: 0 +/-12 Speak English "very well" 0 +/-12 Speak English less than "very well" 0 +/-12
Greek: 0 +/-12 Speak English "very well" 0 +/-12 Speak English less than "very well" 0 +/-12
1 of 4 12/16/2016

Iron County, Wisconsin
Estimate Margin of Error Russian: 0 +/-12 Speak English "very well" 0 +/-12 Speak English less than "very well" 0 +/-12
Polish: 0 +/-12 Speak English "very well" 0 +/-12 Speak English less than "very well" 0 +/-12
Serbo-Croatian: 3 +/-4 Speak English "very well" 3 +/-4 Speak English less than "very well" 0 +/-12
Other Slavic languages: 0 +/-12 Speak English "very well" 0 +/-12 Speak English less than "very well" 0 +/-12
Armenian: 0 +/-12 Speak English "very well" 0 +/-12 Speak English less than "very well" 0 +/-12
Persian: 0 +/-12 Speak English "very well" 0 +/-12 Speak English less than "very well" 0 +/-12
Gujarati: 0 +/-12 Speak English "very well" 0 +/-12 Speak English less than "very well" 0 +/-12
Hindi: 8 +/-9 Speak English "very well" 8 +/-9 Speak English less than "very well" 0 +/-12
Urdu: 0 +/-12 Speak English "very well" 0 +/-12 Speak English less than "very well" 0 +/-12
Other Indic languages: 0 +/-12 Speak English "very well" 0 +/-12 Speak English less than "very well" 0 +/-12
Other Indo-European languages: 0 +/-12 Speak English "very well" 0 +/-12 Speak English less than "very well" 0 +/-12
Chinese: 0 +/-12 Speak English "very well" 0 +/-12 Speak English less than "very well" 0 +/-12
Japanese: 4 +/-8 Speak English "very well" 4 +/-8 Speak English less than "very well" 0 +/-12
Korean: 4 +/-4 Speak English "very well" 4 +/-4 Speak English less than "very well" 0 +/-12
Mon-Khmer, Cambodian: 0 +/-12 Speak English "very well" 0 +/-12 Speak English less than "very well" 0 +/-12
Hmong: 0 +/-12 Speak English "very well" 0 +/-12 Speak English less than "very well" 0 +/-12
Thai: 0 +/-12 Speak English "very well" 0 +/-12 Speak English less than "very well" 0 +/-12
Laotian: 0 +/-12 Speak English "very well" 0 +/-12 Speak English less than "very well" 0 +/-12
Vietnamese: 0 +/-12 Speak English "very well" 0 +/-12 Speak English less than "very well" 0 +/-12
Other Asian languages: 0 +/-12 Speak English "very well" 0 +/-12
2 of 4 12/16/2016

Iron County, Wisconsin
Estimate Margin of Error Speak English less than "very well" 0 +/-12
Tagalog: 0 +/-12 Speak English "very well" 0 +/-12 Speak English less than "very well" 0 +/-12
Other Pacific Island languages: 0 +/-12 Speak English "very well" 0 +/-12 Speak English less than "very well" 0 +/-12
Navajo: 0 +/-12 Speak English "very well" 0 +/-12 Speak English less than "very well" 0 +/-12
Other Native North American languages: 4 +/-5 Speak English "very well" 4 +/-5 Speak English less than "very well" 0 +/-12
Hungarian: 0 +/-12 Speak English "very well" 0 +/-12 Speak English less than "very well" 0 +/-12
Arabic: 0 +/-12 Speak English "very well" 0 +/-12 Speak English less than "very well" 0 +/-12
Hebrew: 0 +/-12 Speak English "very well" 0 +/-12 Speak English less than "very well" 0 +/-12
African languages: 0 +/-12 Speak English "very well" 0 +/-12 Speak English less than "very well" 0 +/-12
Other and unspecified languages: 26 +/-12 Speak English "very well" 21 +/-10 Speak English less than "very well" 5 +/-6
Data are based on a sample and are subject to sampling variability. The degree of uncertainty for an estimate arising from sampling variability is represented through the use of a margin of error. The value shown here is the 90 percent margin of error. The margin of error can be interpreted roughly as providing a 90 percent probability that the interval defined by the estimate minus the margin of error and the estimate plus the margin of error (the lower and upper confidence bounds) contains the true value. In addition to sampling variability, the ACS estimates are subject to nonsampling error (for a discussion of nonsampling variability, see Accuracy of the Data). The effect of nonsampling error is not represented in these tables.
Methodological changes to data collection in 2013 may have affected language data for 2013. Users should be aware of these changes when using multi-year data containing data from 2013. For more information, see: Language User Note.
While the 2011-2015 American Community Survey (ACS) data generally reflect the February 2013 Office of Management and Budget (OMB) definitions of metropolitan and micropolitan statistical areas; in certain instances the names, codes, and boundaries of the principal cities shown in ACS tables may differ from the OMB definitions due to differences in the effective dates of the geographic entities.
Estimates of urban and rural population, housing units, and characteristics reflect boundaries of urban areas defined based on Census 2010 data. As a result, data for urban and rural areas from the ACS do not necessarily reflect the results of ongoing urbanization.
Source: U.S. Census Bureau, 2011-2015 American Community Survey 5-Year Estimates
Explanation of Symbols:
1. An '**' entry in the margin of error column indicates that either no sample observations or too few sample observations were available to compute a standard error and thus the margin of error. A statistical test is not appropriate.
2. An '-' entry in the estimate column indicates that either no sample observations or too few sample observations were available to compute an estimate, or a ratio of medians cannot be calculated because one or both of the median estimates falls in the lowest interval or upper interval of an open-ended distribution.
3. An '-' following a median estimate means the median falls in the lowest interval of an open-ended distribution. 4. An '+' following a median estimate means the median falls in the upper interval of an open-ended distribution. 5. An '***' entry in the margin of error column indicates that the median falls in the lowest interval or upper interval of an open-ended distribution. A
statistical test is not appropriate. 6. An '*****' entry in the margin of error column indicates that the estimate is controlled. A statistical test for sampling variability is not appropriate.
3 of 4 12/16/2016

7. An 'N' entry in the estimate and margin of error columns indicates that data for this geographic area cannot be displayed because the number of sample cases is too small.
8. An '(X)' means that the estimate is not applicable or not available.
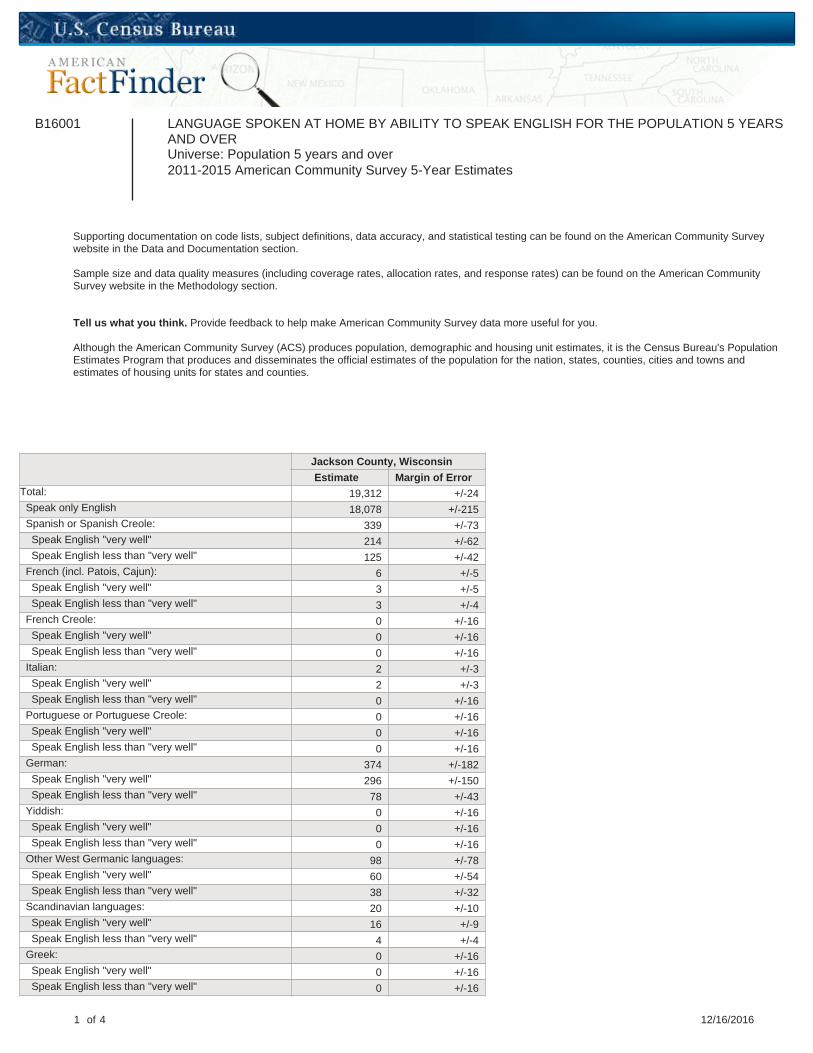
B16001 LANGUAGE SPOKEN AT HOME BY ABILITY TO SPEAK ENGLISH FOR THE POPULATION 5 YEARS AND OVER Universe: Population 5 years and over 2011-2015 American Community Survey 5-Year Estimates
Supporting documentation on code lists, subject definitions, data accuracy, and statistical testing can be found on the American Community Survey website in the Data and Documentation section.
Sample size and data quality measures (including coverage rates, allocation rates, and response rates) can be found on the American Community Survey website in the Methodology section.
Tell us what you think. Provide feedback to help make American Community Survey data more useful for you.
Although the American Community Survey (ACS) produces population, demographic and housing unit estimates, it is the Census Bureau's Population Estimates Program that produces and disseminates the official estimates of the population for the nation, states, counties, cities and towns and estimates of housing units for states and counties.
Jackson County, Wisconsin
Estimate Margin of Error Total: 19,312 +/-24 Speak only English 18,078 +/-215 Spanish or Spanish Creole: 339 +/-73 Speak English "very well" 214 +/-62 Speak English less than "very well" 125 +/-42
French (incl. Patois, Cajun): 6 +/-5 Speak English "very well" 3 +/-5 Speak English less than "very well" 3 +/-4
French Creole: 0 +/-16 Speak English "very well" 0 +/-16 Speak English less than "very well" 0 +/-16
Italian: 2 +/-3 Speak English "very well" 2 +/-3 Speak English less than "very well" 0 +/-16
Portuguese or Portuguese Creole: 0 +/-16 Speak English "very well" 0 +/-16 Speak English less than "very well" 0 +/-16
German: 374 +/-182 Speak English "very well" 296 +/-150 Speak English less than "very well" 78 +/-43
Yiddish: 0 +/-16 Speak English "very well" 0 +/-16 Speak English less than "very well" 0 +/-16
Other West Germanic languages: 98 +/-78 Speak English "very well" 60 +/-54 Speak English less than "very well" 38 +/-32
Scandinavian languages: 20 +/-10 Speak English "very well" 16 +/-9 Speak English less than "very well" 4 +/-4
Greek: 0 +/-16 Speak English "very well" 0 +/-16 Speak English less than "very well" 0 +/-16
1 of 4 12/16/2016

Jackson County, Wisconsin
Estimate Margin of Error Russian: 0 +/-16 Speak English "very well" 0 +/-16 Speak English less than "very well" 0 +/-16
Polish: 7 +/-6 Speak English "very well" 5 +/-4 Speak English less than "very well" 2 +/-3
Serbo-Croatian: 0 +/-16 Speak English "very well" 0 +/-16 Speak English less than "very well" 0 +/-16
Other Slavic languages: 3 +/-4 Speak English "very well" 3 +/-4 Speak English less than "very well" 0 +/-16
Armenian: 0 +/-16 Speak English "very well" 0 +/-16 Speak English less than "very well" 0 +/-16
Persian: 0 +/-16 Speak English "very well" 0 +/-16 Speak English less than "very well" 0 +/-16
Gujarati: 0 +/-16 Speak English "very well" 0 +/-16 Speak English less than "very well" 0 +/-16
Hindi: 0 +/-16 Speak English "very well" 0 +/-16 Speak English less than "very well" 0 +/-16
Urdu: 0 +/-16 Speak English "very well" 0 +/-16 Speak English less than "very well" 0 +/-16
Other Indic languages: 0 +/-16 Speak English "very well" 0 +/-16 Speak English less than "very well" 0 +/-16
Other Indo-European languages: 2 +/-2 Speak English "very well" 2 +/-2 Speak English less than "very well" 0 +/-16
Chinese: 0 +/-16 Speak English "very well" 0 +/-16 Speak English less than "very well" 0 +/-16
Japanese: 9 +/-8 Speak English "very well" 9 +/-8 Speak English less than "very well" 0 +/-16
Korean: 1 +/-3 Speak English "very well" 1 +/-3 Speak English less than "very well" 0 +/-16
Mon-Khmer, Cambodian: 0 +/-16 Speak English "very well" 0 +/-16 Speak English less than "very well" 0 +/-16
Hmong: 13 +/-12 Speak English "very well" 8 +/-8 Speak English less than "very well" 5 +/-9
Thai: 0 +/-16 Speak English "very well" 0 +/-16 Speak English less than "very well" 0 +/-16
Laotian: 42 +/-46 Speak English "very well" 26 +/-29 Speak English less than "very well" 16 +/-19
Vietnamese: 0 +/-16 Speak English "very well" 0 +/-16 Speak English less than "very well" 0 +/-16
Other Asian languages: 2 +/-4 Speak English "very well" 0 +/-16
2 of 4 12/16/2016
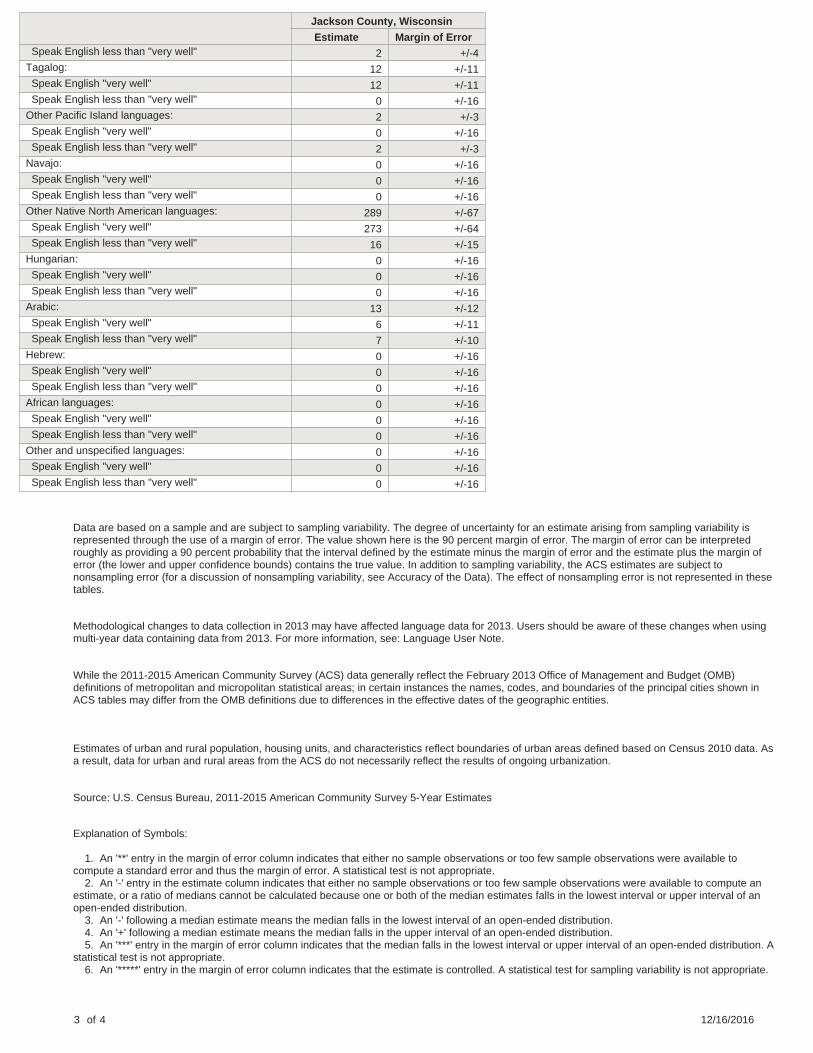
Jackson County, Wisconsin
Estimate Margin of Error Speak English less than "very well" 2 +/-4
Tagalog: 12 +/-11 Speak English "very well" 12 +/-11 Speak English less than "very well" 0 +/-16
Other Pacific Island languages: 2 +/-3 Speak English "very well" 0 +/-16 Speak English less than "very well" 2 +/-3
Navajo: 0 +/-16 Speak English "very well" 0 +/-16 Speak English less than "very well" 0 +/-16
Other Native North American languages: 289 +/-67 Speak English "very well" 273 +/-64 Speak English less than "very well" 16 +/-15
Hungarian: 0 +/-16 Speak English "very well" 0 +/-16 Speak English less than "very well" 0 +/-16
Arabic: 13 +/-12 Speak English "very well" 6 +/-11 Speak English less than "very well" 7 +/-10
Hebrew: 0 +/-16 Speak English "very well" 0 +/-16 Speak English less than "very well" 0 +/-16
African languages: 0 +/-16 Speak English "very well" 0 +/-16 Speak English less than "very well" 0 +/-16
Other and unspecified languages: 0 +/-16 Speak English "very well" 0 +/-16 Speak English less than "very well" 0 +/-16
Data are based on a sample and are subject to sampling variability. The degree of uncertainty for an estimate arising from sampling variability is represented through the use of a margin of error. The value shown here is the 90 percent margin of error. The margin of error can be interpreted roughly as providing a 90 percent probability that the interval defined by the estimate minus the margin of error and the estimate plus the margin of error (the lower and upper confidence bounds) contains the true value. In addition to sampling variability, the ACS estimates are subject to nonsampling error (for a discussion of nonsampling variability, see Accuracy of the Data). The effect of nonsampling error is not represented in these tables.
Methodological changes to data collection in 2013 may have affected language data for 2013. Users should be aware of these changes when using multi-year data containing data from 2013. For more information, see: Language User Note.
While the 2011-2015 American Community Survey (ACS) data generally reflect the February 2013 Office of Management and Budget (OMB) definitions of metropolitan and micropolitan statistical areas; in certain instances the names, codes, and boundaries of the principal cities shown in ACS tables may differ from the OMB definitions due to differences in the effective dates of the geographic entities.
Estimates of urban and rural population, housing units, and characteristics reflect boundaries of urban areas defined based on Census 2010 data. As a result, data for urban and rural areas from the ACS do not necessarily reflect the results of ongoing urbanization.
Source: U.S. Census Bureau, 2011-2015 American Community Survey 5-Year Estimates
Explanation of Symbols:
1. An '**' entry in the margin of error column indicates that either no sample observations or too few sample observations were available to compute a standard error and thus the margin of error. A statistical test is not appropriate.
2. An '-' entry in the estimate column indicates that either no sample observations or too few sample observations were available to compute an estimate, or a ratio of medians cannot be calculated because one or both of the median estimates falls in the lowest interval or upper interval of an open-ended distribution.
3. An '-' following a median estimate means the median falls in the lowest interval of an open-ended distribution. 4. An '+' following a median estimate means the median falls in the upper interval of an open-ended distribution. 5. An '***' entry in the margin of error column indicates that the median falls in the lowest interval or upper interval of an open-ended distribution. A
statistical test is not appropriate. 6. An '*****' entry in the margin of error column indicates that the estimate is controlled. A statistical test for sampling variability is not appropriate.
3 of 4 12/16/2016

7. An 'N' entry in the estimate and margin of error columns indicates that data for this geographic area cannot be displayed because the number of sample cases is too small.
8. An '(X)' means that the estimate is not applicable or not available.

B16001 LANGUAGE SPOKEN AT HOME BY ABILITY TO SPEAK ENGLISH FOR THE POPULATION 5 YEARS AND OVER Universe: Population 5 years and over 2011-2015 American Community Survey 5-Year Estimates
Supporting documentation on code lists, subject definitions, data accuracy, and statistical testing can be found on the American Community Survey website in the Data and Documentation section.
Sample size and data quality measures (including coverage rates, allocation rates, and response rates) can be found on the American Community Survey website in the Methodology section.
Tell us what you think. Provide feedback to help make American Community Survey data more useful for you.
Although the American Community Survey (ACS) produces population, demographic and housing unit estimates, it is the Census Bureau's Population Estimates Program that produces and disseminates the official estimates of the population for the nation, states, counties, cities and towns and estimates of housing units for states and counties.
Jefferson County, Wisconsin
Estimate Margin of Error Total: 79,616 +/-39 Speak only English 74,014 +/-449 Spanish or Spanish Creole: 4,089 +/-370 Speak English "very well" 2,685 +/-343 Speak English less than "very well" 1,404 +/-169
French (incl. Patois, Cajun): 133 +/-75 Speak English "very well" 101 +/-60 Speak English less than "very well" 32 +/-33
French Creole: 0 +/-20 Speak English "very well" 0 +/-20 Speak English less than "very well" 0 +/-20
Italian: 58 +/-35 Speak English "very well" 42 +/-30 Speak English less than "very well" 16 +/-14
Portuguese or Portuguese Creole: 22 +/-28 Speak English "very well" 22 +/-28 Speak English less than "very well" 0 +/-20
German: 444 +/-117 Speak English "very well" 382 +/-109 Speak English less than "very well" 62 +/-40
Yiddish: 0 +/-20 Speak English "very well" 0 +/-20 Speak English less than "very well" 0 +/-20
Other West Germanic languages: 67 +/-62 Speak English "very well" 64 +/-62 Speak English less than "very well" 3 +/-5
Scandinavian languages: 20 +/-18 Speak English "very well" 20 +/-18 Speak English less than "very well" 0 +/-20
Greek: 9 +/-14 Speak English "very well" 9 +/-14 Speak English less than "very well" 0 +/-20
1 of 4 12/16/2016

Jefferson County, Wisconsin
Estimate Margin of Error Russian: 77 +/-47 Speak English "very well" 62 +/-42 Speak English less than "very well" 15 +/-18
Polish: 14 +/-12 Speak English "very well" 9 +/-10 Speak English less than "very well" 5 +/-8
Serbo-Croatian: 4 +/-8 Speak English "very well" 4 +/-8 Speak English less than "very well" 0 +/-20
Other Slavic languages: 26 +/-33 Speak English "very well" 0 +/-20 Speak English less than "very well" 26 +/-33
Armenian: 0 +/-20 Speak English "very well" 0 +/-20 Speak English less than "very well" 0 +/-20
Persian: 0 +/-20 Speak English "very well" 0 +/-20 Speak English less than "very well" 0 +/-20
Gujarati: 0 +/-20 Speak English "very well" 0 +/-20 Speak English less than "very well" 0 +/-20
Hindi: 46 +/-56 Speak English "very well" 36 +/-54 Speak English less than "very well" 10 +/-18
Urdu: 27 +/-44 Speak English "very well" 10 +/-16 Speak English less than "very well" 17 +/-29
Other Indic languages: 11 +/-22 Speak English "very well" 0 +/-20 Speak English less than "very well" 11 +/-22
Other Indo-European languages: 193 +/-156 Speak English "very well" 97 +/-80 Speak English less than "very well" 96 +/-82
Chinese: 106 +/-56 Speak English "very well" 63 +/-57 Speak English less than "very well" 43 +/-35
Japanese: 29 +/-27 Speak English "very well" 5 +/-7 Speak English less than "very well" 24 +/-26
Korean: 13 +/-27 Speak English "very well" 0 +/-20 Speak English less than "very well" 13 +/-27
Mon-Khmer, Cambodian: 0 +/-20 Speak English "very well" 0 +/-20 Speak English less than "very well" 0 +/-20
Hmong: 61 +/-40 Speak English "very well" 23 +/-20 Speak English less than "very well" 38 +/-35
Thai: 7 +/-11 Speak English "very well" 0 +/-20 Speak English less than "very well" 7 +/-11
Laotian: 0 +/-20 Speak English "very well" 0 +/-20 Speak English less than "very well" 0 +/-20
Vietnamese: 29 +/-39 Speak English "very well" 6 +/-9 Speak English less than "very well" 23 +/-31
Other Asian languages: 9 +/-15 Speak English "very well" 9 +/-15
2 of 4 12/16/2016

Jefferson County, Wisconsin
Estimate Margin of Error Speak English less than "very well" 0 +/-20
Tagalog: 78 +/-73 Speak English "very well" 32 +/-36 Speak English less than "very well" 46 +/-46
Other Pacific Island languages: 8 +/-10 Speak English "very well" 0 +/-20 Speak English less than "very well" 8 +/-10
Navajo: 0 +/-20 Speak English "very well" 0 +/-20 Speak English less than "very well" 0 +/-20
Other Native North American languages: 0 +/-20 Speak English "very well" 0 +/-20 Speak English less than "very well" 0 +/-20
Hungarian: 0 +/-20 Speak English "very well" 0 +/-20 Speak English less than "very well" 0 +/-20
Arabic: 0 +/-20 Speak English "very well" 0 +/-20 Speak English less than "very well" 0 +/-20
Hebrew: 0 +/-20 Speak English "very well" 0 +/-20 Speak English less than "very well" 0 +/-20
African languages: 10 +/-19 Speak English "very well" 10 +/-19 Speak English less than "very well" 0 +/-20
Other and unspecified languages: 12 +/-8 Speak English "very well" 9 +/-7 Speak English less than "very well" 3 +/-4
Data are based on a sample and are subject to sampling variability. The degree of uncertainty for an estimate arising from sampling variability is represented through the use of a margin of error. The value shown here is the 90 percent margin of error. The margin of error can be interpreted roughly as providing a 90 percent probability that the interval defined by the estimate minus the margin of error and the estimate plus the margin of error (the lower and upper confidence bounds) contains the true value. In addition to sampling variability, the ACS estimates are subject to nonsampling error (for a discussion of nonsampling variability, see Accuracy of the Data). The effect of nonsampling error is not represented in these tables.
Methodological changes to data collection in 2013 may have affected language data for 2013. Users should be aware of these changes when using multi-year data containing data from 2013. For more information, see: Language User Note.
While the 2011-2015 American Community Survey (ACS) data generally reflect the February 2013 Office of Management and Budget (OMB) definitions of metropolitan and micropolitan statistical areas; in certain instances the names, codes, and boundaries of the principal cities shown in ACS tables may differ from the OMB definitions due to differences in the effective dates of the geographic entities.
Estimates of urban and rural population, housing units, and characteristics reflect boundaries of urban areas defined based on Census 2010 data. As a result, data for urban and rural areas from the ACS do not necessarily reflect the results of ongoing urbanization.
Source: U.S. Census Bureau, 2011-2015 American Community Survey 5-Year Estimates
Explanation of Symbols:
1. An '**' entry in the margin of error column indicates that either no sample observations or too few sample observations were available to compute a standard error and thus the margin of error. A statistical test is not appropriate.
2. An '-' entry in the estimate column indicates that either no sample observations or too few sample observations were available to compute an estimate, or a ratio of medians cannot be calculated because one or both of the median estimates falls in the lowest interval or upper interval of an open-ended distribution.
3. An '-' following a median estimate means the median falls in the lowest interval of an open-ended distribution. 4. An '+' following a median estimate means the median falls in the upper interval of an open-ended distribution. 5. An '***' entry in the margin of error column indicates that the median falls in the lowest interval or upper interval of an open-ended distribution. A
statistical test is not appropriate. 6. An '*****' entry in the margin of error column indicates that the estimate is controlled. A statistical test for sampling variability is not appropriate.
3 of 4 12/16/2016

7. An 'N' entry in the estimate and margin of error columns indicates that data for this geographic area cannot be displayed because the number of sample cases is too small.
8. An '(X)' means that the estimate is not applicable or not available.

B16001 LANGUAGE SPOKEN AT HOME BY ABILITY TO SPEAK ENGLISH FOR THE POPULATION 5 YEARS AND OVER Universe: Population 5 years and over 2011-2015 American Community Survey 5-Year Estimates
Supporting documentation on code lists, subject definitions, data accuracy, and statistical testing can be found on the American Community Survey website in the Data and Documentation section.
Sample size and data quality measures (including coverage rates, allocation rates, and response rates) can be found on the American Community Survey website in the Methodology section.
Tell us what you think. Provide feedback to help make American Community Survey data more useful for you.
Although the American Community Survey (ACS) produces population, demographic and housing unit estimates, it is the Census Bureau's Population Estimates Program that produces and disseminates the official estimates of the population for the nation, states, counties, cities and towns and estimates of housing units for states and counties.
Juneau County, Wisconsin
Estimate Margin of Error Total: 25,086 +/-26 Speak only English 24,096 +/-141 Spanish or Spanish Creole: 433 +/-85 Speak English "very well" 340 +/-88 Speak English less than "very well" 93 +/-39
French (incl. Patois, Cajun): 28 +/-15 Speak English "very well" 25 +/-14 Speak English less than "very well" 3 +/-4
French Creole: 0 +/-16 Speak English "very well" 0 +/-16 Speak English less than "very well" 0 +/-16
Italian: 7 +/-11 Speak English "very well" 7 +/-11 Speak English less than "very well" 0 +/-16
Portuguese or Portuguese Creole: 0 +/-16 Speak English "very well" 0 +/-16 Speak English less than "very well" 0 +/-16
German: 140 +/-62 Speak English "very well" 105 +/-53 Speak English less than "very well" 35 +/-20
Yiddish: 0 +/-16 Speak English "very well" 0 +/-16 Speak English less than "very well" 0 +/-16
Other West Germanic languages: 4 +/-5 Speak English "very well" 0 +/-16 Speak English less than "very well" 4 +/-5
Scandinavian languages: 14 +/-12 Speak English "very well" 14 +/-12 Speak English less than "very well" 0 +/-16
Greek: 0 +/-16 Speak English "very well" 0 +/-16 Speak English less than "very well" 0 +/-16
1 of 4 12/16/2016

Juneau County, Wisconsin
Estimate Margin of Error Russian: 22 +/-34 Speak English "very well" 22 +/-34 Speak English less than "very well" 0 +/-16
Polish: 96 +/-31 Speak English "very well" 42 +/-21 Speak English less than "very well" 54 +/-25
Serbo-Croatian: 13 +/-15 Speak English "very well" 0 +/-16 Speak English less than "very well" 13 +/-15
Other Slavic languages: 17 +/-14 Speak English "very well" 5 +/-5 Speak English less than "very well" 12 +/-11
Armenian: 0 +/-16 Speak English "very well" 0 +/-16 Speak English less than "very well" 0 +/-16
Persian: 0 +/-16 Speak English "very well" 0 +/-16 Speak English less than "very well" 0 +/-16
Gujarati: 0 +/-16 Speak English "very well" 0 +/-16 Speak English less than "very well" 0 +/-16
Hindi: 0 +/-16 Speak English "very well" 0 +/-16 Speak English less than "very well" 0 +/-16
Urdu: 0 +/-16 Speak English "very well" 0 +/-16 Speak English less than "very well" 0 +/-16
Other Indic languages: 0 +/-16 Speak English "very well" 0 +/-16 Speak English less than "very well" 0 +/-16
Other Indo-European languages: 6 +/-7 Speak English "very well" 3 +/-4 Speak English less than "very well" 3 +/-6
Chinese: 40 +/-45 Speak English "very well" 0 +/-16 Speak English less than "very well" 40 +/-45
Japanese: 14 +/-13 Speak English "very well" 14 +/-13 Speak English less than "very well" 0 +/-16
Korean: 0 +/-16 Speak English "very well" 0 +/-16 Speak English less than "very well" 0 +/-16
Mon-Khmer, Cambodian: 0 +/-16 Speak English "very well" 0 +/-16 Speak English less than "very well" 0 +/-16
Hmong: 5 +/-10 Speak English "very well" 5 +/-10 Speak English less than "very well" 0 +/-16
Thai: 9 +/-11 Speak English "very well" 4 +/-6 Speak English less than "very well" 5 +/-7
Laotian: 0 +/-16 Speak English "very well" 0 +/-16 Speak English less than "very well" 0 +/-16
Vietnamese: 0 +/-16 Speak English "very well" 0 +/-16 Speak English less than "very well" 0 +/-16
Other Asian languages: 2 +/-4 Speak English "very well" 2 +/-4
2 of 4 12/16/2016

Juneau County, Wisconsin
Estimate Margin of Error Speak English less than "very well" 0 +/-16
Tagalog: 20 +/-17 Speak English "very well" 15 +/-13 Speak English less than "very well" 5 +/-9
Other Pacific Island languages: 0 +/-16 Speak English "very well" 0 +/-16 Speak English less than "very well" 0 +/-16
Navajo: 0 +/-16 Speak English "very well" 0 +/-16 Speak English less than "very well" 0 +/-16
Other Native North American languages: 82 +/-40 Speak English "very well" 67 +/-39 Speak English less than "very well" 15 +/-9
Hungarian: 0 +/-16 Speak English "very well" 0 +/-16 Speak English less than "very well" 0 +/-16
Arabic: 5 +/-9 Speak English "very well" 0 +/-16 Speak English less than "very well" 5 +/-9
Hebrew: 0 +/-16 Speak English "very well" 0 +/-16 Speak English less than "very well" 0 +/-16
African languages: 29 +/-36 Speak English "very well" 17 +/-18 Speak English less than "very well" 12 +/-21
Other and unspecified languages: 4 +/-5 Speak English "very well" 4 +/-5 Speak English less than "very well" 0 +/-16
Data are based on a sample and are subject to sampling variability. The degree of uncertainty for an estimate arising from sampling variability is represented through the use of a margin of error. The value shown here is the 90 percent margin of error. The margin of error can be interpreted roughly as providing a 90 percent probability that the interval defined by the estimate minus the margin of error and the estimate plus the margin of error (the lower and upper confidence bounds) contains the true value. In addition to sampling variability, the ACS estimates are subject to nonsampling error (for a discussion of nonsampling variability, see Accuracy of the Data). The effect of nonsampling error is not represented in these tables.
Methodological changes to data collection in 2013 may have affected language data for 2013. Users should be aware of these changes when using multi-year data containing data from 2013. For more information, see: Language User Note.
While the 2011-2015 American Community Survey (ACS) data generally reflect the February 2013 Office of Management and Budget (OMB) definitions of metropolitan and micropolitan statistical areas; in certain instances the names, codes, and boundaries of the principal cities shown in ACS tables may differ from the OMB definitions due to differences in the effective dates of the geographic entities.
Estimates of urban and rural population, housing units, and characteristics reflect boundaries of urban areas defined based on Census 2010 data. As a result, data for urban and rural areas from the ACS do not necessarily reflect the results of ongoing urbanization.
Source: U.S. Census Bureau, 2011-2015 American Community Survey 5-Year Estimates
Explanation of Symbols:
1. An '**' entry in the margin of error column indicates that either no sample observations or too few sample observations were available to compute a standard error and thus the margin of error. A statistical test is not appropriate.
2. An '-' entry in the estimate column indicates that either no sample observations or too few sample observations were available to compute an estimate, or a ratio of medians cannot be calculated because one or both of the median estimates falls in the lowest interval or upper interval of an open-ended distribution.
3. An '-' following a median estimate means the median falls in the lowest interval of an open-ended distribution. 4. An '+' following a median estimate means the median falls in the upper interval of an open-ended distribution. 5. An '***' entry in the margin of error column indicates that the median falls in the lowest interval or upper interval of an open-ended distribution. A
statistical test is not appropriate. 6. An '*****' entry in the margin of error column indicates that the estimate is controlled. A statistical test for sampling variability is not appropriate.
3 of 4 12/16/2016

7. An 'N' entry in the estimate and margin of error columns indicates that data for this geographic area cannot be displayed because the number of sample cases is too small.
8. An '(X)' means that the estimate is not applicable or not available.

B16001 LANGUAGE SPOKEN AT HOME BY ABILITY TO SPEAK ENGLISH FOR THE POPULATION 5 YEARS AND OVER Universe: Population 5 years and over 2011-2015 American Community Survey 5-Year Estimates
Supporting documentation on code lists, subject definitions, data accuracy, and statistical testing can be found on the American Community Survey website in the Data and Documentation section.
Sample size and data quality measures (including coverage rates, allocation rates, and response rates) can be found on the American Community Survey website in the Methodology section.
Tell us what you think. Provide feedback to help make American Community Survey data more useful for you.
Although the American Community Survey (ACS) produces population, demographic and housing unit estimates, it is the Census Bureau's Population Estimates Program that produces and disseminates the official estimates of the population for the nation, states, counties, cities and towns and estimates of housing units for states and counties.
Kenosha County, Wisconsin
Estimate Margin of Error Total: 157,474 +/-48 Speak only English 140,302 +/-1,012 Spanish or Spanish Creole: 11,977 +/-829 Speak English "very well" 8,189 +/-664 Speak English less than "very well" 3,788 +/-437
French (incl. Patois, Cajun): 260 +/-115 Speak English "very well" 169 +/-101 Speak English less than "very well" 91 +/-50
French Creole: 22 +/-27 Speak English "very well" 22 +/-27 Speak English less than "very well" 0 +/-20
Italian: 713 +/-214 Speak English "very well" 447 +/-178 Speak English less than "very well" 266 +/-103
Portuguese or Portuguese Creole: 26 +/-29 Speak English "very well" 15 +/-23 Speak English less than "very well" 11 +/-17
German: 576 +/-178 Speak English "very well" 439 +/-166 Speak English less than "very well" 137 +/-79
Yiddish: 0 +/-20 Speak English "very well" 0 +/-20 Speak English less than "very well" 0 +/-20
Other West Germanic languages: 21 +/-30 Speak English "very well" 21 +/-30 Speak English less than "very well" 0 +/-20
Scandinavian languages: 60 +/-52 Speak English "very well" 60 +/-52 Speak English less than "very well" 0 +/-20
Greek: 157 +/-185 Speak English "very well" 16 +/-27 Speak English less than "very well" 141 +/-182
1 of 4 12/16/2016

Kenosha County, Wisconsin
Estimate Margin of Error Russian: 128 +/-96 Speak English "very well" 96 +/-92 Speak English less than "very well" 32 +/-30
Polish: 581 +/-300 Speak English "very well" 544 +/-289 Speak English less than "very well" 37 +/-38
Serbo-Croatian: 408 +/-227 Speak English "very well" 233 +/-157 Speak English less than "very well" 175 +/-109
Other Slavic languages: 97 +/-73 Speak English "very well" 48 +/-43 Speak English less than "very well" 49 +/-60
Armenian: 0 +/-20 Speak English "very well" 0 +/-20 Speak English less than "very well" 0 +/-20
Persian: 8 +/-16 Speak English "very well" 8 +/-16 Speak English less than "very well" 0 +/-20
Gujarati: 218 +/-181 Speak English "very well" 114 +/-142 Speak English less than "very well" 104 +/-92
Hindi: 10 +/-19 Speak English "very well" 10 +/-19 Speak English less than "very well" 0 +/-20
Urdu: 155 +/-156 Speak English "very well" 129 +/-124 Speak English less than "very well" 26 +/-38
Other Indic languages: 80 +/-84 Speak English "very well" 79 +/-84 Speak English less than "very well" 1 +/-3
Other Indo-European languages: 140 +/-131 Speak English "very well" 35 +/-37 Speak English less than "very well" 105 +/-107
Chinese: 266 +/-134 Speak English "very well" 117 +/-83 Speak English less than "very well" 149 +/-104
Japanese: 41 +/-42 Speak English "very well" 41 +/-42 Speak English less than "very well" 0 +/-20
Korean: 206 +/-165 Speak English "very well" 94 +/-88 Speak English less than "very well" 112 +/-88
Mon-Khmer, Cambodian: 13 +/-22 Speak English "very well" 13 +/-22 Speak English less than "very well" 0 +/-20
Hmong: 30 +/-39 Speak English "very well" 30 +/-39 Speak English less than "very well" 0 +/-20
Thai: 12 +/-18 Speak English "very well" 12 +/-18 Speak English less than "very well" 0 +/-20
Laotian: 40 +/-42 Speak English "very well" 24 +/-27 Speak English less than "very well" 16 +/-19
Vietnamese: 167 +/-141 Speak English "very well" 94 +/-95 Speak English less than "very well" 73 +/-85
Other Asian languages: 94 +/-76 Speak English "very well" 32 +/-36
2 of 4 12/16/2016

Kenosha County, Wisconsin
Estimate Margin of Error Speak English less than "very well" 62 +/-68
Tagalog: 372 +/-205 Speak English "very well" 231 +/-166 Speak English less than "very well" 141 +/-85
Other Pacific Island languages: 3 +/-6 Speak English "very well" 3 +/-6 Speak English less than "very well" 0 +/-20
Navajo: 0 +/-20 Speak English "very well" 0 +/-20 Speak English less than "very well" 0 +/-20
Other Native North American languages: 6 +/-9 Speak English "very well" 6 +/-9 Speak English less than "very well" 0 +/-20
Hungarian: 8 +/-12 Speak English "very well" 4 +/-7 Speak English less than "very well" 4 +/-5
Arabic: 58 +/-49 Speak English "very well" 30 +/-37 Speak English less than "very well" 28 +/-32
Hebrew: 96 +/-147 Speak English "very well" 0 +/-20 Speak English less than "very well" 96 +/-147
African languages: 98 +/-89 Speak English "very well" 98 +/-89 Speak English less than "very well" 0 +/-20
Other and unspecified languages: 25 +/-29 Speak English "very well" 25 +/-29 Speak English less than "very well" 0 +/-20
Data are based on a sample and are subject to sampling variability. The degree of uncertainty for an estimate arising from sampling variability is represented through the use of a margin of error. The value shown here is the 90 percent margin of error. The margin of error can be interpreted roughly as providing a 90 percent probability that the interval defined by the estimate minus the margin of error and the estimate plus the margin of error (the lower and upper confidence bounds) contains the true value. In addition to sampling variability, the ACS estimates are subject to nonsampling error (for a discussion of nonsampling variability, see Accuracy of the Data). The effect of nonsampling error is not represented in these tables.
Methodological changes to data collection in 2013 may have affected language data for 2013. Users should be aware of these changes when using multi-year data containing data from 2013. For more information, see: Language User Note.
While the 2011-2015 American Community Survey (ACS) data generally reflect the February 2013 Office of Management and Budget (OMB) definitions of metropolitan and micropolitan statistical areas; in certain instances the names, codes, and boundaries of the principal cities shown in ACS tables may differ from the OMB definitions due to differences in the effective dates of the geographic entities.
Estimates of urban and rural population, housing units, and characteristics reflect boundaries of urban areas defined based on Census 2010 data. As a result, data for urban and rural areas from the ACS do not necessarily reflect the results of ongoing urbanization.
Source: U.S. Census Bureau, 2011-2015 American Community Survey 5-Year Estimates
Explanation of Symbols:
1. An '**' entry in the margin of error column indicates that either no sample observations or too few sample observations were available to compute a standard error and thus the margin of error. A statistical test is not appropriate.
2. An '-' entry in the estimate column indicates that either no sample observations or too few sample observations were available to compute an estimate, or a ratio of medians cannot be calculated because one or both of the median estimates falls in the lowest interval or upper interval of an open-ended distribution.
3. An '-' following a median estimate means the median falls in the lowest interval of an open-ended distribution. 4. An '+' following a median estimate means the median falls in the upper interval of an open-ended distribution. 5. An '***' entry in the margin of error column indicates that the median falls in the lowest interval or upper interval of an open-ended distribution. A
statistical test is not appropriate. 6. An '*****' entry in the margin of error column indicates that the estimate is controlled. A statistical test for sampling variability is not appropriate.
3 of 4 12/16/2016

7. An 'N' entry in the estimate and margin of error columns indicates that data for this geographic area cannot be displayed because the number of sample cases is too small.
8. An '(X)' means that the estimate is not applicable or not available.

B16001 LANGUAGE SPOKEN AT HOME BY ABILITY TO SPEAK ENGLISH FOR THE POPULATION 5 YEARS AND OVER Universe: Population 5 years and over 2011-2015 American Community Survey 5-Year Estimates
Supporting documentation on code lists, subject definitions, data accuracy, and statistical testing can be found on the American Community Survey website in the Data and Documentation section.
Sample size and data quality measures (including coverage rates, allocation rates, and response rates) can be found on the American Community Survey website in the Methodology section.
Tell us what you think. Provide feedback to help make American Community Survey data more useful for you.
Although the American Community Survey (ACS) produces population, demographic and housing unit estimates, it is the Census Bureau's Population Estimates Program that produces and disseminates the official estimates of the population for the nation, states, counties, cities and towns and estimates of housing units for states and counties.
Kewaunee County, Wisconsin
Estimate Margin of Error Total: 19,369 +/-62 Speak only English 18,788 +/-115 Spanish or Spanish Creole: 344 +/-67 Speak English "very well" 138 +/-55 Speak English less than "very well" 206 +/-65
French (incl. Patois, Cajun): 16 +/-12 Speak English "very well" 9 +/-9 Speak English less than "very well" 7 +/-7
French Creole: 0 +/-16 Speak English "very well" 0 +/-16 Speak English less than "very well" 0 +/-16
Italian: 4 +/-5 Speak English "very well" 4 +/-5 Speak English less than "very well" 0 +/-16
Portuguese or Portuguese Creole: 5 +/-6 Speak English "very well" 5 +/-6 Speak English less than "very well" 0 +/-16
German: 44 +/-21 Speak English "very well" 38 +/-20 Speak English less than "very well" 6 +/-7
Yiddish: 2 +/-5 Speak English "very well" 2 +/-5 Speak English less than "very well" 0 +/-16
Other West Germanic languages: 43 +/-21 Speak English "very well" 34 +/-20 Speak English less than "very well" 9 +/-7
Scandinavian languages: 0 +/-16 Speak English "very well" 0 +/-16 Speak English less than "very well" 0 +/-16
Greek: 11 +/-11 Speak English "very well" 8 +/-10 Speak English less than "very well" 3 +/-4
1 of 4 12/16/2016

Kewaunee County, Wisconsin
Estimate Margin of Error Russian: 2 +/-3 Speak English "very well" 2 +/-3 Speak English less than "very well" 0 +/-16
Polish: 23 +/-32 Speak English "very well" 0 +/-16 Speak English less than "very well" 23 +/-32
Serbo-Croatian: 2 +/-4 Speak English "very well" 2 +/-4 Speak English less than "very well" 0 +/-16
Other Slavic languages: 19 +/-15 Speak English "very well" 19 +/-15 Speak English less than "very well" 0 +/-16
Armenian: 0 +/-16 Speak English "very well" 0 +/-16 Speak English less than "very well" 0 +/-16
Persian: 0 +/-16 Speak English "very well" 0 +/-16 Speak English less than "very well" 0 +/-16
Gujarati: 48 +/-41 Speak English "very well" 22 +/-19 Speak English less than "very well" 26 +/-23
Hindi: 0 +/-16 Speak English "very well" 0 +/-16 Speak English less than "very well" 0 +/-16
Urdu: 0 +/-16 Speak English "very well" 0 +/-16 Speak English less than "very well" 0 +/-16
Other Indic languages: 0 +/-16 Speak English "very well" 0 +/-16 Speak English less than "very well" 0 +/-16
Other Indo-European languages: 0 +/-16 Speak English "very well" 0 +/-16 Speak English less than "very well" 0 +/-16
Chinese: 2 +/-4 Speak English "very well" 0 +/-16 Speak English less than "very well" 2 +/-4
Japanese: 4 +/-5 Speak English "very well" 4 +/-5 Speak English less than "very well" 0 +/-16
Korean: 2 +/-3 Speak English "very well" 2 +/-3 Speak English less than "very well" 0 +/-16
Mon-Khmer, Cambodian: 0 +/-16 Speak English "very well" 0 +/-16 Speak English less than "very well" 0 +/-16
Hmong: 0 +/-16 Speak English "very well" 0 +/-16 Speak English less than "very well" 0 +/-16
Thai: 0 +/-16 Speak English "very well" 0 +/-16 Speak English less than "very well" 0 +/-16
Laotian: 0 +/-16 Speak English "very well" 0 +/-16 Speak English less than "very well" 0 +/-16
Vietnamese: 0 +/-16 Speak English "very well" 0 +/-16 Speak English less than "very well" 0 +/-16
Other Asian languages: 0 +/-16 Speak English "very well" 0 +/-16
2 of 4 12/16/2016

Kewaunee County, Wisconsin
Estimate Margin of Error Speak English less than "very well" 0 +/-16
Tagalog: 2 +/-4 Speak English "very well" 2 +/-4 Speak English less than "very well" 0 +/-16
Other Pacific Island languages: 4 +/-6 Speak English "very well" 4 +/-6 Speak English less than "very well" 0 +/-16
Navajo: 0 +/-16 Speak English "very well" 0 +/-16 Speak English less than "very well" 0 +/-16
Other Native North American languages: 0 +/-16 Speak English "very well" 0 +/-16 Speak English less than "very well" 0 +/-16
Hungarian: 0 +/-16 Speak English "very well" 0 +/-16 Speak English less than "very well" 0 +/-16
Arabic: 0 +/-16 Speak English "very well" 0 +/-16 Speak English less than "very well" 0 +/-16
Hebrew: 0 +/-16 Speak English "very well" 0 +/-16 Speak English less than "very well" 0 +/-16
African languages: 0 +/-16 Speak English "very well" 0 +/-16 Speak English less than "very well" 0 +/-16
Other and unspecified languages: 4 +/-7 Speak English "very well" 4 +/-7 Speak English less than "very well" 0 +/-16
Data are based on a sample and are subject to sampling variability. The degree of uncertainty for an estimate arising from sampling variability is represented through the use of a margin of error. The value shown here is the 90 percent margin of error. The margin of error can be interpreted roughly as providing a 90 percent probability that the interval defined by the estimate minus the margin of error and the estimate plus the margin of error (the lower and upper confidence bounds) contains the true value. In addition to sampling variability, the ACS estimates are subject to nonsampling error (for a discussion of nonsampling variability, see Accuracy of the Data). The effect of nonsampling error is not represented in these tables.
Methodological changes to data collection in 2013 may have affected language data for 2013. Users should be aware of these changes when using multi-year data containing data from 2013. For more information, see: Language User Note.
While the 2011-2015 American Community Survey (ACS) data generally reflect the February 2013 Office of Management and Budget (OMB) definitions of metropolitan and micropolitan statistical areas; in certain instances the names, codes, and boundaries of the principal cities shown in ACS tables may differ from the OMB definitions due to differences in the effective dates of the geographic entities.
Estimates of urban and rural population, housing units, and characteristics reflect boundaries of urban areas defined based on Census 2010 data. As a result, data for urban and rural areas from the ACS do not necessarily reflect the results of ongoing urbanization.
Source: U.S. Census Bureau, 2011-2015 American Community Survey 5-Year Estimates
Explanation of Symbols:
1. An '**' entry in the margin of error column indicates that either no sample observations or too few sample observations were available to compute a standard error and thus the margin of error. A statistical test is not appropriate.
2. An '-' entry in the estimate column indicates that either no sample observations or too few sample observations were available to compute an estimate, or a ratio of medians cannot be calculated because one or both of the median estimates falls in the lowest interval or upper interval of an open-ended distribution.
3. An '-' following a median estimate means the median falls in the lowest interval of an open-ended distribution. 4. An '+' following a median estimate means the median falls in the upper interval of an open-ended distribution. 5. An '***' entry in the margin of error column indicates that the median falls in the lowest interval or upper interval of an open-ended distribution. A
statistical test is not appropriate. 6. An '*****' entry in the margin of error column indicates that the estimate is controlled. A statistical test for sampling variability is not appropriate.
3 of 4 12/16/2016

7. An 'N' entry in the estimate and margin of error columns indicates that data for this geographic area cannot be displayed because the number of sample cases is too small.
8. An '(X)' means that the estimate is not applicable or not available.

B16001 LANGUAGE SPOKEN AT HOME BY ABILITY TO SPEAK ENGLISH FOR THE POPULATION 5 YEARS AND OVER Universe: Population 5 years and over 2011-2015 American Community Survey 5-Year Estimates
Supporting documentation on code lists, subject definitions, data accuracy, and statistical testing can be found on the American Community Survey website in the Data and Documentation section.
Sample size and data quality measures (including coverage rates, allocation rates, and response rates) can be found on the American Community Survey website in the Methodology section.
Tell us what you think. Provide feedback to help make American Community Survey data more useful for you.
Although the American Community Survey (ACS) produces population, demographic and housing unit estimates, it is the Census Bureau's Population Estimates Program that produces and disseminates the official estimates of the population for the nation, states, counties, cities and towns and estimates of housing units for states and counties.
La Crosse County, Wisconsin
Estimate Margin of Error Total: 110,490 +/-74 Speak only English 102,695 +/-530 Spanish or Spanish Creole: 2,283 +/-381 Speak English "very well" 1,100 +/-227 Speak English less than "very well" 1,183 +/-303
French (incl. Patois, Cajun): 310 +/-142 Speak English "very well" 243 +/-126 Speak English less than "very well" 67 +/-54
French Creole: 11 +/-15 Speak English "very well" 11 +/-15 Speak English less than "very well" 0 +/-20
Italian: 49 +/-38 Speak English "very well" 49 +/-38 Speak English less than "very well" 0 +/-20
Portuguese or Portuguese Creole: 0 +/-20 Speak English "very well" 0 +/-20 Speak English less than "very well" 0 +/-20
German: 681 +/-187 Speak English "very well" 486 +/-158 Speak English less than "very well" 195 +/-93
Yiddish: 10 +/-16 Speak English "very well" 10 +/-16 Speak English less than "very well" 0 +/-20
Other West Germanic languages: 7 +/-10 Speak English "very well" 7 +/-10 Speak English less than "very well" 0 +/-20
Scandinavian languages: 54 +/-36 Speak English "very well" 42 +/-29 Speak English less than "very well" 12 +/-21
Greek: 11 +/-17 Speak English "very well" 11 +/-17 Speak English less than "very well" 0 +/-20
1 of 4 12/16/2016

La Crosse County, Wisconsin
Estimate Margin of Error Russian: 122 +/-102 Speak English "very well" 122 +/-102 Speak English less than "very well" 0 +/-20
Polish: 9 +/-14 Speak English "very well" 9 +/-14 Speak English less than "very well" 0 +/-20
Serbo-Croatian: 2 +/-4 Speak English "very well" 2 +/-4 Speak English less than "very well" 0 +/-20
Other Slavic languages: 13 +/-14 Speak English "very well" 13 +/-14 Speak English less than "very well" 0 +/-20
Armenian: 5 +/-11 Speak English "very well" 5 +/-11 Speak English less than "very well" 0 +/-20
Persian: 0 +/-20 Speak English "very well" 0 +/-20 Speak English less than "very well" 0 +/-20
Gujarati: 0 +/-20 Speak English "very well" 0 +/-20 Speak English less than "very well" 0 +/-20
Hindi: 0 +/-20 Speak English "very well" 0 +/-20 Speak English less than "very well" 0 +/-20
Urdu: 47 +/-59 Speak English "very well" 41 +/-58 Speak English less than "very well" 6 +/-12
Other Indic languages: 37 +/-40 Speak English "very well" 37 +/-40 Speak English less than "very well" 0 +/-20
Other Indo-European languages: 5 +/-8 Speak English "very well" 5 +/-8 Speak English less than "very well" 0 +/-20
Chinese: 243 +/-128 Speak English "very well" 117 +/-77 Speak English less than "very well" 126 +/-96
Japanese: 26 +/-37 Speak English "very well" 26 +/-37 Speak English less than "very well" 0 +/-20
Korean: 83 +/-94 Speak English "very well" 23 +/-23 Speak English less than "very well" 60 +/-86
Mon-Khmer, Cambodian: 0 +/-20 Speak English "very well" 0 +/-20 Speak English less than "very well" 0 +/-20
Hmong: 3,327 +/-381 Speak English "very well" 1,832 +/-346 Speak English less than "very well" 1,495 +/-363
Thai: 11 +/-14 Speak English "very well" 9 +/-14 Speak English less than "very well" 2 +/-5
Laotian: 8 +/-13 Speak English "very well" 8 +/-13 Speak English less than "very well" 0 +/-20
Vietnamese: 63 +/-56 Speak English "very well" 40 +/-36 Speak English less than "very well" 23 +/-29
Other Asian languages: 112 +/-107 Speak English "very well" 112 +/-107
2 of 4 12/16/2016

La Crosse County, Wisconsin
Estimate Margin of Error Speak English less than "very well" 0 +/-20
Tagalog: 18 +/-21 Speak English "very well" 18 +/-21 Speak English less than "very well" 0 +/-20
Other Pacific Island languages: 28 +/-31 Speak English "very well" 28 +/-31 Speak English less than "very well" 0 +/-20
Navajo: 0 +/-20 Speak English "very well" 0 +/-20 Speak English less than "very well" 0 +/-20
Other Native North American languages: 92 +/-100 Speak English "very well" 87 +/-99 Speak English less than "very well" 5 +/-9
Hungarian: 0 +/-20 Speak English "very well" 0 +/-20 Speak English less than "very well" 0 +/-20
Arabic: 92 +/-76 Speak English "very well" 59 +/-58 Speak English less than "very well" 33 +/-41
Hebrew: 0 +/-20 Speak English "very well" 0 +/-20 Speak English less than "very well" 0 +/-20
African languages: 36 +/-37 Speak English "very well" 36 +/-37 Speak English less than "very well" 0 +/-20
Other and unspecified languages: 0 +/-20 Speak English "very well" 0 +/-20 Speak English less than "very well" 0 +/-20
Data are based on a sample and are subject to sampling variability. The degree of uncertainty for an estimate arising from sampling variability is represented through the use of a margin of error. The value shown here is the 90 percent margin of error. The margin of error can be interpreted roughly as providing a 90 percent probability that the interval defined by the estimate minus the margin of error and the estimate plus the margin of error (the lower and upper confidence bounds) contains the true value. In addition to sampling variability, the ACS estimates are subject to nonsampling error (for a discussion of nonsampling variability, see Accuracy of the Data). The effect of nonsampling error is not represented in these tables.
Methodological changes to data collection in 2013 may have affected language data for 2013. Users should be aware of these changes when using multi-year data containing data from 2013. For more information, see: Language User Note.
While the 2011-2015 American Community Survey (ACS) data generally reflect the February 2013 Office of Management and Budget (OMB) definitions of metropolitan and micropolitan statistical areas; in certain instances the names, codes, and boundaries of the principal cities shown in ACS tables may differ from the OMB definitions due to differences in the effective dates of the geographic entities.
Estimates of urban and rural population, housing units, and characteristics reflect boundaries of urban areas defined based on Census 2010 data. As a result, data for urban and rural areas from the ACS do not necessarily reflect the results of ongoing urbanization.
Source: U.S. Census Bureau, 2011-2015 American Community Survey 5-Year Estimates
Explanation of Symbols:
1. An '**' entry in the margin of error column indicates that either no sample observations or too few sample observations were available to compute a standard error and thus the margin of error. A statistical test is not appropriate.
2. An '-' entry in the estimate column indicates that either no sample observations or too few sample observations were available to compute an estimate, or a ratio of medians cannot be calculated because one or both of the median estimates falls in the lowest interval or upper interval of an open-ended distribution.
3. An '-' following a median estimate means the median falls in the lowest interval of an open-ended distribution. 4. An '+' following a median estimate means the median falls in the upper interval of an open-ended distribution. 5. An '***' entry in the margin of error column indicates that the median falls in the lowest interval or upper interval of an open-ended distribution. A
statistical test is not appropriate. 6. An '*****' entry in the margin of error column indicates that the estimate is controlled. A statistical test for sampling variability is not appropriate.
3 of 4 12/16/2016

7. An 'N' entry in the estimate and margin of error columns indicates that data for this geographic area cannot be displayed because the number of sample cases is too small.
8. An '(X)' means that the estimate is not applicable or not available.

B16001 LANGUAGE SPOKEN AT HOME BY ABILITY TO SPEAK ENGLISH FOR THE POPULATION 5 YEARS AND OVER Universe: Population 5 years and over 2011-2015 American Community Survey 5-Year Estimates
Supporting documentation on code lists, subject definitions, data accuracy, and statistical testing can be found on the American Community Survey website in the Data and Documentation section.
Sample size and data quality measures (including coverage rates, allocation rates, and response rates) can be found on the American Community Survey website in the Methodology section.
Tell us what you think. Provide feedback to help make American Community Survey data more useful for you.
Although the American Community Survey (ACS) produces population, demographic and housing unit estimates, it is the Census Bureau's Population Estimates Program that produces and disseminates the official estimates of the population for the nation, states, counties, cities and towns and estimates of housing units for states and counties.
Lafayette County, Wisconsin
Estimate Margin of Error Total: 15,770 +/-40 Speak only English 14,479 +/-234 Spanish or Spanish Creole: 533 +/-69 Speak English "very well" 220 +/-65 Speak English less than "very well" 313 +/-77
French (incl. Patois, Cajun): 14 +/-13 Speak English "very well" 12 +/-13 Speak English less than "very well" 2 +/-3
French Creole: 0 +/-14 Speak English "very well" 0 +/-14 Speak English less than "very well" 0 +/-14
Italian: 0 +/-14 Speak English "very well" 0 +/-14 Speak English less than "very well" 0 +/-14
Portuguese or Portuguese Creole: 5 +/-4 Speak English "very well" 3 +/-4 Speak English less than "very well" 2 +/-2
German: 155 +/-123 Speak English "very well" 125 +/-87 Speak English less than "very well" 30 +/-37
Yiddish: 0 +/-14 Speak English "very well" 0 +/-14 Speak English less than "very well" 0 +/-14
Other West Germanic languages: 511 +/-172 Speak English "very well" 408 +/-165 Speak English less than "very well" 103 +/-49
Scandinavian languages: 21 +/-10 Speak English "very well" 16 +/-11 Speak English less than "very well" 5 +/-5
Greek: 2 +/-3 Speak English "very well" 2 +/-3 Speak English less than "very well" 0 +/-14
1 of 4 12/16/2016

Lafayette County, Wisconsin
Estimate Margin of Error Russian: 10 +/-11 Speak English "very well" 3 +/-5 Speak English less than "very well" 7 +/-8
Polish: 7 +/-7 Speak English "very well" 5 +/-5 Speak English less than "very well" 2 +/-4
Serbo-Croatian: 0 +/-14 Speak English "very well" 0 +/-14 Speak English less than "very well" 0 +/-14
Other Slavic languages: 0 +/-14 Speak English "very well" 0 +/-14 Speak English less than "very well" 0 +/-14
Armenian: 0 +/-14 Speak English "very well" 0 +/-14 Speak English less than "very well" 0 +/-14
Persian: 0 +/-14 Speak English "very well" 0 +/-14 Speak English less than "very well" 0 +/-14
Gujarati: 0 +/-14 Speak English "very well" 0 +/-14 Speak English less than "very well" 0 +/-14
Hindi: 0 +/-14 Speak English "very well" 0 +/-14 Speak English less than "very well" 0 +/-14
Urdu: 0 +/-14 Speak English "very well" 0 +/-14 Speak English less than "very well" 0 +/-14
Other Indic languages: 10 +/-10 Speak English "very well" 4 +/-5 Speak English less than "very well" 6 +/-9
Other Indo-European languages: 2 +/-4 Speak English "very well" 2 +/-4 Speak English less than "very well" 0 +/-14
Chinese: 4 +/-5 Speak English "very well" 0 +/-14 Speak English less than "very well" 4 +/-5
Japanese: 0 +/-14 Speak English "very well" 0 +/-14 Speak English less than "very well" 0 +/-14
Korean: 0 +/-14 Speak English "very well" 0 +/-14 Speak English less than "very well" 0 +/-14
Mon-Khmer, Cambodian: 0 +/-14 Speak English "very well" 0 +/-14 Speak English less than "very well" 0 +/-14
Hmong: 0 +/-14 Speak English "very well" 0 +/-14 Speak English less than "very well" 0 +/-14
Thai: 0 +/-14 Speak English "very well" 0 +/-14 Speak English less than "very well" 0 +/-14
Laotian: 0 +/-14 Speak English "very well" 0 +/-14 Speak English less than "very well" 0 +/-14
Vietnamese: 0 +/-14 Speak English "very well" 0 +/-14 Speak English less than "very well" 0 +/-14
Other Asian languages: 0 +/-14 Speak English "very well" 0 +/-14
2 of 4 12/16/2016

Lafayette County, Wisconsin
Estimate Margin of Error Speak English less than "very well" 0 +/-14
Tagalog: 0 +/-14 Speak English "very well" 0 +/-14 Speak English less than "very well" 0 +/-14
Other Pacific Island languages: 0 +/-14 Speak English "very well" 0 +/-14 Speak English less than "very well" 0 +/-14
Navajo: 0 +/-14 Speak English "very well" 0 +/-14 Speak English less than "very well" 0 +/-14
Other Native North American languages: 0 +/-14 Speak English "very well" 0 +/-14 Speak English less than "very well" 0 +/-14
Hungarian: 12 +/-14 Speak English "very well" 12 +/-14 Speak English less than "very well" 0 +/-14
Arabic: 0 +/-14 Speak English "very well" 0 +/-14 Speak English less than "very well" 0 +/-14
Hebrew: 0 +/-14 Speak English "very well" 0 +/-14 Speak English less than "very well" 0 +/-14
African languages: 5 +/-8 Speak English "very well" 5 +/-8 Speak English less than "very well" 0 +/-14
Other and unspecified languages: 0 +/-14 Speak English "very well" 0 +/-14 Speak English less than "very well" 0 +/-14
Data are based on a sample and are subject to sampling variability. The degree of uncertainty for an estimate arising from sampling variability is represented through the use of a margin of error. The value shown here is the 90 percent margin of error. The margin of error can be interpreted roughly as providing a 90 percent probability that the interval defined by the estimate minus the margin of error and the estimate plus the margin of error (the lower and upper confidence bounds) contains the true value. In addition to sampling variability, the ACS estimates are subject to nonsampling error (for a discussion of nonsampling variability, see Accuracy of the Data). The effect of nonsampling error is not represented in these tables.
Methodological changes to data collection in 2013 may have affected language data for 2013. Users should be aware of these changes when using multi-year data containing data from 2013. For more information, see: Language User Note.
While the 2011-2015 American Community Survey (ACS) data generally reflect the February 2013 Office of Management and Budget (OMB) definitions of metropolitan and micropolitan statistical areas; in certain instances the names, codes, and boundaries of the principal cities shown in ACS tables may differ from the OMB definitions due to differences in the effective dates of the geographic entities.
Estimates of urban and rural population, housing units, and characteristics reflect boundaries of urban areas defined based on Census 2010 data. As a result, data for urban and rural areas from the ACS do not necessarily reflect the results of ongoing urbanization.
Source: U.S. Census Bureau, 2011-2015 American Community Survey 5-Year Estimates
Explanation of Symbols:
1. An '**' entry in the margin of error column indicates that either no sample observations or too few sample observations were available to compute a standard error and thus the margin of error. A statistical test is not appropriate.
2. An '-' entry in the estimate column indicates that either no sample observations or too few sample observations were available to compute an estimate, or a ratio of medians cannot be calculated because one or both of the median estimates falls in the lowest interval or upper interval of an open-ended distribution.
3. An '-' following a median estimate means the median falls in the lowest interval of an open-ended distribution. 4. An '+' following a median estimate means the median falls in the upper interval of an open-ended distribution. 5. An '***' entry in the margin of error column indicates that the median falls in the lowest interval or upper interval of an open-ended distribution. A
statistical test is not appropriate. 6. An '*****' entry in the margin of error column indicates that the estimate is controlled. A statistical test for sampling variability is not appropriate.
3 of 4 12/16/2016

7. An 'N' entry in the estimate and margin of error columns indicates that data for this geographic area cannot be displayed because the number of sample cases is too small.
8. An '(X)' means that the estimate is not applicable or not available.

B16001 LANGUAGE SPOKEN AT HOME BY ABILITY TO SPEAK ENGLISH FOR THE POPULATION 5 YEARS AND OVER Universe: Population 5 years and over 2011-2015 American Community Survey 5-Year Estimates
Supporting documentation on code lists, subject definitions, data accuracy, and statistical testing can be found on the American Community Survey website in the Data and Documentation section.
Sample size and data quality measures (including coverage rates, allocation rates, and response rates) can be found on the American Community Survey website in the Methodology section.
Tell us what you think. Provide feedback to help make American Community Survey data more useful for you.
Although the American Community Survey (ACS) produces population, demographic and housing unit estimates, it is the Census Bureau's Population Estimates Program that produces and disseminates the official estimates of the population for the nation, states, counties, cities and towns and estimates of housing units for states and counties.
Langlade County, Wisconsin
Estimate Margin of Error Total: 18,572 +/-44 Speak only English 17,886 +/-147 Spanish or Spanish Creole: 303 +/-87 Speak English "very well" 236 +/-70 Speak English less than "very well" 67 +/-40
French (incl. Patois, Cajun): 8 +/-7 Speak English "very well" 6 +/-6 Speak English less than "very well" 2 +/-4
French Creole: 0 +/-14 Speak English "very well" 0 +/-14 Speak English less than "very well" 0 +/-14
Italian: 8 +/-13 Speak English "very well" 0 +/-14 Speak English less than "very well" 8 +/-13
Portuguese or Portuguese Creole: 0 +/-14 Speak English "very well" 0 +/-14 Speak English less than "very well" 0 +/-14
German: 109 +/-43 Speak English "very well" 80 +/-40 Speak English less than "very well" 29 +/-16
Yiddish: 0 +/-14 Speak English "very well" 0 +/-14 Speak English less than "very well" 0 +/-14
Other West Germanic languages: 21 +/-12 Speak English "very well" 21 +/-12 Speak English less than "very well" 0 +/-14
Scandinavian languages: 3 +/-4 Speak English "very well" 3 +/-4 Speak English less than "very well" 0 +/-14
Greek: 0 +/-14 Speak English "very well" 0 +/-14 Speak English less than "very well" 0 +/-14
1 of 4 12/16/2016

Langlade County, Wisconsin
Estimate Margin of Error Russian: 8 +/-10 Speak English "very well" 0 +/-14 Speak English less than "very well" 8 +/-10
Polish: 32 +/-37 Speak English "very well" 2 +/-6 Speak English less than "very well" 30 +/-36
Serbo-Croatian: 0 +/-14 Speak English "very well" 0 +/-14 Speak English less than "very well" 0 +/-14
Other Slavic languages: 8 +/-6 Speak English "very well" 6 +/-6 Speak English less than "very well" 2 +/-3
Armenian: 0 +/-14 Speak English "very well" 0 +/-14 Speak English less than "very well" 0 +/-14
Persian: 0 +/-14 Speak English "very well" 0 +/-14 Speak English less than "very well" 0 +/-14
Gujarati: 0 +/-14 Speak English "very well" 0 +/-14 Speak English less than "very well" 0 +/-14
Hindi: 11 +/-15 Speak English "very well" 5 +/-7 Speak English less than "very well" 6 +/-8
Urdu: 0 +/-14 Speak English "very well" 0 +/-14 Speak English less than "very well" 0 +/-14
Other Indic languages: 0 +/-14 Speak English "very well" 0 +/-14 Speak English less than "very well" 0 +/-14
Other Indo-European languages: 0 +/-14 Speak English "very well" 0 +/-14 Speak English less than "very well" 0 +/-14
Chinese: 0 +/-14 Speak English "very well" 0 +/-14 Speak English less than "very well" 0 +/-14
Japanese: 22 +/-34 Speak English "very well" 22 +/-34 Speak English less than "very well" 0 +/-14
Korean: 13 +/-20 Speak English "very well" 13 +/-20 Speak English less than "very well" 0 +/-14
Mon-Khmer, Cambodian: 0 +/-14 Speak English "very well" 0 +/-14 Speak English less than "very well" 0 +/-14
Hmong: 16 +/-17 Speak English "very well" 3 +/-5 Speak English less than "very well" 13 +/-16
Thai: 0 +/-14 Speak English "very well" 0 +/-14 Speak English less than "very well" 0 +/-14
Laotian: 0 +/-14 Speak English "very well" 0 +/-14 Speak English less than "very well" 0 +/-14
Vietnamese: 0 +/-14 Speak English "very well" 0 +/-14 Speak English less than "very well" 0 +/-14
Other Asian languages: 22 +/-23 Speak English "very well" 22 +/-23
2 of 4 12/16/2016

Langlade County, Wisconsin
Estimate Margin of Error Speak English less than "very well" 0 +/-14
Tagalog: 4 +/-5 Speak English "very well" 4 +/-5 Speak English less than "very well" 0 +/-14
Other Pacific Island languages: 0 +/-14 Speak English "very well" 0 +/-14 Speak English less than "very well" 0 +/-14
Navajo: 0 +/-14 Speak English "very well" 0 +/-14 Speak English less than "very well" 0 +/-14
Other Native North American languages: 6 +/-9 Speak English "very well" 6 +/-9 Speak English less than "very well" 0 +/-14
Hungarian: 17 +/-26 Speak English "very well" 17 +/-26 Speak English less than "very well" 0 +/-14
Arabic: 0 +/-14 Speak English "very well" 0 +/-14 Speak English less than "very well" 0 +/-14
Hebrew: 0 +/-14 Speak English "very well" 0 +/-14 Speak English less than "very well" 0 +/-14
African languages: 67 +/-59 Speak English "very well" 49 +/-39 Speak English less than "very well" 18 +/-24
Other and unspecified languages: 8 +/-13 Speak English "very well" 8 +/-13 Speak English less than "very well" 0 +/-14
Data are based on a sample and are subject to sampling variability. The degree of uncertainty for an estimate arising from sampling variability is represented through the use of a margin of error. The value shown here is the 90 percent margin of error. The margin of error can be interpreted roughly as providing a 90 percent probability that the interval defined by the estimate minus the margin of error and the estimate plus the margin of error (the lower and upper confidence bounds) contains the true value. In addition to sampling variability, the ACS estimates are subject to nonsampling error (for a discussion of nonsampling variability, see Accuracy of the Data). The effect of nonsampling error is not represented in these tables.
Methodological changes to data collection in 2013 may have affected language data for 2013. Users should be aware of these changes when using multi-year data containing data from 2013. For more information, see: Language User Note.
While the 2011-2015 American Community Survey (ACS) data generally reflect the February 2013 Office of Management and Budget (OMB) definitions of metropolitan and micropolitan statistical areas; in certain instances the names, codes, and boundaries of the principal cities shown in ACS tables may differ from the OMB definitions due to differences in the effective dates of the geographic entities.
Estimates of urban and rural population, housing units, and characteristics reflect boundaries of urban areas defined based on Census 2010 data. As a result, data for urban and rural areas from the ACS do not necessarily reflect the results of ongoing urbanization.
Source: U.S. Census Bureau, 2011-2015 American Community Survey 5-Year Estimates
Explanation of Symbols:
1. An '**' entry in the margin of error column indicates that either no sample observations or too few sample observations were available to compute a standard error and thus the margin of error. A statistical test is not appropriate.
2. An '-' entry in the estimate column indicates that either no sample observations or too few sample observations were available to compute an estimate, or a ratio of medians cannot be calculated because one or both of the median estimates falls in the lowest interval or upper interval of an open-ended distribution.
3. An '-' following a median estimate means the median falls in the lowest interval of an open-ended distribution. 4. An '+' following a median estimate means the median falls in the upper interval of an open-ended distribution. 5. An '***' entry in the margin of error column indicates that the median falls in the lowest interval or upper interval of an open-ended distribution. A
statistical test is not appropriate. 6. An '*****' entry in the margin of error column indicates that the estimate is controlled. A statistical test for sampling variability is not appropriate.
3 of 4 12/16/2016

7. An 'N' entry in the estimate and margin of error columns indicates that data for this geographic area cannot be displayed because the number of sample cases is too small.
8. An '(X)' means that the estimate is not applicable or not available.

B16001 LANGUAGE SPOKEN AT HOME BY ABILITY TO SPEAK ENGLISH FOR THE POPULATION 5 YEARS AND OVER Universe: Population 5 years and over 2011-2015 American Community Survey 5-Year Estimates
Supporting documentation on code lists, subject definitions, data accuracy, and statistical testing can be found on the American Community Survey website in the Data and Documentation section.
Sample size and data quality measures (including coverage rates, allocation rates, and response rates) can be found on the American Community Survey website in the Methodology section.
Tell us what you think. Provide feedback to help make American Community Survey data more useful for you.
Although the American Community Survey (ACS) produces population, demographic and housing unit estimates, it is the Census Bureau's Population Estimates Program that produces and disseminates the official estimates of the population for the nation, states, counties, cities and towns and estimates of housing units for states and counties.
Lincoln County, Wisconsin
Estimate Margin of Error Total: 26,985 +/-38 Speak only English 26,504 +/-91 Spanish or Spanish Creole: 194 +/-60 Speak English "very well" 137 +/-48 Speak English less than "very well" 57 +/-30
French (incl. Patois, Cajun): 9 +/-12 Speak English "very well" 9 +/-12 Speak English less than "very well" 0 +/-16
French Creole: 0 +/-16 Speak English "very well" 0 +/-16 Speak English less than "very well" 0 +/-16
Italian: 6 +/-10 Speak English "very well" 6 +/-10 Speak English less than "very well" 0 +/-16
Portuguese or Portuguese Creole: 0 +/-16 Speak English "very well" 0 +/-16 Speak English less than "very well" 0 +/-16
German: 164 +/-53 Speak English "very well" 146 +/-54 Speak English less than "very well" 18 +/-14
Yiddish: 0 +/-16 Speak English "very well" 0 +/-16 Speak English less than "very well" 0 +/-16
Other West Germanic languages: 15 +/-10 Speak English "very well" 15 +/-10 Speak English less than "very well" 0 +/-16
Scandinavian languages: 14 +/-12 Speak English "very well" 14 +/-12 Speak English less than "very well" 0 +/-16
Greek: 0 +/-16 Speak English "very well" 0 +/-16 Speak English less than "very well" 0 +/-16
1 of 4 12/16/2016

Lincoln County, Wisconsin
Estimate Margin of Error Russian: 0 +/-16 Speak English "very well" 0 +/-16 Speak English less than "very well" 0 +/-16
Polish: 8 +/-7 Speak English "very well" 8 +/-7 Speak English less than "very well" 0 +/-16
Serbo-Croatian: 0 +/-16 Speak English "very well" 0 +/-16 Speak English less than "very well" 0 +/-16
Other Slavic languages: 0 +/-16 Speak English "very well" 0 +/-16 Speak English less than "very well" 0 +/-16
Armenian: 0 +/-16 Speak English "very well" 0 +/-16 Speak English less than "very well" 0 +/-16
Persian: 0 +/-16 Speak English "very well" 0 +/-16 Speak English less than "very well" 0 +/-16
Gujarati: 7 +/-10 Speak English "very well" 7 +/-10 Speak English less than "very well" 0 +/-16
Hindi: 0 +/-16 Speak English "very well" 0 +/-16 Speak English less than "very well" 0 +/-16
Urdu: 0 +/-16 Speak English "very well" 0 +/-16 Speak English less than "very well" 0 +/-16
Other Indic languages: 0 +/-16 Speak English "very well" 0 +/-16 Speak English less than "very well" 0 +/-16
Other Indo-European languages: 0 +/-16 Speak English "very well" 0 +/-16 Speak English less than "very well" 0 +/-16
Chinese: 5 +/-6 Speak English "very well" 2 +/-3 Speak English less than "very well" 3 +/-4
Japanese: 2 +/-3 Speak English "very well" 2 +/-3 Speak English less than "very well" 0 +/-16
Korean: 0 +/-16 Speak English "very well" 0 +/-16 Speak English less than "very well" 0 +/-16
Mon-Khmer, Cambodian: 0 +/-16 Speak English "very well" 0 +/-16 Speak English less than "very well" 0 +/-16
Hmong: 19 +/-21 Speak English "very well" 10 +/-8 Speak English less than "very well" 9 +/-14
Thai: 0 +/-16 Speak English "very well" 0 +/-16 Speak English less than "very well" 0 +/-16
Laotian: 0 +/-16 Speak English "very well" 0 +/-16 Speak English less than "very well" 0 +/-16
Vietnamese: 0 +/-16 Speak English "very well" 0 +/-16 Speak English less than "very well" 0 +/-16
Other Asian languages: 16 +/-23 Speak English "very well" 16 +/-23
2 of 4 12/16/2016

Lincoln County, Wisconsin
Estimate Margin of Error Speak English less than "very well" 0 +/-16
Tagalog: 14 +/-11 Speak English "very well" 9 +/-10 Speak English less than "very well" 5 +/-6
Other Pacific Island languages: 0 +/-16 Speak English "very well" 0 +/-16 Speak English less than "very well" 0 +/-16
Navajo: 0 +/-16 Speak English "very well" 0 +/-16 Speak English less than "very well" 0 +/-16
Other Native North American languages: 0 +/-16 Speak English "very well" 0 +/-16 Speak English less than "very well" 0 +/-16
Hungarian: 3 +/-5 Speak English "very well" 3 +/-5 Speak English less than "very well" 0 +/-16
Arabic: 0 +/-16 Speak English "very well" 0 +/-16 Speak English less than "very well" 0 +/-16
Hebrew: 0 +/-16 Speak English "very well" 0 +/-16 Speak English less than "very well" 0 +/-16
African languages: 0 +/-16 Speak English "very well" 0 +/-16 Speak English less than "very well" 0 +/-16
Other and unspecified languages: 5 +/-6 Speak English "very well" 0 +/-16 Speak English less than "very well" 5 +/-6
Data are based on a sample and are subject to sampling variability. The degree of uncertainty for an estimate arising from sampling variability is represented through the use of a margin of error. The value shown here is the 90 percent margin of error. The margin of error can be interpreted roughly as providing a 90 percent probability that the interval defined by the estimate minus the margin of error and the estimate plus the margin of error (the lower and upper confidence bounds) contains the true value. In addition to sampling variability, the ACS estimates are subject to nonsampling error (for a discussion of nonsampling variability, see Accuracy of the Data). The effect of nonsampling error is not represented in these tables.
Methodological changes to data collection in 2013 may have affected language data for 2013. Users should be aware of these changes when using multi-year data containing data from 2013. For more information, see: Language User Note.
While the 2011-2015 American Community Survey (ACS) data generally reflect the February 2013 Office of Management and Budget (OMB) definitions of metropolitan and micropolitan statistical areas; in certain instances the names, codes, and boundaries of the principal cities shown in ACS tables may differ from the OMB definitions due to differences in the effective dates of the geographic entities.
Estimates of urban and rural population, housing units, and characteristics reflect boundaries of urban areas defined based on Census 2010 data. As a result, data for urban and rural areas from the ACS do not necessarily reflect the results of ongoing urbanization.
Source: U.S. Census Bureau, 2011-2015 American Community Survey 5-Year Estimates
Explanation of Symbols:
1. An '**' entry in the margin of error column indicates that either no sample observations or too few sample observations were available to compute a standard error and thus the margin of error. A statistical test is not appropriate.
2. An '-' entry in the estimate column indicates that either no sample observations or too few sample observations were available to compute an estimate, or a ratio of medians cannot be calculated because one or both of the median estimates falls in the lowest interval or upper interval of an open-ended distribution.
3. An '-' following a median estimate means the median falls in the lowest interval of an open-ended distribution. 4. An '+' following a median estimate means the median falls in the upper interval of an open-ended distribution. 5. An '***' entry in the margin of error column indicates that the median falls in the lowest interval or upper interval of an open-ended distribution. A
statistical test is not appropriate. 6. An '*****' entry in the margin of error column indicates that the estimate is controlled. A statistical test for sampling variability is not appropriate.
3 of 4 12/16/2016

7. An 'N' entry in the estimate and margin of error columns indicates that data for this geographic area cannot be displayed because the number of sample cases is too small.
8. An '(X)' means that the estimate is not applicable or not available.

B16001 LANGUAGE SPOKEN AT HOME BY ABILITY TO SPEAK ENGLISH FOR THE POPULATION 5 YEARS AND OVER Universe: Population 5 years and over 2011-2015 American Community Survey 5-Year Estimates
Supporting documentation on code lists, subject definitions, data accuracy, and statistical testing can be found on the American Community Survey website in the Data and Documentation section.
Sample size and data quality measures (including coverage rates, allocation rates, and response rates) can be found on the American Community Survey website in the Methodology section.
Tell us what you think. Provide feedback to help make American Community Survey data more useful for you.
Although the American Community Survey (ACS) produces population, demographic and housing unit estimates, it is the Census Bureau's Population Estimates Program that produces and disseminates the official estimates of the population for the nation, states, counties, cities and towns and estimates of housing units for states and counties.
Manitowoc County, Wisconsin
Estimate Margin of Error Total: 76,290 +/-67 Speak only English 72,018 +/-305 Spanish or Spanish Creole: 1,792 +/-229 Speak English "very well" 1,137 +/-184 Speak English less than "very well" 655 +/-178
French (incl. Patois, Cajun): 95 +/-66 Speak English "very well" 70 +/-62 Speak English less than "very well" 25 +/-21
French Creole: 0 +/-20 Speak English "very well" 0 +/-20 Speak English less than "very well" 0 +/-20
Italian: 19 +/-21 Speak English "very well" 9 +/-14 Speak English less than "very well" 10 +/-15
Portuguese or Portuguese Creole: 8 +/-16 Speak English "very well" 8 +/-16 Speak English less than "very well" 0 +/-20
German: 352 +/-104 Speak English "very well" 272 +/-92 Speak English less than "very well" 80 +/-45
Yiddish: 0 +/-20 Speak English "very well" 0 +/-20 Speak English less than "very well" 0 +/-20
Other West Germanic languages: 71 +/-39 Speak English "very well" 59 +/-36 Speak English less than "very well" 12 +/-12
Scandinavian languages: 18 +/-13 Speak English "very well" 15 +/-13 Speak English less than "very well" 3 +/-4
Greek: 0 +/-20 Speak English "very well" 0 +/-20 Speak English less than "very well" 0 +/-20
1 of 4 12/16/2016

Manitowoc County, Wisconsin
Estimate Margin of Error Russian: 0 +/-20 Speak English "very well" 0 +/-20 Speak English less than "very well" 0 +/-20
Polish: 10 +/-11 Speak English "very well" 3 +/-4 Speak English less than "very well" 7 +/-11
Serbo-Croatian: 30 +/-43 Speak English "very well" 22 +/-30 Speak English less than "very well" 8 +/-13
Other Slavic languages: 39 +/-33 Speak English "very well" 24 +/-26 Speak English less than "very well" 15 +/-20
Armenian: 0 +/-20 Speak English "very well" 0 +/-20 Speak English less than "very well" 0 +/-20
Persian: 0 +/-20 Speak English "very well" 0 +/-20 Speak English less than "very well" 0 +/-20
Gujarati: 29 +/-41 Speak English "very well" 16 +/-23 Speak English less than "very well" 13 +/-18
Hindi: 16 +/-18 Speak English "very well" 16 +/-18 Speak English less than "very well" 0 +/-20
Urdu: 0 +/-20 Speak English "very well" 0 +/-20 Speak English less than "very well" 0 +/-20
Other Indic languages: 0 +/-20 Speak English "very well" 0 +/-20 Speak English less than "very well" 0 +/-20
Other Indo-European languages: 61 +/-51 Speak English "very well" 31 +/-33 Speak English less than "very well" 30 +/-37
Chinese: 15 +/-12 Speak English "very well" 4 +/-6 Speak English less than "very well" 11 +/-10
Japanese: 22 +/-20 Speak English "very well" 20 +/-20 Speak English less than "very well" 2 +/-3
Korean: 39 +/-39 Speak English "very well" 16 +/-26 Speak English less than "very well" 23 +/-19
Mon-Khmer, Cambodian: 0 +/-20 Speak English "very well" 0 +/-20 Speak English less than "very well" 0 +/-20
Hmong: 1,456 +/-179 Speak English "very well" 980 +/-154 Speak English less than "very well" 476 +/-129
Thai: 0 +/-20 Speak English "very well" 0 +/-20 Speak English less than "very well" 0 +/-20
Laotian: 17 +/-33 Speak English "very well" 0 +/-20 Speak English less than "very well" 17 +/-33
Vietnamese: 46 +/-52 Speak English "very well" 16 +/-27 Speak English less than "very well" 30 +/-44
Other Asian languages: 45 +/-56 Speak English "very well" 45 +/-56
2 of 4 12/16/2016

Manitowoc County, Wisconsin
Estimate Margin of Error Speak English less than "very well" 0 +/-20
Tagalog: 29 +/-21 Speak English "very well" 13 +/-11 Speak English less than "very well" 16 +/-16
Other Pacific Island languages: 0 +/-20 Speak English "very well" 0 +/-20 Speak English less than "very well" 0 +/-20
Navajo: 0 +/-20 Speak English "very well" 0 +/-20 Speak English less than "very well" 0 +/-20
Other Native North American languages: 6 +/-9 Speak English "very well" 6 +/-9 Speak English less than "very well" 0 +/-20
Hungarian: 6 +/-6 Speak English "very well" 6 +/-6 Speak English less than "very well" 0 +/-20
Arabic: 38 +/-58 Speak English "very well" 38 +/-58 Speak English less than "very well" 0 +/-20
Hebrew: 0 +/-20 Speak English "very well" 0 +/-20 Speak English less than "very well" 0 +/-20
African languages: 13 +/-21 Speak English "very well" 13 +/-21 Speak English less than "very well" 0 +/-20
Other and unspecified languages: 0 +/-20 Speak English "very well" 0 +/-20 Speak English less than "very well" 0 +/-20
Data are based on a sample and are subject to sampling variability. The degree of uncertainty for an estimate arising from sampling variability is represented through the use of a margin of error. The value shown here is the 90 percent margin of error. The margin of error can be interpreted roughly as providing a 90 percent probability that the interval defined by the estimate minus the margin of error and the estimate plus the margin of error (the lower and upper confidence bounds) contains the true value. In addition to sampling variability, the ACS estimates are subject to nonsampling error (for a discussion of nonsampling variability, see Accuracy of the Data). The effect of nonsampling error is not represented in these tables.
Methodological changes to data collection in 2013 may have affected language data for 2013. Users should be aware of these changes when using multi-year data containing data from 2013. For more information, see: Language User Note.
While the 2011-2015 American Community Survey (ACS) data generally reflect the February 2013 Office of Management and Budget (OMB) definitions of metropolitan and micropolitan statistical areas; in certain instances the names, codes, and boundaries of the principal cities shown in ACS tables may differ from the OMB definitions due to differences in the effective dates of the geographic entities.
Estimates of urban and rural population, housing units, and characteristics reflect boundaries of urban areas defined based on Census 2010 data. As a result, data for urban and rural areas from the ACS do not necessarily reflect the results of ongoing urbanization.
Source: U.S. Census Bureau, 2011-2015 American Community Survey 5-Year Estimates
Explanation of Symbols:
1. An '**' entry in the margin of error column indicates that either no sample observations or too few sample observations were available to compute a standard error and thus the margin of error. A statistical test is not appropriate.
2. An '-' entry in the estimate column indicates that either no sample observations or too few sample observations were available to compute an estimate, or a ratio of medians cannot be calculated because one or both of the median estimates falls in the lowest interval or upper interval of an open-ended distribution.
3. An '-' following a median estimate means the median falls in the lowest interval of an open-ended distribution. 4. An '+' following a median estimate means the median falls in the upper interval of an open-ended distribution. 5. An '***' entry in the margin of error column indicates that the median falls in the lowest interval or upper interval of an open-ended distribution. A
statistical test is not appropriate. 6. An '*****' entry in the margin of error column indicates that the estimate is controlled. A statistical test for sampling variability is not appropriate.
3 of 4 12/16/2016

7. An 'N' entry in the estimate and margin of error columns indicates that data for this geographic area cannot be displayed because the number of sample cases is too small.
8. An '(X)' means that the estimate is not applicable or not available.
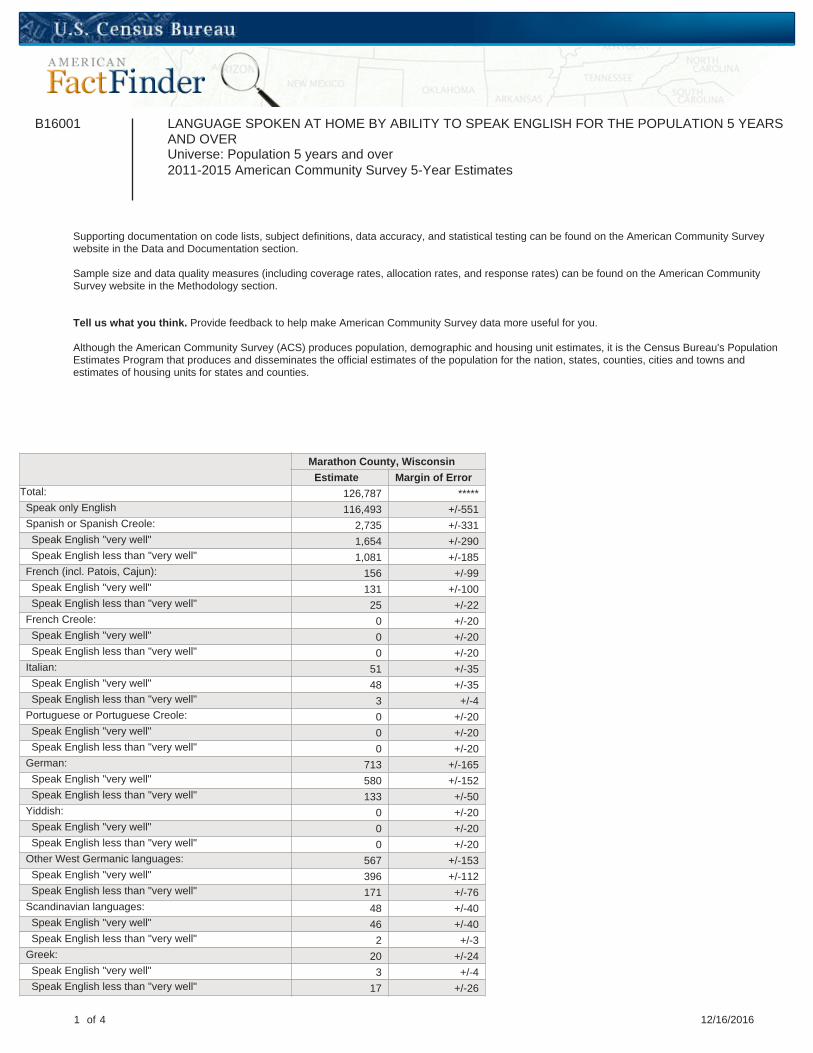
B16001 LANGUAGE SPOKEN AT HOME BY ABILITY TO SPEAK ENGLISH FOR THE POPULATION 5 YEARS AND OVER Universe: Population 5 years and over 2011-2015 American Community Survey 5-Year Estimates
Supporting documentation on code lists, subject definitions, data accuracy, and statistical testing can be found on the American Community Survey website in the Data and Documentation section.
Sample size and data quality measures (including coverage rates, allocation rates, and response rates) can be found on the American Community Survey website in the Methodology section.
Tell us what you think. Provide feedback to help make American Community Survey data more useful for you.
Although the American Community Survey (ACS) produces population, demographic and housing unit estimates, it is the Census Bureau's Population Estimates Program that produces and disseminates the official estimates of the population for the nation, states, counties, cities and towns and estimates of housing units for states and counties.
Marathon County, Wisconsin
Estimate Margin of Error Total: 126,787 ***** Speak only English 116,493 +/-551 Spanish or Spanish Creole: 2,735 +/-331 Speak English "very well" 1,654 +/-290 Speak English less than "very well" 1,081 +/-185
French (incl. Patois, Cajun): 156 +/-99 Speak English "very well" 131 +/-100 Speak English less than "very well" 25 +/-22
French Creole: 0 +/-20 Speak English "very well" 0 +/-20 Speak English less than "very well" 0 +/-20
Italian: 51 +/-35 Speak English "very well" 48 +/-35 Speak English less than "very well" 3 +/-4
Portuguese or Portuguese Creole: 0 +/-20 Speak English "very well" 0 +/-20 Speak English less than "very well" 0 +/-20
German: 713 +/-165 Speak English "very well" 580 +/-152 Speak English less than "very well" 133 +/-50
Yiddish: 0 +/-20 Speak English "very well" 0 +/-20 Speak English less than "very well" 0 +/-20
Other West Germanic languages: 567 +/-153 Speak English "very well" 396 +/-112 Speak English less than "very well" 171 +/-76
Scandinavian languages: 48 +/-40 Speak English "very well" 46 +/-40 Speak English less than "very well" 2 +/-3
Greek: 20 +/-24 Speak English "very well" 3 +/-4 Speak English less than "very well" 17 +/-26
1 of 4 12/16/2016

Marathon County, Wisconsin
Estimate Margin of Error Russian: 0 +/-20 Speak English "very well" 0 +/-20 Speak English less than "very well" 0 +/-20
Polish: 237 +/-62 Speak English "very well" 202 +/-56 Speak English less than "very well" 35 +/-19
Serbo-Croatian: 8 +/-12 Speak English "very well" 8 +/-12 Speak English less than "very well" 0 +/-20
Other Slavic languages: 15 +/-21 Speak English "very well" 15 +/-21 Speak English less than "very well" 0 +/-20
Armenian: 0 +/-20 Speak English "very well" 0 +/-20 Speak English less than "very well" 0 +/-20
Persian: 8 +/-14 Speak English "very well" 8 +/-14 Speak English less than "very well" 0 +/-20
Gujarati: 0 +/-20 Speak English "very well" 0 +/-20 Speak English less than "very well" 0 +/-20
Hindi: 298 +/-121 Speak English "very well" 192 +/-97 Speak English less than "very well" 106 +/-53
Urdu: 6 +/-9 Speak English "very well" 4 +/-8 Speak English less than "very well" 2 +/-5
Other Indic languages: 104 +/-59 Speak English "very well" 29 +/-32 Speak English less than "very well" 75 +/-37
Other Indo-European languages: 17 +/-23 Speak English "very well" 17 +/-23 Speak English less than "very well" 0 +/-20
Chinese: 186 +/-114 Speak English "very well" 77 +/-63 Speak English less than "very well" 109 +/-89
Japanese: 15 +/-16 Speak English "very well" 4 +/-5 Speak English less than "very well" 11 +/-14
Korean: 39 +/-26 Speak English "very well" 11 +/-16 Speak English less than "very well" 28 +/-23
Mon-Khmer, Cambodian: 18 +/-29 Speak English "very well" 0 +/-20 Speak English less than "very well" 18 +/-29
Hmong: 4,614 +/-352 Speak English "very well" 2,783 +/-322 Speak English less than "very well" 1,831 +/-320
Thai: 34 +/-30 Speak English "very well" 10 +/-15 Speak English less than "very well" 24 +/-28
Laotian: 113 +/-102 Speak English "very well" 99 +/-84 Speak English less than "very well" 14 +/-21
Vietnamese: 49 +/-47 Speak English "very well" 27 +/-29 Speak English less than "very well" 22 +/-25
Other Asian languages: 0 +/-20 Speak English "very well" 0 +/-20
2 of 4 12/16/2016

Marathon County, Wisconsin
Estimate Margin of Error Speak English less than "very well" 0 +/-20
Tagalog: 107 +/-107 Speak English "very well" 101 +/-107 Speak English less than "very well" 6 +/-9
Other Pacific Island languages: 19 +/-23 Speak English "very well" 3 +/-4 Speak English less than "very well" 16 +/-23
Navajo: 0 +/-20 Speak English "very well" 0 +/-20 Speak English less than "very well" 0 +/-20
Other Native North American languages: 34 +/-24 Speak English "very well" 29 +/-26 Speak English less than "very well" 5 +/-8
Hungarian: 0 +/-20 Speak English "very well" 0 +/-20 Speak English less than "very well" 0 +/-20
Arabic: 5 +/-12 Speak English "very well" 5 +/-12 Speak English less than "very well" 0 +/-20
Hebrew: 2 +/-2 Speak English "very well" 2 +/-2 Speak English less than "very well" 0 +/-20
African languages: 32 +/-39 Speak English "very well" 29 +/-38 Speak English less than "very well" 3 +/-4
Other and unspecified languages: 44 +/-40 Speak English "very well" 28 +/-31 Speak English less than "very well" 16 +/-26
Data are based on a sample and are subject to sampling variability. The degree of uncertainty for an estimate arising from sampling variability is represented through the use of a margin of error. The value shown here is the 90 percent margin of error. The margin of error can be interpreted roughly as providing a 90 percent probability that the interval defined by the estimate minus the margin of error and the estimate plus the margin of error (the lower and upper confidence bounds) contains the true value. In addition to sampling variability, the ACS estimates are subject to nonsampling error (for a discussion of nonsampling variability, see Accuracy of the Data). The effect of nonsampling error is not represented in these tables.
Methodological changes to data collection in 2013 may have affected language data for 2013. Users should be aware of these changes when using multi-year data containing data from 2013. For more information, see: Language User Note.
While the 2011-2015 American Community Survey (ACS) data generally reflect the February 2013 Office of Management and Budget (OMB) definitions of metropolitan and micropolitan statistical areas; in certain instances the names, codes, and boundaries of the principal cities shown in ACS tables may differ from the OMB definitions due to differences in the effective dates of the geographic entities.
Estimates of urban and rural population, housing units, and characteristics reflect boundaries of urban areas defined based on Census 2010 data. As a result, data for urban and rural areas from the ACS do not necessarily reflect the results of ongoing urbanization.
Source: U.S. Census Bureau, 2011-2015 American Community Survey 5-Year Estimates
Explanation of Symbols:
1. An '**' entry in the margin of error column indicates that either no sample observations or too few sample observations were available to compute a standard error and thus the margin of error. A statistical test is not appropriate.
2. An '-' entry in the estimate column indicates that either no sample observations or too few sample observations were available to compute an estimate, or a ratio of medians cannot be calculated because one or both of the median estimates falls in the lowest interval or upper interval of an open-ended distribution.
3. An '-' following a median estimate means the median falls in the lowest interval of an open-ended distribution. 4. An '+' following a median estimate means the median falls in the upper interval of an open-ended distribution. 5. An '***' entry in the margin of error column indicates that the median falls in the lowest interval or upper interval of an open-ended distribution. A
statistical test is not appropriate. 6. An '*****' entry in the margin of error column indicates that the estimate is controlled. A statistical test for sampling variability is not appropriate.
3 of 4 12/16/2016

7. An 'N' entry in the estimate and margin of error columns indicates that data for this geographic area cannot be displayed because the number of sample cases is too small.
8. An '(X)' means that the estimate is not applicable or not available.

B16001 LANGUAGE SPOKEN AT HOME BY ABILITY TO SPEAK ENGLISH FOR THE POPULATION 5 YEARS AND OVER Universe: Population 5 years and over 2011-2015 American Community Survey 5-Year Estimates
Supporting documentation on code lists, subject definitions, data accuracy, and statistical testing can be found on the American Community Survey website in the Data and Documentation section.
Sample size and data quality measures (including coverage rates, allocation rates, and response rates) can be found on the American Community Survey website in the Methodology section.
Tell us what you think. Provide feedback to help make American Community Survey data more useful for you.
Although the American Community Survey (ACS) produces population, demographic and housing unit estimates, it is the Census Bureau's Population Estimates Program that produces and disseminates the official estimates of the population for the nation, states, counties, cities and towns and estimates of housing units for states and counties.
Marinette County, Wisconsin
Estimate Margin of Error Total: 39,367 +/-51 Speak only English 37,965 +/-235 Spanish or Spanish Creole: 725 +/-170 Speak English "very well" 428 +/-128 Speak English less than "very well" 297 +/-113
French (incl. Patois, Cajun): 154 +/-69 Speak English "very well" 132 +/-66 Speak English less than "very well" 22 +/-20
French Creole: 0 +/-18 Speak English "very well" 0 +/-18 Speak English less than "very well" 0 +/-18
Italian: 25 +/-25 Speak English "very well" 25 +/-25 Speak English less than "very well" 0 +/-18
Portuguese or Portuguese Creole: 14 +/-22 Speak English "very well" 14 +/-22 Speak English less than "very well" 0 +/-18
German: 189 +/-89 Speak English "very well" 176 +/-88 Speak English less than "very well" 13 +/-16
Yiddish: 0 +/-18 Speak English "very well" 0 +/-18 Speak English less than "very well" 0 +/-18
Other West Germanic languages: 29 +/-28 Speak English "very well" 29 +/-28 Speak English less than "very well" 0 +/-18
Scandinavian languages: 17 +/-22 Speak English "very well" 17 +/-22 Speak English less than "very well" 0 +/-18
Greek: 11 +/-8 Speak English "very well" 11 +/-8 Speak English less than "very well" 0 +/-18
1 of 4 12/16/2016

Marinette County, Wisconsin
Estimate Margin of Error Russian: 15 +/-20 Speak English "very well" 3 +/-4 Speak English less than "very well" 12 +/-19
Polish: 95 +/-42 Speak English "very well" 67 +/-33 Speak English less than "very well" 28 +/-23
Serbo-Croatian: 2 +/-4 Speak English "very well" 2 +/-4 Speak English less than "very well" 0 +/-18
Other Slavic languages: 28 +/-19 Speak English "very well" 28 +/-19 Speak English less than "very well" 0 +/-18
Armenian: 0 +/-18 Speak English "very well" 0 +/-18 Speak English less than "very well" 0 +/-18
Persian: 0 +/-18 Speak English "very well" 0 +/-18 Speak English less than "very well" 0 +/-18
Gujarati: 0 +/-18 Speak English "very well" 0 +/-18 Speak English less than "very well" 0 +/-18
Hindi: 0 +/-18 Speak English "very well" 0 +/-18 Speak English less than "very well" 0 +/-18
Urdu: 0 +/-18 Speak English "very well" 0 +/-18 Speak English less than "very well" 0 +/-18
Other Indic languages: 0 +/-18 Speak English "very well" 0 +/-18 Speak English less than "very well" 0 +/-18
Other Indo-European languages: 0 +/-18 Speak English "very well" 0 +/-18 Speak English less than "very well" 0 +/-18
Chinese: 8 +/-17 Speak English "very well" 8 +/-17 Speak English less than "very well" 0 +/-18
Japanese: 9 +/-11 Speak English "very well" 6 +/-10 Speak English less than "very well" 3 +/-5
Korean: 14 +/-22 Speak English "very well" 14 +/-22 Speak English less than "very well" 0 +/-18
Mon-Khmer, Cambodian: 0 +/-18 Speak English "very well" 0 +/-18 Speak English less than "very well" 0 +/-18
Hmong: 0 +/-18 Speak English "very well" 0 +/-18 Speak English less than "very well" 0 +/-18
Thai: 7 +/-10 Speak English "very well" 0 +/-18 Speak English less than "very well" 7 +/-10
Laotian: 0 +/-18 Speak English "very well" 0 +/-18 Speak English less than "very well" 0 +/-18
Vietnamese: 0 +/-18 Speak English "very well" 0 +/-18 Speak English less than "very well" 0 +/-18
Other Asian languages: 25 +/-38 Speak English "very well" 25 +/-38
2 of 4 12/16/2016

Marinette County, Wisconsin
Estimate Margin of Error Speak English less than "very well" 0 +/-18
Tagalog: 19 +/-25 Speak English "very well" 19 +/-25 Speak English less than "very well" 0 +/-18
Other Pacific Island languages: 4 +/-8 Speak English "very well" 4 +/-8 Speak English less than "very well" 0 +/-18
Navajo: 0 +/-18 Speak English "very well" 0 +/-18 Speak English less than "very well" 0 +/-18
Other Native North American languages: 2 +/-3 Speak English "very well" 2 +/-3 Speak English less than "very well" 0 +/-18
Hungarian: 8 +/-12 Speak English "very well" 8 +/-12 Speak English less than "very well" 0 +/-18
Arabic: 0 +/-18 Speak English "very well" 0 +/-18 Speak English less than "very well" 0 +/-18
Hebrew: 0 +/-18 Speak English "very well" 0 +/-18 Speak English less than "very well" 0 +/-18
African languages: 0 +/-18 Speak English "very well" 0 +/-18 Speak English less than "very well" 0 +/-18
Other and unspecified languages: 2 +/-2 Speak English "very well" 2 +/-2 Speak English less than "very well" 0 +/-18
Data are based on a sample and are subject to sampling variability. The degree of uncertainty for an estimate arising from sampling variability is represented through the use of a margin of error. The value shown here is the 90 percent margin of error. The margin of error can be interpreted roughly as providing a 90 percent probability that the interval defined by the estimate minus the margin of error and the estimate plus the margin of error (the lower and upper confidence bounds) contains the true value. In addition to sampling variability, the ACS estimates are subject to nonsampling error (for a discussion of nonsampling variability, see Accuracy of the Data). The effect of nonsampling error is not represented in these tables.
Methodological changes to data collection in 2013 may have affected language data for 2013. Users should be aware of these changes when using multi-year data containing data from 2013. For more information, see: Language User Note.
While the 2011-2015 American Community Survey (ACS) data generally reflect the February 2013 Office of Management and Budget (OMB) definitions of metropolitan and micropolitan statistical areas; in certain instances the names, codes, and boundaries of the principal cities shown in ACS tables may differ from the OMB definitions due to differences in the effective dates of the geographic entities.
Estimates of urban and rural population, housing units, and characteristics reflect boundaries of urban areas defined based on Census 2010 data. As a result, data for urban and rural areas from the ACS do not necessarily reflect the results of ongoing urbanization.
Source: U.S. Census Bureau, 2011-2015 American Community Survey 5-Year Estimates
Explanation of Symbols:
1. An '**' entry in the margin of error column indicates that either no sample observations or too few sample observations were available to compute a standard error and thus the margin of error. A statistical test is not appropriate.
2. An '-' entry in the estimate column indicates that either no sample observations or too few sample observations were available to compute an estimate, or a ratio of medians cannot be calculated because one or both of the median estimates falls in the lowest interval or upper interval of an open-ended distribution.
3. An '-' following a median estimate means the median falls in the lowest interval of an open-ended distribution. 4. An '+' following a median estimate means the median falls in the upper interval of an open-ended distribution. 5. An '***' entry in the margin of error column indicates that the median falls in the lowest interval or upper interval of an open-ended distribution. A
statistical test is not appropriate. 6. An '*****' entry in the margin of error column indicates that the estimate is controlled. A statistical test for sampling variability is not appropriate.
3 of 4 12/16/2016

7. An 'N' entry in the estimate and margin of error columns indicates that data for this geographic area cannot be displayed because the number of sample cases is too small.
8. An '(X)' means that the estimate is not applicable or not available.

B16001 LANGUAGE SPOKEN AT HOME BY ABILITY TO SPEAK ENGLISH FOR THE POPULATION 5 YEARS AND OVER Universe: Population 5 years and over 2011-2015 American Community Survey 5-Year Estimates
Supporting documentation on code lists, subject definitions, data accuracy, and statistical testing can be found on the American Community Survey website in the Data and Documentation section.
Sample size and data quality measures (including coverage rates, allocation rates, and response rates) can be found on the American Community Survey website in the Methodology section.
Tell us what you think. Provide feedback to help make American Community Survey data more useful for you.
Although the American Community Survey (ACS) produces population, demographic and housing unit estimates, it is the Census Bureau's Population Estimates Program that produces and disseminates the official estimates of the population for the nation, states, counties, cities and towns and estimates of housing units for states and counties.
Marquette County, Wisconsin
Estimate Margin of Error Total: 14,416 +/-21 Speak only English 13,778 +/-102 Spanish or Spanish Creole: 304 +/-65 Speak English "very well" 167 +/-35 Speak English less than "very well" 137 +/-55
French (incl. Patois, Cajun): 12 +/-9 Speak English "very well" 12 +/-9 Speak English less than "very well" 0 +/-14
French Creole: 0 +/-14 Speak English "very well" 0 +/-14 Speak English less than "very well" 0 +/-14
Italian: 2 +/-3 Speak English "very well" 2 +/-3 Speak English less than "very well" 0 +/-14
Portuguese or Portuguese Creole: 9 +/-13 Speak English "very well" 9 +/-13 Speak English less than "very well" 0 +/-14
German: 157 +/-42 Speak English "very well" 141 +/-40 Speak English less than "very well" 16 +/-8
Yiddish: 0 +/-14 Speak English "very well" 0 +/-14 Speak English less than "very well" 0 +/-14
Other West Germanic languages: 58 +/-30 Speak English "very well" 29 +/-18 Speak English less than "very well" 29 +/-20
Scandinavian languages: 3 +/-4 Speak English "very well" 3 +/-4 Speak English less than "very well" 0 +/-14
Greek: 5 +/-7 Speak English "very well" 5 +/-7 Speak English less than "very well" 0 +/-14
1 of 4 12/16/2016

Marquette County, Wisconsin
Estimate Margin of Error Russian: 0 +/-14 Speak English "very well" 0 +/-14 Speak English less than "very well" 0 +/-14
Polish: 16 +/-10 Speak English "very well" 9 +/-6 Speak English less than "very well" 7 +/-6
Serbo-Croatian: 2 +/-3 Speak English "very well" 2 +/-3 Speak English less than "very well" 0 +/-14
Other Slavic languages: 0 +/-14 Speak English "very well" 0 +/-14 Speak English less than "very well" 0 +/-14
Armenian: 0 +/-14 Speak English "very well" 0 +/-14 Speak English less than "very well" 0 +/-14
Persian: 0 +/-14 Speak English "very well" 0 +/-14 Speak English less than "very well" 0 +/-14
Gujarati: 0 +/-14 Speak English "very well" 0 +/-14 Speak English less than "very well" 0 +/-14
Hindi: 0 +/-14 Speak English "very well" 0 +/-14 Speak English less than "very well" 0 +/-14
Urdu: 0 +/-14 Speak English "very well" 0 +/-14 Speak English less than "very well" 0 +/-14
Other Indic languages: 0 +/-14 Speak English "very well" 0 +/-14 Speak English less than "very well" 0 +/-14
Other Indo-European languages: 7 +/-6 Speak English "very well" 7 +/-6 Speak English less than "very well" 0 +/-14
Chinese: 4 +/-5 Speak English "very well" 0 +/-14 Speak English less than "very well" 4 +/-5
Japanese: 5 +/-5 Speak English "very well" 5 +/-5 Speak English less than "very well" 0 +/-14
Korean: 0 +/-14 Speak English "very well" 0 +/-14 Speak English less than "very well" 0 +/-14
Mon-Khmer, Cambodian: 0 +/-14 Speak English "very well" 0 +/-14 Speak English less than "very well" 0 +/-14
Hmong: 4 +/-6 Speak English "very well" 4 +/-6 Speak English less than "very well" 0 +/-14
Thai: 3 +/-6 Speak English "very well" 0 +/-14 Speak English less than "very well" 3 +/-6
Laotian: 16 +/-20 Speak English "very well" 16 +/-20 Speak English less than "very well" 0 +/-14
Vietnamese: 0 +/-14 Speak English "very well" 0 +/-14 Speak English less than "very well" 0 +/-14
Other Asian languages: 0 +/-14 Speak English "very well" 0 +/-14
2 of 4 12/16/2016

Marquette County, Wisconsin
Estimate Margin of Error Speak English less than "very well" 0 +/-14
Tagalog: 24 +/-19 Speak English "very well" 24 +/-19 Speak English less than "very well" 0 +/-14
Other Pacific Island languages: 0 +/-14 Speak English "very well" 0 +/-14 Speak English less than "very well" 0 +/-14
Navajo: 0 +/-14 Speak English "very well" 0 +/-14 Speak English less than "very well" 0 +/-14
Other Native North American languages: 0 +/-14 Speak English "very well" 0 +/-14 Speak English less than "very well" 0 +/-14
Hungarian: 7 +/-10 Speak English "very well" 7 +/-10 Speak English less than "very well" 0 +/-14
Arabic: 0 +/-14 Speak English "very well" 0 +/-14 Speak English less than "very well" 0 +/-14
Hebrew: 0 +/-14 Speak English "very well" 0 +/-14 Speak English less than "very well" 0 +/-14
African languages: 0 +/-14 Speak English "very well" 0 +/-14 Speak English less than "very well" 0 +/-14
Other and unspecified languages: 0 +/-14 Speak English "very well" 0 +/-14 Speak English less than "very well" 0 +/-14
Data are based on a sample and are subject to sampling variability. The degree of uncertainty for an estimate arising from sampling variability is represented through the use of a margin of error. The value shown here is the 90 percent margin of error. The margin of error can be interpreted roughly as providing a 90 percent probability that the interval defined by the estimate minus the margin of error and the estimate plus the margin of error (the lower and upper confidence bounds) contains the true value. In addition to sampling variability, the ACS estimates are subject to nonsampling error (for a discussion of nonsampling variability, see Accuracy of the Data). The effect of nonsampling error is not represented in these tables.
Methodological changes to data collection in 2013 may have affected language data for 2013. Users should be aware of these changes when using multi-year data containing data from 2013. For more information, see: Language User Note.
While the 2011-2015 American Community Survey (ACS) data generally reflect the February 2013 Office of Management and Budget (OMB) definitions of metropolitan and micropolitan statistical areas; in certain instances the names, codes, and boundaries of the principal cities shown in ACS tables may differ from the OMB definitions due to differences in the effective dates of the geographic entities.
Estimates of urban and rural population, housing units, and characteristics reflect boundaries of urban areas defined based on Census 2010 data. As a result, data for urban and rural areas from the ACS do not necessarily reflect the results of ongoing urbanization.
Source: U.S. Census Bureau, 2011-2015 American Community Survey 5-Year Estimates
Explanation of Symbols:
1. An '**' entry in the margin of error column indicates that either no sample observations or too few sample observations were available to compute a standard error and thus the margin of error. A statistical test is not appropriate.
2. An '-' entry in the estimate column indicates that either no sample observations or too few sample observations were available to compute an estimate, or a ratio of medians cannot be calculated because one or both of the median estimates falls in the lowest interval or upper interval of an open-ended distribution.
3. An '-' following a median estimate means the median falls in the lowest interval of an open-ended distribution. 4. An '+' following a median estimate means the median falls in the upper interval of an open-ended distribution. 5. An '***' entry in the margin of error column indicates that the median falls in the lowest interval or upper interval of an open-ended distribution. A
statistical test is not appropriate. 6. An '*****' entry in the margin of error column indicates that the estimate is controlled. A statistical test for sampling variability is not appropriate.
3 of 4 12/16/2016

7. An 'N' entry in the estimate and margin of error columns indicates that data for this geographic area cannot be displayed because the number of sample cases is too small.
8. An '(X)' means that the estimate is not applicable or not available.

B16001 LANGUAGE SPOKEN AT HOME BY ABILITY TO SPEAK ENGLISH FOR THE POPULATION 5 YEARS AND OVER Universe: Population 5 years and over 2011-2015 American Community Survey 5-Year Estimates
Supporting documentation on code lists, subject definitions, data accuracy, and statistical testing can be found on the American Community Survey website in the Data and Documentation section.
Sample size and data quality measures (including coverage rates, allocation rates, and response rates) can be found on the American Community Survey website in the Methodology section.
Tell us what you think. Provide feedback to help make American Community Survey data more useful for you.
Although the American Community Survey (ACS) produces population, demographic and housing unit estimates, it is the Census Bureau's Population Estimates Program that produces and disseminates the official estimates of the population for the nation, states, counties, cities and towns and estimates of housing units for states and counties.
Menominee County, Wisconsin
Estimate Margin of Error Total: 4,040 +/-35 Speak only English 3,761 +/-101 Spanish or Spanish Creole: 27 +/-24 Speak English "very well" 6 +/-9 Speak English less than "very well" 21 +/-23
French (incl. Patois, Cajun): 0 +/-9 Speak English "very well" 0 +/-9 Speak English less than "very well" 0 +/-9
French Creole: 0 +/-9 Speak English "very well" 0 +/-9 Speak English less than "very well" 0 +/-9
Italian: 1 +/-3 Speak English "very well" 1 +/-3 Speak English less than "very well" 0 +/-9
Portuguese or Portuguese Creole: 0 +/-9 Speak English "very well" 0 +/-9 Speak English less than "very well" 0 +/-9
German: 6 +/-7 Speak English "very well" 6 +/-7 Speak English less than "very well" 0 +/-9
Yiddish: 0 +/-9 Speak English "very well" 0 +/-9 Speak English less than "very well" 0 +/-9
Other West Germanic languages: 0 +/-9 Speak English "very well" 0 +/-9 Speak English less than "very well" 0 +/-9
Scandinavian languages: 0 +/-9 Speak English "very well" 0 +/-9 Speak English less than "very well" 0 +/-9
Greek: 0 +/-9 Speak English "very well" 0 +/-9 Speak English less than "very well" 0 +/-9
1 of 4 12/16/2016

Menominee County, Wisconsin
Estimate Margin of Error Russian: 0 +/-9 Speak English "very well" 0 +/-9 Speak English less than "very well" 0 +/-9
Polish: 0 +/-9 Speak English "very well" 0 +/-9 Speak English less than "very well" 0 +/-9
Serbo-Croatian: 0 +/-9 Speak English "very well" 0 +/-9 Speak English less than "very well" 0 +/-9
Other Slavic languages: 0 +/-9 Speak English "very well" 0 +/-9 Speak English less than "very well" 0 +/-9
Armenian: 0 +/-9 Speak English "very well" 0 +/-9 Speak English less than "very well" 0 +/-9
Persian: 0 +/-9 Speak English "very well" 0 +/-9 Speak English less than "very well" 0 +/-9
Gujarati: 0 +/-9 Speak English "very well" 0 +/-9 Speak English less than "very well" 0 +/-9
Hindi: 0 +/-9 Speak English "very well" 0 +/-9 Speak English less than "very well" 0 +/-9
Urdu: 0 +/-9 Speak English "very well" 0 +/-9 Speak English less than "very well" 0 +/-9
Other Indic languages: 15 +/-23 Speak English "very well" 15 +/-23 Speak English less than "very well" 0 +/-9
Other Indo-European languages: 9 +/-13 Speak English "very well" 5 +/-7 Speak English less than "very well" 4 +/-7
Chinese: 0 +/-9 Speak English "very well" 0 +/-9 Speak English less than "very well" 0 +/-9
Japanese: 0 +/-9 Speak English "very well" 0 +/-9 Speak English less than "very well" 0 +/-9
Korean: 0 +/-9 Speak English "very well" 0 +/-9 Speak English less than "very well" 0 +/-9
Mon-Khmer, Cambodian: 0 +/-9 Speak English "very well" 0 +/-9 Speak English less than "very well" 0 +/-9
Hmong: 0 +/-9 Speak English "very well" 0 +/-9 Speak English less than "very well" 0 +/-9
Thai: 0 +/-9 Speak English "very well" 0 +/-9 Speak English less than "very well" 0 +/-9
Laotian: 14 +/-23 Speak English "very well" 0 +/-9 Speak English less than "very well" 14 +/-23
Vietnamese: 0 +/-9 Speak English "very well" 0 +/-9 Speak English less than "very well" 0 +/-9
Other Asian languages: 66 +/-56 Speak English "very well" 32 +/-27
2 of 4 12/16/2016

Menominee County, Wisconsin
Estimate Margin of Error Speak English less than "very well" 34 +/-29
Tagalog: 0 +/-9 Speak English "very well" 0 +/-9 Speak English less than "very well" 0 +/-9
Other Pacific Island languages: 0 +/-9 Speak English "very well" 0 +/-9 Speak English less than "very well" 0 +/-9
Navajo: 0 +/-9 Speak English "very well" 0 +/-9 Speak English less than "very well" 0 +/-9
Other Native North American languages: 141 +/-97 Speak English "very well" 134 +/-97 Speak English less than "very well" 7 +/-14
Hungarian: 0 +/-9 Speak English "very well" 0 +/-9 Speak English less than "very well" 0 +/-9
Arabic: 0 +/-9 Speak English "very well" 0 +/-9 Speak English less than "very well" 0 +/-9
Hebrew: 0 +/-9 Speak English "very well" 0 +/-9 Speak English less than "very well" 0 +/-9
African languages: 0 +/-9 Speak English "very well" 0 +/-9 Speak English less than "very well" 0 +/-9
Other and unspecified languages: 0 +/-9 Speak English "very well" 0 +/-9 Speak English less than "very well" 0 +/-9
Data are based on a sample and are subject to sampling variability. The degree of uncertainty for an estimate arising from sampling variability is represented through the use of a margin of error. The value shown here is the 90 percent margin of error. The margin of error can be interpreted roughly as providing a 90 percent probability that the interval defined by the estimate minus the margin of error and the estimate plus the margin of error (the lower and upper confidence bounds) contains the true value. In addition to sampling variability, the ACS estimates are subject to nonsampling error (for a discussion of nonsampling variability, see Accuracy of the Data). The effect of nonsampling error is not represented in these tables.
Methodological changes to data collection in 2013 may have affected language data for 2013. Users should be aware of these changes when using multi-year data containing data from 2013. For more information, see: Language User Note.
While the 2011-2015 American Community Survey (ACS) data generally reflect the February 2013 Office of Management and Budget (OMB) definitions of metropolitan and micropolitan statistical areas; in certain instances the names, codes, and boundaries of the principal cities shown in ACS tables may differ from the OMB definitions due to differences in the effective dates of the geographic entities.
Estimates of urban and rural population, housing units, and characteristics reflect boundaries of urban areas defined based on Census 2010 data. As a result, data for urban and rural areas from the ACS do not necessarily reflect the results of ongoing urbanization.
Source: U.S. Census Bureau, 2011-2015 American Community Survey 5-Year Estimates
Explanation of Symbols:
1. An '**' entry in the margin of error column indicates that either no sample observations or too few sample observations were available to compute a standard error and thus the margin of error. A statistical test is not appropriate.
2. An '-' entry in the estimate column indicates that either no sample observations or too few sample observations were available to compute an estimate, or a ratio of medians cannot be calculated because one or both of the median estimates falls in the lowest interval or upper interval of an open-ended distribution.
3. An '-' following a median estimate means the median falls in the lowest interval of an open-ended distribution. 4. An '+' following a median estimate means the median falls in the upper interval of an open-ended distribution. 5. An '***' entry in the margin of error column indicates that the median falls in the lowest interval or upper interval of an open-ended distribution. A
statistical test is not appropriate. 6. An '*****' entry in the margin of error column indicates that the estimate is controlled. A statistical test for sampling variability is not appropriate.
3 of 4 12/16/2016

7. An 'N' entry in the estimate and margin of error columns indicates that data for this geographic area cannot be displayed because the number of sample cases is too small.
8. An '(X)' means that the estimate is not applicable or not available.

B16001 LANGUAGE SPOKEN AT HOME BY ABILITY TO SPEAK ENGLISH FOR THE POPULATION 5 YEARS AND OVER Universe: Population 5 years and over 2017 American Community Survey 1-Year Estimates
Supporting documentation on code lists, subject definitions, data accuracy, and statistical testing can be found on the American Community Survey website in the Technical Documentation section.
Sample size and data quality measures (including coverage rates, allocation rates, and response rates) can be found on the American Community Survey website in the Methodology section.
Although the American Community Survey (ACS) produces population, demographic and housing unit estimates, it is the Census Bureau's Population Estimates Program that produces and disseminates the official estimates of the population for the nation, states, counties, cities, and towns and estimates of housing units for states and counties.
Milwaukee County, Wisconsin
Estimate Margin of Error Total: 886,665 ***** Speak only English 739,664 +/-6,792 Spanish: 90,938 +/-4,984 Speak English "very well" 57,120 +/-4,113 Speak English less than "very well" 33,818 +/-3,529
French (incl. Cajun): 1,503 +/-607 Speak English "very well" 1,060 +/-445 Speak English less than "very well" 443 +/-318
Haitian: 33 +/-55 Speak English "very well" 33 +/-55 Speak English less than "very well" 0 +/-151
Italian: 896 +/-552 Speak English "very well" 568 +/-318 Speak English less than "very well" 328 +/-321
Portuguese: 375 +/-497 Speak English "very well" 253 +/-308 Speak English less than "very well" 122 +/-203
German: 2,561 +/-752 Speak English "very well" 2,228 +/-619 Speak English less than "very well" 333 +/-249
Yiddish, Pennsylvania Dutch or other West Germanic languages:
158 +/-218
Speak English "very well" 158 +/-218 Speak English less than "very well" 0 +/-151
Greek: 612 +/-488 Speak English "very well" 327 +/-417 Speak English less than "very well" 285 +/-264
Russian: 1,644 +/-673 Speak English "very well" 880 +/-481 Speak English less than "very well" 764 +/-375
Polish: 1,438 +/-995 Speak English "very well" 1,010 +/-553 Speak English less than "very well" 428 +/-578
Serbo-Croatian: 2,028 +/-1,040
1 of 4 02/17/2020
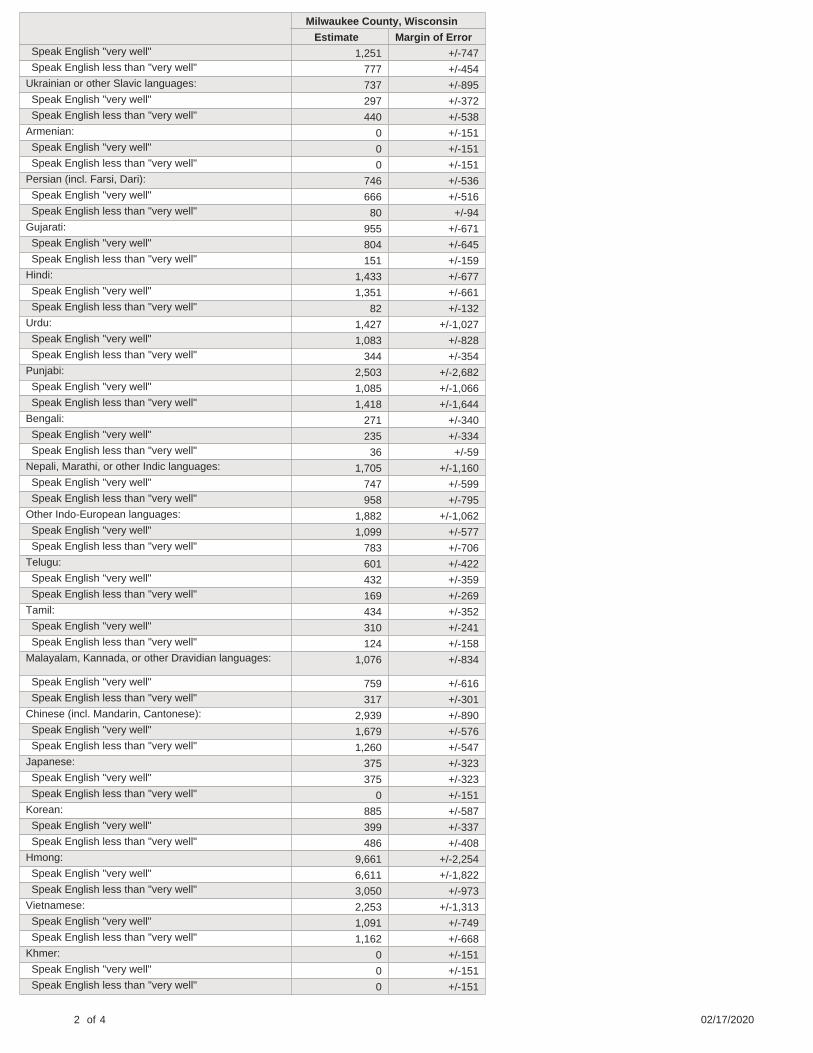
Milwaukee County, Wisconsin
Estimate Margin of Error Speak English "very well" 1,251 +/-747 Speak English less than "very well" 777 +/-454
Ukrainian or other Slavic languages: 737 +/-895 Speak English "very well" 297 +/-372 Speak English less than "very well" 440 +/-538
Armenian: 0 +/-151 Speak English "very well" 0 +/-151 Speak English less than "very well" 0 +/-151
Persian (incl. Farsi, Dari): 746 +/-536 Speak English "very well" 666 +/-516 Speak English less than "very well" 80 +/-94
Gujarati: 955 +/-671 Speak English "very well" 804 +/-645 Speak English less than "very well" 151 +/-159
Hindi: 1,433 +/-677 Speak English "very well" 1,351 +/-661 Speak English less than "very well" 82 +/-132
Urdu: 1,427 +/-1,027 Speak English "very well" 1,083 +/-828 Speak English less than "very well" 344 +/-354
Punjabi: 2,503 +/-2,682 Speak English "very well" 1,085 +/-1,066 Speak English less than "very well" 1,418 +/-1,644
Bengali: 271 +/-340 Speak English "very well" 235 +/-334 Speak English less than "very well" 36 +/-59
Nepali, Marathi, or other Indic languages: 1,705 +/-1,160 Speak English "very well" 747 +/-599 Speak English less than "very well" 958 +/-795
Other Indo-European languages: 1,882 +/-1,062 Speak English "very well" 1,099 +/-577 Speak English less than "very well" 783 +/-706
Telugu: 601 +/-422 Speak English "very well" 432 +/-359 Speak English less than "very well" 169 +/-269
Tamil: 434 +/-352 Speak English "very well" 310 +/-241 Speak English less than "very well" 124 +/-158
Malayalam, Kannada, or other Dravidian languages: 1,076 +/-834
Speak English "very well" 759 +/-616 Speak English less than "very well" 317 +/-301
Chinese (incl. Mandarin, Cantonese): 2,939 +/-890 Speak English "very well" 1,679 +/-576 Speak English less than "very well" 1,260 +/-547
Japanese: 375 +/-323 Speak English "very well" 375 +/-323 Speak English less than "very well" 0 +/-151
Korean: 885 +/-587 Speak English "very well" 399 +/-337 Speak English less than "very well" 486 +/-408
Hmong: 9,661 +/-2,254 Speak English "very well" 6,611 +/-1,822 Speak English less than "very well" 3,050 +/-973
Vietnamese: 2,253 +/-1,313 Speak English "very well" 1,091 +/-749 Speak English less than "very well" 1,162 +/-668
Khmer: 0 +/-151 Speak English "very well" 0 +/-151 Speak English less than "very well" 0 +/-151
2 of 4 02/17/2020
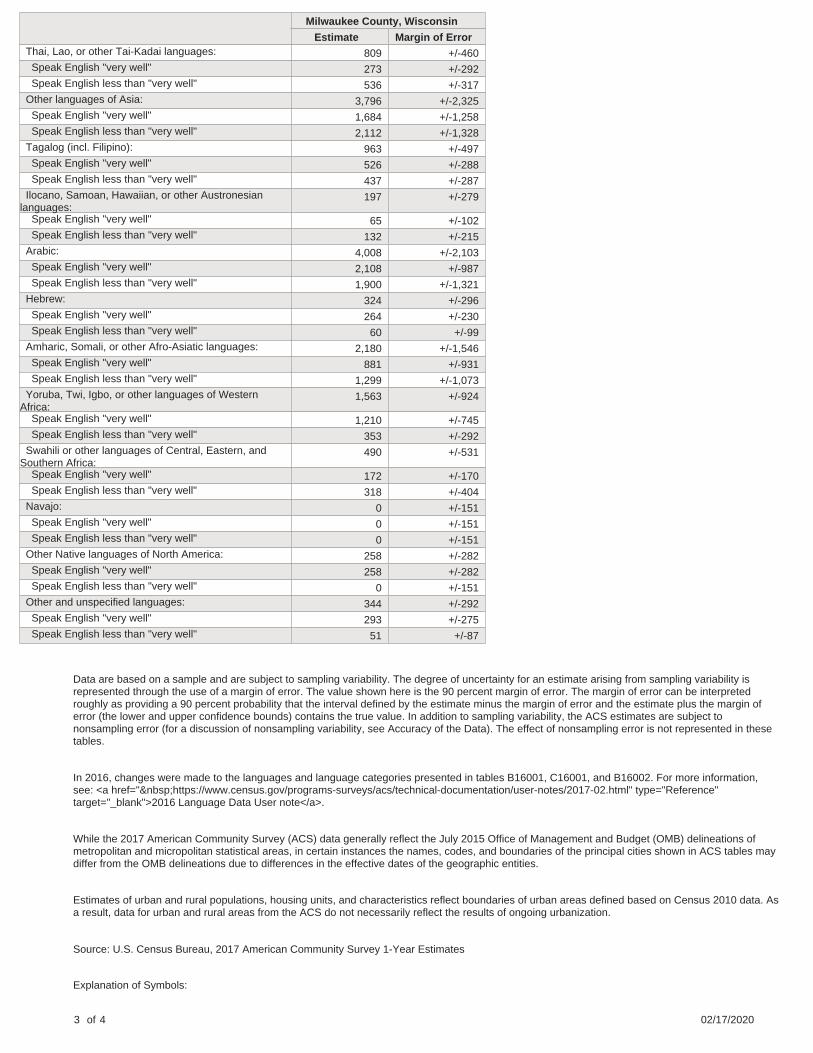
Milwaukee County, Wisconsin
Estimate Margin of Error Thai, Lao, or other Tai-Kadai languages: 809 +/-460 Speak English "very well" 273 +/-292 Speak English less than "very well" 536 +/-317
Other languages of Asia: 3,796 +/-2,325 Speak English "very well" 1,684 +/-1,258 Speak English less than "very well" 2,112 +/-1,328
Tagalog (incl. Filipino): 963 +/-497 Speak English "very well" 526 +/-288 Speak English less than "very well" 437 +/-287
Ilocano, Samoan, Hawaiian, or other Austronesian languages:
197 +/-279
Speak English "very well" 65 +/-102 Speak English less than "very well" 132 +/-215
Arabic: 4,008 +/-2,103 Speak English "very well" 2,108 +/-987 Speak English less than "very well" 1,900 +/-1,321
Hebrew: 324 +/-296 Speak English "very well" 264 +/-230 Speak English less than "very well" 60 +/-99
Amharic, Somali, or other Afro-Asiatic languages: 2,180 +/-1,546 Speak English "very well" 881 +/-931 Speak English less than "very well" 1,299 +/-1,073
Yoruba, Twi, Igbo, or other languages of Western Africa:
1,563 +/-924
Speak English "very well" 1,210 +/-745 Speak English less than "very well" 353 +/-292
Swahili or other languages of Central, Eastern, and Southern Africa:
490 +/-531
Speak English "very well" 172 +/-170 Speak English less than "very well" 318 +/-404
Navajo: 0 +/-151 Speak English "very well" 0 +/-151 Speak English less than "very well" 0 +/-151
Other Native languages of North America: 258 +/-282 Speak English "very well" 258 +/-282 Speak English less than "very well" 0 +/-151
Other and unspecified languages: 344 +/-292 Speak English "very well" 293 +/-275 Speak English less than "very well" 51 +/-87
Data are based on a sample and are subject to sampling variability. The degree of uncertainty for an estimate arising from sampling variability is represented through the use of a margin of error. The value shown here is the 90 percent margin of error. The margin of error can be interpreted roughly as providing a 90 percent probability that the interval defined by the estimate minus the margin of error and the estimate plus the margin of error (the lower and upper confidence bounds) contains the true value. In addition to sampling variability, the ACS estimates are subject to nonsampling error (for a discussion of nonsampling variability, see Accuracy of the Data). The effect of nonsampling error is not represented in these tables.
In 2016, changes were made to the languages and language categories presented in tables B16001, C16001, and B16002. For more information, see: <a href=" https://www.census.gov/programs-surveys/acs/technical-documentation/user-notes/2017-02.html" type="Reference" target="_blank">2016 Language Data User note</a>.
While the 2017 American Community Survey (ACS) data generally reflect the July 2015 Office of Management and Budget (OMB) delineations of metropolitan and micropolitan statistical areas, in certain instances the names, codes, and boundaries of the principal cities shown in ACS tables may differ from the OMB delineations due to differences in the effective dates of the geographic entities.
Estimates of urban and rural populations, housing units, and characteristics reflect boundaries of urban areas defined based on Census 2010 data. As a result, data for urban and rural areas from the ACS do not necessarily reflect the results of ongoing urbanization.
Source: U.S. Census Bureau, 2017 American Community Survey 1-Year Estimates
Explanation of Symbols:
3 of 4 02/17/2020
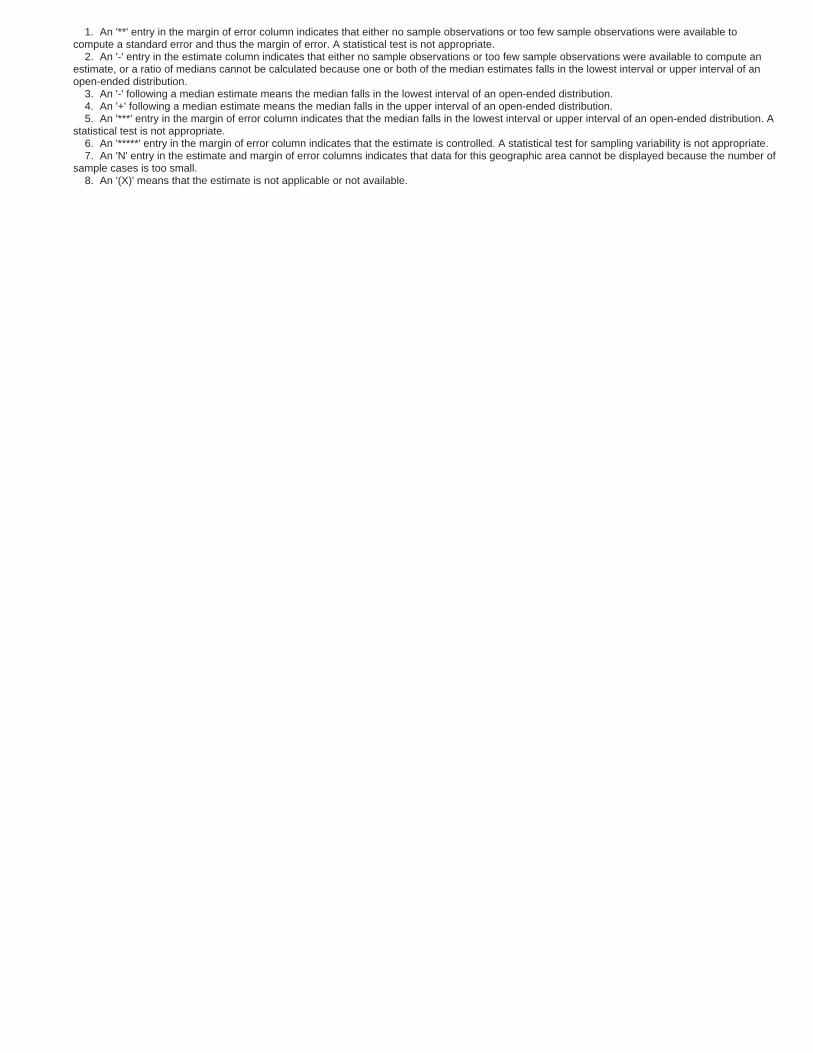
1. An '**' entry in the margin of error column indicates that either no sample observations or too few sample observations were available to compute a standard error and thus the margin of error. A statistical test is not appropriate.
2. An '-' entry in the estimate column indicates that either no sample observations or too few sample observations were available to compute an estimate, or a ratio of medians cannot be calculated because one or both of the median estimates falls in the lowest interval or upper interval of an open-ended distribution.
3. An '-' following a median estimate means the median falls in the lowest interval of an open-ended distribution. 4. An '+' following a median estimate means the median falls in the upper interval of an open-ended distribution. 5. An '***' entry in the margin of error column indicates that the median falls in the lowest interval or upper interval of an open-ended distribution. A
statistical test is not appropriate. 6. An '*****' entry in the margin of error column indicates that the estimate is controlled. A statistical test for sampling variability is not appropriate. 7. An 'N' entry in the estimate and margin of error columns indicates that data for this geographic area cannot be displayed because the number of
sample cases is too small. 8. An '(X)' means that the estimate is not applicable or not available.

B16001 LANGUAGE SPOKEN AT HOME BY ABILITY TO SPEAK ENGLISH FOR THE POPULATION 5 YEARS AND OVER Universe: Population 5 years and over 2011-2015 American Community Survey 5-Year Estimates
Supporting documentation on code lists, subject definitions, data accuracy, and statistical testing can be found on the American Community Survey website in the Data and Documentation section.
Sample size and data quality measures (including coverage rates, allocation rates, and response rates) can be found on the American Community Survey website in the Methodology section.
Tell us what you think. Provide feedback to help make American Community Survey data more useful for you.
Although the American Community Survey (ACS) produces population, demographic and housing unit estimates, it is the Census Bureau's Population Estimates Program that produces and disseminates the official estimates of the population for the nation, states, counties, cities and towns and estimates of housing units for states and counties.
Monroe County, Wisconsin
Estimate Margin of Error Total: 42,065 +/-56 Speak only English 38,581 +/-355 Spanish or Spanish Creole: 1,488 +/-206 Speak English "very well" 758 +/-128 Speak English less than "very well" 730 +/-144
French (incl. Patois, Cajun): 36 +/-26 Speak English "very well" 24 +/-19 Speak English less than "very well" 12 +/-13
French Creole: 0 +/-18 Speak English "very well" 0 +/-18 Speak English less than "very well" 0 +/-18
Italian: 9 +/-13 Speak English "very well" 2 +/-5 Speak English less than "very well" 7 +/-12
Portuguese or Portuguese Creole: 1 +/-3 Speak English "very well" 1 +/-3 Speak English less than "very well" 0 +/-18
German: 1,200 +/-253 Speak English "very well" 948 +/-228 Speak English less than "very well" 252 +/-69
Yiddish: 0 +/-18 Speak English "very well" 0 +/-18 Speak English less than "very well" 0 +/-18
Other West Germanic languages: 333 +/-123 Speak English "very well" 168 +/-81 Speak English less than "very well" 165 +/-66
Scandinavian languages: 10 +/-7 Speak English "very well" 10 +/-7 Speak English less than "very well" 0 +/-18
Greek: 0 +/-18 Speak English "very well" 0 +/-18 Speak English less than "very well" 0 +/-18
1 of 4 12/16/2016

Monroe County, Wisconsin
Estimate Margin of Error Russian: 5 +/-6 Speak English "very well" 3 +/-4 Speak English less than "very well" 2 +/-3
Polish: 23 +/-16 Speak English "very well" 14 +/-12 Speak English less than "very well" 9 +/-12
Serbo-Croatian: 7 +/-10 Speak English "very well" 5 +/-6 Speak English less than "very well" 2 +/-9
Other Slavic languages: 25 +/-37 Speak English "very well" 25 +/-37 Speak English less than "very well" 0 +/-18
Armenian: 0 +/-18 Speak English "very well" 0 +/-18 Speak English less than "very well" 0 +/-18
Persian: 10 +/-14 Speak English "very well" 10 +/-14 Speak English less than "very well" 0 +/-18
Gujarati: 0 +/-18 Speak English "very well" 0 +/-18 Speak English less than "very well" 0 +/-18
Hindi: 15 +/-20 Speak English "very well" 10 +/-14 Speak English less than "very well" 5 +/-7
Urdu: 0 +/-18 Speak English "very well" 0 +/-18 Speak English less than "very well" 0 +/-18
Other Indic languages: 7 +/-9 Speak English "very well" 7 +/-9 Speak English less than "very well" 0 +/-18
Other Indo-European languages: 9 +/-8 Speak English "very well" 9 +/-8 Speak English less than "very well" 0 +/-18
Chinese: 6 +/-8 Speak English "very well" 6 +/-8 Speak English less than "very well" 0 +/-18
Japanese: 9 +/-15 Speak English "very well" 6 +/-11 Speak English less than "very well" 3 +/-5
Korean: 35 +/-34 Speak English "very well" 7 +/-7 Speak English less than "very well" 28 +/-32
Mon-Khmer, Cambodian: 0 +/-18 Speak English "very well" 0 +/-18 Speak English less than "very well" 0 +/-18
Hmong: 42 +/-39 Speak English "very well" 42 +/-39 Speak English less than "very well" 0 +/-18
Thai: 6 +/-6 Speak English "very well" 0 +/-18 Speak English less than "very well" 6 +/-6
Laotian: 0 +/-18 Speak English "very well" 0 +/-18 Speak English less than "very well" 0 +/-18
Vietnamese: 1 +/-3 Speak English "very well" 1 +/-3 Speak English less than "very well" 0 +/-18
Other Asian languages: 0 +/-18 Speak English "very well" 0 +/-18
2 of 4 12/16/2016

Monroe County, Wisconsin
Estimate Margin of Error Speak English less than "very well" 0 +/-18
Tagalog: 42 +/-30 Speak English "very well" 37 +/-30 Speak English less than "very well" 5 +/-6
Other Pacific Island languages: 2 +/-3 Speak English "very well" 0 +/-18 Speak English less than "very well" 2 +/-3
Navajo: 0 +/-18 Speak English "very well" 0 +/-18 Speak English less than "very well" 0 +/-18
Other Native North American languages: 130 +/-48 Speak English "very well" 86 +/-35 Speak English less than "very well" 44 +/-30
Hungarian: 0 +/-18 Speak English "very well" 0 +/-18 Speak English less than "very well" 0 +/-18
Arabic: 23 +/-18 Speak English "very well" 7 +/-6 Speak English less than "very well" 16 +/-17
Hebrew: 0 +/-18 Speak English "very well" 0 +/-18 Speak English less than "very well" 0 +/-18
African languages: 5 +/-7 Speak English "very well" 5 +/-7 Speak English less than "very well" 0 +/-18
Other and unspecified languages: 5 +/-6 Speak English "very well" 3 +/-4 Speak English less than "very well" 2 +/-3
Data are based on a sample and are subject to sampling variability. The degree of uncertainty for an estimate arising from sampling variability is represented through the use of a margin of error. The value shown here is the 90 percent margin of error. The margin of error can be interpreted roughly as providing a 90 percent probability that the interval defined by the estimate minus the margin of error and the estimate plus the margin of error (the lower and upper confidence bounds) contains the true value. In addition to sampling variability, the ACS estimates are subject to nonsampling error (for a discussion of nonsampling variability, see Accuracy of the Data). The effect of nonsampling error is not represented in these tables.
Methodological changes to data collection in 2013 may have affected language data for 2013. Users should be aware of these changes when using multi-year data containing data from 2013. For more information, see: Language User Note.
While the 2011-2015 American Community Survey (ACS) data generally reflect the February 2013 Office of Management and Budget (OMB) definitions of metropolitan and micropolitan statistical areas; in certain instances the names, codes, and boundaries of the principal cities shown in ACS tables may differ from the OMB definitions due to differences in the effective dates of the geographic entities.
Estimates of urban and rural population, housing units, and characteristics reflect boundaries of urban areas defined based on Census 2010 data. As a result, data for urban and rural areas from the ACS do not necessarily reflect the results of ongoing urbanization.
Source: U.S. Census Bureau, 2011-2015 American Community Survey 5-Year Estimates
Explanation of Symbols:
1. An '**' entry in the margin of error column indicates that either no sample observations or too few sample observations were available to compute a standard error and thus the margin of error. A statistical test is not appropriate.
2. An '-' entry in the estimate column indicates that either no sample observations or too few sample observations were available to compute an estimate, or a ratio of medians cannot be calculated because one or both of the median estimates falls in the lowest interval or upper interval of an open-ended distribution.
3. An '-' following a median estimate means the median falls in the lowest interval of an open-ended distribution. 4. An '+' following a median estimate means the median falls in the upper interval of an open-ended distribution. 5. An '***' entry in the margin of error column indicates that the median falls in the lowest interval or upper interval of an open-ended distribution. A
statistical test is not appropriate. 6. An '*****' entry in the margin of error column indicates that the estimate is controlled. A statistical test for sampling variability is not appropriate.
3 of 4 12/16/2016

7. An 'N' entry in the estimate and margin of error columns indicates that data for this geographic area cannot be displayed because the number of sample cases is too small.
8. An '(X)' means that the estimate is not applicable or not available.

B16001 LANGUAGE SPOKEN AT HOME BY ABILITY TO SPEAK ENGLISH FOR THE POPULATION 5 YEARS AND OVER Universe: Population 5 years and over 2011-2015 American Community Survey 5-Year Estimates
Supporting documentation on code lists, subject definitions, data accuracy, and statistical testing can be found on the American Community Survey website in the Data and Documentation section.
Sample size and data quality measures (including coverage rates, allocation rates, and response rates) can be found on the American Community Survey website in the Methodology section.
Tell us what you think. Provide feedback to help make American Community Survey data more useful for you.
Although the American Community Survey (ACS) produces population, demographic and housing unit estimates, it is the Census Bureau's Population Estimates Program that produces and disseminates the official estimates of the population for the nation, states, counties, cities and towns and estimates of housing units for states and counties.
Oconto County, Wisconsin
Estimate Margin of Error Total: 35,608 +/-18 Speak only English 34,579 +/-213 Spanish or Spanish Creole: 530 +/-96 Speak English "very well" 315 +/-85 Speak English less than "very well" 215 +/-47
French (incl. Patois, Cajun): 21 +/-11 Speak English "very well" 13 +/-8 Speak English less than "very well" 8 +/-7
French Creole: 0 +/-18 Speak English "very well" 0 +/-18 Speak English less than "very well" 0 +/-18
Italian: 16 +/-25 Speak English "very well" 0 +/-18 Speak English less than "very well" 16 +/-25
Portuguese or Portuguese Creole: 0 +/-18 Speak English "very well" 0 +/-18 Speak English less than "very well" 0 +/-18
German: 117 +/-52 Speak English "very well" 71 +/-37 Speak English less than "very well" 46 +/-40
Yiddish: 0 +/-18 Speak English "very well" 0 +/-18 Speak English less than "very well" 0 +/-18
Other West Germanic languages: 16 +/-11 Speak English "very well" 12 +/-9 Speak English less than "very well" 4 +/-7
Scandinavian languages: 5 +/-7 Speak English "very well" 5 +/-7 Speak English less than "very well" 0 +/-18
Greek: 26 +/-38 Speak English "very well" 26 +/-38 Speak English less than "very well" 0 +/-18
1 of 4 12/16/2016

Oconto County, Wisconsin
Estimate Margin of Error Russian: 138 +/-185 Speak English "very well" 112 +/-150 Speak English less than "very well" 26 +/-36
Polish: 17 +/-15 Speak English "very well" 11 +/-10 Speak English less than "very well" 6 +/-7
Serbo-Croatian: 0 +/-18 Speak English "very well" 0 +/-18 Speak English less than "very well" 0 +/-18
Other Slavic languages: 4 +/-5 Speak English "very well" 4 +/-5 Speak English less than "very well" 0 +/-18
Armenian: 0 +/-18 Speak English "very well" 0 +/-18 Speak English less than "very well" 0 +/-18
Persian: 0 +/-18 Speak English "very well" 0 +/-18 Speak English less than "very well" 0 +/-18
Gujarati: 0 +/-18 Speak English "very well" 0 +/-18 Speak English less than "very well" 0 +/-18
Hindi: 12 +/-18 Speak English "very well" 0 +/-18 Speak English less than "very well" 12 +/-18
Urdu: 0 +/-18 Speak English "very well" 0 +/-18 Speak English less than "very well" 0 +/-18
Other Indic languages: 19 +/-27 Speak English "very well" 19 +/-27 Speak English less than "very well" 0 +/-18
Other Indo-European languages: 0 +/-18 Speak English "very well" 0 +/-18 Speak English less than "very well" 0 +/-18
Chinese: 2 +/-4 Speak English "very well" 2 +/-4 Speak English less than "very well" 0 +/-18
Japanese: 0 +/-18 Speak English "very well" 0 +/-18 Speak English less than "very well" 0 +/-18
Korean: 22 +/-28 Speak English "very well" 22 +/-28 Speak English less than "very well" 0 +/-18
Mon-Khmer, Cambodian: 0 +/-18 Speak English "very well" 0 +/-18 Speak English less than "very well" 0 +/-18
Hmong: 0 +/-18 Speak English "very well" 0 +/-18 Speak English less than "very well" 0 +/-18
Thai: 0 +/-18 Speak English "very well" 0 +/-18 Speak English less than "very well" 0 +/-18
Laotian: 0 +/-18 Speak English "very well" 0 +/-18 Speak English less than "very well" 0 +/-18
Vietnamese: 0 +/-18 Speak English "very well" 0 +/-18 Speak English less than "very well" 0 +/-18
Other Asian languages: 14 +/-17 Speak English "very well" 9 +/-12
2 of 4 12/16/2016

Oconto County, Wisconsin
Estimate Margin of Error Speak English less than "very well" 5 +/-6
Tagalog: 15 +/-16 Speak English "very well" 6 +/-11 Speak English less than "very well" 9 +/-11
Other Pacific Island languages: 0 +/-18 Speak English "very well" 0 +/-18 Speak English less than "very well" 0 +/-18
Navajo: 0 +/-18 Speak English "very well" 0 +/-18 Speak English less than "very well" 0 +/-18
Other Native North American languages: 21 +/-14 Speak English "very well" 6 +/-6 Speak English less than "very well" 15 +/-12
Hungarian: 8 +/-11 Speak English "very well" 8 +/-11 Speak English less than "very well" 0 +/-18
Arabic: 22 +/-19 Speak English "very well" 9 +/-11 Speak English less than "very well" 13 +/-13
Hebrew: 4 +/-6 Speak English "very well" 4 +/-6 Speak English less than "very well" 0 +/-18
African languages: 0 +/-18 Speak English "very well" 0 +/-18 Speak English less than "very well" 0 +/-18
Other and unspecified languages: 0 +/-18 Speak English "very well" 0 +/-18 Speak English less than "very well" 0 +/-18
Data are based on a sample and are subject to sampling variability. The degree of uncertainty for an estimate arising from sampling variability is represented through the use of a margin of error. The value shown here is the 90 percent margin of error. The margin of error can be interpreted roughly as providing a 90 percent probability that the interval defined by the estimate minus the margin of error and the estimate plus the margin of error (the lower and upper confidence bounds) contains the true value. In addition to sampling variability, the ACS estimates are subject to nonsampling error (for a discussion of nonsampling variability, see Accuracy of the Data). The effect of nonsampling error is not represented in these tables.
Methodological changes to data collection in 2013 may have affected language data for 2013. Users should be aware of these changes when using multi-year data containing data from 2013. For more information, see: Language User Note.
While the 2011-2015 American Community Survey (ACS) data generally reflect the February 2013 Office of Management and Budget (OMB) definitions of metropolitan and micropolitan statistical areas; in certain instances the names, codes, and boundaries of the principal cities shown in ACS tables may differ from the OMB definitions due to differences in the effective dates of the geographic entities.
Estimates of urban and rural population, housing units, and characteristics reflect boundaries of urban areas defined based on Census 2010 data. As a result, data for urban and rural areas from the ACS do not necessarily reflect the results of ongoing urbanization.
Source: U.S. Census Bureau, 2011-2015 American Community Survey 5-Year Estimates
Explanation of Symbols:
1. An '**' entry in the margin of error column indicates that either no sample observations or too few sample observations were available to compute a standard error and thus the margin of error. A statistical test is not appropriate.
2. An '-' entry in the estimate column indicates that either no sample observations or too few sample observations were available to compute an estimate, or a ratio of medians cannot be calculated because one or both of the median estimates falls in the lowest interval or upper interval of an open-ended distribution.
3. An '-' following a median estimate means the median falls in the lowest interval of an open-ended distribution. 4. An '+' following a median estimate means the median falls in the upper interval of an open-ended distribution. 5. An '***' entry in the margin of error column indicates that the median falls in the lowest interval or upper interval of an open-ended distribution. A
statistical test is not appropriate. 6. An '*****' entry in the margin of error column indicates that the estimate is controlled. A statistical test for sampling variability is not appropriate.
3 of 4 12/16/2016

7. An 'N' entry in the estimate and margin of error columns indicates that data for this geographic area cannot be displayed because the number of sample cases is too small.
8. An '(X)' means that the estimate is not applicable or not available.

B16001 LANGUAGE SPOKEN AT HOME BY ABILITY TO SPEAK ENGLISH FOR THE POPULATION 5 YEARS AND OVER Universe: Population 5 years and over 2011-2015 American Community Survey 5-Year Estimates
Supporting documentation on code lists, subject definitions, data accuracy, and statistical testing can be found on the American Community Survey website in the Data and Documentation section.
Sample size and data quality measures (including coverage rates, allocation rates, and response rates) can be found on the American Community Survey website in the Methodology section.
Tell us what you think. Provide feedback to help make American Community Survey data more useful for you.
Although the American Community Survey (ACS) produces population, demographic and housing unit estimates, it is the Census Bureau's Population Estimates Program that produces and disseminates the official estimates of the population for the nation, states, counties, cities and towns and estimates of housing units for states and counties.
Oneida County, Wisconsin
Estimate Margin of Error Total: 34,069 +/-75 Speak only English 33,217 +/-165 Spanish or Spanish Creole: 322 +/-108 Speak English "very well" 272 +/-100 Speak English less than "very well" 50 +/-34
French (incl. Patois, Cajun): 74 +/-51 Speak English "very well" 74 +/-51 Speak English less than "very well" 0 +/-18
French Creole: 0 +/-18 Speak English "very well" 0 +/-18 Speak English less than "very well" 0 +/-18
Italian: 6 +/-7 Speak English "very well" 6 +/-7 Speak English less than "very well" 0 +/-18
Portuguese or Portuguese Creole: 0 +/-18 Speak English "very well" 0 +/-18 Speak English less than "very well" 0 +/-18
German: 165 +/-55 Speak English "very well" 124 +/-51 Speak English less than "very well" 41 +/-21
Yiddish: 2 +/-3 Speak English "very well" 2 +/-3 Speak English less than "very well" 0 +/-18
Other West Germanic languages: 0 +/-18 Speak English "very well" 0 +/-18 Speak English less than "very well" 0 +/-18
Scandinavian languages: 17 +/-17 Speak English "very well" 17 +/-17 Speak English less than "very well" 0 +/-18
Greek: 23 +/-23 Speak English "very well" 23 +/-23 Speak English less than "very well" 0 +/-18
1 of 4 12/16/2016

Oneida County, Wisconsin
Estimate Margin of Error Russian: 25 +/-34 Speak English "very well" 3 +/-5 Speak English less than "very well" 22 +/-33
Polish: 33 +/-34 Speak English "very well" 30 +/-33 Speak English less than "very well" 3 +/-4
Serbo-Croatian: 0 +/-18 Speak English "very well" 0 +/-18 Speak English less than "very well" 0 +/-18
Other Slavic languages: 13 +/-10 Speak English "very well" 11 +/-10 Speak English less than "very well" 2 +/-3
Armenian: 0 +/-18 Speak English "very well" 0 +/-18 Speak English less than "very well" 0 +/-18
Persian: 0 +/-18 Speak English "very well" 0 +/-18 Speak English less than "very well" 0 +/-18
Gujarati: 0 +/-18 Speak English "very well" 0 +/-18 Speak English less than "very well" 0 +/-18
Hindi: 0 +/-18 Speak English "very well" 0 +/-18 Speak English less than "very well" 0 +/-18
Urdu: 1 +/-2 Speak English "very well" 0 +/-18 Speak English less than "very well" 1 +/-2
Other Indic languages: 8 +/-15 Speak English "very well" 0 +/-18 Speak English less than "very well" 8 +/-15
Other Indo-European languages: 3 +/-4 Speak English "very well" 3 +/-4 Speak English less than "very well" 0 +/-18
Chinese: 50 +/-47 Speak English "very well" 9 +/-14 Speak English less than "very well" 41 +/-38
Japanese: 73 +/-82 Speak English "very well" 24 +/-24 Speak English less than "very well" 49 +/-60
Korean: 4 +/-7 Speak English "very well" 0 +/-18 Speak English less than "very well" 4 +/-7
Mon-Khmer, Cambodian: 8 +/-13 Speak English "very well" 0 +/-18 Speak English less than "very well" 8 +/-13
Hmong: 0 +/-18 Speak English "very well" 0 +/-18 Speak English less than "very well" 0 +/-18
Thai: 0 +/-18 Speak English "very well" 0 +/-18 Speak English less than "very well" 0 +/-18
Laotian: 0 +/-18 Speak English "very well" 0 +/-18 Speak English less than "very well" 0 +/-18
Vietnamese: 0 +/-18 Speak English "very well" 0 +/-18 Speak English less than "very well" 0 +/-18
Other Asian languages: 0 +/-18 Speak English "very well" 0 +/-18
2 of 4 12/16/2016

Oneida County, Wisconsin
Estimate Margin of Error Speak English less than "very well" 0 +/-18
Tagalog: 3 +/-4 Speak English "very well" 3 +/-4 Speak English less than "very well" 0 +/-18
Other Pacific Island languages: 0 +/-18 Speak English "very well" 0 +/-18 Speak English less than "very well" 0 +/-18
Navajo: 0 +/-18 Speak English "very well" 0 +/-18 Speak English less than "very well" 0 +/-18
Other Native North American languages: 9 +/-17 Speak English "very well" 9 +/-17 Speak English less than "very well" 0 +/-18
Hungarian: 0 +/-18 Speak English "very well" 0 +/-18 Speak English less than "very well" 0 +/-18
Arabic: 0 +/-18 Speak English "very well" 0 +/-18 Speak English less than "very well" 0 +/-18
Hebrew: 0 +/-18 Speak English "very well" 0 +/-18 Speak English less than "very well" 0 +/-18
African languages: 0 +/-18 Speak English "very well" 0 +/-18 Speak English less than "very well" 0 +/-18
Other and unspecified languages: 13 +/-16 Speak English "very well" 13 +/-16 Speak English less than "very well" 0 +/-18
Data are based on a sample and are subject to sampling variability. The degree of uncertainty for an estimate arising from sampling variability is represented through the use of a margin of error. The value shown here is the 90 percent margin of error. The margin of error can be interpreted roughly as providing a 90 percent probability that the interval defined by the estimate minus the margin of error and the estimate plus the margin of error (the lower and upper confidence bounds) contains the true value. In addition to sampling variability, the ACS estimates are subject to nonsampling error (for a discussion of nonsampling variability, see Accuracy of the Data). The effect of nonsampling error is not represented in these tables.
Methodological changes to data collection in 2013 may have affected language data for 2013. Users should be aware of these changes when using multi-year data containing data from 2013. For more information, see: Language User Note.
While the 2011-2015 American Community Survey (ACS) data generally reflect the February 2013 Office of Management and Budget (OMB) definitions of metropolitan and micropolitan statistical areas; in certain instances the names, codes, and boundaries of the principal cities shown in ACS tables may differ from the OMB definitions due to differences in the effective dates of the geographic entities.
Estimates of urban and rural population, housing units, and characteristics reflect boundaries of urban areas defined based on Census 2010 data. As a result, data for urban and rural areas from the ACS do not necessarily reflect the results of ongoing urbanization.
Source: U.S. Census Bureau, 2011-2015 American Community Survey 5-Year Estimates
Explanation of Symbols:
1. An '**' entry in the margin of error column indicates that either no sample observations or too few sample observations were available to compute a standard error and thus the margin of error. A statistical test is not appropriate.
2. An '-' entry in the estimate column indicates that either no sample observations or too few sample observations were available to compute an estimate, or a ratio of medians cannot be calculated because one or both of the median estimates falls in the lowest interval or upper interval of an open-ended distribution.
3. An '-' following a median estimate means the median falls in the lowest interval of an open-ended distribution. 4. An '+' following a median estimate means the median falls in the upper interval of an open-ended distribution. 5. An '***' entry in the margin of error column indicates that the median falls in the lowest interval or upper interval of an open-ended distribution. A
statistical test is not appropriate. 6. An '*****' entry in the margin of error column indicates that the estimate is controlled. A statistical test for sampling variability is not appropriate.
3 of 4 12/16/2016

7. An 'N' entry in the estimate and margin of error columns indicates that data for this geographic area cannot be displayed because the number of sample cases is too small.
8. An '(X)' means that the estimate is not applicable or not available.
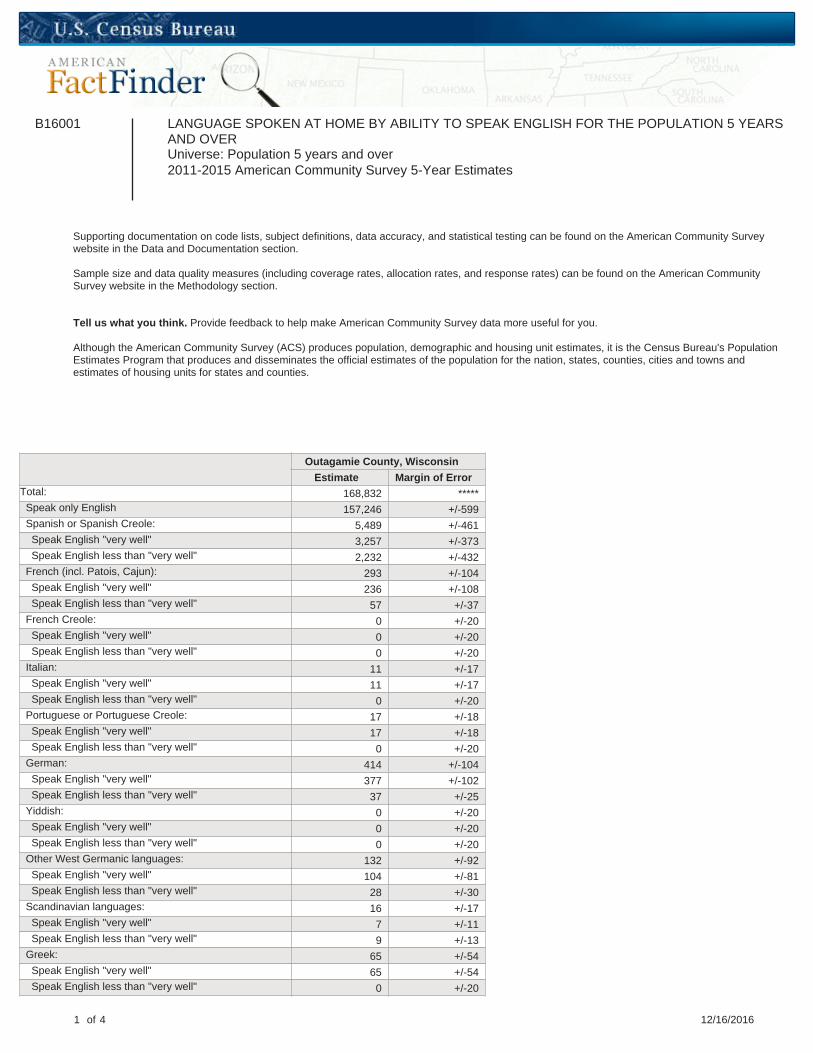
B16001 LANGUAGE SPOKEN AT HOME BY ABILITY TO SPEAK ENGLISH FOR THE POPULATION 5 YEARS AND OVER Universe: Population 5 years and over 2011-2015 American Community Survey 5-Year Estimates
Supporting documentation on code lists, subject definitions, data accuracy, and statistical testing can be found on the American Community Survey website in the Data and Documentation section.
Sample size and data quality measures (including coverage rates, allocation rates, and response rates) can be found on the American Community Survey website in the Methodology section.
Tell us what you think. Provide feedback to help make American Community Survey data more useful for you.
Although the American Community Survey (ACS) produces population, demographic and housing unit estimates, it is the Census Bureau's Population Estimates Program that produces and disseminates the official estimates of the population for the nation, states, counties, cities and towns and estimates of housing units for states and counties.
Outagamie County, Wisconsin
Estimate Margin of Error Total: 168,832 ***** Speak only English 157,246 +/-599 Spanish or Spanish Creole: 5,489 +/-461 Speak English "very well" 3,257 +/-373 Speak English less than "very well" 2,232 +/-432
French (incl. Patois, Cajun): 293 +/-104 Speak English "very well" 236 +/-108 Speak English less than "very well" 57 +/-37
French Creole: 0 +/-20 Speak English "very well" 0 +/-20 Speak English less than "very well" 0 +/-20
Italian: 11 +/-17 Speak English "very well" 11 +/-17 Speak English less than "very well" 0 +/-20
Portuguese or Portuguese Creole: 17 +/-18 Speak English "very well" 17 +/-18 Speak English less than "very well" 0 +/-20
German: 414 +/-104 Speak English "very well" 377 +/-102 Speak English less than "very well" 37 +/-25
Yiddish: 0 +/-20 Speak English "very well" 0 +/-20 Speak English less than "very well" 0 +/-20
Other West Germanic languages: 132 +/-92 Speak English "very well" 104 +/-81 Speak English less than "very well" 28 +/-30
Scandinavian languages: 16 +/-17 Speak English "very well" 7 +/-11 Speak English less than "very well" 9 +/-13
Greek: 65 +/-54 Speak English "very well" 65 +/-54 Speak English less than "very well" 0 +/-20
1 of 4 12/16/2016
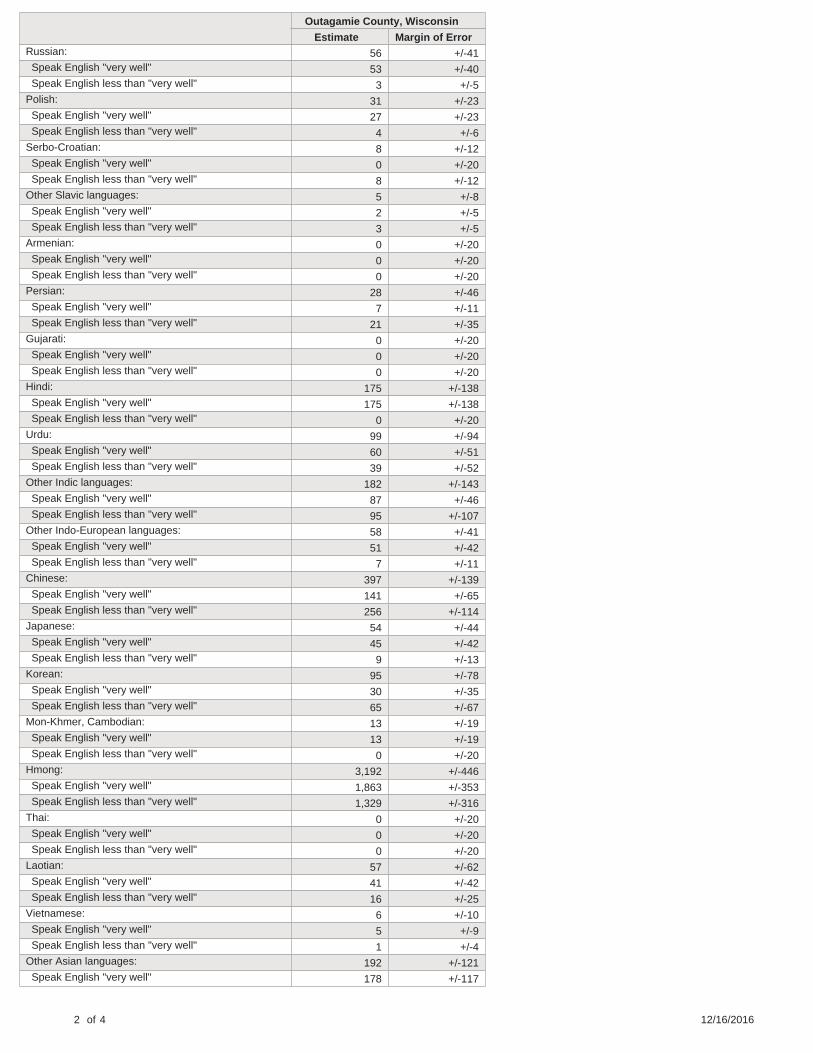
Outagamie County, Wisconsin
Estimate Margin of Error Russian: 56 +/-41 Speak English "very well" 53 +/-40 Speak English less than "very well" 3 +/-5
Polish: 31 +/-23 Speak English "very well" 27 +/-23 Speak English less than "very well" 4 +/-6
Serbo-Croatian: 8 +/-12 Speak English "very well" 0 +/-20 Speak English less than "very well" 8 +/-12
Other Slavic languages: 5 +/-8 Speak English "very well" 2 +/-5 Speak English less than "very well" 3 +/-5
Armenian: 0 +/-20 Speak English "very well" 0 +/-20 Speak English less than "very well" 0 +/-20
Persian: 28 +/-46 Speak English "very well" 7 +/-11 Speak English less than "very well" 21 +/-35
Gujarati: 0 +/-20 Speak English "very well" 0 +/-20 Speak English less than "very well" 0 +/-20
Hindi: 175 +/-138 Speak English "very well" 175 +/-138 Speak English less than "very well" 0 +/-20
Urdu: 99 +/-94 Speak English "very well" 60 +/-51 Speak English less than "very well" 39 +/-52
Other Indic languages: 182 +/-143 Speak English "very well" 87 +/-46 Speak English less than "very well" 95 +/-107
Other Indo-European languages: 58 +/-41 Speak English "very well" 51 +/-42 Speak English less than "very well" 7 +/-11
Chinese: 397 +/-139 Speak English "very well" 141 +/-65 Speak English less than "very well" 256 +/-114
Japanese: 54 +/-44 Speak English "very well" 45 +/-42 Speak English less than "very well" 9 +/-13
Korean: 95 +/-78 Speak English "very well" 30 +/-35 Speak English less than "very well" 65 +/-67
Mon-Khmer, Cambodian: 13 +/-19 Speak English "very well" 13 +/-19 Speak English less than "very well" 0 +/-20
Hmong: 3,192 +/-446 Speak English "very well" 1,863 +/-353 Speak English less than "very well" 1,329 +/-316
Thai: 0 +/-20 Speak English "very well" 0 +/-20 Speak English less than "very well" 0 +/-20
Laotian: 57 +/-62 Speak English "very well" 41 +/-42 Speak English less than "very well" 16 +/-25
Vietnamese: 6 +/-10 Speak English "very well" 5 +/-9 Speak English less than "very well" 1 +/-4
Other Asian languages: 192 +/-121 Speak English "very well" 178 +/-117
2 of 4 12/16/2016

Outagamie County, Wisconsin
Estimate Margin of Error Speak English less than "very well" 14 +/-16
Tagalog: 64 +/-52 Speak English "very well" 58 +/-48 Speak English less than "very well" 6 +/-10
Other Pacific Island languages: 7 +/-9 Speak English "very well" 3 +/-4 Speak English less than "very well" 4 +/-7
Navajo: 0 +/-20 Speak English "very well" 0 +/-20 Speak English less than "very well" 0 +/-20
Other Native North American languages: 232 +/-130 Speak English "very well" 166 +/-85 Speak English less than "very well" 66 +/-80
Hungarian: 6 +/-8 Speak English "very well" 6 +/-8 Speak English less than "very well" 0 +/-20
Arabic: 28 +/-28 Speak English "very well" 28 +/-28 Speak English less than "very well" 0 +/-20
Hebrew: 34 +/-38 Speak English "very well" 34 +/-38 Speak English less than "very well" 0 +/-20
African languages: 92 +/-72 Speak English "very well" 47 +/-55 Speak English less than "very well" 45 +/-49
Other and unspecified languages: 38 +/-35 Speak English "very well" 38 +/-35 Speak English less than "very well" 0 +/-20
Data are based on a sample and are subject to sampling variability. The degree of uncertainty for an estimate arising from sampling variability is represented through the use of a margin of error. The value shown here is the 90 percent margin of error. The margin of error can be interpreted roughly as providing a 90 percent probability that the interval defined by the estimate minus the margin of error and the estimate plus the margin of error (the lower and upper confidence bounds) contains the true value. In addition to sampling variability, the ACS estimates are subject to nonsampling error (for a discussion of nonsampling variability, see Accuracy of the Data). The effect of nonsampling error is not represented in these tables.
Methodological changes to data collection in 2013 may have affected language data for 2013. Users should be aware of these changes when using multi-year data containing data from 2013. For more information, see: Language User Note.
While the 2011-2015 American Community Survey (ACS) data generally reflect the February 2013 Office of Management and Budget (OMB) definitions of metropolitan and micropolitan statistical areas; in certain instances the names, codes, and boundaries of the principal cities shown in ACS tables may differ from the OMB definitions due to differences in the effective dates of the geographic entities.
Estimates of urban and rural population, housing units, and characteristics reflect boundaries of urban areas defined based on Census 2010 data. As a result, data for urban and rural areas from the ACS do not necessarily reflect the results of ongoing urbanization.
Source: U.S. Census Bureau, 2011-2015 American Community Survey 5-Year Estimates
Explanation of Symbols:
1. An '**' entry in the margin of error column indicates that either no sample observations or too few sample observations were available to compute a standard error and thus the margin of error. A statistical test is not appropriate.
2. An '-' entry in the estimate column indicates that either no sample observations or too few sample observations were available to compute an estimate, or a ratio of medians cannot be calculated because one or both of the median estimates falls in the lowest interval or upper interval of an open-ended distribution.
3. An '-' following a median estimate means the median falls in the lowest interval of an open-ended distribution. 4. An '+' following a median estimate means the median falls in the upper interval of an open-ended distribution. 5. An '***' entry in the margin of error column indicates that the median falls in the lowest interval or upper interval of an open-ended distribution. A
statistical test is not appropriate. 6. An '*****' entry in the margin of error column indicates that the estimate is controlled. A statistical test for sampling variability is not appropriate.
3 of 4 12/16/2016

7. An 'N' entry in the estimate and margin of error columns indicates that data for this geographic area cannot be displayed because the number of sample cases is too small.
8. An '(X)' means that the estimate is not applicable or not available.

B16001 LANGUAGE SPOKEN AT HOME BY ABILITY TO SPEAK ENGLISH FOR THE POPULATION 5 YEARS AND OVER Universe: Population 5 years and over 2011-2015 American Community Survey 5-Year Estimates
Supporting documentation on code lists, subject definitions, data accuracy, and statistical testing can be found on the American Community Survey website in the Data and Documentation section.
Sample size and data quality measures (including coverage rates, allocation rates, and response rates) can be found on the American Community Survey website in the Methodology section.
Tell us what you think. Provide feedback to help make American Community Survey data more useful for you.
Although the American Community Survey (ACS) produces population, demographic and housing unit estimates, it is the Census Bureau's Population Estimates Program that produces and disseminates the official estimates of the population for the nation, states, counties, cities and towns and estimates of housing units for states and counties.
Ozaukee County, Wisconsin
Estimate Margin of Error Total: 82,782 +/-62 Speak only English 77,440 +/-539 Spanish or Spanish Creole: 1,785 +/-284 Speak English "very well" 1,310 +/-242 Speak English less than "very well" 475 +/-137
French (incl. Patois, Cajun): 196 +/-86 Speak English "very well" 177 +/-84 Speak English less than "very well" 19 +/-19
French Creole: 0 +/-20 Speak English "very well" 0 +/-20 Speak English less than "very well" 0 +/-20
Italian: 119 +/-55 Speak English "very well" 112 +/-52 Speak English less than "very well" 7 +/-11
Portuguese or Portuguese Creole: 9 +/-13 Speak English "very well" 9 +/-13 Speak English less than "very well" 0 +/-20
German: 537 +/-134 Speak English "very well" 406 +/-120 Speak English less than "very well" 131 +/-68
Yiddish: 23 +/-35 Speak English "very well" 23 +/-35 Speak English less than "very well" 0 +/-20
Other West Germanic languages: 81 +/-64 Speak English "very well" 81 +/-64 Speak English less than "very well" 0 +/-20
Scandinavian languages: 104 +/-89 Speak English "very well" 98 +/-88 Speak English less than "very well" 6 +/-8
Greek: 9 +/-15 Speak English "very well" 0 +/-20 Speak English less than "very well" 9 +/-15
1 of 4 12/16/2016
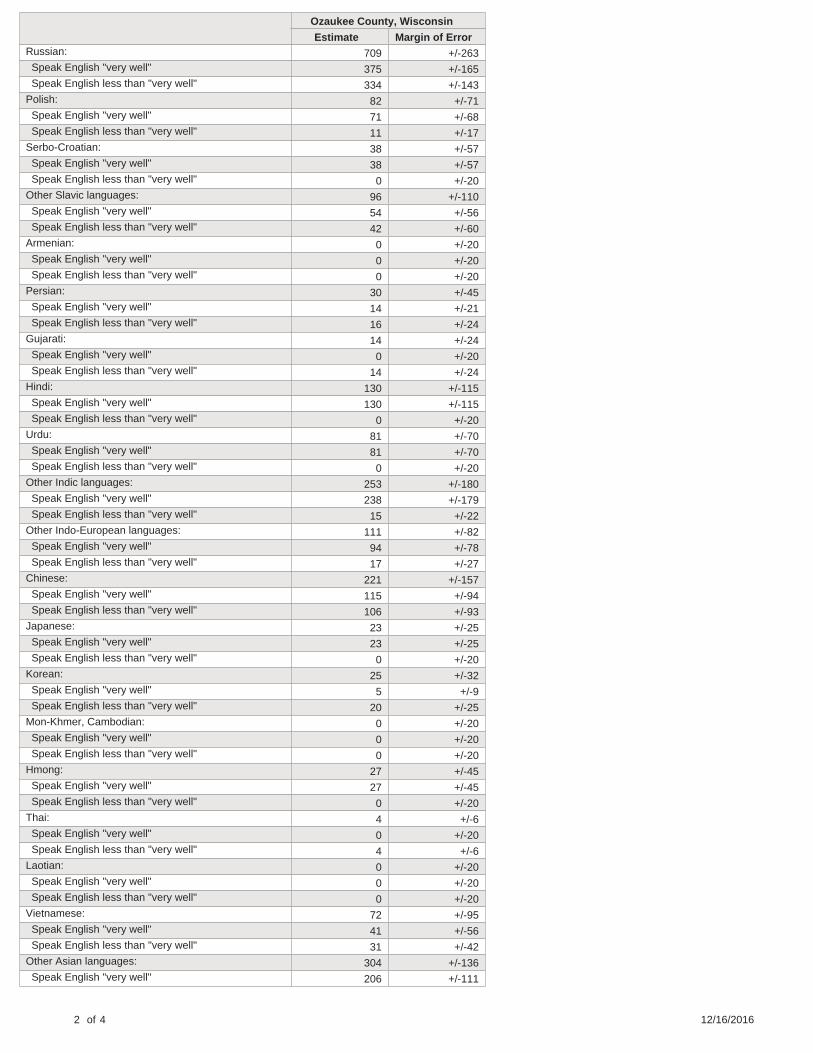
Ozaukee County, Wisconsin
Estimate Margin of Error Russian: 709 +/-263 Speak English "very well" 375 +/-165 Speak English less than "very well" 334 +/-143
Polish: 82 +/-71 Speak English "very well" 71 +/-68 Speak English less than "very well" 11 +/-17
Serbo-Croatian: 38 +/-57 Speak English "very well" 38 +/-57 Speak English less than "very well" 0 +/-20
Other Slavic languages: 96 +/-110 Speak English "very well" 54 +/-56 Speak English less than "very well" 42 +/-60
Armenian: 0 +/-20 Speak English "very well" 0 +/-20 Speak English less than "very well" 0 +/-20
Persian: 30 +/-45 Speak English "very well" 14 +/-21 Speak English less than "very well" 16 +/-24
Gujarati: 14 +/-24 Speak English "very well" 0 +/-20 Speak English less than "very well" 14 +/-24
Hindi: 130 +/-115 Speak English "very well" 130 +/-115 Speak English less than "very well" 0 +/-20
Urdu: 81 +/-70 Speak English "very well" 81 +/-70 Speak English less than "very well" 0 +/-20
Other Indic languages: 253 +/-180 Speak English "very well" 238 +/-179 Speak English less than "very well" 15 +/-22
Other Indo-European languages: 111 +/-82 Speak English "very well" 94 +/-78 Speak English less than "very well" 17 +/-27
Chinese: 221 +/-157 Speak English "very well" 115 +/-94 Speak English less than "very well" 106 +/-93
Japanese: 23 +/-25 Speak English "very well" 23 +/-25 Speak English less than "very well" 0 +/-20
Korean: 25 +/-32 Speak English "very well" 5 +/-9 Speak English less than "very well" 20 +/-25
Mon-Khmer, Cambodian: 0 +/-20 Speak English "very well" 0 +/-20 Speak English less than "very well" 0 +/-20
Hmong: 27 +/-45 Speak English "very well" 27 +/-45 Speak English less than "very well" 0 +/-20
Thai: 4 +/-6 Speak English "very well" 0 +/-20 Speak English less than "very well" 4 +/-6
Laotian: 0 +/-20 Speak English "very well" 0 +/-20 Speak English less than "very well" 0 +/-20
Vietnamese: 72 +/-95 Speak English "very well" 41 +/-56 Speak English less than "very well" 31 +/-42
Other Asian languages: 304 +/-136 Speak English "very well" 206 +/-111
2 of 4 12/16/2016

Ozaukee County, Wisconsin
Estimate Margin of Error Speak English less than "very well" 98 +/-72
Tagalog: 14 +/-17 Speak English "very well" 14 +/-17 Speak English less than "very well" 0 +/-20
Other Pacific Island languages: 4 +/-7 Speak English "very well" 4 +/-7 Speak English less than "very well" 0 +/-20
Navajo: 0 +/-20 Speak English "very well" 0 +/-20 Speak English less than "very well" 0 +/-20
Other Native North American languages: 6 +/-9 Speak English "very well" 3 +/-5 Speak English less than "very well" 3 +/-5
Hungarian: 20 +/-23 Speak English "very well" 20 +/-23 Speak English less than "very well" 0 +/-20
Arabic: 136 +/-145 Speak English "very well" 18 +/-29 Speak English less than "very well" 118 +/-136
Hebrew: 35 +/-58 Speak English "very well" 35 +/-58 Speak English less than "very well" 0 +/-20
African languages: 29 +/-45 Speak English "very well" 29 +/-45 Speak English less than "very well" 0 +/-20
Other and unspecified languages: 15 +/-22 Speak English "very well" 15 +/-22 Speak English less than "very well" 0 +/-20
Data are based on a sample and are subject to sampling variability. The degree of uncertainty for an estimate arising from sampling variability is represented through the use of a margin of error. The value shown here is the 90 percent margin of error. The margin of error can be interpreted roughly as providing a 90 percent probability that the interval defined by the estimate minus the margin of error and the estimate plus the margin of error (the lower and upper confidence bounds) contains the true value. In addition to sampling variability, the ACS estimates are subject to nonsampling error (for a discussion of nonsampling variability, see Accuracy of the Data). The effect of nonsampling error is not represented in these tables.
Methodological changes to data collection in 2013 may have affected language data for 2013. Users should be aware of these changes when using multi-year data containing data from 2013. For more information, see: Language User Note.
While the 2011-2015 American Community Survey (ACS) data generally reflect the February 2013 Office of Management and Budget (OMB) definitions of metropolitan and micropolitan statistical areas; in certain instances the names, codes, and boundaries of the principal cities shown in ACS tables may differ from the OMB definitions due to differences in the effective dates of the geographic entities.
Estimates of urban and rural population, housing units, and characteristics reflect boundaries of urban areas defined based on Census 2010 data. As a result, data for urban and rural areas from the ACS do not necessarily reflect the results of ongoing urbanization.
Source: U.S. Census Bureau, 2011-2015 American Community Survey 5-Year Estimates
Explanation of Symbols:
1. An '**' entry in the margin of error column indicates that either no sample observations or too few sample observations were available to compute a standard error and thus the margin of error. A statistical test is not appropriate.
2. An '-' entry in the estimate column indicates that either no sample observations or too few sample observations were available to compute an estimate, or a ratio of medians cannot be calculated because one or both of the median estimates falls in the lowest interval or upper interval of an open-ended distribution.
3. An '-' following a median estimate means the median falls in the lowest interval of an open-ended distribution. 4. An '+' following a median estimate means the median falls in the upper interval of an open-ended distribution. 5. An '***' entry in the margin of error column indicates that the median falls in the lowest interval or upper interval of an open-ended distribution. A
statistical test is not appropriate. 6. An '*****' entry in the margin of error column indicates that the estimate is controlled. A statistical test for sampling variability is not appropriate.
3 of 4 12/16/2016

7. An 'N' entry in the estimate and margin of error columns indicates that data for this geographic area cannot be displayed because the number of sample cases is too small.
8. An '(X)' means that the estimate is not applicable or not available.

B16001 LANGUAGE SPOKEN AT HOME BY ABILITY TO SPEAK ENGLISH FOR THE POPULATION 5 YEARS AND OVER Universe: Population 5 years and over 2011-2015 American Community Survey 5-Year Estimates
Supporting documentation on code lists, subject definitions, data accuracy, and statistical testing can be found on the American Community Survey website in the Data and Documentation section.
Sample size and data quality measures (including coverage rates, allocation rates, and response rates) can be found on the American Community Survey website in the Methodology section.
Tell us what you think. Provide feedback to help make American Community Survey data more useful for you.
Although the American Community Survey (ACS) produces population, demographic and housing unit estimates, it is the Census Bureau's Population Estimates Program that produces and disseminates the official estimates of the population for the nation, states, counties, cities and towns and estimates of housing units for states and counties.
Pepin County, Wisconsin
Estimate Margin of Error Total: 6,956 +/-12 Speak only English 6,561 +/-95 Spanish or Spanish Creole: 85 +/-20 Speak English "very well" 55 +/-22 Speak English less than "very well" 30 +/-16
French (incl. Patois, Cajun): 5 +/-5 Speak English "very well" 5 +/-5 Speak English less than "very well" 0 +/-12
French Creole: 0 +/-12 Speak English "very well" 0 +/-12 Speak English less than "very well" 0 +/-12
Italian: 0 +/-12 Speak English "very well" 0 +/-12 Speak English less than "very well" 0 +/-12
Portuguese or Portuguese Creole: 0 +/-12 Speak English "very well" 0 +/-12 Speak English less than "very well" 0 +/-12
German: 131 +/-72 Speak English "very well" 122 +/-72 Speak English less than "very well" 9 +/-10
Yiddish: 0 +/-12 Speak English "very well" 0 +/-12 Speak English less than "very well" 0 +/-12
Other West Germanic languages: 139 +/-60 Speak English "very well" 66 +/-33 Speak English less than "very well" 73 +/-42
Scandinavian languages: 2 +/-3 Speak English "very well" 2 +/-3 Speak English less than "very well" 0 +/-12
Greek: 0 +/-12 Speak English "very well" 0 +/-12 Speak English less than "very well" 0 +/-12
1 of 4 12/16/2016

Pepin County, Wisconsin
Estimate Margin of Error Russian: 0 +/-12 Speak English "very well" 0 +/-12 Speak English less than "very well" 0 +/-12
Polish: 0 +/-12 Speak English "very well" 0 +/-12 Speak English less than "very well" 0 +/-12
Serbo-Croatian: 8 +/-11 Speak English "very well" 1 +/-2 Speak English less than "very well" 7 +/-10
Other Slavic languages: 7 +/-8 Speak English "very well" 5 +/-6 Speak English less than "very well" 2 +/-5
Armenian: 0 +/-12 Speak English "very well" 0 +/-12 Speak English less than "very well" 0 +/-12
Persian: 0 +/-12 Speak English "very well" 0 +/-12 Speak English less than "very well" 0 +/-12
Gujarati: 0 +/-12 Speak English "very well" 0 +/-12 Speak English less than "very well" 0 +/-12
Hindi: 0 +/-12 Speak English "very well" 0 +/-12 Speak English less than "very well" 0 +/-12
Urdu: 0 +/-12 Speak English "very well" 0 +/-12 Speak English less than "very well" 0 +/-12
Other Indic languages: 0 +/-12 Speak English "very well" 0 +/-12 Speak English less than "very well" 0 +/-12
Other Indo-European languages: 0 +/-12 Speak English "very well" 0 +/-12 Speak English less than "very well" 0 +/-12
Chinese: 0 +/-12 Speak English "very well" 0 +/-12 Speak English less than "very well" 0 +/-12
Japanese: 0 +/-12 Speak English "very well" 0 +/-12 Speak English less than "very well" 0 +/-12
Korean: 7 +/-7 Speak English "very well" 0 +/-12 Speak English less than "very well" 7 +/-7
Mon-Khmer, Cambodian: 0 +/-12 Speak English "very well" 0 +/-12 Speak English less than "very well" 0 +/-12
Hmong: 0 +/-12 Speak English "very well" 0 +/-12 Speak English less than "very well" 0 +/-12
Thai: 0 +/-12 Speak English "very well" 0 +/-12 Speak English less than "very well" 0 +/-12
Laotian: 0 +/-12 Speak English "very well" 0 +/-12 Speak English less than "very well" 0 +/-12
Vietnamese: 0 +/-12 Speak English "very well" 0 +/-12 Speak English less than "very well" 0 +/-12
Other Asian languages: 0 +/-12 Speak English "very well" 0 +/-12
2 of 4 12/16/2016

Pepin County, Wisconsin
Estimate Margin of Error Speak English less than "very well" 0 +/-12
Tagalog: 3 +/-4 Speak English "very well" 3 +/-4 Speak English less than "very well" 0 +/-12
Other Pacific Island languages: 8 +/-10 Speak English "very well" 8 +/-10 Speak English less than "very well" 0 +/-12
Navajo: 0 +/-12 Speak English "very well" 0 +/-12 Speak English less than "very well" 0 +/-12
Other Native North American languages: 0 +/-12 Speak English "very well" 0 +/-12 Speak English less than "very well" 0 +/-12
Hungarian: 0 +/-12 Speak English "very well" 0 +/-12 Speak English less than "very well" 0 +/-12
Arabic: 0 +/-12 Speak English "very well" 0 +/-12 Speak English less than "very well" 0 +/-12
Hebrew: 0 +/-12 Speak English "very well" 0 +/-12 Speak English less than "very well" 0 +/-12
African languages: 0 +/-12 Speak English "very well" 0 +/-12 Speak English less than "very well" 0 +/-12
Other and unspecified languages: 0 +/-12 Speak English "very well" 0 +/-12 Speak English less than "very well" 0 +/-12
Data are based on a sample and are subject to sampling variability. The degree of uncertainty for an estimate arising from sampling variability is represented through the use of a margin of error. The value shown here is the 90 percent margin of error. The margin of error can be interpreted roughly as providing a 90 percent probability that the interval defined by the estimate minus the margin of error and the estimate plus the margin of error (the lower and upper confidence bounds) contains the true value. In addition to sampling variability, the ACS estimates are subject to nonsampling error (for a discussion of nonsampling variability, see Accuracy of the Data). The effect of nonsampling error is not represented in these tables.
Methodological changes to data collection in 2013 may have affected language data for 2013. Users should be aware of these changes when using multi-year data containing data from 2013. For more information, see: Language User Note.
While the 2011-2015 American Community Survey (ACS) data generally reflect the February 2013 Office of Management and Budget (OMB) definitions of metropolitan and micropolitan statistical areas; in certain instances the names, codes, and boundaries of the principal cities shown in ACS tables may differ from the OMB definitions due to differences in the effective dates of the geographic entities.
Estimates of urban and rural population, housing units, and characteristics reflect boundaries of urban areas defined based on Census 2010 data. As a result, data for urban and rural areas from the ACS do not necessarily reflect the results of ongoing urbanization.
Source: U.S. Census Bureau, 2011-2015 American Community Survey 5-Year Estimates
Explanation of Symbols:
1. An '**' entry in the margin of error column indicates that either no sample observations or too few sample observations were available to compute a standard error and thus the margin of error. A statistical test is not appropriate.
2. An '-' entry in the estimate column indicates that either no sample observations or too few sample observations were available to compute an estimate, or a ratio of medians cannot be calculated because one or both of the median estimates falls in the lowest interval or upper interval of an open-ended distribution.
3. An '-' following a median estimate means the median falls in the lowest interval of an open-ended distribution. 4. An '+' following a median estimate means the median falls in the upper interval of an open-ended distribution. 5. An '***' entry in the margin of error column indicates that the median falls in the lowest interval or upper interval of an open-ended distribution. A
statistical test is not appropriate. 6. An '*****' entry in the margin of error column indicates that the estimate is controlled. A statistical test for sampling variability is not appropriate.
3 of 4 12/16/2016

7. An 'N' entry in the estimate and margin of error columns indicates that data for this geographic area cannot be displayed because the number of sample cases is too small.
8. An '(X)' means that the estimate is not applicable or not available.

B16001 LANGUAGE SPOKEN AT HOME BY ABILITY TO SPEAK ENGLISH FOR THE POPULATION 5 YEARS AND OVER Universe: Population 5 years and over 2011-2015 American Community Survey 5-Year Estimates
Supporting documentation on code lists, subject definitions, data accuracy, and statistical testing can be found on the American Community Survey website in the Data and Documentation section.
Sample size and data quality measures (including coverage rates, allocation rates, and response rates) can be found on the American Community Survey website in the Methodology section.
Tell us what you think. Provide feedback to help make American Community Survey data more useful for you.
Although the American Community Survey (ACS) produces population, demographic and housing unit estimates, it is the Census Bureau's Population Estimates Program that produces and disseminates the official estimates of the population for the nation, states, counties, cities and towns and estimates of housing units for states and counties.
Pierce County, Wisconsin
Estimate Margin of Error Total: 38,628 +/-34 Speak only English 37,357 +/-167 Spanish or Spanish Creole: 498 +/-100 Speak English "very well" 347 +/-80 Speak English less than "very well" 151 +/-66
French (incl. Patois, Cajun): 50 +/-35 Speak English "very well" 50 +/-35 Speak English less than "very well" 0 +/-18
French Creole: 0 +/-18 Speak English "very well" 0 +/-18 Speak English less than "very well" 0 +/-18
Italian: 2 +/-4 Speak English "very well" 2 +/-4 Speak English less than "very well" 0 +/-18
Portuguese or Portuguese Creole: 74 +/-47 Speak English "very well" 9 +/-13 Speak English less than "very well" 65 +/-39
German: 127 +/-57 Speak English "very well" 108 +/-54 Speak English less than "very well" 19 +/-21
Yiddish: 0 +/-18 Speak English "very well" 0 +/-18 Speak English less than "very well" 0 +/-18
Other West Germanic languages: 19 +/-23 Speak English "very well" 17 +/-22 Speak English less than "very well" 2 +/-4
Scandinavian languages: 44 +/-33 Speak English "very well" 28 +/-24 Speak English less than "very well" 16 +/-21
Greek: 0 +/-18 Speak English "very well" 0 +/-18 Speak English less than "very well" 0 +/-18
1 of 4 12/16/2016

Pierce County, Wisconsin
Estimate Margin of Error Russian: 24 +/-28 Speak English "very well" 23 +/-29 Speak English less than "very well" 1 +/-2
Polish: 1 +/-3 Speak English "very well" 1 +/-3 Speak English less than "very well" 0 +/-18
Serbo-Croatian: 0 +/-18 Speak English "very well" 0 +/-18 Speak English less than "very well" 0 +/-18
Other Slavic languages: 4 +/-4 Speak English "very well" 2 +/-3 Speak English less than "very well" 2 +/-4
Armenian: 0 +/-18 Speak English "very well" 0 +/-18 Speak English less than "very well" 0 +/-18
Persian: 0 +/-18 Speak English "very well" 0 +/-18 Speak English less than "very well" 0 +/-18
Gujarati: 0 +/-18 Speak English "very well" 0 +/-18 Speak English less than "very well" 0 +/-18
Hindi: 0 +/-18 Speak English "very well" 0 +/-18 Speak English less than "very well" 0 +/-18
Urdu: 0 +/-18 Speak English "very well" 0 +/-18 Speak English less than "very well" 0 +/-18
Other Indic languages: 39 +/-50 Speak English "very well" 35 +/-44 Speak English less than "very well" 4 +/-8
Other Indo-European languages: 0 +/-18 Speak English "very well" 0 +/-18 Speak English less than "very well" 0 +/-18
Chinese: 187 +/-127 Speak English "very well" 24 +/-22 Speak English less than "very well" 163 +/-127
Japanese: 3 +/-4 Speak English "very well" 3 +/-4 Speak English less than "very well" 0 +/-18
Korean: 6 +/-12 Speak English "very well" 0 +/-18 Speak English less than "very well" 6 +/-12
Mon-Khmer, Cambodian: 0 +/-18 Speak English "very well" 0 +/-18 Speak English less than "very well" 0 +/-18
Hmong: 139 +/-90 Speak English "very well" 85 +/-42 Speak English less than "very well" 54 +/-86
Thai: 0 +/-18 Speak English "very well" 0 +/-18 Speak English less than "very well" 0 +/-18
Laotian: 0 +/-18 Speak English "very well" 0 +/-18 Speak English less than "very well" 0 +/-18
Vietnamese: 0 +/-18 Speak English "very well" 0 +/-18 Speak English less than "very well" 0 +/-18
Other Asian languages: 0 +/-18 Speak English "very well" 0 +/-18
2 of 4 12/16/2016

Pierce County, Wisconsin
Estimate Margin of Error Speak English less than "very well" 0 +/-18
Tagalog: 25 +/-20 Speak English "very well" 25 +/-20 Speak English less than "very well" 0 +/-18
Other Pacific Island languages: 9 +/-19 Speak English "very well" 9 +/-19 Speak English less than "very well" 0 +/-18
Navajo: 0 +/-18 Speak English "very well" 0 +/-18 Speak English less than "very well" 0 +/-18
Other Native North American languages: 5 +/-5 Speak English "very well" 5 +/-5 Speak English less than "very well" 0 +/-18
Hungarian: 0 +/-18 Speak English "very well" 0 +/-18 Speak English less than "very well" 0 +/-18
Arabic: 0 +/-18 Speak English "very well" 0 +/-18 Speak English less than "very well" 0 +/-18
Hebrew: 0 +/-18 Speak English "very well" 0 +/-18 Speak English less than "very well" 0 +/-18
African languages: 12 +/-14 Speak English "very well" 12 +/-14 Speak English less than "very well" 0 +/-18
Other and unspecified languages: 3 +/-4 Speak English "very well" 3 +/-4 Speak English less than "very well" 0 +/-18
Data are based on a sample and are subject to sampling variability. The degree of uncertainty for an estimate arising from sampling variability is represented through the use of a margin of error. The value shown here is the 90 percent margin of error. The margin of error can be interpreted roughly as providing a 90 percent probability that the interval defined by the estimate minus the margin of error and the estimate plus the margin of error (the lower and upper confidence bounds) contains the true value. In addition to sampling variability, the ACS estimates are subject to nonsampling error (for a discussion of nonsampling variability, see Accuracy of the Data). The effect of nonsampling error is not represented in these tables.
Methodological changes to data collection in 2013 may have affected language data for 2013. Users should be aware of these changes when using multi-year data containing data from 2013. For more information, see: Language User Note.
While the 2011-2015 American Community Survey (ACS) data generally reflect the February 2013 Office of Management and Budget (OMB) definitions of metropolitan and micropolitan statistical areas; in certain instances the names, codes, and boundaries of the principal cities shown in ACS tables may differ from the OMB definitions due to differences in the effective dates of the geographic entities.
Estimates of urban and rural population, housing units, and characteristics reflect boundaries of urban areas defined based on Census 2010 data. As a result, data for urban and rural areas from the ACS do not necessarily reflect the results of ongoing urbanization.
Source: U.S. Census Bureau, 2011-2015 American Community Survey 5-Year Estimates
Explanation of Symbols:
1. An '**' entry in the margin of error column indicates that either no sample observations or too few sample observations were available to compute a standard error and thus the margin of error. A statistical test is not appropriate.
2. An '-' entry in the estimate column indicates that either no sample observations or too few sample observations were available to compute an estimate, or a ratio of medians cannot be calculated because one or both of the median estimates falls in the lowest interval or upper interval of an open-ended distribution.
3. An '-' following a median estimate means the median falls in the lowest interval of an open-ended distribution. 4. An '+' following a median estimate means the median falls in the upper interval of an open-ended distribution. 5. An '***' entry in the margin of error column indicates that the median falls in the lowest interval or upper interval of an open-ended distribution. A
statistical test is not appropriate. 6. An '*****' entry in the margin of error column indicates that the estimate is controlled. A statistical test for sampling variability is not appropriate.
3 of 4 12/16/2016

7. An 'N' entry in the estimate and margin of error columns indicates that data for this geographic area cannot be displayed because the number of sample cases is too small.
8. An '(X)' means that the estimate is not applicable or not available.

B16001 LANGUAGE SPOKEN AT HOME BY ABILITY TO SPEAK ENGLISH FOR THE POPULATION 5 YEARS AND OVER Universe: Population 5 years and over 2011-2015 American Community Survey 5-Year Estimates
Supporting documentation on code lists, subject definitions, data accuracy, and statistical testing can be found on the American Community Survey website in the Data and Documentation section.
Sample size and data quality measures (including coverage rates, allocation rates, and response rates) can be found on the American Community Survey website in the Methodology section.
Tell us what you think. Provide feedback to help make American Community Survey data more useful for you.
Although the American Community Survey (ACS) produces population, demographic and housing unit estimates, it is the Census Bureau's Population Estimates Program that produces and disseminates the official estimates of the population for the nation, states, counties, cities and towns and estimates of housing units for states and counties.
Polk County, Wisconsin
Estimate Margin of Error Total: 41,230 +/-33 Speak only English 40,095 +/-143 Spanish or Spanish Creole: 550 +/-107 Speak English "very well" 297 +/-65 Speak English less than "very well" 253 +/-99
French (incl. Patois, Cajun): 41 +/-27 Speak English "very well" 25 +/-21 Speak English less than "very well" 16 +/-16
French Creole: 0 +/-18 Speak English "very well" 0 +/-18 Speak English less than "very well" 0 +/-18
Italian: 5 +/-6 Speak English "very well" 2 +/-3 Speak English less than "very well" 3 +/-5
Portuguese or Portuguese Creole: 3 +/-4 Speak English "very well" 3 +/-4 Speak English less than "very well" 0 +/-18
German: 182 +/-59 Speak English "very well" 154 +/-54 Speak English less than "very well" 28 +/-15
Yiddish: 0 +/-18 Speak English "very well" 0 +/-18 Speak English less than "very well" 0 +/-18
Other West Germanic languages: 29 +/-23 Speak English "very well" 18 +/-19 Speak English less than "very well" 11 +/-13
Scandinavian languages: 34 +/-22 Speak English "very well" 30 +/-19 Speak English less than "very well" 4 +/-5
Greek: 0 +/-18 Speak English "very well" 0 +/-18 Speak English less than "very well" 0 +/-18
1 of 4 12/16/2016

Polk County, Wisconsin
Estimate Margin of Error Russian: 46 +/-46 Speak English "very well" 39 +/-46 Speak English less than "very well" 7 +/-7
Polish: 3 +/-4 Speak English "very well" 3 +/-4 Speak English less than "very well" 0 +/-18
Serbo-Croatian: 11 +/-16 Speak English "very well" 6 +/-8 Speak English less than "very well" 5 +/-9
Other Slavic languages: 10 +/-12 Speak English "very well" 6 +/-7 Speak English less than "very well" 4 +/-6
Armenian: 0 +/-18 Speak English "very well" 0 +/-18 Speak English less than "very well" 0 +/-18
Persian: 0 +/-18 Speak English "very well" 0 +/-18 Speak English less than "very well" 0 +/-18
Gujarati: 0 +/-18 Speak English "very well" 0 +/-18 Speak English less than "very well" 0 +/-18
Hindi: 0 +/-18 Speak English "very well" 0 +/-18 Speak English less than "very well" 0 +/-18
Urdu: 10 +/-14 Speak English "very well" 6 +/-8 Speak English less than "very well" 4 +/-5
Other Indic languages: 8 +/-13 Speak English "very well" 7 +/-12 Speak English less than "very well" 1 +/-4
Other Indo-European languages: 10 +/-8 Speak English "very well" 6 +/-7 Speak English less than "very well" 4 +/-5
Chinese: 57 +/-62 Speak English "very well" 24 +/-29 Speak English less than "very well" 33 +/-34
Japanese: 10 +/-8 Speak English "very well" 8 +/-8 Speak English less than "very well" 2 +/-3
Korean: 0 +/-18 Speak English "very well" 0 +/-18 Speak English less than "very well" 0 +/-18
Mon-Khmer, Cambodian: 0 +/-18 Speak English "very well" 0 +/-18 Speak English less than "very well" 0 +/-18
Hmong: 7 +/-9 Speak English "very well" 0 +/-18 Speak English less than "very well" 7 +/-9
Thai: 4 +/-8 Speak English "very well" 0 +/-18 Speak English less than "very well" 4 +/-8
Laotian: 0 +/-18 Speak English "very well" 0 +/-18 Speak English less than "very well" 0 +/-18
Vietnamese: 6 +/-7 Speak English "very well" 2 +/-3 Speak English less than "very well" 4 +/-7
Other Asian languages: 0 +/-18 Speak English "very well" 0 +/-18
2 of 4 12/16/2016

Polk County, Wisconsin
Estimate Margin of Error Speak English less than "very well" 0 +/-18
Tagalog: 30 +/-18 Speak English "very well" 25 +/-16 Speak English less than "very well" 5 +/-7
Other Pacific Island languages: 10 +/-9 Speak English "very well" 7 +/-7 Speak English less than "very well" 3 +/-5
Navajo: 0 +/-18 Speak English "very well" 0 +/-18 Speak English less than "very well" 0 +/-18
Other Native North American languages: 54 +/-27 Speak English "very well" 38 +/-26 Speak English less than "very well" 16 +/-15
Hungarian: 4 +/-5 Speak English "very well" 2 +/-3 Speak English less than "very well" 2 +/-3
Arabic: 6 +/-8 Speak English "very well" 6 +/-8 Speak English less than "very well" 0 +/-18
Hebrew: 0 +/-18 Speak English "very well" 0 +/-18 Speak English less than "very well" 0 +/-18
African languages: 0 +/-18 Speak English "very well" 0 +/-18 Speak English less than "very well" 0 +/-18
Other and unspecified languages: 5 +/-7 Speak English "very well" 5 +/-7 Speak English less than "very well" 0 +/-18
Data are based on a sample and are subject to sampling variability. The degree of uncertainty for an estimate arising from sampling variability is represented through the use of a margin of error. The value shown here is the 90 percent margin of error. The margin of error can be interpreted roughly as providing a 90 percent probability that the interval defined by the estimate minus the margin of error and the estimate plus the margin of error (the lower and upper confidence bounds) contains the true value. In addition to sampling variability, the ACS estimates are subject to nonsampling error (for a discussion of nonsampling variability, see Accuracy of the Data). The effect of nonsampling error is not represented in these tables.
Methodological changes to data collection in 2013 may have affected language data for 2013. Users should be aware of these changes when using multi-year data containing data from 2013. For more information, see: Language User Note.
While the 2011-2015 American Community Survey (ACS) data generally reflect the February 2013 Office of Management and Budget (OMB) definitions of metropolitan and micropolitan statistical areas; in certain instances the names, codes, and boundaries of the principal cities shown in ACS tables may differ from the OMB definitions due to differences in the effective dates of the geographic entities.
Estimates of urban and rural population, housing units, and characteristics reflect boundaries of urban areas defined based on Census 2010 data. As a result, data for urban and rural areas from the ACS do not necessarily reflect the results of ongoing urbanization.
Source: U.S. Census Bureau, 2011-2015 American Community Survey 5-Year Estimates
Explanation of Symbols:
1. An '**' entry in the margin of error column indicates that either no sample observations or too few sample observations were available to compute a standard error and thus the margin of error. A statistical test is not appropriate.
2. An '-' entry in the estimate column indicates that either no sample observations or too few sample observations were available to compute an estimate, or a ratio of medians cannot be calculated because one or both of the median estimates falls in the lowest interval or upper interval of an open-ended distribution.
3. An '-' following a median estimate means the median falls in the lowest interval of an open-ended distribution. 4. An '+' following a median estimate means the median falls in the upper interval of an open-ended distribution. 5. An '***' entry in the margin of error column indicates that the median falls in the lowest interval or upper interval of an open-ended distribution. A
statistical test is not appropriate. 6. An '*****' entry in the margin of error column indicates that the estimate is controlled. A statistical test for sampling variability is not appropriate.
3 of 4 12/16/2016

7. An 'N' entry in the estimate and margin of error columns indicates that data for this geographic area cannot be displayed because the number of sample cases is too small.
8. An '(X)' means that the estimate is not applicable or not available.

B16001 LANGUAGE SPOKEN AT HOME BY ABILITY TO SPEAK ENGLISH FOR THE POPULATION 5 YEARS AND OVER Universe: Population 5 years and over 2011-2015 American Community Survey 5-Year Estimates
Supporting documentation on code lists, subject definitions, data accuracy, and statistical testing can be found on the American Community Survey website in the Data and Documentation section.
Sample size and data quality measures (including coverage rates, allocation rates, and response rates) can be found on the American Community Survey website in the Methodology section.
Tell us what you think. Provide feedback to help make American Community Survey data more useful for you.
Although the American Community Survey (ACS) produces population, demographic and housing unit estimates, it is the Census Bureau's Population Estimates Program that produces and disseminates the official estimates of the population for the nation, states, counties, cities and towns and estimates of housing units for states and counties.
Portage County, Wisconsin
Estimate Margin of Error Total: 66,801 +/-82 Speak only English 62,872 +/-339 Spanish or Spanish Creole: 1,341 +/-212 Speak English "very well" 781 +/-128 Speak English less than "very well" 560 +/-215
French (incl. Patois, Cajun): 54 +/-28 Speak English "very well" 51 +/-27 Speak English less than "very well" 3 +/-5
French Creole: 0 +/-20 Speak English "very well" 0 +/-20 Speak English less than "very well" 0 +/-20
Italian: 13 +/-14 Speak English "very well" 13 +/-14 Speak English less than "very well" 0 +/-20
Portuguese or Portuguese Creole: 6 +/-9 Speak English "very well" 6 +/-9 Speak English less than "very well" 0 +/-20
German: 350 +/-128 Speak English "very well" 342 +/-128 Speak English less than "very well" 8 +/-7
Yiddish: 0 +/-20 Speak English "very well" 0 +/-20 Speak English less than "very well" 0 +/-20
Other West Germanic languages: 2 +/-4 Speak English "very well" 2 +/-4 Speak English less than "very well" 0 +/-20
Scandinavian languages: 20 +/-19 Speak English "very well" 8 +/-7 Speak English less than "very well" 12 +/-20
Greek: 0 +/-20 Speak English "very well" 0 +/-20 Speak English less than "very well" 0 +/-20
1 of 4 12/16/2016
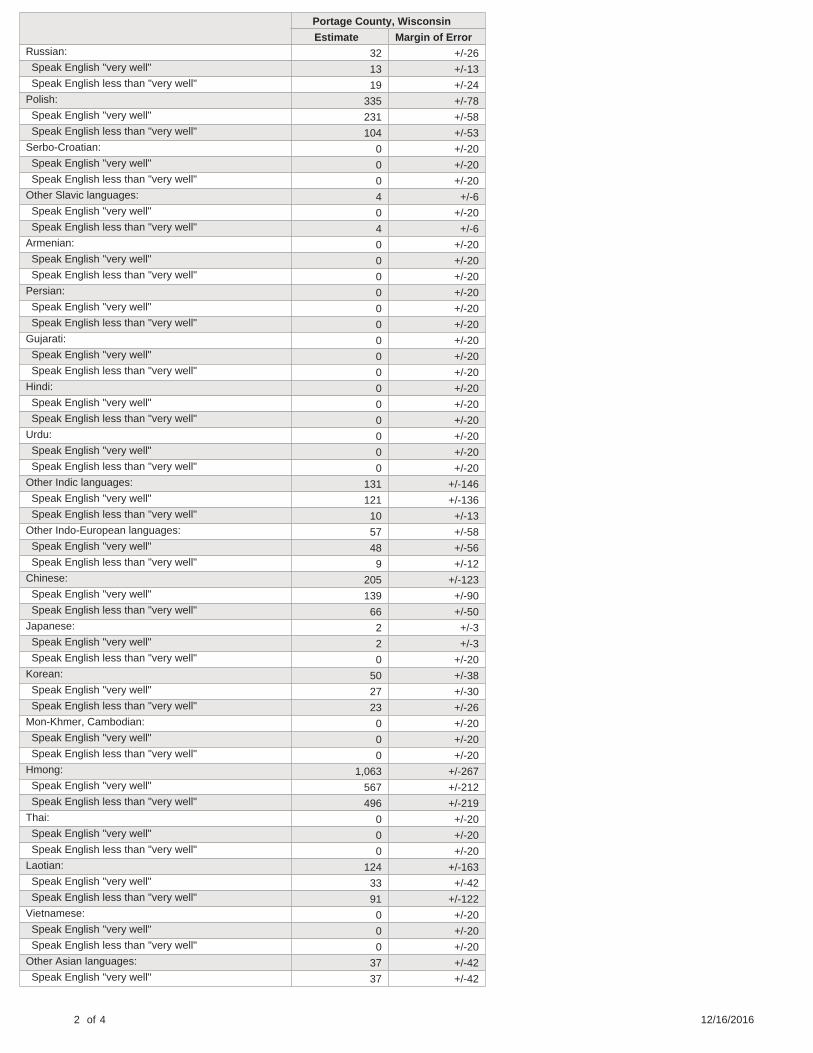
Portage County, Wisconsin
Estimate Margin of Error Russian: 32 +/-26 Speak English "very well" 13 +/-13 Speak English less than "very well" 19 +/-24
Polish: 335 +/-78 Speak English "very well" 231 +/-58 Speak English less than "very well" 104 +/-53
Serbo-Croatian: 0 +/-20 Speak English "very well" 0 +/-20 Speak English less than "very well" 0 +/-20
Other Slavic languages: 4 +/-6 Speak English "very well" 0 +/-20 Speak English less than "very well" 4 +/-6
Armenian: 0 +/-20 Speak English "very well" 0 +/-20 Speak English less than "very well" 0 +/-20
Persian: 0 +/-20 Speak English "very well" 0 +/-20 Speak English less than "very well" 0 +/-20
Gujarati: 0 +/-20 Speak English "very well" 0 +/-20 Speak English less than "very well" 0 +/-20
Hindi: 0 +/-20 Speak English "very well" 0 +/-20 Speak English less than "very well" 0 +/-20
Urdu: 0 +/-20 Speak English "very well" 0 +/-20 Speak English less than "very well" 0 +/-20
Other Indic languages: 131 +/-146 Speak English "very well" 121 +/-136 Speak English less than "very well" 10 +/-13
Other Indo-European languages: 57 +/-58 Speak English "very well" 48 +/-56 Speak English less than "very well" 9 +/-12
Chinese: 205 +/-123 Speak English "very well" 139 +/-90 Speak English less than "very well" 66 +/-50
Japanese: 2 +/-3 Speak English "very well" 2 +/-3 Speak English less than "very well" 0 +/-20
Korean: 50 +/-38 Speak English "very well" 27 +/-30 Speak English less than "very well" 23 +/-26
Mon-Khmer, Cambodian: 0 +/-20 Speak English "very well" 0 +/-20 Speak English less than "very well" 0 +/-20
Hmong: 1,063 +/-267 Speak English "very well" 567 +/-212 Speak English less than "very well" 496 +/-219
Thai: 0 +/-20 Speak English "very well" 0 +/-20 Speak English less than "very well" 0 +/-20
Laotian: 124 +/-163 Speak English "very well" 33 +/-42 Speak English less than "very well" 91 +/-122
Vietnamese: 0 +/-20 Speak English "very well" 0 +/-20 Speak English less than "very well" 0 +/-20
Other Asian languages: 37 +/-42 Speak English "very well" 37 +/-42
2 of 4 12/16/2016

Portage County, Wisconsin
Estimate Margin of Error Speak English less than "very well" 0 +/-20
Tagalog: 9 +/-14 Speak English "very well" 9 +/-14 Speak English less than "very well" 0 +/-20
Other Pacific Island languages: 0 +/-20 Speak English "very well" 0 +/-20 Speak English less than "very well" 0 +/-20
Navajo: 0 +/-20 Speak English "very well" 0 +/-20 Speak English less than "very well" 0 +/-20
Other Native North American languages: 10 +/-15 Speak English "very well" 10 +/-15 Speak English less than "very well" 0 +/-20
Hungarian: 0 +/-20 Speak English "very well" 0 +/-20 Speak English less than "very well" 0 +/-20
Arabic: 31 +/-48 Speak English "very well" 31 +/-48 Speak English less than "very well" 0 +/-20
Hebrew: 0 +/-20 Speak English "very well" 0 +/-20 Speak English less than "very well" 0 +/-20
African languages: 34 +/-53 Speak English "very well" 34 +/-53 Speak English less than "very well" 0 +/-20
Other and unspecified languages: 19 +/-22 Speak English "very well" 19 +/-22 Speak English less than "very well" 0 +/-20
Data are based on a sample and are subject to sampling variability. The degree of uncertainty for an estimate arising from sampling variability is represented through the use of a margin of error. The value shown here is the 90 percent margin of error. The margin of error can be interpreted roughly as providing a 90 percent probability that the interval defined by the estimate minus the margin of error and the estimate plus the margin of error (the lower and upper confidence bounds) contains the true value. In addition to sampling variability, the ACS estimates are subject to nonsampling error (for a discussion of nonsampling variability, see Accuracy of the Data). The effect of nonsampling error is not represented in these tables.
Methodological changes to data collection in 2013 may have affected language data for 2013. Users should be aware of these changes when using multi-year data containing data from 2013. For more information, see: Language User Note.
While the 2011-2015 American Community Survey (ACS) data generally reflect the February 2013 Office of Management and Budget (OMB) definitions of metropolitan and micropolitan statistical areas; in certain instances the names, codes, and boundaries of the principal cities shown in ACS tables may differ from the OMB definitions due to differences in the effective dates of the geographic entities.
Estimates of urban and rural population, housing units, and characteristics reflect boundaries of urban areas defined based on Census 2010 data. As a result, data for urban and rural areas from the ACS do not necessarily reflect the results of ongoing urbanization.
Source: U.S. Census Bureau, 2011-2015 American Community Survey 5-Year Estimates
Explanation of Symbols:
1. An '**' entry in the margin of error column indicates that either no sample observations or too few sample observations were available to compute a standard error and thus the margin of error. A statistical test is not appropriate.
2. An '-' entry in the estimate column indicates that either no sample observations or too few sample observations were available to compute an estimate, or a ratio of medians cannot be calculated because one or both of the median estimates falls in the lowest interval or upper interval of an open-ended distribution.
3. An '-' following a median estimate means the median falls in the lowest interval of an open-ended distribution. 4. An '+' following a median estimate means the median falls in the upper interval of an open-ended distribution. 5. An '***' entry in the margin of error column indicates that the median falls in the lowest interval or upper interval of an open-ended distribution. A
statistical test is not appropriate. 6. An '*****' entry in the margin of error column indicates that the estimate is controlled. A statistical test for sampling variability is not appropriate.
3 of 4 12/16/2016

7. An 'N' entry in the estimate and margin of error columns indicates that data for this geographic area cannot be displayed because the number of sample cases is too small.
8. An '(X)' means that the estimate is not applicable or not available.

B16001 LANGUAGE SPOKEN AT HOME BY ABILITY TO SPEAK ENGLISH FOR THE POPULATION 5 YEARS AND OVER Universe: Population 5 years and over 2011-2015 American Community Survey 5-Year Estimates
Supporting documentation on code lists, subject definitions, data accuracy, and statistical testing can be found on the American Community Survey website in the Data and Documentation section.
Sample size and data quality measures (including coverage rates, allocation rates, and response rates) can be found on the American Community Survey website in the Methodology section.
Tell us what you think. Provide feedback to help make American Community Survey data more useful for you.
Although the American Community Survey (ACS) produces population, demographic and housing unit estimates, it is the Census Bureau's Population Estimates Program that produces and disseminates the official estimates of the population for the nation, states, counties, cities and towns and estimates of housing units for states and counties.
Price County, Wisconsin
Estimate Margin of Error Total: 13,255 +/-16 Speak only English 12,894 +/-69 Spanish or Spanish Creole: 143 +/-41 Speak English "very well" 111 +/-38 Speak English less than "very well" 32 +/-21
French (incl. Patois, Cajun): 19 +/-13 Speak English "very well" 17 +/-13 Speak English less than "very well" 2 +/-2
French Creole: 0 +/-14 Speak English "very well" 0 +/-14 Speak English less than "very well" 0 +/-14
Italian: 4 +/-5 Speak English "very well" 0 +/-14 Speak English less than "very well" 4 +/-5
Portuguese or Portuguese Creole: 14 +/-17 Speak English "very well" 14 +/-17 Speak English less than "very well" 0 +/-14
German: 71 +/-38 Speak English "very well" 55 +/-31 Speak English less than "very well" 16 +/-15
Yiddish: 0 +/-14 Speak English "very well" 0 +/-14 Speak English less than "very well" 0 +/-14
Other West Germanic languages: 0 +/-14 Speak English "very well" 0 +/-14 Speak English less than "very well" 0 +/-14
Scandinavian languages: 2 +/-3 Speak English "very well" 2 +/-3 Speak English less than "very well" 0 +/-14
Greek: 0 +/-14 Speak English "very well" 0 +/-14 Speak English less than "very well" 0 +/-14
1 of 4 12/16/2016

Price County, Wisconsin
Estimate Margin of Error Russian: 0 +/-14 Speak English "very well" 0 +/-14 Speak English less than "very well" 0 +/-14
Polish: 4 +/-5 Speak English "very well" 4 +/-5 Speak English less than "very well" 0 +/-14
Serbo-Croatian: 2 +/-3 Speak English "very well" 0 +/-14 Speak English less than "very well" 2 +/-3
Other Slavic languages: 15 +/-8 Speak English "very well" 15 +/-8 Speak English less than "very well" 0 +/-14
Armenian: 0 +/-14 Speak English "very well" 0 +/-14 Speak English less than "very well" 0 +/-14
Persian: 0 +/-14 Speak English "very well" 0 +/-14 Speak English less than "very well" 0 +/-14
Gujarati: 0 +/-14 Speak English "very well" 0 +/-14 Speak English less than "very well" 0 +/-14
Hindi: 0 +/-14 Speak English "very well" 0 +/-14 Speak English less than "very well" 0 +/-14
Urdu: 2 +/-3 Speak English "very well" 2 +/-3 Speak English less than "very well" 0 +/-14
Other Indic languages: 0 +/-14 Speak English "very well" 0 +/-14 Speak English less than "very well" 0 +/-14
Other Indo-European languages: 0 +/-14 Speak English "very well" 0 +/-14 Speak English less than "very well" 0 +/-14
Chinese: 0 +/-14 Speak English "very well" 0 +/-14 Speak English less than "very well" 0 +/-14
Japanese: 0 +/-14 Speak English "very well" 0 +/-14 Speak English less than "very well" 0 +/-14
Korean: 0 +/-14 Speak English "very well" 0 +/-14 Speak English less than "very well" 0 +/-14
Mon-Khmer, Cambodian: 0 +/-14 Speak English "very well" 0 +/-14 Speak English less than "very well" 0 +/-14
Hmong: 0 +/-14 Speak English "very well" 0 +/-14 Speak English less than "very well" 0 +/-14
Thai: 1 +/-3 Speak English "very well" 1 +/-3 Speak English less than "very well" 0 +/-14
Laotian: 0 +/-14 Speak English "very well" 0 +/-14 Speak English less than "very well" 0 +/-14
Vietnamese: 0 +/-14 Speak English "very well" 0 +/-14 Speak English less than "very well" 0 +/-14
Other Asian languages: 45 +/-34 Speak English "very well" 1 +/-2
2 of 4 12/16/2016

Price County, Wisconsin
Estimate Margin of Error Speak English less than "very well" 44 +/-33
Tagalog: 6 +/-6 Speak English "very well" 0 +/-14 Speak English less than "very well" 6 +/-6
Other Pacific Island languages: 22 +/-29 Speak English "very well" 9 +/-14 Speak English less than "very well" 13 +/-27
Navajo: 0 +/-14 Speak English "very well" 0 +/-14 Speak English less than "very well" 0 +/-14
Other Native North American languages: 0 +/-14 Speak English "very well" 0 +/-14 Speak English less than "very well" 0 +/-14
Hungarian: 0 +/-14 Speak English "very well" 0 +/-14 Speak English less than "very well" 0 +/-14
Arabic: 0 +/-14 Speak English "very well" 0 +/-14 Speak English less than "very well" 0 +/-14
Hebrew: 0 +/-14 Speak English "very well" 0 +/-14 Speak English less than "very well" 0 +/-14
African languages: 0 +/-14 Speak English "very well" 0 +/-14 Speak English less than "very well" 0 +/-14
Other and unspecified languages: 11 +/-10 Speak English "very well" 9 +/-9 Speak English less than "very well" 2 +/-3
Data are based on a sample and are subject to sampling variability. The degree of uncertainty for an estimate arising from sampling variability is represented through the use of a margin of error. The value shown here is the 90 percent margin of error. The margin of error can be interpreted roughly as providing a 90 percent probability that the interval defined by the estimate minus the margin of error and the estimate plus the margin of error (the lower and upper confidence bounds) contains the true value. In addition to sampling variability, the ACS estimates are subject to nonsampling error (for a discussion of nonsampling variability, see Accuracy of the Data). The effect of nonsampling error is not represented in these tables.
Methodological changes to data collection in 2013 may have affected language data for 2013. Users should be aware of these changes when using multi-year data containing data from 2013. For more information, see: Language User Note.
While the 2011-2015 American Community Survey (ACS) data generally reflect the February 2013 Office of Management and Budget (OMB) definitions of metropolitan and micropolitan statistical areas; in certain instances the names, codes, and boundaries of the principal cities shown in ACS tables may differ from the OMB definitions due to differences in the effective dates of the geographic entities.
Estimates of urban and rural population, housing units, and characteristics reflect boundaries of urban areas defined based on Census 2010 data. As a result, data for urban and rural areas from the ACS do not necessarily reflect the results of ongoing urbanization.
Source: U.S. Census Bureau, 2011-2015 American Community Survey 5-Year Estimates
Explanation of Symbols:
1. An '**' entry in the margin of error column indicates that either no sample observations or too few sample observations were available to compute a standard error and thus the margin of error. A statistical test is not appropriate.
2. An '-' entry in the estimate column indicates that either no sample observations or too few sample observations were available to compute an estimate, or a ratio of medians cannot be calculated because one or both of the median estimates falls in the lowest interval or upper interval of an open-ended distribution.
3. An '-' following a median estimate means the median falls in the lowest interval of an open-ended distribution. 4. An '+' following a median estimate means the median falls in the upper interval of an open-ended distribution. 5. An '***' entry in the margin of error column indicates that the median falls in the lowest interval or upper interval of an open-ended distribution. A
statistical test is not appropriate. 6. An '*****' entry in the margin of error column indicates that the estimate is controlled. A statistical test for sampling variability is not appropriate.
3 of 4 12/16/2016

7. An 'N' entry in the estimate and margin of error columns indicates that data for this geographic area cannot be displayed because the number of sample cases is too small.
8. An '(X)' means that the estimate is not applicable or not available.

B16001 LANGUAGE SPOKEN AT HOME BY ABILITY TO SPEAK ENGLISH FOR THE POPULATION 5 YEARS AND OVER Universe: Population 5 years and over 2011-2015 American Community Survey 5-Year Estimates
Supporting documentation on code lists, subject definitions, data accuracy, and statistical testing can be found on the American Community Survey website in the Data and Documentation section.
Sample size and data quality measures (including coverage rates, allocation rates, and response rates) can be found on the American Community Survey website in the Methodology section.
Tell us what you think. Provide feedback to help make American Community Survey data more useful for you.
Although the American Community Survey (ACS) produces population, demographic and housing unit estimates, it is the Census Bureau's Population Estimates Program that produces and disseminates the official estimates of the population for the nation, states, counties, cities and towns and estimates of housing units for states and counties.
Racine County, Wisconsin
Estimate Margin of Error Total: 182,592 ***** Speak only English 167,874 +/-1,071 Spanish or Spanish Creole: 10,789 +/-915 Speak English "very well" 6,561 +/-593 Speak English less than "very well" 4,228 +/-518
French (incl. Patois, Cajun): 243 +/-121 Speak English "very well" 235 +/-121 Speak English less than "very well" 8 +/-11
French Creole: 0 +/-20 Speak English "very well" 0 +/-20 Speak English less than "very well" 0 +/-20
Italian: 125 +/-63 Speak English "very well" 107 +/-58 Speak English less than "very well" 18 +/-18
Portuguese or Portuguese Creole: 78 +/-92 Speak English "very well" 60 +/-64 Speak English less than "very well" 18 +/-28
German: 649 +/-167 Speak English "very well" 532 +/-142 Speak English less than "very well" 117 +/-63
Yiddish: 0 +/-20 Speak English "very well" 0 +/-20 Speak English less than "very well" 0 +/-20
Other West Germanic languages: 5 +/-8 Speak English "very well" 5 +/-8 Speak English less than "very well" 0 +/-20
Scandinavian languages: 47 +/-39 Speak English "very well" 26 +/-31 Speak English less than "very well" 21 +/-35
Greek: 53 +/-44 Speak English "very well" 27 +/-21 Speak English less than "very well" 26 +/-26
1 of 4 12/16/2016

Racine County, Wisconsin
Estimate Margin of Error Russian: 18 +/-20 Speak English "very well" 0 +/-20 Speak English less than "very well" 18 +/-20
Polish: 254 +/-167 Speak English "very well" 193 +/-149 Speak English less than "very well" 61 +/-65
Serbo-Croatian: 253 +/-107 Speak English "very well" 142 +/-73 Speak English less than "very well" 111 +/-80
Other Slavic languages: 137 +/-76 Speak English "very well" 94 +/-60 Speak English less than "very well" 43 +/-43
Armenian: 148 +/-100 Speak English "very well" 129 +/-93 Speak English less than "very well" 19 +/-23
Persian: 12 +/-11 Speak English "very well" 12 +/-11 Speak English less than "very well" 0 +/-20
Gujarati: 55 +/-74 Speak English "very well" 21 +/-26 Speak English less than "very well" 34 +/-49
Hindi: 20 +/-31 Speak English "very well" 0 +/-20 Speak English less than "very well" 20 +/-31
Urdu: 28 +/-34 Speak English "very well" 17 +/-26 Speak English less than "very well" 11 +/-18
Other Indic languages: 182 +/-168 Speak English "very well" 103 +/-93 Speak English less than "very well" 79 +/-78
Other Indo-European languages: 179 +/-130 Speak English "very well" 84 +/-61 Speak English less than "very well" 95 +/-80
Chinese: 455 +/-302 Speak English "very well" 142 +/-71 Speak English less than "very well" 313 +/-254
Japanese: 110 +/-59 Speak English "very well" 82 +/-53 Speak English less than "very well" 28 +/-30
Korean: 155 +/-114 Speak English "very well" 104 +/-100 Speak English less than "very well" 51 +/-45
Mon-Khmer, Cambodian: 0 +/-20 Speak English "very well" 0 +/-20 Speak English less than "very well" 0 +/-20
Hmong: 58 +/-54 Speak English "very well" 33 +/-34 Speak English less than "very well" 25 +/-31
Thai: 18 +/-26 Speak English "very well" 0 +/-20 Speak English less than "very well" 18 +/-26
Laotian: 43 +/-52 Speak English "very well" 34 +/-51 Speak English less than "very well" 9 +/-13
Vietnamese: 46 +/-52 Speak English "very well" 0 +/-20 Speak English less than "very well" 46 +/-52
Other Asian languages: 112 +/-56 Speak English "very well" 76 +/-58
2 of 4 12/16/2016

Racine County, Wisconsin
Estimate Margin of Error Speak English less than "very well" 36 +/-55
Tagalog: 145 +/-109 Speak English "very well" 133 +/-97 Speak English less than "very well" 12 +/-14
Other Pacific Island languages: 9 +/-15 Speak English "very well" 9 +/-15 Speak English less than "very well" 0 +/-20
Navajo: 0 +/-20 Speak English "very well" 0 +/-20 Speak English less than "very well" 0 +/-20
Other Native North American languages: 41 +/-66 Speak English "very well" 41 +/-66 Speak English less than "very well" 0 +/-20
Hungarian: 22 +/-27 Speak English "very well" 22 +/-27 Speak English less than "very well" 0 +/-20
Arabic: 69 +/-50 Speak English "very well" 46 +/-37 Speak English less than "very well" 23 +/-23
Hebrew: 67 +/-80 Speak English "very well" 67 +/-80 Speak English less than "very well" 0 +/-20
African languages: 69 +/-76 Speak English "very well" 45 +/-47 Speak English less than "very well" 24 +/-37
Other and unspecified languages: 24 +/-28 Speak English "very well" 18 +/-25 Speak English less than "very well" 6 +/-10
Data are based on a sample and are subject to sampling variability. The degree of uncertainty for an estimate arising from sampling variability is represented through the use of a margin of error. The value shown here is the 90 percent margin of error. The margin of error can be interpreted roughly as providing a 90 percent probability that the interval defined by the estimate minus the margin of error and the estimate plus the margin of error (the lower and upper confidence bounds) contains the true value. In addition to sampling variability, the ACS estimates are subject to nonsampling error (for a discussion of nonsampling variability, see Accuracy of the Data). The effect of nonsampling error is not represented in these tables.
Methodological changes to data collection in 2013 may have affected language data for 2013. Users should be aware of these changes when using multi-year data containing data from 2013. For more information, see: Language User Note.
While the 2011-2015 American Community Survey (ACS) data generally reflect the February 2013 Office of Management and Budget (OMB) definitions of metropolitan and micropolitan statistical areas; in certain instances the names, codes, and boundaries of the principal cities shown in ACS tables may differ from the OMB definitions due to differences in the effective dates of the geographic entities.
Estimates of urban and rural population, housing units, and characteristics reflect boundaries of urban areas defined based on Census 2010 data. As a result, data for urban and rural areas from the ACS do not necessarily reflect the results of ongoing urbanization.
Source: U.S. Census Bureau, 2011-2015 American Community Survey 5-Year Estimates
Explanation of Symbols:
1. An '**' entry in the margin of error column indicates that either no sample observations or too few sample observations were available to compute a standard error and thus the margin of error. A statistical test is not appropriate.
2. An '-' entry in the estimate column indicates that either no sample observations or too few sample observations were available to compute an estimate, or a ratio of medians cannot be calculated because one or both of the median estimates falls in the lowest interval or upper interval of an open-ended distribution.
3. An '-' following a median estimate means the median falls in the lowest interval of an open-ended distribution. 4. An '+' following a median estimate means the median falls in the upper interval of an open-ended distribution. 5. An '***' entry in the margin of error column indicates that the median falls in the lowest interval or upper interval of an open-ended distribution. A
statistical test is not appropriate. 6. An '*****' entry in the margin of error column indicates that the estimate is controlled. A statistical test for sampling variability is not appropriate.
3 of 4 12/16/2016

7. An 'N' entry in the estimate and margin of error columns indicates that data for this geographic area cannot be displayed because the number of sample cases is too small.
8. An '(X)' means that the estimate is not applicable or not available.

B16001 LANGUAGE SPOKEN AT HOME BY ABILITY TO SPEAK ENGLISH FOR THE POPULATION 5 YEARS AND OVER Universe: Population 5 years and over 2011-2015 American Community Survey 5-Year Estimates
Supporting documentation on code lists, subject definitions, data accuracy, and statistical testing can be found on the American Community Survey website in the Data and Documentation section.
Sample size and data quality measures (including coverage rates, allocation rates, and response rates) can be found on the American Community Survey website in the Methodology section.
Tell us what you think. Provide feedback to help make American Community Survey data more useful for you.
Although the American Community Survey (ACS) produces population, demographic and housing unit estimates, it is the Census Bureau's Population Estimates Program that produces and disseminates the official estimates of the population for the nation, states, counties, cities and towns and estimates of housing units for states and counties.
Richland County, Wisconsin
Estimate Margin of Error Total: 16,763 +/-28 Speak only English 15,945 +/-167 Spanish or Spanish Creole: 290 +/-87 Speak English "very well" 209 +/-75 Speak English less than "very well" 81 +/-47
French (incl. Patois, Cajun): 28 +/-21 Speak English "very well" 26 +/-20 Speak English less than "very well" 2 +/-3
French Creole: 0 +/-14 Speak English "very well" 0 +/-14 Speak English less than "very well" 0 +/-14
Italian: 7 +/-9 Speak English "very well" 3 +/-4 Speak English less than "very well" 4 +/-5
Portuguese or Portuguese Creole: 9 +/-14 Speak English "very well" 9 +/-14 Speak English less than "very well" 0 +/-14
German: 248 +/-90 Speak English "very well" 215 +/-77 Speak English less than "very well" 33 +/-26
Yiddish: 0 +/-14 Speak English "very well" 0 +/-14 Speak English less than "very well" 0 +/-14
Other West Germanic languages: 119 +/-83 Speak English "very well" 113 +/-81 Speak English less than "very well" 6 +/-7
Scandinavian languages: 6 +/-8 Speak English "very well" 6 +/-8 Speak English less than "very well" 0 +/-14
Greek: 0 +/-14 Speak English "very well" 0 +/-14 Speak English less than "very well" 0 +/-14
1 of 4 12/16/2016

Richland County, Wisconsin
Estimate Margin of Error Russian: 8 +/-5 Speak English "very well" 5 +/-3 Speak English less than "very well" 3 +/-3
Polish: 8 +/-8 Speak English "very well" 8 +/-8 Speak English less than "very well" 0 +/-14
Serbo-Croatian: 0 +/-14 Speak English "very well" 0 +/-14 Speak English less than "very well" 0 +/-14
Other Slavic languages: 19 +/-12 Speak English "very well" 13 +/-9 Speak English less than "very well" 6 +/-7
Armenian: 0 +/-14 Speak English "very well" 0 +/-14 Speak English less than "very well" 0 +/-14
Persian: 8 +/-13 Speak English "very well" 0 +/-14 Speak English less than "very well" 8 +/-13
Gujarati: 0 +/-14 Speak English "very well" 0 +/-14 Speak English less than "very well" 0 +/-14
Hindi: 0 +/-14 Speak English "very well" 0 +/-14 Speak English less than "very well" 0 +/-14
Urdu: 0 +/-14 Speak English "very well" 0 +/-14 Speak English less than "very well" 0 +/-14
Other Indic languages: 2 +/-3 Speak English "very well" 2 +/-3 Speak English less than "very well" 0 +/-14
Other Indo-European languages: 46 +/-70 Speak English "very well" 46 +/-70 Speak English less than "very well" 0 +/-14
Chinese: 2 +/-3 Speak English "very well" 0 +/-14 Speak English less than "very well" 2 +/-3
Japanese: 0 +/-14 Speak English "very well" 0 +/-14 Speak English less than "very well" 0 +/-14
Korean: 0 +/-14 Speak English "very well" 0 +/-14 Speak English less than "very well" 0 +/-14
Mon-Khmer, Cambodian: 0 +/-14 Speak English "very well" 0 +/-14 Speak English less than "very well" 0 +/-14
Hmong: 0 +/-14 Speak English "very well" 0 +/-14 Speak English less than "very well" 0 +/-14
Thai: 0 +/-14 Speak English "very well" 0 +/-14 Speak English less than "very well" 0 +/-14
Laotian: 0 +/-14 Speak English "very well" 0 +/-14 Speak English less than "very well" 0 +/-14
Vietnamese: 0 +/-14 Speak English "very well" 0 +/-14 Speak English less than "very well" 0 +/-14
Other Asian languages: 0 +/-14 Speak English "very well" 0 +/-14
2 of 4 12/16/2016

Richland County, Wisconsin
Estimate Margin of Error Speak English less than "very well" 0 +/-14
Tagalog: 15 +/-12 Speak English "very well" 14 +/-12 Speak English less than "very well" 1 +/-3
Other Pacific Island languages: 2 +/-2 Speak English "very well" 0 +/-14 Speak English less than "very well" 2 +/-2
Navajo: 0 +/-14 Speak English "very well" 0 +/-14 Speak English less than "very well" 0 +/-14
Other Native North American languages: 0 +/-14 Speak English "very well" 0 +/-14 Speak English less than "very well" 0 +/-14
Hungarian: 0 +/-14 Speak English "very well" 0 +/-14 Speak English less than "very well" 0 +/-14
Arabic: 0 +/-14 Speak English "very well" 0 +/-14 Speak English less than "very well" 0 +/-14
Hebrew: 1 +/-3 Speak English "very well" 1 +/-3 Speak English less than "very well" 0 +/-14
African languages: 0 +/-14 Speak English "very well" 0 +/-14 Speak English less than "very well" 0 +/-14
Other and unspecified languages: 0 +/-14 Speak English "very well" 0 +/-14 Speak English less than "very well" 0 +/-14
Data are based on a sample and are subject to sampling variability. The degree of uncertainty for an estimate arising from sampling variability is represented through the use of a margin of error. The value shown here is the 90 percent margin of error. The margin of error can be interpreted roughly as providing a 90 percent probability that the interval defined by the estimate minus the margin of error and the estimate plus the margin of error (the lower and upper confidence bounds) contains the true value. In addition to sampling variability, the ACS estimates are subject to nonsampling error (for a discussion of nonsampling variability, see Accuracy of the Data). The effect of nonsampling error is not represented in these tables.
Methodological changes to data collection in 2013 may have affected language data for 2013. Users should be aware of these changes when using multi-year data containing data from 2013. For more information, see: Language User Note.
While the 2011-2015 American Community Survey (ACS) data generally reflect the February 2013 Office of Management and Budget (OMB) definitions of metropolitan and micropolitan statistical areas; in certain instances the names, codes, and boundaries of the principal cities shown in ACS tables may differ from the OMB definitions due to differences in the effective dates of the geographic entities.
Estimates of urban and rural population, housing units, and characteristics reflect boundaries of urban areas defined based on Census 2010 data. As a result, data for urban and rural areas from the ACS do not necessarily reflect the results of ongoing urbanization.
Source: U.S. Census Bureau, 2011-2015 American Community Survey 5-Year Estimates
Explanation of Symbols:
1. An '**' entry in the margin of error column indicates that either no sample observations or too few sample observations were available to compute a standard error and thus the margin of error. A statistical test is not appropriate.
2. An '-' entry in the estimate column indicates that either no sample observations or too few sample observations were available to compute an estimate, or a ratio of medians cannot be calculated because one or both of the median estimates falls in the lowest interval or upper interval of an open-ended distribution.
3. An '-' following a median estimate means the median falls in the lowest interval of an open-ended distribution. 4. An '+' following a median estimate means the median falls in the upper interval of an open-ended distribution. 5. An '***' entry in the margin of error column indicates that the median falls in the lowest interval or upper interval of an open-ended distribution. A
statistical test is not appropriate. 6. An '*****' entry in the margin of error column indicates that the estimate is controlled. A statistical test for sampling variability is not appropriate.
3 of 4 12/16/2016

7. An 'N' entry in the estimate and margin of error columns indicates that data for this geographic area cannot be displayed because the number of sample cases is too small.
8. An '(X)' means that the estimate is not applicable or not available.

B16001 LANGUAGE SPOKEN AT HOME BY ABILITY TO SPEAK ENGLISH FOR THE POPULATION 5 YEARS AND OVER Universe: Population 5 years and over 2011-2015 American Community Survey 5-Year Estimates
Supporting documentation on code lists, subject definitions, data accuracy, and statistical testing can be found on the American Community Survey website in the Data and Documentation section.
Sample size and data quality measures (including coverage rates, allocation rates, and response rates) can be found on the American Community Survey website in the Methodology section.
Tell us what you think. Provide feedback to help make American Community Survey data more useful for you.
Although the American Community Survey (ACS) produces population, demographic and housing unit estimates, it is the Census Bureau's Population Estimates Program that produces and disseminates the official estimates of the population for the nation, states, counties, cities and towns and estimates of housing units for states and counties.
Rock County, Wisconsin
Estimate Margin of Error Total: 150,857 ***** Speak only English 138,391 +/-727 Spanish or Spanish Creole: 9,235 +/-576 Speak English "very well" 5,409 +/-518 Speak English less than "very well" 3,826 +/-459
French (incl. Patois, Cajun): 250 +/-90 Speak English "very well" 226 +/-87 Speak English less than "very well" 24 +/-26
French Creole: 7 +/-11 Speak English "very well" 7 +/-11 Speak English less than "very well" 0 +/-20
Italian: 59 +/-45 Speak English "very well" 35 +/-29 Speak English less than "very well" 24 +/-22
Portuguese or Portuguese Creole: 8 +/-11 Speak English "very well" 2 +/-4 Speak English less than "very well" 6 +/-10
German: 501 +/-129 Speak English "very well" 425 +/-117 Speak English less than "very well" 76 +/-49
Yiddish: 0 +/-20 Speak English "very well" 0 +/-20 Speak English less than "very well" 0 +/-20
Other West Germanic languages: 199 +/-161 Speak English "very well" 192 +/-160 Speak English less than "very well" 7 +/-12
Scandinavian languages: 126 +/-68 Speak English "very well" 119 +/-66 Speak English less than "very well" 7 +/-11
Greek: 44 +/-50 Speak English "very well" 44 +/-50 Speak English less than "very well" 0 +/-20
1 of 4 12/16/2016

Rock County, Wisconsin
Estimate Margin of Error Russian: 51 +/-45 Speak English "very well" 35 +/-38 Speak English less than "very well" 16 +/-26
Polish: 68 +/-31 Speak English "very well" 57 +/-36 Speak English less than "very well" 11 +/-14
Serbo-Croatian: 101 +/-115 Speak English "very well" 101 +/-115 Speak English less than "very well" 0 +/-20
Other Slavic languages: 26 +/-27 Speak English "very well" 21 +/-25 Speak English less than "very well" 5 +/-8
Armenian: 7 +/-10 Speak English "very well" 7 +/-10 Speak English less than "very well" 0 +/-20
Persian: 7 +/-12 Speak English "very well" 4 +/-8 Speak English less than "very well" 3 +/-8
Gujarati: 28 +/-43 Speak English "very well" 28 +/-43 Speak English less than "very well" 0 +/-20
Hindi: 22 +/-25 Speak English "very well" 20 +/-26 Speak English less than "very well" 2 +/-3
Urdu: 7 +/-10 Speak English "very well" 2 +/-4 Speak English less than "very well" 5 +/-9
Other Indic languages: 95 +/-100 Speak English "very well" 72 +/-78 Speak English less than "very well" 23 +/-26
Other Indo-European languages: 264 +/-288 Speak English "very well" 163 +/-168 Speak English less than "very well" 101 +/-121
Chinese: 181 +/-90 Speak English "very well" 121 +/-67 Speak English less than "very well" 60 +/-63
Japanese: 99 +/-42 Speak English "very well" 84 +/-37 Speak English less than "very well" 15 +/-16
Korean: 82 +/-72 Speak English "very well" 71 +/-69 Speak English less than "very well" 11 +/-18
Mon-Khmer, Cambodian: 344 +/-165 Speak English "very well" 198 +/-147 Speak English less than "very well" 146 +/-72
Hmong: 60 +/-57 Speak English "very well" 44 +/-38 Speak English less than "very well" 16 +/-25
Thai: 9 +/-15 Speak English "very well" 0 +/-20 Speak English less than "very well" 9 +/-15
Laotian: 0 +/-20 Speak English "very well" 0 +/-20 Speak English less than "very well" 0 +/-20
Vietnamese: 183 +/-117 Speak English "very well" 57 +/-55 Speak English less than "very well" 126 +/-81
Other Asian languages: 49 +/-40 Speak English "very well" 16 +/-19
2 of 4 12/16/2016

Rock County, Wisconsin
Estimate Margin of Error Speak English less than "very well" 33 +/-30
Tagalog: 117 +/-56 Speak English "very well" 97 +/-52 Speak English less than "very well" 20 +/-21
Other Pacific Island languages: 31 +/-36 Speak English "very well" 31 +/-36 Speak English less than "very well" 0 +/-20
Navajo: 0 +/-20 Speak English "very well" 0 +/-20 Speak English less than "very well" 0 +/-20
Other Native North American languages: 21 +/-21 Speak English "very well" 21 +/-21 Speak English less than "very well" 0 +/-20
Hungarian: 0 +/-20 Speak English "very well" 0 +/-20 Speak English less than "very well" 0 +/-20
Arabic: 101 +/-64 Speak English "very well" 76 +/-45 Speak English less than "very well" 25 +/-25
Hebrew: 18 +/-18 Speak English "very well" 18 +/-18 Speak English less than "very well" 0 +/-20
African languages: 58 +/-63 Speak English "very well" 50 +/-61 Speak English less than "very well" 8 +/-13
Other and unspecified languages: 8 +/-8 Speak English "very well" 8 +/-8 Speak English less than "very well" 0 +/-20
Data are based on a sample and are subject to sampling variability. The degree of uncertainty for an estimate arising from sampling variability is represented through the use of a margin of error. The value shown here is the 90 percent margin of error. The margin of error can be interpreted roughly as providing a 90 percent probability that the interval defined by the estimate minus the margin of error and the estimate plus the margin of error (the lower and upper confidence bounds) contains the true value. In addition to sampling variability, the ACS estimates are subject to nonsampling error (for a discussion of nonsampling variability, see Accuracy of the Data). The effect of nonsampling error is not represented in these tables.
Methodological changes to data collection in 2013 may have affected language data for 2013. Users should be aware of these changes when using multi-year data containing data from 2013. For more information, see: Language User Note.
While the 2011-2015 American Community Survey (ACS) data generally reflect the February 2013 Office of Management and Budget (OMB) definitions of metropolitan and micropolitan statistical areas; in certain instances the names, codes, and boundaries of the principal cities shown in ACS tables may differ from the OMB definitions due to differences in the effective dates of the geographic entities.
Estimates of urban and rural population, housing units, and characteristics reflect boundaries of urban areas defined based on Census 2010 data. As a result, data for urban and rural areas from the ACS do not necessarily reflect the results of ongoing urbanization.
Source: U.S. Census Bureau, 2011-2015 American Community Survey 5-Year Estimates
Explanation of Symbols:
1. An '**' entry in the margin of error column indicates that either no sample observations or too few sample observations were available to compute a standard error and thus the margin of error. A statistical test is not appropriate.
2. An '-' entry in the estimate column indicates that either no sample observations or too few sample observations were available to compute an estimate, or a ratio of medians cannot be calculated because one or both of the median estimates falls in the lowest interval or upper interval of an open-ended distribution.
3. An '-' following a median estimate means the median falls in the lowest interval of an open-ended distribution. 4. An '+' following a median estimate means the median falls in the upper interval of an open-ended distribution. 5. An '***' entry in the margin of error column indicates that the median falls in the lowest interval or upper interval of an open-ended distribution. A
statistical test is not appropriate. 6. An '*****' entry in the margin of error column indicates that the estimate is controlled. A statistical test for sampling variability is not appropriate.
3 of 4 12/16/2016

7. An 'N' entry in the estimate and margin of error columns indicates that data for this geographic area cannot be displayed because the number of sample cases is too small.
8. An '(X)' means that the estimate is not applicable or not available.

B16001 LANGUAGE SPOKEN AT HOME BY ABILITY TO SPEAK ENGLISH FOR THE POPULATION 5 YEARS AND OVER Universe: Population 5 years and over 2011-2015 American Community Survey 5-Year Estimates
Supporting documentation on code lists, subject definitions, data accuracy, and statistical testing can be found on the American Community Survey website in the Data and Documentation section.
Sample size and data quality measures (including coverage rates, allocation rates, and response rates) can be found on the American Community Survey website in the Methodology section.
Tell us what you think. Provide feedback to help make American Community Survey data more useful for you.
Although the American Community Survey (ACS) produces population, demographic and housing unit estimates, it is the Census Bureau's Population Estimates Program that produces and disseminates the official estimates of the population for the nation, states, counties, cities and towns and estimates of housing units for states and counties.
Rusk County, Wisconsin
Estimate Margin of Error Total: 13,627 +/-12 Speak only English 13,189 +/-105 Spanish or Spanish Creole: 127 +/-59 Speak English "very well" 96 +/-58 Speak English less than "very well" 31 +/-19
French (incl. Patois, Cajun): 23 +/-22 Speak English "very well" 23 +/-22 Speak English less than "very well" 0 +/-14
French Creole: 0 +/-14 Speak English "very well" 0 +/-14 Speak English less than "very well" 0 +/-14
Italian: 4 +/-8 Speak English "very well" 0 +/-14 Speak English less than "very well" 4 +/-8
Portuguese or Portuguese Creole: 1 +/-4 Speak English "very well" 1 +/-4 Speak English less than "very well" 0 +/-14
German: 124 +/-44 Speak English "very well" 93 +/-38 Speak English less than "very well" 31 +/-18
Yiddish: 0 +/-14 Speak English "very well" 0 +/-14 Speak English less than "very well" 0 +/-14
Other West Germanic languages: 41 +/-25 Speak English "very well" 28 +/-16 Speak English less than "very well" 13 +/-13
Scandinavian languages: 2 +/-3 Speak English "very well" 2 +/-3 Speak English less than "very well" 0 +/-14
Greek: 0 +/-14 Speak English "very well" 0 +/-14 Speak English less than "very well" 0 +/-14
1 of 4 12/16/2016

Rusk County, Wisconsin
Estimate Margin of Error Russian: 5 +/-7 Speak English "very well" 5 +/-7 Speak English less than "very well" 0 +/-14
Polish: 22 +/-10 Speak English "very well" 9 +/-6 Speak English less than "very well" 13 +/-8
Serbo-Croatian: 3 +/-3 Speak English "very well" 1 +/-2 Speak English less than "very well" 2 +/-3
Other Slavic languages: 8 +/-10 Speak English "very well" 8 +/-10 Speak English less than "very well" 0 +/-14
Armenian: 0 +/-14 Speak English "very well" 0 +/-14 Speak English less than "very well" 0 +/-14
Persian: 0 +/-14 Speak English "very well" 0 +/-14 Speak English less than "very well" 0 +/-14
Gujarati: 0 +/-14 Speak English "very well" 0 +/-14 Speak English less than "very well" 0 +/-14
Hindi: 0 +/-14 Speak English "very well" 0 +/-14 Speak English less than "very well" 0 +/-14
Urdu: 0 +/-14 Speak English "very well" 0 +/-14 Speak English less than "very well" 0 +/-14
Other Indic languages: 0 +/-14 Speak English "very well" 0 +/-14 Speak English less than "very well" 0 +/-14
Other Indo-European languages: 1 +/-3 Speak English "very well" 1 +/-3 Speak English less than "very well" 0 +/-14
Chinese: 42 +/-40 Speak English "very well" 0 +/-14 Speak English less than "very well" 42 +/-40
Japanese: 1 +/-4 Speak English "very well" 0 +/-14 Speak English less than "very well" 1 +/-4
Korean: 0 +/-14 Speak English "very well" 0 +/-14 Speak English less than "very well" 0 +/-14
Mon-Khmer, Cambodian: 0 +/-14 Speak English "very well" 0 +/-14 Speak English less than "very well" 0 +/-14
Hmong: 0 +/-14 Speak English "very well" 0 +/-14 Speak English less than "very well" 0 +/-14
Thai: 0 +/-14 Speak English "very well" 0 +/-14 Speak English less than "very well" 0 +/-14
Laotian: 0 +/-14 Speak English "very well" 0 +/-14 Speak English less than "very well" 0 +/-14
Vietnamese: 0 +/-14 Speak English "very well" 0 +/-14 Speak English less than "very well" 0 +/-14
Other Asian languages: 0 +/-14 Speak English "very well" 0 +/-14
2 of 4 12/16/2016

Rusk County, Wisconsin
Estimate Margin of Error Speak English less than "very well" 0 +/-14
Tagalog: 5 +/-8 Speak English "very well" 5 +/-8 Speak English less than "very well" 0 +/-14
Other Pacific Island languages: 2 +/-3 Speak English "very well" 0 +/-14 Speak English less than "very well" 2 +/-3
Navajo: 0 +/-14 Speak English "very well" 0 +/-14 Speak English less than "very well" 0 +/-14
Other Native North American languages: 0 +/-14 Speak English "very well" 0 +/-14 Speak English less than "very well" 0 +/-14
Hungarian: 0 +/-14 Speak English "very well" 0 +/-14 Speak English less than "very well" 0 +/-14
Arabic: 1 +/-4 Speak English "very well" 1 +/-4 Speak English less than "very well" 0 +/-14
Hebrew: 3 +/-5 Speak English "very well" 3 +/-5 Speak English less than "very well" 0 +/-14
African languages: 20 +/-28 Speak English "very well" 20 +/-28 Speak English less than "very well" 0 +/-14
Other and unspecified languages: 3 +/-4 Speak English "very well" 3 +/-4 Speak English less than "very well" 0 +/-14
Data are based on a sample and are subject to sampling variability. The degree of uncertainty for an estimate arising from sampling variability is represented through the use of a margin of error. The value shown here is the 90 percent margin of error. The margin of error can be interpreted roughly as providing a 90 percent probability that the interval defined by the estimate minus the margin of error and the estimate plus the margin of error (the lower and upper confidence bounds) contains the true value. In addition to sampling variability, the ACS estimates are subject to nonsampling error (for a discussion of nonsampling variability, see Accuracy of the Data). The effect of nonsampling error is not represented in these tables.
Methodological changes to data collection in 2013 may have affected language data for 2013. Users should be aware of these changes when using multi-year data containing data from 2013. For more information, see: Language User Note.
While the 2011-2015 American Community Survey (ACS) data generally reflect the February 2013 Office of Management and Budget (OMB) definitions of metropolitan and micropolitan statistical areas; in certain instances the names, codes, and boundaries of the principal cities shown in ACS tables may differ from the OMB definitions due to differences in the effective dates of the geographic entities.
Estimates of urban and rural population, housing units, and characteristics reflect boundaries of urban areas defined based on Census 2010 data. As a result, data for urban and rural areas from the ACS do not necessarily reflect the results of ongoing urbanization.
Source: U.S. Census Bureau, 2011-2015 American Community Survey 5-Year Estimates
Explanation of Symbols:
1. An '**' entry in the margin of error column indicates that either no sample observations or too few sample observations were available to compute a standard error and thus the margin of error. A statistical test is not appropriate.
2. An '-' entry in the estimate column indicates that either no sample observations or too few sample observations were available to compute an estimate, or a ratio of medians cannot be calculated because one or both of the median estimates falls in the lowest interval or upper interval of an open-ended distribution.
3. An '-' following a median estimate means the median falls in the lowest interval of an open-ended distribution. 4. An '+' following a median estimate means the median falls in the upper interval of an open-ended distribution. 5. An '***' entry in the margin of error column indicates that the median falls in the lowest interval or upper interval of an open-ended distribution. A
statistical test is not appropriate. 6. An '*****' entry in the margin of error column indicates that the estimate is controlled. A statistical test for sampling variability is not appropriate.
3 of 4 12/16/2016

7. An 'N' entry in the estimate and margin of error columns indicates that data for this geographic area cannot be displayed because the number of sample cases is too small.
8. An '(X)' means that the estimate is not applicable or not available.

B16001 LANGUAGE SPOKEN AT HOME BY ABILITY TO SPEAK ENGLISH FOR THE POPULATION 5 YEARS AND OVER Universe: Population 5 years and over 2011-2015 American Community Survey 5-Year Estimates
Supporting documentation on code lists, subject definitions, data accuracy, and statistical testing can be found on the American Community Survey website in the Data and Documentation section.
Sample size and data quality measures (including coverage rates, allocation rates, and response rates) can be found on the American Community Survey website in the Methodology section.
Tell us what you think. Provide feedback to help make American Community Survey data more useful for you.
Although the American Community Survey (ACS) produces population, demographic and housing unit estimates, it is the Census Bureau's Population Estimates Program that produces and disseminates the official estimates of the population for the nation, states, counties, cities and towns and estimates of housing units for states and counties.
St. Croix County, Wisconsin
Estimate Margin of Error Total: 80,478 +/-23 Speak only English 77,566 +/-429 Spanish or Spanish Creole: 1,527 +/-302 Speak English "very well" 1,125 +/-278 Speak English less than "very well" 402 +/-115
French (incl. Patois, Cajun): 156 +/-86 Speak English "very well" 146 +/-80 Speak English less than "very well" 10 +/-16
French Creole: 7 +/-10 Speak English "very well" 7 +/-10 Speak English less than "very well" 0 +/-20
Italian: 26 +/-27 Speak English "very well" 10 +/-8 Speak English less than "very well" 16 +/-25
Portuguese or Portuguese Creole: 0 +/-20 Speak English "very well" 0 +/-20 Speak English less than "very well" 0 +/-20
German: 350 +/-185 Speak English "very well" 311 +/-178 Speak English less than "very well" 39 +/-26
Yiddish: 0 +/-20 Speak English "very well" 0 +/-20 Speak English less than "very well" 0 +/-20
Other West Germanic languages: 94 +/-83 Speak English "very well" 90 +/-83 Speak English less than "very well" 4 +/-6
Scandinavian languages: 50 +/-31 Speak English "very well" 50 +/-31 Speak English less than "very well" 0 +/-20
Greek: 0 +/-20 Speak English "very well" 0 +/-20 Speak English less than "very well" 0 +/-20
1 of 4 12/16/2016

St. Croix County, Wisconsin
Estimate Margin of Error Russian: 0 +/-20 Speak English "very well" 0 +/-20 Speak English less than "very well" 0 +/-20
Polish: 21 +/-20 Speak English "very well" 18 +/-20 Speak English less than "very well" 3 +/-4
Serbo-Croatian: 12 +/-14 Speak English "very well" 12 +/-14 Speak English less than "very well" 0 +/-20
Other Slavic languages: 21 +/-23 Speak English "very well" 21 +/-23 Speak English less than "very well" 0 +/-20
Armenian: 0 +/-20 Speak English "very well" 0 +/-20 Speak English less than "very well" 0 +/-20
Persian: 16 +/-20 Speak English "very well" 16 +/-20 Speak English less than "very well" 0 +/-20
Gujarati: 0 +/-20 Speak English "very well" 0 +/-20 Speak English less than "very well" 0 +/-20
Hindi: 0 +/-20 Speak English "very well" 0 +/-20 Speak English less than "very well" 0 +/-20
Urdu: 15 +/-23 Speak English "very well" 15 +/-23 Speak English less than "very well" 0 +/-20
Other Indic languages: 0 +/-20 Speak English "very well" 0 +/-20 Speak English less than "very well" 0 +/-20
Other Indo-European languages: 19 +/-23 Speak English "very well" 19 +/-23 Speak English less than "very well" 0 +/-20
Chinese: 16 +/-23 Speak English "very well" 8 +/-12 Speak English less than "very well" 8 +/-11
Japanese: 3 +/-4 Speak English "very well" 2 +/-4 Speak English less than "very well" 1 +/-2
Korean: 0 +/-20 Speak English "very well" 0 +/-20 Speak English less than "very well" 0 +/-20
Mon-Khmer, Cambodian: 3 +/-5 Speak English "very well" 3 +/-5 Speak English less than "very well" 0 +/-20
Hmong: 378 +/-188 Speak English "very well" 262 +/-128 Speak English less than "very well" 116 +/-73
Thai: 0 +/-20 Speak English "very well" 0 +/-20 Speak English less than "very well" 0 +/-20
Laotian: 77 +/-115 Speak English "very well" 68 +/-101 Speak English less than "very well" 9 +/-16
Vietnamese: 7 +/-10 Speak English "very well" 0 +/-20 Speak English less than "very well" 7 +/-10
Other Asian languages: 0 +/-20 Speak English "very well" 0 +/-20
2 of 4 12/16/2016

St. Croix County, Wisconsin
Estimate Margin of Error Speak English less than "very well" 0 +/-20
Tagalog: 21 +/-16 Speak English "very well" 13 +/-11 Speak English less than "very well" 8 +/-8
Other Pacific Island languages: 0 +/-20 Speak English "very well" 0 +/-20 Speak English less than "very well" 0 +/-20
Navajo: 2 +/-3 Speak English "very well" 0 +/-20 Speak English less than "very well" 2 +/-3
Other Native North American languages: 11 +/-13 Speak English "very well" 7 +/-8 Speak English less than "very well" 4 +/-6
Hungarian: 0 +/-20 Speak English "very well" 0 +/-20 Speak English less than "very well" 0 +/-20
Arabic: 40 +/-55 Speak English "very well" 6 +/-10 Speak English less than "very well" 34 +/-48
Hebrew: 0 +/-20 Speak English "very well" 0 +/-20 Speak English less than "very well" 0 +/-20
African languages: 5 +/-8 Speak English "very well" 5 +/-8 Speak English less than "very well" 0 +/-20
Other and unspecified languages: 35 +/-44 Speak English "very well" 33 +/-44 Speak English less than "very well" 2 +/-4
Data are based on a sample and are subject to sampling variability. The degree of uncertainty for an estimate arising from sampling variability is represented through the use of a margin of error. The value shown here is the 90 percent margin of error. The margin of error can be interpreted roughly as providing a 90 percent probability that the interval defined by the estimate minus the margin of error and the estimate plus the margin of error (the lower and upper confidence bounds) contains the true value. In addition to sampling variability, the ACS estimates are subject to nonsampling error (for a discussion of nonsampling variability, see Accuracy of the Data). The effect of nonsampling error is not represented in these tables.
Methodological changes to data collection in 2013 may have affected language data for 2013. Users should be aware of these changes when using multi-year data containing data from 2013. For more information, see: Language User Note.
While the 2011-2015 American Community Survey (ACS) data generally reflect the February 2013 Office of Management and Budget (OMB) definitions of metropolitan and micropolitan statistical areas; in certain instances the names, codes, and boundaries of the principal cities shown in ACS tables may differ from the OMB definitions due to differences in the effective dates of the geographic entities.
Estimates of urban and rural population, housing units, and characteristics reflect boundaries of urban areas defined based on Census 2010 data. As a result, data for urban and rural areas from the ACS do not necessarily reflect the results of ongoing urbanization.
Source: U.S. Census Bureau, 2011-2015 American Community Survey 5-Year Estimates
Explanation of Symbols:
1. An '**' entry in the margin of error column indicates that either no sample observations or too few sample observations were available to compute a standard error and thus the margin of error. A statistical test is not appropriate.
2. An '-' entry in the estimate column indicates that either no sample observations or too few sample observations were available to compute an estimate, or a ratio of medians cannot be calculated because one or both of the median estimates falls in the lowest interval or upper interval of an open-ended distribution.
3. An '-' following a median estimate means the median falls in the lowest interval of an open-ended distribution. 4. An '+' following a median estimate means the median falls in the upper interval of an open-ended distribution. 5. An '***' entry in the margin of error column indicates that the median falls in the lowest interval or upper interval of an open-ended distribution. A
statistical test is not appropriate. 6. An '*****' entry in the margin of error column indicates that the estimate is controlled. A statistical test for sampling variability is not appropriate.
3 of 4 12/16/2016

7. An 'N' entry in the estimate and margin of error columns indicates that data for this geographic area cannot be displayed because the number of sample cases is too small.
8. An '(X)' means that the estimate is not applicable or not available.

B16001 LANGUAGE SPOKEN AT HOME BY ABILITY TO SPEAK ENGLISH FOR THE POPULATION 5 YEARS AND OVER Universe: Population 5 years and over 2011-2015 American Community Survey 5-Year Estimates
Supporting documentation on code lists, subject definitions, data accuracy, and statistical testing can be found on the American Community Survey website in the Data and Documentation section.
Sample size and data quality measures (including coverage rates, allocation rates, and response rates) can be found on the American Community Survey website in the Methodology section.
Tell us what you think. Provide feedback to help make American Community Survey data more useful for you.
Although the American Community Survey (ACS) produces population, demographic and housing unit estimates, it is the Census Bureau's Population Estimates Program that produces and disseminates the official estimates of the population for the nation, states, counties, cities and towns and estimates of housing units for states and counties.
Sauk County, Wisconsin
Estimate Margin of Error Total: 59,078 +/-173 Speak only English 55,482 +/-396 Spanish or Spanish Creole: 1,815 +/-313 Speak English "very well" 1,321 +/-256 Speak English less than "very well" 494 +/-142
French (incl. Patois, Cajun): 114 +/-45 Speak English "very well" 60 +/-35 Speak English less than "very well" 54 +/-33
French Creole: 0 +/-20 Speak English "very well" 0 +/-20 Speak English less than "very well" 0 +/-20
Italian: 23 +/-35 Speak English "very well" 23 +/-35 Speak English less than "very well" 0 +/-20
Portuguese or Portuguese Creole: 0 +/-20 Speak English "very well" 0 +/-20 Speak English less than "very well" 0 +/-20
German: 576 +/-183 Speak English "very well" 480 +/-172 Speak English less than "very well" 96 +/-46
Yiddish: 0 +/-20 Speak English "very well" 0 +/-20 Speak English less than "very well" 0 +/-20
Other West Germanic languages: 278 +/-104 Speak English "very well" 187 +/-83 Speak English less than "very well" 91 +/-39
Scandinavian languages: 7 +/-9 Speak English "very well" 7 +/-9 Speak English less than "very well" 0 +/-20
Greek: 27 +/-36 Speak English "very well" 27 +/-36 Speak English less than "very well" 0 +/-20
1 of 4 12/16/2016

Sauk County, Wisconsin
Estimate Margin of Error Russian: 118 +/-84 Speak English "very well" 101 +/-82 Speak English less than "very well" 17 +/-20
Polish: 103 +/-72 Speak English "very well" 88 +/-67 Speak English less than "very well" 15 +/-18
Serbo-Croatian: 11 +/-9 Speak English "very well" 9 +/-8 Speak English less than "very well" 2 +/-3
Other Slavic languages: 62 +/-44 Speak English "very well" 43 +/-33 Speak English less than "very well" 19 +/-21
Armenian: 0 +/-20 Speak English "very well" 0 +/-20 Speak English less than "very well" 0 +/-20
Persian: 0 +/-20 Speak English "very well" 0 +/-20 Speak English less than "very well" 0 +/-20
Gujarati: 5 +/-7 Speak English "very well" 2 +/-3 Speak English less than "very well" 3 +/-6
Hindi: 6 +/-12 Speak English "very well" 6 +/-12 Speak English less than "very well" 0 +/-20
Urdu: 1 +/-3 Speak English "very well" 0 +/-20 Speak English less than "very well" 1 +/-3
Other Indic languages: 14 +/-28 Speak English "very well" 0 +/-20 Speak English less than "very well" 14 +/-28
Other Indo-European languages: 52 +/-48 Speak English "very well" 31 +/-33 Speak English less than "very well" 21 +/-32
Chinese: 60 +/-51 Speak English "very well" 49 +/-46 Speak English less than "very well" 11 +/-19
Japanese: 14 +/-12 Speak English "very well" 9 +/-7 Speak English less than "very well" 5 +/-7
Korean: 24 +/-23 Speak English "very well" 14 +/-15 Speak English less than "very well" 10 +/-12
Mon-Khmer, Cambodian: 0 +/-20 Speak English "very well" 0 +/-20 Speak English less than "very well" 0 +/-20
Hmong: 32 +/-44 Speak English "very well" 32 +/-44 Speak English less than "very well" 0 +/-20
Thai: 14 +/-15 Speak English "very well" 13 +/-14 Speak English less than "very well" 1 +/-3
Laotian: 0 +/-20 Speak English "very well" 0 +/-20 Speak English less than "very well" 0 +/-20
Vietnamese: 49 +/-84 Speak English "very well" 21 +/-38 Speak English less than "very well" 28 +/-47
Other Asian languages: 29 +/-35 Speak English "very well" 19 +/-30
2 of 4 12/16/2016

Sauk County, Wisconsin
Estimate Margin of Error Speak English less than "very well" 10 +/-16
Tagalog: 9 +/-12 Speak English "very well" 2 +/-4 Speak English less than "very well" 7 +/-11
Other Pacific Island languages: 10 +/-11 Speak English "very well" 10 +/-11 Speak English less than "very well" 0 +/-20
Navajo: 3 +/-6 Speak English "very well" 3 +/-6 Speak English less than "very well" 0 +/-20
Other Native North American languages: 110 +/-56 Speak English "very well" 106 +/-57 Speak English less than "very well" 4 +/-7
Hungarian: 8 +/-7 Speak English "very well" 4 +/-5 Speak English less than "very well" 4 +/-6
Arabic: 0 +/-20 Speak English "very well" 0 +/-20 Speak English less than "very well" 0 +/-20
Hebrew: 17 +/-19 Speak English "very well" 15 +/-17 Speak English less than "very well" 2 +/-3
African languages: 0 +/-20 Speak English "very well" 0 +/-20 Speak English less than "very well" 0 +/-20
Other and unspecified languages: 5 +/-9 Speak English "very well" 5 +/-9 Speak English less than "very well" 0 +/-20
Data are based on a sample and are subject to sampling variability. The degree of uncertainty for an estimate arising from sampling variability is represented through the use of a margin of error. The value shown here is the 90 percent margin of error. The margin of error can be interpreted roughly as providing a 90 percent probability that the interval defined by the estimate minus the margin of error and the estimate plus the margin of error (the lower and upper confidence bounds) contains the true value. In addition to sampling variability, the ACS estimates are subject to nonsampling error (for a discussion of nonsampling variability, see Accuracy of the Data). The effect of nonsampling error is not represented in these tables.
Methodological changes to data collection in 2013 may have affected language data for 2013. Users should be aware of these changes when using multi-year data containing data from 2013. For more information, see: Language User Note.
While the 2011-2015 American Community Survey (ACS) data generally reflect the February 2013 Office of Management and Budget (OMB) definitions of metropolitan and micropolitan statistical areas; in certain instances the names, codes, and boundaries of the principal cities shown in ACS tables may differ from the OMB definitions due to differences in the effective dates of the geographic entities.
Estimates of urban and rural population, housing units, and characteristics reflect boundaries of urban areas defined based on Census 2010 data. As a result, data for urban and rural areas from the ACS do not necessarily reflect the results of ongoing urbanization.
Source: U.S. Census Bureau, 2011-2015 American Community Survey 5-Year Estimates
Explanation of Symbols:
1. An '**' entry in the margin of error column indicates that either no sample observations or too few sample observations were available to compute a standard error and thus the margin of error. A statistical test is not appropriate.
2. An '-' entry in the estimate column indicates that either no sample observations or too few sample observations were available to compute an estimate, or a ratio of medians cannot be calculated because one or both of the median estimates falls in the lowest interval or upper interval of an open-ended distribution.
3. An '-' following a median estimate means the median falls in the lowest interval of an open-ended distribution. 4. An '+' following a median estimate means the median falls in the upper interval of an open-ended distribution. 5. An '***' entry in the margin of error column indicates that the median falls in the lowest interval or upper interval of an open-ended distribution. A
statistical test is not appropriate. 6. An '*****' entry in the margin of error column indicates that the estimate is controlled. A statistical test for sampling variability is not appropriate.
3 of 4 12/16/2016

7. An 'N' entry in the estimate and margin of error columns indicates that data for this geographic area cannot be displayed because the number of sample cases is too small.
8. An '(X)' means that the estimate is not applicable or not available.

B16001 LANGUAGE SPOKEN AT HOME BY ABILITY TO SPEAK ENGLISH FOR THE POPULATION 5 YEARS AND OVER Universe: Population 5 years and over 2011-2015 American Community Survey 5-Year Estimates
Supporting documentation on code lists, subject definitions, data accuracy, and statistical testing can be found on the American Community Survey website in the Data and Documentation section.
Sample size and data quality measures (including coverage rates, allocation rates, and response rates) can be found on the American Community Survey website in the Methodology section.
Tell us what you think. Provide feedback to help make American Community Survey data more useful for you.
Although the American Community Survey (ACS) produces population, demographic and housing unit estimates, it is the Census Bureau's Population Estimates Program that produces and disseminates the official estimates of the population for the nation, states, counties, cities and towns and estimates of housing units for states and counties.
Sawyer County, Wisconsin
Estimate Margin of Error Total: 15,577 +/-27 Speak only English 15,028 +/-97 Spanish or Spanish Creole: 114 +/-38 Speak English "very well" 94 +/-37 Speak English less than "very well" 20 +/-18
French (incl. Patois, Cajun): 7 +/-7 Speak English "very well" 7 +/-7 Speak English less than "very well" 0 +/-14
French Creole: 0 +/-14 Speak English "very well" 0 +/-14 Speak English less than "very well" 0 +/-14
Italian: 33 +/-30 Speak English "very well" 33 +/-30 Speak English less than "very well" 0 +/-14
Portuguese or Portuguese Creole: 3 +/-6 Speak English "very well" 0 +/-14 Speak English less than "very well" 3 +/-6
German: 49 +/-24 Speak English "very well" 43 +/-22 Speak English less than "very well" 6 +/-6
Yiddish: 0 +/-14 Speak English "very well" 0 +/-14 Speak English less than "very well" 0 +/-14
Other West Germanic languages: 13 +/-15 Speak English "very well" 11 +/-15 Speak English less than "very well" 2 +/-3
Scandinavian languages: 1 +/-3 Speak English "very well" 1 +/-3 Speak English less than "very well" 0 +/-14
Greek: 2 +/-3 Speak English "very well" 0 +/-14 Speak English less than "very well" 2 +/-3
1 of 4 12/16/2016

Sawyer County, Wisconsin
Estimate Margin of Error Russian: 2 +/-3 Speak English "very well" 2 +/-3 Speak English less than "very well" 0 +/-14
Polish: 12 +/-12 Speak English "very well" 10 +/-11 Speak English less than "very well" 2 +/-3
Serbo-Croatian: 0 +/-14 Speak English "very well" 0 +/-14 Speak English less than "very well" 0 +/-14
Other Slavic languages: 1 +/-2 Speak English "very well" 1 +/-2 Speak English less than "very well" 0 +/-14
Armenian: 0 +/-14 Speak English "very well" 0 +/-14 Speak English less than "very well" 0 +/-14
Persian: 0 +/-14 Speak English "very well" 0 +/-14 Speak English less than "very well" 0 +/-14
Gujarati: 0 +/-14 Speak English "very well" 0 +/-14 Speak English less than "very well" 0 +/-14
Hindi: 0 +/-14 Speak English "very well" 0 +/-14 Speak English less than "very well" 0 +/-14
Urdu: 0 +/-14 Speak English "very well" 0 +/-14 Speak English less than "very well" 0 +/-14
Other Indic languages: 0 +/-14 Speak English "very well" 0 +/-14 Speak English less than "very well" 0 +/-14
Other Indo-European languages: 0 +/-14 Speak English "very well" 0 +/-14 Speak English less than "very well" 0 +/-14
Chinese: 1 +/-3 Speak English "very well" 0 +/-14 Speak English less than "very well" 1 +/-3
Japanese: 7 +/-10 Speak English "very well" 7 +/-10 Speak English less than "very well" 0 +/-14
Korean: 1 +/-2 Speak English "very well" 1 +/-2 Speak English less than "very well" 0 +/-14
Mon-Khmer, Cambodian: 0 +/-14 Speak English "very well" 0 +/-14 Speak English less than "very well" 0 +/-14
Hmong: 20 +/-17 Speak English "very well" 13 +/-11 Speak English less than "very well" 7 +/-7
Thai: 1 +/-2 Speak English "very well" 0 +/-14 Speak English less than "very well" 1 +/-2
Laotian: 0 +/-14 Speak English "very well" 0 +/-14 Speak English less than "very well" 0 +/-14
Vietnamese: 8 +/-9 Speak English "very well" 2 +/-3 Speak English less than "very well" 6 +/-8
Other Asian languages: 6 +/-8 Speak English "very well" 2 +/-3
2 of 4 12/16/2016

Sawyer County, Wisconsin
Estimate Margin of Error Speak English less than "very well" 4 +/-5
Tagalog: 7 +/-8 Speak English "very well" 6 +/-9 Speak English less than "very well" 1 +/-2
Other Pacific Island languages: 1 +/-2 Speak English "very well" 0 +/-14 Speak English less than "very well" 1 +/-2
Navajo: 0 +/-14 Speak English "very well" 0 +/-14 Speak English less than "very well" 0 +/-14
Other Native North American languages: 260 +/-73 Speak English "very well" 240 +/-73 Speak English less than "very well" 20 +/-16
Hungarian: 0 +/-14 Speak English "very well" 0 +/-14 Speak English less than "very well" 0 +/-14
Arabic: 0 +/-14 Speak English "very well" 0 +/-14 Speak English less than "very well" 0 +/-14
Hebrew: 0 +/-14 Speak English "very well" 0 +/-14 Speak English less than "very well" 0 +/-14
African languages: 0 +/-14 Speak English "very well" 0 +/-14 Speak English less than "very well" 0 +/-14
Other and unspecified languages: 0 +/-14 Speak English "very well" 0 +/-14 Speak English less than "very well" 0 +/-14
Data are based on a sample and are subject to sampling variability. The degree of uncertainty for an estimate arising from sampling variability is represented through the use of a margin of error. The value shown here is the 90 percent margin of error. The margin of error can be interpreted roughly as providing a 90 percent probability that the interval defined by the estimate minus the margin of error and the estimate plus the margin of error (the lower and upper confidence bounds) contains the true value. In addition to sampling variability, the ACS estimates are subject to nonsampling error (for a discussion of nonsampling variability, see Accuracy of the Data). The effect of nonsampling error is not represented in these tables.
Methodological changes to data collection in 2013 may have affected language data for 2013. Users should be aware of these changes when using multi-year data containing data from 2013. For more information, see: Language User Note.
While the 2011-2015 American Community Survey (ACS) data generally reflect the February 2013 Office of Management and Budget (OMB) definitions of metropolitan and micropolitan statistical areas; in certain instances the names, codes, and boundaries of the principal cities shown in ACS tables may differ from the OMB definitions due to differences in the effective dates of the geographic entities.
Estimates of urban and rural population, housing units, and characteristics reflect boundaries of urban areas defined based on Census 2010 data. As a result, data for urban and rural areas from the ACS do not necessarily reflect the results of ongoing urbanization.
Source: U.S. Census Bureau, 2011-2015 American Community Survey 5-Year Estimates
Explanation of Symbols:
1. An '**' entry in the margin of error column indicates that either no sample observations or too few sample observations were available to compute a standard error and thus the margin of error. A statistical test is not appropriate.
2. An '-' entry in the estimate column indicates that either no sample observations or too few sample observations were available to compute an estimate, or a ratio of medians cannot be calculated because one or both of the median estimates falls in the lowest interval or upper interval of an open-ended distribution.
3. An '-' following a median estimate means the median falls in the lowest interval of an open-ended distribution. 4. An '+' following a median estimate means the median falls in the upper interval of an open-ended distribution. 5. An '***' entry in the margin of error column indicates that the median falls in the lowest interval or upper interval of an open-ended distribution. A
statistical test is not appropriate. 6. An '*****' entry in the margin of error column indicates that the estimate is controlled. A statistical test for sampling variability is not appropriate.
3 of 4 12/16/2016

7. An 'N' entry in the estimate and margin of error columns indicates that data for this geographic area cannot be displayed because the number of sample cases is too small.
8. An '(X)' means that the estimate is not applicable or not available.

B16001 LANGUAGE SPOKEN AT HOME BY ABILITY TO SPEAK ENGLISH FOR THE POPULATION 5 YEARS AND OVER Universe: Population 5 years and over 2011-2015 American Community Survey 5-Year Estimates
Supporting documentation on code lists, subject definitions, data accuracy, and statistical testing can be found on the American Community Survey website in the Data and Documentation section.
Sample size and data quality measures (including coverage rates, allocation rates, and response rates) can be found on the American Community Survey website in the Methodology section.
Tell us what you think. Provide feedback to help make American Community Survey data more useful for you.
Although the American Community Survey (ACS) produces population, demographic and housing unit estimates, it is the Census Bureau's Population Estimates Program that produces and disseminates the official estimates of the population for the nation, states, counties, cities and towns and estimates of housing units for states and counties.
Shawano County, Wisconsin
Estimate Margin of Error Total: 39,345 +/-19 Speak only English 38,008 +/-196 Spanish or Spanish Creole: 647 +/-128 Speak English "very well" 396 +/-100 Speak English less than "very well" 251 +/-80
French (incl. Patois, Cajun): 15 +/-25 Speak English "very well" 15 +/-25 Speak English less than "very well" 0 +/-18
French Creole: 0 +/-18 Speak English "very well" 0 +/-18 Speak English less than "very well" 0 +/-18
Italian: 4 +/-7 Speak English "very well" 4 +/-7 Speak English less than "very well" 0 +/-18
Portuguese or Portuguese Creole: 27 +/-60 Speak English "very well" 27 +/-60 Speak English less than "very well" 0 +/-18
German: 323 +/-100 Speak English "very well" 264 +/-86 Speak English less than "very well" 59 +/-28
Yiddish: 4 +/-8 Speak English "very well" 4 +/-8 Speak English less than "very well" 0 +/-18
Other West Germanic languages: 72 +/-26 Speak English "very well" 49 +/-21 Speak English less than "very well" 23 +/-13
Scandinavian languages: 6 +/-9 Speak English "very well" 6 +/-9 Speak English less than "very well" 0 +/-18
Greek: 0 +/-18 Speak English "very well" 0 +/-18 Speak English less than "very well" 0 +/-18
1 of 4 12/16/2016

Shawano County, Wisconsin
Estimate Margin of Error Russian: 62 +/-55 Speak English "very well" 58 +/-54 Speak English less than "very well" 4 +/-6
Polish: 42 +/-22 Speak English "very well" 38 +/-19 Speak English less than "very well" 4 +/-6
Serbo-Croatian: 0 +/-18 Speak English "very well" 0 +/-18 Speak English less than "very well" 0 +/-18
Other Slavic languages: 0 +/-18 Speak English "very well" 0 +/-18 Speak English less than "very well" 0 +/-18
Armenian: 0 +/-18 Speak English "very well" 0 +/-18 Speak English less than "very well" 0 +/-18
Persian: 0 +/-18 Speak English "very well" 0 +/-18 Speak English less than "very well" 0 +/-18
Gujarati: 0 +/-18 Speak English "very well" 0 +/-18 Speak English less than "very well" 0 +/-18
Hindi: 0 +/-18 Speak English "very well" 0 +/-18 Speak English less than "very well" 0 +/-18
Urdu: 0 +/-18 Speak English "very well" 0 +/-18 Speak English less than "very well" 0 +/-18
Other Indic languages: 4 +/-6 Speak English "very well" 2 +/-5 Speak English less than "very well" 2 +/-3
Other Indo-European languages: 0 +/-18 Speak English "very well" 0 +/-18 Speak English less than "very well" 0 +/-18
Chinese: 6 +/-13 Speak English "very well" 5 +/-12 Speak English less than "very well" 1 +/-3
Japanese: 3 +/-5 Speak English "very well" 3 +/-5 Speak English less than "very well" 0 +/-18
Korean: 10 +/-21 Speak English "very well" 5 +/-11 Speak English less than "very well" 5 +/-10
Mon-Khmer, Cambodian: 0 +/-18 Speak English "very well" 0 +/-18 Speak English less than "very well" 0 +/-18
Hmong: 16 +/-24 Speak English "very well" 16 +/-24 Speak English less than "very well" 0 +/-18
Thai: 9 +/-12 Speak English "very well" 9 +/-12 Speak English less than "very well" 0 +/-18
Laotian: 6 +/-8 Speak English "very well" 0 +/-18 Speak English less than "very well" 6 +/-8
Vietnamese: 0 +/-18 Speak English "very well" 0 +/-18 Speak English less than "very well" 0 +/-18
Other Asian languages: 0 +/-18 Speak English "very well" 0 +/-18
2 of 4 12/16/2016

Shawano County, Wisconsin
Estimate Margin of Error Speak English less than "very well" 0 +/-18
Tagalog: 11 +/-8 Speak English "very well" 4 +/-4 Speak English less than "very well" 7 +/-6
Other Pacific Island languages: 3 +/-3 Speak English "very well" 2 +/-3 Speak English less than "very well" 1 +/-3
Navajo: 0 +/-18 Speak English "very well" 0 +/-18 Speak English less than "very well" 0 +/-18
Other Native North American languages: 67 +/-30 Speak English "very well" 64 +/-30 Speak English less than "very well" 3 +/-4
Hungarian: 0 +/-18 Speak English "very well" 0 +/-18 Speak English less than "very well" 0 +/-18
Arabic: 0 +/-18 Speak English "very well" 0 +/-18 Speak English less than "very well" 0 +/-18
Hebrew: 0 +/-18 Speak English "very well" 0 +/-18 Speak English less than "very well" 0 +/-18
African languages: 0 +/-18 Speak English "very well" 0 +/-18 Speak English less than "very well" 0 +/-18
Other and unspecified languages: 0 +/-18 Speak English "very well" 0 +/-18 Speak English less than "very well" 0 +/-18
Data are based on a sample and are subject to sampling variability. The degree of uncertainty for an estimate arising from sampling variability is represented through the use of a margin of error. The value shown here is the 90 percent margin of error. The margin of error can be interpreted roughly as providing a 90 percent probability that the interval defined by the estimate minus the margin of error and the estimate plus the margin of error (the lower and upper confidence bounds) contains the true value. In addition to sampling variability, the ACS estimates are subject to nonsampling error (for a discussion of nonsampling variability, see Accuracy of the Data). The effect of nonsampling error is not represented in these tables.
Methodological changes to data collection in 2013 may have affected language data for 2013. Users should be aware of these changes when using multi-year data containing data from 2013. For more information, see: Language User Note.
While the 2011-2015 American Community Survey (ACS) data generally reflect the February 2013 Office of Management and Budget (OMB) definitions of metropolitan and micropolitan statistical areas; in certain instances the names, codes, and boundaries of the principal cities shown in ACS tables may differ from the OMB definitions due to differences in the effective dates of the geographic entities.
Estimates of urban and rural population, housing units, and characteristics reflect boundaries of urban areas defined based on Census 2010 data. As a result, data for urban and rural areas from the ACS do not necessarily reflect the results of ongoing urbanization.
Source: U.S. Census Bureau, 2011-2015 American Community Survey 5-Year Estimates
Explanation of Symbols:
1. An '**' entry in the margin of error column indicates that either no sample observations or too few sample observations were available to compute a standard error and thus the margin of error. A statistical test is not appropriate.
2. An '-' entry in the estimate column indicates that either no sample observations or too few sample observations were available to compute an estimate, or a ratio of medians cannot be calculated because one or both of the median estimates falls in the lowest interval or upper interval of an open-ended distribution.
3. An '-' following a median estimate means the median falls in the lowest interval of an open-ended distribution. 4. An '+' following a median estimate means the median falls in the upper interval of an open-ended distribution. 5. An '***' entry in the margin of error column indicates that the median falls in the lowest interval or upper interval of an open-ended distribution. A
statistical test is not appropriate. 6. An '*****' entry in the margin of error column indicates that the estimate is controlled. A statistical test for sampling variability is not appropriate.
3 of 4 12/16/2016

7. An 'N' entry in the estimate and margin of error columns indicates that data for this geographic area cannot be displayed because the number of sample cases is too small.
8. An '(X)' means that the estimate is not applicable or not available.

B16001 LANGUAGE SPOKEN AT HOME BY ABILITY TO SPEAK ENGLISH FOR THE POPULATION 5 YEARS AND OVER Universe: Population 5 years and over 2011-2015 American Community Survey 5-Year Estimates
Supporting documentation on code lists, subject definitions, data accuracy, and statistical testing can be found on the American Community Survey website in the Data and Documentation section.
Sample size and data quality measures (including coverage rates, allocation rates, and response rates) can be found on the American Community Survey website in the Methodology section.
Tell us what you think. Provide feedback to help make American Community Survey data more useful for you.
Although the American Community Survey (ACS) produces population, demographic and housing unit estimates, it is the Census Bureau's Population Estimates Program that produces and disseminates the official estimates of the population for the nation, states, counties, cities and towns and estimates of housing units for states and counties.
Sheboygan County, Wisconsin
Estimate Margin of Error Total: 108,615 +/-39 Speak only English 97,611 +/-603 Spanish or Spanish Creole: 4,276 +/-449 Speak English "very well" 2,365 +/-357 Speak English less than "very well" 1,911 +/-296
French (incl. Patois, Cajun): 70 +/-43 Speak English "very well" 49 +/-35 Speak English less than "very well" 21 +/-24
French Creole: 0 +/-20 Speak English "very well" 0 +/-20 Speak English less than "very well" 0 +/-20
Italian: 18 +/-17 Speak English "very well" 18 +/-17 Speak English less than "very well" 0 +/-20
Portuguese or Portuguese Creole: 2 +/-3 Speak English "very well" 2 +/-3 Speak English less than "very well" 0 +/-20
German: 877 +/-158 Speak English "very well" 707 +/-145 Speak English less than "very well" 170 +/-61
Yiddish: 4 +/-6 Speak English "very well" 0 +/-20 Speak English less than "very well" 4 +/-6
Other West Germanic languages: 105 +/-83 Speak English "very well" 61 +/-77 Speak English less than "very well" 44 +/-34
Scandinavian languages: 24 +/-26 Speak English "very well" 24 +/-26 Speak English less than "very well" 0 +/-20
Greek: 81 +/-64 Speak English "very well" 52 +/-43 Speak English less than "very well" 29 +/-46
1 of 4 12/16/2016

Sheboygan County, Wisconsin
Estimate Margin of Error Russian: 38 +/-41 Speak English "very well" 17 +/-18 Speak English less than "very well" 21 +/-26
Polish: 42 +/-31 Speak English "very well" 26 +/-21 Speak English less than "very well" 16 +/-22
Serbo-Croatian: 246 +/-176 Speak English "very well" 181 +/-150 Speak English less than "very well" 65 +/-64
Other Slavic languages: 29 +/-22 Speak English "very well" 29 +/-22 Speak English less than "very well" 0 +/-20
Armenian: 0 +/-20 Speak English "very well" 0 +/-20 Speak English less than "very well" 0 +/-20
Persian: 0 +/-20 Speak English "very well" 0 +/-20 Speak English less than "very well" 0 +/-20
Gujarati: 0 +/-20 Speak English "very well" 0 +/-20 Speak English less than "very well" 0 +/-20
Hindi: 91 +/-75 Speak English "very well" 56 +/-56 Speak English less than "very well" 35 +/-52
Urdu: 41 +/-60 Speak English "very well" 25 +/-37 Speak English less than "very well" 16 +/-25
Other Indic languages: 55 +/-51 Speak English "very well" 32 +/-32 Speak English less than "very well" 23 +/-27
Other Indo-European languages: 374 +/-296 Speak English "very well" 154 +/-114 Speak English less than "very well" 220 +/-259
Chinese: 140 +/-90 Speak English "very well" 34 +/-32 Speak English less than "very well" 106 +/-72
Japanese: 77 +/-59 Speak English "very well" 56 +/-53 Speak English less than "very well" 21 +/-23
Korean: 115 +/-88 Speak English "very well" 46 +/-64 Speak English less than "very well" 69 +/-61
Mon-Khmer, Cambodian: 17 +/-25 Speak English "very well" 14 +/-24 Speak English less than "very well" 3 +/-5
Hmong: 3,669 +/-264 Speak English "very well" 2,337 +/-337 Speak English less than "very well" 1,332 +/-286
Thai: 23 +/-32 Speak English "very well" 23 +/-32 Speak English less than "very well" 0 +/-20
Laotian: 23 +/-25 Speak English "very well" 10 +/-15 Speak English less than "very well" 13 +/-12
Vietnamese: 160 +/-147 Speak English "very well" 48 +/-43 Speak English less than "very well" 112 +/-120
Other Asian languages: 109 +/-90 Speak English "very well" 63 +/-45
2 of 4 12/16/2016

Sheboygan County, Wisconsin
Estimate Margin of Error Speak English less than "very well" 46 +/-70
Tagalog: 172 +/-112 Speak English "very well" 70 +/-51 Speak English less than "very well" 102 +/-100
Other Pacific Island languages: 10 +/-27 Speak English "very well" 10 +/-27 Speak English less than "very well" 0 +/-20
Navajo: 0 +/-20 Speak English "very well" 0 +/-20 Speak English less than "very well" 0 +/-20
Other Native North American languages: 42 +/-31 Speak English "very well" 42 +/-31 Speak English less than "very well" 0 +/-20
Hungarian: 14 +/-22 Speak English "very well" 14 +/-22 Speak English less than "very well" 0 +/-20
Arabic: 27 +/-28 Speak English "very well" 27 +/-28 Speak English less than "very well" 0 +/-20
Hebrew: 15 +/-18 Speak English "very well" 0 +/-20 Speak English less than "very well" 15 +/-18
African languages: 16 +/-19 Speak English "very well" 16 +/-19 Speak English less than "very well" 0 +/-20
Other and unspecified languages: 2 +/-3 Speak English "very well" 2 +/-3 Speak English less than "very well" 0 +/-20
Data are based on a sample and are subject to sampling variability. The degree of uncertainty for an estimate arising from sampling variability is represented through the use of a margin of error. The value shown here is the 90 percent margin of error. The margin of error can be interpreted roughly as providing a 90 percent probability that the interval defined by the estimate minus the margin of error and the estimate plus the margin of error (the lower and upper confidence bounds) contains the true value. In addition to sampling variability, the ACS estimates are subject to nonsampling error (for a discussion of nonsampling variability, see Accuracy of the Data). The effect of nonsampling error is not represented in these tables.
Methodological changes to data collection in 2013 may have affected language data for 2013. Users should be aware of these changes when using multi-year data containing data from 2013. For more information, see: Language User Note.
While the 2011-2015 American Community Survey (ACS) data generally reflect the February 2013 Office of Management and Budget (OMB) definitions of metropolitan and micropolitan statistical areas; in certain instances the names, codes, and boundaries of the principal cities shown in ACS tables may differ from the OMB definitions due to differences in the effective dates of the geographic entities.
Estimates of urban and rural population, housing units, and characteristics reflect boundaries of urban areas defined based on Census 2010 data. As a result, data for urban and rural areas from the ACS do not necessarily reflect the results of ongoing urbanization.
Source: U.S. Census Bureau, 2011-2015 American Community Survey 5-Year Estimates
Explanation of Symbols:
1. An '**' entry in the margin of error column indicates that either no sample observations or too few sample observations were available to compute a standard error and thus the margin of error. A statistical test is not appropriate.
2. An '-' entry in the estimate column indicates that either no sample observations or too few sample observations were available to compute an estimate, or a ratio of medians cannot be calculated because one or both of the median estimates falls in the lowest interval or upper interval of an open-ended distribution.
3. An '-' following a median estimate means the median falls in the lowest interval of an open-ended distribution. 4. An '+' following a median estimate means the median falls in the upper interval of an open-ended distribution. 5. An '***' entry in the margin of error column indicates that the median falls in the lowest interval or upper interval of an open-ended distribution. A
statistical test is not appropriate. 6. An '*****' entry in the margin of error column indicates that the estimate is controlled. A statistical test for sampling variability is not appropriate.
3 of 4 12/16/2016

7. An 'N' entry in the estimate and margin of error columns indicates that data for this geographic area cannot be displayed because the number of sample cases is too small.
8. An '(X)' means that the estimate is not applicable or not available.

B16001 LANGUAGE SPOKEN AT HOME BY ABILITY TO SPEAK ENGLISH FOR THE POPULATION 5 YEARS AND OVER Universe: Population 5 years and over 2011-2015 American Community Survey 5-Year Estimates
Supporting documentation on code lists, subject definitions, data accuracy, and statistical testing can be found on the American Community Survey website in the Data and Documentation section.
Sample size and data quality measures (including coverage rates, allocation rates, and response rates) can be found on the American Community Survey website in the Methodology section.
Tell us what you think. Provide feedback to help make American Community Survey data more useful for you.
Although the American Community Survey (ACS) produces population, demographic and housing unit estimates, it is the Census Bureau's Population Estimates Program that produces and disseminates the official estimates of the population for the nation, states, counties, cities and towns and estimates of housing units for states and counties.
Taylor County, Wisconsin
Estimate Margin of Error Total: 19,337 +/-27 Speak only English 18,257 +/-202 Spanish or Spanish Creole: 260 +/-49 Speak English "very well" 182 +/-50 Speak English less than "very well" 78 +/-44
French (incl. Patois, Cajun): 7 +/-5 Speak English "very well" 5 +/-5 Speak English less than "very well" 2 +/-3
French Creole: 0 +/-16 Speak English "very well" 0 +/-16 Speak English less than "very well" 0 +/-16
Italian: 0 +/-16 Speak English "very well" 0 +/-16 Speak English less than "very well" 0 +/-16
Portuguese or Portuguese Creole: 0 +/-16 Speak English "very well" 0 +/-16 Speak English less than "very well" 0 +/-16
German: 500 +/-137 Speak English "very well" 382 +/-135 Speak English less than "very well" 118 +/-35
Yiddish: 0 +/-16 Speak English "very well" 0 +/-16 Speak English less than "very well" 0 +/-16
Other West Germanic languages: 167 +/-78 Speak English "very well" 128 +/-68 Speak English less than "very well" 39 +/-29
Scandinavian languages: 0 +/-16 Speak English "very well" 0 +/-16 Speak English less than "very well" 0 +/-16
Greek: 0 +/-16 Speak English "very well" 0 +/-16 Speak English less than "very well" 0 +/-16
1 of 4 12/16/2016

Taylor County, Wisconsin
Estimate Margin of Error Russian: 4 +/-5 Speak English "very well" 4 +/-5 Speak English less than "very well" 0 +/-16
Polish: 26 +/-12 Speak English "very well" 19 +/-11 Speak English less than "very well" 7 +/-5
Serbo-Croatian: 50 +/-79 Speak English "very well" 50 +/-79 Speak English less than "very well" 0 +/-16
Other Slavic languages: 7 +/-7 Speak English "very well" 6 +/-7 Speak English less than "very well" 1 +/-2
Armenian: 0 +/-16 Speak English "very well" 0 +/-16 Speak English less than "very well" 0 +/-16
Persian: 0 +/-16 Speak English "very well" 0 +/-16 Speak English less than "very well" 0 +/-16
Gujarati: 0 +/-16 Speak English "very well" 0 +/-16 Speak English less than "very well" 0 +/-16
Hindi: 0 +/-16 Speak English "very well" 0 +/-16 Speak English less than "very well" 0 +/-16
Urdu: 0 +/-16 Speak English "very well" 0 +/-16 Speak English less than "very well" 0 +/-16
Other Indic languages: 0 +/-16 Speak English "very well" 0 +/-16 Speak English less than "very well" 0 +/-16
Other Indo-European languages: 0 +/-16 Speak English "very well" 0 +/-16 Speak English less than "very well" 0 +/-16
Chinese: 0 +/-16 Speak English "very well" 0 +/-16 Speak English less than "very well" 0 +/-16
Japanese: 14 +/-15 Speak English "very well" 14 +/-15 Speak English less than "very well" 0 +/-16
Korean: 0 +/-16 Speak English "very well" 0 +/-16 Speak English less than "very well" 0 +/-16
Mon-Khmer, Cambodian: 0 +/-16 Speak English "very well" 0 +/-16 Speak English less than "very well" 0 +/-16
Hmong: 0 +/-16 Speak English "very well" 0 +/-16 Speak English less than "very well" 0 +/-16
Thai: 0 +/-16 Speak English "very well" 0 +/-16 Speak English less than "very well" 0 +/-16
Laotian: 0 +/-16 Speak English "very well" 0 +/-16 Speak English less than "very well" 0 +/-16
Vietnamese: 0 +/-16 Speak English "very well" 0 +/-16 Speak English less than "very well" 0 +/-16
Other Asian languages: 3 +/-3 Speak English "very well" 3 +/-3
2 of 4 12/16/2016

Taylor County, Wisconsin
Estimate Margin of Error Speak English less than "very well" 0 +/-16
Tagalog: 28 +/-23 Speak English "very well" 19 +/-17 Speak English less than "very well" 9 +/-10
Other Pacific Island languages: 0 +/-16 Speak English "very well" 0 +/-16 Speak English less than "very well" 0 +/-16
Navajo: 0 +/-16 Speak English "very well" 0 +/-16 Speak English less than "very well" 0 +/-16
Other Native North American languages: 0 +/-16 Speak English "very well" 0 +/-16 Speak English less than "very well" 0 +/-16
Hungarian: 0 +/-16 Speak English "very well" 0 +/-16 Speak English less than "very well" 0 +/-16
Arabic: 11 +/-16 Speak English "very well" 6 +/-9 Speak English less than "very well" 5 +/-7
Hebrew: 0 +/-16 Speak English "very well" 0 +/-16 Speak English less than "very well" 0 +/-16
African languages: 3 +/-3 Speak English "very well" 0 +/-16 Speak English less than "very well" 3 +/-3
Other and unspecified languages: 0 +/-16 Speak English "very well" 0 +/-16 Speak English less than "very well" 0 +/-16
Data are based on a sample and are subject to sampling variability. The degree of uncertainty for an estimate arising from sampling variability is represented through the use of a margin of error. The value shown here is the 90 percent margin of error. The margin of error can be interpreted roughly as providing a 90 percent probability that the interval defined by the estimate minus the margin of error and the estimate plus the margin of error (the lower and upper confidence bounds) contains the true value. In addition to sampling variability, the ACS estimates are subject to nonsampling error (for a discussion of nonsampling variability, see Accuracy of the Data). The effect of nonsampling error is not represented in these tables.
Methodological changes to data collection in 2013 may have affected language data for 2013. Users should be aware of these changes when using multi-year data containing data from 2013. For more information, see: Language User Note.
While the 2011-2015 American Community Survey (ACS) data generally reflect the February 2013 Office of Management and Budget (OMB) definitions of metropolitan and micropolitan statistical areas; in certain instances the names, codes, and boundaries of the principal cities shown in ACS tables may differ from the OMB definitions due to differences in the effective dates of the geographic entities.
Estimates of urban and rural population, housing units, and characteristics reflect boundaries of urban areas defined based on Census 2010 data. As a result, data for urban and rural areas from the ACS do not necessarily reflect the results of ongoing urbanization.
Source: U.S. Census Bureau, 2011-2015 American Community Survey 5-Year Estimates
Explanation of Symbols:
1. An '**' entry in the margin of error column indicates that either no sample observations or too few sample observations were available to compute a standard error and thus the margin of error. A statistical test is not appropriate.
2. An '-' entry in the estimate column indicates that either no sample observations or too few sample observations were available to compute an estimate, or a ratio of medians cannot be calculated because one or both of the median estimates falls in the lowest interval or upper interval of an open-ended distribution.
3. An '-' following a median estimate means the median falls in the lowest interval of an open-ended distribution. 4. An '+' following a median estimate means the median falls in the upper interval of an open-ended distribution. 5. An '***' entry in the margin of error column indicates that the median falls in the lowest interval or upper interval of an open-ended distribution. A
statistical test is not appropriate. 6. An '*****' entry in the margin of error column indicates that the estimate is controlled. A statistical test for sampling variability is not appropriate.
3 of 4 12/16/2016

7. An 'N' entry in the estimate and margin of error columns indicates that data for this geographic area cannot be displayed because the number of sample cases is too small.
8. An '(X)' means that the estimate is not applicable or not available.

B16001 LANGUAGE SPOKEN AT HOME BY ABILITY TO SPEAK ENGLISH FOR THE POPULATION 5 YEARS AND OVER Universe: Population 5 years and over 2011-2015 American Community Survey 5-Year Estimates
Supporting documentation on code lists, subject definitions, data accuracy, and statistical testing can be found on the American Community Survey website in the Data and Documentation section.
Sample size and data quality measures (including coverage rates, allocation rates, and response rates) can be found on the American Community Survey website in the Methodology section.
Tell us what you think. Provide feedback to help make American Community Survey data more useful for you.
Although the American Community Survey (ACS) produces population, demographic and housing unit estimates, it is the Census Bureau's Population Estimates Program that produces and disseminates the official estimates of the population for the nation, states, counties, cities and towns and estimates of housing units for states and counties.
Trempealeau County, Wisconsin
Estimate Margin of Error Total: 27,429 +/-32 Speak only English 25,403 +/-167 Spanish or Spanish Creole: 1,353 +/-81 Speak English "very well" 595 +/-122 Speak English less than "very well" 758 +/-88
French (incl. Patois, Cajun): 45 +/-59 Speak English "very well" 45 +/-59 Speak English less than "very well" 0 +/-16
French Creole: 0 +/-16 Speak English "very well" 0 +/-16 Speak English less than "very well" 0 +/-16
Italian: 3 +/-4 Speak English "very well" 0 +/-16 Speak English less than "very well" 3 +/-4
Portuguese or Portuguese Creole: 1 +/-3 Speak English "very well" 0 +/-16 Speak English less than "very well" 1 +/-3
German: 255 +/-96 Speak English "very well" 177 +/-82 Speak English less than "very well" 78 +/-32
Yiddish: 0 +/-16 Speak English "very well" 0 +/-16 Speak English less than "very well" 0 +/-16
Other West Germanic languages: 71 +/-48 Speak English "very well" 41 +/-42 Speak English less than "very well" 30 +/-22
Scandinavian languages: 95 +/-30 Speak English "very well" 78 +/-25 Speak English less than "very well" 17 +/-12
Greek: 0 +/-16 Speak English "very well" 0 +/-16 Speak English less than "very well" 0 +/-16
1 of 4 12/16/2016

Trempealeau County, Wisconsin
Estimate Margin of Error Russian: 0 +/-16 Speak English "very well" 0 +/-16 Speak English less than "very well" 0 +/-16
Polish: 58 +/-29 Speak English "very well" 38 +/-23 Speak English less than "very well" 20 +/-13
Serbo-Croatian: 7 +/-10 Speak English "very well" 7 +/-10 Speak English less than "very well" 0 +/-16
Other Slavic languages: 2 +/-3 Speak English "very well" 2 +/-3 Speak English less than "very well" 0 +/-16
Armenian: 0 +/-16 Speak English "very well" 0 +/-16 Speak English less than "very well" 0 +/-16
Persian: 0 +/-16 Speak English "very well" 0 +/-16 Speak English less than "very well" 0 +/-16
Gujarati: 0 +/-16 Speak English "very well" 0 +/-16 Speak English less than "very well" 0 +/-16
Hindi: 0 +/-16 Speak English "very well" 0 +/-16 Speak English less than "very well" 0 +/-16
Urdu: 0 +/-16 Speak English "very well" 0 +/-16 Speak English less than "very well" 0 +/-16
Other Indic languages: 0 +/-16 Speak English "very well" 0 +/-16 Speak English less than "very well" 0 +/-16
Other Indo-European languages: 7 +/-10 Speak English "very well" 7 +/-10 Speak English less than "very well" 0 +/-16
Chinese: 10 +/-15 Speak English "very well" 10 +/-15 Speak English less than "very well" 0 +/-16
Japanese: 3 +/-5 Speak English "very well" 3 +/-5 Speak English less than "very well" 0 +/-16
Korean: 6 +/-7 Speak English "very well" 6 +/-7 Speak English less than "very well" 0 +/-16
Mon-Khmer, Cambodian: 0 +/-16 Speak English "very well" 0 +/-16 Speak English less than "very well" 0 +/-16
Hmong: 34 +/-27 Speak English "very well" 7 +/-10 Speak English less than "very well" 27 +/-24
Thai: 10 +/-12 Speak English "very well" 4 +/-5 Speak English less than "very well" 6 +/-7
Laotian: 0 +/-16 Speak English "very well" 0 +/-16 Speak English less than "very well" 0 +/-16
Vietnamese: 4 +/-5 Speak English "very well" 4 +/-5 Speak English less than "very well" 0 +/-16
Other Asian languages: 0 +/-16 Speak English "very well" 0 +/-16
2 of 4 12/16/2016

Trempealeau County, Wisconsin
Estimate Margin of Error Speak English less than "very well" 0 +/-16
Tagalog: 21 +/-14 Speak English "very well" 9 +/-8 Speak English less than "very well" 12 +/-11
Other Pacific Island languages: 0 +/-16 Speak English "very well" 0 +/-16 Speak English less than "very well" 0 +/-16
Navajo: 0 +/-16 Speak English "very well" 0 +/-16 Speak English less than "very well" 0 +/-16
Other Native North American languages: 15 +/-18 Speak English "very well" 15 +/-18 Speak English less than "very well" 0 +/-16
Hungarian: 0 +/-16 Speak English "very well" 0 +/-16 Speak English less than "very well" 0 +/-16
Arabic: 0 +/-16 Speak English "very well" 0 +/-16 Speak English less than "very well" 0 +/-16
Hebrew: 6 +/-8 Speak English "very well" 6 +/-8 Speak English less than "very well" 0 +/-16
African languages: 20 +/-24 Speak English "very well" 20 +/-24 Speak English less than "very well" 0 +/-16
Other and unspecified languages: 0 +/-16 Speak English "very well" 0 +/-16 Speak English less than "very well" 0 +/-16
Data are based on a sample and are subject to sampling variability. The degree of uncertainty for an estimate arising from sampling variability is represented through the use of a margin of error. The value shown here is the 90 percent margin of error. The margin of error can be interpreted roughly as providing a 90 percent probability that the interval defined by the estimate minus the margin of error and the estimate plus the margin of error (the lower and upper confidence bounds) contains the true value. In addition to sampling variability, the ACS estimates are subject to nonsampling error (for a discussion of nonsampling variability, see Accuracy of the Data). The effect of nonsampling error is not represented in these tables.
Methodological changes to data collection in 2013 may have affected language data for 2013. Users should be aware of these changes when using multi-year data containing data from 2013. For more information, see: Language User Note.
While the 2011-2015 American Community Survey (ACS) data generally reflect the February 2013 Office of Management and Budget (OMB) definitions of metropolitan and micropolitan statistical areas; in certain instances the names, codes, and boundaries of the principal cities shown in ACS tables may differ from the OMB definitions due to differences in the effective dates of the geographic entities.
Estimates of urban and rural population, housing units, and characteristics reflect boundaries of urban areas defined based on Census 2010 data. As a result, data for urban and rural areas from the ACS do not necessarily reflect the results of ongoing urbanization.
Source: U.S. Census Bureau, 2011-2015 American Community Survey 5-Year Estimates
Explanation of Symbols:
1. An '**' entry in the margin of error column indicates that either no sample observations or too few sample observations were available to compute a standard error and thus the margin of error. A statistical test is not appropriate.
2. An '-' entry in the estimate column indicates that either no sample observations or too few sample observations were available to compute an estimate, or a ratio of medians cannot be calculated because one or both of the median estimates falls in the lowest interval or upper interval of an open-ended distribution.
3. An '-' following a median estimate means the median falls in the lowest interval of an open-ended distribution. 4. An '+' following a median estimate means the median falls in the upper interval of an open-ended distribution. 5. An '***' entry in the margin of error column indicates that the median falls in the lowest interval or upper interval of an open-ended distribution. A
statistical test is not appropriate. 6. An '*****' entry in the margin of error column indicates that the estimate is controlled. A statistical test for sampling variability is not appropriate.
3 of 4 12/16/2016

7. An 'N' entry in the estimate and margin of error columns indicates that data for this geographic area cannot be displayed because the number of sample cases is too small.
8. An '(X)' means that the estimate is not applicable or not available.

B16001 LANGUAGE SPOKEN AT HOME BY ABILITY TO SPEAK ENGLISH FOR THE POPULATION 5 YEARS AND OVER Universe: Population 5 years and over 2011-2015 American Community Survey 5-Year Estimates
Supporting documentation on code lists, subject definitions, data accuracy, and statistical testing can be found on the American Community Survey website in the Data and Documentation section.
Sample size and data quality measures (including coverage rates, allocation rates, and response rates) can be found on the American Community Survey website in the Methodology section.
Tell us what you think. Provide feedback to help make American Community Survey data more useful for you.
Although the American Community Survey (ACS) produces population, demographic and housing unit estimates, it is the Census Bureau's Population Estimates Program that produces and disseminates the official estimates of the population for the nation, states, counties, cities and towns and estimates of housing units for states and counties.
Vernon County, Wisconsin
Estimate Margin of Error Total: 28,165 +/-24 Speak only English 24,879 +/-322 Spanish or Spanish Creole: 356 +/-89 Speak English "very well" 223 +/-70 Speak English less than "very well" 133 +/-54
French (incl. Patois, Cajun): 38 +/-27 Speak English "very well" 19 +/-13 Speak English less than "very well" 19 +/-25
French Creole: 3 +/-5 Speak English "very well" 3 +/-5 Speak English less than "very well" 0 +/-18
Italian: 10 +/-9 Speak English "very well" 10 +/-9 Speak English less than "very well" 0 +/-18
Portuguese or Portuguese Creole: 0 +/-18 Speak English "very well" 0 +/-18 Speak English less than "very well" 0 +/-18
German: 1,574 +/-302 Speak English "very well" 1,137 +/-274 Speak English less than "very well" 437 +/-86
Yiddish: 0 +/-18 Speak English "very well" 0 +/-18 Speak English less than "very well" 0 +/-18
Other West Germanic languages: 933 +/-257 Speak English "very well" 569 +/-197 Speak English less than "very well" 364 +/-122
Scandinavian languages: 189 +/-69 Speak English "very well" 173 +/-69 Speak English less than "very well" 16 +/-8
Greek: 4 +/-4 Speak English "very well" 4 +/-4 Speak English less than "very well" 0 +/-18
1 of 4 12/16/2016

Vernon County, Wisconsin
Estimate Margin of Error Russian: 0 +/-18 Speak English "very well" 0 +/-18 Speak English less than "very well" 0 +/-18
Polish: 2 +/-2 Speak English "very well" 2 +/-2 Speak English less than "very well" 0 +/-18
Serbo-Croatian: 0 +/-18 Speak English "very well" 0 +/-18 Speak English less than "very well" 0 +/-18
Other Slavic languages: 32 +/-23 Speak English "very well" 27 +/-23 Speak English less than "very well" 5 +/-6
Armenian: 0 +/-18 Speak English "very well" 0 +/-18 Speak English less than "very well" 0 +/-18
Persian: 0 +/-18 Speak English "very well" 0 +/-18 Speak English less than "very well" 0 +/-18
Gujarati: 0 +/-18 Speak English "very well" 0 +/-18 Speak English less than "very well" 0 +/-18
Hindi: 0 +/-18 Speak English "very well" 0 +/-18 Speak English less than "very well" 0 +/-18
Urdu: 0 +/-18 Speak English "very well" 0 +/-18 Speak English less than "very well" 0 +/-18
Other Indic languages: 2 +/-3 Speak English "very well" 2 +/-3 Speak English less than "very well" 0 +/-18
Other Indo-European languages: 2 +/-2 Speak English "very well" 2 +/-2 Speak English less than "very well" 0 +/-18
Chinese: 77 +/-60 Speak English "very well" 70 +/-63 Speak English less than "very well" 7 +/-10
Japanese: 2 +/-3 Speak English "very well" 2 +/-3 Speak English less than "very well" 0 +/-18
Korean: 0 +/-18 Speak English "very well" 0 +/-18 Speak English less than "very well" 0 +/-18
Mon-Khmer, Cambodian: 0 +/-18 Speak English "very well" 0 +/-18 Speak English less than "very well" 0 +/-18
Hmong: 17 +/-20 Speak English "very well" 16 +/-20 Speak English less than "very well" 1 +/-2
Thai: 2 +/-3 Speak English "very well" 2 +/-3 Speak English less than "very well" 0 +/-18
Laotian: 0 +/-18 Speak English "very well" 0 +/-18 Speak English less than "very well" 0 +/-18
Vietnamese: 0 +/-18 Speak English "very well" 0 +/-18 Speak English less than "very well" 0 +/-18
Other Asian languages: 1 +/-3 Speak English "very well" 1 +/-3
2 of 4 12/16/2016

Vernon County, Wisconsin
Estimate Margin of Error Speak English less than "very well" 0 +/-18
Tagalog: 16 +/-14 Speak English "very well" 8 +/-7 Speak English less than "very well" 8 +/-11
Other Pacific Island languages: 0 +/-18 Speak English "very well" 0 +/-18 Speak English less than "very well" 0 +/-18
Navajo: 0 +/-18 Speak English "very well" 0 +/-18 Speak English less than "very well" 0 +/-18
Other Native North American languages: 14 +/-15 Speak English "very well" 14 +/-15 Speak English less than "very well" 0 +/-18
Hungarian: 0 +/-18 Speak English "very well" 0 +/-18 Speak English less than "very well" 0 +/-18
Arabic: 0 +/-18 Speak English "very well" 0 +/-18 Speak English less than "very well" 0 +/-18
Hebrew: 6 +/-10 Speak English "very well" 6 +/-10 Speak English less than "very well" 0 +/-18
African languages: 4 +/-5 Speak English "very well" 2 +/-3 Speak English less than "very well" 2 +/-3
Other and unspecified languages: 2 +/-3 Speak English "very well" 2 +/-3 Speak English less than "very well" 0 +/-18
Data are based on a sample and are subject to sampling variability. The degree of uncertainty for an estimate arising from sampling variability is represented through the use of a margin of error. The value shown here is the 90 percent margin of error. The margin of error can be interpreted roughly as providing a 90 percent probability that the interval defined by the estimate minus the margin of error and the estimate plus the margin of error (the lower and upper confidence bounds) contains the true value. In addition to sampling variability, the ACS estimates are subject to nonsampling error (for a discussion of nonsampling variability, see Accuracy of the Data). The effect of nonsampling error is not represented in these tables.
Methodological changes to data collection in 2013 may have affected language data for 2013. Users should be aware of these changes when using multi-year data containing data from 2013. For more information, see: Language User Note.
While the 2011-2015 American Community Survey (ACS) data generally reflect the February 2013 Office of Management and Budget (OMB) definitions of metropolitan and micropolitan statistical areas; in certain instances the names, codes, and boundaries of the principal cities shown in ACS tables may differ from the OMB definitions due to differences in the effective dates of the geographic entities.
Estimates of urban and rural population, housing units, and characteristics reflect boundaries of urban areas defined based on Census 2010 data. As a result, data for urban and rural areas from the ACS do not necessarily reflect the results of ongoing urbanization.
Source: U.S. Census Bureau, 2011-2015 American Community Survey 5-Year Estimates
Explanation of Symbols:
1. An '**' entry in the margin of error column indicates that either no sample observations or too few sample observations were available to compute a standard error and thus the margin of error. A statistical test is not appropriate.
2. An '-' entry in the estimate column indicates that either no sample observations or too few sample observations were available to compute an estimate, or a ratio of medians cannot be calculated because one or both of the median estimates falls in the lowest interval or upper interval of an open-ended distribution.
3. An '-' following a median estimate means the median falls in the lowest interval of an open-ended distribution. 4. An '+' following a median estimate means the median falls in the upper interval of an open-ended distribution. 5. An '***' entry in the margin of error column indicates that the median falls in the lowest interval or upper interval of an open-ended distribution. A
statistical test is not appropriate. 6. An '*****' entry in the margin of error column indicates that the estimate is controlled. A statistical test for sampling variability is not appropriate.
3 of 4 12/16/2016

7. An 'N' entry in the estimate and margin of error columns indicates that data for this geographic area cannot be displayed because the number of sample cases is too small.
8. An '(X)' means that the estimate is not applicable or not available.

B16001 LANGUAGE SPOKEN AT HOME BY ABILITY TO SPEAK ENGLISH FOR THE POPULATION 5 YEARS AND OVER Universe: Population 5 years and over 2011-2015 American Community Survey 5-Year Estimates
Supporting documentation on code lists, subject definitions, data accuracy, and statistical testing can be found on the American Community Survey website in the Data and Documentation section.
Sample size and data quality measures (including coverage rates, allocation rates, and response rates) can be found on the American Community Survey website in the Methodology section.
Tell us what you think. Provide feedback to help make American Community Survey data more useful for you.
Although the American Community Survey (ACS) produces population, demographic and housing unit estimates, it is the Census Bureau's Population Estimates Program that produces and disseminates the official estimates of the population for the nation, states, counties, cities and towns and estimates of housing units for states and counties.
Vilas County, Wisconsin
Estimate Margin of Error Total: 20,551 +/-15 Speak only English 19,928 +/-134 Spanish or Spanish Creole: 203 +/-80 Speak English "very well" 169 +/-76 Speak English less than "very well" 34 +/-28
French (incl. Patois, Cajun): 19 +/-13 Speak English "very well" 17 +/-13 Speak English less than "very well" 2 +/-3
French Creole: 0 +/-16 Speak English "very well" 0 +/-16 Speak English less than "very well" 0 +/-16
Italian: 0 +/-16 Speak English "very well" 0 +/-16 Speak English less than "very well" 0 +/-16
Portuguese or Portuguese Creole: 3 +/-5 Speak English "very well" 3 +/-5 Speak English less than "very well" 0 +/-16
German: 115 +/-43 Speak English "very well" 77 +/-28 Speak English less than "very well" 38 +/-28
Yiddish: 5 +/-11 Speak English "very well" 5 +/-11 Speak English less than "very well" 0 +/-16
Other West Germanic languages: 8 +/-9 Speak English "very well" 8 +/-9 Speak English less than "very well" 0 +/-16
Scandinavian languages: 8 +/-8 Speak English "very well" 8 +/-8 Speak English less than "very well" 0 +/-16
Greek: 0 +/-16 Speak English "very well" 0 +/-16 Speak English less than "very well" 0 +/-16
1 of 4 12/16/2016
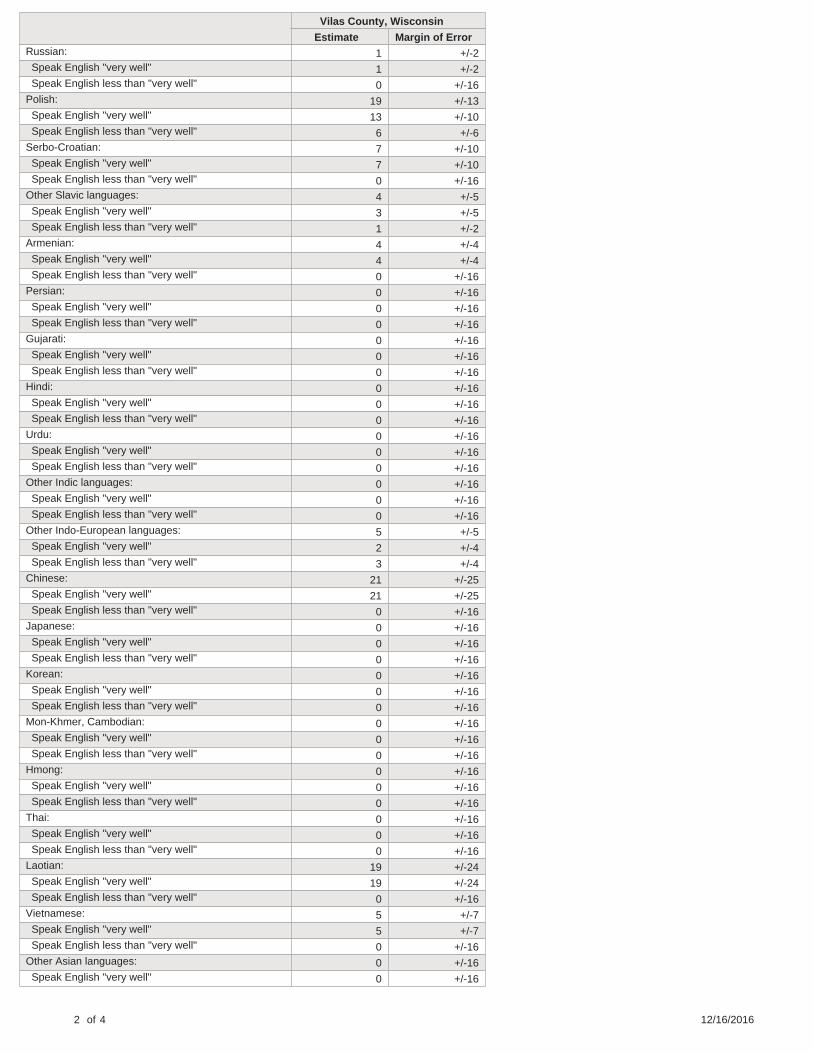
Vilas County, Wisconsin
Estimate Margin of Error Russian: 1 +/-2 Speak English "very well" 1 +/-2 Speak English less than "very well" 0 +/-16
Polish: 19 +/-13 Speak English "very well" 13 +/-10 Speak English less than "very well" 6 +/-6
Serbo-Croatian: 7 +/-10 Speak English "very well" 7 +/-10 Speak English less than "very well" 0 +/-16
Other Slavic languages: 4 +/-5 Speak English "very well" 3 +/-5 Speak English less than "very well" 1 +/-2
Armenian: 4 +/-4 Speak English "very well" 4 +/-4 Speak English less than "very well" 0 +/-16
Persian: 0 +/-16 Speak English "very well" 0 +/-16 Speak English less than "very well" 0 +/-16
Gujarati: 0 +/-16 Speak English "very well" 0 +/-16 Speak English less than "very well" 0 +/-16
Hindi: 0 +/-16 Speak English "very well" 0 +/-16 Speak English less than "very well" 0 +/-16
Urdu: 0 +/-16 Speak English "very well" 0 +/-16 Speak English less than "very well" 0 +/-16
Other Indic languages: 0 +/-16 Speak English "very well" 0 +/-16 Speak English less than "very well" 0 +/-16
Other Indo-European languages: 5 +/-5 Speak English "very well" 2 +/-4 Speak English less than "very well" 3 +/-4
Chinese: 21 +/-25 Speak English "very well" 21 +/-25 Speak English less than "very well" 0 +/-16
Japanese: 0 +/-16 Speak English "very well" 0 +/-16 Speak English less than "very well" 0 +/-16
Korean: 0 +/-16 Speak English "very well" 0 +/-16 Speak English less than "very well" 0 +/-16
Mon-Khmer, Cambodian: 0 +/-16 Speak English "very well" 0 +/-16 Speak English less than "very well" 0 +/-16
Hmong: 0 +/-16 Speak English "very well" 0 +/-16 Speak English less than "very well" 0 +/-16
Thai: 0 +/-16 Speak English "very well" 0 +/-16 Speak English less than "very well" 0 +/-16
Laotian: 19 +/-24 Speak English "very well" 19 +/-24 Speak English less than "very well" 0 +/-16
Vietnamese: 5 +/-7 Speak English "very well" 5 +/-7 Speak English less than "very well" 0 +/-16
Other Asian languages: 0 +/-16 Speak English "very well" 0 +/-16
2 of 4 12/16/2016

Vilas County, Wisconsin
Estimate Margin of Error Speak English less than "very well" 0 +/-16
Tagalog: 16 +/-16 Speak English "very well" 5 +/-7 Speak English less than "very well" 11 +/-14
Other Pacific Island languages: 6 +/-10 Speak English "very well" 0 +/-16 Speak English less than "very well" 6 +/-10
Navajo: 0 +/-16 Speak English "very well" 0 +/-16 Speak English less than "very well" 0 +/-16
Other Native North American languages: 142 +/-56 Speak English "very well" 137 +/-57 Speak English less than "very well" 5 +/-7
Hungarian: 0 +/-16 Speak English "very well" 0 +/-16 Speak English less than "very well" 0 +/-16
Arabic: 0 +/-16 Speak English "very well" 0 +/-16 Speak English less than "very well" 0 +/-16
Hebrew: 0 +/-16 Speak English "very well" 0 +/-16 Speak English less than "very well" 0 +/-16
African languages: 0 +/-16 Speak English "very well" 0 +/-16 Speak English less than "very well" 0 +/-16
Other and unspecified languages: 13 +/-15 Speak English "very well" 5 +/-7 Speak English less than "very well" 8 +/-13
Data are based on a sample and are subject to sampling variability. The degree of uncertainty for an estimate arising from sampling variability is represented through the use of a margin of error. The value shown here is the 90 percent margin of error. The margin of error can be interpreted roughly as providing a 90 percent probability that the interval defined by the estimate minus the margin of error and the estimate plus the margin of error (the lower and upper confidence bounds) contains the true value. In addition to sampling variability, the ACS estimates are subject to nonsampling error (for a discussion of nonsampling variability, see Accuracy of the Data). The effect of nonsampling error is not represented in these tables.
Methodological changes to data collection in 2013 may have affected language data for 2013. Users should be aware of these changes when using multi-year data containing data from 2013. For more information, see: Language User Note.
While the 2011-2015 American Community Survey (ACS) data generally reflect the February 2013 Office of Management and Budget (OMB) definitions of metropolitan and micropolitan statistical areas; in certain instances the names, codes, and boundaries of the principal cities shown in ACS tables may differ from the OMB definitions due to differences in the effective dates of the geographic entities.
Estimates of urban and rural population, housing units, and characteristics reflect boundaries of urban areas defined based on Census 2010 data. As a result, data for urban and rural areas from the ACS do not necessarily reflect the results of ongoing urbanization.
Source: U.S. Census Bureau, 2011-2015 American Community Survey 5-Year Estimates
Explanation of Symbols:
1. An '**' entry in the margin of error column indicates that either no sample observations or too few sample observations were available to compute a standard error and thus the margin of error. A statistical test is not appropriate.
2. An '-' entry in the estimate column indicates that either no sample observations or too few sample observations were available to compute an estimate, or a ratio of medians cannot be calculated because one or both of the median estimates falls in the lowest interval or upper interval of an open-ended distribution.
3. An '-' following a median estimate means the median falls in the lowest interval of an open-ended distribution. 4. An '+' following a median estimate means the median falls in the upper interval of an open-ended distribution. 5. An '***' entry in the margin of error column indicates that the median falls in the lowest interval or upper interval of an open-ended distribution. A
statistical test is not appropriate. 6. An '*****' entry in the margin of error column indicates that the estimate is controlled. A statistical test for sampling variability is not appropriate.
3 of 4 12/16/2016

7. An 'N' entry in the estimate and margin of error columns indicates that data for this geographic area cannot be displayed because the number of sample cases is too small.
8. An '(X)' means that the estimate is not applicable or not available.

B16001 LANGUAGE SPOKEN AT HOME BY ABILITY TO SPEAK ENGLISH FOR THE POPULATION 5 YEARS AND OVER Universe: Population 5 years and over 2011-2015 American Community Survey 5-Year Estimates
Supporting documentation on code lists, subject definitions, data accuracy, and statistical testing can be found on the American Community Survey website in the Data and Documentation section.
Sample size and data quality measures (including coverage rates, allocation rates, and response rates) can be found on the American Community Survey website in the Methodology section.
Tell us what you think. Provide feedback to help make American Community Survey data more useful for you.
Although the American Community Survey (ACS) produces population, demographic and housing unit estimates, it is the Census Bureau's Population Estimates Program that produces and disseminates the official estimates of the population for the nation, states, counties, cities and towns and estimates of housing units for states and counties.
Walworth County, Wisconsin
Estimate Margin of Error Total: 97,504 +/-45 Speak only English 87,159 +/-602 Spanish or Spanish Creole: 7,976 +/-463 Speak English "very well" 4,356 +/-390 Speak English less than "very well" 3,620 +/-350
French (incl. Patois, Cajun): 85 +/-48 Speak English "very well" 79 +/-46 Speak English less than "very well" 6 +/-6
French Creole: 0 +/-20 Speak English "very well" 0 +/-20 Speak English less than "very well" 0 +/-20
Italian: 55 +/-31 Speak English "very well" 40 +/-26 Speak English less than "very well" 15 +/-14
Portuguese or Portuguese Creole: 92 +/-103 Speak English "very well" 89 +/-103 Speak English less than "very well" 3 +/-4
German: 413 +/-142 Speak English "very well" 363 +/-124 Speak English less than "very well" 50 +/-37
Yiddish: 0 +/-20 Speak English "very well" 0 +/-20 Speak English less than "very well" 0 +/-20
Other West Germanic languages: 27 +/-19 Speak English "very well" 23 +/-18 Speak English less than "very well" 4 +/-6
Scandinavian languages: 89 +/-45 Speak English "very well" 89 +/-45 Speak English less than "very well" 0 +/-20
Greek: 30 +/-25 Speak English "very well" 25 +/-24 Speak English less than "very well" 5 +/-8
1 of 4 12/16/2016

Walworth County, Wisconsin
Estimate Margin of Error Russian: 115 +/-87 Speak English "very well" 56 +/-40 Speak English less than "very well" 59 +/-50
Polish: 225 +/-99 Speak English "very well" 134 +/-87 Speak English less than "very well" 91 +/-43
Serbo-Croatian: 13 +/-16 Speak English "very well" 13 +/-16 Speak English less than "very well" 0 +/-20
Other Slavic languages: 160 +/-145 Speak English "very well" 54 +/-65 Speak English less than "very well" 106 +/-94
Armenian: 8 +/-8 Speak English "very well" 8 +/-8 Speak English less than "very well" 0 +/-20
Persian: 0 +/-20 Speak English "very well" 0 +/-20 Speak English less than "very well" 0 +/-20
Gujarati: 71 +/-70 Speak English "very well" 35 +/-44 Speak English less than "very well" 36 +/-33
Hindi: 131 +/-114 Speak English "very well" 121 +/-113 Speak English less than "very well" 10 +/-15
Urdu: 0 +/-20 Speak English "very well" 0 +/-20 Speak English less than "very well" 0 +/-20
Other Indic languages: 19 +/-19 Speak English "very well" 19 +/-19 Speak English less than "very well" 0 +/-20
Other Indo-European languages: 149 +/-167 Speak English "very well" 90 +/-85 Speak English less than "very well" 59 +/-84
Chinese: 180 +/-84 Speak English "very well" 69 +/-66 Speak English less than "very well" 111 +/-86
Japanese: 113 +/-73 Speak English "very well" 95 +/-72 Speak English less than "very well" 18 +/-28
Korean: 7 +/-11 Speak English "very well" 0 +/-20 Speak English less than "very well" 7 +/-11
Mon-Khmer, Cambodian: 9 +/-11 Speak English "very well" 9 +/-11 Speak English less than "very well" 0 +/-20
Hmong: 41 +/-49 Speak English "very well" 31 +/-47 Speak English less than "very well" 10 +/-14
Thai: 30 +/-30 Speak English "very well" 4 +/-7 Speak English less than "very well" 26 +/-28
Laotian: 0 +/-20 Speak English "very well" 0 +/-20 Speak English less than "very well" 0 +/-20
Vietnamese: 83 +/-74 Speak English "very well" 30 +/-44 Speak English less than "very well" 53 +/-37
Other Asian languages: 4 +/-6 Speak English "very well" 4 +/-6
2 of 4 12/16/2016

Walworth County, Wisconsin
Estimate Margin of Error Speak English less than "very well" 0 +/-20
Tagalog: 37 +/-33 Speak English "very well" 22 +/-19 Speak English less than "very well" 15 +/-19
Other Pacific Island languages: 60 +/-81 Speak English "very well" 58 +/-81 Speak English less than "very well" 2 +/-5
Navajo: 0 +/-20 Speak English "very well" 0 +/-20 Speak English less than "very well" 0 +/-20
Other Native North American languages: 13 +/-22 Speak English "very well" 13 +/-22 Speak English less than "very well" 0 +/-20
Hungarian: 8 +/-9 Speak English "very well" 3 +/-4 Speak English less than "very well" 5 +/-8
Arabic: 62 +/-57 Speak English "very well" 62 +/-57 Speak English less than "very well" 0 +/-20
Hebrew: 0 +/-20 Speak English "very well" 0 +/-20 Speak English less than "very well" 0 +/-20
African languages: 40 +/-40 Speak English "very well" 40 +/-40 Speak English less than "very well" 0 +/-20
Other and unspecified languages: 0 +/-20 Speak English "very well" 0 +/-20 Speak English less than "very well" 0 +/-20
Data are based on a sample and are subject to sampling variability. The degree of uncertainty for an estimate arising from sampling variability is represented through the use of a margin of error. The value shown here is the 90 percent margin of error. The margin of error can be interpreted roughly as providing a 90 percent probability that the interval defined by the estimate minus the margin of error and the estimate plus the margin of error (the lower and upper confidence bounds) contains the true value. In addition to sampling variability, the ACS estimates are subject to nonsampling error (for a discussion of nonsampling variability, see Accuracy of the Data). The effect of nonsampling error is not represented in these tables.
Methodological changes to data collection in 2013 may have affected language data for 2013. Users should be aware of these changes when using multi-year data containing data from 2013. For more information, see: Language User Note.
While the 2011-2015 American Community Survey (ACS) data generally reflect the February 2013 Office of Management and Budget (OMB) definitions of metropolitan and micropolitan statistical areas; in certain instances the names, codes, and boundaries of the principal cities shown in ACS tables may differ from the OMB definitions due to differences in the effective dates of the geographic entities.
Estimates of urban and rural population, housing units, and characteristics reflect boundaries of urban areas defined based on Census 2010 data. As a result, data for urban and rural areas from the ACS do not necessarily reflect the results of ongoing urbanization.
Source: U.S. Census Bureau, 2011-2015 American Community Survey 5-Year Estimates
Explanation of Symbols:
1. An '**' entry in the margin of error column indicates that either no sample observations or too few sample observations were available to compute a standard error and thus the margin of error. A statistical test is not appropriate.
2. An '-' entry in the estimate column indicates that either no sample observations or too few sample observations were available to compute an estimate, or a ratio of medians cannot be calculated because one or both of the median estimates falls in the lowest interval or upper interval of an open-ended distribution.
3. An '-' following a median estimate means the median falls in the lowest interval of an open-ended distribution. 4. An '+' following a median estimate means the median falls in the upper interval of an open-ended distribution. 5. An '***' entry in the margin of error column indicates that the median falls in the lowest interval or upper interval of an open-ended distribution. A
statistical test is not appropriate. 6. An '*****' entry in the margin of error column indicates that the estimate is controlled. A statistical test for sampling variability is not appropriate.
3 of 4 12/16/2016

7. An 'N' entry in the estimate and margin of error columns indicates that data for this geographic area cannot be displayed because the number of sample cases is too small.
8. An '(X)' means that the estimate is not applicable or not available.

B16001 LANGUAGE SPOKEN AT HOME BY ABILITY TO SPEAK ENGLISH FOR THE POPULATION 5 YEARS AND OVER Universe: Population 5 years and over 2011-2015 American Community Survey 5-Year Estimates
Supporting documentation on code lists, subject definitions, data accuracy, and statistical testing can be found on the American Community Survey website in the Data and Documentation section.
Sample size and data quality measures (including coverage rates, allocation rates, and response rates) can be found on the American Community Survey website in the Methodology section.
Tell us what you think. Provide feedback to help make American Community Survey data more useful for you.
Although the American Community Survey (ACS) produces population, demographic and housing unit estimates, it is the Census Bureau's Population Estimates Program that produces and disseminates the official estimates of the population for the nation, states, counties, cities and towns and estimates of housing units for states and counties.
Washburn County, Wisconsin
Estimate Margin of Error Total: 14,908 +/-32 Speak only English 14,572 +/-65 Spanish or Spanish Creole: 128 +/-38 Speak English "very well" 108 +/-35 Speak English less than "very well" 20 +/-12
French (incl. Patois, Cajun): 17 +/-11 Speak English "very well" 12 +/-10 Speak English less than "very well" 5 +/-5
French Creole: 0 +/-14 Speak English "very well" 0 +/-14 Speak English less than "very well" 0 +/-14
Italian: 0 +/-14 Speak English "very well" 0 +/-14 Speak English less than "very well" 0 +/-14
Portuguese or Portuguese Creole: 0 +/-14 Speak English "very well" 0 +/-14 Speak English less than "very well" 0 +/-14
German: 63 +/-20 Speak English "very well" 52 +/-18 Speak English less than "very well" 11 +/-7
Yiddish: 0 +/-14 Speak English "very well" 0 +/-14 Speak English less than "very well" 0 +/-14
Other West Germanic languages: 6 +/-6 Speak English "very well" 6 +/-6 Speak English less than "very well" 0 +/-14
Scandinavian languages: 12 +/-8 Speak English "very well" 12 +/-8 Speak English less than "very well" 0 +/-14
Greek: 0 +/-14 Speak English "very well" 0 +/-14 Speak English less than "very well" 0 +/-14
1 of 4 12/16/2016

Washburn County, Wisconsin
Estimate Margin of Error Russian: 10 +/-8 Speak English "very well" 10 +/-8 Speak English less than "very well" 0 +/-14
Polish: 3 +/-3 Speak English "very well" 3 +/-3 Speak English less than "very well" 0 +/-14
Serbo-Croatian: 0 +/-14 Speak English "very well" 0 +/-14 Speak English less than "very well" 0 +/-14
Other Slavic languages: 17 +/-12 Speak English "very well" 12 +/-10 Speak English less than "very well" 5 +/-7
Armenian: 0 +/-14 Speak English "very well" 0 +/-14 Speak English less than "very well" 0 +/-14
Persian: 3 +/-4 Speak English "very well" 0 +/-14 Speak English less than "very well" 3 +/-4
Gujarati: 0 +/-14 Speak English "very well" 0 +/-14 Speak English less than "very well" 0 +/-14
Hindi: 8 +/-11 Speak English "very well" 0 +/-14 Speak English less than "very well" 8 +/-11
Urdu: 0 +/-14 Speak English "very well" 0 +/-14 Speak English less than "very well" 0 +/-14
Other Indic languages: 12 +/-13 Speak English "very well" 6 +/-8 Speak English less than "very well" 6 +/-7
Other Indo-European languages: 0 +/-14 Speak English "very well" 0 +/-14 Speak English less than "very well" 0 +/-14
Chinese: 4 +/-5 Speak English "very well" 2 +/-3 Speak English less than "very well" 2 +/-3
Japanese: 6 +/-8 Speak English "very well" 6 +/-8 Speak English less than "very well" 0 +/-14
Korean: 0 +/-14 Speak English "very well" 0 +/-14 Speak English less than "very well" 0 +/-14
Mon-Khmer, Cambodian: 0 +/-14 Speak English "very well" 0 +/-14 Speak English less than "very well" 0 +/-14
Hmong: 0 +/-14 Speak English "very well" 0 +/-14 Speak English less than "very well" 0 +/-14
Thai: 0 +/-14 Speak English "very well" 0 +/-14 Speak English less than "very well" 0 +/-14
Laotian: 0 +/-14 Speak English "very well" 0 +/-14 Speak English less than "very well" 0 +/-14
Vietnamese: 0 +/-14 Speak English "very well" 0 +/-14 Speak English less than "very well" 0 +/-14
Other Asian languages: 23 +/-27 Speak English "very well" 18 +/-21
2 of 4 12/16/2016

Washburn County, Wisconsin
Estimate Margin of Error Speak English less than "very well" 5 +/-6
Tagalog: 14 +/-10 Speak English "very well" 6 +/-7 Speak English less than "very well" 8 +/-8
Other Pacific Island languages: 0 +/-14 Speak English "very well" 0 +/-14 Speak English less than "very well" 0 +/-14
Navajo: 0 +/-14 Speak English "very well" 0 +/-14 Speak English less than "very well" 0 +/-14
Other Native North American languages: 7 +/-7 Speak English "very well" 7 +/-7 Speak English less than "very well" 0 +/-14
Hungarian: 3 +/-5 Speak English "very well" 0 +/-14 Speak English less than "very well" 3 +/-5
Arabic: 0 +/-14 Speak English "very well" 0 +/-14 Speak English less than "very well" 0 +/-14
Hebrew: 0 +/-14 Speak English "very well" 0 +/-14 Speak English less than "very well" 0 +/-14
African languages: 0 +/-14 Speak English "very well" 0 +/-14 Speak English less than "very well" 0 +/-14
Other and unspecified languages: 0 +/-14 Speak English "very well" 0 +/-14 Speak English less than "very well" 0 +/-14
Data are based on a sample and are subject to sampling variability. The degree of uncertainty for an estimate arising from sampling variability is represented through the use of a margin of error. The value shown here is the 90 percent margin of error. The margin of error can be interpreted roughly as providing a 90 percent probability that the interval defined by the estimate minus the margin of error and the estimate plus the margin of error (the lower and upper confidence bounds) contains the true value. In addition to sampling variability, the ACS estimates are subject to nonsampling error (for a discussion of nonsampling variability, see Accuracy of the Data). The effect of nonsampling error is not represented in these tables.
Methodological changes to data collection in 2013 may have affected language data for 2013. Users should be aware of these changes when using multi-year data containing data from 2013. For more information, see: Language User Note.
While the 2011-2015 American Community Survey (ACS) data generally reflect the February 2013 Office of Management and Budget (OMB) definitions of metropolitan and micropolitan statistical areas; in certain instances the names, codes, and boundaries of the principal cities shown in ACS tables may differ from the OMB definitions due to differences in the effective dates of the geographic entities.
Estimates of urban and rural population, housing units, and characteristics reflect boundaries of urban areas defined based on Census 2010 data. As a result, data for urban and rural areas from the ACS do not necessarily reflect the results of ongoing urbanization.
Source: U.S. Census Bureau, 2011-2015 American Community Survey 5-Year Estimates
Explanation of Symbols:
1. An '**' entry in the margin of error column indicates that either no sample observations or too few sample observations were available to compute a standard error and thus the margin of error. A statistical test is not appropriate.
2. An '-' entry in the estimate column indicates that either no sample observations or too few sample observations were available to compute an estimate, or a ratio of medians cannot be calculated because one or both of the median estimates falls in the lowest interval or upper interval of an open-ended distribution.
3. An '-' following a median estimate means the median falls in the lowest interval of an open-ended distribution. 4. An '+' following a median estimate means the median falls in the upper interval of an open-ended distribution. 5. An '***' entry in the margin of error column indicates that the median falls in the lowest interval or upper interval of an open-ended distribution. A
statistical test is not appropriate. 6. An '*****' entry in the margin of error column indicates that the estimate is controlled. A statistical test for sampling variability is not appropriate.
3 of 4 12/16/2016

7. An 'N' entry in the estimate and margin of error columns indicates that data for this geographic area cannot be displayed because the number of sample cases is too small.
8. An '(X)' means that the estimate is not applicable or not available.

B16001 LANGUAGE SPOKEN AT HOME BY ABILITY TO SPEAK ENGLISH FOR THE POPULATION 5 YEARS AND OVER Universe: Population 5 years and over 2011-2015 American Community Survey 5-Year Estimates
Supporting documentation on code lists, subject definitions, data accuracy, and statistical testing can be found on the American Community Survey website in the Data and Documentation section.
Sample size and data quality measures (including coverage rates, allocation rates, and response rates) can be found on the American Community Survey website in the Methodology section.
Tell us what you think. Provide feedback to help make American Community Survey data more useful for you.
Although the American Community Survey (ACS) produces population, demographic and housing unit estimates, it is the Census Bureau's Population Estimates Program that produces and disseminates the official estimates of the population for the nation, states, counties, cities and towns and estimates of housing units for states and counties.
Washington County, Wisconsin
Estimate Margin of Error Total: 125,595 +/-20 Speak only English 119,850 +/-556 Spanish or Spanish Creole: 2,780 +/-356 Speak English "very well" 1,798 +/-325 Speak English less than "very well" 982 +/-223
French (incl. Patois, Cajun): 249 +/-124 Speak English "very well" 193 +/-92 Speak English less than "very well" 56 +/-55
French Creole: 0 +/-20 Speak English "very well" 0 +/-20 Speak English less than "very well" 0 +/-20
Italian: 28 +/-28 Speak English "very well" 14 +/-14 Speak English less than "very well" 14 +/-21
Portuguese or Portuguese Creole: 0 +/-20 Speak English "very well" 0 +/-20 Speak English less than "very well" 0 +/-20
German: 1,236 +/-230 Speak English "very well" 1,009 +/-212 Speak English less than "very well" 227 +/-89
Yiddish: 0 +/-20 Speak English "very well" 0 +/-20 Speak English less than "very well" 0 +/-20
Other West Germanic languages: 36 +/-47 Speak English "very well" 28 +/-40 Speak English less than "very well" 8 +/-13
Scandinavian languages: 28 +/-29 Speak English "very well" 28 +/-29 Speak English less than "very well" 0 +/-20
Greek: 89 +/-89 Speak English "very well" 62 +/-53 Speak English less than "very well" 27 +/-42
1 of 4 12/16/2016

Washington County, Wisconsin
Estimate Margin of Error Russian: 64 +/-68 Speak English "very well" 30 +/-41 Speak English less than "very well" 34 +/-57
Polish: 83 +/-83 Speak English "very well" 83 +/-83 Speak English less than "very well" 0 +/-20
Serbo-Croatian: 135 +/-128 Speak English "very well" 76 +/-72 Speak English less than "very well" 59 +/-61
Other Slavic languages: 12 +/-14 Speak English "very well" 12 +/-14 Speak English less than "very well" 0 +/-20
Armenian: 0 +/-20 Speak English "very well" 0 +/-20 Speak English less than "very well" 0 +/-20
Persian: 0 +/-20 Speak English "very well" 0 +/-20 Speak English less than "very well" 0 +/-20
Gujarati: 136 +/-122 Speak English "very well" 67 +/-73 Speak English less than "very well" 69 +/-60
Hindi: 86 +/-71 Speak English "very well" 53 +/-40 Speak English less than "very well" 33 +/-38
Urdu: 0 +/-20 Speak English "very well" 0 +/-20 Speak English less than "very well" 0 +/-20
Other Indic languages: 79 +/-92 Speak English "very well" 59 +/-80 Speak English less than "very well" 20 +/-33
Other Indo-European languages: 32 +/-41 Speak English "very well" 23 +/-28 Speak English less than "very well" 9 +/-13
Chinese: 60 +/-50 Speak English "very well" 16 +/-20 Speak English less than "very well" 44 +/-39
Japanese: 42 +/-37 Speak English "very well" 15 +/-17 Speak English less than "very well" 27 +/-27
Korean: 0 +/-20 Speak English "very well" 0 +/-20 Speak English less than "very well" 0 +/-20
Mon-Khmer, Cambodian: 0 +/-20 Speak English "very well" 0 +/-20 Speak English less than "very well" 0 +/-20
Hmong: 138 +/-105 Speak English "very well" 86 +/-86 Speak English less than "very well" 52 +/-43
Thai: 107 +/-79 Speak English "very well" 74 +/-63 Speak English less than "very well" 33 +/-35
Laotian: 0 +/-20 Speak English "very well" 0 +/-20 Speak English less than "very well" 0 +/-20
Vietnamese: 50 +/-69 Speak English "very well" 26 +/-31 Speak English less than "very well" 24 +/-38
Other Asian languages: 146 +/-102 Speak English "very well" 96 +/-76
2 of 4 12/16/2016

Washington County, Wisconsin
Estimate Margin of Error Speak English less than "very well" 50 +/-45
Tagalog: 34 +/-29 Speak English "very well" 18 +/-23 Speak English less than "very well" 16 +/-18
Other Pacific Island languages: 0 +/-20 Speak English "very well" 0 +/-20 Speak English less than "very well" 0 +/-20
Navajo: 0 +/-20 Speak English "very well" 0 +/-20 Speak English less than "very well" 0 +/-20
Other Native North American languages: 29 +/-30 Speak English "very well" 29 +/-30 Speak English less than "very well" 0 +/-20
Hungarian: 5 +/-7 Speak English "very well" 5 +/-7 Speak English less than "very well" 0 +/-20
Arabic: 34 +/-34 Speak English "very well" 15 +/-16 Speak English less than "very well" 19 +/-29
Hebrew: 0 +/-20 Speak English "very well" 0 +/-20 Speak English less than "very well" 0 +/-20
African languages: 0 +/-20 Speak English "very well" 0 +/-20 Speak English less than "very well" 0 +/-20
Other and unspecified languages: 27 +/-30 Speak English "very well" 0 +/-20 Speak English less than "very well" 27 +/-30
Data are based on a sample and are subject to sampling variability. The degree of uncertainty for an estimate arising from sampling variability is represented through the use of a margin of error. The value shown here is the 90 percent margin of error. The margin of error can be interpreted roughly as providing a 90 percent probability that the interval defined by the estimate minus the margin of error and the estimate plus the margin of error (the lower and upper confidence bounds) contains the true value. In addition to sampling variability, the ACS estimates are subject to nonsampling error (for a discussion of nonsampling variability, see Accuracy of the Data). The effect of nonsampling error is not represented in these tables.
Methodological changes to data collection in 2013 may have affected language data for 2013. Users should be aware of these changes when using multi-year data containing data from 2013. For more information, see: Language User Note.
While the 2011-2015 American Community Survey (ACS) data generally reflect the February 2013 Office of Management and Budget (OMB) definitions of metropolitan and micropolitan statistical areas; in certain instances the names, codes, and boundaries of the principal cities shown in ACS tables may differ from the OMB definitions due to differences in the effective dates of the geographic entities.
Estimates of urban and rural population, housing units, and characteristics reflect boundaries of urban areas defined based on Census 2010 data. As a result, data for urban and rural areas from the ACS do not necessarily reflect the results of ongoing urbanization.
Source: U.S. Census Bureau, 2011-2015 American Community Survey 5-Year Estimates
Explanation of Symbols:
1. An '**' entry in the margin of error column indicates that either no sample observations or too few sample observations were available to compute a standard error and thus the margin of error. A statistical test is not appropriate.
2. An '-' entry in the estimate column indicates that either no sample observations or too few sample observations were available to compute an estimate, or a ratio of medians cannot be calculated because one or both of the median estimates falls in the lowest interval or upper interval of an open-ended distribution.
3. An '-' following a median estimate means the median falls in the lowest interval of an open-ended distribution. 4. An '+' following a median estimate means the median falls in the upper interval of an open-ended distribution. 5. An '***' entry in the margin of error column indicates that the median falls in the lowest interval or upper interval of an open-ended distribution. A
statistical test is not appropriate. 6. An '*****' entry in the margin of error column indicates that the estimate is controlled. A statistical test for sampling variability is not appropriate.
3 of 4 12/16/2016

7. An 'N' entry in the estimate and margin of error columns indicates that data for this geographic area cannot be displayed because the number of sample cases is too small.
8. An '(X)' means that the estimate is not applicable or not available.

B16001 LANGUAGE SPOKEN AT HOME BY ABILITY TO SPEAK ENGLISH FOR THE POPULATION 5 YEARS AND OVER Universe: Population 5 years and over 2011-2015 American Community Survey 5-Year Estimates
Supporting documentation on code lists, subject definitions, data accuracy, and statistical testing can be found on the American Community Survey website in the Data and Documentation section.
Sample size and data quality measures (including coverage rates, allocation rates, and response rates) can be found on the American Community Survey website in the Methodology section.
Tell us what you think. Provide feedback to help make American Community Survey data more useful for you.
Although the American Community Survey (ACS) produces population, demographic and housing unit estimates, it is the Census Bureau's Population Estimates Program that produces and disseminates the official estimates of the population for the nation, states, counties, cities and towns and estimates of housing units for states and counties.
Waukesha County, Wisconsin
Estimate Margin of Error Total: 373,448 +/-57 Speak only English 345,828 +/-1,174 Spanish or Spanish Creole: 11,297 +/-787 Speak English "very well" 7,503 +/-706 Speak English less than "very well" 3,794 +/-619
French (incl. Patois, Cajun): 879 +/-182 Speak English "very well" 809 +/-174 Speak English less than "very well" 70 +/-53
French Creole: 0 +/-20 Speak English "very well" 0 +/-20 Speak English less than "very well" 0 +/-20
Italian: 506 +/-206 Speak English "very well" 385 +/-158 Speak English less than "very well" 121 +/-70
Portuguese or Portuguese Creole: 298 +/-176 Speak English "very well" 212 +/-143 Speak English less than "very well" 86 +/-61
German: 2,924 +/-317 Speak English "very well" 2,401 +/-283 Speak English less than "very well" 523 +/-133
Yiddish: 6 +/-8 Speak English "very well" 0 +/-20 Speak English less than "very well" 6 +/-8
Other West Germanic languages: 57 +/-42 Speak English "very well" 57 +/-42 Speak English less than "very well" 0 +/-20
Scandinavian languages: 227 +/-107 Speak English "very well" 206 +/-96 Speak English less than "very well" 21 +/-24
Greek: 320 +/-127 Speak English "very well" 294 +/-123 Speak English less than "very well" 26 +/-39
1 of 4 12/16/2016

Waukesha County, Wisconsin
Estimate Margin of Error Russian: 297 +/-124 Speak English "very well" 175 +/-76 Speak English less than "very well" 122 +/-89
Polish: 517 +/-155 Speak English "very well" 404 +/-134 Speak English less than "very well" 113 +/-79
Serbo-Croatian: 292 +/-147 Speak English "very well" 203 +/-112 Speak English less than "very well" 89 +/-65
Other Slavic languages: 365 +/-138 Speak English "very well" 251 +/-97 Speak English less than "very well" 114 +/-64
Armenian: 8 +/-13 Speak English "very well" 8 +/-13 Speak English less than "very well" 0 +/-20
Persian: 122 +/-92 Speak English "very well" 64 +/-64 Speak English less than "very well" 58 +/-49
Gujarati: 262 +/-193 Speak English "very well" 159 +/-120 Speak English less than "very well" 103 +/-88
Hindi: 1,197 +/-307 Speak English "very well" 1,009 +/-264 Speak English less than "very well" 188 +/-106
Urdu: 550 +/-225 Speak English "very well" 460 +/-217 Speak English less than "very well" 90 +/-51
Other Indic languages: 842 +/-385 Speak English "very well" 648 +/-312 Speak English less than "very well" 194 +/-90
Other Indo-European languages: 168 +/-69 Speak English "very well" 131 +/-56 Speak English less than "very well" 37 +/-25
Chinese: 1,657 +/-388 Speak English "very well" 929 +/-236 Speak English less than "very well" 728 +/-210
Japanese: 174 +/-99 Speak English "very well" 86 +/-62 Speak English less than "very well" 88 +/-73
Korean: 380 +/-209 Speak English "very well" 258 +/-148 Speak English less than "very well" 122 +/-91
Mon-Khmer, Cambodian: 0 +/-20 Speak English "very well" 0 +/-20 Speak English less than "very well" 0 +/-20
Hmong: 475 +/-280 Speak English "very well" 391 +/-223 Speak English less than "very well" 84 +/-78
Thai: 53 +/-63 Speak English "very well" 34 +/-53 Speak English less than "very well" 19 +/-29
Laotian: 68 +/-70 Speak English "very well" 24 +/-29 Speak English less than "very well" 44 +/-45
Vietnamese: 450 +/-216 Speak English "very well" 136 +/-97 Speak English less than "very well" 314 +/-143
Other Asian languages: 1,903 +/-408 Speak English "very well" 1,434 +/-362
2 of 4 12/16/2016

Waukesha County, Wisconsin
Estimate Margin of Error Speak English less than "very well" 469 +/-197
Tagalog: 451 +/-187 Speak English "very well" 354 +/-162 Speak English less than "very well" 97 +/-62
Other Pacific Island languages: 96 +/-106 Speak English "very well" 47 +/-48 Speak English less than "very well" 49 +/-66
Navajo: 0 +/-20 Speak English "very well" 0 +/-20 Speak English less than "very well" 0 +/-20
Other Native North American languages: 51 +/-57 Speak English "very well" 51 +/-57 Speak English less than "very well" 0 +/-20
Hungarian: 71 +/-57 Speak English "very well" 56 +/-53 Speak English less than "very well" 15 +/-15
Arabic: 402 +/-178 Speak English "very well" 253 +/-99 Speak English less than "very well" 149 +/-116
Hebrew: 37 +/-32 Speak English "very well" 37 +/-32 Speak English less than "very well" 0 +/-20
African languages: 197 +/-136 Speak English "very well" 143 +/-102 Speak English less than "very well" 54 +/-57
Other and unspecified languages: 21 +/-21 Speak English "very well" 13 +/-17 Speak English less than "very well" 8 +/-12
Data are based on a sample and are subject to sampling variability. The degree of uncertainty for an estimate arising from sampling variability is represented through the use of a margin of error. The value shown here is the 90 percent margin of error. The margin of error can be interpreted roughly as providing a 90 percent probability that the interval defined by the estimate minus the margin of error and the estimate plus the margin of error (the lower and upper confidence bounds) contains the true value. In addition to sampling variability, the ACS estimates are subject to nonsampling error (for a discussion of nonsampling variability, see Accuracy of the Data). The effect of nonsampling error is not represented in these tables.
Methodological changes to data collection in 2013 may have affected language data for 2013. Users should be aware of these changes when using multi-year data containing data from 2013. For more information, see: Language User Note.
While the 2011-2015 American Community Survey (ACS) data generally reflect the February 2013 Office of Management and Budget (OMB) definitions of metropolitan and micropolitan statistical areas; in certain instances the names, codes, and boundaries of the principal cities shown in ACS tables may differ from the OMB definitions due to differences in the effective dates of the geographic entities.
Estimates of urban and rural population, housing units, and characteristics reflect boundaries of urban areas defined based on Census 2010 data. As a result, data for urban and rural areas from the ACS do not necessarily reflect the results of ongoing urbanization.
Source: U.S. Census Bureau, 2011-2015 American Community Survey 5-Year Estimates
Explanation of Symbols:
1. An '**' entry in the margin of error column indicates that either no sample observations or too few sample observations were available to compute a standard error and thus the margin of error. A statistical test is not appropriate.
2. An '-' entry in the estimate column indicates that either no sample observations or too few sample observations were available to compute an estimate, or a ratio of medians cannot be calculated because one or both of the median estimates falls in the lowest interval or upper interval of an open-ended distribution.
3. An '-' following a median estimate means the median falls in the lowest interval of an open-ended distribution. 4. An '+' following a median estimate means the median falls in the upper interval of an open-ended distribution. 5. An '***' entry in the margin of error column indicates that the median falls in the lowest interval or upper interval of an open-ended distribution. A
statistical test is not appropriate. 6. An '*****' entry in the margin of error column indicates that the estimate is controlled. A statistical test for sampling variability is not appropriate.
3 of 4 12/16/2016

7. An 'N' entry in the estimate and margin of error columns indicates that data for this geographic area cannot be displayed because the number of sample cases is too small.
8. An '(X)' means that the estimate is not applicable or not available.

B16001 LANGUAGE SPOKEN AT HOME BY ABILITY TO SPEAK ENGLISH FOR THE POPULATION 5 YEARS AND OVER Universe: Population 5 years and over 2011-2015 American Community Survey 5-Year Estimates
Supporting documentation on code lists, subject definitions, data accuracy, and statistical testing can be found on the American Community Survey website in the Data and Documentation section.
Sample size and data quality measures (including coverage rates, allocation rates, and response rates) can be found on the American Community Survey website in the Methodology section.
Tell us what you think. Provide feedback to help make American Community Survey data more useful for you.
Although the American Community Survey (ACS) produces population, demographic and housing unit estimates, it is the Census Bureau's Population Estimates Program that produces and disseminates the official estimates of the population for the nation, states, counties, cities and towns and estimates of housing units for states and counties.
Waupaca County, Wisconsin
Estimate Margin of Error Total: 49,401 +/-55 Speak only English 47,303 +/-265 Spanish or Spanish Creole: 1,182 +/-198 Speak English "very well" 657 +/-176 Speak English less than "very well" 525 +/-127
French (incl. Patois, Cajun): 40 +/-27 Speak English "very well" 38 +/-26 Speak English less than "very well" 2 +/-3
French Creole: 0 +/-20 Speak English "very well" 0 +/-20 Speak English less than "very well" 0 +/-20
Italian: 0 +/-20 Speak English "very well" 0 +/-20 Speak English less than "very well" 0 +/-20
Portuguese or Portuguese Creole: 0 +/-20 Speak English "very well" 0 +/-20 Speak English less than "very well" 0 +/-20
German: 406 +/-142 Speak English "very well" 293 +/-122 Speak English less than "very well" 113 +/-48
Yiddish: 0 +/-20 Speak English "very well" 0 +/-20 Speak English less than "very well" 0 +/-20
Other West Germanic languages: 57 +/-29 Speak English "very well" 38 +/-19 Speak English less than "very well" 19 +/-15
Scandinavian languages: 85 +/-48 Speak English "very well" 76 +/-48 Speak English less than "very well" 9 +/-7
Greek: 0 +/-20 Speak English "very well" 0 +/-20 Speak English less than "very well" 0 +/-20
1 of 4 12/16/2016

Waupaca County, Wisconsin
Estimate Margin of Error Russian: 0 +/-20 Speak English "very well" 0 +/-20 Speak English less than "very well" 0 +/-20
Polish: 23 +/-21 Speak English "very well" 23 +/-21 Speak English less than "very well" 0 +/-20
Serbo-Croatian: 0 +/-20 Speak English "very well" 0 +/-20 Speak English less than "very well" 0 +/-20
Other Slavic languages: 66 +/-74 Speak English "very well" 15 +/-13 Speak English less than "very well" 51 +/-73
Armenian: 0 +/-20 Speak English "very well" 0 +/-20 Speak English less than "very well" 0 +/-20
Persian: 0 +/-20 Speak English "very well" 0 +/-20 Speak English less than "very well" 0 +/-20
Gujarati: 0 +/-20 Speak English "very well" 0 +/-20 Speak English less than "very well" 0 +/-20
Hindi: 0 +/-20 Speak English "very well" 0 +/-20 Speak English less than "very well" 0 +/-20
Urdu: 0 +/-20 Speak English "very well" 0 +/-20 Speak English less than "very well" 0 +/-20
Other Indic languages: 5 +/-10 Speak English "very well" 2 +/-3 Speak English less than "very well" 3 +/-7
Other Indo-European languages: 4 +/-5 Speak English "very well" 0 +/-20 Speak English less than "very well" 4 +/-5
Chinese: 103 +/-54 Speak English "very well" 26 +/-29 Speak English less than "very well" 77 +/-39
Japanese: 7 +/-10 Speak English "very well" 3 +/-6 Speak English less than "very well" 4 +/-5
Korean: 3 +/-4 Speak English "very well" 3 +/-4 Speak English less than "very well" 0 +/-20
Mon-Khmer, Cambodian: 0 +/-20 Speak English "very well" 0 +/-20 Speak English less than "very well" 0 +/-20
Hmong: 11 +/-16 Speak English "very well" 6 +/-11 Speak English less than "very well" 5 +/-6
Thai: 4 +/-6 Speak English "very well" 2 +/-3 Speak English less than "very well" 2 +/-3
Laotian: 0 +/-20 Speak English "very well" 0 +/-20 Speak English less than "very well" 0 +/-20
Vietnamese: 8 +/-9 Speak English "very well" 0 +/-20 Speak English less than "very well" 8 +/-9
Other Asian languages: 9 +/-15 Speak English "very well" 0 +/-20
2 of 4 12/16/2016

Waupaca County, Wisconsin
Estimate Margin of Error Speak English less than "very well" 9 +/-15
Tagalog: 8 +/-13 Speak English "very well" 8 +/-13 Speak English less than "very well" 0 +/-20
Other Pacific Island languages: 21 +/-30 Speak English "very well" 19 +/-30 Speak English less than "very well" 2 +/-3
Navajo: 0 +/-20 Speak English "very well" 0 +/-20 Speak English less than "very well" 0 +/-20
Other Native North American languages: 56 +/-88 Speak English "very well" 56 +/-88 Speak English less than "very well" 0 +/-20
Hungarian: 0 +/-20 Speak English "very well" 0 +/-20 Speak English less than "very well" 0 +/-20
Arabic: 0 +/-20 Speak English "very well" 0 +/-20 Speak English less than "very well" 0 +/-20
Hebrew: 0 +/-20 Speak English "very well" 0 +/-20 Speak English less than "very well" 0 +/-20
African languages: 0 +/-20 Speak English "very well" 0 +/-20 Speak English less than "very well" 0 +/-20
Other and unspecified languages: 0 +/-20 Speak English "very well" 0 +/-20 Speak English less than "very well" 0 +/-20
Data are based on a sample and are subject to sampling variability. The degree of uncertainty for an estimate arising from sampling variability is represented through the use of a margin of error. The value shown here is the 90 percent margin of error. The margin of error can be interpreted roughly as providing a 90 percent probability that the interval defined by the estimate minus the margin of error and the estimate plus the margin of error (the lower and upper confidence bounds) contains the true value. In addition to sampling variability, the ACS estimates are subject to nonsampling error (for a discussion of nonsampling variability, see Accuracy of the Data). The effect of nonsampling error is not represented in these tables.
Methodological changes to data collection in 2013 may have affected language data for 2013. Users should be aware of these changes when using multi-year data containing data from 2013. For more information, see: Language User Note.
While the 2011-2015 American Community Survey (ACS) data generally reflect the February 2013 Office of Management and Budget (OMB) definitions of metropolitan and micropolitan statistical areas; in certain instances the names, codes, and boundaries of the principal cities shown in ACS tables may differ from the OMB definitions due to differences in the effective dates of the geographic entities.
Estimates of urban and rural population, housing units, and characteristics reflect boundaries of urban areas defined based on Census 2010 data. As a result, data for urban and rural areas from the ACS do not necessarily reflect the results of ongoing urbanization.
Source: U.S. Census Bureau, 2011-2015 American Community Survey 5-Year Estimates
Explanation of Symbols:
1. An '**' entry in the margin of error column indicates that either no sample observations or too few sample observations were available to compute a standard error and thus the margin of error. A statistical test is not appropriate.
2. An '-' entry in the estimate column indicates that either no sample observations or too few sample observations were available to compute an estimate, or a ratio of medians cannot be calculated because one or both of the median estimates falls in the lowest interval or upper interval of an open-ended distribution.
3. An '-' following a median estimate means the median falls in the lowest interval of an open-ended distribution. 4. An '+' following a median estimate means the median falls in the upper interval of an open-ended distribution. 5. An '***' entry in the margin of error column indicates that the median falls in the lowest interval or upper interval of an open-ended distribution. A
statistical test is not appropriate. 6. An '*****' entry in the margin of error column indicates that the estimate is controlled. A statistical test for sampling variability is not appropriate.
3 of 4 12/16/2016

7. An 'N' entry in the estimate and margin of error columns indicates that data for this geographic area cannot be displayed because the number of sample cases is too small.
8. An '(X)' means that the estimate is not applicable or not available.

B16001 LANGUAGE SPOKEN AT HOME BY ABILITY TO SPEAK ENGLISH FOR THE POPULATION 5 YEARS AND OVER Universe: Population 5 years and over 2011-2015 American Community Survey 5-Year Estimates
Supporting documentation on code lists, subject definitions, data accuracy, and statistical testing can be found on the American Community Survey website in the Data and Documentation section.
Sample size and data quality measures (including coverage rates, allocation rates, and response rates) can be found on the American Community Survey website in the Methodology section.
Tell us what you think. Provide feedback to help make American Community Survey data more useful for you.
Although the American Community Survey (ACS) produces population, demographic and housing unit estimates, it is the Census Bureau's Population Estimates Program that produces and disseminates the official estimates of the population for the nation, states, counties, cities and towns and estimates of housing units for states and counties.
Waushara County, Wisconsin
Estimate Margin of Error Total: 23,175 +/-12 Speak only English 21,305 +/-191 Spanish or Spanish Creole: 1,106 +/-125 Speak English "very well" 657 +/-127 Speak English less than "very well" 449 +/-103
French (incl. Patois, Cajun): 10 +/-8 Speak English "very well" 10 +/-8 Speak English less than "very well" 0 +/-16
French Creole: 0 +/-16 Speak English "very well" 0 +/-16 Speak English less than "very well" 0 +/-16
Italian: 8 +/-8 Speak English "very well" 3 +/-4 Speak English less than "very well" 5 +/-7
Portuguese or Portuguese Creole: 5 +/-8 Speak English "very well" 3 +/-4 Speak English less than "very well" 2 +/-5
German: 528 +/-163 Speak English "very well" 375 +/-164 Speak English less than "very well" 153 +/-52
Yiddish: 0 +/-16 Speak English "very well" 0 +/-16 Speak English less than "very well" 0 +/-16
Other West Germanic languages: 61 +/-39 Speak English "very well" 40 +/-36 Speak English less than "very well" 21 +/-13
Scandinavian languages: 3 +/-4 Speak English "very well" 3 +/-4 Speak English less than "very well" 0 +/-16
Greek: 0 +/-16 Speak English "very well" 0 +/-16 Speak English less than "very well" 0 +/-16
1 of 4 12/16/2016

Waushara County, Wisconsin
Estimate Margin of Error Russian: 0 +/-16 Speak English "very well" 0 +/-16 Speak English less than "very well" 0 +/-16
Polish: 44 +/-29 Speak English "very well" 34 +/-26 Speak English less than "very well" 10 +/-10
Serbo-Croatian: 0 +/-16 Speak English "very well" 0 +/-16 Speak English less than "very well" 0 +/-16
Other Slavic languages: 9 +/-6 Speak English "very well" 9 +/-6 Speak English less than "very well" 0 +/-16
Armenian: 0 +/-16 Speak English "very well" 0 +/-16 Speak English less than "very well" 0 +/-16
Persian: 0 +/-16 Speak English "very well" 0 +/-16 Speak English less than "very well" 0 +/-16
Gujarati: 0 +/-16 Speak English "very well" 0 +/-16 Speak English less than "very well" 0 +/-16
Hindi: 0 +/-16 Speak English "very well" 0 +/-16 Speak English less than "very well" 0 +/-16
Urdu: 0 +/-16 Speak English "very well" 0 +/-16 Speak English less than "very well" 0 +/-16
Other Indic languages: 0 +/-16 Speak English "very well" 0 +/-16 Speak English less than "very well" 0 +/-16
Other Indo-European languages: 11 +/-11 Speak English "very well" 4 +/-5 Speak English less than "very well" 7 +/-11
Chinese: 13 +/-13 Speak English "very well" 10 +/-10 Speak English less than "very well" 3 +/-4
Japanese: 5 +/-5 Speak English "very well" 3 +/-4 Speak English less than "very well" 2 +/-3
Korean: 0 +/-16 Speak English "very well" 0 +/-16 Speak English less than "very well" 0 +/-16
Mon-Khmer, Cambodian: 0 +/-16 Speak English "very well" 0 +/-16 Speak English less than "very well" 0 +/-16
Hmong: 20 +/-23 Speak English "very well" 15 +/-17 Speak English less than "very well" 5 +/-9
Thai: 5 +/-5 Speak English "very well" 5 +/-5 Speak English less than "very well" 0 +/-16
Laotian: 8 +/-10 Speak English "very well" 0 +/-16 Speak English less than "very well" 8 +/-10
Vietnamese: 3 +/-5 Speak English "very well" 0 +/-16 Speak English less than "very well" 3 +/-5
Other Asian languages: 0 +/-16 Speak English "very well" 0 +/-16
2 of 4 12/16/2016

Waushara County, Wisconsin
Estimate Margin of Error Speak English less than "very well" 0 +/-16
Tagalog: 15 +/-8 Speak English "very well" 11 +/-7 Speak English less than "very well" 4 +/-4
Other Pacific Island languages: 0 +/-16 Speak English "very well" 0 +/-16 Speak English less than "very well" 0 +/-16
Navajo: 0 +/-16 Speak English "very well" 0 +/-16 Speak English less than "very well" 0 +/-16
Other Native North American languages: 4 +/-7 Speak English "very well" 4 +/-7 Speak English less than "very well" 0 +/-16
Hungarian: 0 +/-16 Speak English "very well" 0 +/-16 Speak English less than "very well" 0 +/-16
Arabic: 9 +/-13 Speak English "very well" 9 +/-13 Speak English less than "very well" 0 +/-16
Hebrew: 0 +/-16 Speak English "very well" 0 +/-16 Speak English less than "very well" 0 +/-16
African languages: 0 +/-16 Speak English "very well" 0 +/-16 Speak English less than "very well" 0 +/-16
Other and unspecified languages: 3 +/-4 Speak English "very well" 0 +/-16 Speak English less than "very well" 3 +/-4
Data are based on a sample and are subject to sampling variability. The degree of uncertainty for an estimate arising from sampling variability is represented through the use of a margin of error. The value shown here is the 90 percent margin of error. The margin of error can be interpreted roughly as providing a 90 percent probability that the interval defined by the estimate minus the margin of error and the estimate plus the margin of error (the lower and upper confidence bounds) contains the true value. In addition to sampling variability, the ACS estimates are subject to nonsampling error (for a discussion of nonsampling variability, see Accuracy of the Data). The effect of nonsampling error is not represented in these tables.
Methodological changes to data collection in 2013 may have affected language data for 2013. Users should be aware of these changes when using multi-year data containing data from 2013. For more information, see: Language User Note.
While the 2011-2015 American Community Survey (ACS) data generally reflect the February 2013 Office of Management and Budget (OMB) definitions of metropolitan and micropolitan statistical areas; in certain instances the names, codes, and boundaries of the principal cities shown in ACS tables may differ from the OMB definitions due to differences in the effective dates of the geographic entities.
Estimates of urban and rural population, housing units, and characteristics reflect boundaries of urban areas defined based on Census 2010 data. As a result, data for urban and rural areas from the ACS do not necessarily reflect the results of ongoing urbanization.
Source: U.S. Census Bureau, 2011-2015 American Community Survey 5-Year Estimates
Explanation of Symbols:
1. An '**' entry in the margin of error column indicates that either no sample observations or too few sample observations were available to compute a standard error and thus the margin of error. A statistical test is not appropriate.
2. An '-' entry in the estimate column indicates that either no sample observations or too few sample observations were available to compute an estimate, or a ratio of medians cannot be calculated because one or both of the median estimates falls in the lowest interval or upper interval of an open-ended distribution.
3. An '-' following a median estimate means the median falls in the lowest interval of an open-ended distribution. 4. An '+' following a median estimate means the median falls in the upper interval of an open-ended distribution. 5. An '***' entry in the margin of error column indicates that the median falls in the lowest interval or upper interval of an open-ended distribution. A
statistical test is not appropriate. 6. An '*****' entry in the margin of error column indicates that the estimate is controlled. A statistical test for sampling variability is not appropriate.
3 of 4 12/16/2016

7. An 'N' entry in the estimate and margin of error columns indicates that data for this geographic area cannot be displayed because the number of sample cases is too small.
8. An '(X)' means that the estimate is not applicable or not available.
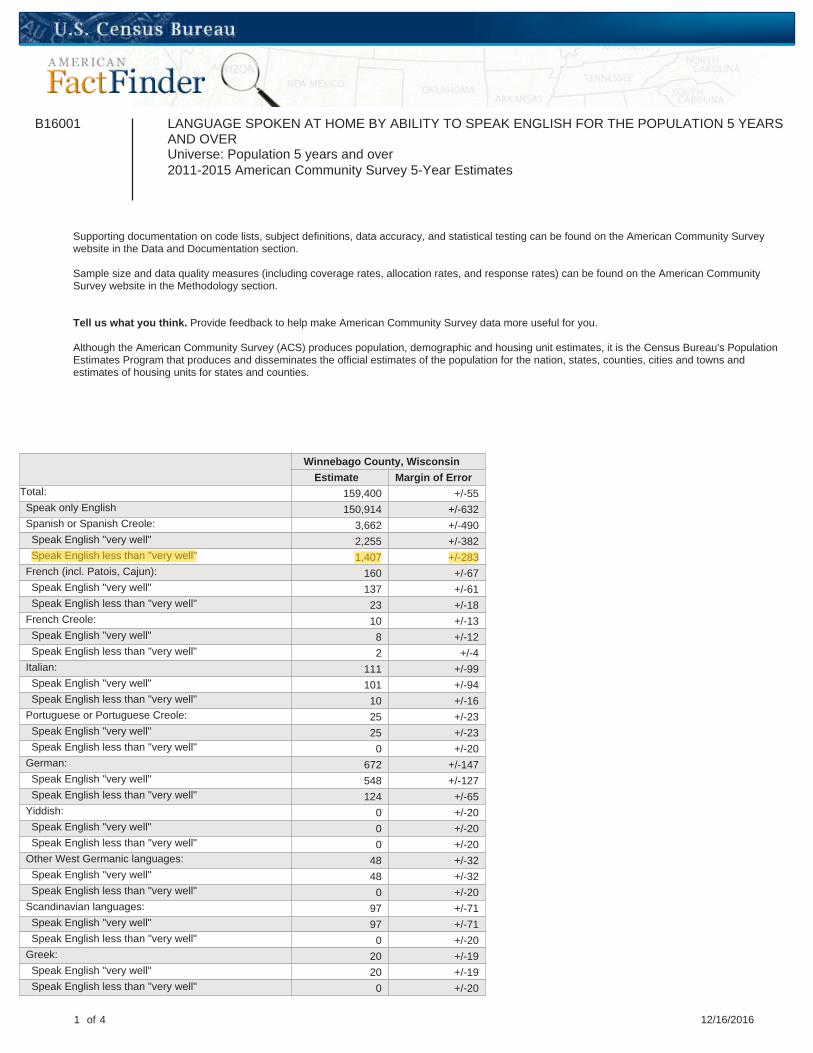
B16001 LANGUAGE SPOKEN AT HOME BY ABILITY TO SPEAK ENGLISH FOR THE POPULATION 5 YEARS AND OVER Universe: Population 5 years and over 2011-2015 American Community Survey 5-Year Estimates
Supporting documentation on code lists, subject definitions, data accuracy, and statistical testing can be found on the American Community Survey website in the Data and Documentation section.
Sample size and data quality measures (including coverage rates, allocation rates, and response rates) can be found on the American Community Survey website in the Methodology section.
Tell us what you think. Provide feedback to help make American Community Survey data more useful for you.
Although the American Community Survey (ACS) produces population, demographic and housing unit estimates, it is the Census Bureau's Population Estimates Program that produces and disseminates the official estimates of the population for the nation, states, counties, cities and towns and estimates of housing units for states and counties.
Winnebago County, Wisconsin
Estimate Margin of Error Total: 159,400 +/-55 Speak only English 150,914 +/-632 Spanish or Spanish Creole: 3,662 +/-490 Speak English "very well" 2,255 +/-382 Speak English less than "very well" 1,407 +/-283
French (incl. Patois, Cajun): 160 +/-67 Speak English "very well" 137 +/-61 Speak English less than "very well" 23 +/-18
French Creole: 10 +/-13 Speak English "very well" 8 +/-12 Speak English less than "very well" 2 +/-4
Italian: 111 +/-99 Speak English "very well" 101 +/-94 Speak English less than "very well" 10 +/-16
Portuguese or Portuguese Creole: 25 +/-23 Speak English "very well" 25 +/-23 Speak English less than "very well" 0 +/-20
German: 672 +/-147 Speak English "very well" 548 +/-127 Speak English less than "very well" 124 +/-65
Yiddish: 0 +/-20 Speak English "very well" 0 +/-20 Speak English less than "very well" 0 +/-20
Other West Germanic languages: 48 +/-32 Speak English "very well" 48 +/-32 Speak English less than "very well" 0 +/-20
Scandinavian languages: 97 +/-71 Speak English "very well" 97 +/-71 Speak English less than "very well" 0 +/-20
Greek: 20 +/-19 Speak English "very well" 20 +/-19 Speak English less than "very well" 0 +/-20
1 of 4 12/16/2016

Winnebago County, Wisconsin
Estimate Margin of Error Russian: 14 +/-21 Speak English "very well" 14 +/-21 Speak English less than "very well" 0 +/-20
Polish: 81 +/-39 Speak English "very well" 75 +/-38 Speak English less than "very well" 6 +/-8
Serbo-Croatian: 27 +/-32 Speak English "very well" 12 +/-18 Speak English less than "very well" 15 +/-23
Other Slavic languages: 18 +/-23 Speak English "very well" 18 +/-23 Speak English less than "very well" 0 +/-20
Armenian: 0 +/-20 Speak English "very well" 0 +/-20 Speak English less than "very well" 0 +/-20
Persian: 25 +/-46 Speak English "very well" 25 +/-46 Speak English less than "very well" 0 +/-20
Gujarati: 6 +/-10 Speak English "very well" 6 +/-10 Speak English less than "very well" 0 +/-20
Hindi: 164 +/-139 Speak English "very well" 79 +/-55 Speak English less than "very well" 85 +/-94
Urdu: 148 +/-112 Speak English "very well" 120 +/-103 Speak English less than "very well" 28 +/-42
Other Indic languages: 48 +/-72 Speak English "very well" 20 +/-31 Speak English less than "very well" 28 +/-42
Other Indo-European languages: 202 +/-188 Speak English "very well" 171 +/-149 Speak English less than "very well" 31 +/-41
Chinese: 232 +/-121 Speak English "very well" 176 +/-104 Speak English less than "very well" 56 +/-45
Japanese: 73 +/-61 Speak English "very well" 63 +/-60 Speak English less than "very well" 10 +/-12
Korean: 9 +/-15 Speak English "very well" 0 +/-20 Speak English less than "very well" 9 +/-15
Mon-Khmer, Cambodian: 20 +/-22 Speak English "very well" 10 +/-17 Speak English less than "very well" 10 +/-14
Hmong: 1,812 +/-337 Speak English "very well" 1,240 +/-299 Speak English less than "very well" 572 +/-184
Thai: 23 +/-26 Speak English "very well" 0 +/-20 Speak English less than "very well" 23 +/-26
Laotian: 8 +/-13 Speak English "very well" 0 +/-20 Speak English less than "very well" 8 +/-13
Vietnamese: 107 +/-136 Speak English "very well" 107 +/-136 Speak English less than "very well" 0 +/-20
Other Asian languages: 129 +/-95 Speak English "very well" 103 +/-88
2 of 4 12/16/2016

Winnebago County, Wisconsin
Estimate Margin of Error Speak English less than "very well" 26 +/-31
Tagalog: 199 +/-122 Speak English "very well" 175 +/-117 Speak English less than "very well" 24 +/-28
Other Pacific Island languages: 14 +/-15 Speak English "very well" 14 +/-15 Speak English less than "very well" 0 +/-20
Navajo: 0 +/-20 Speak English "very well" 0 +/-20 Speak English less than "very well" 0 +/-20
Other Native North American languages: 35 +/-53 Speak English "very well" 35 +/-53 Speak English less than "very well" 0 +/-20
Hungarian: 32 +/-29 Speak English "very well" 13 +/-15 Speak English less than "very well" 19 +/-19
Arabic: 101 +/-66 Speak English "very well" 90 +/-65 Speak English less than "very well" 11 +/-16
Hebrew: 38 +/-53 Speak English "very well" 38 +/-53 Speak English less than "very well" 0 +/-20
African languages: 36 +/-46 Speak English "very well" 29 +/-44 Speak English less than "very well" 7 +/-12
Other and unspecified languages: 80 +/-68 Speak English "very well" 31 +/-33 Speak English less than "very well" 49 +/-54
Data are based on a sample and are subject to sampling variability. The degree of uncertainty for an estimate arising from sampling variability is represented through the use of a margin of error. The value shown here is the 90 percent margin of error. The margin of error can be interpreted roughly as providing a 90 percent probability that the interval defined by the estimate minus the margin of error and the estimate plus the margin of error (the lower and upper confidence bounds) contains the true value. In addition to sampling variability, the ACS estimates are subject to nonsampling error (for a discussion of nonsampling variability, see Accuracy of the Data). The effect of nonsampling error is not represented in these tables.
Methodological changes to data collection in 2013 may have affected language data for 2013. Users should be aware of these changes when using multi-year data containing data from 2013. For more information, see: Language User Note.
While the 2011-2015 American Community Survey (ACS) data generally reflect the February 2013 Office of Management and Budget (OMB) definitions of metropolitan and micropolitan statistical areas; in certain instances the names, codes, and boundaries of the principal cities shown in ACS tables may differ from the OMB definitions due to differences in the effective dates of the geographic entities.
Estimates of urban and rural population, housing units, and characteristics reflect boundaries of urban areas defined based on Census 2010 data. As a result, data for urban and rural areas from the ACS do not necessarily reflect the results of ongoing urbanization.
Source: U.S. Census Bureau, 2011-2015 American Community Survey 5-Year Estimates
Explanation of Symbols:
1. An '**' entry in the margin of error column indicates that either no sample observations or too few sample observations were available to compute a standard error and thus the margin of error. A statistical test is not appropriate.
2. An '-' entry in the estimate column indicates that either no sample observations or too few sample observations were available to compute an estimate, or a ratio of medians cannot be calculated because one or both of the median estimates falls in the lowest interval or upper interval of an open-ended distribution.
3. An '-' following a median estimate means the median falls in the lowest interval of an open-ended distribution. 4. An '+' following a median estimate means the median falls in the upper interval of an open-ended distribution. 5. An '***' entry in the margin of error column indicates that the median falls in the lowest interval or upper interval of an open-ended distribution. A
statistical test is not appropriate. 6. An '*****' entry in the margin of error column indicates that the estimate is controlled. A statistical test for sampling variability is not appropriate.
3 of 4 12/16/2016

7. An 'N' entry in the estimate and margin of error columns indicates that data for this geographic area cannot be displayed because the number of sample cases is too small.
8. An '(X)' means that the estimate is not applicable or not available.

B16001 LANGUAGE SPOKEN AT HOME BY ABILITY TO SPEAK ENGLISH FOR THE POPULATION 5 YEARS AND OVER Universe: Population 5 years and over 2011-2015 American Community Survey 5-Year Estimates
Supporting documentation on code lists, subject definitions, data accuracy, and statistical testing can be found on the American Community Survey website in the Data and Documentation section.
Sample size and data quality measures (including coverage rates, allocation rates, and response rates) can be found on the American Community Survey website in the Methodology section.
Tell us what you think. Provide feedback to help make American Community Survey data more useful for you.
Although the American Community Survey (ACS) produces population, demographic and housing unit estimates, it is the Census Bureau's Population Estimates Program that produces and disseminates the official estimates of the population for the nation, states, counties, cities and towns and estimates of housing units for states and counties.
Wood County, Wisconsin
Estimate Margin of Error Total: 69,938 +/-121 Speak only English 66,435 +/-486 Spanish or Spanish Creole: 1,228 +/-269 Speak English "very well" 849 +/-222 Speak English less than "very well" 379 +/-166
French (incl. Patois, Cajun): 81 +/-58 Speak English "very well" 43 +/-25 Speak English less than "very well" 38 +/-44
French Creole: 0 +/-20 Speak English "very well" 0 +/-20 Speak English less than "very well" 0 +/-20
Italian: 33 +/-49 Speak English "very well" 33 +/-49 Speak English less than "very well" 0 +/-20
Portuguese or Portuguese Creole: 0 +/-20 Speak English "very well" 0 +/-20 Speak English less than "very well" 0 +/-20
German: 476 +/-178 Speak English "very well" 420 +/-174 Speak English less than "very well" 56 +/-31
Yiddish: 0 +/-20 Speak English "very well" 0 +/-20 Speak English less than "very well" 0 +/-20
Other West Germanic languages: 12 +/-10 Speak English "very well" 10 +/-9 Speak English less than "very well" 2 +/-4
Scandinavian languages: 71 +/-84 Speak English "very well" 71 +/-84 Speak English less than "very well" 0 +/-20
Greek: 36 +/-53 Speak English "very well" 36 +/-53 Speak English less than "very well" 0 +/-20
1 of 4 12/16/2016

Wood County, Wisconsin
Estimate Margin of Error Russian: 43 +/-61 Speak English "very well" 43 +/-61 Speak English less than "very well" 0 +/-20
Polish: 30 +/-21 Speak English "very well" 22 +/-20 Speak English less than "very well" 8 +/-6
Serbo-Croatian: 38 +/-43 Speak English "very well" 38 +/-43 Speak English less than "very well" 0 +/-20
Other Slavic languages: 44 +/-68 Speak English "very well" 44 +/-68 Speak English less than "very well" 0 +/-20
Armenian: 0 +/-20 Speak English "very well" 0 +/-20 Speak English less than "very well" 0 +/-20
Persian: 0 +/-20 Speak English "very well" 0 +/-20 Speak English less than "very well" 0 +/-20
Gujarati: 0 +/-20 Speak English "very well" 0 +/-20 Speak English less than "very well" 0 +/-20
Hindi: 10 +/-18 Speak English "very well" 0 +/-20 Speak English less than "very well" 10 +/-18
Urdu: 48 +/-64 Speak English "very well" 34 +/-46 Speak English less than "very well" 14 +/-19
Other Indic languages: 0 +/-20 Speak English "very well" 0 +/-20 Speak English less than "very well" 0 +/-20
Other Indo-European languages: 56 +/-57 Speak English "very well" 56 +/-57 Speak English less than "very well" 0 +/-20
Chinese: 93 +/-64 Speak English "very well" 71 +/-60 Speak English less than "very well" 22 +/-34
Japanese: 77 +/-59 Speak English "very well" 59 +/-49 Speak English less than "very well" 18 +/-17
Korean: 39 +/-36 Speak English "very well" 4 +/-7 Speak English less than "very well" 35 +/-31
Mon-Khmer, Cambodian: 0 +/-20 Speak English "very well" 0 +/-20 Speak English less than "very well" 0 +/-20
Hmong: 674 +/-172 Speak English "very well" 432 +/-111 Speak English less than "very well" 242 +/-80
Thai: 0 +/-20 Speak English "very well" 0 +/-20 Speak English less than "very well" 0 +/-20
Laotian: 0 +/-20 Speak English "very well" 0 +/-20 Speak English less than "very well" 0 +/-20
Vietnamese: 135 +/-115 Speak English "very well" 75 +/-69 Speak English less than "very well" 60 +/-51
Other Asian languages: 37 +/-40 Speak English "very well" 20 +/-30
2 of 4 12/16/2016

Wood County, Wisconsin
Estimate Margin of Error Speak English less than "very well" 17 +/-25
Tagalog: 45 +/-36 Speak English "very well" 40 +/-36 Speak English less than "very well" 5 +/-8
Other Pacific Island languages: 14 +/-24 Speak English "very well" 0 +/-20 Speak English less than "very well" 14 +/-24
Navajo: 0 +/-20 Speak English "very well" 0 +/-20 Speak English less than "very well" 0 +/-20
Other Native North American languages: 115 +/-55 Speak English "very well" 99 +/-52 Speak English less than "very well" 16 +/-13
Hungarian: 0 +/-20 Speak English "very well" 0 +/-20 Speak English less than "very well" 0 +/-20
Arabic: 0 +/-20 Speak English "very well" 0 +/-20 Speak English less than "very well" 0 +/-20
Hebrew: 0 +/-20 Speak English "very well" 0 +/-20 Speak English less than "very well" 0 +/-20
African languages: 0 +/-20 Speak English "very well" 0 +/-20 Speak English less than "very well" 0 +/-20
Other and unspecified languages: 68 +/-72 Speak English "very well" 40 +/-41 Speak English less than "very well" 28 +/-36
Data are based on a sample and are subject to sampling variability. The degree of uncertainty for an estimate arising from sampling variability is represented through the use of a margin of error. The value shown here is the 90 percent margin of error. The margin of error can be interpreted roughly as providing a 90 percent probability that the interval defined by the estimate minus the margin of error and the estimate plus the margin of error (the lower and upper confidence bounds) contains the true value. In addition to sampling variability, the ACS estimates are subject to nonsampling error (for a discussion of nonsampling variability, see Accuracy of the Data). The effect of nonsampling error is not represented in these tables.
Methodological changes to data collection in 2013 may have affected language data for 2013. Users should be aware of these changes when using multi-year data containing data from 2013. For more information, see: Language User Note.
While the 2011-2015 American Community Survey (ACS) data generally reflect the February 2013 Office of Management and Budget (OMB) definitions of metropolitan and micropolitan statistical areas; in certain instances the names, codes, and boundaries of the principal cities shown in ACS tables may differ from the OMB definitions due to differences in the effective dates of the geographic entities.
Estimates of urban and rural population, housing units, and characteristics reflect boundaries of urban areas defined based on Census 2010 data. As a result, data for urban and rural areas from the ACS do not necessarily reflect the results of ongoing urbanization.
Source: U.S. Census Bureau, 2011-2015 American Community Survey 5-Year Estimates
Explanation of Symbols:
1. An '**' entry in the margin of error column indicates that either no sample observations or too few sample observations were available to compute a standard error and thus the margin of error. A statistical test is not appropriate.
2. An '-' entry in the estimate column indicates that either no sample observations or too few sample observations were available to compute an estimate, or a ratio of medians cannot be calculated because one or both of the median estimates falls in the lowest interval or upper interval of an open-ended distribution.
3. An '-' following a median estimate means the median falls in the lowest interval of an open-ended distribution. 4. An '+' following a median estimate means the median falls in the upper interval of an open-ended distribution. 5. An '***' entry in the margin of error column indicates that the median falls in the lowest interval or upper interval of an open-ended distribution. A
statistical test is not appropriate. 6. An '*****' entry in the margin of error column indicates that the estimate is controlled. A statistical test for sampling variability is not appropriate.
3 of 4 12/16/2016

7. An 'N' entry in the estimate and margin of error columns indicates that data for this geographic area cannot be displayed because the number of sample cases is too small.
8. An '(X)' means that the estimate is not applicable or not available.