Embed Size (px)
Citation preview

Integrated Electrocatalytic Processing of Levulinic Acid and Formic Acid to Biofuel Intermediate Valeric Acid
Yang Qiu†a, Le Xin†a, David J. Chadderdona, Ji Qia, Changhai Liangb, Wenzhen Li*a
a Department of Chemical Engineering, Michigan Technological University, Houghton, Michigan, USA. Fax: +1-906-487-3213; Tel: 5
+1-906-487-2298; E-mail: [email protected] b School of Chemical Engineering, Dalian University of technology, Dalian, Liaoning, China. † These authors contributed equally to this work.
Support Information 10
Fig S1 Current density as a function of time for electro-oxidation of valeric acid. Reaction conditions: constant fuel-cell voltage of 0.1V, anode: 0.3 M VA + 0.5 M H2SO4 with 1 ml min-1 fed over 3.0mg cm-2 Pd/C-40wt%, cathode: oxygen of 400 ml min-1 fed over 3.0mg cm-2 Pt/C-40wt%.
15
20
Electronic Supplementary Material (ESI) for Green ChemistryThis journal is © The Royal Society of Chemistry 2013
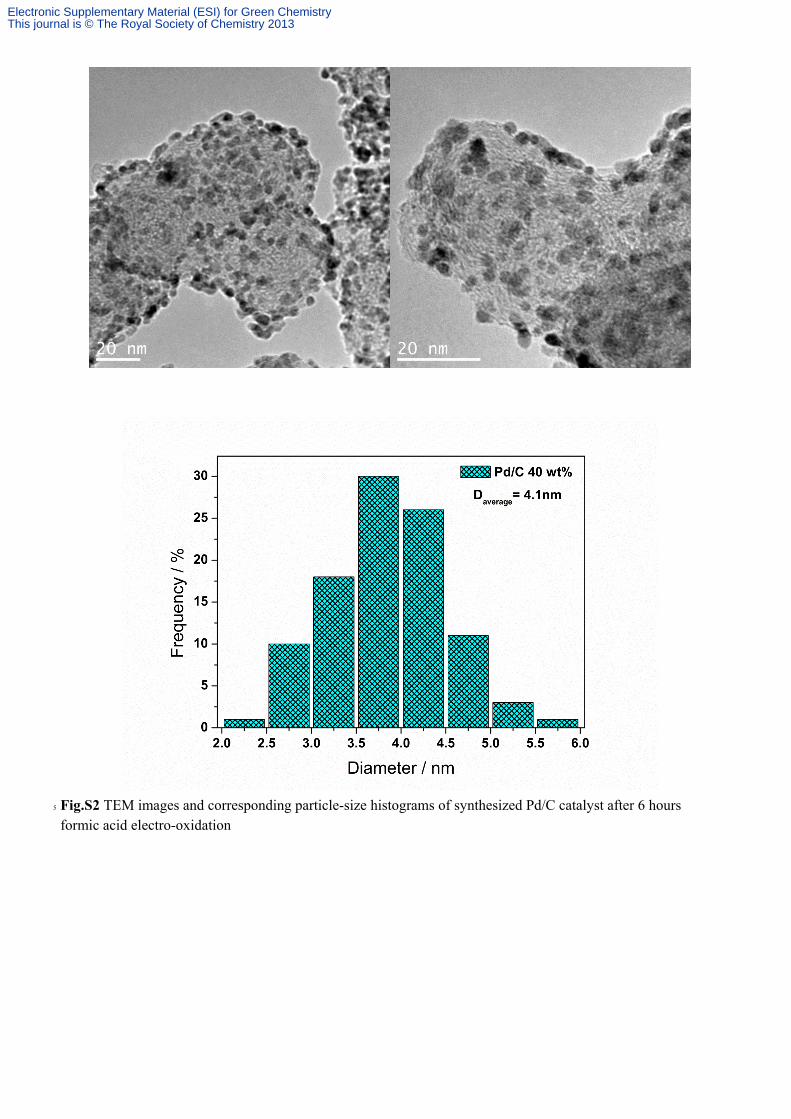
Fig.S2 TEM images and corresponding particle-size histograms of synthesized Pd/C catalyst after 6 hours 5
formic acid electro-oxidation
Electronic Supplementary Material (ESI) for Green ChemistryThis journal is © The Royal Society of Chemistry 2013

`
Fig. S3 TEM images and corresponding particle-size histograms of synthesized Pd/C catalyst before 6 hours formic acid electro-oxidation.
5
.
Electronic Supplementary Material (ESI) for Green ChemistryThis journal is © The Royal Society of Chemistry 2013

Fig.S4 Cyclic voltammograms of Pt/C-40wt% catalyst with valeric acid concentrations of 0, 0.1, 0.2 and 0.3M in 1.0M formic acid + 0.5M H2SO4 solution, at 50mV s-1, room temperature.
The VA effect on the electro-catalytic oxidation of FA on Pt/C catalyst was investigated by the cyclic
voltammograms of Pt/C-40wt%, in 0M, 0.1M, 0.2M and 0.3M VA +1.0M FA + 0.5M H2SO4 solution. 5
Similar to Pd/C-40wt% catalyst, the peak currents for FA electro-oxidation on Pt/C-40wt% catalyst are
decreased to 2.32 mA, 0.34 mA and 0.11 mA, with the VA concentration increasing to 0.1 M, 0.2M
and 0.3M, respectively, as shown in Fig. S2.
Electronic Supplementary Material (ESI) for Green ChemistryThis journal is © The Royal Society of Chemistry 2013

Fig.S5 (a) Cyclic voltammograms and (b) ECSA of Pt/C-40wt% catalyst with VA concentrations of 0M, 0.1M, 0.2M and 0.3M + 0.5M H2SO4 solution, at 50mV s-1, room temperature.
The cyclic voltammetograms of Pt/C-40wt% in 0M, 0.1M, 0.2M and 0.3M VA + 0.5M H2SO4 aqueous 5
solution are shown in Fig. S3. The ECSA of Pt/C-40wt% calculated based on the hydrogen desorption
peak are decreased from 18 m2/g (0 M VA) to 9.0 m2 g-1, 7.3 m2 g-1 and 5.7 m2 g-1, with the VA
concentration increasing to 0.1M, 0.2M and 0.3M, respectively, indicating a higher VA concentration
leads to a greater ECSA loss. 10
(a)
(b)
Electronic Supplementary Material (ESI) for Green ChemistryThis journal is © The Royal Society of Chemistry 2013

Fig.S6 (a) Cyclic voltammograms and (b) ECSA of Pt/C-40wt% catalyst with 0.2 M acetic acid, propionic acid, butyric acid or valeric acid in 0.5 M H2SO4 solution, at 50mV s-1, room temperature.
Fig. S4 shows cyclic voltammetograms of Pt/C-40wt% in 0.2M carboxylic acid (acetic acid, propionic 5
acid, butyric acid and valeric acid)) + 0.5 M H2SO4 solution. With the carbon chain length increasing
(from C2 to C5), the ECSA of Pt/C calculated from the hydrogen desorption peak deceased to 16.3 m2
g-1 (with acetic acid), 14.6 m2 g-1 (with propionic acid), 11.3 m2 g-1 (with butyric acid), and 7.3 m2 g-1
(with valeric acid), indicating that carboxylic acids of longer carbon chains lead to a greater ECSA loss. 10
(a)
(b)
Electronic Supplementary Material (ESI) for Green ChemistryThis journal is © The Royal Society of Chemistry 2013

Fig.S7 XRD patterns of synthesized Pd/C and commercial Pd catalysts.
The average crystal grain size of Pt/C and Pd/C can be estimated based on the Debye–Scherrer
equation: 5
Eq. S1
where L is the mean crystal size, λ is the wavelength of the X-ray (1.5406 Å), B2β is the full width at
half-maximum of the peak (rad), and θmax is the Bragg angle (rad). From the calculation based on (220)
diffraction peak, the particle sizes of Pt/C and Pd/C are 3.8 nm and 3.4 nm, respectively. 10
2 max
0.9
cosKL
B
Electronic Supplementary Material (ESI) for Green ChemistryThis journal is © The Royal Society of Chemistry 2013