Embed Size (px)
Citation preview

WORLD TRADE REPORT 2014
52
B. The increasing importance of developing countries in the global economy
One of the most striking features of the global economy in recent years has been the increasingly large role played by developing economies. This section examines how many countries recorded impressive growth in the last decade while making great strides in reducing poverty. Some have become leading producers and exporters of manufactured goods, agricultural products and commercial services, in some cases eclipsing the industrialized economies. This is especially true of the large developing economies which have taken on more prominent positions in international fora such as the G-20.

B. TH
E IN
CR
EA
SIN
G IM
PO
RTA
NC
E O
F D
EV
ELO
PIN
G C
OU
NTR
IES
IN TH
E
GLO
BA
L EC
ON
OM
YII. TRADE AND DEVELOPMENT: RECENT TRENDS AND THE ROLE OF THE WTO
53
Contents1 Worldwide convergence in GDP 54
2 What factors determine growth? 58
3 Rising share of developing countries in the world economy 60
4 Heterogeneity of development experiences 64
5 Trade opening in developing countries 69
6 Conclusions 71
7 Appendix tables 73
Some key facts and findings
Faster GDP growth in developing countries has increased their rate of convergence with developed countries in terms of per capita income in recent decades. However, developing economies are still much poorer than developed countries, and millions remain in poverty even in the most dynamic developing countries.
GDP growth has moved hand in hand with integration in the world economy. The share of developing economies in world output increased from 23 per cent to 40 per cent between 2000 and 2012. The share of these countries in world trade also rose from 33 per cent to 48 per cent.
G-20 developing countries have reduced their applied tariffs by over 5 per cent, committed to a “bound” rate or ceiling for over 80 per cent of their tariff lines, and reduced bound rates by about 10 per cent in the last decade.

WORLD TRADE REPORT 2014
54
However, despite significant progress made by developing economies overall, many countries remain desperately poor, and even the most dynamic developing economies still have large numbers of people living below the poverty line. Whether the economic success of recent years can be sustained in the future is also a matter of some uncertainty, since developing economies have never completely de-coupled from the developed countries whose economies have yet to fully recover from the financial crisis and global recession of 2008-09.
A variety of statistics on recent trends in development are presented in this section to shed light on the development landscape since the start of the millennium, and to clarify what distinguishes this period from earlier years. The discussion focuses on growth in GDP and per capita income, but other dimensions of development are also considered, including measures of human development (e.g. life expectancy, education, etc.), environmental degradation (e.g. emissions of CO2 and other greenhouse gases), and inequality (e.g. poverty rates and Gini coefficients). Trade flows of developing economies are also explored, focusing on the enhanced export opportunities for least-developed countries as a result of the trade opening of large, dynamic developing economies.
In terms of terminology, grouping countries according to their level of development poses a challenge within a WTO context, since the WTO agreements allow preferential treatment for developing and least-developed economies in certain circumstances. The regional groupings used in this publication should not be interpreted as implying anything about a country’s rights and obligations under WTO agreements, and should only be seen as broadly indicative of a country’s status.
The country groups used in this report are loosely based on the United Nations Millennium Development Goals (MDG) classification, with countries categorized as either “developed” or “developing” (precise definitions of these groups are provided in Appendix Table B.1). “Developed economies” comprise all 27 member states of the European Union, other non-EU Western European countries and territories (principally Iceland, Norway and Switzerland), Australia, Canada, Japan, New Zealand and the United States.1
All other countries and territories are collectively referred to as “developing economies”.
Under “developing economies”, we define three sub-groups:
1. “least-developed countries” (LDCs), which correspond exactly with the MDG definition,
2. “G-20 developing economies”, which include the 11 non-developed members of the G-20, i.e. Argentina, Brazil, China, India, Indonesia, the Republic of Korea, Mexico, the Russian Federation, the Kingdom of Saudi Arabia, South Africa and Turkey. This group of large developing
countries was chosen due to the perception that the more widely used BRICs group (i.e. Brazil, the Russian Federation, India, China and sometimes South Africa) was too narrow and lacked regional representation.
3. “Other developing economies”, which comprise all remaining countries.
The countries of Central and Eastern Europe, the Baltic States and the Commonwealth of Independent States (CIS)2 used to be categorized as “transition economies”. However, this group became less analytically useful after many of its members joined the European Union. We have chosen to include the remaining transition economies in the “developing economies” group because we wish to classify the Russian Federation as a “G-20 developing economy” and because of its similarity in economic structure to other large, middle-income countries.
Other country groupings may also be used from time to time as needed – for example, to denote geographic regions or income levels.
1. Worldwide convergence in GDP
Economic growth and development tend to be viewed as long-run phenomena that are better measured in decades rather than years. However, many development indicators appear to have altered their trajectory since around 2000, with low- and middle-income countries gaining on the mature industrial economies in terms of per capita income and other measures of quality of life. The performance of G-20 developing economies has been especially impressive compared with developed economies and with LDCs and other developing economies. Recently, G-20 developing economies have seen output growth slow, however. This is partly due to weak demand in developed markets, but domestic structural issues have also played a part.
Since the start of the millennium, developing economies have increased their rate of convergence with developed economies as a result of both faster growth in the developing world and slower growth in developed economies. This trend was magnified by the global financial crisis, although the process started much earlier. This part of the report presents a number of facts on growth to illustrate this convergence.
(a) Strong growth in developing economies since 2000
From the early 1980s until the late-1990s, developing economies did not grow appreciably faster than developed countries and in some years grew more slowly, largely due to a prolonged period of weakness in prices of primary commodities that developing countries export disproportionately. Recent evidence points to convergence since 2000, with large developing economies such as
B. TH
E IN
CR
EA
SIN
G IM
PO
RTA
NC
E O
F D
EV
ELO
PIN
G C
OU
NTR
IES
IN TH
E
GLO
BA
L EC
ON
OM
YII. TRADE AND DEVELOPMENT: RECENT TRENDS AND THE ROLE OF THE WTO
55
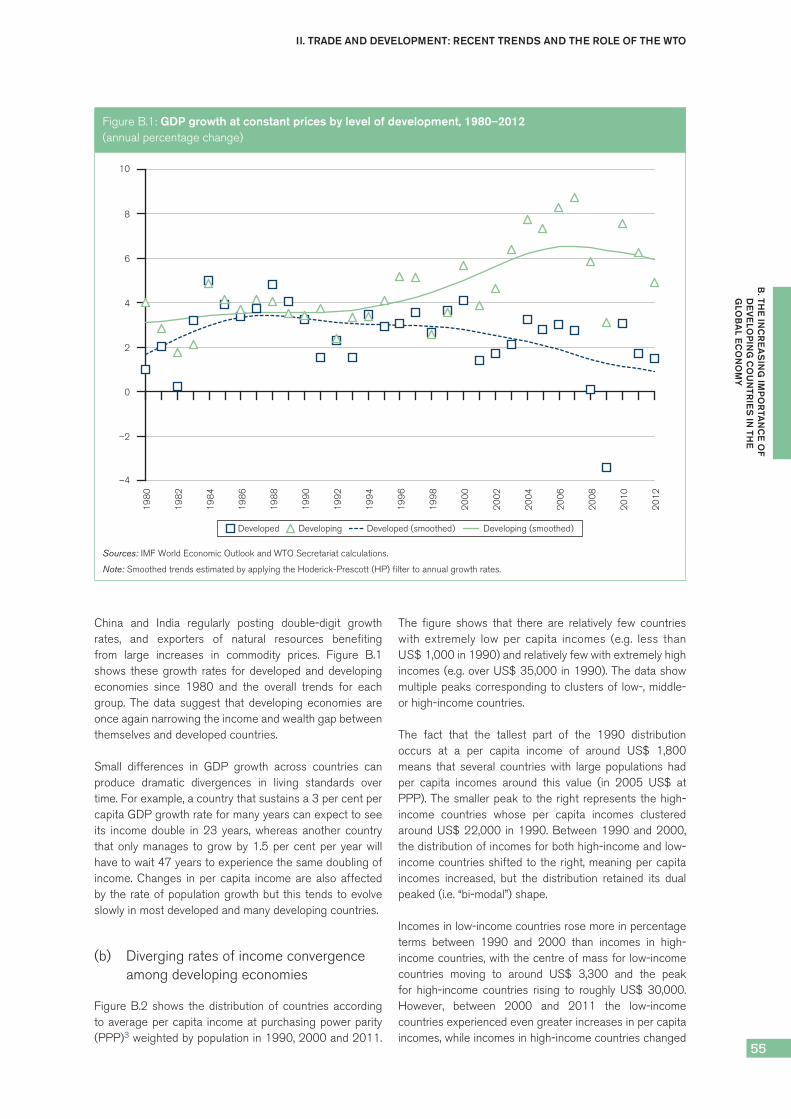
Figure B.1: GDP growth at constant prices by level of development, 1980–2012(annual percentage change)
–4
–2
0
2
4
6
8
10
19
80
19
82
19
84
19
86
19
88
19
90
19
92
19
94
19
96
19
98
20
00
20
02
20
04
20
06
20
08
20
10
20
12
Developed Developing Developed (smoothed) Developing (smoothed)
Sources: IMF World Economic Outlook and WTO Secretariat calculations.
Note: Smoothed trends estimated by applying the Hoderick-Prescott (HP) filter to annual growth rates.
China and India regularly posting double-digit growth rates, and exporters of natural resources benefiting from large increases in commodity prices. Figure B.1 shows these growth rates for developed and developing economies since 1980 and the overall trends for each group. The data suggest that developing economies are once again narrowing the income and wealth gap between themselves and developed countries.
Small differences in GDP growth across countries can produce dramatic divergences in living standards over time. For example, a country that sustains a 3 per cent per capita GDP growth rate for many years can expect to see its income double in 23 years, whereas another country that only manages to grow by 1.5 per cent per year will have to wait 47 years to experience the same doubling of income. Changes in per capita income are also affected by the rate of population growth but this tends to evolve slowly in most developed and many developing countries.
(b) Diverging rates of income convergence among developing economies
Figure B.2 shows the distribution of countries according to average per capita income at purchasing power parity (PPP)3 weighted by population in 1990, 2000 and 2011.
The figure shows that there are relatively few countries with extremely low per capita incomes (e.g. less than US$ 1,000 in 1990) and relatively few with extremely high incomes (e.g. over US$ 35,000 in 1990). The data show multiple peaks corresponding to clusters of low-, middle- or high-income countries.
The fact that the tallest part of the 1990 distribution occurs at a per capita income of around US$ 1,800 means that several countries with large populations had per capita incomes around this value (in 2005 US$ at PPP). The smaller peak to the right represents the high-income countries whose per capita incomes clustered around US$ 22,000 in 1990. Between 1990 and 2000, the distribution of incomes for both high-income and low-income countries shifted to the right, meaning per capita incomes increased, but the distribution retained its dual peaked (i.e. “bi-modal”) shape.
Incomes in low-income countries rose more in percentage terms between 1990 and 2000 than incomes in high-income countries, with the centre of mass for low-income countries moving to around US$ 3,300 and the peak for high-income countries rising to roughly US$ 30,000. However, between 2000 and 2011 the low-income countries experienced even greater increases in per capita incomes, while incomes in high-income countries changed

WORLD TRADE REPORT 2014
56
very little, providing evidence of convergence between developed and developing countries. Interestingly, a number of middle-income countries have begun to converge with high-income economies at an even faster pace. As a result of this change, the distribution of world incomes showed a three-peaked (i.e. “tri-modal”) shape in 2011.
As there are now fewer countries with incomes below US$ 8,000 and more with incomes above US$ 9,000, this suggests that income inequality between countries probably went down between 2000 and 2011. However, this measure fails to account for income variation within countries. This additional source of variation must also be taken into account when attempting to measure inequality for the world as a whole.
Sala-i-Martin (2006) and Pinkovskiy and Sala-i-Martin (2009) have produced estimates of global income distribution from 1970 to 2006 which reflect both inequality within countries and between countries. This research finds that most of the inequality at the global level is between countries and that global Gini coefficients – a measure of inequality – have fallen from 0.65 in 1990 to 0.63 in 2000 and to 0.61 in 2006. Measures of poverty using multiple poverty lines have declined steadily over time.
Further evidence of convergence in per capita income between developing and developed countries can be seen in Figure B.3, which shows the evolution of incomes by level of development between 1990 and 2011. The
chart shows that in 2011 the total percentage increase in average per capita incomes for developed economies since 1990 was less than the world average, whereas developed economies’ incomes had risen more than the world average as recently as 2006. G-20 developing economies, LDCs and other developing economies all appear to have risen sharply in terms of per capita incomes since 2003. Between then and 2011, developing economies as a whole saw their average per capita income rise by 54 per cent. Over the same period, incomes of G-20 developing economies, LDCs and other developing economies advanced 61 per cent, 43 per cent and 43 per cent respectively. This stands in sharp contrast to the 1990 to 2000 period, during which incomes in LDCs declined by 7 per cent, and those in other developing countries recorded growth below the world average.
GDP growth in excess of population growth in the 1990s and 2000s should have raised per capita incomes in most developing economies. Figure B.4 shows that this is indeed the case. The chart shows a diversity of economic performance between developed economies, G-20 developing economies, LDCs and the world between 1990 and 2011. Although output per head has stagnated in developed economies in recent years, these countries remain much wealthier than most developing economies. For example, despite China’s rapid economic growth over the last 20 years or so, it remains relatively poor compared with developed economies and the world as a whole. China’s per capita income in 2011 was just 24 per cent of the average for developed economies, and 76 per cent of the world average. India’s per capita GDP at PPP was just 11 per cent of the average income in developed economies and 35 per cent of the average world income. LDCs have an average income of just 4 per cent of the average income in developed economies and 11 per cent of the world average income.
The Republic of Korea is the most conspicuous success story among the countries shown in the chart, having more than doubled its per capita income (up 260 per cent) over a 21-year period. Other countries, however, had growth setbacks. These include Argentina, which went through a debt/currency crisis in the late 1990s, and Brazil, which saw its per capita income stagnate between 1997 and the mid-2000s.
When incomes are converging, countries with lower initial per capita GDP tend to grow faster than those that are already relatively wealthy. This is shown in Figure B.5, which displays per capita income growth between 2000 and 2012 in G-20 developing economies and LDCs as well as their incomes as a percentage of the average for developed countries in 2000. The chart shows that countries with low starting incomes (e.g. India had around 5 per cent of the average income in developed economies in 2000) have tended to grow more rapidly in the last decade (e.g. India grew more than 6 per cent per year on average during this period).
Figure B.2: Kernel density of real GDP at PPP weighted by population, 1990–2011(logarithmic scale)
0.1
0.2
0.3
0.4
0.5
100 1,000 10,000 100,000(log scale)
1990 2000 2011
Source: Penn World Tables 8.0 and Secretariat calculations.
Note: This figure shows the distribution of countries according to average per capita income at purchasing power parity (PPP) weighted by population in 1990, 2000 and 2011, using a mathematical algorithm know as a kernel density estimator. Essentially, this technique produces a smoothed frequency distribution for a collection of data. In the case of per capita income data, it shows which income ranges contain the most countries/people and which contain the fewest. Observations are weighted by population to provide a better indication of the distribution of incomes across persons, since otherwise small countries (e.g. Gambia, Qatar) would have the same weight as large ones (e.g. China, India).

B. TH
E IN
CR
EA
SIN
G IM
PO
RTA
NC
E O
F D
EV
ELO
PIN
G C
OU
NTR
IES
IN TH
E
GLO
BA
L EC
ON
OM
YII. TRADE AND DEVELOPMENT: RECENT TRENDS AND THE ROLE OF THE WTO
57
Figure B.3: Per capita real GDP of selected economies, 1990–2011(indices of 2005 US$ at purchasing power parity)
80
100
120
140
160
180
200
2201
99
0
19
91
19
92
19
93
19
94
19
95
19
96
19
97
19
98
19
99
20
00
20
01
20
02
20
03
20
04
20
05
20
06
20
07
20
08
20
09
20
10
20
11
Developed economies Developing economies G-20 developing economies Least-developed countries (LDCs)
Other developing economies World
Source: Penn World Tables 8.0.
Note: GDP figures are expenditure-based.
Figure B.4: Per capita GDP of G-20 developing economies and LDCs, 1990–2011(2005 US$ at purchasing power parity)
0
5,000
10,000
15,000
20,000
25,000
30,000
35,000
Dev
elop
ed
Kor
ea, R
ep. o
f
Sau
di A
rabi
a, K
ingd
om o
f
Rus
sian
Fed
erat
ion
Arg
entin
a
Turk
ey
Mex
ico
Wor
ld
Bra
zil
Sou
th A
fric
a
Chi
na
Indo
nesi
a
Indi
a
LDC
s
1990 2000 2011
Source: Penn World Tables 8.0.
Note: GDP figures are expenditure-based.

WORLD TRADE REPORT 2014
58
2. What factors determine growth?
Clearly, development is not just about growth. However, GDP growth helps to generate the economic resources needed to improve people’s living conditions. To improve water safety and access to good health and education, housing and food, for example, a country needs resources. Economic growth can generate these resources. In fact, there tends to be a positive link between human development indexes and GDP per capita. The relationship between growth and development is, however, not automatic, and a government needs to respond with appropriate policies to tackle any social or environmental concerns that may arise.
(a) Resources, technology, institutions and trade
GDP per capita grows for two reasons. The first is when countries accumulate resources, including investments in physical capital, such as machinery or infrastructure, and investment in human capital, such as on-the-job training to enhance workers’ skills. The second is when countries
utilize these resources more efficiently. Technologies, the institutional framework or geographical characteristics are key determinants of the ways in which resource endowments are utilized and therefore how a country’s GDP grows.
One development strategy is, therefore, to favour investments and accumulate capital. The fast-growing countries in the 1950s experienced a growing share of investment in GDP. However, at a certain point, continuing to endow workers with capital goods will not generate further growth (due to diminishing returns to capital). In other words, additional capital will become redundant. In their theoretical model of growth, Solow (1956) and Swan (1956) show that sustained growth in output per capita can only be achieved with continuous advances in technological knowledge. Growth through capital accumulation only cannot be sustained.
To be sustainable, investment-led industrialization needs to be complemented by investment in education or research and development (R&D). Whether targeted at introducing a new product or a new production technology, investment in R&D will prevent investments from running
Figure B.5: Convergence in per capita incomes of G-20 developing economies and LDCs, 2000–12(per cent and annual percentage change)
0
2
1
4
3
5
6
7
8
9
10
0 10 20 30 40 50 60 70
Avg
. ann
ual g
row
th in
per
cap
ita G
DP
20
00
–2
01
1 (
%)
Per capita income in 2000 (% of developed)
Korea, Rep. of
Saudi Arabia,Kingdom of
Russian
Federation
Argentina
Mexico
Brazil
South Africa
Indonesia
India
LDCs
Turkey
China
Source: Penn World Tables 8.0.
Note: GDP figures are expenditure-based. Bubble size represents average population 2000-12.

B. TH
E IN
CR
EA
SIN
G IM
PO
RTA
NC
E O
F D
EV
ELO
PIN
G C
OU
NTR
IES
IN TH
E
GLO
BA
L EC
ON
OM
YII. TRADE AND DEVELOPMENT: RECENT TRENDS AND THE ROLE OF THE WTO
59
into diminishing returns to scale. For example, if the R&D conducted by a firm allows it to introduce a new or higher-quality good which can be sold at a higher price, it is profitable for the firm to invest in producing it: innovation creates new investment opportunities. At the same time, the prospect of making profits by introducing new products motivates further R&D. This virtuous cycle in which capital investment and R&D feed into each other generates sustained growth (Grossman and Helpman, 1991).
A similar virtuous cycle can arise when innovation leads to increased productivity of capital and labour. Romer (1986 and 1990) formalizes this in a model in which technological innovation takes the form of new intermediate goods. In this framework, the growing number of inputs raises productivity because it allows increasing specialization of labour across an increased variety of activities, thus preventing diminishing returns to capital.
Recent economic literature has emphasized the role of institutions for sustained growth. The quality of institutions (e.g. contract enforceability, property rights, rule of law) is crucial in determining a firm’s incentive to invest in human and physical capital or R&D. For example, a well-known argument for innovation is that new technologies provide market power and that firms’ investments in R&D are motivated by the prospect of higher future profits derived from this market power (Schumpeter, 1942). In this context, the enforcement of property rights is a crucial determinant of the process of technological development and subsequent growth. Since firms under-invest in R&D when property rights are not enforced, economies with low institutional quality tend to grow more slowly than economies with higher institutional quality (Acemoglu, 2008; Helpman, 2004).
Opening up to trade also affects GDP growth. On the one hand, trade liberalization raises GDP because it improves resource allocation by allowing specialization according to comparative advantage and exploitation of economies of scale. On the other hand, open economies also tend to grow faster because trade sustains investment and innovation, fosters international technological spillovers and may trigger institutional reforms.
Table B.1 illustrates the evolution of some important determinants of long-run growth, including the share of investment in GDP, rates of primary and secondary school enrolment, the ratio of trade to GDP and the ratio of inflows of foreign direct investment (FDI) to GDP, regulatory quality and the rule of law. Regulatory quality refers to the perceived ability of governments to formulate and implement policies that promote economic growth in the private sector. Rule of law refers to the perceived quality of contract enforcement, the courts and the police, including the prevalence of crime and violence. These indicators are averaged over developing economies in two periods, 1990-2000 and 2000-2012, with countries grouped into quartiles based on their average rates of per capita GDP growth in each period. The first (bottom) quartile includes the countries with the lowest rates of per capita GDP growth while the fourth (top) quartile includes the economies with the highest growth rates.
The table highlights some notable features of the growth of developing economies over the last two decades. All quartiles recorded faster growth in the post-2000 period than in the 1990s. The countries with the slowest growth in per capita GDP in the first period saw their incomes contract by 4.7 per cent per year on average, whereas the bottom quartile in the second period recorded an average
Table B.1: Sources of economic growth in developing economies, 1990–2000 and 2000–12(annual percentage change, per cent, and indices –2.5 to 2.5)
Quartiles of per capita GDP growth1990–2000
Quartiles of per capita GDP growth2000–12
Quartile 1
Quartile 2
Quartile 3
Quartile 4
Quartile 1
Quartile 2
Quartile 3
Quartile 4
Per capita GDP growth rate (annual percentage change)
–4.7 –0.1 2.0 5.8 –0.1 2.3 4.1 7.6
Investment share in GDP (per cent) 19.2 20.6 23.3 28.9 20.8 21.5 24.4 26.5
Primary school enrolment rate (per cent) 64.5 77.5 79.4 88.1 80.0 87.3 87.2 85.7
Secondary school enrolment rate (per cent) 27.8 52.0 47.0 57.4 48.9 56.0 62.9 60.7
Ratio of trade to GDP (per cent) 30.5 48.5 42.4 43.6 41.8 46.2 45.3 46.2
FDI inflows / GDP (per cent) 2.1 2.5 3.0 4.8 4.7 5.8 4.9 6.0
Regulatory quality index (–2.5 to 2.5) –0.8 –0.4 0.1 0.1 –0.3 –0.1 –0.2 –0.5
Rule of law index (–2.5 to 2.5) –1.0 –0.5 –0.1 0.1 –0.5 –0.2 –0.2 –0.6
Source: Penn World Tables 8.0 for per capita GDP, Worldwide Governance Indicators (WGI) for regulatory quality and rule of law indices, World Development Indicators (WDI) for other variables.
Note: The trade to GDP ratio is defined as the average of exports and imports divided by output. WGI data are reported bi-annually from 1996 to 2000 and annually from 2002 to 2012.

WORLD TRADE REPORT 2014
60
decline of just 0.1 per cent per year. Meanwhile, per capita income growth in the second, third, and fourth quartiles was around 2 age points higher in the second period than in the first.
Faster income growth was associated with higher levels of investment, schooling, trade and FDI in both the 1990s and 2000s, although the top quartile in the later period had lower levels of both primary and secondary school enrolment than the third quartile. Measures of institutional quality (i.e. regulatory quality and rule of law) increased with per capita GDP in the 1990s but decreased during the 2000s, to the point that the top quartile actually recorded the lowest scores for both regulatory quality and rule of law.
(b) Trade and growth
The case for free trade typically rests on the existence of gains from trade. Most economists agree that the effect of trade liberalization is to increase real GDP, while acknowledging the possible relevance of the costs of adjusting to trade opening. Opening up increases a country’s GDP because it improves the efficiency of its resource allocation. First, trade allows each country to specialize in the production of the goods that it can produce more cheaply and import the other goods, thus exploiting comparative advantages. Secondly, by extending the size of the market in which the firm operates beyond national borders, trade allows firms to exploit economies of scale. Thirdly, trade selects the most productive firms in the market.4 The relationship between trade and growth is discussed further below (see Box B.1).
The positive relationship between trade and growth is illustrated by Figures B.6 and B.7. Figure B.6 shows that a rising share of world trade in GDP has been accompanied by rising per capita GDP since 1980. Whether GDP growth caused trade to grow faster or trade caused GDP to accelerate is difficult to establish with any degree of certainty. It is most likely that it runs both ways. However, Figure B.6 reveals an important long-run relationship between trade and GDP.
Figure B.7 shows real per capita GDP growth plotted against export growth since 2000. The strength of this relationship may be exaggerated by the fact that exports are a component of GDP. However, other measures of trade openness also consistently show a positive, if somewhat weaker, relationship between trade and growth.
Figure B.8 shows the average annual percentage change in GDP in two periods, 1990-2000 and 2000-11. It shows that world output grew faster in the last 11 years than it did in the preceding ten and that all categories of developing economies experienced faster growth in
the second period. The fastest average growth in the post-2000 period was recorded by oil-exporting LDCs (6.6 per cent per year on average, up from 1.2 per cent in the 1990s), thanks in part to rising prices of primary commodities in recent years. However, the performance of G-20 developing economies (some of which are natural resource exporters) was nearly as impressive (5.2 per cent per year on average, up from 3.9 per cent in the preceding decade).
LDC exporters of agricultural products also saw their incomes grow at an impressive 3.9 per cent per year since 2000 after recording a dismal performance in the 1990s, when incomes contracted by about 1.3 per cent per year (see also Section D).
Only developed economies recorded slower average growth in the 2000s than in the 1990s (0.9 per cent compared with 2.8 per cent), which may be partly explained by the global financial crisis that disproportionately affected advanced economies. However, even if we restrict ourselves to the pre-crisis period, i.e. 2000-2008, we see that advanced economies still grew more slowly in the 2000s (2.0 per cent vs. 2.8 per cent).
3. Rising share of developing countries in the world economy
Faster-than-average output growth raises countries’ shares in world GDP over time. This is shown in Figure B.9, which illustrates the increasing share of developing economies in world GDP at purchasing power parity. These countries raised their collective share in global output from 39 per cent in 2000 to 52 per cent in 2012. Much of the increase was due to the G-20 developing economies, which increased their share in exports from 25 per cent to 36 per cent. China alone more than doubled its share from 7 per cent to 15 per cent. India recorded a more modest increase from 4 per cent to 6 per cent over the same interval while Brazil was unchanged at 3 per cent and Mexico dropped from 3 per cent to 2 per cent. All LDCs combined still only accounted for around 2 per cent of world exports in 2012, up from 1 per cent in 2000.
Although Figure B.9 suggests that living standards are indeed improving in developing economies, it does not accurately reflect their importance as export destinations. This is because a country’s ability to purchase imports depends more on its nominal dollar income than on income at purchasing power parity. From this perspective, the share of developing economies in world output rose to 40 per cent from 23 per cent between 2000 and 2012. This is a large increase but it illustrates that developing economies are still responsible for less than half of world income.
Figure B.10 illustrates the increasing share of developing economies in world merchandise exports

B. TH
E IN
CR
EA
SIN
G IM
PO
RTA
NC
E O
F D
EV
ELO
PIN
G C
OU
NTR
IES
IN TH
E
GLO
BA
L EC
ON
OM
YII. TRADE AND DEVELOPMENT: RECENT TRENDS AND THE ROLE OF THE WTO
61
Box B.1: How does trade affect growth?
Opening up to trade affects long-run growth through several channels. First, trade can affect growth by affecting the return to capital accumulation. Models that analyse the interaction between international trade and economic growth show that, unlike a closed economy, a small open economy can sustain extensive periods of growth with capital accumulation only. If a small open economy adopts policies that foster investment, it can accumulate capital without experiencing falling rates of returns on investments because these are determined in the world market (by factor price equalization) and are unaffected by the investment decision in the small open economy. Ventura (1997) explains in this way the growth of East Asian “tiger” economies in the 1970s and 1980s.5
Secondly, trade can affect growth through its effects on the incentive to innovate. In this context, what matters is the effect of trade on market size, competition and knowledge spillovers. Typically, opening up to trade increases the size of the market that a firm faces (scale effect). This increases the reward to R&D because it increases the revenues associated with introducing a new good and, in turn, the incentive to invest in R&D. Therefore, growth increases (Rivera-Batiz and Romer, 1991; Grossman and Helpman, 1991).
Enhanced competition generated by trade has two contrasting effects on the incentive to innovate. On the one hand, competition augments firms’ incentive to invest in R&D. Otherwise, firms are displaced from the market (Peretto, 2003; Aghion et al, 2005). On the other hand, competition lowers the incentive to innovate because it reduces the monopoly rents of the successful innovator. Empirical evidence supports an overall positive relationship between competition and the incentive to innovate, thus supporting an overall positive relationship between trade opening and growth through this channel.
Trade can also affect firms’ incentive to innovate through its effects on knowledge spillovers. Trade can enhance knowledge spillovers because it gives access to the knowledge embodied in the good produced abroad. Trade in transport and communication services may reduce the cost of exchange of information. FDI may contribute to technology transfers through on-the-job training. If discoveries made in a foreign country increase R&D productivity in the home country (knowledge spillovers), domestic firms have a higher incentive to innovate. This will translate into higher growth.
Finally, trade can have positive effects on growth through its effect on the institutional framework. Often trade liberalization goes hand in hand with the adoption of external commitments. Trade liberalization often takes place in a multilateral or regional context. Countries that enter a trade agreement not only commit to lower their trade tariffs but also embrace a certain institutional framework. For example, membership of the WTO also requires countries to comply with certain transparency rules in trade policy as well as certain rules regarding behind-the-border measures, such as technical regulations, subsidies or property rights. Empirical work (Rodrick et al. 2004) supports the idea that international trade improves the institutional framework, and that a commitment to opening up to trade through WTO membership boosts growth (Tang and Wei, 2009).
Overall, the core message of the economic models outlined above is that international trade boosts growth. However, theoretical literature highlights situations where the static gains from trade can come at the cost of lower long-run growth. The main argument here relies on the existence of learning-by-doing in specific sectors and not in others; that is, experience accumulated in a specific sector of the economy drives overall productivity.
Suppose that there are two countries, North and South, and two goods, agriculture and manufacturing. Suppose as well that learning-by-doing only characterizes the manufacturing sector. When these two countries open up to trade, the North will specialize in the production of the manufacturing good and the South in the production of the agricultural good. However, since only the manufacturing sector exhibits a high potential for growth, the North will grow faster under free trade while the opposite will occur in the South.
Two empirical findings reduce the importance of this theoretical argument. First, comparative advantages change over time. All export-led growth success stories have been characterized by a shift of the production structure away from agriculture into manufacturing – for example, Hong Kong (China), the Republic of Korea, Singapore and Chinese Taipei. Secondly, international trade may be associated with knowledge spillovers. Therefore, it is possible – contrary to what is assumed in the model – that knowledge developed in the North transfers to the South.
In developing countries, where domestic innovation is low, international diffusion of knowledge is particularly important for growth. Most importantly, a general result of the economic literature is that even when negative effects of trade on growth exist, provided that there are large knowledge spillovers, the ultimate effect of trade on growth is positive.6

WORLD TRADE REPORT 2014
62
Figure B.6: World GDP per capita and share of exports of goods and services in world GDP(2005 international dollars and percentage)
6
10
14
18
22
26
30
34
38
4,000
5,000
6,000
7,000
8,000
9,000
10,000
11,000
12,0001
98
0
19
82
19
84
19
86
19
88
19
90
19
92
19
94
19
96
19
98
20
00
20
02
20
04
20
06
20
08
20
10
20
12
World GDP per capita (left scale) Share of exports of goods and services in world GDP (right scale)
Source: World Bank World Development Indicators.
Figure B.7: Real per capita GDP growth and merchandise export volume growth, 2000–11(average annual percentage change on both axes)
–10
–5
0
5
10
15
–10 –5 0 5 10 15 20 25
Per
cap
ita G
DP
gro
wth
Export growth
Source: World Bank World Development Indicators and WTO Secretariat calculations.
Note: Growth rates are averaged over the period.

B. TH
E IN
CR
EA
SIN
G IM
PO
RTA
NC
E O
F D
EV
ELO
PIN
G C
OU
NTR
IES
IN TH
E
GLO
BA
L EC
ON
OM
YII. TRADE AND DEVELOPMENT: RECENT TRENDS AND THE ROLE OF THE WTO
63
Figure B.8: Average annual growth in per capita GDP at purchasing power parity by level of development, 1990–2011(annual percentage change)
1.8
2.9
1.51.9
0.9
–0.7
1.2
–1.3
2.4
0.9
4.7
5.4
3.8 3.7
6.6
3.9
–2.0
–1.0
0.0
1.0
2.0
3.0
4.0
5.0
6.0
7.0
World Developedeconomies
Developingeconomies
G-20developingeconomies
Otherdevelopingeconomies
Leastdevelopedcountries(LDCs)
LDC oilexporters
LDCagriculturalproductsexporters
1990-2000 2000-2011
Source: Penn World Tables 8.0 (expenditure-based) and WTO Secretariat calculations.
Note: LDC oil exporters comprise Angola, Bhutan, Chad, Equatorial Guinea, Myanmar, Sudan and Yemen. LDC agriculture exporters comprise Afghanistan, Benin, Burkina Faso, Burundi, Central African Republic, Comoros, Ethiopia, Gambia, Guinea-Bissau, Kiribati, Liberia, Malawi, Rwanda, Sao Tomé and Principe, Solomon Islands, Somalia, Togo, Uganda and Vanuatu.
since 1995 (qualitatively similar shares can be observed on the import side as well). The share of G-20 developing economies in world exports increased between 1995 and 2000 from 13 per cent to 16 per cent. However, between 2000 and 2012 this share leapt to 28 per cent despite the global financial
crisis in 2009. The share of LDCs in global exports was negligible throughout the entire period but the share of other developing economies rose from 16 per cent in 1995 to 20 per cent in 2012. Collectively, the share of developing economies increased from 33 per cent to 48 per cent over this period.
Figure B.9: Shares of selected economies in world GDP at purchasing power parity, 2000–12(percentage)
EuropeanUnion (27), 25%
UnitedStates, 24%
Japan, 8%Other developed, 5%
China, 7%India, 4%
Brazil, 3%
Russian Federation, 3%Mexico, 3%
Korea, Rep. of, 2%
Turkey, 1%Indonesia, 1%
Saudi Arabia, Kingdom of, 1%
Argentina, 1%South Africa, 1%
Otherdeveloping, 13%
LDCs, 1%
Developed,61%
G-20developing,
25%
Otherdeveloping,
13%
2000 2012
UnitedStates,20%
EuropeanUnion (27), 19%Japan, 6%
Other developed, 4%
China, 15%
India, 6%
Russian Federation, 3%
Brazil, 3%
Mexico, 2%
Korea, Rep. of, 2%
Turkey, 1%
Indonesia, 1%
Saudi Arabia,Kingdom of, 1%
Argentina, 1%South Africa, 1%
Otherdeveloping, 15%
LDCs, 2%
Developed,48%
G-20developing,
36%
Otherdeveloping,
15%
Source: IMF World Economic Outlook database, October 2013.

WORLD TRADE REPORT 2014
64
4. Heterogeneity of development experiences
As stated, growth is just one aspect of development. If rising output and higher incomes did not allow people to obtain a better standard of living, development would not be worth pursuing. The evidence suggests that per capita GDP growth does improve several dimensions of quality of life, but these gains are not uniformly distributed. In this section, we measure various aspects of development and development policy, using a human development index (excluding GDP per capita), an income inequality measure (Gini) and an environment quality index.
(a) Human development indicators and income growth
Exploring the relationship between growth and living standards could be undertaken in many ways. Common measures of well-being include health (e.g. life expectancy at birth, infant mortality), nutrition (intake of calories, incidence of disease), and opportunity/social mobility (literacy rates, economic and gender inequality, etc.). Examining each of these indicators separately would duplicate much of the work in the Millennium Development Goals Report (2013) so this report focuses on a composite indicator in the form of the World Bank’s Human Development Index (HDI). Box B.2 discusses how close we are to attaining the
Millennium Development Goals. The standard version of this index combines life expectancy at birth, average years of schooling and per capita gross national income but this report uses an alternative version that excludes income in order to avoid comparing like with like.
Appendix Table B.2 includes combinations of output growth and human development performance for all available countries. It shows that countries with above average growth in output do not always have above average changes in human development scores (representing positive improvements in human development). This is confirmed by Figure B.11, which shows a positive relationship between HDI scores and GDP between 2000 and 2012 but only when weighted by population. When countries are not weighted in this way, there appears to be no relationship at all between HDI and GDP growth.
The lack of a strong link may be partly due to the fact that the data only cover a ten-year period whereas improvements in human development may take longer to emerge. A stronger relationship may also be obscured by the economic idiosyncrasies of extremely small countries, which can suffer from circumstances ranging from being landlocked to being remote from other larger economies. Population weighting also gives a great deal of weight to China and other large developing economies, which experienced fast growth in the 2000s while also improving their human development scores.
Figure B.10: Evolution of world merchandise exports by level of development, 1995–2012(US$ billion)
727 1,013 1,7012,836 2,142 2,713 3,368 3,504
6781,018
2,156
3,744
2,948
3,843
4,767 4,931
3,593
4,212
6,296
9,059
7,024
8,178
9,542 9,290
5,022
6,279
10,236
15,806
12,242
14,897
17,881 17,930
0
2,000
4,000
6,000
8,000
10,000
12,000
14,000
16,000
18,000
20,000
19
95
20
00
20
05
20
08
20
09
20
10
20
11
20
12
Other developingLDCsG-20 developingDeveloped
Source: WTO Secretariat.

B. TH
E IN
CR
EA
SIN
G IM
PO
RTA
NC
E O
F D
EV
ELO
PIN
G C
OU
NTR
IES
IN TH
E
GLO
BA
L EC
ON
OM
YII. TRADE AND DEVELOPMENT: RECENT TRENDS AND THE ROLE OF THE WTO
65
Figure B.11: Real per capita GDP growth and changes in human development, 2000–12(per cent and change in non-income human development index)
–2
0
2
4
6
8
10
12
–2 0 2 4 6 8 10 12 14 15
Ave
rage
rea
l GD
P g
row
th 2
00
0-1
1
Change in non-income human development index (2000-12)
Sources: Penn World Tables 8.0, World Development Indicators and WTO Secretariat calculations.
Note: The size of each data point signifies the country’s population.
(b) Growth and inequality within countries
Countries may achieve high rates of economic growth without the benefit being felt by many of their citizens if growth results in a more unequal distribution of incomes and wealth within those countries. Inequality between countries is also undesirable, because it means that one’s birthplace has a bigger impact than merit on one’s future opportunities and quality of life. Finally, the global income distribution is significant in its own right since it is equally important to lift poor people out of poverty irrespective of where they live.
Figure B.13 illustrates the relationship between income growth and changes in income inequality in developing economies between 2000 and 2011. Income growth is measured by the average per capita GDP growth while inequality is indicated by changes in the Gini coefficient.7 The size of each data point denotes the country’s population so we can distinguish any trends between large and small countries.
Among the countries that have grown the fastest since 2000, some have raised their Gini index scores while others have reduced them. A positive change in the Gini index means that the country’s income distribution has become more unequal while a negative change means that it has become more equal. The chart shows a cluster of large countries with relatively slow growth and negative
Gini changes, indicating a mildly positive relationship between growth and inequality. However, if we ignore population weighting, there does not appear to be a systematic relationship between per capita GDP growth changes and income inequality.
What explains these patterns? Economists have discussed for some time the existence of the so-called Kuznets curve. This is an inverted U-shaped curve that is intended to describe the relationship between income per capita and inequality. It is based on Kuznets’ hypothesis that, as a country develops, income inequality worsens at first, then improves as the country attains a certain level of development. Kuznets’ argument was that, at early stages of industrialization, wages are held down by the migration of rural people to the cities, and therefore GDP growth is accompanied by increasing inequality. Subsequently, when GDP per capita has reached a certain level, inequality falls because the rise of the welfare state allows for better redistribution policies.
Empirical evidence, however, does not support the existence of a Kuznets curve in inequality. The foremost example is the experience of rapid economic growth of certain East Asian countries (Hong Kong, China; Indonesia; Japan; the Republic of Korea; Malaysia; Singapore; and Thailand) between 1965 and 1990. Contrary to the Kuznets curve, these countries experienced rapid industrialization coupled with a rapid reduction in the number of people

WORLD TRADE REPORT 2014
66
Box B.2: How close are the Millennium Development Goals to being achieved?
World leaders met at the United Nations Millennium Summit in September 2000 to discuss the challenges of development in the 21st century. At the summit, the leaders adopted the Millennium Declaration, which identified eight goals that the international community should strive to achieve in order to “ensure that globalization becomes a positive force for all of the world’s people”.
The Declaration recognized the unique challenges facing developing economies and stated that a sustained effort would be needed to make progress. The goals set out in the Declaration, known as the Millennium Development Goals (MDGs), were ambitious but in principle achievable by the target date of 2015. Since this deadline is now close at hand, it is instructive to review the progress made to date and to identify areas where work still needs to be done. This is summarized in Table B.2. Although the MDGs were intended to be both measurable and attainable, so far only the first (reducing the most extreme forms of poverty) has been comprehensively addressed.
Table B.2: Progress towards achieving the MDGsTarget Progress
1 Halve, between 1990 and 2015, the proportion of people whose income is less than one dollar a day
This has been met but 1.2 billion people still live in extreme poverty
2 Achieve universal primary education. If current trends continue, the world will not meet the goal by 2015.
3 Eliminate gender disparity in primary and secondary education, preferably by 2005, and in all levels of education no later than 2015.
Steady progress has been made, but more targeted action is needed in many regions
4 Reduce child mortality by two-thirds. Major gains have been made but efforts must be redoubled to meet the target.
5 Reduce by three-quarters, between 1990 and 2015, the maternal mortality ratio.
Maternal mortality has declined by nearly half since 1990 but still falls far short of the MDG target.
6 Halt and begin to reverse the spread of HIV/AIDS by 2015. The incidence of HIV is declining steadily in most regions; however, 2.5 million people are newly infected each year.
7 Integrate the principles of sustainable development into country policies and programmes and reverse the loss of environmental resources.
Forests are a safety net for the poor but they continue to disappear at an alarming rate.
8 Develop a global partnership for development. With regard to trade, the decisions reached at the WTO’s Bali Ministerial Conference in December 2013, while yet to be fully implemented, are a first step in concluding the Doha Development Agenda, but the remaining issues are still to be resolved
Source: Millennium Development Goals Report (2013).
Figure B.12: Share of population living in households below extreme poverty line, selected countries, 2000–11(per cent)
0
10
20
30
40
50
60
70
Mal
i
Nep
al
Uga
nda
Ban
glad
esh
Pak
ista
n
Vie
t Nam
Eth
iopi
a
Chi
na
Indo
nesi
a
Indi
a
Hon
dura
s
Cam
bodi
a
Gua
tem
ala
Ken
ya
Phi
lippi
nes
Sou
th A
fric
a
Bra
zil
Thai
land
Col
ombi
a
Tuni
sia
2000 2011 Approximate MDG target
Source: World Bank PovcalNet.Note: Extreme poverty is defined as less than US$ 1.25 per person per day. The MDG targets are set at 50 per cent of the 1990 figure.
Attaining the MDG targets at the global or the regional level may shift attention away from the difficulties that some countries are having in achieving them. Progress in halving the proportion of people living in extreme poverty, defined as having an income of less than US$ 1.25 per day, is shown in Figure B.12 based on data from the World Bank’s

B. TH
E IN
CR
EA
SIN
G IM
PO
RTA
NC
E O
F D
EV
ELO
PIN
G C
OU
NTR
IES
IN TH
E
GLO
BA
L EC
ON
OM
YII. TRADE AND DEVELOPMENT: RECENT TRENDS AND THE ROLE OF THE WTO
67
Box B.2: How close are the Millennium Development Goals to being achieved? (continued)
PovcalNet database. By 2011, some countries had managed to cut extreme poverty by more than half, well in advance of the 2015 deadline, while others remained far from achieving this.
Some countries have significantly exceeded their targets – notably China, Viet Nam, Pakistan and Nepal. However, the share of the population in extreme poverty has actually increased in a few African countries, notably Kenya and Zambia.
Trade can help to contribute to achieving several of the MDGs, especially the first (eradication of poverty and hunger) and the eighth (global partnership for development). Trade helps to achieve the first goal to the extent that greater access to international markets boosts exports, which contribute positively to GDP. Trade can also make firms in developing economies more efficient by giving them access to larger markets, thereby allowing them to take advantage of economies of scale. Imports can also help to reduce the burden of poverty by increasing competition and giving low-income consumers access to less expensive goods, both imported and domestically produced.
The main contribution of the WTO to the goal of developing a global partnership for development was intended to be the conclusion of the Doha Round of trade negotiations with an agreement that reflected developing country concerns. Although the Round has not yet been completed, the agreement reached at the Bali Ministerial Conference was a positive step in that direction.
Figure B.13: Per capita GDP growth and income inequality in developing economies, 2000–11(average annual percentage change and change in Gini coefficient)
–8
–4
0
4
8
12
–2 0 2 4 6 8 10
Cha
nge
in 0
-10
0 G
ini c
oeffi
cien
t, 2
00
0-1
1
Average annual growth in real GDP per capita, 2000-11
Sources: Penn World Tables 8.0 for real GDP, World Bank for Gini coefficients.
Note: The world average change in the Gini index between 2000 and 2011 was –1.3. The size of each data point signifies the country’s population.
living in absolute poverty and reduced inequality. Most recently, the impressive growth of many Asian economies has proceeded together with a significant increase in the size of the middle class.
The specific reasons for economic growth and government policies at the country level explain the different growth and inequality trends. For example, a number of empirical
studies show that the relationship between GDP per capita and inequality mainly depends on technological changes. The main determinants of wage inequality in developing countries are skill-biased technological changes because they increase the relative wage of skilled workers.
Globalization and trade are often perceived to be a cause of inequality and job insecurity. Yet, recent evidence

WORLD TRADE REPORT 2014
68
suggests that trade is unlikely to have had an impact on inequality through the traditional channels of shifting demand for production factors (Haskel et al., 2012). Inequality is principally driven by technological changes, increased demand for skilled labour, and FDI-enhancing types of taxation choices made by governments (Feenstra and Hanson, 1997).
Economic literature on the Asian miracle has highlighted the role of the government, land reforms and universal education to explain the good performance of Asian countries. According to Stiglitz (1996), redistribution policies increased the ability of the median citizen to consume, thus providing an additional boost for growth through domestic consumption and investment.
(c) Environmental impact of economic development
Another important dimension of development beyond income is environmental quality. As with the Human Development Index cited above, we have relied on a composite index to gauge the strength of the relationship between incomes and environmental performance for all available countries. The measure used in this report is the
Environmental Performance Index (EPI) produced by the Yale Centre for Environmental Law and Policy.
The index is based on 22 indicators of environmental health and eco-system viability, including pollution, access to clean drinking water, sulphur dioxide (SO2) emissions, carbon dioxide (CO2) emissions, agricultural subsidies and critical habitat protection. Higher values of the index represent better environmental quality. Among the fast-growing developing economies, some have improved their EPI performance while others have seen a deterioration.
Figure B.14 shows a positive relationship between the EPI and per capita income. This suggests that countries with higher incomes are better able to pay for preserving their environment. To the extent that trade and other policies can promote economic growth, they may indirectly help to clean up the environment.
Environmental economics refers to the “Environmental Kuznets Curve” (EKC) to identify a correlation between income per capita and environmental degradation. The hypothesis is that environmental quality degrades at the early stages of development while beyond a certain income level environmental quality improves (Grossman
Figure B.14: Real per capita GDP and environmental performance(2005 PPP$, weighted by population in 2010)
–10,000
0
10,000
20,000
30,000
40,000
50,000
60,000
20 30 40 50 60 70 80
Rea
l GD
P p
er c
apita
(2
01
0)
Environmental Performance Index (2010)
Sources: Yale Center for Environmental Law and Policy and Penn World Tables 8.0.
Note: The size of each data point signifies the country’s population.

B. TH
E IN
CR
EA
SIN
G IM
PO
RTA
NC
E O
F D
EV
ELO
PIN
G C
OU
NTR
IES
IN TH
E
GLO
BA
L EC
ON
OM
YII. TRADE AND DEVELOPMENT: RECENT TRENDS AND THE ROLE OF THE WTO
69
and Krueger, 1993). Pollution increases as an economy industrializes and moves from agriculture to manufacturing (a pollution-intensive sector). Then, as the country GDP per capita increases, environmental quality improves despite the increase in the economic activity (scale effect). This is for several reasons.
First, as an economy develops, the composition of production changes. Production tends to move away from natural resource-intensive goods to services. Secondly, changes in consumption and a growing preference for environmentally friendly goods emerge at higher levels of income. Thirdly, as a country’s level of development increases, the quality of institutions improves, as does a country’s capacity to enforce regulatory measures to address environmental problems. Finally, a higher GDP per capita also enhances the possibility to exploit economies of scale associated with pollution abatement technologies (technique effect).
Empirical evidence on the existence of an EKC has to date produced conflicting results. While there is some evidence for a reduction in some pollutants, such as SO2, the EKC has in general not been found to apply for CO2 emissions – rather, per capita CO2 emissions appear to increase with income (Shafik, 1994; Frankel and Rose, 2005; Huang et al., 2008). Among the possible explanations for this conflicting evidence is that, while some pollutants create local problems (SO2 is one of them), others (such as CO2 emissions) do not. Therefore, while reducing pollution that is causing a local problem provides a higher pay-off for local government, governments are less likely to intervene when the environmental impact of a pollutant is more global than local.
Empirical evidence indicates that there is no causal relationship between a country’s level of development and its environmental performance. Political institutions, good governance and the diffusion of environmentally friendly technological innovation (all factors associated with a
country’s level of development) shape the relationship between GDP per capita and environmental quality. As a country’s economic size increases, so does its economic activity and – for a given technology – pollution. However, appropriate environmental policies can have an impact on this relationship.
Trade is an important factor affecting the relationship between growth and environment. First, opening up to trade increases the availability, and lowers the costs, of environmentally friendly technologies. Secondly, the greater demand by the public – especially in more advanced economies – for a cleaner environment also provides an incentive to adopt cleaner technologies in less advanced economies. For example, it has been argued that multinational enterprises, due to concerns about their reputation and economies of scale, may require more stringent environmental measures from their subsidiaries than that required by the host country (Albornoz et al., 2009). Thirdly, assuming no changes in the scale of an economic activity and the production method, trade opening may reduce domestic pollution in the country that specializes in the clean sectors. Specialization in a pollution-intensive sector will, however, worsen environmental quality if the country does not improve its environmentally friendly technologies.
5. Trade opening in developing countries
The trade opening of several large, dynamic developing economies over the last decades has radically changed the pattern of international trade. Table B.3 shows data for the most-favoured nation (MFN) applied rate, the “bound” rates (the maximum tariff rates that WTO members have committed not to exceed), and the percentage of product lines with bound rates. The table shows an average rate in 2011 and the percentage change since 1996.
Table B.3: Average tariff rates, by country group(per cent)
Most-favoured nation (MFN) rate(per cent)
Bound rate (per cent)
Bound lines (per cent)
Average 2009–11
Change since 1996
Average 2009–11
Change since 1996
Average 2009–11
Change since 1996
World 8.5 –2.0 27.0 –3.8 80.1 12.9
Developed 2.7 –1.9 6.3 –1.3 98.9 –0.1
G-20 developing 10.1 –5.5 29.2 –9.8 80.0 7.9
Other developing 13.0 –1.7 29.6 –7.1 87.6 22.4
LDCs 7.1 –2.1 42.2 –2.4 45.5 8.4
Source: WTO Secretariat.
Note: Changes are from average 1996-98 to average 2009-11. The sample only includes those country-product pairs for which data are available on the status of bound lines, bound rates and imports for at least one year both at the beginning and at the end of the period.

WORLD TRADE REPORT 2014
70
All country groups shown in Table B.3 have liberalized trade since 1996 but the trade opening in G-20 developing and other developing economies has been the most significant. G-20 developing countries have reduced their MFN applied rate by over 5 per cent. They have bound over 80 per cent of their tariff lines and reduced their bound rates by approximately 10 per cent over the last decade. While the change in the MFN rate in other developing economies was roughly in line with the change for the world as a whole, these countries also reduced their bound rates sharply (by 7 per cent) and substantially increased the number of bound lines (by 22 per cent).
China’s accession to the WTO in 2001 played a major role in its opening to trade. China’s simple average tariff has fallen from about 40 per cent in 1985 to under 10 per cent today. Ianchovichina and Martin (2001) create a counterfactual scenario for Chinese tariffs if the country had not joined the WTO. They estimate that China’s accession might have lowered its weighted average tariff protection on imports from 21.4 per cent to 7.9 per cent. A large body of research exists showing the positive impact of China’s accession in terms of economic growth, trade and investment.8
The trade opening of G-20 developing economies has expanded export opportunities for these economies in general and for LDCs in particular. This is illustrated by Table B.4, which shows the evolution of tariffs applied by developed economies and selected G-20 developing
economies on imports from LDCs. The G-20 developing economies in the table are limited to those with data for all periods shown, i.e. 2002-12. Tariffs on LDC imports have fallen more rapidly in G-20 developing countries than in developed countries since 2002. Much of this decline is due to the opening of the Chinese market, which carries a large weight in this group of importers.
In recent years, LDCs and other developing countries have significantly increased their exports to G-20 developing countries, particularly those in Asia. The share of Africa’s exports to developed economies fell from 72 per cent in 1995 to 53 per cent in 2012 (see Figure B.15). A similar pattern was observed in South and Central America and in the Middle East, although it was not as marked as in Africa. For most developing countries, the emergence of large new markets has led to an increase in total exports rather than diversion from traditional trading partners towards new ones. Trade expansion to these markets also reduces output volatility for vulnerable economies.
However, not all products and countries benefit to the same extent from these new market opportunities. Exports from African countries to developing economies are concentrated in primary products, especially oil. This trend is particularly evident in Africa’s exports to developing Asia (i.e. Asia excluding Australia, Japan and New Zealand). In 2012, fuels accounted for about 69 per cent of all exports from Africa to these countries, compared with a 65 per cent share in exports to
Table B.4: Tariffs on imports from LDCs in developed and selected G-20 developing economies, 2002–12(US$ million and per cent)
Import values (US$ million)
Weighted average tariffs, including preferencesa (per cent)
All sectors
Non-oil
Agricultural (AOA)b
Non-agricultural (NAMA)c
All sectors
Non-oil
Agricultural (AOA)b
Non-agricultural (NAMA)c
Developed economies
2002 23,683 16,880 1,664 15,216 2.4 4.0 2.8 4.2
2007 58,377 30,603 3,283 27,320 2.1 3.4 1.9 3.6
2012 83,059 46,492 5,233 41,259 2.1 3.5 0.9 3.8
Selected G-20 developing economiesd
2002 4,969 4,221 218 4,003 1.9 5.3 13.3 3.1
2007 31,149 26,728 1,027 25,700 1.0 4.4 17.6 1.7
2012e 63,657 46,777 1,664 45,113 0.4 1.2 5.2 0.8
Source: WTO Secretariat estimates based on IDB data.
a Weighted averages for developed economies use fixed weights for all three years.
b Agricultural products as defined in Annex 1 of the WTO Uruguay Round Agreement on Agriculture (AOA).
c i.e. non-agricultural market access, referring to all products not covered by the WTO Agreement on Agriculture.
d Includes Brazil, China, Indonesia, Republic of Korea, Mexico, South Africa and Turkey.
e Tariff data are available for all G-20 developing economies other than Argentina in 2012. For this group of countries, trade-weighted average tariffs on LDC imports are 1.3 per cent for all sectors, 1.3 per cent for non-oil, 3.8 per cent for agriculture and 1.8 per cent for non-agriculture.

B. TH
E IN
CR
EA
SIN
G IM
PO
RTA
NC
E O
F D
EV
ELO
PIN
G C
OU
NTR
IES
IN TH
E
GLO
BA
L EC
ON
OM
YII. TRADE AND DEVELOPMENT: RECENT TRENDS AND THE ROLE OF THE WTO
71
Figure B.15: Merchandise exports of Africa, by export/import partner, 1995–2012(US$ billion and per cent)
0
10
20
30
40
50
60
70
80
90
100
19
95
19
96
19
97
19
98
19
99
20
00
20
01
20
02
20
03
20
04
20
05
20
06
20
07
20
08
20
09
20
10
20
11
20
12
Exports (per cent)
11
2
12
5
12
7
10
5
11
7 14
9
13
9
14
5 17
9
24
0
31
1
37
1
43
7
56
2
39
3
51
1
59
8 63
0
0
100
200
300
400
500
600
700
19
95
19
96
19
97
19
98
19
99
20
00
20
01
20
02
20
03
20
04
20
05
20
06
20
07
20
08
20
09
20
10
20
11
20
12
Exports (US$ billion)
11
2
11
6
11
8
12
3
11
9
12
3
13
0
13
6 16
2 20
6 24
7 29
0
36
2
45
9
39
2
45
7
54
3 58
0
0
100
200
300
400
500
600
700
19
95
19
96
19
97
19
98
19
99
20
00
20
01
20
02
20
03
20
04
20
05
20
06
20
07
20
08
20
09
20
10
20
11
20
12
Imports (US$ billion)
0
10
20
30
40
50
60
70
80
90
100
19
95
19
96
19
97
19
98
19
99
20
00
20
01
20
02
20
03
20
04
20
05
20
06
20
07
20
08
20
09
20
10
20
11
20
12
Imports (per cent)
UnspecifiedOther developingLDCsOther G-20 developingIndiaChinaBrazilDeveloped
Source: WTO Secretariat.
developed countries. Moreover, the share of primary products (including food, agricultural raw materials and mining products as well as oil) in African exports to developing Asia reached 90 per cent in 2012, compared with 82 per cent for developed economies (see Figure B.16). In addition, developing Asia’s trade with Africa is concentrated in a handful of countries. Around 80 per cent of developing Asia’s imports from Africa originate from three countries: Angola, Nigeria and South Africa.
6. Conclusions
This section has documented the rapid rise of large developing countries over the past 15 years and their increased importance in international trade. Trade opening across a wide range of sectors has been an integral part of this process. Access to these markets presents an enormous opportunity for other developing countries.

WORLD TRADE REPORT 2014
72
Figure B.16: Merchandise exports of Africa to developed economies and developing Asia by product, 1995–2012(per cent)
0
10
20
30
40
50
60
70
80
90
100
19
95
19
96
19
97
19
98
19
99
20
00
20
01
20
02
20
03
20
04
20
05
20
06
20
07
20
08
20
09
20
10
20
11
20
12
Developed economies
0
10
20
30
40
50
60
70
80
90
100
19
95
19
96
19
97
19
98
19
99
20
00
20
01
20
02
20
03
20
04
20
05
20
06
20
07
20
08
20
09
20
10
20
11
20
12
Developing Asia
UnspecifiedManufacturesMiningFuelsRaw materialsFood
Source: WTO Secretariat.
Endnotes
1 The developed economies group also includes a number of small territories whose data are usually recorded together with other countries, specifically: Andorra, Bermuda, Channel Islands, Faroe Islands, Gibraltar, Greenland, Isle of Man, Liechtenstein, Monaco, San Marino, and Saint Pierre and Miquelon.
2 The Commonwealth of Independent States consists of Armenia, Azerbaijan, Belarus, Georgia, Kazakhstan, Kyrgyzstan, Moldova, the Russian Federation, Tajikistan, Turkmenistan, Ukraine and Uzbekistan.
3 On 29 April, 2014, the World Bank announced the release of new purchasing power parity (PPP) estimates from the International Comparison Program using data from 199 countries – the most extensive measurement effort of this type to date. These new estimates may alter some specific findings in this report, which was prepared using earlier PPP estimates, but the overall story would not be affected.
4 See WTO (2008b), Section B for a review, as well as Box B.1 for a short overview.
5 Acemoglu and Ventura (2002) show that long-term growth with capital accumulation only is not sustainable in an open economy (as is typically the case in a closed economy) if countries have market power over the product they export (a high-technology product, for example). This is because, in this case, they will experience a worsening of their terms-of-trade as their exports increase.
6 Baldwin and Robert-Nicoud (2008).
7 This coefficient (also known as the Gini index because it ranges in value between 0 and 1) measures the degree of concentration in a particular population when the mathematical form of the underlying distribution is unknown. It is especially popular for measuring income inequality and is based on the Lorenz curve, which shows the proportion of total income received by the poorest X per cent of persons in a particular country.
8 For instance, Ianchovichina and Martin (2001) provide estimates of the gains due to trade reforms and their impact on wages and employment. Hertel et al. (2006) show that China’s accession to the WTO substantially increased investment and capital stocks. These authors explain the rise of domestic investment by commitments about the removal of local content requirements, the end of discrimination between domestic and foreign companies and a more efficient use of domestic savings. Mattoo (2002) looks at the impact of China’s accession to the WTO from commitments on services liberalization that he considers to constitute the most radical programme of services reforms negotiated under the WTO. He finds that foreign investment increased as most restrictions on foreign entry and ownership, as well as forms of discrimination against foreign firms, were expected to be eliminated. See also Tang and Wei (2009) for a more general empirical examination of the positive impact of GATT/WTO accessions on growth and investment. Similar results, with a further refined methodology, are also obtained by Eicher and Henn (2011).

B. TH
E IN
CR
EA
SIN
G IM
PO
RTA
NC
E O
F D
EV
ELO
PIN
G C
OU
NTR
IES
IN TH
E
GLO
BA
L EC
ON
OM
YII. TRADE AND DEVELOPMENT: RECENT TRENDS AND THE ROLE OF THE WTO
73
Appendix tablesAppendix Table B.1: Country groups used in this report
Developed economies
Australia, Austria, Belgium, Bermuda, Bulgaria, Canada, Cyprus, Czech Republic, Denmark, Estonia, Faroe Islands, Finland, France, Germany, Gibraltar, Greece, Greenland, Hungary, Iceland, Ireland, Italy, Japan, Latvia, Liechtenstein, Lithuania, Luxembourg, Malta, Monaco, Netherlands, New Zealand, Norway, Poland, Portugal, Romania, Saint Pierre and Miquelon, Slovak Republic, Slovenia, Spain, Sweden, Switzerland, United Kingdom, United States.
Developing economies
G-20 developing economies
Argentina, Brazil, China, India, Indonesia, Republic of Korea, Mexico, Russian Federation, Kingdom of Saudi Arabia, South Africa, Turkey.
Least-developed countries (LDCs)
Afghanistan, Angola, Bangladesh, Benin, Bhutan, Burkina Faso, Burundi, Cambodia, Central African Republic, Chad, Comoros, Democratic Republic of the Congo, Djibouti, Equatorial Guinea, Eritrea, Ethiopia, The Gambia, Guinea, Guinea-Bissau, Haiti, Kiribati, Lao People’s Democratic Republic, Lesotho, Liberia, Madagascar, Malawi, Mali, Mauritania, Mozambique, Myanmar, Nepal, Niger, Rwanda, Samoa, Sao Tomé and Principe, Senegal, Sierra Leone, Solomon Islands, Somalia, South Sudan, Sudan, Tanzania, Timor-Leste, Togo, Tuvalu, Uganda, Vanuatu, Yemen, Zambia.
Other developing economies
Albania, Algeria, American Samoa, Andorra, Anguilla, Antigua and Barbuda, Armenia, Aruba (the Netherlands with respect to), Azerbaijan, Bahamas, Kingdom of Bahrain, Barbados, Belarus, Belize, Plurinational State of Bolivia, Bosnia and Herzegovina, Botswana, British Indian Ocean Territory, British Virgin Islands, Brunei Darussalam, Cabo Verde, Cameroon, Cayman Islands, Chile, Chinese Taipei, Christmas Island, Cocos Islands, Colombia, Congo, Cook Islands, Costa Rica, Côte d’Ivoire, Croatia, Cuba, Curaçao, Dominica, Dominican Republic, Ecuador, Egypt, El Salvador, Fiji, French Guiana, French Polynesia, FYR Macedonia, Gabon, Georgia, Ghana, Grenada, Guadeloupe, Guam, Guatemala, Guyana, Honduras, Hong Kong (China), Iran, Iraq, Israel, Jamaica, Jordan, Kazakhstan, Kenya, Democratic People’s Republic of Korea, State of Kuwait, Kyrgyz Republic, Lebanese Republic, Libya, Macao (China), Malaysia, Maldives, Marshall Islands, Martinique, Mauritius, Federated States of Micronesia, Midway Islands, Moldova, Mongolia, Montenegro, Montserrat, Morocco, Namibia, Nauru, Netherlands Antilles, New Caledonia, Nicaragua, Nigeria, Niue, Norfolk Island, Northern Mariana Islands, Oman, Pakistan, Palau, Panama, Papua New Guinea, Paraguay, Peru, Philippines, Pitcairn, Puerto Rico, Qatar, Reunion, Saint Helena, Saint Kitts and Nevis, Saint Lucia, Saint Vincent and the Grenadines, Serbia, Seychelles, Singapore, Sint Maarten, Sri Lanka, Suriname, Swaziland, Syrian Arab Republic, Tajikistan, Thailand, Tokelau, Tonga, Trinidad and Tobago, Tunisia, Turkmenistan, Turks and Caicos Islands, Ukraine, United Arab Emirates, Uruguay, U.S. Virgin Islands, Uzbekistan, Bolivarian Republic of Venezuela, Viet Nam, Wake Island, Wallis and Futuna Islands, Zimbabwe.
Source: WTO Secretariat.

WORLD TRADE REPORT 2014
74
Economy
Real GDP per capita
2011a (2005 US$)
Growth in real per
capita GDP 2000-11a (average annual
percentage change)
Environmental Performance
Index (0-100)
Non-income Human
Development Index
(0-100)
Trade/GDP ratio
(period average)
Trade-weighted
average tariff (per cent)
Gini (0-100)
2000a 2010a 2000a 2012a1998-2000a
2010-2012a 2000a 2011a 2000a 2011a
Developed economies
Australia 38,499 1.7 56 57 96 98 20 22 10.9 1.8 .. ..
Austria 37,283 1.1 68 69 85 91 42 54 2.1 1.1 29 ..
Belgium 35,446 1.0 53 63 90 92 .. 83 2.1 1.1 33 ..
Bulgaria 12,907 5.1 49 56 77 83 50 64 2.1 1.1 26 ..
Canada 35,345 0.5 56 58 91 93 41 31 1.3 0.9 33 ..
Cyprus 28,183 2.2 56 57 82 87 50 44 2.1 1.1 .. ..
Czech Republic 23,254 2.4 61 65 86 91 56 71 2.1 1.1 .. ..
Denmark 35,641 0.9 61 64 88 92 39 50 2.1 1.1 25 ..
Estonia 20,102 5.2 56 56 84 89 79 92 2.1 1.1 37 ..
Finland 33,747 1.4 62 64 85 91 35 41 2.1 1.1 27 ..
France 31,438 0.8 62 69 86 92 26 30 2.1 1.1 .. ..
Germany 34,520 1.4 67 67 88 95 30 48 2.1 1.1 28 ..
Greece 23,699 1.4 56 60 82 90 22 26 2.1 1.1 34 ..
Hungary 18,852 2.9 52 57 83 87 68 87 2.1 1.1 27 ..
Iceland 31,922 –0.5 64 66 89 94 36 54 3.4 1.0 .. ..
Ireland 36,705 1.1 54 59 90 96 89 94 2.1 1.1 34 ..
Italy 29,089 –0.2 63 69 84 91 24 29 2.1 1.1 36 ..
Japan 30,427 0.3 60 63 90 94 10 16 2.8 1.3 .. ..
Latvia 16,006 4.9 64 70 78 86 47 59 2.1 1.1 34 35
Lithuania 17,200 4.7 62 66 80 85 47 77 2.1 1.1 32 38
Luxembourg 78,131 2.1 69 69 83 86 75 132 2.1 1.1 31 ..
Malta 23,993 1.4 48 49 81 88 87 98 2.1 1.1 .. ..
Netherlands 38,055 1.1 64 66 91 95 60 77 2.1 1.1 31 ..
New Zealand 26,667 0.9 59 66 94 98 31 29 2.5 1.6 36 ..
Norway 52,415 2.7 68 70 94 98 37 34 1.1 0.5 26 ..
Poland 18,430 3.9 62 63 82 85 28 45 2.1 1.1 33 33
Portugal 22,290 1.1 52 58 78 84 33 38 2.1 1.1 38 ..
Romania 13,574 6.5 42 48 76 84 31 41 2.1 1.1 30 27
Slovak Republic 21,467 4.7 60 67 82 87 47 87 2.1 1.1 .. 26
Slovenia 24,365 1.8 57 62 87 94 52 70 2.1 1.1 28 ..
Spain 28,741 1.6 56 60 86 92 28 30 2.1 1.1 35 ..
Sweden 36,101 1.2 66 69 94 94 39 45 2.1 1.1 25 ..
Switzerland 44,824 1.7 76 77 89 93 42 58 1.4 0.0 34 ..
United Kingdom 32,260 0.6 61 69 84 89 27 32 2.1 1.1 36 ..
United States 42,646 0.5 54 57 92 96 12 15 1.8 1.6 41 ..
G-20 developing economies
Argentina 14,508 3.2 52 56 80 85 11 20 10.5 5.6 51 44
Brazil 9,295 1.9 55 61 68 76 9 12 12.7 7.9 60 55
China 8,069 7.5 41 42 65 73 20 27 14.6 4.1 39 42
India 3,602 6.2 35 36 49 58 13 25 28.6 8.2 .. 34
Indonesia 4,339 2.8 47 52 58 67 42 24 5.2 2.6 29 38
Korea, Republic of 27,522 3.1 52 57 88 95 38 55 5.9 8.7 32 ..
Mexico 12,710 1.4 43 49 73 81 32 32 15.2 2.2 52 47
Russian Federation 18,678 6.4 49 45 74 82 33 26 8.8 5.2 37 40
Saudi Arabia, Kingdom of
25,556 5.1 51 50 69 77 29 41 12.1 3.9 .. ..
South Africa 8,457 3.3 34 35 61 61 25 29 4.6 4.5 58 63
Turkey 14,437 3.1 40 45 63 72 20 27 5.4 2.7 .. 40
Appendix Table B.2: Development indicators by level of development for selected economies, 2000–12a

B. TH
E IN
CR
EA
SIN
G IM
PO
RTA
NC
E O
F D
EV
ELO
PIN
G C
OU
NTR
IES
IN TH
E
GLO
BA
L EC
ON
OM
YII. TRADE AND DEVELOPMENT: RECENT TRENDS AND THE ROLE OF THE WTO
75
Economy
Real GDP per capita
2011a (2005 US$)
Growth in real per
capita GDP 2000-11a (average annual
percentage change)
Environmental Performance
Index (0-100)
Non-income Human
Development Index
(0-100)
Trade/GDP ratio
(period average)
Trade-weighted
average tariff (per cent)
Gini (0-100)
2000a 2010a 2000a 2012a1998-2000a
2010-2012a 2000a 2011a 2000a 2011a
Other developing economies
Albania 7,365 4.6 59 66 77 81 25 42 11.3 1.3 29 35
Antigua and Barbuda 12,909 –0.3 .. .. .. 78 72 51 15.5 14.6 .. ..
Armenia 5,235 6.3 45 47 77 81 36 35 2.4 2.3 36 31
Azerbaijan 9,317 11.9 34 43 .. 78 37 39 6.6 3.9 .. 34
Bahamas 19,367 –2.3 .. .. .. 78 41 48 28.6 18.9 .. ..
Bahrain, Kingdom of 20,676 2.4 .. .. 77 81 71 62 7.9 5.7 .. ..
Barbados 20,642 –0.9 .. .. 80 86 54 56 21.0 14.8 .. ..
Belarus 15,353 6.9 49 54 .. 83 .. 72 8.9 1.8 30 26
Belize 7,367 1.6 .. .. 72 77 57 61 11.2 11.1 53 ..
Bolivia, Plurinational State of
4,167 3.6 54 55 68 74 21 37 8.5 3.7 63 56
Bosnia and Herzegovina
7,581 3.9 38 37 .. 79 59 49 5.1 1.5 .. ..
Botswana 11,811 3.4 48 54 55 60 46 46 1.5 3.6 .. ..
Brunei Darussalam 67,544 4.5 62 62 79 83 55 45 9.5 4.1 .. ..
Cameroon 1,858 –0.1 42 43 43 52 24 26 13.5 11.9 .. ..
Cabo Verde 4,126 5.2 .. .. 58 62 41 53 .. 10.2 .. ..
Chile 15,243 4.3 53 55 80 86 28 35 9.0 4.0 55 52
Colombia 8,408 3.0 58 62 68 75 16 18 11.0 5.6 59 56
Congo 2,427 2.6 47 47 50 55 66 79 17.8 14.7 .. ..
Costa Rica 10,123 1.6 66 69 74 82 48 40 3.7 3.1 47 51
Côte d’Ivoire 1,372 –1.8 51 54 38 44 37 47 7.2 6.8 44 42
Croatia 17,216 3.3 61 64 78 84 40 42 4.5 1.3 31 34
Dominica 11,329 2.3 .. .. 77 77 57 44 13.8 8.6 .. ..
Dominican Republic 8,727 3.4 51 52 67 73 40 29 15.9 6.1 52 47
Ecuador 6,828 4.6 58 61 71 77 25 32 11.1 4.1 57 49
Egypt 4,836 1.9 48 55 62 70 20 23 14.2 8.1 33 31
El Salvador 1,117 1.1 51 52 64 72 33 36 6.5 5.5 52 48
Fiji 4,645 –0.8 .. .. 74 79 56 58 .. 9.9 .. 43
FYR Macedonia 8,240 3.5 45 47 .. 78 49 61 9.3 2.0 34 44
Gabon 12,403 4.8 50 58 60 67 49 41 16.2 14.5 .. ..
Georgia 5,839 7.2 54 57 .. 85 30 45 10.1 0.7 41 42
Ghana 2,522 3.8 45 48 53 65 46 41 16.2 8.6 41 ..
Grenada 8,502 1.4 .. .. .. 83 58 36 16.2 7.6 .. ..
Guatemala 4,236 1.1 48 52 51 60 23 31 5.8 2.3 54 ..
Honduras 2,920 1.2 49 53 60 70 53 57 8.4 6.5 55 57
Hong Kong, China 38,569 2.5 .. .. 80 91 129 209 0.0 0.0 .. ..
Iran 11,818 5.9 41 43 66 77 19 26 22.7 21.8 44 ..
Iraq 4,197 0.3 26 25 59 62 64 37 .. .. .. ..
Israel 25,081 –0.9 54 55 91 94 35 35 .. 3.5 .. ..
Jamaica 5,078 0.3 52 54 72 79 43 41 9.9 7.5 44 ..
Jordan 5,092 4.4 40 42 72 77 53 58 18.9 5.2 36 35
Kazakhstan 16,270 10 35 33 71 79 42 39 .. 3.4 .. 29
Kenya 1,298 –0.3 47 49 49 59 38 37 15.0 6.1 43 ..
Kuwait, State of 63,199 7.0 37 36 73 73 42 47 3.9 4.1 .. ..
Kyrgyz Republic 2,217 0.6 46 46 71 74 47 70 6.8 2.4 36 33
Lebanese Republic 13,159 8.0 47 47 .. 76 37 74 16.9 4.8 .. ..
Macao, China 69,472 10.1 .. .. .. .. 70 79 .. 0.0 .. ..
Appendix Table B.2: Development indicators by level of development for selected economies, 2000–12a (continued)

WORLD TRADE REPORT 2014
76
Economy
Real GDP per capita
2011a (2005 US$)
Growth in real per
capita GDP 2000-11a (average annual
percentage change)
Environmental Performance
Index (0-100)
Non-income Human
Development Index
(0-100)
Trade/GDP ratio
(period average)
Trade-weighted
average tariff (per cent)
Gini (0-100)
2000a 2010a 2000a 2012a1998-2000a
2010-2012a 2000a 2011a 2000a 2011a
Malaysia 13,469 2.8 60 63 73 79 108 83 4.3 4.0 49 46
Maldives 10,344 4.7 .. .. 61 72 75 99 20.6 20.6 63 ..
Mauritius 9,645 –0.8 .. .. 68 75 61 60 23.8 0.7 .. ..
Moldova 3,393 6.3 42 45 71 75 61 62 2.2 2.5 39 33
Mongolia 5,219 8.7 42 45 63 75 57 65 .. 5.1 30 37
Montenegro 11,017 2.9 .. .. .. 85 .. 51 .. 3.5 .. 29
Morocco 3,647 1.0 43 46 52 61 28 41 25.4 7.1 39 ..
Namibia 5,146 2.9 50 51 56 61 46 45 0.5 1.1 .. ..
Nigeria 2,339 15.7 37 40 .. 48 36 34 20.0 10.6 .. 49
Oman 31,055 8.1 44 44 .. 69 45 54 13.7 3.2 .. ..
Pakistan 2,473 1.7 35 40 41 53 16 18 17.9 9.5 33 30
Panama 12,155 4.0 56 58 77 81 70 77 7.2 7.6 58 52
Paraguay 4,351 2.9 49 52 66 73 41 49 10.5 4.5 57 52
Peru 8,924 6.3 47 50 73 78 16 25 12.8 1.5 51 48
Philippines 3,521 0.5 50 57 68 72 50 30 4.1 4.8 46 43
Qatar 124,720 9.4 46 47 73 76 75 45 4.3 3.8 .. ..
Saint Kitts and Nevis 12,706 0.7 .. .. .. 76 54 34 13.1 10.8 .. ..
Saint Lucia 9,198 2.0 .. .. .. 77 58 57 16.3 9.0 .. ..
Saint Vincent and the Grenadines
8,092 1.3 .. .. .. 77 57 42 15.0 8.4 .. ..
Serbia 9,575 3.6 46 46 79 82 28 46 5.8 .. .. 30
Singapore 51,644 3.8 53 56 80 88 164 201 0.0 0.0 42 ..
Sri Lanka 4,701 3.6 50 56 75 79 41 29 6.7 5.7 .. 36
Suriname 6,700 2.9 .. .. .. 71 50 52 12.9 11.9 53 ..
Swaziland 4,239 –0.6 .. .. 47 52 78 63 0.7 4.2 .. 51
Syrian Arab Republic 3,919 10.2 41 43 63 69 31 24 15.5 6.1 .. ..
Chinese Taipei 28,414 1.2 56 62 .. .. 48 71 .. .. .. ..
Tajikistan 2,437 5.3 36 39 67 73 76 46 6.8 5.9 29 31
Thailand 8,491 2.9 54 60 64 72 55 72 9.5 4.9 43 39
Trinidad and Tobago 20,196 5.6 43 47 70 74 50 64 17.9 10.0 .. ..
Tunisia 6,632 0.5 44 47 66 75 40 52 25.7 16.0 41 36
Turkmenistan 12,531 5.2 30 32 .. 73 100 56 0.0 .. 41 ..
Ukraine 8,176 6.8 47 46 76 81 51 54 3.9 1.9 29 26
Uruguay 12,625 2.5 56 57 78 83 17 27 6.2 3.8 44 45
Uzbekistan 6,209 5.6 29 32 .. 74 21 27 5.8 6.9 45 ..
Venezuela, Bolivarian Rep. of
10,343 4.7 53 56 66 77 22 21 13.4 8.6 48 ..
Viet Nam 3,448 6.1 48 51 61 69 50 83 19.0 5.7 36 36
Zimbabwe 4,348 –0.1 49 53 45 54 40 57 17.7 .. .. ..
Least-developed countries (LDC)
Angola 4,214 8.1 43 48 35 48 74 52 8.5 7.4 59 43
Bangladesh 1,554 2.6 38 43 49 57 16 27 17.9 13.0 33 32
Benin 1,232 0.4 50 50 38 46 27 29 12.6 15.0 .. ..
Bhutan 4,607 3.8 .. .. .. 52 38 53 14.8 17.8 .. ..
Burkina Faso 1,052 3.4 .. .. .. 33 18 28 11.2 8.6 47 40
Burundi 490 0.8 .. .. 29 42 12 18 13.3 6.6 42 ..
Cambodia 2,348 7.6 53 55 51 60 47 52 16.4 9.9 .. 36
Central African Republic
617 –0.7 .. .. 29 39 21 17 18.3 13.6 .. 56
Appendix Table B.2: Development indicators by level of development for selected economies, 2000–12a (continued)

B. TH
E IN
CR
EA
SIN
G IM
PO
RTA
NC
E O
F D
EV
ELO
PIN
G C
OU
NTR
IES
IN TH
E
GLO
BA
L EC
ON
OM
YII. TRADE AND DEVELOPMENT: RECENT TRENDS AND THE ROLE OF THE WTO
77
Economy
Real GDP per capita
2011a (2005 US$)
Growth in real per
capita GDP 2000-11a (average annual
percentage change)
Environmental Performance
Index (0-100)
Non-income Human
Development Index
(0-100)
Trade/GDP ratio
(period average)
Trade-weighted
average tariff (per cent)
Gini (0-100)
2000a 2010a 2000a 2012a1998-2000a
2010-2012a 2000a 2011a 2000a 2011a
Chad 1,851 7.8 .. .. 29 32 24 44 13.2 14.9 .. ..
Comoros 921 –0.6 .. .. .. 48 26 33 .. 6.2 .. ..
Congo, Democratic Republic of
291 2.6 46 47 32 40 20 69 12.7 11.0 .. ..
Djibouti 2,392 2.3 .. .. .. 44 34 34 26.7 17.6 .. ..
Equatorial Guinea 9,176 9.5 .. .. 45 46 101 74 14.4 15.6 .. ..
Ethiopia 783 5.3 52 53 29 43 16 25 12.1 10.4 30 34
Gambia 1,236 0.5 .. .. 34 45 27 36 .. 12.5 50 ..
Guinea 958 –2.4 .. .. .. 37 23 38 .. 11.9 .. ..
Guinea-Bissau 907 1.5 .. .. .. 37 30 28 13.9 11.8 .. ..
Lao People's Democratic Republic
2,624 4.7 .. .. 50 58 35 31 13.4 13.2 35 37
Lesotho 1,488 3.4 .. .. 45 48 73 78 17.5 10.7 .. ..
Liberia 474 –0.8 .. .. 40 50 104 86 .. .. .. ..
Madagascar 759 –0.8 .. .. 49 60 28 31 3.4 6.1 42 44
Malawi 802 2.8 .. .. 40 49 34 42 9.9 6.2 50 44
Mali 941 1.7 .. .. 26 36 31 31 10.6 8.4 .. 33
Mauritania 2,616 5.8 .. .. 42 47 33 71 9.9 10.1 39 40
Mozambique 818 6.0 47 48 26 33 22 42 10.1 4.8 .. 46
Nepal 1,185 1.2 51 58 45 53 26 22 16.4 12.0 .. 33
Niger 523 0.1 .. .. 22 31 21 38 13.7 9.7 .. 35
Rwanda 1,201 5.2 .. .. 33 48 12 22 6.3 6.1 52 51
Sao Tomé and Principe
1,852 4.2 .. .. 51 58 33 34 .. .. .. ..
Senegal 1,412 –0.8 46 47 41 50 31 33 9.4 8.4 .. 40
Sierra Leone 867 1.7 .. .. 26 38 16 37 .. 9.9 .. 35
Sudan 2,374 4.8 44 46 36 41 13 15 19.7 14.7 .. 35
Tanzania 1,269 4.8 52 54 40 53 17 37 13.1 6.6 35 ..
Togo 947 1.4 47 49 49 54 37 48 10.9 11.1 .. 39
Uganda 1,187 3.0 .. .. 42 51 18 31 6.0 7.3 43 44
Yemen 2,048 7.0 33 35 35 47 36 31 11.8 3.8 33 ..
Zambia 2,052 7.0 54 56 40 48 33 42 9.4 2.7 53 57
Sources: Penn World Tables 8.0 for real GDP, Yale Center for Enviromental Law and Policy for EPI, World Bank World Development Indicators for Gini, UNDP for HDI, WTO Secretariat for trade/GDP.
Notes: Real GDP per capita is measured as the ratio of expenditure-based GDP at chained purchasing power parity (PPP) and population, both taken from the Penn World Tables v. 8.0. The Environmental Performance Index (EPI) ranks countries’ performance on a variety of indicators covering both environmental public health and ecosystem vitality. The Human Development Index (HDI) is a synthetic measure of several quality-of-life indictors, including life expectancy, health, and educational attainment, but excluding income. Trade openness is measured as (exports + imports)/(2*GDP). These data are then averaged over three years to smooth out volatility. The trade-weighted average tariff is the average of effectively applied rates weighted by the product import shares corresponding to each partner country. Specific rates have been converted to ad valorem equivalents. Import weights are taken from the UN Comtrade database. The Gini coefficient measures the extent to which the distribution of incomes in a given country deviates from a hypothetical distribution where all incomes are equal. a Or nearest year.
Appendix Table B.2: Development indicators by level of development for selected economies, 2000–12a (continued)