Embed Size (px)
Citation preview

UNITED STATESSECURITIES AND EXCHANGE COMMISSION
Washington, D.C. 20549__________________________________________________
FORM 10-Q__________________________________________________
☒ QUARTERLY REPORT PURSUANT TO SECTION 13 OR 15(d) OF THE SECURITIES EXCHANGE ACT OF 1934.
For the quarterly period ended June 30, 2021
OR
☐ TRANSITION REPORT PURSUANT TO SECTION 13 OR 15(d) OF THE SECURITIES EXCHANGE ACT OF 1934.
For the transition period from to
Commission File Number: 001-35780__________________________________________________
BRIGHT HORIZONS FAMILY SOLUTIONS INC.(Exact name of registrant as specified in its charter)
__________________________________________________
Delaware 80-0188269(State or other jurisdiction
of incorporation)(I.R.S. Employer
Identification Number)
2 Wells AvenueNewton, Massachusetts 02459
(Address of principal executive offices) (Zip code)
Registrant’s telephone number, including area code: (617) 673-8000
Not Applicable(Former name, former address and former fiscal year, if changed since last report)
Securities registered pursuant to Section 12(b) of the Act:
Title of each class Trading Symbol(s) Name of each exchange on which registeredCommon Stock, $0.001 par value per share BFAM New York Stock Exchange
Indicate by check mark whether the registrant (1) has filed all reports required to be filed by Section 13 or 15(d) of the Securities Exchange Act of 1934during the preceding 12 months (or for such shorter period that the registrant was required to file such reports), and (2) has been subject to such filingrequirements for the past 90 days. Yes ☒ No ☐Indicate by check mark whether the registrant has submitted electronically every Interactive Data File required to be submitted pursuant to Rule 405 ofRegulation S-T (§232.405 of this chapter) during the preceding 12 months (or for such shorter period that the registrant was required to submit suchfiles). Yes ☒ No ☐Indicate by check mark whether the registrant is a large accelerated filer, an accelerated filer, a non-accelerated filer, a smaller reporting company, or anemerging growth company. See the definitions of “large accelerated filer,” “accelerated filer,” “smaller reporting company,” and “emerging growthcompany” in Rule 12b-2 of the Exchange Act.
Large accelerated filer ☒ Accelerated filer ☐
Non-accelerated filer ☐ Smaller reporting company ☐
Emerging growth company ☐
If an emerging growth company, indicate by check mark if the registrant has elected not to use the extended transition period for complying with any newor revised financial accounting standards provided pursuant to Section 13(a) of the Exchange Act. ☐Indicate by check mark whether the Registrant is a shell company (as defined in Rule 12b-2 of the Exchange Act). Yes ☐ No ☒
As of July 29, 2021, there were 60,560,617 shares of common stock outstanding.

Table of Contents
BRIGHT HORIZONS FAMILY SOLUTIONS INC.
FORM 10-Q
For the quarterly period ended June 30, 2021
TABLE OF CONTENTS
PART I. FINANCIAL INFORMATION PageItem 1. Condensed Consolidated Financial Statements (Unaudited) 3Item 2. Management’s Discussion and Analysis of Financial Condition and Results of Operations 24Item 3. Quantitative and Qualitative Disclosures About Market Risk 36Item 4. Controls and Procedures 37PART II. OTHER INFORMATIONItem 1. Legal Proceedings 38Item 1A. Risk Factors 38Item 2. Unregistered Sales of Equity Securities and Use of Proceeds 38Item 3. Defaults Upon Senior Securities 38Item 4. Mine Safety Disclosures 38Item 5. Other Information 38Item 6. Exhibits 39Signatures 40
2

Table of Contents
PART I. FINANCIAL INFORMATION
Item 1. Condensed Consolidated Financial Statements (Unaudited)
BRIGHT HORIZONS FAMILY SOLUTIONS INC.
CONDENSED CONSOLIDATED BALANCE SHEETS
(Unaudited)
June 30, 2021 December 31, 2020
(In thousands, except share data)ASSETSCurrent assets:
Cash and cash equivalents $ 418,638 $ 384,344 Accounts receivable — net of allowance for credit losses of $2,402 and $2,357 at June 30, 2021and December 31, 2020, respectively 141,253 176,617 Prepaid expenses and other current assets 74,743 62,902 Prepaid income taxes 19,830 322
Total current assets 654,464 624,185 Fixed assets — net 617,248 628,757 Goodwill 1,451,041 1,431,967 Other intangible assets — net 261,013 274,620 Operating lease right-of-use assets 703,107 717,821 Other assets 54,010 49,298
Total assets $ 3,740,883 $ 3,726,648 LIABILITIES AND STOCKHOLDERS’ EQUITYCurrent liabilities:
Current portion of long-term debt $ 10,750 $ 10,750 Accounts payable and accrued expenses 190,554 194,551 Current portion of operating lease liabilities 87,934 87,181 Deferred revenue 225,683 197,939 Other current liabilities 49,599 40,393
Total current liabilities 564,520 530,814 Long-term debt — net 1,015,433 1,020,137 Operating lease liabilities 712,399 729,754 Other long-term liabilities 117,822 105,980 Deferred revenue 10,421 10,215 Deferred income taxes 49,144 45,951
Total liabilities 2,469,739 2,442,851 Stockholders’ equity:
Preferred stock, $0.001 par value; 25,000,000 shares authorized; no shares issued or outstanding atJune 30, 2021 and December 31, 2020 — —
Common stock, $0.001 par value; 475,000,000 shares authorized; 60,278,756 and 60,466,168shares issued and outstanding at June 30, 2021 and December 31, 2020, respectively 60 60 Additional paid-in capital 868,289 910,304 Accumulated other comprehensive loss (23,654) (27,069)Retained earnings 426,449 400,502
Total stockholders’ equity 1,271,144 1,283,797 Total liabilities and stockholders’ equity $ 3,740,883 $ 3,726,648
See accompanying notes to condensed consolidated financial statements.
3

Table of Contents
BRIGHT HORIZONS FAMILY SOLUTIONS INC.
CONDENSED CONSOLIDATED STATEMENTS OF INCOME
(Unaudited)
Three months ended June 30, Six months ended June 30,2021 2020 2021 2020
(In thousands, except share data)Revenue $ 441,478 $ 293,772 $ 832,318 $ 800,095 Cost of services 335,496 228,536 644,978 626,000
Gross profit 105,982 65,236 187,340 174,095 Selling, general and administrative expenses 64,458 49,247 124,568 106,616 Amortization of intangible assets 7,512 7,875 15,052 16,084
Income from operations 34,012 8,114 47,720 51,395 Interest expense — net (9,580) (9,129) (18,596) (19,335)
Income (loss) before income tax 24,432 (1,015) 29,124 32,060 Income tax benefit (expense) (5,617) 1,374 (3,177) (969)
Net income $ 18,815 $ 359 $ 25,947 $ 31,091
Earnings per common share:Common stock — basic $ 0.31 $ 0.01 $ 0.43 $ 0.53 Common stock — diluted $ 0.31 $ 0.01 $ 0.42 $ 0.52
Weighted average common shares outstanding:Common stock — basic 60,551,528 59,631,428 60,573,237 58,781,169 Common stock — diluted 61,106,792 60,266,102 61,216,383 59,572,444
See accompanying notes to condensed consolidated financial statements.
4

Table of Contents
BRIGHT HORIZONS FAMILY SOLUTIONS INC.
CONDENSED CONSOLIDATED STATEMENTS OF COMPREHENSIVE INCOME (LOSS)
(Unaudited)
Three months ended June 30, Six months ended June 30,2021 2020 2021 2020
(In thousands)Net income $ 18,815 $ 359 $ 25,947 $ 31,091 Other comprehensive income (loss):
Foreign currency translation adjustments 1,213 1,557 699 (37,951)Unrealized gain (loss) on cash flow hedges andinvestments, net of tax 964 793 2,716 (3,477)
Total other comprehensive income (loss) 2,177 2,350 3,415 (41,428)Comprehensive income (loss) $ 20,992 $ 2,709 $ 29,362 $ (10,337)
See accompanying notes to condensed consolidated financial statements.
5

Table of Contents
BRIGHT HORIZONS FAMILY SOLUTIONS INC.
CONDENSED CONSOLIDATED STATEMENTS OF CHANGES IN STOCKHOLDERS' EQUITY
(Unaudited)
Three months ended June 30, 2021
Common Stock AdditionalPaid-inCapital
TreasuryStock,at Cost
Accumulated OtherComprehensiveIncome (Loss)
RetainedEarnings
TotalStockholders’
EquityShares Amount
(In thousands, except share data)Balance at April 1, 2021 60,726,701 $ 61 $ 928,761 $ — $ (25,831) $ 407,634 $ 1,310,625
Stock-based compensation expense 5,829 5,829 Issuance of common stock under theEquity Incentive Plan 75,169 — 5,341 5,341 Shares received in net share settlementof stock option exercises and vesting ofrestricted stock (8,114) — (1,297) (1,297)Purchase of treasury stock (70,346) (70,346)Retirement of treasury stock (515,000) (1) (70,345) 70,346 — Other comprehensive income 2,177 2,177 Net income 18,815 18,815
Balance at June 30, 2021 60,278,756 $ 60 $ 868,289 $ — $ (23,654) $ 426,449 $ 1,271,144
Three months ended June 30, 2020
Common Stock AdditionalPaid-inCapital
TreasuryStock,at Cost
Accumulated OtherComprehensiveIncome (Loss)
RetainedEarnings
TotalStockholders’
EquityShares Amount
(In thousands, except share data)Balance at April 1, 2020 57,920,154 $ 58 $ 627,337 $ — $ (94,109) $ 404,242 $ 937,528
Issuance of common stock 2,138,580 2 249,788 249,790 Stock-based compensation expense 5,155 5,155 Issuance of common stock under theEquity Incentive Plan 117,276 — 5,577 5,577 Shares received in net share settlementof stock option exercises and vesting ofrestricted stock (23,823) — (2,484) (2,484)Other comprehensive income 2,350 2,350 Net income 359 359
Balance at June 30, 2020 60,152,187 $ 60 $ 885,373 $ — $ (91,759) $ 404,601 $ 1,198,275
See accompanying notes to condensed consolidated financial statements.
6

Table of Contents
BRIGHT HORIZONS FAMILY SOLUTIONS INC.
CONDENSED CONSOLIDATED STATEMENTS OF CHANGES IN STOCKHOLDERS' EQUITY
(Unaudited)
Six months ended June 30, 2021
Common Stock AdditionalPaid-inCapital
TreasuryStock,at Cost
Accumulated OtherComprehensiveIncome (Loss)
RetainedEarnings
TotalStockholders’
EquityShares Amount
(In thousands, except share data)Balance at January 1, 2021 60,466,168 $ 60 $ 910,304 $ — $ (27,069) $ 400,502 $ 1,283,797
Stock-based compensation expense 11,135 11,135 Issuance of common stock under theEquity Incentive Plan 371,561 1 24,337 24,338 Shares received in net share settlementof stock option exercises and vestingof restricted stock (43,973) — (7,142) (7,142)Purchase of treasury stock (70,346) (70,346)Retirement of treasury stock (515,000) (1) (70,345) 70,346 — Other comprehensive income 3,415 3,415 Net income 25,947 25,947
Balance at June 30, 2021 60,278,756 $ 60 $ 868,289 $ — $ (23,654) $ 426,449 $ 1,271,144
Six months ended June 30, 2020
Common Stock AdditionalPaid-inCapital
TreasuryStock,at Cost
Accumulated OtherComprehensiveIncome (Loss)
RetainedEarnings
TotalStockholders’
EquityShares Amount
(In thousands, except share data)Balance at January 1, 2020 57,884,020 $ 58 $ 648,031 $ — $ (50,331) $ 373,510 $ 971,268
Issuance of common stock 2,138,580 2 249,788 249,790 Stock-based compensation expense 9,438 9,438 Issuance of common stock under theEquity Incentive Plan 416,152 1 18,038 18,039 Shares received in net share settlementof stock option exercises and vestingof restricted stock (55,252) — (7,715) (7,715)Purchase of treasury stock (32,208) (32,208)Retirement of treasury stock (231,313) (1) (32,207) 32,208 — Other comprehensive loss (41,428) (41,428)Net income 31,091 31,091
Balance at June 30, 2020 60,152,187 $ 60 $ 885,373 $ — $ (91,759) $ 404,601 $ 1,198,275
See accompanying notes to condensed consolidated financial statements.
7

Table of Contents
BRIGHT HORIZONS FAMILY SOLUTIONS INC.
CONDENSED CONSOLIDATED STATEMENTS OF CASH FLOWS
(Unaudited)
Six months ended June 30,2021 2020
(In thousands)CASH FLOWS FROM OPERATING ACTIVITIES:Net income $ 25,947 $ 31,091 Adjustments to reconcile net income to net cash provided by operating activities:
Depreciation and amortization 55,392 55,880 Impairment losses on long-lived assets — 16,857 Impairment losses on equity investment — 2,128 Stock-based compensation expense 11,135 9,438 Deferred income taxes 2,238 (2,783)Other non-cash adjustments — net 513 (1,187)Changes in assets and liabilities:
Accounts receivable 35,338 (73,449)Prepaid expenses and other current assets (10,612) (33,156)Accounts payable and accrued expenses (1,818) (19,824)Income taxes (19,908) 327 Deferred revenue 28,117 3,399 Leases (2,143) 30,003 Other assets 3,101 3,404 Other current and long-term liabilities 8,425 29,132
Net cash provided by operating activities 135,725 51,260
CASH FLOWS FROM INVESTING ACTIVITIES:Purchases of fixed assets (33,953) (32,374)Proceeds from the disposal of fixed assets 5,490 7,352 Proceeds from the maturity of debt securities and sale of other investments 10,500 7,247 Purchases of debt securities and other investments (10,611) (6,106)Payments and settlements for acquisitions — net of cash acquired (9,082) (4,394)
Net cash used in investing activities (37,656) (28,275)
CASH FLOWS FROM FINANCING ACTIVITIES:Proceeds from stock issuance — net of issuance costs — 249,937 Borrowings under revolving credit facility — 43,200 Payments under revolving credit facility — (43,200)Principal payments of long-term debt (5,375) (5,375)Payments of debt issuance costs (2,057) (2,818)Purchase of treasury stock (70,346) (32,658)Proceeds from issuance of common stock upon exercise of options and restricted stock upon purchase 28,180 21,187 Taxes paid related to the net share settlement of stock options and restricted stock (7,142) (7,715)Payments of contingent consideration for acquisitions — (1,088)
Net cash provided by (used in) financing activities (56,740) 221,470 Effect of exchange rates on cash, cash equivalents and restricted cash (675) (908)
Net increase in cash, cash equivalents and restricted cash 40,654 243,547 Cash, cash equivalents and restricted cash — beginning of period 388,465 31,192 Cash, cash equivalents and restricted cash — end of period $ 429,119 $ 274,739
See accompanying notes to condensed consolidated financial statements.
8

Table of Contents
BRIGHT HORIZONS FAMILY SOLUTIONS INC.
CONDENSED CONSOLIDATED STATEMENTS OF CASH FLOWS (CONTINUED)
(Unaudited)
Six months ended June 30,2021 2020
(In thousands)RECONCILIATION OF CASH, CASH EQUIVALENTS AND RESTRICTED CASH TO THECONSOLIDATED BALANCE SHEETS:Cash and cash equivalents $ 418,638 $ 270,442 Restricted cash and cash equivalents, included in prepaid expenses and other current assets 10,481 4,297
Total cash, cash equivalents and restricted cash — end of period $ 429,119 $ 274,739
SUPPLEMENTAL CASH FLOW INFORMATION:Cash payments of interest $ 16,815 $ 18,117 Cash payments of income taxes $ 21,200 $ 6,709 Cash paid for amounts included in the measurement of lease liabilities $ 72,496 $ 51,397
NON-CASH TRANSACTIONS:Fixed asset purchases recorded in accounts payable and accrued expenses $ 2,849 $ 3,311 Contingent consideration issued for acquisitions $ 7,337 $ — Operating right-of-use assets obtained in exchange for operating lease liabilities — net $ 28,147 $ 71,677 Restricted stock reclassified from other current liabilities to equity upon vesting $ 4,178 $ 4,424
See accompanying notes to condensed consolidated financial statements.
9

Table of Contents
BRIGHT HORIZONS FAMILY SOLUTIONS INC.
NOTES TO CONDENSED CONSOLIDATED FINANCIAL STATEMENTS
(Unaudited)
1. ORGANIZATION AND BASIS OF PRESENTATION
Organization — Bright Horizons Family Solutions Inc. (“Bright Horizons” or the “Company”) provides center-based early education and child care, back-up child and adult/elder care, tuition assistance and student loan repayment program administration, educational advisory services, and other supportservices for employers and families in the United States, the United Kingdom, the Netherlands, Puerto Rico and India. The Company provides servicesdesigned to help families, employers and their employees better integrate work and family life, primarily under multi-year contracts with employers whooffer early education and child care, family care solutions, and workforce education services, as part of their employee benefits packages in an effort tosupport employees across life and career stages and improve employee engagement.
Basis of Presentation — The accompanying unaudited condensed consolidated balance sheet as of June 30, 2021 and the condensed consolidatedstatements of income, comprehensive income (loss), changes in stockholders’ equity, and cash flows for the interim periods ended June 30, 2021 and 2020have been prepared in accordance with accounting principles generally accepted in the United States of America (“U.S. GAAP” or “GAAP”) for interimfinancial information and pursuant to the rules and regulations of the Securities and Exchange Commission (“SEC”). Accordingly, they do not include allof the information and footnotes required in accordance with U.S. GAAP for complete financial statements and should be read in conjunction with theaudited financial statements included in the Company’s Annual Report on Form 10-K for the year ended December 31, 2020. The consolidated financialstatements include the accounts of the Company and its subsidiaries. Intercompany balances and transactions have been eliminated in consolidation.Certain reclassifications have been made to prior period amounts within the condensed consolidated balance sheet and supplemental statement of cashflows information to conform to the current period presentation.
In the opinion of the Company’s management, the Company’s unaudited condensed consolidated balance sheet as of June 30, 2021 and the condensedconsolidated statements of income, comprehensive income (loss), changes in stockholders’ equity, and cash flows for the interim periods ended June 30,2021 and 2020, reflect all adjustments (consisting only of normal and recurring adjustments) necessary to present fairly the results of the interim periodspresented. The operating results for the interim periods presented are not necessarily indicative of the results expected for the full year.
Stockholders’ Equity — The board of directors of the Company authorized a share repurchase program of up to $300 million of the Company’soutstanding common stock, effective June 12, 2018. The share repurchase program has no expiration date. The shares may be repurchased from time totime in open market transactions at prevailing market prices, in privately negotiated transactions, under Rule 10b5-1 plans, or by other means in accordancewith federal securities laws. During the three months ended June 30, 2021, 0.5 million shares were repurchased for $70.3 million under this authorization,and at June 30, 2021, $124.5 million remained available under the repurchase program.
On April 21, 2020, the Company completed the issuance and sale of 2,138,580 shares of common stock, par value $0.001 per share, to Durable CapitalMaster Fund LP at a price of $116.90 per share. The Company subsequently filed a registration statement to register the resale of these shares in accordancewith the terms of the purchase agreement. The Company received net proceeds from the offering of $249.8 million.
COVID-19 Pandemic — Since March 2020, the Company's global operations have been significantly impacted by the COVID-19 pandemic. As ofJune 30, 2021, the Company operated 1,006 early education and child care centers, of which approximately 920 early education and child care centers wereopen. The Company remains focused on the re-enrollment of its centers and the phased re-opening of the limited number of centers that remain temporarilyclosed, which the Company expects will continue throughout 2021. The broad and long-term effects of COVID-19, its duration and the scope of ongoingand related disruptions, cannot be predicted. Given these factors, the Company currently expects the effects of COVID-19 to continue to adversely impactthe results of its operations for the remainder of 2021.
10

Table of Contents
Government Support — The Coronavirus Aid, Relief, and Economic Security Act (“CARES Act”) and the Consolidated Appropriations Act, 2021(“CAA”) were enacted in the United States on March 27, 2020 and January 1, 2021, respectively; both are economic aid packages to help mitigate theimpact of the pandemic. Additionally, other foreign governmental legislation that provided relief provisions was enacted in response to the economicimpact of COVID-19. The Company has participated in certain government support programs, including availing itself of certain tax deferrals and taxcredits allowed pursuant to the CARES Act in the United States, as well as certain tax deferrals, tax credits, and employee wage support in the UnitedKingdom. On December 27, 2020, the employee retention tax credit, originally enacted under the CARES Act in the United States, was expanded andextended under the CAA to wages paid through the first two quarters of 2021, among other changes. Governmental support received is recorded on theconsolidated statement of income as a reduction to the related expenses that the assistance is intended to defray. During the six months ended June 30, 2021and 2020, $17.0 million and $39.6 million, respectively, was recorded as a reduction to cost of services in relation to these benefits. As of June 30, 2021and December 31, 2020, $10.9 million and $8.4 million, respectively, was recorded in prepaid expenses and other current assets on the consolidatedbalance sheet for amounts due from government support programs. Additionally, the Company had payroll tax deferrals totaling $20.4 million as ofJune 30, 2021 and December 31, 2020, of which $10.2 million was recorded in accounts payable and accrued expenses and $10.2 million was included inother long-term liabilities.
Recently Adopted Pronouncement — In December 2019, the Financial Accounting Standards Board (“FASB”) issued ASU 2019-12, Income Taxes(Topic 740): Simplifying the Accounting for Income Taxes. The standard removes certain exceptions to the general principles in Topic 740 and improves theconsistent application of U.S. GAAP by clarifying and amending certain areas of the existing guidance. The Company adopted the new guidance onJanuary 1, 2021. The adoption of this standard did not have a material impact on the Company’s consolidated financial statements and related disclosures.
2. REVENUE RECOGNITION
Disaggregation of RevenueThe Company disaggregates revenue from contracts with customers into segments and geographical regions. Revenue disaggregated by segment andgeographical region was as follows:
Full servicecenter-based
child care Back-up care
Educationaladvisory andother services Total
(In thousands)Three months ended June 30, 2021North America $ 216,327 $ 76,660 $ 25,567 $ 318,554 Europe 118,100 4,824 — 122,924
$ 334,427 $ 81,484 $ 25,567 $ 441,478 Three months ended June 30, 2020North America $ 92,572 $ 133,106 $ 20,562 $ 246,240 Europe 44,734 2,798 — 47,532
$ 137,306 $ 135,904 $ 20,562 $ 293,772
Full servicecenter-based
child care Back-up care
Educationaladvisory andother services Total
(In thousands)Six months ended June 30, 2021North America $ 408,781 $ 147,842 $ 49,733 $ 606,356 Europe 215,965 9,997 — 225,962
$ 624,746 $ 157,839 $ 49,733 $ 832,318 Six months ended June 30, 2020North America $ 390,639 $ 203,663 $ 41,327 $ 635,629 Europe 158,058 6,408 — 164,466
$ 548,697 $ 210,071 $ 41,327 $ 800,095
11

Table of Contents
The classification “North America” is comprised of the Company’s United States, Puerto Rico, and Canada operations and the classification “Europe”includes the United Kingdom, Netherlands, and India operations. During the third quarter of fiscal 2020, the Company divested its child care centerbusiness in Canada and ceased to operate its two centers in that geography.
Deferred RevenueThe Company records deferred revenue when payments are received in advance of the Company’s performance under the contract, which is recognized asrevenue as the performance obligation is satisfied. During the six months ended June 30, 2021, $146.7 million was recognized as revenue related to thedeferred revenue balance recorded at December 31, 2020. During the six months ended June 30, 2020, $151.4 million was recognized as revenue related tothe deferred revenue balance recorded at December 31, 2019.
Remaining Performance ObligationsThe Company does not disclose the value of unsatisfied performance obligations for contracts with an original contract term of one year or less, or forvariable consideration allocated to the unsatisfied performance obligation of a series of services. The transaction price allocated to the remainingperformance obligations relates to services that are paid or invoiced in advance. The Company’s remaining performance obligations not subject to thepractical expedients were not material.
3. LEASES
The Company has operating leases for certain of its full service and back-up early education and child care centers, corporate offices, call centers, and to alesser extent, various office equipment, in the United States, the United Kingdom, and the Netherlands. Most of the leases expire within 10 to 15 years andmany contain renewal options and/or termination provisions. The Company does not have any finance leases as of June 30, 2021.
Lease ExpenseThe components of lease expense were as follows:
Three months ended June 30, Six months ended June 30,2021 2020 2021 2020
(In thousands)Operating lease expense $ 33,652 $ 38,667 $ 67,277 $ 72,528 Variable lease expense 6,735 6,120 13,677 15,353
Total lease expense $ 40,387 $ 44,787 $ 80,954 $ 87,881
(1) Excludes short-term lease expense and sublease income, which were immaterial for the periods presented.
Operating lease expense for the three and six months ended June 30, 2020 includes an impairment loss on operating lease right-of-use assets of $5.2million. Refer to Note 9, Fair Value Measurements, for additional information.
Other InformationThe weighted average remaining lease term and the weighted average discount rate were as follows:
June 30, 2021 December 31, 2020
Weighted average remaining lease term (in years) 10 10Weighted average discount rate 5.9% 6.0%
(1)
(1)
12

Table of Contents
Maturity of Lease LiabilitiesThe following table summarizes the maturity of lease liabilities as of June 30, 2021:
Operating Leases
(In thousands)Remainder of 2021 $ 55,582 2022 133,656 2023 125,251 2024 114,428 2025 99,967 Thereafter 540,141
Total lease payments 1,069,025 Less imputed interest (268,692)
Present value of lease liabilities 800,333 Less current portion of operating lease liabilities (87,934)
Long-term operating lease liabilities $ 712,399
As of June 30, 2021, the Company had entered into additional operating leases that have not yet commenced with total fixed payment obligations of $21.8million. The leases are expected to commence between the third quarter of fiscal 2021 and the fourth quarter of fiscal 2022 and have initial lease terms ofapproximately 10 to 15 years.
Lease ModificationsAs of June 30, 2021, the Company had deferred lease payments of $2.0 million. The majority of these lease payments are payable over the next year. As ofDecember 31, 2020, the Company had deferred lease payments of $7.7 million.
4. ACQUISITIONS
The Company’s growth strategy includes expansion through strategic and synergistic acquisitions. The goodwill resulting from these acquisitions ariseslargely from synergies expected from combining the operations of the businesses acquired with the Company's existing operations, including costefficiencies and leveraging existing client relationships, as well as from benefits derived from gaining the related assembled workforce.
2021 AcquisitionsDuring the six months ended June 30, 2021, the Company acquired two centers as well as a camp and back-up care provider in the United States, in twoseparate business acquisitions, which were each accounted for as a business combination. These businesses were acquired for aggregate cash considerationof $8.6 million, net of cash acquired of $0.3 million, and consideration payable of $0.4 million. Additionally, the Company is subject to contingentconsideration payments for these two acquisitions, and recorded a preliminary fair value estimate of $7.3 million in relation to these contingentconsideration arrangements at acquisition. Contingent consideration of up to $1.2 million may be payable within one year if certain performance targets aremet for one of the acquisitions, and contingent consideration is payable in 2026 based on certain financial metrics for the other acquisition. The Companyrecorded goodwill of $14.5 million related to the back-up care segment and of $3.4 million related to the full service center-based child care segment, all ofwhich will be deductible for tax purposes. In addition, the Company recorded intangible assets of $1.3 million that will be amortized over five years, aswell as fixed assets of $1.5 million in relation to these acquisitions.
The determination and allocation of purchase price consideration is based on preliminary estimates of fair value; such estimates and assumptions aresubject to change within the measurement period (up to one year from the acquisition date). As of June 30, 2021, the purchase price allocations for theseacquisitions remain open as the Company gathers additional information regarding the assets acquired and the liabilities assumed, and finalizes itsdetermination of the estimated fair value of the contingent consideration at the date of acquisition. The operating results for the acquired businesses areincluded in the consolidated results of operations from the date of acquisition, and were not material to the Company’s financial results.
13
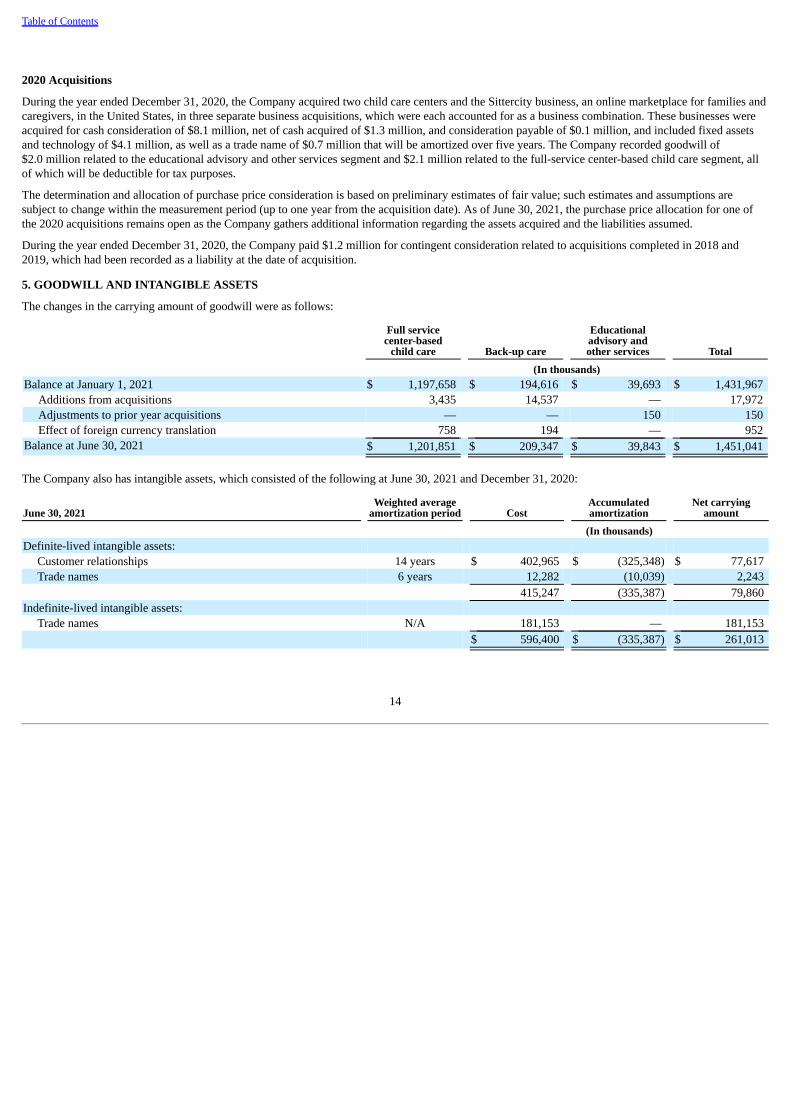
Table of Contents
2020 Acquisitions
During the year ended December 31, 2020, the Company acquired two child care centers and the Sittercity business, an online marketplace for families andcaregivers, in the United States, in three separate business acquisitions, which were each accounted for as a business combination. These businesses wereacquired for cash consideration of $8.1 million, net of cash acquired of $1.3 million, and consideration payable of $0.1 million, and included fixed assetsand technology of $4.1 million, as well as a trade name of $0.7 million that will be amortized over five years. The Company recorded goodwill of$2.0 million related to the educational advisory and other services segment and $2.1 million related to the full-service center-based child care segment, allof which will be deductible for tax purposes.
The determination and allocation of purchase price consideration is based on preliminary estimates of fair value; such estimates and assumptions aresubject to change within the measurement period (up to one year from the acquisition date). As of June 30, 2021, the purchase price allocation for one ofthe 2020 acquisitions remains open as the Company gathers additional information regarding the assets acquired and the liabilities assumed.
During the year ended December 31, 2020, the Company paid $1.2 million for contingent consideration related to acquisitions completed in 2018 and2019, which had been recorded as a liability at the date of acquisition.
5. GOODWILL AND INTANGIBLE ASSETS
The changes in the carrying amount of goodwill were as follows:
Full servicecenter-based
child care Back-up care
Educationaladvisory andother services Total
(In thousands)Balance at January 1, 2021 $ 1,197,658 $ 194,616 $ 39,693 $ 1,431,967
Additions from acquisitions 3,435 14,537 — 17,972 Adjustments to prior year acquisitions — — 150 150 Effect of foreign currency translation 758 194 — 952
Balance at June 30, 2021 $ 1,201,851 $ 209,347 $ 39,843 $ 1,451,041
The Company also has intangible assets, which consisted of the following at June 30, 2021 and December 31, 2020:
June 30, 2021Weighted average
amortization period CostAccumulatedamortization
Net carryingamount
(In thousands)Definite-lived intangible assets:
Customer relationships 14 years $ 402,965 $ (325,348) $ 77,617 Trade names 6 years 12,282 (10,039) 2,243
415,247 (335,387) 79,860 Indefinite-lived intangible assets:
Trade names N/A 181,153 — 181,153 $ 596,400 $ (335,387) $ 261,013
14

Table of Contents
December 31, 2020Weighted average
amortization period CostAccumulatedamortization
Net carryingamount
(In thousands)Definite-lived intangible assets:
Customer relationships 14 years $ 402,319 $ (310,587) $ 91,732 Trade names 6 years 11,219 (9,633) 1,586
413,538 (320,220) 93,318 Indefinite-lived intangible assets:
Trade names N/A 181,302 — 181,302 $ 594,840 $ (320,220) $ 274,620
6. CREDIT ARRANGEMENTS AND DEBT OBLIGATIONS
Senior Secured Credit FacilitiesThe Company’s senior secured credit facilities consist of a secured term loan facility (“term loan facility”) and a $400 million multi-currency revolvingcredit facility (“revolving credit facility”). The term loan matures on November 7, 2023 and requires quarterly principal payments of $2.7 million, with theremaining principal balance due on November 7, 2023.
Outstanding term loan borrowings were as follows:June 30, 2021 December 31, 2020
(In thousands)Term loan $ 1,029,313 $ 1,034,688 Deferred financing costs and original issue discount (3,130) (3,801)
Total debt 1,026,183 1,030,887 Less current maturities (10,750) (10,750)
Long-term debt $ 1,015,433 $ 1,020,137
On May 26, 2021, the Company amended its existing senior credit facilities to, among other changes, extend the revolving credit facility maturity date fromJuly 31, 2022 to May 26, 2026 (subject to a springing maturity to August 8, 2023 if more than $25 million of the term loans have not been repaid,refinanced or extended), and reduce the interest rates applicable to borrowings outstanding on the revolving credit facility. In conjunction with this creditamendment, the Company incurred $2.1 million in fees that have been capitalized in other assets on the consolidated balance sheet and are amortized overthe contractual life of the revolving credit facility. There were no borrowings outstanding on the revolving credit facility at June 30, 2021 andDecember 31, 2020.
In April and May 2020, the Company amended its existing senior credit facilities to, among other things, increase the borrowing capacity of the revolvingcredit facility from $225 million to $400 million, modify the interest rates applicable to borrowings outstanding on the revolving credit facility, and modifythe terms of the applicable covenants. In conjunction with these credit amendments, the Company incurred $2.8 million in fees that have been capitalized inother assets on the consolidated balance sheet and were being amortized over the contractual life of the revolving credit facility prior to the May 26, 2021amendment.
All borrowings under the credit agreement are subject to variable interest. The effective interest rate for the term loan was 2.50% at June 30, 2021 andDecember 31, 2020, and the weighted average interest rate was 2.50% and 3.00% for the six months ended June 30, 2021 and 2020, respectively, prior tothe effects of any interest rate hedge arrangements. Effective as of May 26, 2021, borrowings under the revolving credit facility bear interest at a rate perannum ranging from 0.50% to 0.75% over the base rate, or 1.50% to 1.75% over the eurocurrency rate. The weighted average interest rate for the revolvingcredit facility was 4.00% and 4.49% for the six months ended June 30, 2021 and 2020, respectively.
15

Table of Contents
All obligations under the senior secured credit facilities are secured by substantially all the assets of the Company’s U.S. subsidiaries. The senior securedcredit facilities contain a number of covenants that, among other things and subject to certain exceptions, may restrict the ability of Bright Horizons FamilySolutions LLC, the Company’s wholly-owned subsidiary, and its restricted subsidiaries, to: incur certain liens; make investments, loans, advances andacquisitions; incur additional indebtedness or guarantees; pay dividends on capital stock or redeem, repurchase or retire capital stock or subordinatedindebtedness; engage in transactions with affiliates; sell assets, including capital stock of the Company’s subsidiaries; alter the business conducted; enterinto agreements restricting the Company’s subsidiaries’ ability to pay dividends; and consolidate or merge.
In addition, the credit agreement governing the senior secured credit facilities requires Bright Horizons Capital Corp., the Company’s direct subsidiary, tobe a passive holding company, subject to certain exceptions. The revolving credit facility requires Bright Horizons Family Solutions LLC, the borrower,and its restricted subsidiaries, to comply with a maximum first lien net leverage ratio of 4.25 to 1.00 beginning June 30, 2021. A breach of the applicablecovenant is subject to certain equity cure rights.
Future principal payments of long-term debt are as follows for the years ending December 31:Term Loan
(In thousands)Remainder of 2021 $ 5,375 2022 10,750 2023 1,013,188
Total future principal payments $ 1,029,313
Derivative Financial InstrumentsThe Company is subject to interest rate risk as all borrowings under the senior secured credit facilities are subject to variable interest rates. In October2017, the Company entered into variable-to-fixed interest rate swap agreements to mitigate the exposure to variable interest arrangements on $500 millionnotional amount of the outstanding term loan borrowings. These swap agreements, designated and accounted for as cash flow hedges from inception, arescheduled to mature on October 31, 2021. The Company is required to make monthly payments on the notional amount at a fixed average interest rate, plusthe applicable rate for eurocurrency loans. Effective as of May 31, 2018, the notional amount is subject to a total interest rate of approximately 3.65%. Inexchange, the Company receives interest on the notional amount at a variable rate based on the one-month LIBOR rate, subject to a 0.75% floor.
In June 2020, the Company entered into interest rate cap agreements with a total notional value of $800 million, designated and accounted for as cash flowhedges from inception, to provide the Company with interest rate protection in the event the one-month LIBOR rate increases above 1%. Interest rate capagreements for $300 million notional value have an effective date of June 30, 2020 and expire on October 31, 2023, while interest rate cap agreements foranother $500 million notional amount have a forward starting effective date of October 29, 2021, which coincides with the maturity of the interest rateswap agreements, and expire on October 31, 2023.
The interest rate swaps and interest rate caps are recorded on the Company’s consolidated balance sheet at fair value and classified based on theinstruments’ maturity dates. The Company records gains and losses resulting from changes in the fair value of the interest rate swaps and interest rate capsto accumulated other comprehensive income or loss. These gains and losses are subsequently reclassified into earnings and recognized to interest expensein the Company’s consolidated statement of income in the period that the hedged interest expense on the term loan facility is recognized. The premium paidfor the interest rate cap was recorded as an asset and will be allocated to each of the individual hedged interest payments on the basis of their relative fairvalues. The change in each respective allocated fair value amount will be reclassified out of accumulated other comprehensive income when each of thehedged forecasted transactions impacts earnings and recognized to interest expense in the Company's consolidated statement of income.
The fair value of the derivative financial instruments was as follows for the periods presented:
Derivative financial instrumentsConsolidated balance sheet
classification June 30, 2021 December 31, 2020
(In thousands)Interest rate swaps - liability Other current liabilities $ 1,911 $ 4,775 Interest rate caps - asset Other assets $ 1,141 $ 277
16

Table of Contents
The effect of the derivative financial instruments on other comprehensive income (loss) was as follows:
Derivatives designated as cashflow hedging instruments
Amount of gain (loss)recognized in other
comprehensive income(loss)
Consolidated statement ofincome classification
Amount of net gain (loss)reclassified into earnings
Total effect on othercomprehensive income
(loss)
(In thousands) (In thousands)Three months ended June 30, 2021Cash flow hedges $ (138) Interest expense — net $ (1,471) $ 1,333 Income tax effect 37 Income tax expense 393 (356)
Net of income taxes $ (101) $ (1,078) $ 977
Three months ended June 30, 2020Cash flow hedges $ (219) Interest expense — net $ (1,356) $ 1,137 Income tax effect 59 Income tax expense 365 (306)
Net of income taxes $ (160) $ (991) $ 831
Derivatives designated as cashflow hedging instruments
Amount of gain (loss)recognized in other
comprehensive income(loss)
Consolidated statement ofincome classification
Amount of net gain (loss)reclassified into earnings
Total effect on othercomprehensive income
(loss)
(In thousands) (In thousands)Six months ended June 30, 2021Cash flow hedges $ 840 Interest expense — net $ (2,921) $ 3,761 Income tax effect (224) Income tax expense 780 (1,004)
Net of income taxes $ 616 $ (2,141) $ 2,757
Six months ended June 30, 2020Cash flow hedges $ (6,521) Interest expense — net $ (1,641) $ (4,880)Income tax effect 1,754 Income tax expense 442 1,312
Net of income taxes $ (4,767) $ (1,199) $ (3,568)
During the next twelve months, the Company estimates that a net loss of $2.2 million, pre-tax, will be reclassified from accumulated other comprehensiveincome (loss) and recorded to interest expense related to these derivative financial instruments.
17

Table of Contents
7. EARNINGS PER SHARE
The following tables set forth the computation of basic and diluted earnings per share using the two-class method:Three months ended June 30, Six months ended June 30,2021 2020 2021 2020
(In thousands, except share data)Basic earnings per share:Net income $ 18,815 $ 359 $ 25,947 $ 31,091 Allocation of net income to common stockholders:Common stock $ 18,733 $ 358 $ 25,838 $ 30,945 Unvested participating shares 82 1 109 146
Net income $ 18,815 $ 359 $ 25,947 $ 31,091
Weighted average common shares outstanding:Common stock 60,551,528 59,631,428 60,573,237 58,781,169 Unvested participating shares 263,957 250,427 249,571 262,614 Earnings per common share:Common stock $ 0.31 $ 0.01 $ 0.43 $ 0.53
Three months ended June 30, Six months ended June 30,2021 2020 2021 2020
(In thousands, except share data)Diluted earnings per share:Earnings allocated to common stock $ 18,733 $ 358 $ 25,838 $ 30,945 Plus: earnings allocated to unvested participating shares 82 1 109 146 Less: adjusted earnings allocated to unvested participatingshares (81) (1) (108) (144)
Earnings allocated to common stock $ 18,734 $ 358 $ 25,839 $ 30,947
Weighted average common shares outstanding:Common stock 60,551,528 59,631,428 60,573,237 58,781,169 Effect of dilutive securities 555,264 634,674 643,146 791,275
Weighted average common shares outstanding —diluted 61,106,792 60,266,102 61,216,383 59,572,444
Earnings per common share:Common stock $ 0.31 $ 0.01 $ 0.42 $ 0.52
Options outstanding to purchase 1.0 million and 1.2 million shares of common stock were excluded from diluted earnings per share for the three monthsended June 30, 2021 and 2020, respectively, and 0.9 million and 0.8 million shares of common stock were excluded for the six months ended June 30, 2021and 2020, respectively, since their effect was anti-dilutive. These options may become dilutive in the future.
18

Table of Contents
8. INCOME TAXES
The Company’s effective income tax rates were 23.0% and (135.4)% for the three months ended June 30, 2021 and 2020, respectively, and 10.9% and 3.0%for the six months ended June 30, 2021 and 2020, respectively. The effective income tax rate may fluctuate from quarter to quarter for various reasons,including changes to income (loss) before income tax, jurisdictional mix of income (loss) before income tax, valuation allowances, jurisdictional incometax rate changes, as well as discrete items such as the settlement of foreign, federal and state tax issues and the effects of excess tax benefits associated withthe exercise of stock options and vesting of restricted stock, which is included as a reduction of tax expense. During the three and six months ended June30, 2021, the excess tax benefit from stock-based compensation expense decreased tax expense by $1.2 million and $5.1 million, respectively. During thethree and six months ended June 30, 2020, the excess tax benefit from stock-based compensation expense decreased tax expense by $1.7 million and $8.6million, respectively. For the three and six months ended June 30, 2021, prior to the inclusion of the excess tax benefit and other discrete items, theeffective income tax rate approximated 28%. For the three and six months ended June 30, 2020, prior to the inclusion of the excess tax benefit and otherdiscrete items, the effective income tax rate approximated 29%.
The Company’s unrecognized tax benefits were $3.8 million at June 30, 2021 and $4.0 million at December 31, 2020, inclusive of interest. The Companysettled an open tax matter during the quarter resulting in a decrease in the unrecognized tax benefits of $0.4 million. The Company expects theunrecognized tax benefits to change over the next twelve months if certain tax matters settle with the applicable taxing jurisdiction during this time frame,or, if the applicable statute of limitations lapses. The impact of the amount of such changes to previously recorded uncertain tax positions could range fromzero to $2.4 million.
The Company and its domestic subsidiaries are subject to audit for U.S. federal income tax as well as multiple state jurisdictions. U.S. federal income taxreturns are typically subject to examination by the Internal Revenue Service (“IRS”) and the statute of limitations for federal tax returns is three years. TheCompany’s filings for the tax years 2017 through 2020 are subject to audit based upon the federal statute of limitations.
State income tax returns are generally subject to examination for a period of three to four years after filing of the respective return. The state impact of anyfederal changes remains subject to examination by various states for a period of up to one year after formal notification to the states. As of June 30, 2021,there were two income tax audits in process and the tax years from 2016 to 2020 are subject to audit.
The Company is also subject to corporate income tax at its subsidiaries located in the United Kingdom, the Netherlands, India, Ireland, and Puerto Rico.The tax returns for the Company’s subsidiaries located in foreign jurisdictions are subject to examination for periods ranging from one to five years.
9. FAIR VALUE MEASUREMENTS
Fair value is defined as the price that would be received to sell an asset or paid to transfer a liability in an orderly transaction between market participants atthe measurement date. Fair value measurements are classified using a three-level hierarchy, which prioritizes the inputs used to measure fair value intothree levels and bases the categorization within the hierarchy upon the lowest level of input that is available and significant to the fair value measurement.The hierarchy gives the highest priority to observable inputs such as unadjusted quoted prices in active markets for identical assets or liabilities and thelowest priority to unobservable inputs. The Company uses observable inputs where relevant and whenever possible. The three levels of the hierarchy aredefined as follows: Level 1 — Fair value is derived using quoted prices from active markets for identical instruments. Level 2 — Fair value is derived using quoted prices for similar instruments from active markets or for identical or similar instruments in markets that arenot active; or, fair value is based on model-derived valuations in which all significant inputs and significant value drivers are observable from activemarkets. Level 3 — Fair value is derived from valuation techniques in which one or more significant inputs or significant value drivers are unobservable.
The carrying value of cash and cash equivalents, restricted cash, accounts receivable, and accounts payable and accrued expenses approximates their fairvalue because of their short-term nature.
Financial instruments that potentially expose the Company to concentrations of credit risk consisted mainly of cash and accounts receivable. The Companymitigates its exposure by maintaining its cash in financial institutions of high credit standing. The Company’s accounts receivable is derived primarily fromthe services it provides, and the related credit risk is dispersed across many clients in various industries with no single client accounting for more than 10%of the Company's net revenue or accounts receivable. No significant credit concentration risk existed at June 30, 2021.
19

Table of Contents
Long-term Debt — The Company’s long-term debt is recorded at adjusted cost, net of original issue discounts and deferred financing costs. The fair valueof the Company’s long-term debt is based on current bid prices, which approximates carrying value. As such, the Company’s long-term debt was classifiedas Level 1. As of June 30, 2021, the carrying value and estimated fair value of long-term debt were both $1.03 billion. As of December 31, 2020, thecarrying value and estimated fair value of long-term debt were $1.03 billion and $1.02 billion, respectively.
Derivative Financial Instruments — The Company’s interest rate swap agreements and interest rate cap agreements are recorded at fair value, whichwere estimated using market-standard valuation models. Such models project future cash flows and discount the future amounts to a present value usingmarket-based observable inputs. Additionally, the fair value of the interest rate swaps and interest rate caps included consideration of credit risk. TheCompany used a potential future exposure model to estimate this credit valuation adjustment (“CVA”). The inputs to the CVA were largely based onobservable market data, with the exception of certain assumptions regarding credit worthiness. As the magnitude of the CVA was not a significantcomponent of the fair value of the interest rate swaps and interest rate caps, it was not considered a significant input. The fair value of the interest rateswaps and interest rate caps are classified as Level 2. As of June 30, 2021 and December 31, 2020, the fair value of the interest rate swap agreements was$1.9 million and $4.8 million, respectively, which were recorded in other current liabilities on the consolidated balance sheet. As of June 30, 2021 andDecember 31, 2020, the fair value of the interest rate cap agreements was $1.1 million and $0.3 million, respectively, which were recorded in other assetson the consolidated balance sheet.
Debt Securities — The Company’s investments in debt securities, which are classified as available-for-sale, consist of U.S. Treasury and U.S. governmentagency securities and certificates of deposit. These securities are held in escrow by the Company’s wholly-owned captive insurance company and werepurchased with restricted cash. As such, these securities are not available to fund the Company’s operations. These securities are recorded at fair valueusing quoted prices available in active markets and are classified as Level 1. As of June 30, 2021, the fair value of the available-for-sale debt securities was$25.9 million and was classified based on the instruments’ maturity dates, with $21.5 million included in prepaid expenses and other current assets and$4.4 million in other assets on the consolidated balance sheet. As of December 31, 2020, the fair value of the available-for-sale debt securities was $27.9million, with $21.5 million included in prepaid expenses and other current assets and $6.4 million in other assets on the consolidated balance sheet. AtJune 30, 2021 and December 31, 2020, the amortized cost was $25.9 million and $27.9 million, respectively. The debt securities held at June 30, 2021 hadremaining maturities ranging from less than one year to approximately 1.5 years. Unrealized gains and losses, net of tax, on available-for-sale debtsecurities were immaterial for the three and six months ended June 30, 2021 and 2020.
Liabilities for Contingent Consideration — The Company is subject to contingent consideration arrangements in connection with certain businesscombinations. Liabilities for contingent consideration are measured at fair value each reporting period, with the acquisition-date fair value included as partof the consideration payable for the related business combination and subsequent changes in fair value recorded to selling, general and administrativeexpenses on the Company’s consolidated statement of income. The fair value of contingent consideration was generally calculated using customaryvaluation models based on probability-weighted outcomes of meeting certain future performance targets and forecasted results. The key inputs to thevaluations are the projections of future financial results in relation to the businesses and the company-specific discount rates. The Company classified thecontingent consideration liabilities as a Level 3 fair value measurement due to the lack of observable inputs used in the model. The contingentconsideration liabilities outstanding as of June 30, 2021 related to 2019 and 2021 acquisitions. See Note 4, Acquisitions, for additional information.
The following table provides a roll forward of the recurring Level 3 fair value measurements:Six months ended June 30,
2021
(In thousands)Balance at January 1, 2021 $ 13,721
Issuance of contingent consideration in connection with acquisitions 7,337 Changes in fair value 379 Foreign currency translation 100
Balance at June 30, 2021 $ 21,537
20

Table of Contents
Nonrecurring Fair Value Estimates — During the three and six months ended June 30, 2020, the Company recognized impairment losses of $11.9million and $16.9 million, respectively, on fixed assets and operating lease right-of-use assets for certain centers. The impairment losses were included incost of services on the consolidated statement of income, which have been allocated to the full service center-based child care segment. The estimated fairvalue of the applicable center long-lived assets was based on the fair value of the asset groups, calculated using a discounted cash flow model, withunobservable inputs. The fair value of the fixed assets was insignificant given the current and expected cash flows of these centers and the valuation of thelease right-of-use-assets considered the amount a market participant would pay for use of the asset. The Company classified the center long-lived assets asa Level 3 fair value measurement due to the lack of observable inputs used in the model.
During the three and six months ended June 30, 2020, the Company recognized a $2.1 million impairment loss on an equity investment. The impairmentloss was included in cost of services on the consolidated statement of income, which has been allocated to the back-up care segment. The estimated fairvalue of the equity investment was based on a qualitative assessment, that considered the current economic environment, business prospects and transactioninformation in the entity's securities, among other factors considered. The Company classified the equity investment as a Level 3 fair value measurementdue to the lack of observable inputs.
10. ACCUMULATED OTHER COMPREHENSIVE INCOME (LOSS)
Accumulated other comprehensive income (loss), which is included as a component of stockholders’ equity, is comprised of foreign currency translationadjustments and unrealized gains (losses) on cash flow hedges and investments, net of tax.
The changes in accumulated other comprehensive income (loss) by component were as follows:Six months ended June 30, 2021
Foreign currencytranslation
adjustments(1)
Unrealized gain(loss) on
cash flow hedges
Unrealized gain(loss) on
investments Total
(In thousands)Balance at January 1, 2021 $ (22,332) $ (4,785) $ 48 $ (27,069)
Other comprehensive income (loss) before reclassifications — netof tax 1,086 616 (41) 1,661 Less: amounts reclassified from accumulated other comprehensiveincome (loss) — net of tax 387 (2,141) — (1,754)
Net other comprehensive income (loss) 699 2,757 (41) 3,415 Balance at June 30, 2021 $ (21,633) $ (2,028) $ 7 $ (23,654)
Six months ended June 30, 2020Foreign currency
translationadjustments
(1)
Unrealized gain(loss) on
cash flow hedges
Unrealized gain(loss) on
investments Total
(In thousands)Balance at January 1, 2020 $ (47,835) $ (2,566) $ 70 $ (50,331)
Other comprehensive income (loss) before reclassifications — netof tax (37,951) (4,767) 91 (42,627)Less: amounts reclassified from accumulated other comprehensiveincome (loss) — net of tax — (1,199) — (1,199)
Net other comprehensive income (loss) (37,951) (3,568) 91 (41,428)Balance at June 30, 2020 $ (85,786) $ (6,134) $ 161 $ (91,759)
(1) Taxes are not provided for the currency translation adjustments related to the undistributed earnings of foreign subsidiaries that are intended to be indefinitelyreinvested.
21

Table of Contents
11. SEGMENT INFORMATION
The Company’s reportable segments are comprised of (1) full service center-based child care, (2) back-up care, and (3) educational advisory and otherservices. The full service center-based child care segment includes the traditional center-based early education and child care, preschool, and elementaryeducation. The Company’s back-up care segment consists of center-based back-up child care, in-home child and adult/elder care, and self-sourcedreimbursed care. The Company’s educational advisory and other services segment consists of tuition assistance and student loan repayment programadministration, workforce education and related educational advising, college admissions advisory services, and an online marketplace for families andcaregivers, which have been aggregated as they do not meet the thresholds for separate disclosure. The Company and its chief operating decision makerevaluate performance based on revenues and income from operations. Intercompany activity is eliminated in the segment results. The assets and liabilitiesof the Company are managed centrally and are reported internally in the same manner as the consolidated financial statements; therefore, no segment assetinformation is produced or included herein.
Revenue and income from operations by reportable segment were as follows:
Full servicecenter-based
child care Back-up care
Educationaladvisory andother services Total
(In thousands)Three months ended June 30, 2021Revenue $ 334,427 $ 81,484 $ 25,567 $ 441,478 Income from operations 4,062 24,769 5,181 34,012
Three months ended June 30, 2020Revenue $ 137,306 $ 135,904 $ 20,562 $ 293,772 Income (loss) from operations (71,842) 75,121 4,835 8,114
(1) For the three months ended June 30, 2020, income (loss) from operations included impairment costs of $14.0 million, of which $6.7 million related to fixed assets and$5.2 million related to operating lease right-of-use assets in the full service center-based child care segment, and $2.1 million related to an equity investment in theback-up care segment. Additionally, loss from operations in the full service center-based child care segment included $4.4 million in costs primarily associated with theclosure of centers, including related severance and facilities costs.
Full servicecenter-based
child care Back-up care
Educationaladvisory andother services Total
(In thousands)Six months ended June 30, 2021Revenue $ 624,746 $ 157,839 $ 49,733 $ 832,318 Income (loss) from operations (13,905) 51,959 9,666 47,720
Six months ended June 30, 2020Revenue $ 548,697 $ 210,071 $ 41,327 $ 800,095 Income (loss) from operations (55,095) 97,360 9,130 51,395
(1) For the six months ended June 30, 2020, income (loss) from operations included impairment costs of $19.0 million, of which $11.7 million related to fixed assets and$5.2 million related to operating lease right-of-use assets in the full service center-based child care segment, and $2.1 million related to an equity investment in theback-up care segment. Additionally, loss from operations in the full service center-based child care segment included $4.4 million in costs primarily associated with theclosure of centers, including related severance and facilities costs.
(1)
(1)
22

Table of Contents
12. CONTINGENCIES
Litigation
The Company is a defendant in certain legal matters in the ordinary course of business and records accruals for outstanding legal matters when theCompany believes it is probable that a loss has been incurred, and the amount can be reasonably estimated. The Company is currently subject to agovernmental investigation and may be subject to one or more health and safety charges in the United Kingdom related to an incident at a Companynursery in July 2019. The Company accrued a liability with respect to this matter, which is reflected in the consolidated financial statements, but is notconsidered material. While the outcome is inherently uncertain and may be subject to liability in excess of the accrual, the Company does not expect thismatter to have a material adverse effect on the Company’s consolidated financial position. The Company's accruals for outstanding legal matters are notmaterial, individually or in the aggregate, to the Company's consolidated financial position. Management believes the resolution of such pending legalmatters will not have a material adverse effect on the Company’s financial condition, results of operations or cash flows, although the Company cannotpredict the ultimate outcome of any such actions.
23

Table of Contents
Item 2. Management’s Discussion and Analysis of Financial Condition and Results of Operations
Special Note Regarding Forward-Looking Statements
This Quarterly Report on Form 10-Q includes statements that express our opinions, expectations, beliefs, plans, objectives, assumptions or projectionsregarding future events or future results and therefore are, or may be deemed to be, “forward-looking statements” within the meaning of the PrivateSecurities Litigation Reform Act of 1995 (the “Act”). The following cautionary statements are being made pursuant to the provisions of the Act and withthe intention of obtaining the benefits of the “safe harbor” provisions of the Act. These forward-looking statements can generally be identified by the use offorward-looking terminology, including the terms “believes,” “expects,” “may,” “will,” “should,” “seeks,” “projects,” “approximately,” “intends,” “plans,”“estimates” or “anticipates,” or, in each case, their negatives or other variations or comparable terminology. These forward-looking statements include allmatters that are not historical facts. They appear in a number of places throughout this Quarterly Report and include statements regarding our intentions,beliefs or current expectations concerning, among other things, our results of operations, financial condition and liquidity, the impact of COVID-19 and itsvariants on our near and long- term operations, our expectations around the timing to open temporarily closed centers, permanent center closures, thecontinued operation of currently open centers, timing to re-enroll and re-ramp centers as well as certain back-up care services, enrollment recovery, our costmanagement and cost-saving initiatives and capital spending, labor costs and labor market, impact of government mandates, continued performance andcontributions from our back-up care segment, use of back-up care solutions, access to and impact of government relief and support programs including taxdeferrals and credits, leases, lease deferrals and timing for payment, ability to respond to changing market conditions, our growth, our strategies, demandfor services, macroeconomic trends, investments in user experience and service delivery, the impact of accounting principles, pronouncements and policies,acquisitions and expected synergies, our fair value estimates, impairment losses, goodwill from business combinations, estimates and impact of equitytransactions, unrecognized tax benefits and the impact of uncertain tax positions, our effective tax rate, the outcome of tax audits, settlements and taxliabilities, future impact of excess tax benefits, estimates and adjustments, amortization expense, the impact of foreign currency exchange rates, our creditrisk, our share repurchase program, the outcome of litigation, legal proceedings and our insurance coverage, debt securities, our interest rate swaps andcaps, interest rates and projections, interest expense, the use of derivatives or other market risk sensitive instruments, our indebtedness, borrowings underour senior credit facility and revolving credit facility, the need for additional debt or equity financings and our ability to obtain such financing, our sourcesand uses of cash flow, our ability to fund operations, and make capital expenditures and payments with cash and cash equivalents and borrowings, and ourability to meet financial obligations and comply with covenants of our senior credit facility.
By their nature, forward-looking statements involve risks and uncertainties because they relate to events and depend on circumstances that may or may notoccur in the future. We believe that these risks and uncertainties include, but are not limited to, those disclosed in our Annual Report on Form 10-K for theyear ended December 31, 2020, including with respect to the impacts from the ongoing COVID-19 pandemic, as well as other factors disclosed from timeto time in our other filings with the SEC.
Although we base these forward-looking statements on assumptions that we believe are reasonable when made, we caution that forward-looking statementsare not guarantees of future performance and that our actual results of operations, financial condition and liquidity, and the development of the industry inwhich we operate may differ materially from those made in or suggested by the forward-looking statements contained in this Quarterly Report. In addition,even if our results of operations, financial condition and liquidity, and the development of the industry in which we operate, are consistent with theforward-looking statements contained in this Quarterly Report, those results or developments may not be indicative of results or developments insubsequent periods.
Given these risks and uncertainties, you are cautioned not to place undue reliance on these forward-looking statements. Any forward-looking statement thatwe make in this Quarterly Report speaks only as of the date of such statement, and we undertake no obligation to update any forward-looking statements orto publicly announce the results of any revisions to any of those statements to reflect future events or developments, except as required by law.
Overview
The following is a discussion of the significant factors affecting the consolidated operating results, financial condition, liquidity and cash flows of BrightHorizons Family Solutions Inc. (“we” or the “Company”) for the three and six months ended June 30, 2021, as compared to the three and six months endedJune 30, 2020. This discussion should be read in conjunction with Management’s Discussion and Analysis of Financial Condition and Results ofOperations and the Consolidated Financial Statements and Notes thereto included in our Annual Report on Form 10-K for the fiscal year endedDecember 31, 2020.
24

Table of Contents
We are a leading provider of high-quality education and care, including early education and child care, back-up and family care solutions, and workforceeducation services that are designed to help client employees better integrate work and family life, as well as grow their careers. We provide servicesprimarily under multi-year contracts with employers who offer early education and child care, back-up care, and educational advisory and other services aspart of their employee benefits packages in an effort to support employees across life and career stages and improve employee recruitment, employeeengagement, productivity, retention and career advancement. As of June 30, 2021, we had more than 1,300 client relationships with employers across adiverse array of industries, including more than 190 Fortune 500 companies and more than 80 of Working Mother magazine’s 2020 “100 Best Companies.”
At June 30, 2021, we operated 1,006 early education and child care centers, compared to 1,076 centers at June 30, 2020, and had the capacity to serveapproximately 113,000 children and their families in the United States, the United Kingdom, the Netherlands, and India. At June 30, 2021, approximately920, or 90%, of our child care centers were open.
Our reportable segments are comprised of (1) full service center-based child care, (2) back-up care, and (3) educational advisory and other services, whichincludes tuition assistance and student loan repayment program administration, workforce education and related educational advising, college admissionsadvisory services, and an online marketplace for families and caregivers.
Since March 2020, our global operations have been significantly impacted by the COVID-19 pandemic and the measures to prevent its spread, such asperiodically reinstated lockdowns and required business and school closures and restrictions. We remain focused on the re-enrollment of our centers and thephased re-opening of the limited number of centers that remain temporarily closed, which we expect will continue throughout 2021. The broad and long-term effects of COVID-19, its duration and the scope of ongoing and related disruptions cannot be predicted and are affected by many interdependentvariables and decisions by government authorities and our client partners, as well as demand, economic, workforce and labor market trends, the adoptionand effectiveness of vaccines, and developments in the persistence and treatment of COVID-19 and its variants. We cannot anticipate how long it will takefor re-opened centers to reach typical enrollment levels and there is no assurance that centers currently open will continue to operate. Additionally, as wecontinue to analyze the current environment, we may decide to not re-open certain centers in locations where demand, economic and workforce trends haveshifted. We currently expect the effects of COVID-19 to our business to continue to adversely impact our results of operations for the remainder of 2021.
We will continue to monitor and respond to the changing conditions, challenges and disruptions resulting from the COVID-19 pandemic, and the changingneeds of clients, families and children, while remaining focused on our strategic priorities to deliver high quality education and care services, connectacross our service lines, extend our impact on new customers and clients, and preserve our strong culture. These challenging times have demonstrated ourcrisis management abilities, our critical role in the business continuity plans of our client partners, our leadership in developing and implementing enhancedhealth and safety protocols, and the value that our unique service offering provides to the families and clients we serve. We remain confident in ourbusiness model, the strength of our client partnerships, the strength of our balance sheet and liquidity position, and our ability to continue to respond tochanging market conditions.
25

Table of Contents
Results of Operations
The following table sets forth statement of income data as a percentage of revenue for the three months ended June 30, 2021 and 2020:
Three Months Ended June 30,2021 % 2020 %
(In thousands, except percentages)Revenue $ 441,478 100.0 % $ 293,772 100.0 %Cost of services 335,496 76.0 % 228,536 77.8 %
Gross profit 105,982 24.0 % 65,236 22.2 %Selling, general and administrative expenses 64,458 14.6 % 49,247 16.8 %Amortization of intangible assets 7,512 1.7 % 7,875 2.6 %
Income from operations 34,012 7.7 % 8,114 2.8 %Interest expense — net (9,580) (2.2)% (9,129) (3.1)%
Income (loss) before income tax 24,432 5.5 % (1,015) (0.3)%Income tax benefit (expense) (5,617) (1.2)% 1,374 0.4 %
Net income $ 18,815 4.3 % $ 359 0.1 %
Adjusted EBITDA $ 67,951 15.4 % $ 60,025 20.4 %Adjusted income from operations $ 34,012 7.7 % $ 27,211 9.3 %Adjusted net income $ 29,841 6.8 % $ 26,445 9.0 %
The following table sets forth statement of income data as a percentage of revenue for the six months ended June 30, 2021 and 2020:Six Months Ended June 30,
2021 % 2020 %
(In thousands, except percentages)Revenue $ 832,318 100.0 % $ 800,095 100.0 %Cost of services 644,978 77.5 % 626,000 78.2 %
Gross profit 187,340 22.5 % 174,095 21.8 %Selling, general and administrative expenses 124,568 15.0 % 106,616 13.3 %Amortization of intangible assets 15,052 1.8 % 16,084 2.1 %
Income from operations 47,720 5.7 % 51,395 6.4 %Interest expense — net (18,596) (2.2)% (19,335) (2.4)%
Income before income tax 29,124 3.5 % 32,060 4.0 %Income tax expense (3,177) (0.4)% (969) (0.1)%
Net income $ 25,947 3.1 % $ 31,091 3.9 %
Adjusted EBITDA $ 114,247 13.7 % $ 141,483 17.7 %Adjusted income from operations $ 47,720 5.7 % $ 76,165 9.5 %Adjusted net income $ 43,696 5.2 % $ 70,091 8.8 %
(1) Adjusted EBITDA, adjusted income from operations and adjusted net income are non-GAAP financial measures and are not determined in accordance with accountingprinciples generally accepted in the United States (“GAAP”). Refer to “Non-GAAP Financial Measures and Reconciliation” below for a reconciliation of these non-GAAP financial measures to their respective measures determined under GAAP and for information regarding our use of non-GAAP measures.
(1)
(1)
(1)
(1)
(1)
(1)
26

Table of Contents
Three Months Ended June 30, 2021 Compared to the Three Months Ended June 30, 2020
Revenue. Revenue increased by $147.7 million, or 50%, to $441.5 million for the three months ended June 30, 2021 from $293.8 million for the sameperiod in 2020. The following table summarizes the revenue and percentage of total revenue for each of our segments for the three months ended June 30,2021 and 2020:
Three Months Ended June 30,2021 2020 Change 2021 vs 2020
(In thousands, except percentages)Full-service center-based child care $ 334,427 75.7 % $ 137,306 46.7 % $ 197,121 143.6 %
Tuition 298,065 89.1 % 76,834 56.0 % 221,231 287.9 %Management fees and operating subsidies 36,362 10.9 % 60,472 44.0 % (24,110) (39.9) %
Back-up care 81,484 18.5 % 135,904 46.3 % (54,420) (40.0)%Educational advisory and other services 25,567 5.8 % 20,562 7.0 % 5,005 24.3 %
Total revenue $ 441,478 100.0 % $ 293,772 100.0 % $ 147,706 50.3 %
Revenue generated by the full service center-based child care segment in the three months ended June 30, 2021 increased by $197.1 million, or 144%,when compared to the same period in 2020. Revenue growth in this segment was attributable to enrollment increases in our open child care centers and thecontinued re-opening of our temporarily closed centers. Tuition revenue increased by $221.2 million, or 288%, when compared to the prior year, on a 196%increase in enrollment. While enrollment in our child care centers improved during the quarter, our centers continue to operate below pre-COVID-19enrollment levels during this re-ramping phase and we expect enrollment recovery to continue throughout 2021. Higher foreign currency exchange rates forour United Kingdom and Netherlands operations also contributed to our revenue growth, which increased 2021 tuition revenue by approximately 4%, or$5.0 million. Management fees and operating subsidies from employer sponsors decreased $24.1 million, or 40%, due to reduced operating subsidiesreceived to support center operations in connection with the increase in tuition revenue.
Revenue generated by back-up care services in the three months ended June 30, 2021 decreased by $54.4 million, or 40%, when compared to the sameperiod in 2020. While we had gains from expanded sales to new clients, increased utilization from existing clients, and increases in traditional in-center andin-home use during the quarter, back-up care revenue decreased compared to the prior year as the second quarter in 2020 benefited from significant demandfor back-up care services (primarily for self-sourced reimbursed care) during the early stages of the pandemic when other care alternatives were notavailable. Traditional in-center and in-home use continues to ramp and, although usage remains below pre-COVID-19 levels, we expect continued recoverythroughout 2021.
Revenue generated by educational advisory and other services in the three months ended June 30, 2021 increased by $5.0 million, or 24%, when comparedto the same period in the prior year. Revenue growth in this segment was primarily attributable to contributions from sales to new clients and increasedutilization from existing clients. An acquisition completed in 2020 contributed $2.3 million to the growth of this segment in 2021.
Cost of Services. Cost of services increased by $107.0 million, or 47%, to $335.5 million for the three months ended June 30, 2021 from $228.5 million forthe same period in 2020.
Cost of services in the full service center-based child care segment increased $105.5 million, or 60%, to $280.5 million in the three months ended June 30,2021 when compared to the same period in 2020. The increase in cost of services was primarily associated with a 125% increase in personnel costs, whichgenerally represent 70% of the costs for this segment, in connection with the enrollment growth at our centers. The increase in cost of services was partiallyoffset by a 3% decrease in program supplies, materials, and facility costs, which generally represent the remaining 30% of costs for this segment, primarilydue to funding from government support programs which reduced other operating expenses by $7.4 million in the second quarter of 2021. The secondquarter of 2020 included a reduction in certain payroll and other operating expenses of $39.6 million from funding received from government supportprograms, which was partially offset by impairment costs of $11.9 million and center closure costs of $4.4 million that did not occur in 2021.
Cost of services in the back-up care segment decreased by $0.7 million, or 2%, to $42.5 million in the three months ended June 30, 2021, when comparedto the prior year. Cost of services in the second quarter of 2020 included impairment costs of $2.1 million related to an equity investment. After takingthese charges into account, cost of services increased $1.4 million, or 4%, in the three months ended June 30, 2021, associated with the effects of a changein the revenue mix, with the return to higher levels of traditional in-center and in-home care in the current period compared to more significant self-sourcedreimbursed care in the prior year period. The increase in traditional utilization levels over the prior year generated increased care provider fees in the threemonths ended June 30, 2021, and we continue to invest in personnel, marketing and technology to support our customer user experience and servicedelivery.
27

Table of Contents
Cost of services in the educational advisory and other services segment increased by $2.2 million, or 21%, to $12.5 million in the three months ended June30, 2021 when compared to the prior year, which is broadly consistent with the revenue growth. The increase was primarily due to personnel costs relatedto delivering services to the expanding customer base.
Gross Profit. Gross profit increased by $40.7 million, or 62%, to $106.0 million for the three months ended June 30, 2021 from $65.2 million for the sameperiod in 2020. Gross profit margin was 24% of revenue for the three months ended June 30, 2021, an increase of approximately 2% from the three monthsended June 30, 2020. The increase was primarily due to improved margins in the full service center-based child care segment from enrollment increases atopen centers and from the re-opening of temporarily closed child care centers, partially offset by reduced contributions from our back-up care services as aresult of the decrease in self-sourced reimbursed care.
Selling, General and Administrative Expenses (“SGA”). SGA increased by $15.2 million, or 31%, to $64.5 million for the three months ended June 30,2021 from $49.2 million for the same period in 2020, in order to support the business throughout the pandemic and as it re-ramps. SGA was 15% ofrevenue for the three months ended June 30, 2021, compared to 17% for the same period in 2020 due to the lower revenue base in 2020.
Amortization of Intangible Assets. Amortization expense on intangible assets was $7.5 million for the three months ended June 30, 2021, a decrease from$7.9 million for the three months ended June 30, 2020, due to decreases from certain intangible assets becoming fully amortized during the period, partiallyoffset by increases from the acquisitions completed in 2020 and 2021.
Income from Operations. Income from operations increased by $25.9 million, or 319%, to $34.0 million for the three months ended June 30, 2021 whencompared to the prior year. The following table summarizes income from operations and percentage of revenue for each of our segments for the threemonths ended June 30, 2021 and 2020:
Three Months Ended June 30,2021 2020 Change 2021 vs 2020
(In thousands, except percentages)Full-service center-based child care $ 4,062 1.2 % $ (71,842) (52.3)% $ 75,904 105.7 %Back-up care 24,769 30.4 % 75,121 55.3 % (50,352) (67.0)%Educational advisory and other services 5,181 20.3 % 4,835 23.5 % 346 7.2 %
Income from operations $ 34,012 7.7 % $ 8,114 2.8 % $ 25,898 319.2 %
The increase in income from operations was due to the following:• Income from operations for the full service center-based child care segment increased $75.9 million, or 106%, in the three months ended June 30,
2021 when compared to the same period in 2020 primarily due to increases in tuition revenue from enrollment growth in our open centers and the re-opening of temporarily closed centers, as well as contributions from government support programs that reduced certain operating expenses by $7.4million during the quarter. Income from operations for the three months ended June 30, 2020 included contributions from government supportprograms of $39.6 million, which were partially offset by impairment costs of $11.9 million and center closure costs of $4.4 million.
• Income from operations for the back-up care segment decreased $50.4 million, or 67%, in the three months ended June 30, 2021 when compared tothe same period in 2020, as the second quarter of 2020 benefited from increased demand during the early stages of the pandemic.
• Income from operations for the educational advisory and other services segment increased $0.3 million, or 7%, in the three months ended June 30,2021 when compared to the same period in 2020 due to contributions from the expanding revenue base.
Net Interest Expense. Net interest expense was $9.6 million for the three months ended June 30, 2021, which is relatively consistent with interest expenseof $9.1 million for the same period in 2020. Including the effects of the interest rate swap arrangements, the weighted average interest rates for the termloan and revolving credit facility were 3.1% for both the three months ended June 30, 2021 and 2020. Based on our current interest rate projections, weestimate that our overall weighted average interest rate will approximate 3.0% for the remainder of 2021.
28

Table of Contents
Income Tax Expense (Benefit). We recorded income tax expense of $5.6 million during the three months ended June 30, 2021, at an effective income taxrate of 23%, compared to an income tax benefit of $1.4 million during the three months ended June 30, 2020, at an effective income tax rate of (135)%.The difference between the effective income tax rate as compared to the statutory income tax rate was primarily due to the effects of excess tax benefitsassociated with the exercise of stock options and vesting of restricted stock, which had a more significant impact to the effective tax rate for 2020 due to thelower income before income tax. The effective income tax rate may fluctuate from quarter to quarter for various reasons, including changes to incomebefore income tax, jurisdictional mix of income before income tax, valuation allowances, jurisdictional income tax rate changes, as well as discrete itemssuch as the settlement of foreign, federal and state tax issues and the effects of excess tax benefits associated with the exercise of stock options and vestingof restricted stock. During the three months ended June 30, 2021 and 2020, the excess tax benefits reduced income tax expense by $1.2 million and $1.7million, respectively. The effective income tax rate prior to the inclusion of the excess tax benefits from stock-based compensation and other discrete itemswas approximately 28% and 29% for the three months ended June 30, 2021 and 2020, respectively.
Adjusted EBITDA and Adjusted Income from Operations. Adjusted EBITDA and adjusted income from operations increased $7.9 million, or 13%, and$6.8 million, or 25%, respectively, for the three months ended June 30, 2021 over the comparable period in 2020 primarily as a result of the increase ingross profit in the full service center-based child care segment, partially offset by reduced contributions in the back-up care segment.
Adjusted Net Income. Adjusted net income increased $3.4 million, or 13%, for the three months ended June 30, 2021 when compared to the same period in2020, primarily due to the increase in income from operations, partially offset by a higher effective tax rate.
Six Months Ended June 30, 2021 Compared to the Six Months Ended June 30, 2020
Revenue. Revenue increased $32.2 million, or 4%, to $832.3 million for the six months ended June 30, 2021 from $800.1 million for the same period in2020. The following table summarizes the revenue and percentage of total revenue for each of our segments for the six months ended June 30, 2021 and2020:
Six Months Ended June 30,2021 2020 Change 2021 vs 2020
(In thousands, except percentages)Full-service center-based child care $ 624,746 75.0 % $ 548,697 68.5 % $ 76,049 13.9 %
Tuition 548,317 87.8 % 449,713 82.0 % 98,604 21.9 %Management fees and operating subsidies 76,429 12.2 % 98,984 18.0 % (22,555) (22.8)%
Back-up care 157,839 19.0 % 210,071 26.3 % (52,232) (24.9)%Educational advisory and other services 49,733 6.0 % 41,327 5.2 % 8,406 20.3 %
Total revenue $ 832,318 100.0 % $ 800,095 100.0 % $ 32,223 4.0 %
Revenue generated by the full service center-based child care segment in the six months ended June 30, 2021 increased by $76.0 million, or 14%, whencompared to the same period in 2020. Revenue growth in this segment was attributable to enrollment increases in our open centers and the continued re-opening of our temporarily closed centers. Tuition revenue increased by $98.6 million, or 22%, when compared to the prior year, on a 13% increase inenrollment. As noted above, while enrollment in our child care centers has improved, we remain in the re-ramp phase and enrollment remains below pre-COVID-19 levels. We expect recovery to continue throughout 2021. Higher foreign currency exchange rates for our United Kingdom and Netherlandsoperations also contributed to our revenue growth, which increased 2021 tuition revenue by approximately 3%, or $15.0 million. Management fees andoperating subsidies from employer sponsors decreased $22.6 million, or 23%, due to reduced operating subsidies received to support center operations inconnection with the increase in tuition revenue.
Revenue generated by back-up care services in the six months ended June 30, 2021 decreased by $52.2 million, or 25%, when compared to the same periodin 2020. While we had gains from expanded sales to new clients, increased utilization from existing clients, and increases in traditional in-center and in-home use in the 2021 year to date period, back-up care revenue decreased compared to the prior year as the second quarter in 2020 benefited fromsignificant demand for back-up care services (primarily for self-sourced reimbursed care) during the early stages of the pandemic when other carealternatives were not available. As noted above, traditional in-center and in-home use continues to ramp, and, although usage remains below pre-COVID-19 levels, we expect continued recovery throughout 2021.
Revenue generated by educational advisory and other services in the six months ended June 30, 2021 increased by $8.4 million, or 20%, when compared tothe same period in the prior year. Revenue growth in this segment was primarily attributable to contributions from sales to new clients and increasedutilization from existing clients. An acquisition completed in 2020 contributed $4.3 million to the growth of this segment in 2021.
29

Table of Contents
Cost of Services. Cost of services increased $19.0 million, or 3%, to $645.0 million for the six months ended June 30, 2021 from $626.0 million for thesame period in 2020.
Cost of services in the full service center-based child care segment increased $20.2 million, or 4%, to $541.7 million in the six months ended June 30, 2021when compared to the same period in 2020. The increase in cost of services was primarily associated with the revenue increase. Funding from governmentsupport programs reduced certain operating expenses by $17.0 million in 2021. Cost of services in 2020 included a reduction in certain payroll andoperating expenses of $39.6 million from funding received from government support programs, partially offset by impairment costs of $16.9 million andcenter closure costs of $4.4 million that did not occur in 2021.
Cost of services in the back-up care segment decreased $4.6 million, or 5%, to $78.8 million in the six months ended June 30, 2021, when compared to theprior year. Cost of services for the six months ended June 30, 2020 included impairment costs of $2.1 million related to an equity investment. After takingthese charges into account, cost of services decreased $2.5 million, or 3%, in the six months ended June 30, 2021, associated with the revenue decrease,partially offset by the effects of a change in the revenue mix, with the return to higher levels of traditional in-center and in-home care in the current periodcompared to more significant self-sourced reimbursed care in the prior year period. The increase in traditional utilization levels over the prior yeargenerated increased care provider fees in the six months ended June 30, 2021, and we continue to invest in personnel, marketing and technology to supportour customer user experience and service delivery.
Cost of services in the educational advisory and other services segment increased by $3.4 million, or 16%, to $24.5 million in the six months endedJune 30, 2021 due to personnel costs related to delivering services to the expanding customer base.
Gross Profit. Gross profit increased $13.2 million, or 8%, to $187.3 million for the six months ended June 30, 2021 from $174.1 million for the sameperiod in 2020. Gross profit margin was 23% of revenue for the six months ended June 30, 2021, an increase of approximately 1% from the six monthsended June 30, 2020. The increase was primarily due to improved margins in the full service center-based child care segment from enrollment increases atopen centers and from the re-opening of temporarily closed child care centers, partially offset by reduced contributions from our back-up care services as aresult of the decrease in self-sourced reimbursed care.
Selling, General and Administrative Expenses. SGA increased $18.0 million, or 17%, to $124.6 million for the six months ended June 30, 2021 from$106.6 million for the same period in 2020, in order to support the business throughout the pandemic and as it re-ramps. SGA was 15% of revenue for thesix months ended June 30, 2021, compared to 13% for the same period in 2020.
Amortization of Intangible Assets. Amortization expense on intangible assets was $15.1 million for the six months ended June 30, 2021, a decrease from$16.1 million for the six months ended June 30, 2020 due to decreases from certain intangible assets becoming fully amortized during the period, partiallyoffset by increases from the acquisitions completed in 2020 and 2021.
Income from Operations. Income from operations decreased by $3.7 million, or 7%, to $47.7 million for the six months ended June 30, 2021 whencompared to the same period in 2020. The following table summarizes income from operations and percentage of revenue for each of our segments for thesix months ended June 30, 2021 and 2020:
Six Months Ended June 30,2021 2020 Change 2021 vs 2020
(In thousands, except percentages)Full-service center-based child care $ (13,905) (2.2)% $ (55,095) (10.0)% $ 41,190 74.8 %Back-up care 51,959 32.9 % 97,360 46.3 % (45,401) (46.6)%Educational advisory and other services 9,666 19.4 % 9,130 22.1 % 536 5.9 %
Income from operations $ 47,720 5.7 % $ 51,395 6.4 % $ (3,675) (7.2)%
The decrease in income from operations was due to the following:• Income from operations for the full service center-based child care segment increased $41.2 million, or 75%, in the six months ended June 30, 2021
when compared to the same period in 2020 primarily due to increases in tuition revenue from enrollment growth in our open centers and the re-opening of temporarily closed centers, as well as contributions from government support programs that reduced certain payroll and operatingexpenses by $17.0 million in 2021. Income from operations for the six months ended June 30, 2020, included contributions from governmentsupport programs of $39.6 million, which were partially offset by impairment costs of $16.9 million and center closure costs of $4.4 million.
30

Table of Contents
• Income from operations for the back-up care segment decreased $45.4 million, or 47%, in the six months ended June 30, 2021 when compared to thesame period in 2020, as the second quarter of 2020 benefited from increased demand during the early stages of the pandemic.
• Income from operations for the educational advisory and other services segment increased $0.5 million, or 6%, in the six months ended June 30,2021 when compared to the same period in 2020 due to contributions from the expanding revenue base.
Net Interest Expense. Net interest expense decreased to $18.6 million for the six months ended June 30, 2021 from $19.3 million for the same period in2020, due to decreased borrowings under our revolving credit facility as well as decreases in the interest rates applicable to our debt. Including the effectsof the interest rate swap arrangements, the weighted average interest rates for the term loan and revolving credit facility were 3.1% and 3.3% for the sixmonths ended June 30, 2021 and 2020, respectively.
Income Tax Expense. We recorded income tax expense of $3.2 million for the six months ended June 30, 2021 at an effective income tax rate of 11%,compared to income tax expense of $1.0 million during the six months ended June 30, 2020, at an effective income tax rate of 3%. The difference betweenthe effective income tax rates as compared to the statutory income tax rates was primarily due to the effects of excess tax benefits associated with theexercise of stock options and vesting of restricted stock. During the six months ended June 30, 2021 and 2020 the excess tax benefit decreased income taxexpense by $5.1 million and $8.6 million, respectively. The effective income tax rate may fluctuate from quarter to quarter for various reasons, includingchanges to income before income tax, jurisdictional mix of income before income tax, valuation allowances, jurisdictional income tax rate changes, as wellas discrete items such as the settlement of foreign, federal and state tax issues and the effects of excess tax benefits associated with the exercise of stockoptions and vesting of restricted stock. The effective income tax rate would have approximated 28% and 29% for the six months ended June 30, 2021 and2020, respectively, prior to the inclusion of the excess tax benefit from stock-based compensation and other discrete items.
Adjusted EBITDA and Adjusted Income from Operations. Adjusted EBITDA and adjusted income from operations decreased $27.2 million, or 19%, and$28.4 million, or 37%, respectively, for the six months ended June 30, 2021 over the comparable period in 2020 primarily as a result of the decrease ingross profit in the back-up care segment, partially offset by growth in full service center-based child care.
Adjusted Net Income. Adjusted net income decreased $26.4 million, or 38%, for the six months ended June 30, 2021 when compared to the same period in2020, primarily due to the decrease in income from operations and a higher effective tax rate.
31

Table of Contents
Non-GAAP Financial Measures and ReconciliationIn our quarterly and annual reports, earnings press releases and conference calls, we discuss key financial measures that are not calculated in accordancewith GAAP to supplement our consolidated financial statements presented on a GAAP basis. These non-GAAP financial measures of adjusted EBITDA,adjusted income from operations, adjusted net income and diluted adjusted earnings per common share are reconciled from their respective measuresdetermined under GAAP as follows:
Three Months Ended June 30, Six Months Ended June 30,2021 2020 2021 2020
(In thousands, except share data)Net income $ 18,815 $ 359 $ 25,947 $ 31,091 Interest expense — net 9,580 9,129 18,596 19,335 Income tax expense (benefit) 5,617 (1,374) 3,177 969 Depreciation 20,598 19,784 40,340 39,796 Amortization of intangible assets 7,512 7,875 15,052 16,084
EBITDA 62,122 35,773 103,112 107,275 Additional adjustments:COVID-19 related costs — 18,436 — 23,406 Stock-based compensation expense 5,829 5,155 11,135 9,438 Other costs — 661 — 1,364
Total adjustments 5,829 24,252 11,135 34,208 Adjusted EBITDA $ 67,951 $ 60,025 $ 114,247 $ 141,483
Income from operations $ 34,012 $ 8,114 $ 47,720 $ 51,395 COVID-19 related costs — 18,436 — 23,406 Other costs — 661 — 1,364
Adjusted income from operations $ 34,012 $ 27,211 $ 47,720 $ 76,165
Net income $ 18,815 $ 359 $ 25,947 $ 31,091 Income tax expense (benefit) 5,617 (1,374) 3,177 969
Income (loss) before income tax 24,432 (1,015) 29,124 32,060 Amortization of intangible assets 7,512 7,875 15,052 16,084 COVID-19 related costs — 18,436 — 23,406 Stock-based compensation expense 5,829 5,155 11,135 9,438 Other costs — 661 — 1,364
Adjusted income before income tax 37,773 31,112 55,311 82,352 Adjusted income tax expense (7,932) (4,667) (11,615) (12,261)
Adjusted net income $ 29,841 $ 26,445 $ 43,696 $ 70,091
Weighted average common shares outstanding —diluted 61,106,792 60,266,102 61,216,383 59,572,444
Diluted adjusted earnings per common share $ 0.49 $ 0.44 $ 0.71 $ 1.18
(a) Represents amortization of intangible assets, including quarterly amortization expense of $5.0 million associated with intangible assets recorded in connection with ourgoing private transaction in May 2008.
(b) COVID-19 related costs in 2020 represent impairment costs for investments and long-lived assets as a result of center closures and decreases in the fair values forcertain centers that were open or temporarily closed, and other costs incurred as a result of the impact of COVID-19 on our operations and related management actions.For the three months ended June 30, 2020, impairment costs totaled $14.0 million, of which $11.9 million related to the full service center-based child care segment and$2.1 million related to the back-up care segment, and for the six months ended June 30, 2020, impairment costs totaled $19.0 million, of which $16.9 million related tothe full service center-based child care segment, and $2.1 million related to the back-up care segment. Other COVID-19 related costs totaled $4.4 million for the threeand six months ended June 30, 2020, and were primarily associated with the closure of centers, including severance and facilities costs.
(a)
(b)
(c)
(d)
(b)
(d)
(a)
(b)
(c)
(d)
(e)
32

Table of Contents
(c) Represents non-cash stock-based compensation expense in accordance with Accounting Standards Codification Topic 718, Compensation-Stock Compensation.(d) Other costs in 2020 relate to occupancy costs incurred for our new corporate headquarters during the construction period, which represented duplicative office costs
while we also continued to carry the costs for our previous corporate headquarters.(e) Represents income tax expense calculated on adjusted income before income tax at an effective tax rate of approximately 21% and 15% for 2021 and 2020,
respectively. The tax rate for 2021 represents a tax rate of approximately 27% applied to the expected adjusted income before income tax, less the estimated effect ofexcess tax benefits related to equity transactions. However, the jurisdictional mix of the expected adjusted income before income tax for the full year, and the timingand volume of the tax benefits associated with such future equity activity will affect these estimates and the estimated effective tax rate for the year.
Adjusted EBITDA, adjusted income from operations, adjusted net income and diluted adjusted earnings per common share (collectively referred to as the“non-GAAP financial measures”) are not presentations made in accordance with GAAP, and the use of the terms adjusted EBITDA, adjusted income fromoperations, adjusted net income and diluted adjusted earnings per common share may differ from similar measures reported by other companies and maynot be comparable to other similarly titled measures. We believe the non-GAAP financial measures provide investors with useful information with respectto our historical operations. We present the non-GAAP financial measures as supplemental performance measures because we believe they facilitate acomparative assessment of our operating performance relative to our performance based on our results under GAAP, while isolating the effects of someitems that vary from period to period. Specifically, adjusted EBITDA allows for an assessment of our operating performance and of our ability to service orincur indebtedness without the effect of non-cash charges, such as depreciation, amortization, stock-based compensation expense, impairment costs andother costs incurred due to the impact of COVID-19, including center closing costs, and duplicative corporate office costs. In addition, adjusted incomefrom operations, adjusted net income and diluted adjusted earnings per common share allow us to assess our performance without the impact of thespecifically identified items that we believe do not directly reflect our core operations. These non-GAAP financial measures also function as keyperformance indicators used to evaluate our operating performance internally, and they are used in connection with the determination of incentivecompensation for management, including executive officers. Adjusted EBITDA is also used in connection with the determination of certain ratiorequirements under our credit agreement. Adjusted EBITDA, adjusted income from operations, adjusted net income and diluted adjusted earnings percommon share are not measurements of our financial performance under GAAP and should not be considered in isolation or as an alternative to incomebefore taxes, net income, diluted earnings per common share, net cash provided by (used in) operating, investing or financing activities or any otherfinancial statement data presented as indicators of financial performance or liquidity, each as presented in accordance with GAAP. Consequently, our non-GAAP financial measures should be considered together with our consolidated financial statements, which are prepared in accordance with GAAP andincluded in Part I, Item 1 of this Quarterly Report on Form 10-Q. We understand that although adjusted EBITDA, adjusted income from operations,adjusted net income and diluted adjusted earnings per common share are frequently used by securities analysts, lenders and others in their evaluation ofcompanies, they have limitations as analytical tools, and you should not consider them in isolation, or as a substitute for analysis of our results as reportedunder GAAP. Some of these limitations are:
• adjusted EBITDA, adjusted income from operations and adjusted net income do not fully reflect our cash expenditures, future requirements forcapital expenditures or contractual commitments;
• adjusted EBITDA, adjusted income from operations and adjusted net income do not reflect changes in, or cash requirements for, our working capitalneeds;
• adjusted EBITDA does not reflect the significant interest expense, or the cash requirements necessary to service interest or principal payments, ondebt; and
• although depreciation and amortization are non-cash charges, the assets being depreciated and amortized will often have to be replaced in the future;and adjusted EBITDA, adjusted income from operations and adjusted net income do not reflect any cash requirements for such replacements.
Because of these limitations, adjusted EBITDA, adjusted income from operations and adjusted net income should not be considered as discretionary cashavailable to us to reinvest in the growth of our business or as measures of cash that will be available to us to meet our obligations.
33

Table of Contents
Liquidity and Capital Resources
Our primary cash requirements are for the ongoing operations of our existing early education and child care centers, back-up care, educational advisory andother services, and debt financing obligations. Our primary sources of liquidity are our existing cash, cash flows from operations and borrowings availableunder our revolving credit facility. We had $418.6 million in cash ($429.1 million including restricted cash) at June 30, 2021, of which $54.3 million washeld in foreign jurisdictions, compared to $384.3 million in cash ($388.5 million including restricted cash) at December 31, 2020, of which $43.6 millionwas held in foreign jurisdictions. Operations outside of North America accounted for 27% and 21% of our consolidated revenue in the six months endedJune 30, 2021 and 2020, respectively. The net impact on our liquidity from changes in foreign currency exchange rates was not material for the six monthsended June 30, 2021 and 2020, and we do not currently expect that the effects of changes in foreign currency exchange rates will have a material net impacton our liquidity, capital resources or results from operations for the remainder of 2021.
On April 21, 2020, we completed the issuance and sale of 2,138,580 shares of common stock to Durable Capital Master Fund LP at a price of $116.90 pershare. We raised net proceeds from the offering of $249.8 million, which further strengthened our liquidity and financial position and increased our cashand cash equivalents.
Our revolving credit facility is part of our senior secured credit facilities, which consist of a secured term loan facility and a $400 million revolving creditfacility. There were no borrowings outstanding on our revolving credit facility at June 30, 2021 and December 31, 2020.
We had working capital of $89.9 million and $93.4 million at June 30, 2021 and December 31, 2020, respectively. We anticipate that our cash flows fromoperating activities will continue to be impacted while our re-opened centers ramp enrollment and while certain centers remain temporarily closed. Duringthis re-enrollment and re-opening phase, cash flows from operating activities will be supplemented with our existing cash, as well as borrowings availableunder our revolving credit facility, as needed. As we focus on the re-enrollment and ramping of re-opened centers, as well as re-opening our remainingtemporarily closed centers, we will continue to prioritize investments that support current operations and strategic opportunities, as well as the principal andinterest payments on our debt.
We have participated in certain government support programs, including certain tax deferrals and tax credits allowed pursuant to the CARES Act and theCAA in the United States, as well as certain tax deferrals, tax credits, and employee wage support in the United Kingdom, and may continue to do so in thefuture. During the six months ended June 30, 2021 and 2020, $17.0 million and $39.6 million, respectively, was recorded as a reduction to cost of servicesin relation to these benefits. As of June 30, 2021 and December 31, 2020, $10.9 million and $8.4 million, respectively, was recorded in prepaid expensesand other current assets on the consolidated balance sheet for amounts receivable from government support programs. Additionally, the Company hadpayroll tax deferrals totaling $20.4 million as of June 30, 2021 and December 31, 2020, of which $10.2 million was included in accounts payable andaccrued expenses and $10.2 million was included in other long-term liabilities. There is no assurance that these government support programs will continuein the future at current levels, or at all.
In response to the broad effects of COVID-19, we have re-negotiated certain payment terms with lessors to mitigate the impact on our financial positionand operations. As of June 30, 2021 and December 31, 2020, we had $2.0 million and $7.7 million, respectively, in lease payment deferrals of which themajority are payable over the next year.
The board of directors authorized a share repurchase program of up to $300 million of our outstanding common stock, effective June 12, 2018. During thesix months ended June 30, 2021, we repurchased 0.5 million shares for $70.3 million, and $124.5 million remained available under the repurchase program.During the six months ended June 30, 2020, we repurchased 0.2 million shares for $32.2 million. All repurchased shares have been retired.
We believe that funds provided by operations, our existing cash balances, and borrowings available under our revolving credit facility will be adequate tofund all obligations and liquidity requirements for at least the next twelve months. However, prolonged disruptions to our operations, including as a resultof periodically reinstated lockdowns, required school, child care and business closures and restrictions, and government mandates in response to theCOVID-19 pandemic, may require financing beyond our existing cash and borrowing capacity, and it may be necessary for us to obtain additional debt orequity financing. We may not be able to obtain such financing on reasonable terms, if at all.
34
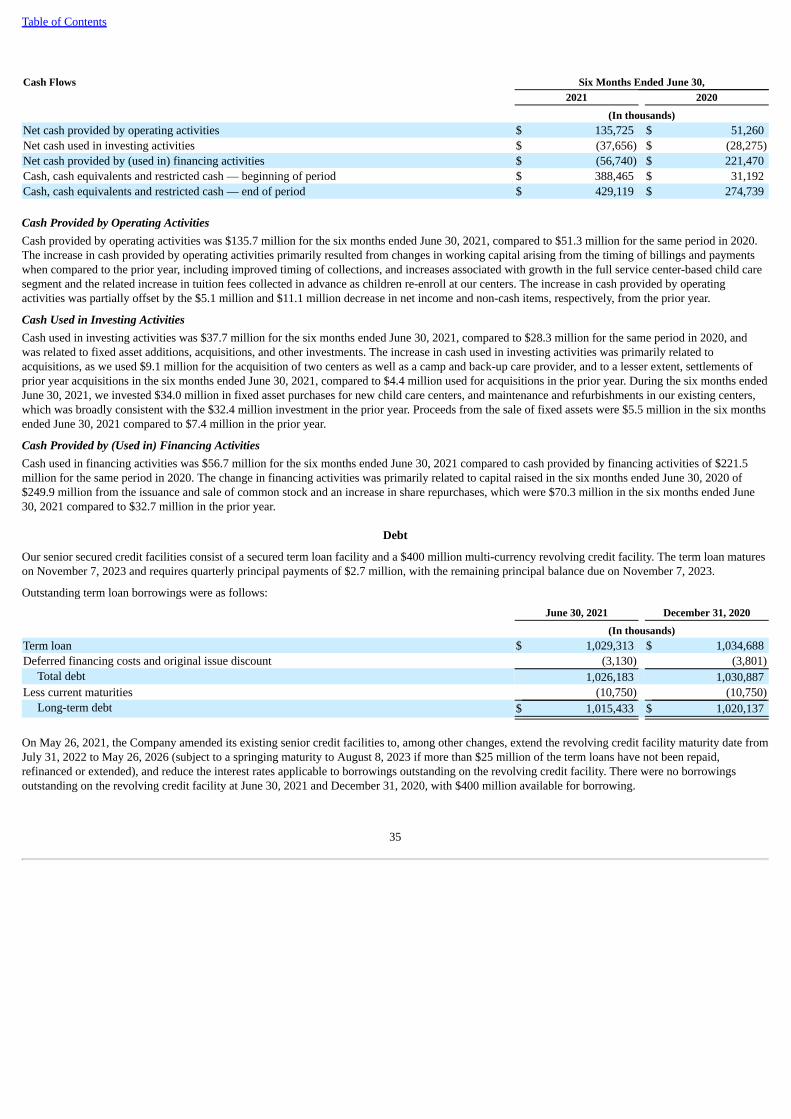
Table of Contents
Cash Flows Six Months Ended June 30,2021 2020
(In thousands)Net cash provided by operating activities $ 135,725 $ 51,260 Net cash used in investing activities $ (37,656) $ (28,275)Net cash provided by (used in) financing activities $ (56,740) $ 221,470 Cash, cash equivalents and restricted cash — beginning of period $ 388,465 $ 31,192 Cash, cash equivalents and restricted cash — end of period $ 429,119 $ 274,739
Cash Provided by Operating ActivitiesCash provided by operating activities was $135.7 million for the six months ended June 30, 2021, compared to $51.3 million for the same period in 2020.The increase in cash provided by operating activities primarily resulted from changes in working capital arising from the timing of billings and paymentswhen compared to the prior year, including improved timing of collections, and increases associated with growth in the full service center-based child caresegment and the related increase in tuition fees collected in advance as children re-enroll at our centers. The increase in cash provided by operatingactivities was partially offset by the $5.1 million and $11.1 million decrease in net income and non-cash items, respectively, from the prior year.
Cash Used in Investing ActivitiesCash used in investing activities was $37.7 million for the six months ended June 30, 2021, compared to $28.3 million for the same period in 2020, andwas related to fixed asset additions, acquisitions, and other investments. The increase in cash used in investing activities was primarily related toacquisitions, as we used $9.1 million for the acquisition of two centers as well as a camp and back-up care provider, and to a lesser extent, settlements ofprior year acquisitions in the six months ended June 30, 2021, compared to $4.4 million used for acquisitions in the prior year. During the six months endedJune 30, 2021, we invested $34.0 million in fixed asset purchases for new child care centers, and maintenance and refurbishments in our existing centers,which was broadly consistent with the $32.4 million investment in the prior year. Proceeds from the sale of fixed assets were $5.5 million in the six monthsended June 30, 2021 compared to $7.4 million in the prior year.
Cash Provided by (Used in) Financing ActivitiesCash used in financing activities was $56.7 million for the six months ended June 30, 2021 compared to cash provided by financing activities of $221.5million for the same period in 2020. The change in financing activities was primarily related to capital raised in the six months ended June 30, 2020 of$249.9 million from the issuance and sale of common stock and an increase in share repurchases, which were $70.3 million in the six months ended June30, 2021 compared to $32.7 million in the prior year.
Debt
Our senior secured credit facilities consist of a secured term loan facility and a $400 million multi-currency revolving credit facility. The term loan matureson November 7, 2023 and requires quarterly principal payments of $2.7 million, with the remaining principal balance due on November 7, 2023.
Outstanding term loan borrowings were as follows:
June 30, 2021 December 31, 2020
(In thousands)Term loan $ 1,029,313 $ 1,034,688 Deferred financing costs and original issue discount (3,130) (3,801)
Total debt 1,026,183 1,030,887 Less current maturities (10,750) (10,750)
Long-term debt $ 1,015,433 $ 1,020,137
On May 26, 2021, the Company amended its existing senior credit facilities to, among other changes, extend the revolving credit facility maturity date fromJuly 31, 2022 to May 26, 2026 (subject to a springing maturity to August 8, 2023 if more than $25 million of the term loans have not been repaid,refinanced or extended), and reduce the interest rates applicable to borrowings outstanding on the revolving credit facility. There were no borrowingsoutstanding on the revolving credit facility at June 30, 2021 and December 31, 2020, with $400 million available for borrowing.
35

Table of Contents
In April and May 2020, we amended our existing senior credit facilities to, among other things, increase the borrowing capacity of our revolving creditfacility from $225 million to $400 million, modify the interest rates applicable to borrowings outstanding on the revolving credit facility, and modify theterms of the applicable covenants.
Borrowings under the credit agreement are subject to variable interest. We mitigate our interest rate exposure with variable-to-fixed interest rate swapagreements with an underlying fixed notional value of $500 million, designated and accounted for as cash flow hedges from inception, that are scheduled tomature on October 31, 2021. The weighted average interest rate for the term loan was 3.06% and 3.31% for the six months ended June 30, 2021 and 2020,respectively, including the impact of the interest rate swap agreements. We have interest rate cap agreements with a total notional value of $800 million,designated and accounted for as cash flow hedges from inception, that provide us with interest rate protection in the event the one-month LIBOR rateincreases above 1%. Interest rate cap agreements for $300 million notional value have an effective date of June 30, 2020 and expire on October 31, 2023,while interest rate cap agreements for another $500 million notional amount have a forward starting effective date of October 29, 2021, which coincideswith the maturity of our existing interest rate swap agreements, and expire on October 31, 2023.
The revolving credit facility requires Bright Horizons Family Solutions LLC, the borrower, and its restricted subsidiaries, to comply with a quarterlymaintenance based financial covenant. A breach of this covenant is subject to certain equity cure rights. The credit agreement governing the senior securedcredit facilities contains certain customary affirmative covenants and events of default. We were in compliance with our financial covenant at June 30,2021. Refer to Note 6, Credit Arrangements and Debt Obligations, in our condensed consolidated financial statements for additional information on ourdebt and credit arrangements, and covenant requirements.
Off-Balance Sheet Arrangements
As of June 30, 2021, we had no off-balance sheet arrangements.
Critical Accounting Policies
For a discussion of our “Critical Accounting Policies,” refer to Part II, Item 7, “Management’s Discussion and Analysis of Financial Condition and Resultsof Operations,” in our Annual Report on Form 10-K for the year ended December 31, 2020. There have been no material changes to our critical accountingpolicies since December 31, 2020.
Item 3. Quantitative and Qualitative Disclosures About Market Risk
We are exposed to market risk from changes in interest rates and fluctuations in foreign currency exchange rates. Other than the broad effects of theCOVID-19 pandemic and its negative impact on the global economy and major financial markets, there have been no material changes in our exposure tointerest rate or foreign currency exchange rate fluctuations since December 31, 2020. See Part II, Item 7A, “Quantitative and Qualitative Disclosures aboutMarket Risk,” in our Annual Report on Form 10-K for the year ended December 31, 2020 for further information regarding market risk.
36

Table of Contents
Item 4. Controls and Procedures
Evaluation of Disclosure Controls and Procedures
As of June 30, 2021, we conducted an evaluation under the supervision and with the participation of management, including our Chief Executive Officerand Chief Financial Officer (our principal executive officer and principal financial officer, respectively), regarding the effectiveness of the design andoperation of our disclosure controls and procedures as defined in Rule 13a-15(e) and 15d-15(e) of the Securities Exchange Act of 1934 (the “ExchangeAct”). The term “disclosure controls and procedures” means controls and other procedures that are designed to ensure that information required to bedisclosed in reports that we file or submit under the Exchange Act is recorded, processed, summarized and reported within the requisite time periods andthat such disclosure controls and procedures were effective to ensure that information required to be disclosed by the Company in the reports that we file orsubmit under the Exchange Act is accumulated and communicated to our management, including our principal executive and principal financial officers, orpersons performing similar functions, as appropriate to allow timely decisions regarding required disclosure. Based on this evaluation, our Chief ExecutiveOfficer and Chief Financial Officer concluded that our disclosure controls and procedures (as defined in Exchange Act Rules 13a-15(e) and 15d-15(e))were effective as of June 30, 2021.
Changes in Internal Control over Financial Reporting
There have been no changes in our internal control over financial reporting that occurred during the quarter ended June 30, 2021 that have materiallyaffected, or are reasonably likely to materially affect, our internal control over financial reporting.
37

Table of Contents
PART II. OTHER INFORMATION
Item 1. Legal Proceedings
We are, from time to time, subject to claims, suits, and matters arising in the ordinary course of business. Such claims have in the past generally beencovered by insurance, but there can be no assurance that our insurance will be adequate to cover all liabilities that may arise out of claims or mattersbrought against us. We believe the resolution of such legal matters will not have a material adverse effect on our financial position, results of operations, orcash flows, although we cannot predict the ultimate outcome of any such actions. Refer to Note 12, Contingencies, to the consolidated financial statementsin Part I, Item 1, of this Quarterly Report on Form 10-Q for additional information.
Item 1A. Risk Factors
Our operations and financial results are subject to various risks and uncertainties, which could adversely affect our business, financial condition andoperating results. We believe that these risks and uncertainties include, but are not limited to, those disclosed in Part I, Item 1A, “Risk Factors,” of ourAnnual Report on Form 10-K for the fiscal year ended December 31, 2020, including with respect to the impacts from the ongoing COVID-19 pandemic.The risks described in our Annual Report on Form 10-K are not the only risks we face. Additional risks and uncertainties, not presently known to us or thatwe currently deem immaterial, may also materially impair our business, financial condition or results of operations. There have been no material changes toour risk factors since our Annual Report on Form 10-K for the year ended December 31, 2020.
Item 2. Unregistered Sales of Equity Securities and Use of Proceeds
Issuer Purchases of Equity Securities
The table below sets forth information regarding purchases of our common stock during the three months ended June 30, 2021:
Period
Total Number ofShares
Purchased(a)
Average PricePaid
per Share(b)
Total Number of SharesPurchased as Part ofPublicly Announced
Plans or Programs (1)(c)
Approximate Dollar Value ofShares that May Yet Be
Purchased Underthe Plans or Programs
(In thousands) (1)(d)
April 1, 2021 to April 30, 2021 — $ — — $ 194,850 May 1, 2021 to May 31, 2021 395,000 $ 135.62 395,000 $ 141,280 June 1, 2021 to June 30, 2021 120,000 $ 139.71 120,000 $ 124,515
515,000 515,000
(1) The board of directors authorized a share repurchase program of up to $300 million of our outstanding common stock effective June 12, 2018. The share repurchaseprogram has no expiration date. All repurchased shares have been retired.
Item 3. Defaults Upon Senior Securities
None.
Item 4. Mine Safety Disclosures
Not applicable.
Item 5. Other Information
Not applicable.
38

Table of Contents
Item 6. Exhibits
(a) Exhibits:
ExhibitNumber Exhibit Title10.1 Sixth Amendment to Credit Agreement, dated as of May 26, 2021, by and among Bright Horizons Family Solutions LLC, Bright
Horizons Capital Corp., the Loan Parties as parties thereto, JPMorgan Chase Bank, N.A., as administrative agent and L/C issuer, andeach Refinancing Revolver Lender as parties thereto (incorporated by reference to Exhibit 99.1 to the Company’s Current Report onForm 8-K, filed May 26, 2021).
31.1* Principal Executive Officer Certification Pursuant to Securities Exchange Act Rules 13a-14(a) and 15d-14(a) as Adopted Pursuant toSection 302 of the Sarbanes-Oxley Act of 2002.
31.2* Principal Financial Officer Certification Pursuant to Securities Exchange Act Rules 13a-14(a) and 15d-14(a) as Adopted Pursuant toSection 302 of the Sarbanes-Oxley Act of 2002.
32.1** Principal Executive Officer Certification Pursuant to 18 U.S.C. Section 1350 as Adopted Pursuant to Section 906 of the Sarbanes-OxleyAct of 2002.
32.2** Principal Financial Officer Certification Pursuant to 18 U.S.C. Section 1350 as Adopted Pursuant to Section 906 of the Sarbanes-OxleyAct of 2002.
101.INS* Inline XBRL Instance Document - the instance document does not appear in Interactive Data File because its XBRL tags are embeddedwithin the Inline XBRL document.
101.SCH* Inline XBRL Taxonomy Extension Schema Document.101.CAL* Inline XBRL Taxonomy Extension Calculation Linkbase Document.101.DEF* Inline XBRL Taxonomy Extension Definition Linkbase Document.101.LAB* Inline XBRL Taxonomy Extension Label Linkbase Document.101.PRE* Inline XBRL Taxonomy Extension Presentation Linkbase Document.104 Cover Page Interactive Data File (formatted as inline XBRL with applicable taxonomy extension information contained in Exhibits 101).
* Exhibits filed herewith.** Exhibits furnished herewith.
39

Table of Contents
SIGNATURES
Pursuant to the requirements of the Securities Exchange Act of 1934, the registrant has duly caused this report to be signed on its behalf by the undersignedthereunto duly authorized.
BRIGHT HORIZONS FAMILY SOLUTIONS INC.Date: August 6, 2021 By: /s/ Elizabeth Boland
Elizabeth BolandChief Financial Officer
(Duly Authorized Officer)
40

Exhibit 31.1
CERTIFICATION OF CHIEF EXECUTIVE OFFICER, BRIGHT HORIZONS FAMILY SOLUTIONS INC.
I, Stephen Kramer, certify that:
1. I have reviewed this quarterly report on Form 10-Q of Bright Horizons Family Solutions Inc.;
2. Based on my knowledge, this report does not contain any untrue statement of a material fact or omit to state a material fact necessary to make thestatements made, in light of the circumstances under which such statements were made, not misleading with respect to the period covered by thisreport;
3. Based on my knowledge, the financial statements, and other financial information included in this report, fairly present in all material respects thefinancial condition, results of operations and cash flows of the registrant as of, and for, the periods presented in this report;
4. The registrant’s other certifying officer and I are responsible for establishing and maintaining disclosure controls and procedures (as defined inExchange Act Rules 13a-15(e) and 15d-15(e)) and internal control over financial reporting (as defined in Exchange Act Rules 13a-15(f) and 15d-15(f))for the registrant and have:
a) Designed such disclosure controls and procedures, or caused such disclosure controls and procedures to be designed under our supervision, toensure that material information relating to the registrant, including its consolidated subsidiaries, is made known to us by others within thoseentities, particularly during the period in which this report is being prepared;
b) Designed such internal control over financial reporting, or caused such internal control over financial reporting to be designed under oursupervision, to provide reasonable assurance regarding the reliability of financial reporting and the preparation of financial statements for externalpurposes in accordance with generally accepted accounting principles;
c) Evaluated the effectiveness of the registrant’s disclosure controls and procedures and presented in this report our conclusions about theeffectiveness of the disclosure controls and procedures, as of the end of the period covered by this report based on such evaluation; and
d) Disclosed in this report any change in the registrant’s internal control over financial reporting that occurred during the registrant’s most recentfiscal quarter (the registrant’s fourth fiscal quarter in the case of an annual report) that has materially affected, or is reasonably likely to materiallyaffect, the registrant’s internal control over financial reporting; and
5. The registrant’s other certifying officer and I have disclosed, based on our most recent evaluation of internal control over financial reporting, to theregistrant’s auditors and the audit committee of the registrant’s board of directors (or persons performing the equivalent functions):
a) All significant deficiencies and material weaknesses in the design or operation of internal control over financial reporting which are reasonablylikely to adversely affect the registrant’s ability to record, process, summarize and report financial information; and
b) Any fraud, whether or not material, that involves management or other employees who have a significant role in the registrant’s internal controlover financial reporting.
Date: August 6, 2021 /s/ Stephen KramerStephen Kramer
Chief Executive Officer

Exhibit 31.2
CERTIFICATION OF CHIEF FINANCIAL OFFICER, BRIGHT HORIZONS FAMILY SOLUTIONS INC.
I, Elizabeth Boland, certify that:
1. I have reviewed this quarterly report on Form 10-Q of Bright Horizons Family Solutions Inc.;
2. Based on my knowledge, this report does not contain any untrue statement of a material fact or omit to state a material fact necessary to make thestatements made, in light of the circumstances under which such statements were made, not misleading with respect to the period covered by thisreport;
3. Based on my knowledge, the financial statements, and other financial information included in this report, fairly present in all material respects thefinancial condition, results of operations and cash flows of the registrant as of, and for, the periods presented in this report;
4. The registrant’s other certifying officer and I are responsible for establishing and maintaining disclosure controls and procedures (as defined inExchange Act Rules 13a-15(e) and 15d-15(e)) and internal control over financial reporting (as defined in Exchange Act Rules 13a-15(f) and 15d-15(f))for the registrant and have:
a) Designed such disclosure controls and procedures, or caused such disclosure controls and procedures to be designed under our supervision, toensure that material information relating to the registrant, including its consolidated subsidiaries, is made known to us by others within thoseentities, particularly during the period in which this report is being prepared;
b) Designed such internal control over financial reporting, or caused such internal control over financial reporting to be designed under oursupervision, to provide reasonable assurance regarding the reliability of financial reporting and the preparation of financial statements for externalpurposes in accordance with generally accepted accounting principles;
c) Evaluated the effectiveness of the registrant’s disclosure controls and procedures and presented in this report our conclusions about theeffectiveness of the disclosure controls and procedures, as of the end of the period covered by this report based on such evaluation; and
d) Disclosed in this report any change in the registrant’s internal control over financial reporting that occurred during the registrant’s most recentfiscal quarter (the registrant’s fourth fiscal quarter in the case of an annual report) that has materially affected, or is reasonably likely to materiallyaffect, the registrant’s internal control over financial reporting; and
5. The registrant’s other certifying officer and I have disclosed, based on our most recent evaluation of internal control over financial reporting, to theregistrant’s auditors and the audit committee of the registrant’s board of directors (or persons performing the equivalent functions):
a) All significant deficiencies and material weaknesses in the design or operation of internal control over financial reporting which are reasonablylikely to adversely affect the registrant’s ability to record, process, summarize and report financial information; and
b) Any fraud, whether or not material, that involves management or other employees who have a significant role in the registrant’s internal controlover financial reporting.
Date: August 6, 2021 /s/ Elizabeth BolandElizabeth Boland
Chief Financial Officer

Exhibit 32.1
CERTIFICATION PURSUANT TO18 U.S.C. SECTION 1350
AS ADOPTED PURSUANT TOSECTION 906 OF THE SARBANES-OXLEY ACT OF 2002
In connection with the Quarterly Report of Bright Horizons Family Solutions Inc. (the “Company”) on Form 10-Q for the quarter ended June 30, 2021, asfiled with the Securities and Exchange Commission on the date hereof (the “Report”), I, Stephen Kramer, Chief Executive Officer of the Company, certify,pursuant to 18 U.S.C. §1350, adopted pursuant to §906 of the Sarbanes-Oxley Act of 2002, that based on my knowledge:
1) the Report fully complies with the requirements of Section 13(a) or 15(d) of the Securities Exchange Act of 1934, as amended; and
2) the information contained in the Report fairly presents, in all material respects, the financial condition and results of operations of the Company.
Date: August 6, 2021 /s/ Stephen KramerStephen Kramer
Chief Executive Officer
A signed original of this written statement required by Section 906, or other document authenticating, acknowledging, or otherwise adopting the signaturethat appears in typed form within the electronic version of this written statement required by Section 906, has been provided to Bright Horizons FamilySolutions Inc. and will be retained by Bright Horizons Family Solutions Inc. and furnished to the Securities and Exchange Commission or its staff uponrequest.

Exhibit 32.2
CERTIFICATION PURSUANT TO18 U.S.C. SECTION 1350
AS ADOPTED PURSUANT TOSECTION 906 OF THE SARBANES-OXLEY ACT OF 2002
In connection with the Quarterly Report of Bright Horizons Family Solutions Inc. (the “Company”) on Form 10-Q for the quarter ended June 30, 2021, asfiled with the Securities and Exchange Commission on the date hereof (the “Report”), I, Elizabeth Boland, Chief Financial Officer of the Company, certify,pursuant to 18 U.S.C. §1350, adopted pursuant to §906 of the Sarbanes-Oxley Act of 2002, that based on my knowledge:
1) the Report fully complies with the requirements of Section 13(a) or 15(d) of the Securities Exchange Act of 1934, as amended; and
2) the information contained in the Report fairly presents, in all material respects, the financial condition and results of operations of the Company.
Date: August 6, 2021 /s/ Elizabeth BolandElizabeth Boland
Chief Financial Officer
A signed original of this written statement required by Section 906, or other document authenticating, acknowledging, or otherwise adopting the signaturethat appears in typed form within the electronic version of this written statement required by Section 906, has been provided to Bright Horizons FamilySolutions Inc. and will be retained by Bright Horizons Family Solutions Inc. and furnished to the Securities and Exchange Commission or its staff uponrequest.