Embed Size (px)
Citation preview

1
ECOLE POLYTECHNIQUE FEDERALE DE LAUSANNE FACULTE DES SCIENCES DE LA VIE
Master Project in Bioengineering and Biotechnology
MECHANOELECTRIC FEEDBACK IN CARDIOMYOCYTE MONOLAYERS AND
WHOLE HEARTS IN RESPONSE TO STRETCH
Achieved in the Cardiac Mechanics Research Group at UCSD Under the supervision of
Principal Investigator Dr. Andrew McCulloch and Supervisor Adam Wright
by
BARBARA MURIENNE
Under the direction of Professor Nikolaos Stergiopulos
From the Laboratory of Hemodynamics and Cardiovascular Technology at EPFL
SAN DIEGO, UCSD 2008-2009

2
Contents Contents......................................................................................................................................2 Abstract ......................................................................................................................................3 1. Introduction.............................................................................................................................4 2. Theory ....................................................................................................................................6
2.1 The heart...........................................................................................................................6 2.2 Photolithography.............................................................................................................11 2.3 Stretch devices ................................................................................................................12 2.4 Electrodes .......................................................................................................................13 2.5 Optical mapping..............................................................................................................14 2.6 Post-processing of the optical signals...............................................................................17 2.7 Immunostaining ..............................................................................................................21
3. Materials and methods...........................................................................................................22
3.1 Cardiomyocyte isolation..................................................................................................22 3.2 Photolithography.............................................................................................................22 3.3 Fabrication of micropatterned elastic silicone membranes................................................23 3.4 Cardiomyocyte culture on micropatterned elastic silicone membranes .............................24 3.5 Staining procedure design for optical mapping of cardiomyocyte monolayers..................25 3.6 Electrode design and cardiomyocyte monolayer pacing ...................................................26 3.7 Immunostaining ..............................................................................................................27 3.8 Temperature and oxygenation setup design......................................................................27 3.9 Stretcher calibration ........................................................................................................29 3.10 Optical setup for cardiomyocyte monolayer imaging .....................................................29 3.11 Acquisition setup...........................................................................................................30 3.12 Extraction of activation time, repolarization, APD and CV values..................................31
4. Results ..................................................................................................................................32
4.1 Cardiomyocyte culture on silicone micropatterned membranes........................................32 4.2 Staining and optical signal recording ...............................................................................33 4.3 Making new micropatterned silicon wafers......................................................................34 4.4 Cardiomyocyte pacing.....................................................................................................36 4.5 Analysis ..........................................................................................................................38 4.6 Immunostaining ..............................................................................................................39 4.7 Design of a temperature control system ...........................................................................41 4.8 Stretcher calibration ........................................................................................................42 4.9 Optical mapping experiments ..........................................................................................42
5. Discussion.............................................................................................................................45 6. Conclusion ............................................................................................................................49 References ................................................................................................................................50 Acknowledgments.....................................................................................................................53

3
Abstract
Stretch has been shown to induce electrophysiological changes in the whole heart and
cardiomyocyte monolayer models. However, the mechano-electric mechanisms responsible for
these changes are still not completely understood.
In this project, micropatterned cardiomyocyte monolayers were anisotropically stretched in order
to investigate two hypotheses: the increase in action potential duration (APD) and decrease in
conduction velocity (CV) in response to stretch and the effect of stretch-activated channel
blockers on these electrophysiological changes.
The results obtained showed a decrease in APD in response to stretch in all experiments.
Regarding CV, a decrease during propagation in the longitudinal direction (along the long axis of
the aligned cardiomyocytes) and an increase during propagation in the transverse direction (along
the short axis of the aligned cardiomyocytes) were observed in response to stretch. These
electrophysiological changes did not seem altered by the presence of 70 µM and 85 µM
streptomycin. However, the results for the APD have to be considered with caution due to
limitations of the data analysis procedure.

4
1. Introduction
Nowadays, heart diseases affect more and more people all over the world. In fact, coronary
heart disease, stroke, high blood pressure, heart failure and other heart- and blood vessel-related
problems are a major cause of death in the United States, where one out of three adults suffer
from one or more types of cardiovascular disease [38]. Consequently, understanding the
underlying biological mechanisms in the heart is important and crucial to develop new treatments
for cardiac diseases.
A mechanical disturbance in the environment of a cardiac cell, produced by the application
of an external load, induces a change in the cell length and tension. In response to this
modification, a feedback loop alters the excitation of the cell, thus controlling its mechanical
contraction and consequently its length and tension [26]. This contraction-excitation coupling,
called mechanoelectric feedback (MEF), is thought to play an important role in the generation of
electrical instability in the heart, such as arrhythmias, due to environmental and mechanical
disturbances. Mechanical stretch of myocardial tissue induces immediate as well as chronic
responses. Acute mechanical stretch has been shown to induce depolarization of the cell
membrane and modification of the action potential. These electrophysiological changes may be
related to the activation of mechano-sensitive ion channels and may contribute to the genesis of
stretch-induced arrhythmias [36]. Chronic stress on the heart has been shown to induce the
activation of gene expression, followed by the initiation of remodelling processes leading to
hypertrophy. Hypertrophy may contribute to the electrical instability of the heart by increasing
the sensitivity of mechano-sensitive channels [36]. Stretch can occur in the cardiac tissue for
example, if there are heterogeneities in the tissue electrical properties or contractibility, or if there
is a block in the conduction system, resulting in one part of the heart contracting before the other.
Preliminary studies, performed on isotropic cardiomyocyte monolayers [47] as well as on
whole hearts [42], have shown an increase in the action potential duration (APD) as well as a
decrease in the conduction velocity (CV) in response to stretch for both models. These similar
responses are thought to be due to the stretch-activated channels (SACs) [36]. Consequently, the
use of SAC blockers, such as streptomycin or gadolinium, could allow one to investigate the role
of these channels in the electrophysiological changes observed. Gadolinium has been shown to
reduce or suppress stretch-activated inward current ISAC in ventricular myocytes of various
species [25; 46] and to suppress stretch-related transient depolarization and extrasystoles in
isolated canine ventricles [19]. However, it has also been shown to block other channels such as

5
the L-type Ca2+ channels in guinea-pig isolated ventricular myocytes [28], which makes it a
potential but not ideal candidate as a SAC blocker. On rabbit hearts [42] streptomycin was used
as a SAC blocker but the same electrophysiological changes were observed: a decrease in CV and
an increase in APD. However, used on isolated guinea pig ventricular myocytes, streptomycin has
been shown to reverse the large stretch-induced increase in intracellular Ca2+ concentration that
might be associated with heart arrhythmias, without blocking the L-type Ca2+ channels [17].
Two hypotheses can thus be considered: either streptomycin did not work in blocking the SACs
in the rabbit heart or the SACs are not directly responsible for the electrophysiological changes
observed in response to stretch.
The goal of this project is to study mechanoelectric feedback under anisotropic stretch
conditions using both micropatterned cardiomyocyte monolayer and whole heart models,
focusing on the use of efficient optical mapping techniques to obtain exploitable and relevant
data. The protocols for pacing, staining and optical mapping of cardiomyocyte monolayers have
first to be fully characterized whereas those for whole hearts have already been defined and
shown to work. Optical mapping is a tool of major importance as it allows one to record action
potentials from multiple sites, simultaneously and in a non-invasive manner. The advantage of the
cardiomyocyte monolayer as a model is that a cell monolayer is an intermediate between a single
cell and a whole organ, making parameters such as cell substrate, organization, alignment, and
shape easier to control, while keeping a certain level of complexity. Regarding the results found
in the literature, two hypotheses lead this project. The first one is that the APD increases whereas
the CV decreases in response to stretch. This hypothesis has already been confirmed for non-
patterned cardiomyocyte cultures [47] but needs to be demonstrated for micropatterned ones. The
second hypothesis is that the presence of a SAC blocker such as streptomycin may induce a
suppression of the APD increase in response to stretch, while having no effect on the CV
decrease. This hypothesis suggests that the molecular mechanisms related to the APD and CV
changes in response to stretch might be different and that the CV decrease may not be exclusively
due to the SACs.

6
2. Theory
2.1 The heart
2.1.1 Generalities
The heart is a vital organ found in all vertebrates, which is responsible for pumping blood
throughout the body, thus bringing oxygen to all tissues and taking away metabolic byproducts.
The cardiac muscle tissue is an involuntary muscle tissue, meaning its contraction is not
controlled by the nervous system, although its beating frequency and contraction strength are.
The ability of the heart to independently initiate its own beats and the regularity of its pacing
activity are called automaticity and rhythmicity respectively [2].
2.1.2 Initiation of cardiac contraction
Several structures of the heart play an important role in the initiation of cardiac contraction.
The sinoatrial node (SA node) and two or three sites located next to it are responsible for
the initiation of impulses that induce cardiac contraction. This spontaneous depolarization of the
cardiac tissue is due to the plasma membranes of the SA node cells which have pacemaker
channels. These channels are hyperpolarization-activated and have a reduced permeability to
potassium ions but allow the passive transfer of calcium and sodium ions, which induces the
creation of a net charge [2]. The impulses generated are propagated from the SA node to the atria
before it finally reaches the atrioventricular node (AV node). The wave of excitation then travels
very slowly through the AV node as it is composed of slow-response fibers. The delay between
atrial and ventricular depolarization is the time needed for the atrial contraction to fill the
ventricles. When the AV junction is unable to conduct the cardiac impulse from atria to
ventricles, pacemakers in the Purkinje fiber network initiate the ventricular contractions.
However, these contractions occur at low frequencies and are usually not sufficient for the heart
to pump the required quantity of blood out to the body. The electrical impulses are transmitted
from the AV node to the Purkinje fibers through the His-bundle, also called AV bundle [2].
Ectopic pacemakers, which are automatic cells different from the ones of the SA node
found in the atrium, AV node, or His-Purkinje system, constitute a safety mechanism when
normal pacemaking centers stop functioning. They have the ability to create propagated cardiac
impulses when normal rhythmic pacemaker cells are suppressed. However, in some cases, the

7
rhythmicity of the ectopic foci can be abnormally enhanced, inducing abnormal impulses by slow
diastolic depolarization of these automatic cells or by after-depolarizations that reach threshold
[2].
2.1.3 Action potentials
When depolarization of specific sites of the heart reaches a certain threshold, action
potentials (APs) are generated. The various phases of the cardiac action potential are associated to
changes in the cell membrane permeability, mainly to K+, Na+ and Ca++ ions. Two action
potential repolarization periods can be distinguished: the absolute and relative refractory periods
(ARP and RRP respectively). During the ARP, the myocardial cell cannot be depolarized again
because the voltage-sensitive gates have not completed their opening/closing cycle. During the
RRP, the generation of an action potential is inhibited, however it can happen that an action
potential occurs due to a greater electrical stimulus than the one originally needed. The RRP ends
when the membrane has returned to its resting potential [2].
There are two main types of action potentials that may be recorded from cardiac cells:
fast- and slow-response APs. Fast-response APs are mainly recorded from atrial, ventricular and
Purkinje fibers and show a steep upstroke due to the opening of the fast Na+ channels. Slow-
response APs are recorded from normal SA and AV cells as well as from abnormal myocardial
cells that have been depolarized and have a less steep upstroke generated by the activation of Ca++
channels. Differences also exist regarding the AP shape depending on the part of the heart
considered and the action potential frequency [2].
2.1.4 Calcium and contraction
Two types of Ca2+ channels can be found in the cardiac muscle cell membrane : the L-
type and T-type Ca2+ channels, which are both voltage-sensitive channels. L-type channels (L for
long-lasting) are important for sustaining action potentials as they respond to higher membrane
potentials, open more slowly but stay open longer than the T-type channels. The T-type channels
(T for transient) are found mostly in pacemaker cells as they are important for initiating action
potentials [53].
In non-pacemaker cardiac muscle cells, calcium starts entering the intracellular
compartment at the end of the depolarization phase and then continues throughout the plateau
phase, through the L-type calcium channels. This inflow of Ca2+ inside the cell induces a release
of Ca2+ from the sarcoplasmic reticulum and other subsarcolemmal sites [24]. When the cardiac

8
muscle is in its excited state, the intracellular Ca2+ can bind to troponin and induce a
conformational change of the molecule, leading to a displacement of tropomyosin which is
present on the actin filaments. The displacement of tropomyosin allows myosin to link actin
filaments, thus inducing contraction [52]. A decrease in [Ca2+]i is then required for the cardiac
muscle relaxation to occur as Ca2+ needs to dissociate from troponin so that the molecule returns
to its initial conformation, where tropomyosin blocks myosin cross-bridge attachment sites again.
Ca2+ is removed from the intracellular compartment mostly via a reuptake into the sarcoplasmic
reticulum permitted by a SR Ca2+-ATPase but also via a sarcolemmal Na+/Ca2+-exchanger and
Ca2+-ATPase present on the sarcolemma, as well as a mitochondrial Ca2+-uniporter. The
Na+/K+ pump makes Na+ exit the cell and thus ensures that there is enough extracellular Na+ for
the Na+/Ca2+ to work and uptake Na+ while releasing Ca2+ outside the cell [3; 24]. Figure 1
summarizes the Ca2+ transport in ventricular myocytes.
Figure 1. Ca2+ transport in ventricular myocytes [3].
Inset shows the time course of an action potential, Ca2+ transient and contraction measured in a rabbit ventricular myocyte at 37 °C. NCX, Na+/Ca2+ exchange; ATP, ATPase; PLB, phospholamban; SR, sarcoplasmic reticulum.
2.1.5 ECG and arrhythmias
An electrocardiogram (ECG) is an electrical recording of the propagation of the cardiac
impulse through the heart and is recorded from the surface of the body using electrodes. The main
waves that constitute a normal electrocardiogram are : the P wave, the QRS complex and the T
wave as shown in Figure 2.

9
Figure 2. Main waves of a normal electrocardiogram [48].
The P-wave is the wave of electric depolarization that spreads from the SA node throughout the
atria. The brief isoelectric, zero voltage, period that occurs right after the P-wave corresponds to
the time needed for the electric impulse to travel through the AV node and His-bundle. In
humans, if the P-R interval seems to last more than 0.2 second, there might exist an AV
conduction block. The QRS complex represents the ventricular depolarization. If this complex is
prolonged and seems to last more than 0.1 second in humans, the ventricular conduction may be
impaired. This defect can be due to a bundle branch block or the firing of ectopic foci, which
usually results in the propagation of the generated impulses through slower pathways. The S-T
segment is an isoelectric, zero-voltage, period representing the time needed for the entire
ventricle to be depolarized. This period corresponds to the plateau phase of the ventricular
cardiomyocyte action potential. The T-wave is the wave of ventricular repolarization. The U
wave is thought to correspond to the repolarization of the papillary muscles or Purkinje fibers but
is not always seen on the electrocardiogram [50].
Arrhythmias are problems affecting the electrical activity of the heart. They induce
abnormal heart rhythms and make the heart pump less effectively. If arrhythmias last for some
time, they may affect the whole heart rhythm, making it too fast, too slow or unstable, which may
have huge consequences. Arrhythmias can happen if the natural pacemaker of the heart starts
developing an abnormal rhythm or if another part of the heart, as an ectopic pacemaker, starts
firing although the normal pacemaker is functioning normally. It can also occur if the normal
electrical conduction pathway is interrupted or if nearby sites present a big difference in their
action potential duration, which may induce reentry. The mechanism for reentry is shown in
Figure 3.

10
Figure 3. Normal electrical conduction versus reentry [49].
In a normal tissue, as represented in the top image of Figure 3, the action potential generated
travels down along both branches 1 and 2 of the conducting pathway. The electrical impulses then
propagate into branch 3 towards opposite directions or cancel each other. In case of an abnormal
tissue, reentry may occur, as represented in the bottom image of Figure 3. This can be due to a
blocking element (grey region) within one branch, which allows the electrical propagation to
travel only in one direction, and to a difference in tissue excitability at the time of propagation.
As shown in the bottom image of Figure 3, no impulse can travel down through branch 2 because
of the blocking element and the only pathway for an impulse is down branch 1, through branch 3
and eventually up via branch 2. After crossing the blocking element, if the impulse finds excitable
tissue, it will continue its propagation and travel again via branch 1, describing a loop. If it finds
non-excitable tissue, meaning a tissue still in its refractory period, the impulse will die [49].
2.1.6 Stretch-activated ion channels
Stretch-activated channels (SACs) provide a simple mechanism to explain
mechanosensitivity, although it has not yet been proved in vivo. When a cell is mechanically
stimulated, SACs open as they are directly gated by mechanical stimulation and allow the
mechanical signal to be converted into an electrochemical flux [23]. All SACs found in the heart
are cation-selective and have been found in both ventricular and atrial cells, in both tissue-
cultured and freshly isolated cells. Most of them are non-selective channels which are weakly
selective to monovalent cations and permeable to divalent cations such as Ca2+ [23].
In stretched ventricular myocytes, the intracellular calcium concentration ([Ca2+]i) has
been shown to increase during rest. This increase in [Ca2+]i is potentially caused by either the

11
direct entry of Ca2+ via stretch-activated non-selective ion channels or their indirect entry due to
a Na+ influx via non-selective mechanosensitive cation channels, which in turn raises [Ca2+]i via
the Na+/Ca2+ exchanger [29]. These non-selective ion channels, which allow Ca2+ and Na+ to
enter the cells and thus contribute to the [Ca2+]i increase, have a reversal potential less negative
than the resting membrane potential. This less negative reversal potential allows an inward
current flow to depolarize the cells in diastole and trigger stretch-induced arrhythmias, with
alteration of the action potential and premature ventricular excitations [20; 23]. In 2000, Zeng
also suggested that voltage-dependent K+, Na+ or Ca2+ channels might not be responsible for the
mechano-sensitive currents observed and that Cl- selective SACs also exist but do not seem to
play a major role in the stretch-activated current generated [46].
Pharmacological studies have revealed a few SAC blockers such as Gd3+, amiloride and
its derivatives, streptomycin and some voltage-sensitive channels blockers. Gd3+ is the best
known and has been shown to be effective as a blocker of SACs. However, Gd3+ does not block
all SACs and is not completely specific for them as it blocks other channels as well, such as
certain voltage-sensitive Ca2+ channels [23]. Streptomycin has been shown to reverse the large
increase in intracellular Ca2+ concentration without blocking the L-type Ca2+ channels in
guinea-pig isolated ventricular myocytes [17]. A new possible SACs blocker has also been found
in the venom of the Grammastola spatulata spider. It has first been shown to block mechanical
transduction in GH3 neurons, Xenopus oocytes and chick heart cells [34]. This new peptide is
thought to be the present most specific SAC blocker and has been shown to block stretch-induced
arrhythmias as well as stretch-induced changes in the action potential in isolated hearts [33].
2.2 Photolithography
Photolithography in the MEMS or microfabrication field is a process used to generate
micropatterns by selectively exposing some parts of a photosensitive material spread on a
substrate to a light radiation, as shown in Figure 4.

12
Figure 4. Photolithography process [51].
The substrate, for example a silicon wafer, is coated with a photoresist and exposed to a light
source through a mask. The mask defines the micropatterns by only allowing only some parts of
the photoresist to be exposed to the light source. The photoresist is a light-sensitive material
which can be positive or negative and changes its properties depending on its exposure to light.
During the development, either the exposed or unexposed parts of the resist are removed. For a
positive resist, the developer removes the parts of the resist exposed to light, whereas for a
negative resist, only the exposed parts stay. Other processes such as etching and lift-off can also
be used after photolithography to create different structures. Etching is the process of transferring
a pattern from the photoresist to the layer below it, whereas lift-off transfers the photoresist
pattern to the layer above it [51]. Using different masks and techniques, several patterns can be
combined on a single object to create a more complex structure.
2.3 Stretch devices
Stretch devices are designed to stretch cells that have been previously cultured on elastic
membranes as monolayers. Each device consists of three concentric cylinders: an indenter ring, a
membrane holder with an O-ring and a screw-top as shown on Figure 5 (a,c). There exists two
different types of stretch devices, circular stretchers which induce isotropic stretch and elliptical
stretchers which induce anisotropic stretch as represented on Figure 5 (b,d). The elastic

13
membrane, which forms the bottom of the stretch device, serves as culture substrate for the plated
cells and to which stretch is applied, is maintained on the membrane holder with an O-ring.
Rotations of the screw-top make it push on the indenter ring, which in turn pushes down inside
the membrane-holding ring, thus inducing a stretch of the elastic membrane and consequently of
the cultured cells attached [7].
Figure 5. Circular (a,b) and elliptical (c,d) stretch devices for the culture of micropatterned cells [7].
a. Components of the circular stretch device. b. Stretch induced by the circular stretch device. c. Components of the elliptical stretch device. d. Stretch induced by the elliptical stretch device.
As a specific correlation exists between the screw-top rotation and the elastic membrane stretch,
calibration of each device must be performed before the beginning of the stretching experiments.
This specific correlation, although it is different for each stretch device, must be precisely
determined in order to exactly know the percentage of stretch corresponding to a particular angle
of rotation of the screw-top.
2.4 Electrodes
Several types and configurations of electrodes exist and are used for different purposes.
Monopolar electrodes are electrodes with a single working wire. They are usually used with
monophasic stimulation. Bipolar electrodes are a pair of working wires. They are usually used to
attenuate the shock (stimulus) artifact. A bipolar configuration is generally used with biphasic
pulses so that each tip serves as the anode half the time. Several bipolar electrode configurations
exist such as the side-by-side tips, staggered tips and concentric electrodes. In both cases, the
orientation of electrode tip(s) as well as their size and shape are very important and should always
be reported [35].

14
2.5 Optical mapping
2.5.1 Generalities
For our purpose, optical mapping includes the use of an ion-specific or voltage-sensitive
dye to track specific phenomena optically. This imaging technique is based on light-tissue
interactions, such as photon scattering, absorption, fluorescence, which are dependent on the light
wavelength and thus limit the spatiotemporal resolution of the images.
2.5.2 Staining
In cardiac studies, fluorescent probes are usually used because they yield higher fractional
changes in signal per each voltage variation than others. Longer wavelengths are generally
preferred in case of optical recordings from deep inside the myocardial wall, as light absorption
and scattering decreases with longer wavelengths. A classification of voltage-sensitive dyes into
two groups, the fast and slow dyes, based on their response time and molecular mechanism of
voltage sensitivity, was introduced by Cohen and Salzberg in 1978. Only the fast probes are used
in cardiac studies as they allow one to detect voltage changes on a time scale of microseconds.
One of the most important families of dyes is the styryl dye family. In case of action potentials
recordings, the styryl dyes di-4-ANEPPS, di-8-ANEPPS and RH-237, which can be excited using
visible light, are widely used [14].
Voltage-sensitive ANEP dyes have very interesting properties. They modify their
electronic structure and thus fluorescence spectra in response to changes in the surrounding
electric field. Their optical response is fast enough to detect transient potential changes in
excitable cells including cardiac cells and tissue preparations. They also show a potential-
dependent shift in excitation spectra allowing the quantization of membrane potential using
excitation ratio measurements. Ratiometric measurements are usually used to correct unequal dye
loading, bleaching and focal-plane shift, as the ratio of two fluorescent signals does not depend
on their absolute intensities. Their absorption and fluorescence spectra are highly dependent on
their environment and they are essentially non-fluorescent in water and become strongly
fluorescent when binding to membranes. Di-4-ANEPPS and di-8-ANEPPS are voltage-sensitive
dyes which are commonly used in cardiac studies. The di-4-ANEPPS dye has a uniform 10 % per
100 mV change in fluorescence intensity as well as the most consistent potentiometric response in
different cell and tissue type among the other ANEP dyes. The di-8-ANEPPS dye, which spectra

15
when bound to a phospholipid bilayer is shown on Figure 6, has been shown to have properties
changing linearly with membrane voltage variations, making it very useful for optical
investigation of transmembrane voltage fluctuations [15]. Moreover, it is less susceptible to
internalization than the di-4-ANEPPS dye, allowing extended observation periods [57].
Figure 6. Absorption and fluorescence spectra of di-8-ANEPPS bound to phospholipid bilayer membranes [57].
Other types of dyes exist, such as the ion-sensitive dyes. In cardiac studies, calcium-
sensitive dyes, such as Fura-2 and Indo-1, are widely used to detect calcium transients in cardiac
cells and allow ratiometric fluorescence measurements.
2.5.3 Light detectors
Three main categories of multiple site light detectors exist: charged-coupled device (CCD)
cameras, photodiode arrays (PDAs) and metal-oxide semiconductor (CMOS) cameras. The
choice of a light detector is based on several criteria: its spatial resolution, which depends on the
number of pixels of the detector, its temporal resolution which is the number of frames per
seconds and its sensitivity, which varies according to the level of three classes of noise, dark
noise, shot noise and readout noise. CCD cameras have a high spatial resolution, due to the large
number of pixels present on the CCD sensor but a relatively lower rate of data acquisition. They
also have a good signal-to-noise ratio due to a high quantum efficiency and a low background
noise level. However, their dynamic range is determined by the accuracy of the A/D conversion
and the saturation of the sensor depending on the light levels detected. CCD cameras are mostly
used for whole heart optical mapping. In case of cell culture optical mapping, PDAs are generally
used because they produce signals having a high SNR and provide a good temporal resolution.
Moreover, PDAs have a larger pixel size than CCD cameras, allowing them to produce useful
signals even at high rates and under low-light condition, which is usually the case when imaging
cultured cells. The primary disadvantage of PDA systems is a relatively lower spatial resolution.
CMOS cameras are a new emergent family of cameras having a high-speed image acquisition and
16
a quantum efficiency comparable with the CCD cameras, which seem to combine high temporal
and spatial resolution and which could become the new detector system used in cardiac studies in
the future [14; 15].
2.5.4 Data acquisition
Data acquisition for optical mapping can be performed using the MiCAM ultima imaging
system. This system has been originally developed for brain investigations, via the collaboration
of Riken, Stanley and Brain Vision, which are all brain or research institutes and is nowadays also
used in the cardiovascular field of research. The MiCAM ultima system is a powerful tool for
data acquisition as it can take 10,000 images per second, has a resolution of 100x100 pixels and
can be controlled via a computer having the MiCAM ultima software installed [58].
2.5.5 Calibration
Calibration of the optical signal for voltage-sensitive experiments, meaning the
establishment of the correlation between the fluorescence detected and the changes in the cell
membrane potential, is generally not performed. In fact, as action potentials have a quite constant
amplitude due to their “all-or-nothing nature” [15], only the relative change in fluorescence ∆F/F
is usually calculated. Calibration of the optical signal for calcium-sensitive experiments is
generally performed using ratiometric measurements, as exact values of free calcium
concentration and concentration of calcium bound to cell membranes are needed. In fact, the
excitation (or emission) spectrum of a ratiometric dye changes according to a parameter of
interest (ex: free calcium), so that the variations of this parameter is measured as the ratio
between two fluorescence intensity values taken at two different wavelengths.
2.5.6 Advantages
The advantages of optical mapping are that it allows to record action potentials from
multiple sites, simultaneously, in a non-invasive manner and to generate maps of action potential
propagation. The study of activation sequences during rapid or low-level depolarizations, using
arrays of surface electrodes, is much more difficult and sometimes leads to uncertain results.
Moreover, the non-contact aspect of optical recording is very important in MEF studies to prevent
experimental artifacts.

17
2.6 Post-processing of the optical signals
2.6.1 Pre-processing
An optical signal is obtained from each pixel of the heart surface for the time of a run and
is first inverted to better represent an action potential. A raw optical action potential has its
upstroke downwards, as represented in Figure 7, because depolarization of myocardial tissue
induces a decrease in the dye fluorescence intensity in the red spectrum recorded.
Figure 7. Representative raw optical action potential from a single pixel location [41].
The background diastolic intensity value is then calculated by taking median value of all points
within the lowest 20% of the signal range and the signal is normalized by calculating ∆F/F, which
represents the change in fluorescence compared to background diastolic signal [41]. The resulting
signal is shown in Figure 8.
Figure 8. Signal after inversion and normalization [41].
2.6.2 Filtering
First, a spatial filtering, using a 5x5 Gaussian convolution kernel, is applied to the signals
in order to reduce noise. As the optical signals vary in time and space, a phase correlation
technique is used to correct the time shift prior to applying the spatial filtering [41]. A kernel
filter works by applying a kernel matrix to every pixel of the image. The kernel has a certain size
and contains multiplication factors to be applied to the pixel of interest as well as its neighbors.
Once all values considered have been multiplied, the value of the pixel of interest is replaced by

18
the sum of the products. Spatial filtering of an image is the process of modifying each pixel value
based upon its neighboring pixel values. This filtering has to be done for all images of one run.
Temporal filtering using either centered median filters, low-pass Kaiser window filter or
mean-value filter is then performed [41]. A median filter is generally used to reduce noise and
usually does better job than a mean filter in preserving action potential morphology. Temporal
filtering of a stack of images is the process of modifying the sequence of images based upon its
temporal sequence of values. It involves looking at one pixel at a time over the time course of the
run and has to be done for all pixels.
The signal resulting from the phased-shift spatial filtering and temporal filtering is shown
in Figure 9.
Figure 9. Final filtered signal [41].
2.6.3 Feature extraction
•••• Maps of activation, repolarization and APD
Maps of activation, repolarization and APD time can be created from the optical signals
obtained, as represented in Figure 10 (a,b,c). In 2001, maps of activation, repolarization and ADP
were generated by Sung et al., with and without phase-shifting as well as with different kernel
sizes, and compared. The best signal was obtained using the 7×7 kernel filter but the signal
quality was only slightly better than with the 5×5 kernel and the computational cost was greater
[41].

19
a. b. c. Figure 10. a. Activation map. b. Repolarization map. c. APD map [41].
One map is obtained for each beat. The activation time is identified as the time at which the first
derivative of the action potential upstroke is maximal. Repolarization time and APD are different,
the APD is calculated with respect to the AP upstroke, whereas the repolarization time is
determined with respect to the range defined, as shown in Figure 11.
time
∆F/F
APD1 APD2
80% repol. for AP1
80% repol. for AP2
repol. time 1 repol. time 2 Legend:
AP upstroke time detected when the 1st derivative of the AP upstroke slope is maximum
left boundary of the defined range
repol.=repolarization
action potential
Figure 11. APD versus repolarization time.
For AP repolarization time, the peak of the signal following upstroke is first identified and the
time at which the optical action potential has recovered 80% from peak value is then calculated.
The AP repolarization time is then calculated as the time between the time of the range left
boundary and the repolarization time. The APD maps are obtained by simple subtraction of the
activation time from the 80% repolarization time at each pixel [41].
•••• Maps of conduction velocity vector field and magnitude
The vector field calculation is performed for each map (each beat). An example of a map
showing a velocity vector field is represented in Figure 12.
20
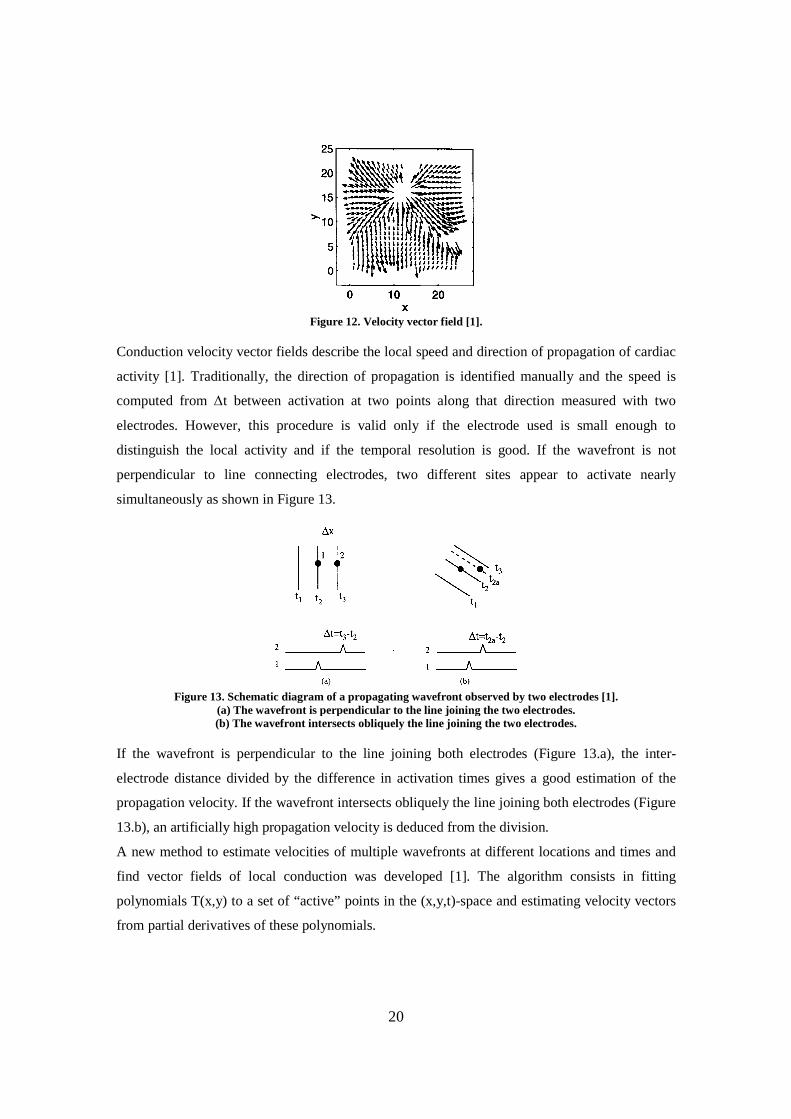
Figure 12. Velocity vector field [1].
Conduction velocity vector fields describe the local speed and direction of propagation of cardiac
activity [1]. Traditionally, the direction of propagation is identified manually and the speed is
computed from ∆t between activation at two points along that direction measured with two
electrodes. However, this procedure is valid only if the electrode used is small enough to
distinguish the local activity and if the temporal resolution is good. If the wavefront is not
perpendicular to line connecting electrodes, two different sites appear to activate nearly
simultaneously as shown in Figure 13.
Figure 13. Schematic diagram of a propagating wavefront observed by two electrodes [1].
(a) The wavefront is perpendicular to the line joining the two electrodes. (b) The wavefront intersects obliquely the line joining the two electrodes.
If the wavefront is perpendicular to the line joining both electrodes (Figure 13.a), the inter-
electrode distance divided by the difference in activation times gives a good estimation of the
propagation velocity. If the wavefront intersects obliquely the line joining both electrodes (Figure
13.b), an artificially high propagation velocity is deduced from the division.
A new method to estimate velocities of multiple wavefronts at different locations and times and
find vector fields of local conduction was developed [1]. The algorithm consists in fitting
polynomials T(x,y) to a set of “active” points in the (x,y,t)-space and estimating velocity vectors
from partial derivatives of these polynomials.

21
Maps of the conduction velocity magnitude are obtained by taking the square root of the
sum of the squares of the vector components.
2.7 Immunostaining
Immunostaining is a process using antibodies to detect the presence of specific proteins
in a sample. Table 1 shows some stains of interest for cardiac cell studies.
Feature of interest Possible stains Stained element Cell alignment wheat germ agglutinin (WGA)
anti-troponin phalloidin
-> cell membrane (all cells) -> troponin (cardiomyocytes) ->actin (all cells)
Number of cardiomyocytes (vs. fibroblasts)
anti-sarcomeric alpha actinin -> sarcomeric alpha actinin (cardiomyocytes)
Cardiomyocyte connectivity anti-connexin43 -> connexin43 Total number of cells Hoechst -> DNA (all nuclei)
Table 1. Some stains of interest for cardiac cell studies.

22
3. Materials and methods
3.1 Cardiomyocyte isolation Materials -1 or 2 days old Sprague-Dawley rats -Cardiomyocyte isolation kit (Cellutron) -Cell medium containing penicillin-streptomycin Method
The cell isolation process is performed by Daniel Dempsey and Michael Angelo and
follows the “Neonatal Myocyte Isolation Protocol” [55]. Ventricular cardiomyocytes are first
isolated from 1 or 2-day-old Sprague–Dawley rat hearts using multiple digestions. Myocytes are
then separated from fibroblasts using a pre-plating process.
3.2 Photolithography Materials -Polished silicon metal wafers N-type (Silicon Quest Int’l, 4’’ diameter) -Acetone, methanol, isopropanol -Nitrogen -Hotplate -Resist spinner (Laurell Technologies Corporation, Model WS-400B-6NPP/LITE) -SU-8-5 Negative photoresist (Microchem) -Mask 10+10 microns, 0-45-90, chrome on glass (Advance Reproductions Corporation) -Mask aligner MA6 (Suss Microtec) -SU-8 Developer (Microchem) -Oven (BlueM) Method
The procedure for the fabrication of micropatterned silicon wafers having 5 µm deep
microgrooves described below is entirely performed in a cleanroom.
First of all, the wafer has to be coated with photoresist. In order to achieve a uniform coating, the
wafer is placed on the spinner and centered, then 4 ml photoresist is applied to its center using a
pipette and the spinning recipe below is used to reach a 5 µm thick layer of resist.
Spinning recipe: - spread cycle: 500 rpm at 100 rpm/s, 5 s duration
- spin cycle: 3000 rpm at 300 rpm/s, 30 s duration

23
After the coating process, the wafer has to be soft-bake on a hotplate at 65ºC for 1 min, then at
95ºC for 3 min, in order for the solvent to evaporate and for the film to solidify. The wafer is then
removed from the hotplate and allowed to cool down 10 min at room temperature.
After the soft-baking step, the wafer is exposed to 365 nm UV light through the mask, for 30 s,
using the hard-contact mode of the MA6 Mask Aligner.
After the exposure comes the post-exposure bake. The wafer is placed on a hotplate at 65ºC for 1
min then at 95ºC for 1 min, in order to selectively crosslink the exposed area of the resist.
After the post-exposure baking step, the wafer is immersed in a Petri dish containing some SU-8
Developer solution and agitated by hand for 1 min for development. At the end of the
development time, the wafer is rinsed with water and blow-dried with nitrogen.
Finally, the wafer is hard-baked overnight in a oven at 200ºC to remove the solvent content of the
photoresist and thus increasing its adhesion and hardening.
Adapted from [7] and [59].
3.3 Fabrication of micropatterned elastic silicone membranes Materials -Sylgard 186 Silicone Elastomer Base (Dow Corning) -Sylgard 186 Silicone Elastomer Curing Agent (Dow Corning) -Balance -Centrifuge (5804R, Eppendorf) -Micropatterned silicon wafer -Spin-coater (WS-400A-6NPP/LITE, Laurell) -Vacuum pump (5KH36KNA510X, GE Motors and Industrials Systems) -Vacuum dessicator (Nalgene) -Oven Method
First of all, 10g of Sylgard 186 Silicon Elastomer Base and 1g Sylgard 186 Silicon
Elastomer Curing Agent are poured in a plastic weight boat and well mixed using a spatula. As
air bubbles usually arise during the mixing step, the mixture is then centrifuged for 1 minute at
4500 rpm.
After the air bubbles are removed, the mixture is spin coated on a micropatterned silicon wafer.
The spin coating process is performed using a spin-coater and a vacuum pump. The wafer is first
centered onto the spinner, then the mixture is poured onto it and finally, the spinner is
programmed to run for 30 seconds at 650 rpm. At the end of the spin coating process, the PDMS-
coated wafer is carefully removed from the spinner, placed into a vacuum dessicator to remove

24
any bubbles still present. The vacuum is applied for 30 minutes and then slowly removed by
opening the side valve. Several cycles may be necessary to completely get rid of the air bubbles.
After the air bubbles removal, the curing process is engaged by first heating the PDMS-coated
wafer in the oven at 70ºC for 2 hours and then keeping it at room temperature overnight for
complete curing. Finally, the PDMS membrane is slowly peeled off the wafer using a razor blade
and a cut is made on the membrane to indicate on which side the micropatterns stand.
Adapted from [7].
3.4 Cardiomyocyte culture on micropatterned elastic silicone membranes Materials -Isolated ventricular cardiomyocytes (from neonatal rats) -Sterile 100 mm × 20 mm Petri dish (Falcon, adapted to stretcher dimensions) -Anisotropic stretch device (including the 3 cylinders and the O-ring) (manufactured in UCSD) -Elastic micropatterned silicone membrane -Laminin (1mg/ml, Sigma) -Maintenance medium without antibiotics (74.7% DMEM 1× Gibco, 18.7% Medium 199 1× Gibco, 5.5% HS, 1.1% FBS) -70% ethanol -Sterile PBS (1×, Gibco) -ddH2O Method
All the following steps have to be performed under the tissue culture hood. First of all, the
three cylinders of the stretcher as well as the O-ring, are rinsed with 70% ethanol and the elastic
micropatterned silicone membrane is rinsed by immersion in ddH2O then in 70% ethanol. The
membrane, as well as all the stretcher elements, are then exposed to UV light for 15 minutes. 15
minutes later, the stretcher is assembled, with the membrane held onto it by the O-ring, and put
into a 100 mm × 20 mm Petri dish. The membrane is then rinsed with 70% ethanol, washed twice
with sterile PBS and finally exposed to UV overnight.
The next day, laminin with concentration 1mg/ml is diluted with PBS at a 1:100 ratio. The
coating solution is then applied to the membrane. The stretcher is finally incubated in the fridge
overnight, wrapped into parafilm.
The day after, the coating solution is removed and the cardiomyocytes are seeded at a density of
260,000/cm2 [47].

25
24 hours later, the preparation is rinsed twice with maintenance medium. The cardiomyocytes are
then cultured 5 days before the beginning of the experiments and the medium is replaced every 2
days.
Note: 3 days is the time required for the cardiomyocytes to completely fill the collagen tracks and
for the intercellular gap junctions to be formed. Some antibiotics such as streptomycin and
penicillin can be added to the medium depending on the experiments. Warning: the above
procedure has to be started two days before the isolation day.
Adapted from [7].
3.5 Staining procedure design for optical mapping of cardiomyocyte monolayers Materials -di-8-ANEPPS dye (Invitrogen) -DMSO (Sigma) -Pluronic F-127 (20% solution in DMSO) (Invitrogen) -Tyrode’s solution (in 1L H2O: 16.9 %w NaHCO3, 1.3 %w NaH2PO4-H2O, 14.5 %w Dextrose, 1.7 %w MgCl2, 2.7 %w KCl, 61.3 %w NaCl, 1.6 %w CaCl2) -Orbital shaker Method
30 µM of the di-8-ANEPPS dye (at 2 mM in DMSO) is mixed with Pluronic F-127 (20%
solution in DMSO) in Tyrode’s solution, so that Pluronic represent 0.1% of the final loading
solution. DMSO is used to make the dye membrane permeant *. Pluronic F-127 is used to
maintain the dye solubility and help tissue penetration. The maintenance medium is then removed
from the stretcher and replaced by the staining solution. The stretcher is then placed on an orbital
shaker for 15 minutes then under the hood for 25 minutes. The staining procedure is performed at
room temperature to avoid dye internalization by the cardiomyocytes. Finally, the staining
solution is removed and replaced by dye-free medium before imaging the cardiomyocyte
monolayer.
Note: As the di-8-ANEPPS dye is light-sensitive, the mixture with DMSO and Pluronic as well as
the cell incubation should be performed using respectively a tube and a culture dish covered with
aluminum foil.
* Most ion-selective dyes and several other probes are membrane impermeant because they carry
one or more charged carboxyl groups. The charges carried by the carboxyl groups can be masked

26
by esterification of the groups using acetate or acetoxymethyl (AM) groups, thus making the dye
membrane permeant [21].
3.6 Electrode design and cardiomyocyte monolayer pacing Materials -Platinum wire with 0.125 mm diameter (World Precision Instruments Inc.) -Coated cable (Belden) -Shrink tubing (RoHS Compliant, Alpha Wire Company) -Heat gun -Soldering iron -Connectors -Digital stimulator (DS8000, World Precision Instruments) -Isolator (DLS100, World Precision Instruments) Method
2 pieces of a Pt wire, 2 cm long, are cut and soldered to a coated cable with a BNC
connector at the other end. The electrodes are then positioned parallel, 3 mm apart, and glued to a
plastic rectangle, so that they end up 1 mm above the cardiomyocyte monolayer, as shown in
Figure 14.
Legend:
1 mm
Membrane with the cardiomyocyte monolayer
Cover of the culture dish
plastic rectangle
Pt wire with diameter of 0.125 mm
coated wire
2 cm
Side view
Bottom view3 mm
Figure 14. Electrode design.
The 2 parallel platinum electrodes are placed either perpendicular or parallel to the microgrooves.
The cardiomyocytes are paced using bipolar pulses with 10 ms duration, 20 V voltage and 2 Hz
frequency.

27
3.7 Immunostaining Materials -1X PBS (Gibco) -4% Paraformaldehyde (PFA) (Electron Microscopy Sciences) -Triton X-100 (Sigma) -Blocking solution (BS) 1.5% or 3% goat serum (4% Bovine Serum Albumin, Nalgene, + 1% cold water fish gelatin, Sigma + 1 M Glycine, Sigma + 1.5% or 3% Normal Goat Serum) -Primary antibodies:
Mouse anti-sarcomeric alpha actinin (Sigma) Rabbit poly anti-connexin43 (Sigma)
-Secondary antibodies: Alexa Fluor 568 goat anti-mouse (Molecular Probes) Alexa Fluor 488 goat anti-rabbit (Molecular Probes)
-DAPI stain (Sigma) Method
First of all, the culture media is removed, the cells are fixed in 4% PFA for 7-10 min and
washed 3 × 3 min with 1X PBS. Then., they are permeabilized with 0.2% Triton X-100 in PBS
for 15 min and washed 3 x 3 min with 1X PBS. After they are fixed and permeabilized, the cells
are incubated in 3% Blocking Solution (BS) for 30 min.
At the end of the blocking step, the cells are incubated with the primary antibodies (dilution
1:600) in BS 1.5% Goat Serum at room temperature for 2-3 h or overnight at 4 degrees. Then,
they are washed 2 x 3 min with 0.2% Triton X-100 in PBS and 4 x 3 min with 1X PBS.
After the incubation with the primary antibodies, the cells are incubated with the secondary
antibodies (dilution 1:250) in BS 1.5% Goat Serum at room temperature for 30 min. Then, they
are washed 1 x 3 min with 0.2% Triton X-100 in PBS and 2 x 3 min with PBS.
Finally, the cells are incubated with DAPI (1:2000 dilution) for 10 min and washed 1 x 3 min
with PBS.
Note: As the Alexa Fluor antibodies are light-sensitive, the cells are incubated in a dark box.
Adapted from [54].
3.8 Temperature and oxygenation setup design Material -Gas tank with 95% O2 - 5% CO2 EITHER -Hot plate (Fisher Scientific, serial nº 910N3256) OR -Temperature controller (TET-612, HBKJ)

28
-Thermocouple (5SRTC-TT-T-40-36, Omega) -Relay (DSS41A05, SRC Devices) -Heating pad 0.5 in × 2 in, 5W/in2 at 28V (KHLV-0502/5, Omega) Assembly
For the first temperature and oxygenation setup, the stretcher was simply positioned on a
heating plate heated up to 37ºC and the cardiomyocytes were oxygenated via a superficial flow of
95% O2 and 5% CO2 air. Then, a temperature control system was designed using a flexible
heating pad controlled by a thermocouple via a relay. The corresponding electrical circuit is
represented in Figure 15. The heating pad is attached to the stretcher in order to warm up the
silicone membrane mounted on it, as well as the cultured cardiomyocytes. The thermocouple
senses the temperature of the silicone membrane and modifies the heating pad, in order to
maintain the membrane temperature around 37ºC. If the SSR output generates current because the
thermocouple senses a low membrane temperature, an electric field is created between the coil
and the mechanical switch of the relay, making the switch attracted to the coil. Once the electrical
circuit is closed, the heating pads can heat up. A relay was required as the 8V SSR output was not
enough to directly control the heating pad which at least requires a 12V power supply.
Relay
J1, J2 : alarms controlling the SSR output
SSR activated voltage : open circuit 8V, short circuit 40 mA
Relay (mechanical switch)
Power supply : max 28 V
Heating pads on stretcher
Coil resistance : 500 Ω
+ -
SSR output
TEMPERATURE CONTROLLER
RELAY
Membrane
Figure 15. Electrical circuit for the temperature control system [adapted from 60].

29
3.9 Stretcher calibration Materials -Stretcher (manufactured at the Campus Research Machine Shop in UCSD) -Flat silicone membranes -Camera Cascade 512F (Photometrics) with a chip having 512 × 512 pixels, 16 µm ×16 µm each -MetaMorph imaging software -Vacuum silicone grease (Dow Corning)
Method
A new silicone membrane must be used for each calibration run. Black points equally
spaced are drawn, on the membrane, along the short and long axis of the ellipse formed by the
indenter ring. The membrane is then mounted onto the stretcher to be calibrated and a little
amount of silicone grease is spread on the indenter ring, in order to avoid sticking of the
membrane against it. The initial stretch is set to 0% strain with no rotation of the screw-top (0
degree rotation). Static images of the silicone membrane are captured over a series of 120 degrees
turns, from 0 to 1440 degrees, which corresponds to four complete rotations of the screw top.
The stack of images obtained is then used to detect the displacement of the black points drawn on
the membrane. Their displacement is tracked using the auto-tracking function of the MetaMorph
imaging software. Finally, the percentage stretch along the short and long axis is calculated and
correlated to the degree of rotation of the screw-top. The percentage stretch is obtained by
calculation of the linear stretch ratio along both axis, meaning the ratio of the actual length (after
stretch) to the initial length (without stretch).
Adapted from [7] and [30].
3.10 Optical setup for cardiomyocyte monolayer imaging Materials -Objectives with 1X lenses (×2) (Planapo/Leica) (NA=0.125) -500 nm dichroic mirror (×1) (500 DRLP 69326, Omega Optical) -Longpass 610 nm emission filter (×1) (RG 610) -LED light source (×1) -CMOS camera (×1) with 1 cm × 1 cm chip having 100 × 100 pixels (Ultima Master 6013) Assembly
The optical setup is represented in Figure 16.

30
Optical setup for cardiomyocyte monolayer
Legend:
LED light source
1× lens
Emission filter
Dichroic miror
Excitation light
Emission light
Stretcher
Acquisition setup
CMOS
camera
Electrodes, oxygenation and
temperature setups
Figure 16. Optical setup for cardiomyocyte monolayers.
3.11 Acquisition setup Materials -MiCam Ultima Power box -MiCam Ultima Acquisition box -Computer with Ultima software -Voltage converter Assembly
The acquisition setup is shown in Figure 17. The stimulation setup is linked to the
acquisition setup in order for the pacing stimulus to be recorded.

31
Isolator
MiCam UltimaAcquisition box
Power box
Electrodes
Camera, Optical setup
Stimulation and acquisition setups for cardiomyocyte monolayer
Stimulator
Computer
Voltage converter
Legend:
Acquisition
Stimulation
Power
Figure 17. Stimulation and acquisition setups for cardiomyocyte monolayers.
3.12 Extraction of activation time, repolarization, APD and CV values Materials -Matlab scripts Method
First, the global activation time (time for activation of the whole imaged area for the
cardiomyocyte monolayer model) has to be calculated. For this purpose, the 98-2 percentiles (98
percentile minus 2 percentile) of the activation times is calculated for each beat of each run. Then,
for each run the mean of the 98-2 percentiles obtained is taken, giving one activation time value
per run. For the calculation of repolarization and APD values, the median of the values obtained
for each beat of each run is calculated. Then, for each run the mean of the values obtained is
taken, giving one repolarization and one APD value per run.
As for the conduction velocity, it is calculated for each beat of each run, from the conduction
velocity vector field maps obtained. First, the median of the magnitude of all the velocity vectors
contained in a particular region of interest is calculated for all maps of each run. Then, the mean
of all the resulting vectors is taken and gives a conduction velocity value for each run.
32
4. Results
4.1 Cardiomyocyte culture on silicone micropatterned membranes
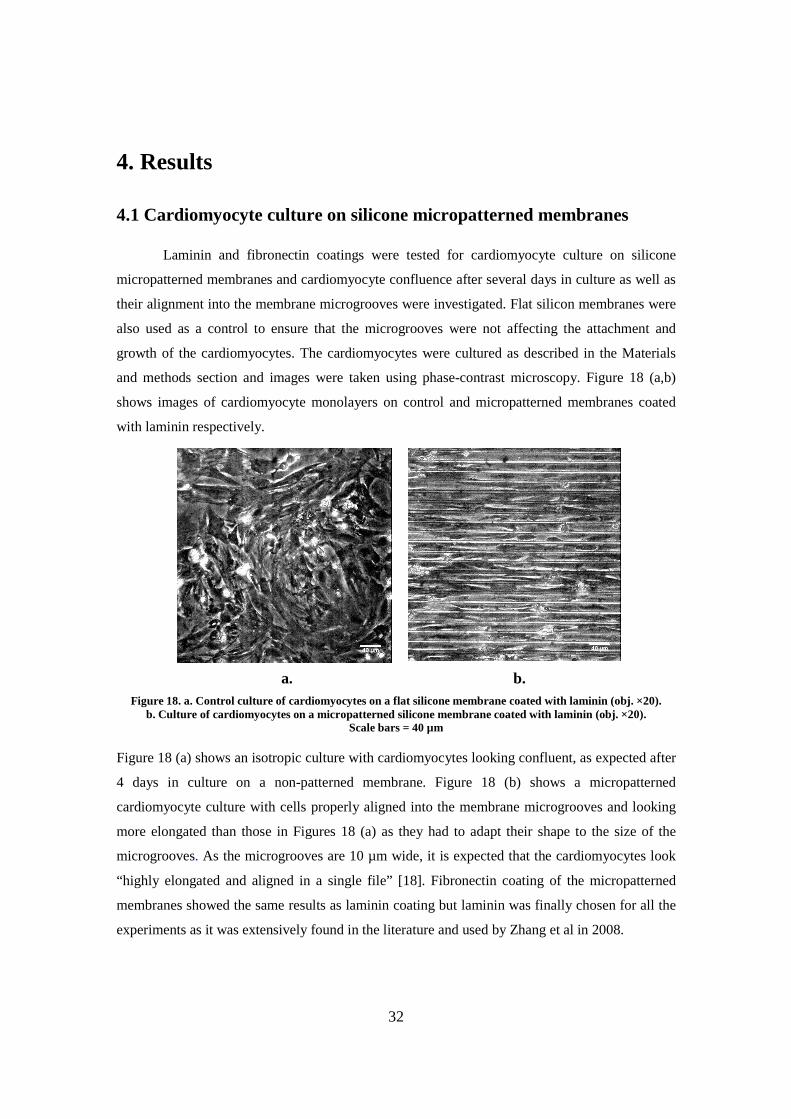
Laminin and fibronectin coatings were tested for cardiomyocyte culture on silicone
micropatterned membranes and cardiomyocyte confluence after several days in culture as well as
their alignment into the membrane microgrooves were investigated. Flat silicon membranes were
also used as a control to ensure that the microgrooves were not affecting the attachment and
growth of the cardiomyocytes. The cardiomyocytes were cultured as described in the Materials
and methods section and images were taken using phase-contrast microscopy. Figure 18 (a,b)
shows images of cardiomyocyte monolayers on control and micropatterned membranes coated
with laminin respectively.
a. b. Figure 18. a. Control culture of cardiomyocytes on a flat silicone membrane coated with laminin (obj. ×20).
b. Culture of cardiomyocytes on a micropatterned silicone membrane coated with laminin (obj. ×20). Scale bars = 40 µm
Figure 18 (a) shows an isotropic culture with cardiomyocytes looking confluent, as expected after
4 days in culture on a non-patterned membrane. Figure 18 (b) shows a micropatterned
cardiomyocyte culture with cells properly aligned into the membrane microgrooves and looking
more elongated than those in Figures 18 (a) as they had to adapt their shape to the size of the
microgrooves. As the microgrooves are 10 µm wide, it is expected that the cardiomyocytes look
“highly elongated and aligned in a single file” [18]. Fibronectin coating of the micropatterned
membranes showed the same results as laminin coating but laminin was finally chosen for all the
experiments as it was extensively found in the literature and used by Zhang et al in 2008.

33
4.2 Staining and optical signal recording
Once the micropatterned culture of cardiomyocytes on silicone membranes showed to
work, a protocol was developed to stain the cells with the voltage-sensitive dye di-8-ANEPPS
(see Materials and methods section) and observe changes in their transmembrane voltage. The
optical signals corresponding to the electrical activity of the cardiomyocytes (i.e. their action
potentials) could then be recorded from all over the imaged area (1 cm × 1 cm) as shown in
Figure 19.
Figure 19. Optical action potentials recorded from different pixels of the imaged area.
The optical signals displayed in Figure 19 arise from different pixels of the imaged monolayer,
meaning from different cardiomyocytes that were beating spontaneously at a frequency around
1.7 Hz. When an action potential occurs (i.e. when the cell membrane is depolarized), the
emission spectrum of the dye shifts such that the fluorescence intensity recorded (wavelength ≥
610 nm) decreases, resulting in an optical signal in the shape of an inverted action potential. In
Figure 19, the optical signals have been inverted on purpose, in order to more closely resemble
action potentials, and displayed as the relative change in fluorescence compared to the baseline
fluorescence, but have not been post-process yet. The fact that the baseline of the inverted signals
goes up, meaning that the fluorescence intensity decreases with time, is most probably due to
photobleaching. However, it could also be related to dye molecules attached to the cell
membranes that gradually leak out in the extra-cellular or intra-cellular spaces and to molecules
bound to the membranes that re-orient themselves [13]. Such a drift is removed during the post-
processing using a least-squares fitting method as it might cause a modification in the calculated
values for repolarization time and APD.

34
Depending on the selected pixels, the action potentials displayed sometimes show a clear
temporal shift. Such a shift, which can be clearly seen in Figure 20, is an indicator of electrical
propagation through the cardiomyocyte monolayer.
Figure 20. Optical action potentials recorded from different pixels of the imaged area
and showing a temporal shift.
In figure 20, the electrical impulses are travelling from the bottom right corner to the top left
corner of the imaged part of the cardiomyocyte monolayer. The temporal shift of the optical
signals can be easily seen as at a particular time, each of the three locations of the monolayer
displays a different phase of the action potential.
The cells that compose the monolayers used for all these optical mapping experiments should
only be ventricular cardiomyocytes, thus they should not be able to beat on their own. However,
it is possible that some atrial cardiomyocytes were isolated and cultured as well, or that irregular
intracellular calcium handling make the ventricular myocytes beat spontaneously. In fact,
depolarization has been shown to occur via a non-specific transient inward current flowing
through Ca2+-activated cation channels in isolated ventricular neonatal rat cardiomyocytes and to
be responsible for their enhanced pacemaker activity [43].
4.3 Making new micropatterned silicon wafers
After the success of the staining procedure, allowing one to record the cardiomyocyte
optical action potentials, and before trying to stimulate the cells at a defined frequency, it was
necessary to check the connectivity of the cardiomyocytes and the fact that they were all beating
together. For this purpose, activation maps were generated. Figure 21 represents one of the first
activation maps obtained from the intrinsic electrical activity of the cells, the scale bar is in ms,
the blue areas are the areas of earliest activation. The strange activation pattern obtained indicates
a problem in the propagation of the activation and consequently in the connection between the

35
cardiomyocytes. In fact, gaps or bad connections between some cells can stop the electrical
impulses from propagating to adjacent cells. The presence of too many fibroblasts could
eventually be a problem as well if they appear to take over the cardiomyocytes. The expected
activation pattern should show a nice propagation from one area of the monolayer to the other
side.
Figure 21. Activation map for cardiomyocytes cultured on a micropatterned silicone membrane.
The first concern while trying to solve this problem was about the dimensions of the
micropatterns. The wafers used to create the membranes were really old and their micropatterns
had lost their sharp shape. In fact, although the micropatterns probably had a width and a ridge of
10 µm when they were first made, the use of a stylus profiler revealed an actual width of 15 µm, a
ridge of 5 µm and a depth higher than 6 µm. The loss of the initial dimensions, due to the
extensive use of the wafers, as well as the micropattern depth probably made it difficult for the
cardiomyocytes at the bottom of the microgrooves to form electrical junctions with those from the
adjacent microgrooves. Consequently, new silicon wafers were designed and created (see
Materials and methods section) with microgrooves having dimensions 10 + 10 + 5 µm (width +
spacing + depth) [12; 32]. Microgrooves with dimensions 10 + 5 + 5 µm have been shown to be
optimal for the culture of neonatal rat cardiomyocytes, as they allow alignment of the cells while
preserving their anatomical, molecular and physiological functions, as they would be in a
neonatal rat heart [12]. A 5 µm ridge has been shown to allow cell-cell connections between
different microgrooves, whereas a 10 µm ridge did not [12]. However, in the present study, the
whole membrane (microgrooves and ridges) was coated with laminin and the cardiomyocytes did
aligned into the 10 µm microgrooves as well as on the 10 µm ridges, thus creating good cell-cell
connections while keeping a proper alignment.
Figure 22 represents one of the maps showing the intrinsic electrical activity of the
cardiomyocytes cultured on the new micropatterned membranes. The scale bar is in ms and the
blue areas are the areas of earliest activation.

36
Figure 22. Activation map for cardiomyocytes cultured on a new micropatterned silicone membrane.
The activation pattern shown in Figure 22 is the one expected. The cardiomyocytes are connected
all together, allowing the propagation of the activation from one side of the monolayer to the
other. The block present in the middle of the imaged area is due to a membrane defect, leading
the absence of cardiomyocytes or to a bad connection between them in this particular area.
Membranes with 10 + 5 + 5 µm microgrooves were thus used for all further experiments.
4.4 Cardiomyocyte pacing
In order to pace these confluent monolayers of cardiomyocytes, electrodes, shown in
Figure 23, and a pacing protocol, described in the Materials and methods section, were designed.
Pacing the cardiomyocytes at a defined frequency is of great importance to be able to compare the
results obtained from different monolayers. In fact, cell spontaneous beating rate varies from one
monolayer to the other and influences the shape of the action potentials and thus the APD and
repolarization values.
Figure 23. Pacing electrodes.
Figures 24 and 25 show the cardiomyocyte optical action potentials in black, as well as the pacing
stimulus in red from the same non-paced (top signal) and then paced (bottom signal) monolayer
area. In Figure 24, the cells were stimulated at a basic cycle length of 500 ms whereas in Figure
25, the cells were paced at a cycle length of 300 ms.

37
Figure 24. Non-paced (top signal) and paced (CL = 500 ms, bottom signal) optical action potentials.
Figure 25. Non-paced (top signal) and paced (CL = 300 ms, bottom signal) optical action potentials.
Both Figures 24 and 25 confirm that the cardiomyocytes were actually paced at each of the
imposed frequencies. In Figure 24, the pacing peaks are shifted relative to the action potentials
because the pacing lead was distant from the imaged area and it took time for the activation
wavefront to propagate to these cells.

38
4.5 Analysis
After all the above steps were performed, the analysis of some preliminary data recorded
showed that nice maps and values could be obtained from paced unstretched micropatterned
cardiomyocyte monolayers. Maps of activation, APD at 80% repolarization, CV vector field and
CV magnitude obtained from one of the stretchers are represented in Figure 26 (a,b,c,d)
respectively. The scale bars corresponding to the activation and APD maps are in ms, the one for
the CV magnitude is in cm/s. The blue areas are the sites of earlier activation, lower APD and CV
magnitude respectively. The parallel black lines in the top left corner of the activation map
indicate the position of the pacing electrodes. The discontinuity present in all maps is due to a
membrane defect.
a. Activation map b. APD map at 80% repolarization
c. CV vector field
d. CV magnitude map
Figure 26. Maps of activation (a), APD at 80% repolarization (b), CV vector field (c) and CV magnitude (d).
An average APD80 value of 326.3 ms was obtained by averaging APD80 over 4 stretchers. This
value is a little higher than the values found in the literature, such as 214.29 ms [47], 206.8 ± 9.7
ms [39], 117±27 ms [5] for isotropic neonatal cardiomyocyte cultures and 122±26 ms [5] for
patterned cultures. However, this APD80 value is still in the same range as those mentioned in
previous studies. As for CV, an average of 10.5 cm/s over 4 stretchers was obtained for

39
propagation along the micropatterns, which is comparable to values showed by other studies,
such as 24 cm/s [47], 26.0 ± 2.0 cm/s [39], 16.8±2.1 cm/s [5] for isotropic neonatal
cardiomyocyte cultures and 20.8±3.2 cm/s [5] for patterned cultures, although a little bit lower.
Lower CV values might be due to the isolation and culture methods used.
The electrodes were then aligned parallel and perpendicularly to the micropatterns in order to
look at propagation along the short axis of the aligned cardiomyocytes (transverse propagation)
and along their long axis (longitudinal propagation), respectively. A comparison between
transverse and longitudinal CV, shown in Figure 27, revealed that CV in the transverse direction
is more than twice smaller than CV in the longitudinal direction. This result agrees with the study
of Bian and Tung using zigzag patterned cultures [4] and shows that the cardiomyocyte
monolayers behave as expected.
Transverse versus longitudinal CV
0
2
4
6
8
10
12
14
16
Before stretch
CV
[cm
/s]
Longitudinal CV (n=6)
Transverse CV (n=2)
Figure 27. Transverse versus longitudinal CV.
4.6 Immunostaining
The goal of the immunostaining was to check the cardiomyocyte alignment into the
membrane microgrooves, the cell-cell connections as well as the number of cardiomyocytes
compared to the other cell types, especially fibroblasts. The anti-sarcomeric alpha-actinin
antibody allowed one to stain for the cardiomyocytes and thus check their confluence and
alignment into the membrane microgrooves. The anti-connexin43 antibody allowed one to check
the cell-cell electrical junctions. The DAPI stain allowed one to stain for the DNA (nuclei) of all
cells and thus visualize the number of cardiomyocytes compared to the other cell types when
compared to the anti-sarcomeric alpha actinin stain. Figures 28 and 29 show micropatterned
cardiomyocyte cultures stained for sarcomeric alpha-actinin, connexin-43 and nuclei, captured
with ×20 and ×40 objectives respectively.

40
Figure 28. Immunostaining of a micropatterned cardiomyocyte monolayer (obj. ×20). Red= sarcomeric alpha-
actinin (cardiomyocytes), green = connexin-43 and blue = DNA (nuclei). Scale bar = 20 µm.
Figure 29. Immunostaining of a micropatterned cardiomyocyte monolayer (obj. ×40). Red= sarcomeric alpha-
actinin (cardiomyocytes), green = connexin-43 and blue = DNA (nuclei). Scale bar = 20 µm.
Figure 28 shows a nice alignment of the cardiomyocytes along the micropatterns of the
membrane, as well as the presence of connexin-43 proteins, as expected. Not all connexin-43
proteins can be seen on this figure as they were on different planes and that the deconvolution of
several images taken at different planes could not be performed. Despite the presence of a few
gaps and some other cell types, most probably fibroblasts, the culture looks confluent and the
majority of the cells are cardiomyocytes. The few rounded cells are dead cardiomyocytes. Figure
29 shows a few cardiomyocytes in details. They are aligned and carry connexin-43 proteins on
their surface, as expected. Gap junctions between cardiomyocytes from one microgroove to
another (*) and from cells aligned in the same groove (**) can be clearly seen, which indicates
**
*

41
that the cardiomyocytes were able to connect in both their transverse and longitudinal directions.
The higher magnification allows one to better see the striations characteristic for the sarcomeric
alpha-actinin pattern. The nuclei without the alpha-actinin staining are most likely fibroblasts.
4.7 Design of a temperature control system
A temperature control system was designed in order to maintain the temperature of the
cardiomyocytes during the time period of the experiments. This system, shown in Figure 30, was
composed of a flexible heating pad positioned on one side of the stretcher, which temperature was
controlled by a thermocouple (see Materials and methods section). However, the temperature
control system developed could not be used during the experiments as it still needed to be
improved. In fact, it did not allow one to heat the middle of the membrane fast enough and a
temperature gradient was formed across the membrane, creating differences in temperature
between its middle and periphery. Using a 12V power supply, the middle of the membrane could
only be heated up to 33ºC in 50 min. This slow rate of increase was due to the quite low power
supply used for the heating pad (can be up to 28V), as well as to heat dissipation. With a 24 V
power supply, the temperature gradient formed across the membrane made the side closest to the
heating pad heated up to 38ºC in 30 min, while the middle only warmed up to 33ºC. After a
longer time, the middle of the membrane finally reached 37ºC, but the temperature was then way
too high for the cells at its periphery. The use of a second heating pad on the other side of the
stretcher should work better in heating the membrane faster up to 37ºC, while decreasing the
temperature gradient. However, the best option would probably be the use of a hotplate whose
temperature could be controlled using the thermocouple and the temperature controller.
Figure 30. Temperature control setup.
Thermocouple Heating pad
Temperature controller

42
4.8 Stretcher calibration
The last step before being able to perform a complete experiment including staining,
imaging, pacing and stretching of the cardiomyocytes was the calibration of the stretchers (see
Materials and methods section). Curves representing the percentage stretch versus the degree of
rotation of the screw-top for both the short and the long axis of the stretchers were obtained, one
of them is shown in Figure 31. The relationship between the percentage stretch and the degree of
rotation of the screw-top appeared to be linear, as expected.
Calibration stretcher 1
R2 = 0.9928
R2 = 0.9809
-5
0
5
10
15
20
25
0 120 240 360 480 600 720 840 960 1080 1200 1320 1440 1560
angle (degree)
per
cen
tag
e st
retc
h (
%)
S1 short axis 1S1 long axis 1S1 short axis 2S1 long axis 2S1 short axis 3S1 long axis 3S1 short axis 4S1 long axis 4
Figure 31. Rotation of the screw-top versus percentage stretch for the long axis (red regression curve) and short
axis (blue regression curve) of stretcher 1.
The stretch applied with such an elliptical stretcher design is homogeneous, except at 2 mm of the
indenter ring [18], anisotropic and is transferred from the substrate to the adherent cells [30].
Finally, a 4%:10% stretch ratio was used in order to be close to the 10%:5% stretch ratio found in
the literature and usually used for cells [18; 47].
4.9 Optical mapping experiments
After all the steps described above were completed, the optical mapping experiments
could finally be performed. The main goal of these experiments was to study the changes in APD
and CV values, in response to anisotropic stretch, in micropatterned cardiomyocyte monolayers.
In these experiments, the cardiomyocytes were cultured either without antibiotics or with
different concentrations of streptomycin. About 10% stretch was applied along the cardiomyocyte

43
transverse axis and 4% stretch applied along their longitudinal axis. The electrical propagation
was studied in both longitudinal and transverse directions by positioning the electrodes
perpendicularly and parallel to the micropatterns respectively. The cardiomyocytes were paced at
a cycle length of 500 ms and recordings were taken, 1 min apart, before stretch and 5 min after
stretch. The electrode and micropattern configurations are represented in Figure 32.
10%
4%
Legend:
Imaging area
Electrodes
Stretch
Micropatterns
Indenter ring Figure 32. Electrode and micropattern configurations.
The same imaged area, situated in the middle of the stretched membrane, was maintained before
and after stretch, so that when stretching, the same cardiomyocytes are imaged except those at the
edges that leave the field of view. The temperature and oxygenation of the cardiomyocytes were
maintained using a hotplate heated up to 37ºC and a superficial 95%O2 -5%CO2 air flow.
The results obtained for APD80 and CV in response to stretch in the different experimental
conditions are shown in Figures 33 and 34 respectively. Values have been obtained for 8
stretchers and normalized regarding the values before stretch in order to account for cellular
baseline differences.
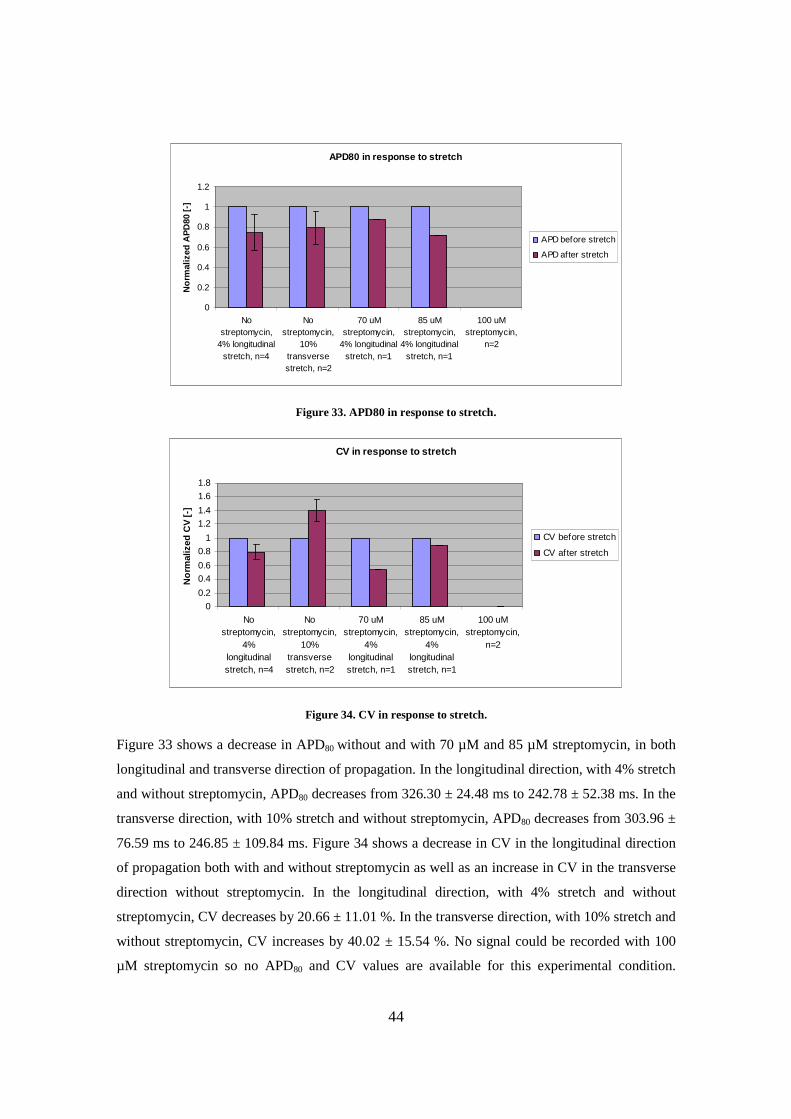
44
APD80 in response to stretch
0
0.2
0.4
0.6
0.8
1
1.2
Nostreptomycin,
4% longitudinalstretch, n=4
Nostreptomycin,
10%transversestretch, n=2
70 uMstreptomycin,
4% longitudinalstretch, n=1
85 uMstreptomycin,
4% longitudinalstretch, n=1
100 uMstreptomycin,
n=2
No
rmal
ized
AP
D80
[-]
APD before stretch
APD after stretch
Figure 33. APD80 in response to stretch.
CV in response to stretch
0
0.2
0.40.6
0.8
1
1.21.4
1.6
1.8
Nostreptomycin,
4%longitudinalstretch, n=4
Nostreptomycin,
10%transversestretch, n=2
70 uMstreptomycin,
4%longitudinalstretch, n=1
85 uMstreptomycin,
4%longitudinalstretch, n=1
100 uMstreptomycin,
n=2
No
rmal
ized
CV
[-]
CV before stretch
CV after stretch
Figure 34. CV in response to stretch.
Figure 33 shows a decrease in APD80 without and with 70 µM and 85 µM streptomycin, in both
longitudinal and transverse direction of propagation. In the longitudinal direction, with 4% stretch
and without streptomycin, APD80 decreases from 326.30 ± 24.48 ms to 242.78 ± 52.38 ms. In the
transverse direction, with 10% stretch and without streptomycin, APD80 decreases from 303.96 ±
76.59 ms to 246.85 ± 109.84 ms. Figure 34 shows a decrease in CV in the longitudinal direction
of propagation both with and without streptomycin as well as an increase in CV in the transverse
direction without streptomycin. In the longitudinal direction, with 4% stretch and without
streptomycin, CV decreases by 20.66 ± 11.01 %. In the transverse direction, with 10% stretch and
without streptomycin, CV increases by 40.02 ± 15.54 %. No signal could be recorded with 100
µM streptomycin so no APD80 and CV values are available for this experimental condition.

45
5. Discussion
The results obtained in this study show a decrease in APD80 in response to stretch,
although an increase, potentially due to the SACs, was expected based on the results from by
Zhang [47] and Sung [42]. However, APD shortening has previously been reported in single cell
stretch experiments on guinea pig ventricular myocytes [45] and frog ventricular myocytes [44].
Moreover, a reduction of the monophasic action potential (MAP) duration has been observed in
rabbit hearts [16] and pig hearts [22] during wall stretch. Parameters such as localization of the
recording electrode [10], frequency of stimulation [22] as well as speed and amplitude of pressure
increase inside the heart [6; 16] are thought to lead to the differences in APD response to load. In
fact, “a fast stretch of low amplitude is more efficient than a large slow stretch” [8]. Moreover,
simulations performed by Riemer and co-workers in 1998 suggested that the stretch response of
APD is highly sensitive to a few ionic currents dependent on SAC subtypes and ionic reversal
potentials as well as extracellular ionic conditions, leading to either a lengthening or shortening of
the APD. In fact, on the one hand, an extracellular calcium concentration ([Ca]o) of 1 mM and a
reversal potential for the stretch current (Es) of -50 mV were shown to induce APD shortening
with increasing stretch. On the other hand, a 4 mM [Ca]o or a -20 mV Es with increasing
conductance of the stretch current could induce APD lengthening [37]. Temperature and type of
stretch applied [8] also seem to be factors playing a major role in the APD response. However,
the APD80 decrease observed in response to stretch in this study is very large, sometimes reaching
a 80 to 100 ms difference. Although this APD80 decrease might be real, such a difference between
values before and after stretch is most likely due to an artifact of the analysis programs used,
which are easily fooled by the level of noise of the signals. In fact, the program for the extraction
of the values was shown to pick up too short APD values, due to the presence of a large noise,
especially after stretch, during repolarization. For this purpose, an additional fit using a quadratic
function of order 2 was implemented for the repolarization phase of the action potential. The
efficiency of the fitting process was evaluated on several samples, one of them is shown in Figure
35.

46
Figure 35. Action potential (blue) and fit of the repolarization phase (red).
The red curve in Figure 35 seems to fit the action potential repolarization phase. However, when
the fitting process was added to the program, only the beginning of the repolarization phase was
fitted and the action potential baseline appeared to be off, introducing errors in the calculation of
the APD values. Regarding the analysis problems, several pairs of action potentials from the same
pixels before and after stretch have been scaled and compared, one pair is shown in Figure 36.
Figure 36. Action potentials from the same pixel before (blue) and after (red) stretch.
The effect of stretch on APD cannot be clearly seen in Figure 36. It seems difficult to tell which
action potential repolarizes before the other and the APD could also be increasing in response to
stretch, as shown by Zhang in 2008 [47] as well as Sung in 2003 [42]. In Zhang et al.
experiments, cardiomyocytes were cultured on a non-patterned deformable elastomer and
anisotropically stretched (10%:5%) using an elliptical stretcher and the results showed an increase
in APD80 from 214.29 ms to 228.57 ms ([47], Figure 6B). In Sung et al. experiments, the left
ventricular end-diastolic pressure of isolated rabbit hearts was increased from 0 to 30 mmHg. The
results showed an increase in APD80 from 179 ± 7 ms to 207 ± 5 ms (P<0.0001) in response to
ventricular loading and the use of 200 µM streptomycin did not affect the electrophysiological
changes observed in response to stretch [42]. The APD values obtained in this study are globally
47
a little higher than the ones found by Zhang et al. and Sung et al. However, the values for the
rabbit hearts are expected to be different as the action potential shape varies among species due to
differential expression of ion channels. Moreover, the rate of pacing plays a large role on APD
and the rabbit hearts were paced much faster than 500 ms cycle length in those experiments. The
delay in action potential repolarization observed in some cases, leading to a longer APD, might
be due to the activation of the SACs, which modulate the cell membrane resistance to ion
trafficking, or to a length-dependent modulation of intracellular calcium handling [9]. The
opening of SACs leads mainly to the influx of Na+ and Ca2+ inside the cells which in turn
induces the activation of the Na+/Ca2+ pump and the Na+/K+ ATPase. However, the changes in
intracellular calcium concentration induced by these mechanically-induced fluxes were
considered to be too small to generate calcium induced calcium release [9] but the effect of SACs
on cell calcium might improve load sharing among fibers [40]. Consequently, both an increase
and a decrease in APD have been observed and the development of a better analysis tool is
necessary to obtain relevant values of APD from this study that could be trusted and compared
with other studies.
The purpose of adding streptomycin to the cardiomyocyte culture was to block the SACs
and modify the electrophysiological changes in response to stretch, especially the APD.
Regarding the results obtained, the use of 70 µM and 85 µM streptomycin does not seem to be
efficient in modifying the APD response to stretch. However, the addition of 100 µM
streptomycin to the culture just before the experiments interfered with dye loading and
diminished fluorescence within 15-20 min after the addition, making one unable to record
cardiomyocyte action potentials anymore. Streptomycin is a water-soluble aminoglycoside that
can easily enter bacterial cells but is not supposed to penetrate mammalian ones. It has been
shown to penetrate bacteria and start damaging their membrane within 10-15 min, by making
them unable to produce healthy fatty acids and lipids [27], leading to a complete loss of K+,
nucleotides and proteins after 45 min. In this study, DMSO was used to make the membrane more
permeable, allowing the voltage-sensitive dye to be inserted into it and track the variations in
membrane voltage. This permeabilization of the membrane might be responsible for the
penetration of streptomycin into the cardiomyocytes followed by the degradation of their
membrane, leading to a possible detachment or internalization of the voltage-sensitive dye,
making it unable to respond to the changes in membrane potential. A small study was run in
parallel to the experiments to compare the streptomycin concentration added to the culture with
the stability of the optical signal, assuming no photobleaching. This study revealed that a
maximum of 90 µM streptomycin can be added to the culture without diminishing the optical

48
signal after a short period of time. If a higher concentration is needed, two possible solutions are
either to try using less DMSO for the staining procedure or to use another SACs blocker such as
the Grammostola spatulata venom [33; 34].
The decrease in CV obtained for all 4% stretch longitudinal propagation experiments was
expected. A CV decrease from 24 cm/s to 22 cm/s was obtained by Zhang et al. ([47], Figure 7C).
In Sung et al. experiments, the results showed a decrease in apparent surface CV by 16% ± 7%
(P=0.007). The CV values obtained in this study are globally lower than those from Zhang et al.,
which might be due to the use of different cell isolation and culture methods, but the percentage
decrease is higher than that from Sung et al. This decrease in CV does not seem to be affected by
the addition of 70 µM and 85 µM streptomycin and thus might not be completely due to SACs.
This decrease could actually be explained by factors either extrinsic or intrinsic to cells. For
example, the loss of efficiency of some gap junction proteins, such as connexin-43, in conducting
the electrical impulses due to an acute stretch could be one reason for the slowing CV. In fact, in
the case of chronic stretch, it has been shown that cells adapt and upregulate connexin-43
expression [7]. Moreover, when stretching a tissue, the resistance and capacitance of the cells
change. The resistance is lowered, which induces an increase of the conduction velocity but the
capacitance is raised, which overall induces a decrease of the conduction velocity [31]. The
increase in CV for the 10% stretch transverse propagation experiments is difficult to explain. A
change in resistance or conductance inside and outside the cells might be the cause for this
unexpected increase. In fact, experiments performed on sheep Purkinje fibres suggested that a
stretch-induced increase in membrane resistance might be at the origin of the observed increase in
CV [11].
Another interesting result is that CV values in the transverse direction are lower than in the
longitudinal direction, as found by Bian and Tung in 2006 using zigzag cardiomyocyte cultures
[4]. This lower CV in the transverse axis compared to longitudinal axis is primarily due to an
increased intercellular resistance in the transverse direction because of gap junction distribution.
In fact, gap junction proteins are more concentrated at the cell longitudinal ends.

49
6. Conclusion
Studying the effect of stretch on the electrophysiology of cardiac cells in micropatterned
cardiomyocyte monolayers was exciting as the electrophysiological changes observed may be
directly involved in the generation of arrhythmias.
No experiments were performed on whole hearts due to a lack of time and more experiments with
micropatterned cardiomyocyte monolayers need to be performed in order to better evaluate the
trend of the results and obtain significant values. A better data analysis method should be
developed in order to take care of noisy signals and give relevant APD values. Designing a better
control of the ionic environment and temperature of the cardiomyocytes as well as defining the
rapidity of stretch application might also be of interest, as these elements might play an important
role in the cardiomyocyte response to stretch. It would also be interesting to perform experiments
with the cardiomyocytes aligned with the short axis of the stretcher, in order for the primary
strain axis to be in their longitudinal direction, and to compare the responses. Moreover, further
investigation of the role of extracellular and intracellular resistance and capacitance in the
cardiomyocyte electrophysiological response to stretch seems necessary in order to better
understand how parameters like APD and CV are affected. Selective block of SACs is also a
major issue as it could allow one to investigate the underlying mechanism and cause for stretch-
induced electrophysiological changes and thus lead to the development of new drug therapies for
mechanically induced arrhythmias.

50
References Papers and books [1] Bayly PV, KenKnight BH, Rogers JM, Hillsley RE, Ideker RE, Smith WM: Estimation of conduction velocity vector fields from epicardial mapping data. IEEE Trans Biomed Eng 1998; 45:563-571. [2] Berne RM, Levy MN: Cardiovascular physiology. St. Louis, MO: Mosby, 2001, p. xiv, 312. [3] Bers DM: Cardiac excitation-contraction coupling. Nature 2002; 415:198-205. [4] Bian W, Tung L: Structure-related initiation of reentry by rapid pacing in monolayers of cardiac cells. Circ Res 2006; 98:e29-38. [5] Bursac N, Loo Y, Leong K, Tung L: Novel anisotropic engineered cardiac tissues: studies of electrical propagation. Biochem Biophys Res Commun 2007; 361:847-853. [6] Calkins H, Levine JH, Kass DA: Electrophysiological effect of varied rate and extent of acute in vivo left ventricular load increase. Cardiovasc Res 1991; 25:637-644. [7] Camelliti P, Gallagher JO, Kohl P, McCulloch AD: Micropatterned cell cultures on elastic membranes as an in vitro model of myocardium. Nat Protoc 2006; 1:1379-1391. [8] Cazorla O, Pascarel C, Brette F, Le Guennec JY: Modulation of ions channels and membrane receptors activities by mechanical interventions in cardiomyocytes: possible mechanisms for mechanosensitivity. Prog Biophys Mol Biol 1999; 71:29-58. [9] Crozatier B: Stretch-induced modifications of myocardial performance: from ventricular function to cellular and molecular mechanisms. Cardiovasc Res 1996; 32:25-37. [10] Dean JW, Lab MJ: Regional changes in ventricular excitability during load manipulation of the in situ pig heart. J Physiol 1990; 429:387-400. [11] Deck KA: [Changes in the Resting Potential and the Cable Properties of Purkinje Fibers during Stretch.]. Pflugers Arch Gesamte Physiol Menschen Tiere 1964; 280:131-140. [12] Deutsch J, Motlagh D, Russell B, Desai TA: Fabrication of microtextured membranes for cardiac myocyte attachment and orientation. J Biomed Mater Res 2000; 53:267-275. [13] Dhein S, Mohr FW, Delmar M: Practical methods in cardiovascular research. Berlin ; New York: Springer, 2005, p. xx, 1010 p., 1016 p. of plates. [14] Efimov IR, Nikolski VP, Salama G: Optical imaging of the heart. Circ Res 2004; 95:21-33. [15] Entcheva E, Bien H: Macroscopic optical mapping of excitation in cardiac cell networks with ultra-high spatiotemporal resolution. Prog Biophys Mol Biol 2006; 92:232-257. [16] Franz MR, Cima R, Wang D, Profitt D, Kurz R: Electrophysiological effects of myocardial stretch and mechanical determinants of stretch-activated arrhythmias. Circulation 1992; 86:968-978. [17] Gannier F, White E, Lacampagne A, Garnier D, Le Guennec JY: Streptomycin reverses a large stretch induced increases in [Ca2+]i in isolated guinea pig ventricular myocytes. Cardiovasc Res 1994; 28:1193-1198. [18] Gopalan SM, Flaim C, Bhatia SN, Hoshijima M, Knoell R, Chien KR, Omens JH, McCulloch AD: Anisotropic stretch-induced hypertrophy in neonatal ventricular myocytes micropatterned on deformable elastomers. Biotechnol Bioeng 2003; 81:578-587. [19] Hansen DE, Borganelli M, Stacy GP, Jr., Taylor LK: Dose-dependent inhibition of stretch-induced arrhythmias by gadolinium in isolated canine ventricles. Evidence for a unique mode of antiarrhythmic action. Circ Res 1991; 69:820-831. [20] Hansen DE, Stacy GP, Jr., Taylor LK, Jobe RL, Wang Z, Denton PK, Alexander J, Jr.: Calcium- and sodium-dependent modulation of stretch-induced arrhythmias in isolated canine ventricles. Am J Physiol 1995; 268:H1803-1813. [21] Hawes CR, Satiat-Jeunemaitre B: Plant cell biology : a practical approach. Oxford ; New York: Oxford University Press, 2001, p. xx, 338 p., [334] p. of plates. [22] Horner SM, Dick DJ, Murphy CF, Lab MJ: Cycle length dependence of the electrophysiological effects of increased load on the myocardium. Circulation 1996; 94:1131-1136. [23] Hu H, Sachs F: Stretch-activated ion channels in the heart. J Mol Cell Cardiol 1997; 29:1511-1523.

51
[24] Hutton P, Cooper GM, III FMJ, IV JFB, (Editors): Fundamental Principles and Practise of Anaesthesia, 2002, [25] Kamkin A, Kiseleva I, Isenberg G: Stretch-activated currents in ventricular myocytes: amplitude and arrhythmogenic effects increase with hypertrophy. Cardiovasc Res 2000; 48:409-420. [26] Kohl P, Hunter P, Noble D: Stretch-induced changes in heart rate and rhythm: clinical observations, experiments and mathematical models. Prog Biophys Mol Biol 1999; 71:91-138. [27] Kornder JD: Streptomycin revisited: molecular action in the microbial cell. Med Hypotheses 2002; 58:34-46. [28] Lacampagne A, Gannier F, Argibay J, Garnier D, Le Guennec JY: The stretch-activated ion channel blocker gadolinium also blocks L-type calcium channels in isolated ventricular myocytes of the guinea-pig. Biochim Biophys Acta 1994; 1191:205-208. [29] Le Guennec JY, White E, Gannier F, Argibay JA, Garnier D: Stretch-induced increase of resting intracellular calcium concentration in single guinea-pig ventricular myocytes. Exp Physiol 1991; 76:975-978. [30] Lee AA, Delhaas T, Waldman LK, MacKenna DA, Villarreal FJ, McCulloch AD: An equibiaxial strain system for cultured cells. Am J Physiol 1996; 271:C1400-1408. [31] Mills RW, Narayan SM, McCulloch AD: Mechanisms of conduction slowing during myocardial stretch by ventricular volume loading in the rabbit. Am J Physiol Heart Circ Physiol 2008; 295:H1270-H1278. [32] Motlagh D, Hartman TJ, Desai TA, Russell B: Microfabricated grooves recapitulate neonatal myocyte connexin43 and N-cadherin expression and localization. J Biomed Mater Res A 2003; 67:148-157. [33] Nazir S, Dick D, Sachs F, Lab M: Effects of G. spatulata venom, a novel stretch-activated channel blocker in a model of stretch-induced ventricular fibrillation in the isolated heart. Circulation (Suppl I) 1995. [34] Niggel J, Hu H, Sigurdson W, Bowman C, Sachs F: Grammostola spatulata venom blocks mechanical transduction in GH3 neurons, Xenopus oocytes and chick heart cells. Biophys J 1996. [35] Patterson MM, Kesner RP: Electrical stimulation research techniques. New York: Academic Press, 1981, p. xv, 370. [36] Ravens U: Mechano-electric feedback and arrhythmias. Prog Biophys Mol Biol 2003; 82:255-266. [37] Riemer TL, Sobie EA, Tung L: Stretch-induced changes in arrhythmogenesis and excitability in experimentally based heart cell models. Am J Physiol 1998; 275:H431-442. [38] Rosamond W, Flegal K, Furie K, Go A, Greenlund K, Haase N, Hailpern SM, Ho M, Howard V, Kissela B, Kittner S, Lloyd-Jones D, McDermott M, Meigs J, Moy C, Nichol G, O'Donnell C, Roger V, Sorlie P, Steinberger J, Thom T, Wilson M, Hong Y: Heart disease and stroke statistics--2008 update: a report from the American Heart Association Statistics Committee and Stroke Statistics Subcommittee. Circulation 2008; 117:e25-146. [39] Sathaye A, Bursac N, Sheehy S, Tung L: Electrical pacing counteracts intrinsic shortening of action potential duration of neonatal rat ventricular cells in culture. J Mol Cell Cardiol 2006; 41:633-641. [40] Sigurdson W, Ruknudin A, Sachs F: Calcium imaging of mechanically induced fluxes in tissue-cultured chick heart: role of stretch-activated ion channels. Am J Physiol 1992; 262:H1110-1115. [41] Sung D, Cosman J, Mills R, McCulloch AD: Phase shifting prior to spatial filtering enhances optical recordings of cardiac action potential propagation. Ann Biomed Eng 2001; 29:854-861. [42] Sung D, Mills RW, Schettler J, Narayan SM, Omens JH, McCulloch AD: Ventricular filling slows epicardial conduction and increases action potential duration in an optical mapping study of the isolated rabbit heart. J Cardiovasc Electrophysiol 2003; 14:739-749. [43] Thandroyen FT, Morris AC, Hagler HK, Ziman B, Pai L, Willerson JT, Buja LM: Intracellular calcium transients and arrhythmia in isolated heart cells. Circ Res 1991; 69:810-819. [44] Tung L, Zou S: Influence of stretch on excitation threshold of single frog ventricular cells. Exp Physiol 1995; 80:221-235. [45] White E, Le Guennec JY, Nigretto JM, Gannier F, Argibay JA, Garnier D: The effects of increasing cell length on auxotonic contractions; membrane potential and intracellular calcium transients in single guinea-pig ventricular myocytes. Exp Physiol 1993; 78:65-78. [46] Zeng T, Bett GC, Sachs F: Stretch-activated whole cell currents in adult rat cardiac myocytes. Am J Physiol Heart Circ Physiol 2000; 278:H548-557.
52
[47] Zhang Y, Sekar RB, McCulloch AD, Tung L: Cell cultures as models of cardiac mechanoelectric feedback. Prog Biophys Mol Biol 2008; 97:367-382. Websites [48] http://www.virtualrespiratorycentre.com/Investigations.asp?sid=28 [49] http://www.cvphysiology.com/Arrhythmias/A008c.htm [50] http://www.cvphysiology.com/Arrhythmias/A009.htm [51] http://www.memsnet.org/mems/beginner/lithography.html [52] http://en.wikipedia.org/wiki/Troponin [53] http://en.wikipedia.org/wiki/Cardiac_action_potential Protocols [54] Alice Zemljic-Harpf, Immunostaining on isolated adult cardiac myocytes protocol, Dr. Robert Ross Laboratory, UCLA, Dept. of Physiology [55] Aundrea Graves, Jeff Jacot, Neonatal myocyte isolation protocol Product information [56] Invitrogen, Pluronic F-127 datasheet [57] Invitrogen, Potential-Sensitive ANEP Dyes datasheet [58] MiCAM ultima imaging system, manual for users [59] Microchem, SU-8 product information datasheet [60] Temperature controller TET-612, manual for users

53
Acknowledgments Thank you to Dr. McCulloch for the opportunity of working in the CMRG and having such an interesting project as well as for his guidance and advice. Thank you to Professor Stergiopulos for assisting and guiding me in the choice of my project. A special thanks to Adam for his help, patience and advice as well as for everything he taught me. Thank you to Mike and Daniel for doing the cell isolation as well as to Amy and Joyce for their help. Thank you to all the people I have met this year, each of whom has helped me in different ways.