Embed Size (px)
Citation preview
Volume 4 • Issue 1 • 1000159J Biomet BiostatISSN:2155-6180 JBMBS, an open access journal
Research Article Open Access
Gao et al., J Biomet Biostat 2013, 4:1 DOI: 10.4172/2155-6180.1000159
Research Article Open Access
Keywords: Multilevel Poisson model; Random effects Poissonmodel; Hierarchical poisson model; Conditional poisson model; Bias; Type I error rate
Introduction Clustered data arise often in studies of clinical and health care
research. Clusters are formed either by natural matching, for example in family or twin studies, or by matching on some characteristics that may have associations with the outcomes, and the exposure (confounders). In general, subjects in a cluster are correlated, and the strength of correlation depends on the nature of outcomes and the clustering criteria.
This paper focuses on clustered Poisson data, in which some subjects are ‘exposed’ and some, are not in a cluster. Exposure may refer to any variable, including treatment that varies among units (typically subjects), in a cluster. A covariate in clustered data generally has two components, between-cluster component represented by the cluster mean of the covariate, and within-cluster component which is the deviation from the cluster mean [1]. Our interest is to estimate the within-cluster exposure effect. Several statistical methods can be considered to assess the effect, including 1) Independent Poisson model (IP); 2) Fixed Cluster effects Poisson model (FCP); 3) Conditional likelihood Poisson estimation (CP); 4) Generalized Estimating Equations (GEE); and two versions of random cluster effects Poisson models; one that does not attempt to estimate separate between- and within-cluster effects (5, RCP), and one that does (6, RCP_bw). Detailed descriptions of these methods are given in the next section, along with a review of relevant literature.
Several features are important in design and analysis of studies with clustered data, including number of clusters, number of subjects per cluster (cluster size), and the ratio of number of exposed to unexposed subjects in each cluster (termed “exposure ratio” in this paper). The objective of this paper is to compare the performance of above six methods, for estimating the exposure effect for clustered Poisson data
in a variety of designs. Similar investigations have been performed for binary outcomes [1-6], but our theoretical and simulation results are unique for clustered Poisson data. It will be seen that the exposure ratio plays a key role in determining behavior and choice of statistical methods. Constant exposure ratio will be shown to have several advantages and can be achieved in designed studies, for example: sampling from large databases, based on subjects’ characteristics or propensity scores [7,8].
The motivation for this paper was a study conducted in young children in Indonesia, to examine the association of incidence of Respiratory Syncytial Virus (RSV) infection, with characteristics of the mother. RSV is the major cause of viral lower respiratory tract infections in infants and young children worldwide. The outcome variable was the number of RSV infections, during the follow-up period. It was thought that the time during the year when the child was born could be an important factor, due to temperature and rainfall variation, across the year. To adjust for this effect, children were grouped into 24 birth cohorts of half month each, according to their birth dates.
Statistical MethodsWe assume clustered Poisson data from the following scenario. Let
*Corresponding author: Stanley Xu, Department of Biostatistics and Informatics, Colorado School of Public Health, University of Colorado, Denver, Colorado, USA, E-mail: [email protected]
Received December 30, 2012; Accepted January 21, 2013; Published January 25, 2013
Citation: Gao D, Grunwald GK, Xu S (2013) Statistical Methods for Estimating Within-Cluster Effects for Clustered Poisson Data. J Biomet Biostat 4: 159. doi:10.4172/2155-6180.1000159
Copyright: © 2013 Gao D, et al. This is an open-access article distributed under the terms of the Creative Commons Attribution License, which permits unrestricted use, distribution, and reproduction in any medium, provided the original author and source are credited.
Statistical Methods for Estimating Within-Cluster Effects for Clustered Poisson DataDexiang Gao1, Gary K. Grunwald2, and Stanley Xu2,3*1Research Institute, The Children’s Hospital, Denver, Colorado, USA2Department of Biostatistics and Informatics, Colorado School of Public Health, University of Colorado, Denver, Colorado, USA3
AbstractClustered Poisson data frequently appear in medical research. Interest often focuses on examination of an
exposure effect within clusters. The objective of this paper is to compare the performance of six methods for estimating the exposure effect for clustered Poisson data: 1) independent Poisson; 2) fixed cluster effects Poisson; 3) conditional likelihood Poisson estimation; 4) Generalized Estimating Equations (GEE); 5) random cluster effects Poisson; and 6) random cluster effects Poisson, with separate between- and within-cluster effects. Biases and standard errors of within-cluster exposure effects are compared across the six statistical methods considering constant or varying exposure ratio (number of exposed to unexposed subjects), constant or varying cluster sizes, different within-cluster exposure effect, different cluster variances, and number of clusters. Simulations and theoretical results show that exposure ratio is a key quantity. With constant exposure ratio designs, maximum likelihood estimates and asymptotic standard errors were obtained in closed form. All models, except GEE, give equivalent estimates and standard errors of the within-cluster exposure effect. With varying exposure ratio designs, conditional likelihood and fixed cluster effects methods yield the same estimates and standard errors for the exposure effect. Results from the random cluster effects Poisson model with separate between- and within-cluster effects are very similar to those from fixed cluster effects Poisson and conditional Poisson methods. We applied the above approaches to birth cohort data, to analyze incidence of Respiratory Syncytial Virus (RSV) infection in young children in Indonesia.
Institute for Health Research, Kaiser Permanente Colorado, Denver, Colorado, USA
Journal of Biometrics & Biostatistics Jour
nal o
f Biometrics & Biostatistics
ISSN: 2155-6180
Citation: Gao D, Grunwald GK, Xu S (2013) Statistical Methods for Estimating Within-Cluster Effects for Clustered Poisson Data. J Biomet Biostat 4: 159. doi:10.4172/2155-6180.1000159
J Biomet BiostatISSN:2155-6180 JBMBS, an open access journal
Page 2 of 6
Volume 4 • Issue 1 • 1000159
Yij denote the outcome for the jth subject (j=1,…,ni) in the ith cluster (i=1,…,K), E(Yij =λij, and there is an exposure indicator variable xij equal to 1 for exposed and 0 for unexposed subjects. We assume a log link function,
log(λij)=α+βxij+γi (1)
Where α is the intercept, β is a parameter for the exposure variable xij, and γi are cluster specific effects, and independent across clusters. We assume that Yij|λij~Poisson (λij) and Yij are independent across clusters, and within clusters conditional on γi. The following six statistical methods were considered for analyzing this type of clustered Poisson data.
Independent Poisson model (IP)
IP assumes that there are no cluster effects, γi=0 for all clusters. Maximum Likelihood Estimates (MLE) can be obtained with standard softwares, using likelihood techniques. In this paper, SAS PROC GENMOD with log link function and Poisson distribution were used to fit this model. The IP model ignores the correlation among observations within a cluster, and thus serves as a standard for other models, if the correlation is zero. It also serves as a benchmark indicating how biased, inefficient or invalid it is to ignore the correlation, when the actual correlation is not zero.
Fixed Cluster effects Poisson model (FCP)
FCP assumes that the γi is unknown, but fixed coefficients. MLEs for β and γi are obtained from standard softwares (e.g. SAS PROC GENMOD), by including clusters as fixed effects in the model. However, the usual asymptotic theory does not hold when the number of parameters increases with the number of clusters. The FCP model cannot be used to estimate between-cluster effects, since they are collinear with the γi.
Conditional likelihood Poisson estimation (CP)
In CP, the γi are treated as nuisance parameters, and are conditioned out of the likelihood function [9,10]. The conditional joint density of the ni observations in cluster i is
1,...,1
11
exp( )( | )
exp( )!
ij
i
i i i
yn
ijii in i n n
j ijij jj
xsf y y sxy
β
β===
=
∏∑∏
Where 1
ini ijj
s y=
= ∑ is the sufficient statistic for γi. The above
density function is free of the cluster effects, γi,due to conditioning on its sufficient statistics. The cluster effect γi are not necessarily independent of the covariates xij, although dependencies are conditioned out along with the γi. To obtain MLEs, SAS PROC NLMIXED was used to fit the CP model, by defining the log likelihood function and using the general (ll) statement. The CP model estimates purely within-cluster effects, and cannot estimate effects of between-cluster covariates.
Generalized Estimating Equations (GEE)
GEE is used to estimate population average parameters, where marginal models are specified. It is not a likelihood based approach. The model is specified as log(λij)=α*+β*xij, and the correlation among subjects in a cluster is accounted for, by assuming a ‘working’ correlation matrix, in this case Corr(Yij,Yih)=ρ for all pairs, with j≠h [11]. We used SAS PROC GENMOD to fit the model with the empirical corrected variance estimate for its robustness throughout this paper.
Random Cluster effects Poisson model (RCP)
RCP assumes that the γi in (1) are independently and identically distributed N(0,σ2), with σ2 representing between cluster variance. The likelihood of observations in a cluster conditional on γi is a product of Poisson densities, and the marginal likelihood is obtained by integrating over the γi. In general, the integral cannot be evaluated in closed form. Numerical integrations were carried out, and MLEs were obtained with SAS PROC NLMIXED.
Random Cluster effects Poisson model separating between- and within-cluster effects (RCP_bw)
If the clusters do not have the same exposure ratio, the cluster means of exposure ratios represent between-cluster information, and between- and within-cluster exposure effects are separable [1]. We refer to this model as RCP_bw. Equation (1) is modified to
ij ijlog( ( )w bi i ix x xλ α β β γ) = + − + +
Where βb represents the between-cluster exposure effect, βw represents the within-cluster exposure effect, and is the focus of this paper, ix is the mean of xi. Likelihood ratio tests can be used to test, if βw=βb. If they are equal, RCP_bw reduces to RCP.
Issues related to appropriate statistical approaches for analysis of clustered data have been investigated in a number of studies with binary outcomes, as mentioned previously. The FCP method accounts for cluster differences, but has been shown to have severe biases in the case of matched pairs [14]. The CP method accounts for clustering effect, and is consistent and asymptotically efficient for matched pairs with binary outcomes [15]. It is also robust to the distribution of random effects, and to the association of random cluster effects γi with covariates xij. However, it cannot estimate effects of between-cluster covariates. GEE accounts for clustering of subjects, and is easy to carry out using standard software (e.g. SAS PROC GENMOD). However, it has been noted to have high type I error rates for between-cluster effects in clustered binary data [5]. RCP and RCP_bw account for clustering of subjects, and when applicable, they seem to be the best models for analyzing clustered binary outcomes [1,2]. They do make distributional assumptions on the γi, however, it has been shown in other studies [16,17], that these assumptions do not substantially affect estimates of covariate effects.
There have been fewer studies with clustered Poisson data as outcome. It has been shown that with Poisson outcomes, FCP and CP, give the same estimate of within-cluster exposure effect, regardless of equality of exposure ratios [18]. Demidenko [19] studied clustered Poisson models and showed equality of some of the estimators described above, assuming constant and balanced (equal numbers of exposed and unexposed in each cluster) exposure ratios and equal cluster sizes. Gail [20] and Petersen and Deddens [21] showed that in designs balanced in all covariates with Poisson data as outcome, removing covariates does not affect estimates of effects of other covariates, which is related to equality of FCP and IP in our situation.
Theoretical ResultsWith constant exposure ratio, regardless of the number of subjects
in each cluster being constant or not, IP, CP, FCP, and RCP methods
The coefficients α* and β* are estimated by solving the generalized estimating equations. In the Poisson case, the marginal parameter β* from GEE corresponds to the subject-specific parameter β in (1), although the intercepts α and α* differ [12,13].
Citation: Gao D, Grunwald GK, Xu S (2013) Statistical Methods for Estimating Within-Cluster Effects for Clustered Poisson Data. J Biomet Biostat 4: 159. doi:10.4172/2155-6180.1000159
J Biomet BiostatISSN:2155-6180 JBMBS, an open access journal
Page 3 of 6
Volume 4 • Issue 1 • 1000159
have the same MLE of β
1 1
0 0
ˆ log s / nâs / n
=
(2)
And its asymptotic variance is
0 1
1 1ˆvar( )s s
β ≈ + (3)
In (2) and (3), n1 and s1 are the total number of subjects, and total number of events for the exposed group (x=1), and n0 and s0 are the corresponding numbers for the unexposed group (x=0). Note that
Square root of ^
var( )β is the standard error of ^β (Appendix).
With constant exposure ratio designs, the results show that cluster effects γi can be ignored, and simple Poisson regression can be used to estimate the exposure effect, which does not require cluster size being constant. Equations (2) and (3) provide straightforward sample-based expressions of the similar results, with less restrictive assumptions, compared to studies by Gail [20], Petersen and Deddens [21] and Demidenko [19]. Calculation of the marginal likelihood for the RCP method requires integration over the random effects, and in general, the integral cannot be evaluated in closed form, so a simple analytical result is unexpected. In our case, g(γ), the density function of γ, needs not be Gaussian as typically assumed, and (2) and (3) hold generally for random effects distributions, that are sufficiently smooth.
Assuming normally distributed random effects in the RCP model, the theoretical asymptotic variance of
^β using the expected
information is
2 21 122 2
0 12
1 1 1ˆvar( )log ( | )L s n e n eE
α σ α β σβ
ββ
+ + +≈ = +
∂− ∂
(4)
It is not intuitive that ^
var( )β in equation (4) is inversely
proportional to the between cluster variance σ2. This is due to the fact that the mean of log normal distribution is proportional to the σ2, E(Y)=exp(α+βx+σ2/2), consequently the standard error of β estimate is smaller because of larger mean of Y. Equation (4) is useful in interpreting the simulation results, and in sample size estimation for designs with constant or near constant exposure ratio across clusters. Another common random effects model uses Poisson distribution conditional on the random effects that follow a gamma distribution [22,23]. The marginal likelihood of this model is in closed form, and the corresponding MLE and its asymptotic variance can be derived algebraically.
Note that the equalities derived and discussed above refer to estimates and standard errors for the coefficient of exposure effect, β, only. Other aspects of the models (e.g. intercept α, likelihood) may differ.
Simulations and ResultsWe performed simulations to study the impact of exposure ratio,
cluster size, and between cluster variance on bias and precision of estimates of β, the within-cluster exposure effect. 500 data sets were simulated under each condition.
Simulations
Clustered Poisson data were simulated according to model (1) with
γ independent and identically distributed N (0,σ2). A single binary exposure variable was included. The following parameter values were selected: α=0; β=0 and 0.25 (results with β=0.5 were not reported, as they are similar to the results with β=0.25); and σ2=0, 0.5, 1.0, and 2.0, describing cluster heterogeneity.
We considered the following cluster characteristics: 1) cluster size (ni). Two designs were used, constant cluster size with ni=6 subjects per cluster, or varying cluster size with cluster sizes ni=6 to 42 subjects, by an increment of 6 among clusters. 2) Number of clusters (K), K=20, 30 or 50 clusters for constant cluster size design, and K=30 clusters for varying cluster size design. 3) exposure ratios, exposure ratios 3:3 for each cluster, describing constant ratio and balanced clusters; 1:5 (one exposed and 5 unexposed subjects) for each cluster, describing constant ratio, but unbalanced clusters; and a varying ratio design, where the exposure ratio varies randomly among clusters.
Evaluation measures
Simulation results
Bias of β̂ : Our theoretical derivations showed that under constant exposure ratio designs four models, IP, FCP, CP, and RCP, generate the same estimate of β, which is a simple closed form as in (2). Simulation results (not shown) verified these theoretical results, and also indicated no bias of practical importance in any cases, including the varying exposure ratio and varying cluster size designs.
Precision of β̂ : Table 1 shows the precision of estimation of β, measured in three ways. For constant exposure ratio designs, theoretical results show that the asymptotic standard errors are the same for IP, FCP, CP and RCP, which is verified by simulations. It is also shown that
ˆavg{SE( )}β correctly depict the variability of β̂ since they agree with ˆ( )SD β , and both agree with the theoretical result, ˆ( )SE β as in (4). For
GEE approach, ˆ( )SD β is very similar to that of the other methods, but ˆavg{SE( )}β tends to be slightly smaller with larger σ2 values, or varying
exposure ratio designs, or smaller numbers of clusters (K=20, data not shown). Implications of this for type I error rates are discussed below.
It also shows greater precision of β̂ for 3:3 designs, compared to 1:5 designs with the same number of clusters and subjects. This can also be seen from equations (3) and (4), and it mirrors the usual benefits in precision from balanced designs (e.g. equal group size t-tests). For constant exposure ratio designs, precision of β̂ increases as σ2 increases, this agrees with equation (4). Equation (4) also shows that
ˆvar( )β is inversely proportional to β, and to the numbers of exposed and unexposed subjects, which agrees with our simulations (data not shown). Note that these results relating precision to cluster variance depend on the normality assumption of the random effects. For
The six statistical methods were compared based on bias and standard error of the estimates. Bias was calculated as the average of the 500 estimates of β minus its true value. The Standard Error (SE) of the estimate of β was calculated three ways: as the average of the 500 standard errors given by the procedures, denoted ˆavg{SE( )}β ; as the standard deviation of the 500 estimates of β, denoted ˆSD( )β , which in general represents the true variability empirically; and using the theoretical expression in (4), denoted ˆSE( )β , which is available only for constant exposure ratio designs. If the theory used by the procedure is appropriate and there is no bias,
^ˆavg{SE( )} ( )SDβ β= ; if the theory used to derive (4) holds, the three expressions are equal. Because little bias was noted in any cases, ˆavg{SE( )}β is approximately the root mean squared error. We also examined type I error rates with β=0 in simulations, and calculated as percentage of samples with p-values less than 0.05.
Citation: Gao D, Grunwald GK, Xu S (2013) Statistical Methods for Estimating Within-Cluster Effects for Clustered Poisson Data. J Biomet Biostat 4: 159. doi:10.4172/2155-6180.1000159
J Biomet BiostatISSN:2155-6180 JBMBS, an open access journal
Page 4 of 6
Volume 4 • Issue 1 • 1000159
models of the form (1), the method used in the appendix can be used to derive the corresponding theoretical results for other random effect distributions. All of these patterns continue to hold when the cluster sizes are not equal. The varying and fixed cluster size results are not directly comparable, because of different numbers of subjects in a cluster.
For varying exposure ratio designs (Table 1), IP does poorly as expected, since it ignores clustering, giving very high ˆ( )SD β that is not reflected by ˆavg{SE( )}β . FCP and CP have the same likelihood function (Appendix), and give identical results. Table 1 shows that under varying exposure ratio designs, regardless of the cluster size being constant or not, FCP/CP and RCP_bw have the same ˆavg{SE( )}β and
ˆ( )SD β . Close examination of individual results (not shown) indicates that there may be slight differences between FCP/CP and RCP_bw for individual samples, so this may not be a mathematical equality. These three methods use purely within-cluster information. The ˆ( )SD β from RCP and GEE are similar, yet the procedure average standard error
ˆavg{SE( )}β of GEE tends to be slightly smaller than that of RCP. Again, this affects type I error rates. Compared to RCP and GEE, estimates of β from FCP/CP and RCP_bw tend to have slightly larger variability, as the latter are based on only the within-cluster information, while RCP and GEE use both within- and between-cluster information. Similar patterns have been noted in the binary outcome case [5].
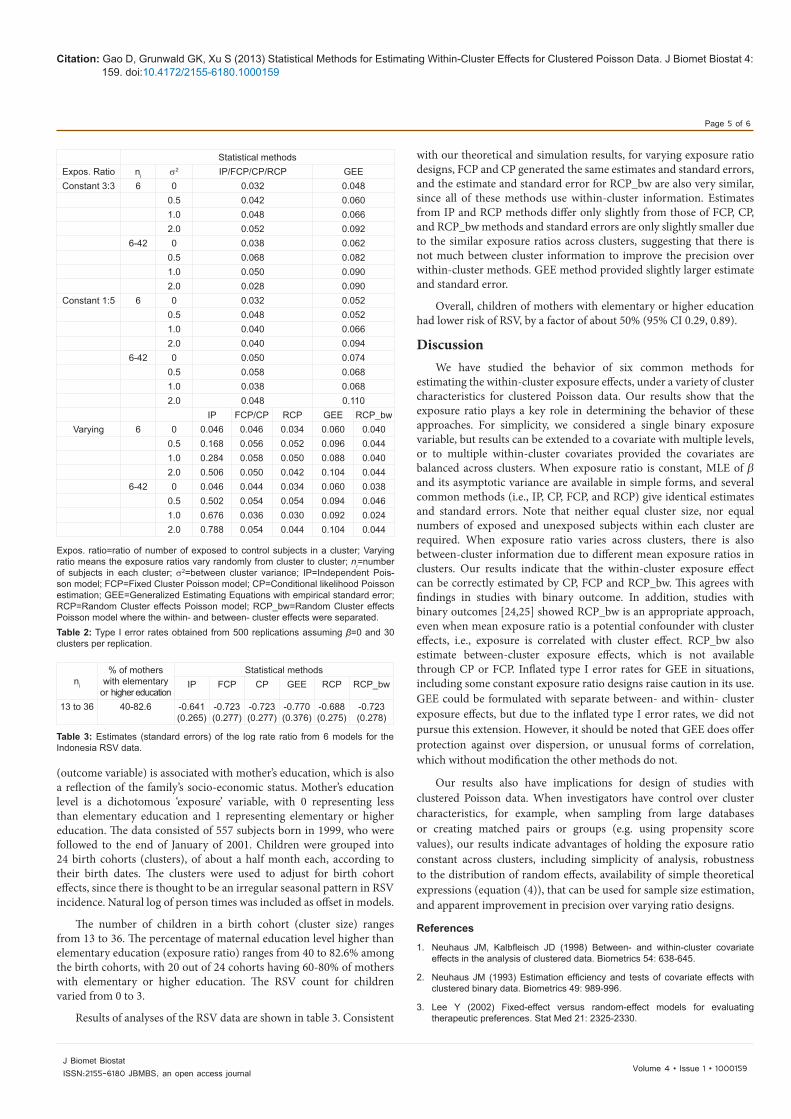
Type I error rates: Table 2 shows type I error rates under the null hypothesis, β=0. Type I error rates for constant exposure ratio designs remain at, or near 0.05 for IP, FCP, CP, and RCP in balanced 3:3, unbalanced 1:5, and varying cluster size designs. Type I error rates for GEE tend to be greater than 0.05, up to 0.10, with higher type I error rates occurring for larger σ2. This corresponds with the slightly smaller procedure standard errors ˆavg{SE( )}β which underestimate ˆ( )SD β in table 1. Again, ˆ( )SD β represents the true empirical variability. Inflated type I error rates have also been observed for GEE with binary outcomes [5]. Patterns are similar for varying exposure ratio designs, except that IP is, as expected, invalid with very high type I error rates. ˆavg{SE( )}β from GEE in table 1 is the empirical standard errors, as commonly recommended for their robustness. We repeated the analyses with the model-based standard errors. We found that when the between-cluster variance is zero, the model-based standard errors are very similar to the empirical standard errors, but as the between-cluster variance increases, the model-based standard errors become substantially larger than those from other methods, resulting in loss in estimation efficiency.
Respiratory Syncytial Virus (RSV) Infection in Indonesian Infants
We applied these six approaches to the Indonesian infant RSV data. One of our objectives was to examine if child’s frequency of RSV
ˆˆ{ ( )}avg SE β 1 ( ˆ( )SD β )2 3ˆ( )SE β
Expos. ratio ni 2σ IP/FCP/CP/RCP GEE theory
Constant 3:3 6 0 0.141 (0.133) 0.138 (0.133) 0.1410.5 0.125 (0.118) 0.121 (0.118) 0.124
1.0 0.112 (0.113) 0.106 (0.113) 0.1092.0 0.090 (0.091) 0.082 (0.091) 0.085
6-42 0 0.070 (0.069) 0.068 (0.069) 0.0700.5 0.063 (0.058) 0.060 (0.059) 0.0621.0 0.056 (0.054) 0.054 (0.055) 0.0552.0 0.046 (0.044) 0.043 (0.047) 0.043
Constant 1:5 6 0 0.181 (0.176) 0.178 (0.176) 0.1810.5 0.161 (0.144) 0.155 (0.144) 0.1591.0 0.144 (0.136) 0.135(0.136) 0.1412.0 0.117 (0.118) 0.107 (0.118) 0.110
6-42 0 0.090 (0.092) 0.088 (0.092) 0.0900.5 0.081 (0.082) 0.076 (0.082) 0.080
1.0 0.072 (0.074) 0.068 (0.074) 0.0702.0 0.059 (0.057) 0.054 (0.060) 0.055
IP FCP/CP RCP GEE RCP_bwVarying 6 0 0.141 (0.141) 0.154 (0.153) 0.142 (0.142) 0.136 (0.142) 0.154 (0.153)
0.5 0.126 (0.180) 0.138 (0.141) 0.135 (0.141) 0.130 (0.141) 0.138 (0.141)1.0 0.113 (0.213) 0.123 (0.124) 0.122 (0.123) 0.115 (0.122) 0.123 (0.124)2.0 0.091 (0.293) 0.099 (0.107) 0.099 (0.107) 0.090 (0.107) 0.099 (0.107)
6-42 0 0.070 (0.069) 0.089 (0.089) 0.071 (0.068) 0.067 (0.069) 0.089 (0.090)0.5 0.063 (0.186) 0.080 (0.085) 0.079 (0.083) 0.075 (0.083) 0.080 (0.085)1.0 0.057 (0.272) 0.072 (0.074) 0.071 (0.073) 0.067 (0.074) 0.072 (0.074)2.0 0.047 (0.405) 0.058 (0.060) 0.058 (0.060) 0.054 (0.066) 0.058 (0.060)
Exposure ratio=ratio of number of exposed to control subjects in a cluster; Varying ratio means the exposure ratios vary randomly from cluster to cluster; in =number of subjects in a cluster; σ2=between cluster variance; IP=Independent Poisson model; FCP=Fixed Cluster Poisson model; CP=Conditional likelihood Poisson estimation; GEE-Generalized Estimating Equations with empirical standard error; RCP=Random Cluster effects Poisson model; RCP_bw=Random Cluster effects Poisson model where the within- and between- cluster effects were separated.1 ˆˆ{ ( )}avg SE β , average of procedure standard errors across 500 samples2 ˆ( )SD β , standard deviation of the 500 estimates of β3 ˆ( )SE β , theoretical standard error in (4) calculated from expected information
Table 1: Precision of estimates of β obtained from 500 replications with β=0.25 and 30 clusters per replication.
Citation: Gao D, Grunwald GK, Xu S (2013) Statistical Methods for Estimating Within-Cluster Effects for Clustered Poisson Data. J Biomet Biostat 4: 159. doi:10.4172/2155-6180.1000159
J Biomet BiostatISSN:2155-6180 JBMBS, an open access journal
Page 5 of 6
Volume 4 • Issue 1 • 1000159
(outcome variable) is associated with mother’s education, which is also a reflection of the family’s socio-economic status. Mother’s education level is a dichotomous ‘exposure’ variable, with 0 representing less than elementary education and 1 representing elementary or higher education. The data consisted of 557 subjects born in 1999, who were followed to the end of January of 2001. Children were grouped into 24 birth cohorts (clusters), of about a half month each, according to their birth dates. The clusters were used to adjust for birth cohort effects, since there is thought to be an irregular seasonal pattern in RSV incidence. Natural log of person times was included as offset in models.
The number of children in a birth cohort (cluster size) ranges from 13 to 36. The percentage of maternal education level higher than elementary education (exposure ratio) ranges from 40 to 82.6% among the birth cohorts, with 20 out of 24 cohorts having 60-80% of mothers with elementary or higher education. The RSV count for children varied from 0 to 3.
Results of analyses of the RSV data are shown in table 3. Consistent
with our theoretical and simulation results, for varying exposure ratio designs, FCP and CP generated the same estimates and standard errors, and the estimate and standard error for RCP_bw are also very similar, since all of these methods use within-cluster information. Estimates from IP and RCP methods differ only slightly from those of FCP, CP, and RCP_bw methods and standard errors are only slightly smaller due to the similar exposure ratios across clusters, suggesting that there is not much between cluster information to improve the precision over within-cluster methods. GEE method provided slightly larger estimate and standard error.
Overall, children of mothers with elementary or higher education had lower risk of RSV, by a factor of about 50% (95% CI 0.29, 0.89).
DiscussionWe have studied the behavior of six common methods for
estimating the within-cluster exposure effects, under a variety of cluster characteristics for clustered Poisson data. Our results show that the exposure ratio plays a key role in determining the behavior of these approaches. For simplicity, we considered a single binary exposure variable, but results can be extended to a covariate with multiple levels, or to multiple within-cluster covariates provided the covariates are balanced across clusters. When exposure ratio is constant, MLE of β and its asymptotic variance are available in simple forms, and several common methods (i.e., IP, CP, FCP, and RCP) give identical estimates and standard errors. Note that neither equal cluster size, nor equal numbers of exposed and unexposed subjects within each cluster are required. When exposure ratio varies across clusters, there is also between-cluster information due to different mean exposure ratios in clusters. Our results indicate that the within-cluster exposure effect can be correctly estimated by CP, FCP and RCP_bw. This agrees with findings in studies with binary outcome. In addition, studies with binary outcomes [24,25] showed RCP_bw is an appropriate approach, even when mean exposure ratio is a potential confounder with cluster effects, i.e., exposure is correlated with cluster effect. RCP_bw also estimate between-cluster exposure effects, which is not available through CP or FCP. Inflated type I error rates for GEE in situations, including some constant exposure ratio designs raise caution in its use. GEE could be formulated with separate between- and within- cluster exposure effects, but due to the inflated type I error rates, we did not pursue this extension. However, it should be noted that GEE does offer protection against over dispersion, or unusual forms of correlation, which without modification the other methods do not.
Our results also have implications for design of studies with clustered Poisson data. When investigators have control over cluster characteristics, for example, when sampling from large databases or creating matched pairs or groups (e.g. using propensity score values), our results indicate advantages of holding the exposure ratio constant across clusters, including simplicity of analysis, robustness to the distribution of random effects, availability of simple theoretical expressions (equation (4)), that can be used for sample size estimation, and apparent improvement in precision over varying ratio designs.
References
1. Neuhaus JM, Kalbfleisch JD (1998) Between- and within-cluster covariate effects in the analysis of clustered data. Biometrics 54: 638-645.
2. Neuhaus JM (1993) Estimation efficiency and tests of covariate effects with clustered binary data. Biometrics 49: 989-996.
3. Lee Y (2002) Fixed-effect versus random-effect models for evaluating therapeutic preferences. Stat Med 21: 2325-2330.
Statistical methodsExpos. Ratio ni σ2 IP/FCP/CP/RCP GEEConstant 3:3 6 0 0.032 0.048
0.5 0.042 0.0601.0 0.048 0.0662.0 0.052 0.092
6-42 0 0.038 0.0620.5 0.068 0.0821.0 0.050 0.0902.0 0.028 0.090
Constant 1:5 6 0 0.032 0.0520.5 0.048 0.0521.0 0.040 0.0662.0 0.040 0.094
6-42 0 0.050 0.0740.5 0.058 0.0681.0 0.038 0.0682.0 0.048 0.110
IP FCP/CP RCP GEE RCP_bwVarying 6 0 0.046 0.046 0.034 0.060 0.040
0.5 0.168 0.056 0.052 0.096 0.0441.0 0.284 0.058 0.050 0.088 0.0402.0 0.506 0.050 0.042 0.104 0.044
6-42 0 0.046 0.044 0.034 0.060 0.0380.5 0.502 0.054 0.054 0.094 0.0461.0 0.676 0.036 0.030 0.092 0.0242.0 0.788 0.054 0.044 0.104 0.044
Expos. ratio=ratio of number of exposed to control subjects in a cluster; Varying ratio means the exposure ratios vary randomly from cluster to cluster; ni=number of subjects in each cluster; σ2=between cluster variance; IP=Independent Pois-son model; FCP=Fixed Cluster Poisson model; CP=Conditional likelihood Poisson estimation; GEE=Generalized Estimating Equations with empirical standard error; RCP=Random Cluster effects Poisson model; RCP_bw=Random Cluster effects Poisson model where the within- and between- cluster effects were separated. Table 2: Type I error rates obtained from 500 replications assuming β=0 and 30 clusters per replication.
ni
% of mothers with elementary
or higher education
Statistical methodsIP FCP CP GEE RCP RCP_bw
13 to 36 40-82.6 -0.641(0.265)
-0.723(0.277)
-0.723(0.277)
-0.770(0.376)
-0.688(0.275)
-0.723(0.278)
Table 3: Estimates (standard errors) of the log rate ratio from 6 models for the Indonesia RSV data.
Citation: Gao D, Grunwald GK, Xu S (2013) Statistical Methods for Estimating Within-Cluster Effects for Clustered Poisson Data. J Biomet Biostat 4: 159. doi:10.4172/2155-6180.1000159
J Biomet BiostatISSN:2155-6180 JBMBS, an open access journal
Page 6 of 6
Volume 4 • Issue 1 • 1000159
4. Ten Have TR, Ratcliffe SJ, Reboussin BA, Miller ME (2004) Deviations from the population-averaged versus cluster specific relationship for clustered binary data. Stat Methods Med Res 13: 3-16.
5. Heo M, Leon AC (2005) Comparison of statistical methods for analysis of clustered binary observations. Stat Med 24: 911-923.
6. Kang W, Lee MS, Lee Y (2005) HGLM versus conditional estimators for the analysis of clustered binary data. Stat Med 24: 741-752.
7. Sills MR, Shetterly S, Xu S, Magid D, Kempe A (2007) Association between parental depression and children’s healthcare utilization. Pediatrics 119: e829-e836.
8. Austin PC (2008) A critical appraisal of propensity-score matching in the medical literature between 1996 and 2003. Stat Med 27: 2037-2049.
9. Farrington CP (1995) Relative incidence estimation from case series for vaccine safety evaluation. Biometrics 51: 228-235.
10. Agresti A (2002) Categorical data analysis. (2nd edn), Wiley-Interscience.
11. Liang KY, Zeger SL (1986) Longitudinal data analysis using generalized linear models. Biometrika 73: 13-22.
12. Diggle PJ, Heagerty P, Liang KY, Zeger SL (2002) Analysis of longitudinal data. (2nd edn), Oxford University Press, New York, USA.
13. Gromping U (1996) A note on fitting a marginal model to mixed effects Log-linear regression data via GEE. Biometrics 52: 280-285.
14. Andersen EB (1970) Asymptotic properties of conditional maximum-likelihood estimators. J R Stat Soc Series B Stat Methodol 32: 283-301.
15. Neuhaus JM, Kalbfleisch JD, Hauck WW (1994) Conditions for consistent estimation in mixed-effects models for binary matched-pairs data. Can J Stat 22: 139-148.
16. Neuhaus JM, Hauck WW, Kalbfleisch JD (1992) The effects of mixture distribution misspecification when fitting mixed-effects logistic models. Biometrika 79: 775-762.
17. Geert V, Lesaffre E (1997) The linear mixed model. A critical investigation in the context of longitudinal data. In: Proceedings of the nantucket conference on modelling longitudinal and spatially correlated data: methods, applications, and future directions, New York, USA.
18. Cameron AC, Trivedi PK (1998) Regression analysis of count data. Cambridge University Press, UK.
19. Demidenko E (2007) Poisson regression for clustered data. Int Stat Rev 75: 96-113.
20. Gail MH (1988) The effect of pooling across strata in perfectly balanced studies. Biometrics 44: 151-162.
21. Petersen MR, Deddens JA (2000) Effects of omitting a covariate in Poisson models when the data are balanced. Can J Stat 28: 439-445.
22. Guo G (1996) Negative multinomial regression models for clustered event counts. Sociological Methodology 26: 113-132.
23. Solis-Trapala IL, Farewell VT (2005) Regression analysis of overdispersed correlated count data with subject specific covariates. Stat Med 24: 2557-2575.
24. Berlin JA, Kimmel SE, Ten Have TR, Sammel MD (1999) An empirical comparison of several clustered data approaches under confounding due to cluster effects in the analysis of complications of coronary angiography. Biometrics 55: 470-476.
25. Localio AR, Berlin JA, Ten Have TR, Kimmel SE (2001) Adjustments for center in multicenter studies: an overview. Ann Intern Med 135: 112-123.
Citation: Gao D, Grunwald GK, Xu S (2013) Statistical Methods for Estimating Within-Cluster Effects for Clustered Poisson Data. J Biomet Biostat 4: 159. doi:10.4172/2155-6180.1000159
![Zhang et al., J Biomet Biostat 2012, S7 Biometrics ... Papers/2012... · head (ONH) via ophthalmoscopy of fundus imaging [6] and etc. Due to the complexity and variety of the disease](https://img.pdfslide.us/doc/110x75/5ec284acfe18821f054fe682/zhang-et-al-j-biomet-biostat-2012-s7-biometrics-papers2012-head-onh.jpg)