Embed Size (px)
Citation preview
1
BANKERS’ ERRORS IN SCREENING NEW FIRMS
Jean Bonnet *, Sylvie Cieply
** and Marcus Dejardin
***
* University of Caen, CREM-CAEN, UMR CNRS 6211, Faculty of Economics and Business Administration,
19, rue Claude Bloch, 14032 Caen, France, [email protected]
**
University of Caen, CREM-CAEN, UMR CNRS 6211, Institut Banque-Assurance,
19 rue Claude Bloch, 14032 Caen, France, [email protected]
*** Université Catholique de Louvain and University of Namur, CERPE, Faculty of Economics, Social Sciences
and Business Administration,
8, Rempart de la Vierge, 5000 Namur, Belgium, [email protected]
Draft version: February 23, 2012
Abstract:
Bankers are making errors when screening new firms. Two types can be distinguished. Both
are based on informational asymmetries. The first error corresponds to credit rationing “à la
Stiglitz and Weiss” (1981) and consists in not financing good risks. The second error “à la De
Meza and Webb” (1987) relates to firms receiving credit although they should have not. How
much reliable are these classics? Challenging theories through the exploitation of a very rich
dataset on new French firms from the late Twentieth Century, we show that the Stiglitz and
Weiss constraint is not highly spread. The imperfection of the credit market described by De
Meza and Webb appears more realistic. In addition, we identify factors influencing the
decision of bankers to grant credit and explaining the errors they make. Our results make a
plea for bankers’ risk assessment to be fed by systematic multivariate analysis of the actual
outcomes obtained by starters.
Key words:
Credit Rationing, Over Financing, Informational Asymmetries, Errors, Bankers.
JEL Classification:
M13, D82, G21

2
1. Introduction
Banks do exist because they screen and monitor borrowers more efficiently than other
investors would (Goodhart, 1989, Bhattacharya and Thakor, 1993, Allen and Santomero,
1998, Fama, 1985). Banks are superior to non financial agents because they are specialized in
gathering private information and treating it (Freixas and Rochet, 1999). By granting bigger
loans than private non financial agents would be able to, they reduce transaction costs
(Benston and Smith, 1976) and limit free-riding problems (Diamond, 1984, Bhattacharya,
Boot and Thakor, 2004). Banks are superior to other financial institutions too because they
manage money and deposit accounts, and consequently they own highly strategic information
on firms’ receipts and expenditures and on the way firms develop themselves or not (Ruhle,
1997, Diamond and Rajan, 2001).
Despite all these comparative advantages of banks, relationships between bankers and
firms are not perfect. Banks indeed suffer from informational asymmetries and agency
problems (Freixas and Rochet, 1999). In this context, prices cannot clear the market and (non-
walrassian) equilibrium arises with a fringe of unsatisfied agents.
For Keynes (1930), the unsatisfied agents are borrowers. Stiglitz and Weiss (1981)
propose an explanation for it. In their model, entrepreneurs launch projects. By assumption,
they all require the same external finance, and projects have the same mean return but differ
in their risk. The individual characteristics of entrepreneurs are privileged information owned
by entrepreneurs and very imperfectly shared with outside investors. In this model, bankers
only know the distribution of entrepreneurs’ characteristics. Consequently, the risk of projects
cannot be easily and perfectly accessed. Bankers may not be able to differentiate adequately
between high risk and low risks firms and projects. Moreover, once loans have been granted,
borrowers may not be able to perfectly monitor firms. In all these cases, increasing the interest
rate may be disastrous. A rise in interest rate would drive the “best” firms (lower risks) to
refuse loans proposals they would consider as too costly (adverse selection). Additionally, it
may incite firms to launch riskier projects, leading to an excessively risky portfolio (moral
hazard). Ultimately, because of these informational imperfections, bankers may prefer simply
not to lend credit and equilibrium on the credit market may arise with rationing1.
De Meza and Webb (1987) contest this result. Like in Stiglitz and Weiss (1981), all
projects require the same initial investments and the same level of external finance. Bankers
are assumed to have no prior information on entrepreneurs’ characteristics too. In contrast to
Stiglitz and Weiss (1981) however, De Meza and Webb (1987) consider that the mean return
of projects varies across firms. In their model, entrepreneurs differ from each other in
expected return and not in risk. This change in hypotheses has serious consequence. De Meza
and Webb (1987) find neither credit rationing nor under-investment but, on the contrary, over-
financing and over-investment; too many entrepreneurial projects are financed2. More
recently, De Meza and Webb (2000) show that even a credit-rationing equilibrium may
involve excessive lending. Their model combines the assumption that entrepreneurs differ in
intrinsic quality (and not only in risk) with the moral hazard problem described by Stiglitz and
Weiss. In this model, rationing occurs as a result of moral hazard and coexists with over-
investment due to heterogeneous agents. Whether banks randomly screen customers, the
result may be more lending than the optimal situation under full information3.
1 The consequence of this market failure is under-investment (Hubbard, 1998, Jaffee and Stiglitz, 1990) and
appropriate policy is to subsidize lending. 2 Here, appropriate policy is no more to subsidize lending but to tax it.
3 In this case, “subsidizing inactivity and taxing lending may yield a Pareto improvement” (De Meza and Webb,
2000, p. 218).

3
In the two polar cases described above (credit rationing and over-financing), bankers
do not succeed in perfectly discriminating “good” firms and/or projects; the imperfection of
information leads bankers to make errors in the screening of applicants for credit. This error
can be either a lack of credit (“error à la Stiglitz and Weiss”) or an excessive offer of credit
(“error à la De Meza, Webb”), these two cases being potentially observed simultaneously on
the credit market for different agents.
The objective of this paper is to collect some evidence to identify what kind of error is
the most prevalent in the credit market for new firms. In both popular and academic presses,
there is the widespread idea that entrepreneurial activity is hampered by a limited access to
banking loans. The financing of new firms is so supposed to be a perfect field to apply the
Stiglitz and Weiss model whilst any consensus on the existence of credit rationing does not
come into view by surveying empirical studies. For instance, Evans and Jovanovic (1989),
Evans and Leighton (1989), Holtz-Eakin, Joulfaian and Rosen (1994a and 1994b) and
Johansson (2000) derive from a significant positive relationship between entrepreneur’s
wealth and the probability to become self-employed that start-ups suffer from capital gap. But
this interpretation is criticized by Cressy (1996) who supports the idea that the correlation
between financial capital and the survival of new firms is spurious and that the treatment of
endogeneity between the determinants of banking loans and those of entrepreneurial activity
stresses mainly the role of human capital4. A report by OECD (2006) supports as well the idea
that “in a number of high income OECD countries, there is little evidence of an overall
scarcity of financing for SMEs” (p. 11). Berger and Udell (1998) adopt an intermediate
position: they argue that while the macro effects of credit rationing may be small, there is
evidence to suggest that when credit is rationed for some firms it may be more readily
available to others.
Better understanding of errors made by bankers when they screen new firms may have
policy implications. Many policymakers believe that new firms have inadequate access to
banking loans as a result of market imperfections. In response, significant resources are being
channeled into the financing of new firms. For example, support programs help bankers to
finance new firms based on collateral programs and/or co-financing devices. However, if
these imperfections lead to an excessive supply of loans (and not to a lack of loans), these
solutions may be totally inappropriate.
We address these issues using a firm level qualitative data source produced by the
French National Institute of Statistics and Economic Studies (INSEE). The dataset relates to
the situation in France, during the mid-nineties. It builds on an original survey that was
carried out on a cohort of new firms set up, or taken over, during the first half of 1994.
Interestingly, this survey gathers information on both demands for credit by entrepreneurs and
supply of credit by bankers. It was no longer the case for following surveys on more recent
cohorts of new firms.
The main result is to show that credit rationing and over financing may coexist. It was
the case on the French credit market for new firms in the mid-nineties. Accordingly, the De
Meza and Webb model (2000) appears to be more appropriate than the Stiglitz and Weiss one
(1981). Even a credit-rationing equilibrium may involve excessive lending. Additionally, our
results allow identifying the determining characteristics of entrepreneurs and firms according
to their group (the credit rationing group and the excessive lending group). This is important
as they may be subject to different public policies.
4 “Provision of finance is demand-driven, with banks supplying funds elastically and business request governing
take-up. Firms self-select for funds on the basis of the human capital endowments of the proprietors with ‘better’
business more likely to borrow. A reason why others have seemingly identified start-up debt-gaps may be the
failure to test a sufficiently rich empirical model” (Cressy, 1996, p. 1253).

4
The remaining of the paper is structured as follows. Section 2 presents the data.
Section 3 introduces the empirical strategy that we designed to test new firms access to credit
and bankers’ errors. Statistical and econometric results are presented in section 4. The paper
ends with a discussion of the findings.
2. Data
We rely on the SINE data5 produced by the French National Institute of Statistics and
Economic Studies (INSEE). These data give information on the financing policy of young
firms when they are created and, where applicable, their financial problems in the following
two years. Additionally, they allow the characterization of the entrepreneur, his/her track
record, and the context. The SINE dataset does not refer to the general entrepreneurial
intention in the French population but to entrepreneurial projects that are concretized in new
firms. As a consequence, entrepreneurial intentions that are aborted due to financial
constraints are not reported. The point is of importance as the firm financing conditions are
considered.
The first-wave survey (SINE 94-1) was conducted in 1994 among a sample of 30 778
firms which had been set up or taken over during the first half of 1994, and survived at least
for one month. The sample6 is representative of the total population which was of 96 407 new
firms belonging to the private productive sector, active in the fields of industry, building,
trade and services. A second-wave survey (SINE 94-2), carried out in 1997, gives information
about the status of the same firms three years after their start: are they closed down or still
running. In the following research and for the sake of consistency, we consider only new
firms that have been active in the same field over the entire period, i.e. without change of
(branch of) activity during the period; with unvarying legal status; and set up by individuals in
the Metropolitan France, meaning that firm subsidiaries and French overseas department are
excluded. Finally we consider only new firms with banking relationships, i.e. new firms that
have asked for banking loans, at their start. We remain with a sample of 8 855 units,
representing 22 760 new firms.
3. Empirical strategy
Our empirical strategy entails two steps. First, we identify and classify bankers’ errors
by distinguishing whether they can be derived from Stiglitz-Weiss or De Meza-Webb way of
modeling credit market imperfections. Second, econometric analyses are performed to deliver
information on factors associated with access to credit, and to identify the determinants of
bankers’ errors.
To define the new firm situation regarding the credit market, we first use information
indicating whether banks were granting credit or not to the start-up (acceptance versus
refusal). We then identify bankers’ errors derived from the theoretical literature. The error “à
la Stiglitz and Weiss” (SW error) corresponds to the case of new firms that are denied credit
although they are successful in developing their project. Success is proxied by the fact that the
firm is still alive three years after the start. The error “à la De Meza and Webb” (DMW error)
refers to new firms that receive credit although they fail in developing their project; failure
being here proxied by the fact that the firm ceases activities during the three years period after
5 SINE stands for “Système d'information sur les nouvelles entreprises”.
6 It is a compulsory survey which obtained a 98.8 % rate of reply. The sample was built by randomly drawing
out samples from 416 (2x8x26) elementary strata: origin (start-up or takeover: 2 modalities), branch (8
modalities) and localization (22 French regions plus 4 overseas départements). The exploitation of the database
involves the use of a weight variable (the reverse of the draw rate per branch, per region and per origin).

5
the start. As a final point, we consider as good firms, all firms still alive after three years. It
means that we include those firms whose survival does not depend on access to credit. The
other firms, i.e. all dead firms whatever they ask and obtain, or are denied credit, are
considered as bad firms.
Our econometric modeling strategy is summarized in Table 1, where are crossed
respectively the resulting decision of the screening process by bankers, expressed in terms of
erroneous or non-erroneous decision, and the ex post observed quality of firms, i.e. are they
still alive or did they die during the three years period after the start.
Table 1: Econometric modeling strategy
Ex post quality of firm
Ex ante discrimination
of bankers
Good
Firms still alive after three
years
Bad
Firms died during the
three years period after
the start
Total
Errors Firms ask for credit and are
denied it (a): SW error
Firms ask for credit and
obtain it (c): DMW error
Errors
(a+c)
Model 4
a vs. b
Model 1 (b+c) vs. (a+d)
Model 5
c vs. d
Model 3
(a+c) vs (b+d)
Non Errors Firms ask for credit and
obtain it (b)
Firms ask for credit and
are denied it (d)
Non errors
(b+d)
Total Still alive firms
(a+b) Model 2
(a+b) vs. (c+d)
Dead firms
(c+d)
The first model (Model 1) looks for factors used to screen applicants for credit. The
model is logistic. The binary output variable corresponds to bankers’ decision. This variable is
equal to 1 when loan is granted and zero when credit is denied. We look for determinants of
the likelihood that banks will grant a loan to a start-up. This model is tested on the global
sample that concerns all firms, whatever their status may be (still alive three years after their
start, or closed down). Exogenous variables concern the characteristics of firms and those of
entrepreneurs.
The relationship between firm survival and access to credit is not trivial: when a firm
is not indebted, the risk to default is automatically reduced. To assess the impact of obtaining
credit on firm survival, another logistic model (Model 2) is tested with the status of firms
(alive or closed down) as the binary endogenous variable (equal to 1 when firms are still alive
three years after their start; 0, otherwise) and the access to credit among exogenous variables.
The third logistic model (Model 3) looks for the determinants of errors whatever these
errors may be (SW error or DMW error). We identify consequently the variables which can
be more frequently associated with errors. In this new logistic model, the endogenous variable
is equal to 1 if bankers make an error and zero otherwise.
With the estimation of two additional logistic models (Models 4 and 5), we identify
variables which are associated, first, with SW error; and, second, with DMW error. The
endogenous variable for these models is equal to 1 if bankers make a SW (a DMW) error and
zero otherwise. Estimations are respectively run on the sub-population of firms still alive
three years after their start, and on the sub-sample of dead firms.
All estimated models include several control variables characterizing the new firm and
its context: origin, branch of industry, financial public aid, start-up size, initial investment.
The other variables which have been retained describe the entrepreneur. They comprise the
entrepreneur’s human capital measured through his or her previous status, previous
occupation, level of diploma, skills acquired during previous activity, length of the experience
in the same branch of activity, size of the firm in which it was acquired, the main motive for
the business to be set-up, the present managing experience, and the number of new firms set

6
up before. We also control for the entrepreneur’s social capital linked to entrepreneurship and
business ownership (family antecedents, or friends), and other individual characteristics
(gender, age and nationality).
4. Results
4.1. Descriptive statistics
On a population of 66 873 new firms set up in 1994, only 22 760 asked indeed for
credit at the beginning of activity; meaning that only a third of new firms ask for credit at
their start. And, out of these 22 760, only 2 801 firms are denied banking loans. The rate of
loan refusals is therefore only 12.31%.
Table 2 describes the distribution of new firms with credit demand among different
cases bound to both the status of firms three years after their start (still alive or died) and the
errors of bankers (SW errors or DMW errors). Errors concern 35.49% of the sample. SW
errors only concern 5.02% of the total sample, and 14.15% of all errors made by bankers.
Most of errors are thus DMW errors. DMW errors concern 30.47% of the total sample and
85.85% of errors made by bankers. Bankers appear to grant too much credit taking into
account the final risk of default among new firms.
Table 2: Distribution of new firms with credit demand
Ex post quality of firm Good Bad Total
Ex ante discrimination
of bankers
Errors SW error DMW error Errors
1 143 6 935 8 078
5,02%*/14,15%**/8,08% 30,47%*/85,85%**/80,71% 35,49%*/100%**/35,49%***
Non Errors Non error Non error Non error
13 024 1 658 14 682
57,22%*/88,71%**/91,92%*** 7,28%*/11,29%**/19,29%*** 64,51%*/100%**/64,51%***
Total 14 167
62,25%*/62.25%**/100%***
8 593
37,75%*/37,75%**/100%***
22 760
100%*, **, ***
Lecture of the table: * % of the cell in the total sample, **% of the cell in the line, ***% of the cell in the column

7
4.2. Bankers’ decision to grant credit to new firms
Model 1 (see Table 3) identifies factors that influence the decision of bankers to grant
credit to new firms or not. The factors that influence positively the acceptance of credit
demand are, among firms’ characteristics, to buy out an existing firm rather than to start an
ex-nihilo new firm, to belong to some sectors where customers are individuals rather than
firms (Agriculture and Food Industry, Construction, Catering, Households Services), to
receive public aid and to benefit from a high financial capital (more than 100 000 kF) to start.
Among entrepreneurs’ characteristics, the factors that make it likely to receive a bank loan are
some status of the owner-manager before the start-up (being craftsman or skilled worker) and
an experience close to this new venture. On the contrary, the factors that negatively influence
the acceptance for credit demand are: to work in the branch of activity services for firms, to
have two employees or more, a low level of financial capital (less than 100 000 kF), to be a
foreigner, to be a man, to be formerly unemployed or without activity as to be workers and
executives, to be a graduate (bachelor or undergraduate), to be incited to create a firm because
of unemployment and not to benefit from an entrepreneurial environment.
We also confirm the role of financial capital to increase access to credit for new firms.
Public aid produces quite the same impact on the likelihood of firms to get access to credit.
The role of human capital, in particular the status of entrepreneur, i.e. his professional and
academic background, is more ambiguous: being graduated makes new firms’ access to credit
decrease whereas past experiences in the same field play a positive role in access to credit.
We must notice that the access of new firms to credit is an important factor, which
contributes to firms’ survival (Model 2; see Table 4). On the global population (22 760 firms),
14 157 firms are still alive after four years whereas 8 593 closed down. The decision of
bankers is an important determinant of the likelihood of firms to survive or not more than four
years. Refusals of credit to new firms by bankers indeed negatively influence the likelihood of
firms to survive as does belonging to the Catering branch of activity and employing more than
five persons. A short life span of the firm is related to entrepreneurs under 35 years old or
from 45 to 50 years old; with a professional status of middle management executive; long
term or short-term unemployed, without activity, without any degree and with an experience
which is not strictly in the same sector. On the contrary, we notice that high equity when they
start (more than 100 kf) and the allowance of public aid play, as banking loans, a positive role
in the probability of survival of new firms.

8
Table 3. Model 1: Factors affecting the decision of bankers to grant credit
Variable
Reference modality
Estimation std Wald Pr > Khi 2
Intercept 2.3051 0.1193 373.4784 <.0001
Origin Start-up Buy out 0.6486 0.0560 133.9453 <.0001
Branch of Activity
Trade
Agriculture and food industry 1.1236 0.1744 41.5163 <.0001
Industry 0.1202 0.0847 2.0163 0.1556
Transportation 0.4003 0.0806 24.6877 <.0001
Construction 0.1782 0.0968 3.3865 0.0657
Catering 0.5336 0.0783 46.4981 <.0001
Household services 0.8635 0.0870 98.4238 <.0001
Services to firms -0.2360 0.0727 10.5501 0.0012
Public financial aid Non obtained Obtained 0.7361 0.0567 168.5946 <.0001
Initial size of the firm
No employee
1 employee -0.1026 0.0598 2.9456 0.0861
2 – 5 employees -0.1823 0.0646 7.9616 0.0048
+ 5 employees -1.0140 0.1094 85.9699 <.0001
Total amount of money invested at the beginning
7623 - 15244 euros
Less than 1525 euros -1.0184 0.0875 135.4209 <.0001
1525 – 3811 euros -0.5136 0.0775 43.8970 <.0001
3812 – 7622 euros -0.1836 0.0693 7.0185 0.0081
15245– 38112 euros 0.2857 0.0648 19.4462 <.0001
38113 – 76225 euros 0.7012 0.0860 66.5384 <.0001
76226 – 152450 euros 1.0278 0.1142 81.0397 <.0001
+ 152450 euros 2.5393 0.2314 120.4475 <.0001
Nationality
French
European foreigner -0.3061 0.1207 6.4277 0.0112
Non European foreigner -1.3153 0.0974 182.3957 <.0001
Gender Woman Man -0.2517 0.0555 20.5342 <.0001
Age of the entrepreneur
30 – 35 years old
- 25 years old 0.1834 0.0917 3.9942 0.0457
25 – 30 years old 0.2562 0.0729 12.3535 0.0004
35 – 40 years old 0.0826 0.0717 1.3280 0.2492
40 – 45 years old 0.3164 0.0768 16.9694 <.0001
45 – 50 years old 0.1395 0.0830 2.8265 0.0927
+ 50 years old 0.1972 0.0962 4.2006 0.0404
Previous professional status Employee
Craftsman 0.3535 0.1004 12.4024 0.0004
Manager -0.1512 0.1211 1.5604 0.2116
Supervisor worker 0.2188 0.1091 4.0221 0.0449
Middle management position -0.1820 0.0899 4.0954 0.0430
Executive -0.1371 0.0785 3.0477 0.0809
Worker -0.1543 0.0714 4.6656 0.0308
Student -0.0691 0.0907 0.5808 0.4460
Previous occupation of the entrepreneur
Labor force
Short term unemployed -0.8298 0.0664 156.1301 <.0001
Long term unemployed -1.1112 0.0747 221.3827 <.0001
Non-working -0.6861 0.1129 36.9500 <.0001
Level of diploma
Intermediate level
No diploma 0.00707 0.0750 0.0089 0.9248
Secondary school diploma -0.1539 0.0638 5.8200 0.0158
Till two years at university -0.2095 0.0787 7.0827 0.0078
From three years and more at university -0.0471 0.0894 0.2770 0.5987
Experience in the same branch of activity
No experience
Close vocational experience 0.2536 0.0695 13.3078 0.0003
Different experience -0.2088 0.0825 6.4021 0.0114
Close experience for the partner -0.2131 0.1256 2.8805 0.0897
Length of the experience
More than 10 years
No experience -0.3583 0.1559 5.2792 0.0216
3 years experience -0.4205 0.0822 26.1526 <.0001
3 – 10 years experience -0.1406 0.0678 4.3015 0.0381
Size of the firm in which the experience was acquired
Between 4 and 9 employees
Less than 3 employees 0.00640 0.0767 0.0070 0.9335
Between 10 and 49 employees 0.1576 0.0806 3.8234 0.0505
Between 50 and 99 employees -0.4706 0.1160 16.4645 <.0001
Between 100 and 199 employees 0.2734 0.1506 3.2929 0.0696
Between 200 and 499 employees -0.5882 0.1446 16.5503 <.0001
More than 500 employees -0.3006 0.1172 6.5796 0.0103
Entrepreneurship "milieu" Family or friends No -0.1479 0.0496 8.9099 0.0028
Main motivation to set up his firm
Taste for entrepreneurship
Start for new idea -0.0911 0.0848 1.1538 0.2828
Catch an opportunity 0.0553 0.0596 0.8628 0.3529
Start for necessity -0.4806 0.0637 56.8594 <.0001
Example of the surrounding 0.0137 0.1221 0.0125 0.9110
Present exercise of entrepreneur role No Yes -0.2057 0.0807 6.4916 0.0108
Previous setting up of new firms
No
1 start up -0.3912 0.0735 28.3205 <.0001
2 or 3 start ups -0.5120 0.1085 22.2685 <.0001
+ 4 start ups -0.7590 0.1895 16.0411 <.0001

9
Table 4. Model 2: Factors affecting the survival of new firms
Variable
Reference modality
Estimation std Wald Pr > Khi 2
Intercept 0.3950 0.0802 24.2707 <.0001
Bank loan asked accepted Denial of credit -0.6756 0.0460 216.0252 <.0001
Origin Start-up Buy out 0.6767 0.0356 361.3093 <.0001
Branch of Activity
Trade
Agriculture and food industry 0.1979 0.0834 5.6328 0.0176
Industry 0.3497 0.0623 31.5000 <.0001
Transportation 0.4978 0.0585 72.3142 <.0001
Construction 0.6319 0.0724 76.1305 <.0001
Catering -0.3257 0.0460 50.1399 <.0001
Household services 0.6119 0.0532 132.1264 <.0001
Services to firms -0.0498 0.0561 0.7868 0.3751
Public financial aid Non obtained Obtained 0.1471 0.0403 13.2992 0.0003
Initial size of the firm No employee
1 employee 0.0295 0.0400 0.5436 0.4609
2 – 5 employees -0.0422 0.0425 0.9841 0.3212
+ 5 employees -0.3301 0.0826 15.9769 <.0001
Total amount of money invested at the beginning
7623 - 15245 euros
Less than 1525 euros -0.0423 0.0741 0.3257 0.5682
1525 – 3811 euros 0.0659 0.0600 1.2086 0.2716
3812 – 7622 euros 0.0728 0.0509 2.0473 0.1525
15245– 38112 euros 0.3500 0.0443 62.4807 <.0001
38113 – 76225 euros 0.7367 0.0539 187.1441 <.0001
76226 – 152450 euros 0.9104 0.0643 200.4301 <.0001
+ 152450 euros 1.2156 0.0836 211.3771 <.0001
Nationality French
European foreigner 0.3345 0.0927 13.0136 0.0003
Non European foreigner -0.1037 0.0898 1.3326 0.2483
Gender Woman Man 0.0843 0.0363 5.3951 0.0202
Age of the entrepreneur 30 – 35 years old
- 25 years old -0.5509 0.0642 73.5986 <.0001
25 – 30 years old -0.2507 0.0500 25.0993 <.0001
35 – 40 years old -0.0873 0.0505 2.9907 0.0837
40 – 45 years old -0.1012 0.0524 3.7313 0.0534
45 – 50 years old -0.1786 0.0567 9.9143 0.0016
+ 50 years old -0.1235 0.0675 3.3473 0.0673
Previous professional status Employee
Craftsman 0.0623 0.0620 1.0100 0.3149
Manager 0.1772 0.0899 3.8896 0.0486
Supervisor worker 0.4160 0.0717 33.6759 <.0001
Middle management position -0.0486 0.0651 0.5559 0.4559
Executive 0.2454 0.0543 20.4434 <.0001
Worker 0.2322 0.0490 22.4341 <.0001
Student -0.1082 0.0653 2.7513 0.0972
Previous occupation of the entrepreneur
Labor force
Short term unemployed -0.2714 0.0456 35.4986 <.0001
Long term unemployed -0.3533 0.0533 43.9530 <.0001
Non-working -0.6923 0.0776 79.5783 <.0001
Level of diploma
Intermediate level
No diploma -0.3076 0.0520 35.0441 <.0001
Secondary school diploma 0.1046 0.0435 5.7763 0.0162
Till two years at university 0.1511 0.0547 7.6419 0.0057
From three years and more at university 0.6733 0.0661 103.7856 <.0001
Experience in the same branch of activity
No experience
Close vocational experience -0.4646 0.0466 99.3689 <.0001
Different experience -0.8670 0.0559 240.5805 <.0001
Close experience for the partner -0.8467 0.0827 104.8190 <.0001
Length of the experience More than 10 years
No experience -0.4188 0.1141 13.4595 0.0002
3 years experience -0.2338 0.0579 16.3128 <.0001
3 – 10 years experience -0.1384 0.0460 9.0539 0.0026
Size of the firm in which the experience was acquired
Between 4 and 9 employees
Less than 3 employees -0.00345 0.0508 0.0046 0.9458
Between 10 and 49 employees -0.2045 0.0550 13.8224 0.0002
Between 50 and 99 employees -0.2677 0.0895 8.9479 0.0028
Between 100 and 199 employees -0.0439 0.1058 0.1720 0.6784
Between 200 and 499 employees -0.1486 0.1168 1.6197 0.2031
More than 500 employees -0.3360 0.0824 16.6229 <.0001
Entrepreneurship "milieu" Family or friends No 0.0753 0.0350 4.6426 0.0312
Main motivation to set up his firm
Taste for entrepreneurship
Start for new idea -0.0706 0.0602 1.3757 0.2408
Catch an opportunity 0.1240 0.0384 10.4460 0.0012
Start for necessity -0.2156 0.0481 20.0836 <.0001
Example of the surrounding -0.1850 0.0824 5.0415 0.0247
Present exercise of entrepreneur role No Yes 0.0897 0.0568 2.4935 0.1143
Previous setting up of new firms
No
1 start up -0.0351 0.0531 0.4362 0.5090
2 or 3 start ups -0.6696 0.0750 79.7467 <.0001
+ 4 start ups 0.2013 0.1519 1.7575 0.1849

10
4.3. Errors made by bankers when they screen new firms
As shown by estimation of Model 3 (see Table 5), errors are positively linked with the
allowance of public aid to new firms. Errors are more frequent when entrepreneurs are
European ones, when they are over 50 years old, when they were executives or without
activity, when they are undergraduate, without experience or with an experience of less than
three years, when their motivation to create a firm is to escape unemployment and when they
created several firms in the past. On the contrary, errors are less frequent when firms survive,
when they are denied credit at birth, when they are takeovers, from several sectors
(Agriculture and Food Industry, Building, Transportation, Hotels/Restaurant, Services), when
the size (number of employees and total equity to start) is rather high, when entrepreneurs are
non European ones, when they are men, supervisor workers before starting the new firm and
unemployed for a short term.
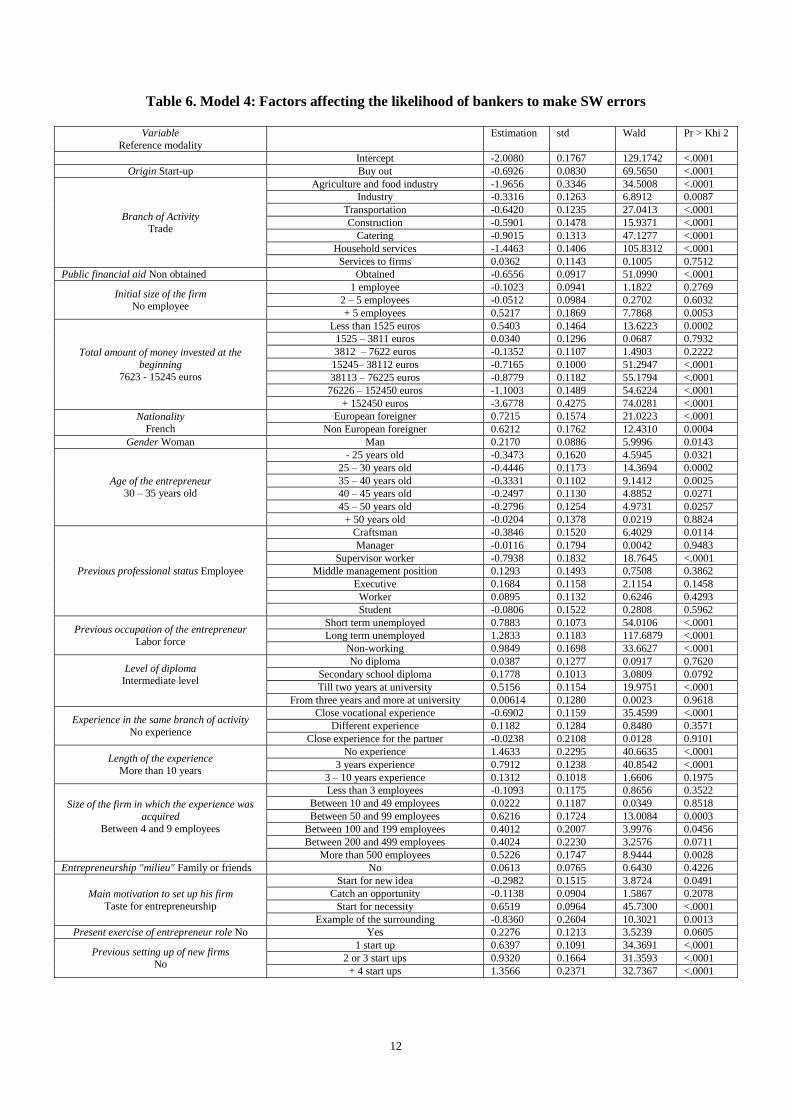
By testing the Model 4 (see Table 6), we identify factors affecting the likelihood of
SW errors. On the population of firms which are still alive three years after their start (14 167
firms), the SW error concerns 1 143 firms. SW Errors are positively linked with a high
number of employees (more than five) and a small amount of equity at the beginning of firms’
life (less than 10 kF). This error is more frequent when the entrepreneurs are not French,
when they are men, when they are unemployed (short and long term) or without any activity,
when they are undergraduate, when their experience is inferior to 3 years, when the desire to
start a new firm is bound to unemployment or when they created more than, at least, one firm
in the past. SW errors are negatively linked with buyouts, all sectors except services to firms,
the allowance of public aid, high equity at the beginning, a past experience of entrepreneurs as
craftsmen or supervisor workers, a close experience before starting and a motive to create a
new firm based on new idea and in an entrepreneurial context.
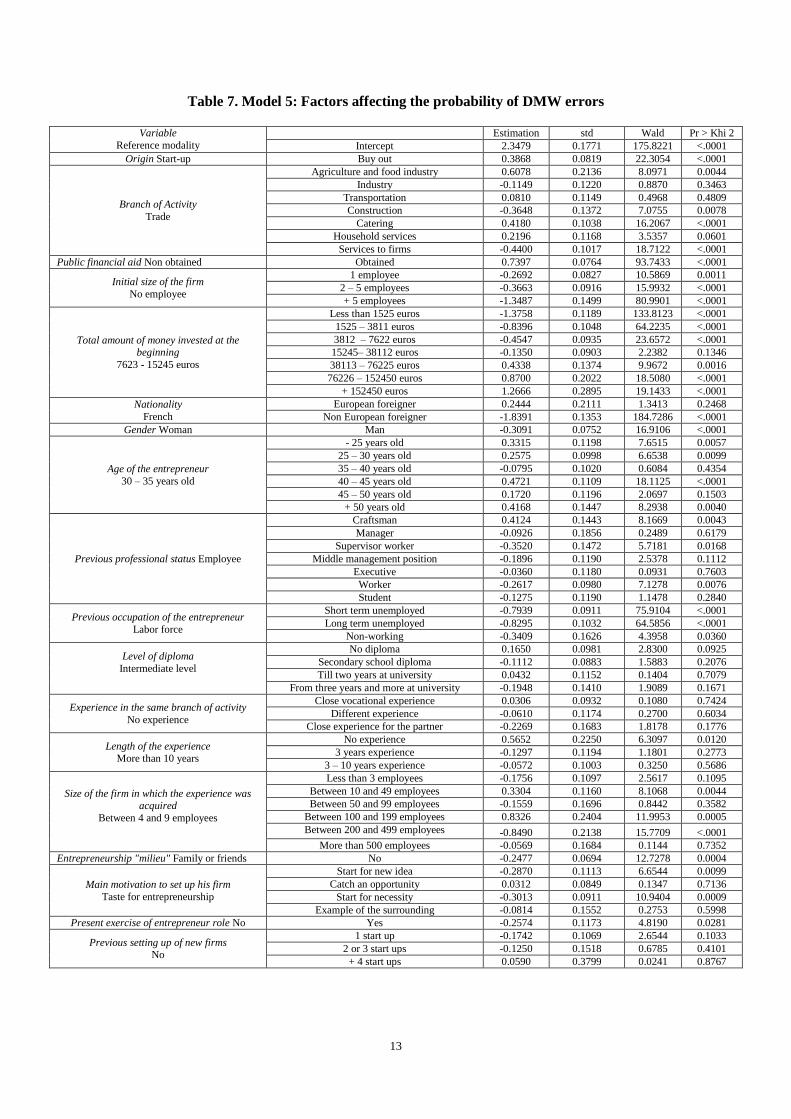
By testing the Model 5 (see Table 7), we identify factors affecting the frequency of
DMW errors. On the population of firms which did not survive in the three years after they
start (8 593 firms), the DMW errors concern 6 935 firms. DMW errors are positively linked
with buyouts, some sectors (Agriculture and food industry, Hotels and restaurants, … ), public
aid, high equity at the beginning of firms’ life (more than 250 kF) and past experience of
entrepreneurs as craftsmen. Public aids in this case are a source of inefficiency on the credit
market. Buyouts or high equity are interpreted as signal of quality that can finally hide the
reality of high risks to bankers. DMW Errors are negatively linked to other sectors (transport,
services to firms) and to a small amount of equity at the beginning of firms’ life (less than 50
kF). DMW errors decrease when firm employs at least one employee, when the entrepreneur
is non European, when they are men rather than women, supervisor workers, executives, or
skilled and unskilled workers, when they are unemployed (short and long term) or without
any activity, with diploma (A-level or postgraduate) and when their motive to create is based
on escaping unemployment.

11
Table 5. Model 3: Factors affecting the likelihood of bankers to make errors
Variable
Reference modality
Estimation std Wald Pr > Khi 2
Intercept 2.2010 0.1193 340.4779 <.0001
Status of the firm closed down Still alive -4.0704 0.0477 7287.0029 <.0001
Bank loan asked accepted Denial of credit -0.8890 0.0613 210.0244 <.0001
Origin Start-up Buy out -0.1355 0.0509 7.0725 0.0078
Branch of Activity Trade
Agriculture and food industry -0.2874 0.1201 5.7290 0.0167
Industry -0.1239 0.0876 2.0010 0.1572
Transportation -0.1792 0.0834 4.6122 0.0317
Construction -0.4066 0.1021 15.8629 <.0001
Catering 0.0265 0.0660 0.1609 0.6883
Household services -0.4694 0.0749 39.2621 <.0001
Services to firms -0.1686 0.0791 4.5422 0.0331
Public financial aid Non obtained Obtained 0.1208 0.0564 4.5917 0.0321
Initial size of the firm No employee
1 employee -0.2053 0.0573 12.8582 0.0003
2 – 5 employees -0.2693 0.0602 20.0026 <.0001
+ 5 employees -0.7059 0.1142 38.2191 <.0001
Total amount of money invested at the
beginning
7623 - 15245 euros
Less than 1525 euros -0.7256 0.1013 51.261 <.0001
1525 – 3811 euros -0.4545 0.0851 28.5362 <.0001
3812 – 7622 euros -0.287 0.0735 15 <.0001
15245– 38112 euros -0.3158 0.0643 24.0875 <.0001
38113 – 76225 euros -0.264 0.0764 11.9216 0.0006
76226 – 152450 euros -0.3179 0.0909 12.2205 0.0005
+ 152450 euros -0.9084 0.1157 61.6601 <.0001
Nationality
French
European foreigner 0.5772 0.1248 21.3885 <.0001
Non European foreigner -0.962 0.1178 66.7172 <.0001
Gender Woman Man -0.101 0.052 3.7735 0.0521
Age of the entrepreneur 30 – 35 years old
- 25 years old 0.0512 0.0908 0.3179 0.5728
25 – 30 years old -0.0482 0.0711 0.4587 0.4982
35 – 40 years old -0.1262 0.0718 3.0901 0.0788
40 – 45 years old 0.0872 0.0743 1.3779 0.2405
45 – 50 years old 0.012 0.0802 0.0225 0.8807
+ 50 years old 0.2945 0.0951 9.5924 0.002
Previous professional status Employee
Craftsman -0.0639 0.0896 0.5094 0.4754
Manager 0.24 0.124 3.7416 0.0531
Supervisor worker -0.3421 0.1025 11.1423 0.0008
Middle management position -0.1077 0.0913 1.3923 0.238
Executive 0.1573 0.0769 4.1806 0.0409
Worker -0.1121 0.0703 2.5426 0.1108
Student -0.1314 0.0907 2.0956 0.1477
Previous occupation of the entrepreneur
Labor force
Short term unemployed -0.1486 0.0643 5.3462 0.0208
Long term unemployed 0.1129 0.0752 2.2559 0.1331
Non-working 0.2993 0.1095 7.4651 0.0063
Level of diploma Intermediate level
No diploma -0.00212 0.0727 0.0009 0.9767
Secondary school diploma -0.0428 0.0623 0.4707 0.4927
Till two years at university 0.1752 0.0782 5.0238 0.025
From three years and more at university 0.0966 0.0887 1.1862 0.2761
Experience in the same branch of activity
No experience
Close vocational experience -0.2407 0.0672 12.8213 0.0003
Different experience 0.1525 0.0788 3.7453 0.053
Close experience for the partner 0.0353 0.1181 0.0892 0.7652
Length of the experience
More than 10 years
No experience 0.97 0.1626 35.5887 <.0001
3 years experience 0.2592 0.0822 9.9518 0.0016
3 – 10 years experience 0.099 0.0653 2.2962 0.1297
Size of the firm in which the experience was
acquired
Between 4 and 9 employees
Less than 3 employees -0.1784 0.0726 6.0352 0.014
Between 10 and 49 employees 0.2054 0.0775 7.0218 0.0081
Between 50 and 99 employees 0.2554 0.1234 4.2817 0.0385
Between 100 and 199 employees 0.6614 0.1466 20.3554 <.0001
Between 200 and 499 employees -0.3904 0.169 5.3388 0.0209
More than 500 employees 0.1449 0.1155 1.5742 0.2096
Entrepreneurship "milieu" Family or friends No -0.079 0.0497 2.5274 0.1119
Main motivation to set up his firm
Taste for entrepreneurship
Start for new idea -0.384 0.0847 20.5393 <.0001
Catch an opportunity 0.0773 0.0542 2.0319 0.154
Start for necessity 0.162 0.069 5.508 0.0189
Example of the surrounding -0.2141 0.1161 3.4028 0.0651
Present exercise of entrepreneur role No Yes 0.0567 0.0808 0.4921 0.483
Previous setting up of new firms No
1 start up 0.2481 0.0745 11.0855 0.0009
2 or 3 start ups 0.345 0.1078 10.2357 0.0014
+ 4 start ups 1.1797 0.1871 39.7596 <.0001
12
Table 6. Model 4: Factors affecting the likelihood of bankers to make SW errors
Variable
Reference modality
Estimation std Wald Pr > Khi 2
Intercept -2.0080 0.1767 129.1742 <.0001
Origin Start-up Buy out -0.6926 0.0830 69.5650 <.0001
Branch of Activity Trade
Agriculture and food industry -1.9656 0.3346 34.5008 <.0001
Industry -0.3316 0.1263 6.8912 0.0087
Transportation -0.6420 0.1235 27.0413 <.0001
Construction -0.5901 0.1478 15.9371 <.0001
Catering -0.9015 0.1313 47.1277 <.0001
Household services -1.4463 0.1406 105.8312 <.0001
Services to firms 0.0362 0.1143 0.1005 0.7512
Public financial aid Non obtained Obtained -0.6556 0.0917 51.0990 <.0001
Initial size of the firm No employee
1 employee -0.1023 0.0941 1.1822 0.2769
2 – 5 employees -0.0512 0.0984 0.2702 0.6032
+ 5 employees 0.5217 0.1869 7.7868 0.0053
Total amount of money invested at the
beginning
7623 - 15245 euros
Less than 1525 euros 0.5403 0.1464 13.6223 0.0002
1525 – 3811 euros 0.0340 0.1296 0.0687 0.7932
3812 – 7622 euros -0.1352 0.1107 1.4903 0.2222
15245– 38112 euros -0.7165 0.1000 51.2947 <.0001
38113 – 76225 euros -0.8779 0.1182 55.1794 <.0001
76226 – 152450 euros -1.1003 0.1489 54.6224 <.0001
+ 152450 euros -3.6778 0.4275 74.0281 <.0001
Nationality French
European foreigner 0.7215 0.1574 21.0223 <.0001
Non European foreigner 0.6212 0.1762 12.4310 0.0004
Gender Woman Man 0.2170 0.0886 5.9996 0.0143
Age of the entrepreneur 30 – 35 years old
- 25 years old -0.3473 0.1620 4.5945 0.0321
25 – 30 years old -0.4446 0.1173 14.3694 0.0002
35 – 40 years old -0.3331 0.1102 9.1412 0.0025
40 – 45 years old -0.2497 0.1130 4.8852 0.0271
45 – 50 years old -0.2796 0.1254 4.9731 0.0257
+ 50 years old -0.0204 0.1378 0.0219 0.8824
Previous professional status Employee
Craftsman -0.3846 0.1520 6.4029 0.0114
Manager -0.0116 0.1794 0.0042 0.9483
Supervisor worker -0.7938 0.1832 18.7645 <.0001
Middle management position 0.1293 0.1493 0.7508 0.3862
Executive 0.1684 0.1158 2.1154 0.1458
Worker 0.0895 0.1132 0.6246 0.4293
Student -0.0806 0.1522 0.2808 0.5962
Previous occupation of the entrepreneur
Labor force
Short term unemployed 0.7883 0.1073 54.0106 <.0001
Long term unemployed 1.2833 0.1183 117.6879 <.0001
Non-working 0.9849 0.1698 33.6627 <.0001
Level of diploma Intermediate level
No diploma 0.0387 0.1277 0.0917 0.7620
Secondary school diploma 0.1778 0.1013 3.0809 0.0792
Till two years at university 0.5156 0.1154 19.9751 <.0001
From three years and more at university 0.00614 0.1280 0.0023 0.9618
Experience in the same branch of activity
No experience
Close vocational experience -0.6902 0.1159 35.4599 <.0001
Different experience 0.1182 0.1284 0.8480 0.3571
Close experience for the partner -0.0238 0.2108 0.0128 0.9101
Length of the experience
More than 10 years
No experience 1.4633 0.2295 40.6635 <.0001
3 years experience 0.7912 0.1238 40.8542 <.0001
3 – 10 years experience 0.1312 0.1018 1.6606 0.1975
Size of the firm in which the experience was
acquired
Between 4 and 9 employees
Less than 3 employees -0.1093 0.1175 0.8656 0.3522
Between 10 and 49 employees 0.0222 0.1187 0.0349 0.8518
Between 50 and 99 employees 0.6216 0.1724 13.0084 0.0003
Between 100 and 199 employees 0.4012 0.2007 3.9976 0.0456
Between 200 and 499 employees 0.4024 0.2230 3.2576 0.0711
More than 500 employees 0.5226 0.1747 8.9444 0.0028
Entrepreneurship "milieu" Family or friends No 0.0613 0.0765 0.6430 0.4226
Main motivation to set up his firm
Taste for entrepreneurship
Start for new idea -0.2982 0.1515 3.8724 0.0491
Catch an opportunity -0.1138 0.0904 1.5867 0.2078
Start for necessity 0.6519 0.0964 45.7300 <.0001
Example of the surrounding -0.8360 0.2604 10.3021 0.0013
Present exercise of entrepreneur role No Yes 0.2276 0.1213 3.5239 0.0605
Previous setting up of new firms No
1 start up 0.6397 0.1091 34.3691 <.0001
2 or 3 start ups 0.9320 0.1664 31.3593 <.0001
+ 4 start ups 1.3566 0.2371 32.7367 <.0001
13
Table 7. Model 5: Factors affecting the probability of DMW errors
Variable
Reference modality
Estimation std Wald Pr > Khi 2
Intercept 2.3479 0.1771 175.8221 <.0001
Origin Start-up Buy out 0.3868 0.0819 22.3054 <.0001
Branch of Activity
Trade
Agriculture and food industry 0.6078 0.2136 8.0971 0.0044
Industry -0.1149 0.1220 0.8870 0.3463
Transportation 0.0810 0.1149 0.4968 0.4809
Construction -0.3648 0.1372 7.0755 0.0078
Catering 0.4180 0.1038 16.2067 <.0001
Household services 0.2196 0.1168 3.5357 0.0601
Services to firms -0.4400 0.1017 18.7122 <.0001
Public financial aid Non obtained Obtained 0.7397 0.0764 93.7433 <.0001
Initial size of the firm
No employee
1 employee -0.2692 0.0827 10.5869 0.0011
2 – 5 employees -0.3663 0.0916 15.9932 <.0001
+ 5 employees -1.3487 0.1499 80.9901 <.0001
Total amount of money invested at the beginning
7623 - 15245 euros
Less than 1525 euros -1.3758 0.1189 133.8123 <.0001
1525 – 3811 euros -0.8396 0.1048 64.2235 <.0001
3812 – 7622 euros -0.4547 0.0935 23.6572 <.0001
15245– 38112 euros -0.1350 0.0903 2.2382 0.1346
38113 – 76225 euros 0.4338 0.1374 9.9672 0.0016
76226 – 152450 euros 0.8700 0.2022 18.5080 <.0001
+ 152450 euros 1.2666 0.2895 19.1433 <.0001
Nationality
French
European foreigner 0.2444 0.2111 1.3413 0.2468
Non European foreigner -1.8391 0.1353 184.7286 <.0001
Gender Woman Man -0.3091 0.0752 16.9106 <.0001
Age of the entrepreneur
30 – 35 years old
- 25 years old 0.3315 0.1198 7.6515 0.0057
25 – 30 years old 0.2575 0.0998 6.6538 0.0099
35 – 40 years old -0.0795 0.1020 0.6084 0.4354
40 – 45 years old 0.4721 0.1109 18.1125 <.0001
45 – 50 years old 0.1720 0.1196 2.0697 0.1503
+ 50 years old 0.4168 0.1447 8.2938 0.0040
Previous professional status Employee
Craftsman 0.4124 0.1443 8.1669 0.0043
Manager -0.0926 0.1856 0.2489 0.6179
Supervisor worker -0.3520 0.1472 5.7181 0.0168
Middle management position -0.1896 0.1190 2.5378 0.1112
Executive -0.0360 0.1180 0.0931 0.7603
Worker -0.2617 0.0980 7.1278 0.0076
Student -0.1275 0.1190 1.1478 0.2840
Previous occupation of the entrepreneur
Labor force
Short term unemployed -0.7939 0.0911 75.9104 <.0001
Long term unemployed -0.8295 0.1032 64.5856 <.0001
Non-working -0.3409 0.1626 4.3958 0.0360
Level of diploma
Intermediate level
No diploma 0.1650 0.0981 2.8300 0.0925
Secondary school diploma -0.1112 0.0883 1.5883 0.2076
Till two years at university 0.0432 0.1152 0.1404 0.7079
From three years and more at university -0.1948 0.1410 1.9089 0.1671
Experience in the same branch of activity
No experience
Close vocational experience 0.0306 0.0932 0.1080 0.7424
Different experience -0.0610 0.1174 0.2700 0.6034
Close experience for the partner -0.2269 0.1683 1.8178 0.1776
Length of the experience
More than 10 years
No experience 0.5652 0.2250 6.3097 0.0120
3 years experience -0.1297 0.1194 1.1801 0.2773
3 – 10 years experience -0.0572 0.1003 0.3250 0.5686
Size of the firm in which the experience was acquired
Between 4 and 9 employees
Less than 3 employees -0.1756 0.1097 2.5617 0.1095
Between 10 and 49 employees 0.3304 0.1160 8.1068 0.0044
Between 50 and 99 employees -0.1559 0.1696 0.8442 0.3582
Between 100 and 199 employees 0.8326 0.2404 11.9953 0.0005
Between 200 and 499 employees -0.8490 0.2138 15.7709 <.0001
More than 500 employees -0.0569 0.1684 0.1144 0.7352
Entrepreneurship "milieu" Family or friends No -0.2477 0.0694 12.7278 0.0004
Main motivation to set up his firm
Taste for entrepreneurship
Start for new idea -0.2870 0.1113 6.6544 0.0099
Catch an opportunity 0.0312 0.0849 0.1347 0.7136
Start for necessity -0.3013 0.0911 10.9404 0.0009
Example of the surrounding -0.0814 0.1552 0.2753 0.5998
Present exercise of entrepreneur role No Yes -0.2574 0.1173 4.8190 0.0281
Previous setting up of new firms No
1 start up -0.1742 0.1069 2.6544 0.1033
2 or 3 start ups -0.1250 0.1518 0.6785 0.4101
+ 4 start ups 0.0590 0.3799 0.0241 0.8767

14
5. Discussion and conclusion
Our applied research sought to challenge existing and competing theories about credit
access. Regarding this aim, we first have shown that the constraint described by Stiglitz and
Weiss (1981) was not highly spread among French new firms during the mid-nineties. The
imperfection of the credit market described by DMW is a much more realistic model. Thus, in
a way, we confirm on the French case the result given by Cressy (1996) concerning British
new firms.
More originally, by examining factors affecting credit access, we confirm the positive
effect of both financial capital and public aid on access to credit. However, we emphasize the
negative effects of public aid on the quality of bankers’ discrimination. When public aid is
allowed, the likelihood that bankers make errors increases. The screening process used by
bankers is less efficient as soon as firms receive public aid. This result is due to the influence
of financial backing on the frequency of DMW errors. Public aid makes the errors “à la
DMW” increase. On the contrary, we notice that the SW error is negatively bound to public
aids. In this case, the likelihood of credit rationing “à la SW” decreases: firms are less often
excluded from the market of credit when they are eligible for them. We observe the same
effects on access to credit referring to high equity level at the start of the firm. As public aid
and/or relatively high capital contribution improve firms’ financial accounts, bankers are less
severe in their screening process and too optimistic when they assess firms’ risks of default.
The likelihood of errors and the nature of them are dependent on the firms’
characteristics, in particular the circumstances at their start. Financing takeovers is easier than
financing ex nihilo new firms. The global likelihood of bankers’ errors decreases. The effect
on bankers’ errors of this variable is very similar to the effect of financial capital. They both
make the likelihood of DMW errors increase whereas they make the likelihood of SW errors
decrease. On the contrary, when firms belong to the sector of services, their access to credit is
limited but bankers’ errors are less frequent.
The likelihood of errors and the nature of them are dependent on the entrepreneurs’
characteristics too. In particular, human capital (degree and experience) and personal
characteristics play a significant role in access to credit and in the nature of errors made by
bankers. When entrepreneurs are undergraduates, the access of new firms to credit decreases
and, at the same time, bankers’ errors increase. More precisely, we notice the increase in the
SW errors frequency when entrepreneurs are undergraduate. The same effect on errors is
identified when the experience of entrepreneur is inferior to three years before starting a new
firm. A low human capital identified by banks leads new firms to more credit rationing. We
confirm the positive role played by the observed human capital based on diploma and past
experiences. Concerning personal characteristics, we highlight the effect of the nationality of
entrepreneurs and their status on the job market too. As a whole, the screening process of
bankers appears to be more efficient when entrepreneurs are not European and when they are
not unemployed for a long time. In these cases, DMW errors are generally less frequent but
credit rationing (SW errors) is much higher. The screening process of banks is too severe in
comparison with the level of ex post risk and some projects are not financed by banks
although firms finally do not fail.

15
6. References
Allen F, Santomero A., (1998), “The Theory of Financial Intermediation”, Journal of Banking and
Finance, 21, 1461-1485.
Benston G., Smith C., (1976), “A Transaction Cost Approach To the Theory of Financial
Intermediation”, Journal of Finance, 2, 215-231.
Berger A., Udell G., (1998), “The Economics of Small Business Finance: The Roles of Private Equity
and Debt Markets In the Financial Growth Cycle”, Journal of Banking and Finance, 22, 613-673.
Bhattacharya S., Boot A., Thakor A., (2004), Credit, Intermediation and the Macroeconomy, OUP: Oxford.
Bhattacharya S., Thakor A., (1993) “Contemporary Banking Theory”, Journal of Financial
Intermediation, 3, 2-50.
Cressy R., (1996), “Are Business Start-ups Debt-Rationed?” Economic Journal, 438, pp. 1253-1270.
De Meza D.E., Webb D.C., (2006), “Credit Rationing: Something's Gotta Give”, Economica, 73, 563-578.
De Meza D.E., (2002), “Over lending”, The Economic Journal, 112, pp.17-30.
De Meza D.E., Webb, D.C., (1987), “Too Much Investment: a Problem of Asymmetric Information”,
Quarterly Journal of Economics, 102, 281-292.
De Meza D.E., Webb, D.C., (2000), “Does Credit Rationing Imply Insufficient Lending?” Journal of
Public Economics, 78, 215-234.
Diamond D., Rajan R., (2001), “Liquidity Risk, Creation and Financial Fragility: A Theory Of
Banking”, Journal of Political Economy, 2, 287-327.
Diamond D.W., (1984), “Financial Intermediation and Delegated Monitoring “, Journal of Economic
Studies, vol. LI, 393-414.
Evans D. S., Leighton L., (1989), “Some Empirical Aspects of Entrepreneurship”, American
Economic Review, 79 (3), 519-535.
Evans D., Jovanovic B., (1989), “An Estimated Model of Entrepreneurial Choice under Liquidity
Constraints”, Journal of Political Economy, 97(4), 808-827.
Evans D., Leighton L., (1989), “Some Empirical Aspects of Entrepreneurship”, American Economic
Review, 79(3), 519-535.
Fama E.F., (1985), “What’s Different about Banks ?”, Journal of Monetary Economic, 1, pp. 29-39.
Freixas X., Rochet J., (1999), Microeconomics of Banking, MIT Press : Cambridge (Mass.).
Goodhart C.A.E. (1989), Money, Information and Uncertainty, Macmillan: Basingstoke.
Holtz-Eakin D., Joulfaian D., Rosen H., (1994a), “Entrepreneurial Decisions and Liquidity
Constraints”, Rand Journal of Economics, 25(2), 334-347.
Holtz-Eakin, D., Joulfaian, D., Rosen H.S., (1994b), “Sticking It Out: Entrepreneurial Survival and
Liquidity Constraints”, Journal of Political Economy, 102 (1), 53-75.
Hubbard G., (1998), “Capital-Market Imperfections and Investment”, Journal of Economic Literature,
36(1), pp. 193-225.
Jaffee D., Stiglitz J.E., (1990): “Credit rationing” in B.M. Friedman and F.H. Hahn (Eds.): Handbook
of Monetary Economics, vol. II, North Holland, pp. 838-888.
Johansson E., (2000), “Self-employment and Liquidity Constraints: Evidence from Finland”,
Scandinavian Journal of Economics, 102(1), pp. 123-134.
Keynes J.M., (1930), A Treatise on Money, in The Collected Writings of John Maynard Keynes,
Volume VI, The Applied Theory of Money, New York, Cambridge University Press, 1971.
OECD, 2006, The SME Financing Gap: Theory and Evidence, tome I, Paris: OECD,
Ruhle I., (1997), “Why Banks? Microeconomic Foundation of Financial Intermediaries”, Development
and Finance, 3, 10-99.
Stiglitz J.E., Weiss A., (1981), “Credit Rationing In Markets With Imperfect Information”, The
American Economic Review, n°3, pp. 349-410.