Embed Size (px)
Citation preview

MAKERERE UNIVERSITY
GLYCAEMIC CONTROL AND PREVALENCE OF
MICROALBUMINURIA AMONG CHILDREN WITH TYPE 1
DIABETES MELLITUS ATTENDING MULAGO HOSPITAL
CLINICS
BY
DR OBURU OFUMBI GEOFFREY MB.Ch.B (MUK)
A DISSERTATION SUBMITTED IN PARTIAL FULFILLMENT OF THE REQUIREMENTS FOR THE
AWARD OF THE DEGREE OF MASTER OF MEDICINE IN PAEDIATRICS AND CHILD HEALTH
May 2009
i
DECLARATION
I Oburu Ofumbi Geoffrey, hereby declare that the work presented in this dissertation has not
been presented for any other degree in any University.
Signed……………….................……… ...................……………….
DR. OBURU OFUMBI GEOFFREY Date
This dissertation has been submitted for examination with the approval of the following
supervisors;
……........................................ ..........……………………….
DR EDISON MWOROZI Date
MB.Ch.B, M.Med (MUK), Dip.CEH
Senior Consultant Paediatrician, School of Health Science, Makerere University
............................................................ ...........................................
DR ISRAEL KALYESUBULA Date
MB.Ch.B, M.Med (MUK) DTCH (Liv)
Consultant Paediatrician, School of Health Science,
Makerere University
.................................................... ...........................................
DR AMOS ODIIT Date
MB.Ch.B, M.Med.Paed
Consultant Paediatrician, and honorary lecturer,
School of Health Science, Makerere University
ii
DEDICATION
To the memory of my late mother Mrs Damalie Abbo who passed away just before I started
School.
To the memory of my grandmother Faith Norah Ajuang who passed away only months after
I had started the hectic journey of a Masters programme in paediatrics and child health.
To my father Dr Alex Ofumbi for his love and value for education, to my sister Betty
Ofumbi, to the lady of my life Dr Rebecca Esther for her endurance and support and finally
to the peadiatric diabetic patients in the country.
iii
ACKNOWLEDGEMENT
The development and completion of this work was made possible by support and collaboration
with many people. I wish to express my sincere gratitude and thanks to Prof Antoinette Moran
for facilitating this research.
Special thanks go to my supervisors Dr. Edson Mworozi, Dr. Israel Kalyesubula and Dr Amos
Odiit for the guidance that they have given me through out the preparation of this dissertation.
To the centre for international child health, British Colombia children’s hospital, Vancouver,
Canada for part sponsoring this study
My sincere thanks also go to all members of the Department of Paediatrics and Child Health,
who assisted and advised me when approached.
Special thanks go to Dr. Philip Kasirye not only for suggesting this topic to me but also giving
me the necessary advice and guidance during the various stages of the study and for critically
reading through the manuscripts. I further extend my special thanks to Dr Mworozi for having
provided me with the equipment for data collection without which this research would not have
been done.
I thank the paediatric diabetic team and all the diabetic patients in Mulago hospital for their co-
operation that enabled me carry out this research.
I further thank my father, brothers, sisters, and friends for the support and encouragement they
gave me through out my study.
Above all, I thank God for giving me strength, courage and wisdom through out my study.
iv
TABLE OF CONTENTS
Contents
DECLARATION ........................................................................................................................ i
DEDICATION ........................................................................................................................... ii
ACKNOWLEDGEMENT ......................................................................................................... iii
TABLE OF CONTENTS .......................................................................................................... iv
LIST OF FIGURES AND TABLES ......................................................................................... vii
ACRONYMS AND ABBREVIATIONS ................................................................................ viii
OPERATIONAL DEFINITIONS .............................................................................................. ix
ABSTRACT ............................................................................................................................. xi
CHAPTER ONE .........................................................................................................................1
1.0 Background Information ....................................................................................................1
1.1 Literature review................................................................................................................1
1.2 Global situation of type 1 diabetes mellitus ........................................................................2
1.3 Type 1 diabetes mellitus and nephropathy ..........................................................................4
1.4 Risk factors ........................................................................................................................6
1.5 Microalbuminuria ..............................................................................................................6
1.5.0 Definitions and methods of screening ..............................................................................6
1.5.2 Prevention and intervention.............................................................................................9
CHAPTER TWO ...................................................................................................................... 11
2.0 Problem statement ........................................................................................................... 11
2.1 Justification ..................................................................................................................... 12
2.2 Research questions........................................................................................................... 12
2.3 Objectives ........................................................................................................................ 13
v
2.3.1 Specific objectives ........................................................................................................ 13
CHAPTER THREE ................................................................................................................... 15
3.0 Methods ........................................................................................................................... 15
Study design .......................................................................................................................... 15
3.1 Sample size estimation ..................................................................................................... 15
3.2 Selection of patients ......................................................................................................... 16
3.3 Study setting .................................................................................................................... 17
3.4 Study procedure ............................................................................................................... 18
3.5 Study measurements ........................................................................................................ 19
3.6 Data collection procedure ................................................................................................ 20
3.7 Laboratory methods ......................................................................................................... 20
3.7.1 Glycosylated haemoglobin (HbA1C) .............................................................................. 20
3.7.2 Urine investigations ...................................................................................................... 21
3.8 Data management and analysis ........................................................................................ 22
3.9 Ethical considerations ...................................................................................................... 23
3.10. Dissemination of study findings .................................................................................... 23
CHAPTER FOUR ..................................................................................................................... 24
4.0 Results ............................................................................................................................. 24
4.1 Description of study participants ...................................................................................... 24
4.2 Baseline clinical characteristics ........................................................................................ 25
4.3 Prevalence of sub- optimal glycaemic control and albuminuria ........................................ 27
4.4 Glycaemic control and percentage of albuminuria among study children.......................... 27
4.5 Factors associated with glycaemic control ........................................................................ 30
vi
CHAPTER FIVE ...................................................................................................................... 31
5.0 Discussion ....................................................................................................................... 31
5.1 Prevalence of glycaemic control....................................................................................... 32
5.2 Prevalence of microalbuminuria ....................................................................................... 32
5.3 Factors associated with poor glycaemic control ................................................................ 33
5.4 Conclusions ..................................................................................................................... 34
5.5 Recommendations............................................................................................................ 34
5.6 Study Limitations ............................................................................................................ 34
References ................................................................................................................................ 35
Appendices ............................................................................................................................... 42
Appendix 1: Study consent form ............................................................................................... 42
Appendix 2: Luganda version consent form.............................................................................. 45
Appendix 3: Assent form .......................................................................................................... 47
Appendix 4 Luganda version of assent form: ............................................................................. 49
Appendix 5: Questionnaire ........................................................................................................ 51
Appendix 6: Urinary protein calorimetry .................................................................................. 54
Appendix 7: Normal ranges for of glycaemic control and Insulin types ..................................... 56
vii
LIST OF FIGURES AND TABLES
Figure 1: Conceptual frame work .............................................................................................. 14
Figure 2: Study profile of participants ....................................................................................... 24
Table 1: Base line characteristics ............................................................................................... 26
Figure 3: Compares percentages of albuminuria and glycaemic levels among study children. .... 28
Table 2: Bivariate analysis of factors associated with sub optimal HbA1C levels ........................ 29
viii
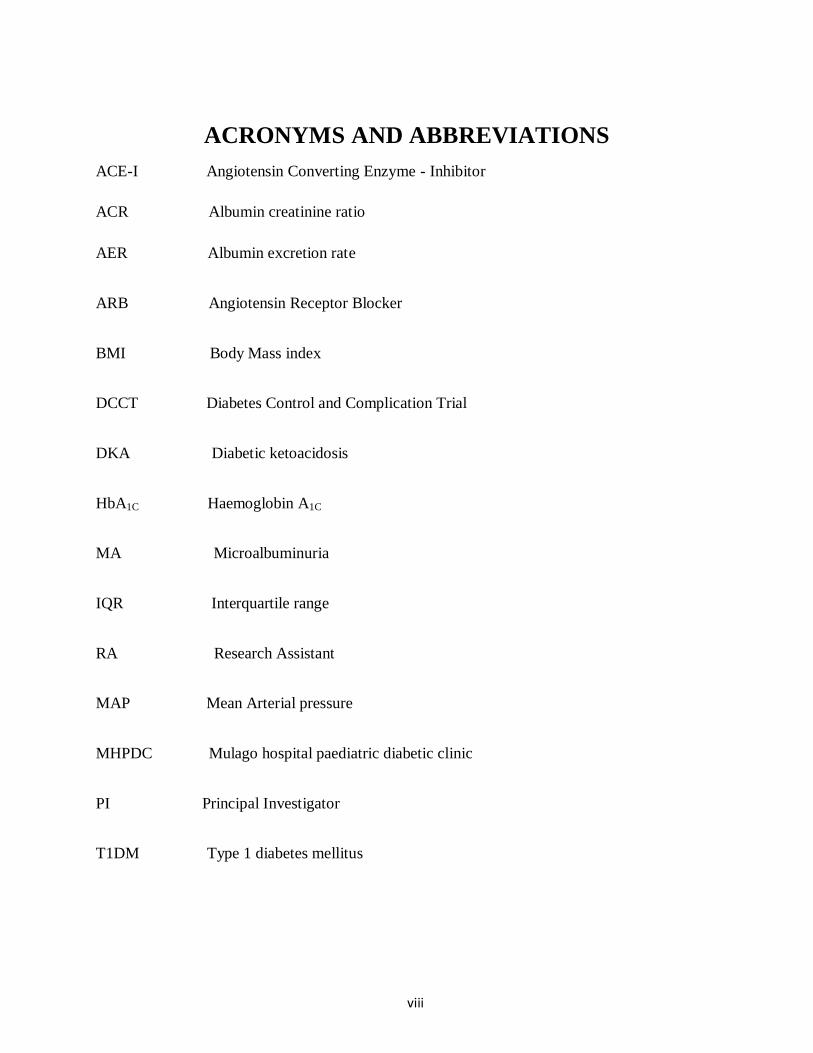
ACRONYMS AND ABBREVIATIONS
ACE-I Angiotensin Converting Enzyme - Inhibitor
ACR Albumin creatinine ratio
AER Albumin excretion rate
ARB Angiotensin Receptor Blocker
BMI Body Mass index
DCCT Diabetes Control and Complication Trial
DKA Diabetic ketoacidosis
HbA1C Haemoglobin A1C
MA Microalbuminuria
IQR Interquartile range
RA Research Assistant
MAP Mean Arterial pressure
MHPDC Mulago hospital paediatric diabetic clinic
PI Principal Investigator
T1DM Type 1 diabetes mellitus
ix
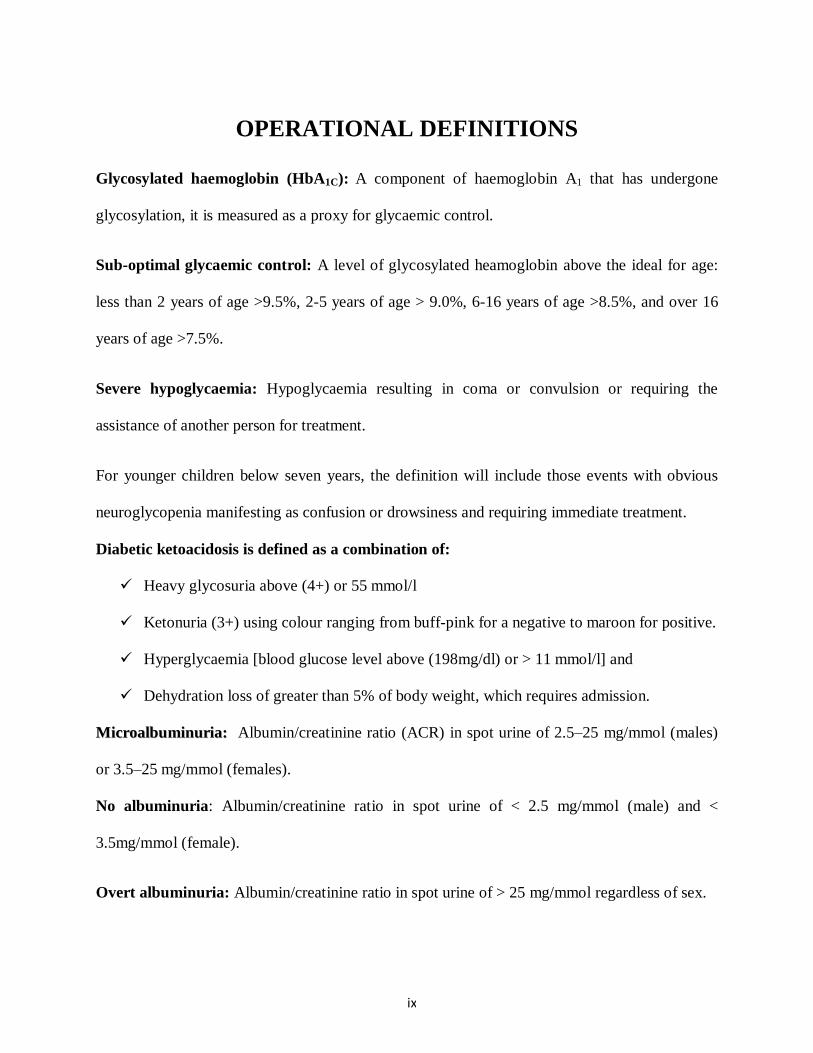
OPERATIONAL DEFINITIONS
Glycosylated haemoglobin (HbA1C): A component of haemoglobin A1 that has undergone
glycosylation, it is measured as a proxy for glycaemic control.
Sub-optimal glycaemic control: A level of glycosylated heamoglobin above the ideal for age:
less than 2 years of age >9.5%, 2-5 years of age > 9.0%, 6-16 years of age >8.5%, and over 16
years of age >7.5%.
Severe hypoglycaemia: Hypoglycaemia resulting in coma or convulsion or requiring the
assistance of another person for treatment.
For younger children below seven years, the definition will include those events with obvious
neuroglycopenia manifesting as confusion or drowsiness and requiring immediate treatment.
Diabetic ketoacidosis is defined as a combination of:
Heavy glycosuria above (4+) or 55 mmol/l
Ketonuria (3+) using colour ranging from buff-pink for a negative to maroon for positive.
Hyperglycaemia [blood glucose level above (198mg/dl) or > 11 mmol/l] and
Dehydration loss of greater than 5% of body weight, which requires admission.
MMiiccrrooaallbbuummiinnuurriiaa:: Albumin/creatinine ratio (ACR) in spot urine of 2.5–25 mg/mmol (males)
or 3.5–25 mg/mmol (females).
No albuminuria: Albumin/creatinine ratio in spot urine of < 2.5 mg/mmol (male) and <
3.5mg/mmol (female).
Overt albuminuria: Albumin/creatinine ratio in spot urine of > 25 mg/mmol regardless of sex.
x
Weight and height percentiles: The age and sex specific cut off points, for sexes from 2 years
to 18 years.
Hypertension: Systolic blood pressure above the 95th percentile value for age, sex, and height
for those with no history of diabetes mellitus or hypertension in first degree relatives.
Insulin accessibility: Is the daily availability of insulin to children three months prior to
enrolment into the study.
Insulin insecurity: Is none availability of insulin to children in doses and frequencies
prescribed, three months prior to enrolment into the study.

xi
ABSTRACT
Background: Uganda has an estimated 900 children under the age of 14 years with T1DM.
Currently, there is limited information on burden and complications of diabetes in the country, as
it is in sub-Saharan Africa where diagnosis is often missed, monitoring is erratic and availability
of insulin is poor.
Glycosylated haemoglobin is a reliable indicator of glycaemic control needed to provide
protection of body organs. Acute complications of T1DM include DKA, infection,
hypoglycaemia, and electrolyte imbalance. Chronic complications of T1DM include neuropathy,
nephropathy, retinopathy and neuropsychiatric.
Microalbuminuria is a good indicator of early renal damage when treatment with angiotensin
converting enzyme inhibitors may reverse the disease.
Objective: This study assessed glycaemic control and microalbuminuria in children with type 1
diabetes attending Mulago hospital clinic.
Methods: A cross sectional study was conducted at the diabetic clinic in Mulago hospital, after
informed consent and assent (when applicable) was obtained. All children were on insulin, either
soluble-lente combination or mixtard. Data was collected on socio-demographic, patient’s
characteristics, insulin usage, duration of disease and factors affecting glycaemic control. It was
then exported into EpiData v 3.1. The prevalence of glycaemic control and microalbuminuria
was performed using Stata v 10.0 software package. Odds ratio was used to measure factors of
association with sub optimal glycaemic control. Statistical significance was considered when P-
value was ≤ 0.05.
xii
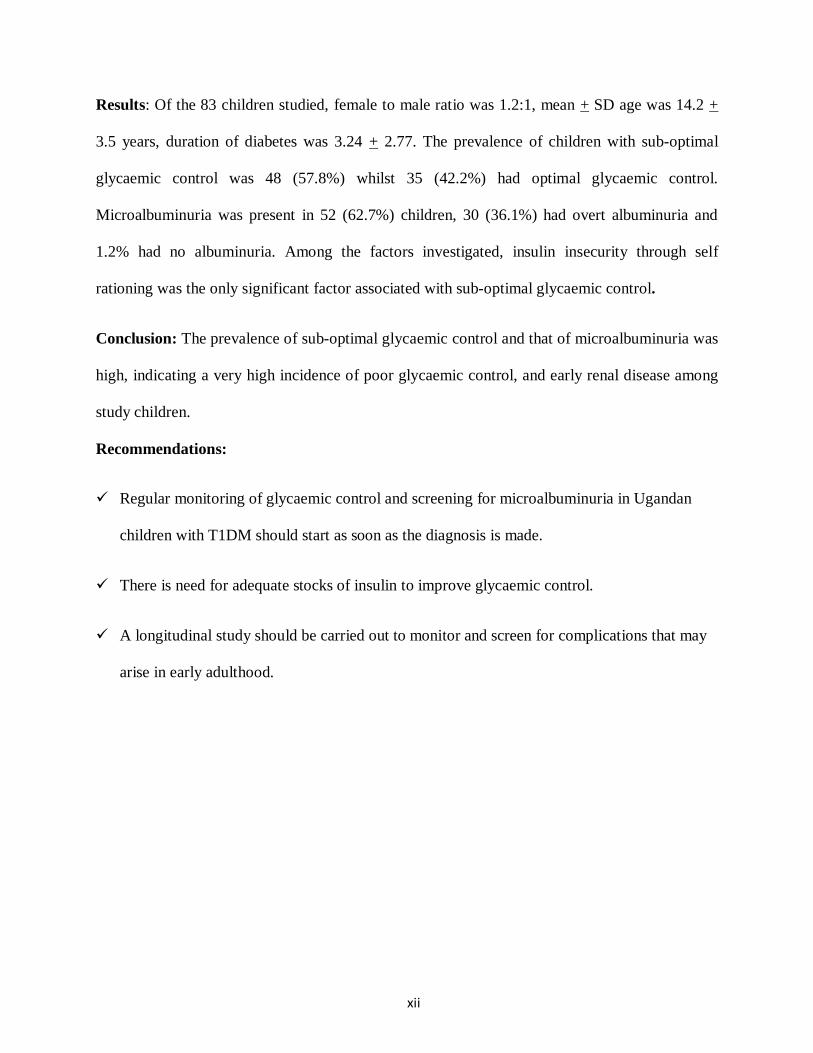
Results: Of the 83 children studied, female to male ratio was 1.2:1, mean + SD age was 14.2 +
3.5 years, duration of diabetes was 3.24 + 2.77. The prevalence of children with sub-optimal
glycaemic control was 48 (57.8%) whilst 35 (42.2%) had optimal glycaemic control.
Microalbuminuria was present in 52 (62.7%) children, 30 (36.1%) had overt albuminuria and
1.2% had no albuminuria. Among the factors investigated, insulin insecurity through self
rationing was the only significant factor associated with sub-optimal glycaemic control.
Conclusion: The prevalence of sub-optimal glycaemic control and that of microalbuminuria was
high, indicating a very high incidence of poor glycaemic control, and early renal disease among
study children.
Recommendations:
Regular monitoring of glycaemic control and screening for microalbuminuria in Ugandan
children with T1DM should start as soon as the diagnosis is made.
There is need for adequate stocks of insulin to improve glycaemic control.
A longitudinal study should be carried out to monitor and screen for complications that may
arise in early adulthood.
1
CHAPTER ONE
1.0 Background Information
There are about 400,000 children with diabetes with additional 70,000 annually world wide1 and
the incidence is on the increase at about 3% per year2.
Uganda has an estimated 900 children under the age of 14 years with diabetes1. Limited
information on burden and complications is available in sub-Saharan Africa where diagnosis is
often missed, monitoring is erratic and availability of insulin is not predictable3.
Acute complications of T1DM include DKA, infection, hypoglycaemia, and electrolyte
imbalance while chronic ones are neuropathy, nephropathy, retinopathy and neuropsychiatric.
Renal microvascular damage leads to progressive renal disease starting with reversible 4-11
stages
1-3 to irreversible 12-17
stages 4-5. MA is a good indicator of early renal damage when treatment
with angiotensin converting enzyme inhibitors (ACE-I) may reverse the disease18,19
.
Glycosylated heamoglobin (HbA1C) at different age dependent cut-offs is a reliable indicator of
glycaemic control20,21
. Positive predictive factors for the development of microalbuminuria
include increasing age22-25
, poor metabolic control within the first 5 years, dyslipidemia23-26
,
smoking27
, and familial and genetic factors28,29
.
1.1 Literature review
In the developed world, enormous efforts are made to reduce chronic complications of diabetes,
yet in many developing countries, the incidence of these complications in children is not known,
making their management even more difficult. Information on chronic complications of diabetes
2
in sub-Saharan Africa is scarce; however, the occurrence of new cases of paediatric T1DM has
gone hand in hand with the growing disease prevalence, demonstrating the importance of
assessing for these complications30-32
.
Microalbuminuria denotes increases in albumin excretion rate (AER) outside the normal range
but too low to register on the conventional clinic testing. It is an early sign of diabetic
nephropathy at a stage when nephropathy may be reversible with careful glycaemic and blood
pressure control19
, and by use of angiotensin converting enzyme inhibitors18
. Depending on the
method of screening the prevalence of MA in children and young adults with T1DM varies
world wide between 5% and 22%33,34
. In those with T1DM onset under 20 years of age, diabetic
nephropathy is a described complication associated with generalized microvascular35
and
macrovascular36
damage, and increases all-cause mortality in this age category3377--3399.. Therefore, it
is important to carefully monitor all children with T1DM to ensure diabetes control is optimized
and to look for evidence of early renal disease, because the occurrence of persistent
microalbuminuria (PMA) predicts later development of renal failure in T1DM patients40-42
. This
involves regular screening for microalbuminuria. Urinary albumin excretion is the best marker
and the most practical method for detecting diabetic nephropathy. The gold standard for the
assessment of MA and overt albuminuria in children is the quantitative analysis of a 24 hour
urine collection43,44
. However, the American diabetes association considers on-spot urine
collections for albumin creatinine to be an acceptable screening strategy in children, with more
intensive investigation required for those who screen positive45,46
.
1.2 Global situation of type 1 diabetes mellitus
There has been an upturn in the incidence of T1DM, a trend that is now observed in countries
around the world2. The incidence is increasing in children and youth by about 3% (range about
3
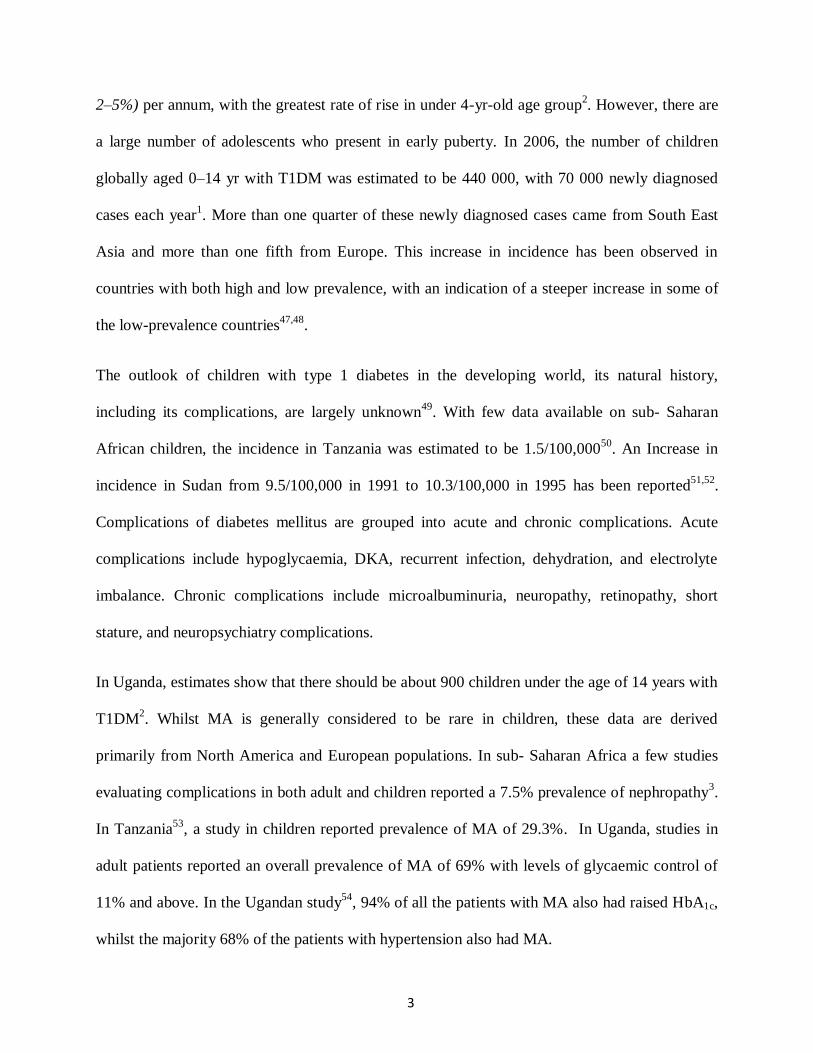
2–5%) per annum, with the greatest rate of rise in under 4-yr-old age group2. However, there are
a large number of adolescents who present in early puberty. In 2006, the number of children
globally aged 0–14 yr with T1DM was estimated to be 440 000, with 70 000 newly diagnosed
cases each year1. More than one quarter of these newly diagnosed cases came from South East
Asia and more than one fifth from Europe. This increase in incidence has been observed in
countries with both high and low prevalence, with an indication of a steeper increase in some of
the low-prevalence countries47,48
.
The outlook of children with type 1 diabetes in the developing world, its natural history,
including its complications, are largely unknown49
. With few data available on sub- Saharan
African children, the incidence in Tanzania was estimated to be 1.5/100,00050
. An Increase in
incidence in Sudan from 9.5/100,000 in 1991 to 10.3/100,000 in 1995 has been reported51,52
.
Complications of diabetes mellitus are grouped into acute and chronic complications. Acute
complications include hypoglycaemia, DKA, recurrent infection, dehydration, and electrolyte
imbalance. Chronic complications include microalbuminuria, neuropathy, retinopathy, short
stature, and neuropsychiatry complications.
In Uganda, estimates show that there should be about 900 children under the age of 14 years with
T1DM2. Whilst MA is generally considered to be rare in children, these data are derived
primarily from North America and European populations. In sub- Saharan Africa a few studies
evaluating complications in both adult and children reported a 7.5% prevalence of nephropathy3.
In Tanzania53
, a study in children reported prevalence of MA of 29.3%. In Uganda, studies in
adult patients reported an overall prevalence of MA of 69% with levels of glycaemic control of
11% and above. In the Ugandan study54
, 94% of all the patients with MA also had raised HbA1c,
whilst the majority 68% of the patients with hypertension also had MA.

4
1.3 Type 1 diabetes mellitus and nephropathy
Natural history, early pathohistological changes, and pathogenesis
Chronic hyperglycaemia is an important factor in the pathogenesis of diabetic nephropathy55-57
.
Long standing hyperglycaemia up regulates the expression of a fibrogenic growth factor,
transforming growth factor-β, which is involved in both early and later stages DN58
. Following
vascular injury, a cytokine cascade is activated which increases capillary permeability to plasma
protein. Within the renal vasculature the effect of increased endothelial permeability to proteins
is the occurrence of MA57,59
.
The natural history of renal involvement in patients with T1DM is classified into five stages
according to the degree of changes in renal function and morphology60,61
.
Stage I
With the onset of diabetes, the only changes—which are encountered in 25–50% of patients are
increased renal size and increased GFR by 20–40%, called hyper-filtration. Microalbuminuria
may be present but is readily reversible with insulin treatment. The increases in renal size and
GFR may normalize or may persist in some patients. Hyper-filtration is thought to predispose
these patients to the development of diabetic kidney ddiisseeaassee44,,66,,77
,, but other findings support the
view that renal hypertrophy is the primary dysfunction, and it precedes hyper-filtration during
the development of MAA1111
.. Blood pressure typically is normal during this period. There is no
evidence of histological lesion in glomeruli or vascular structures.
5
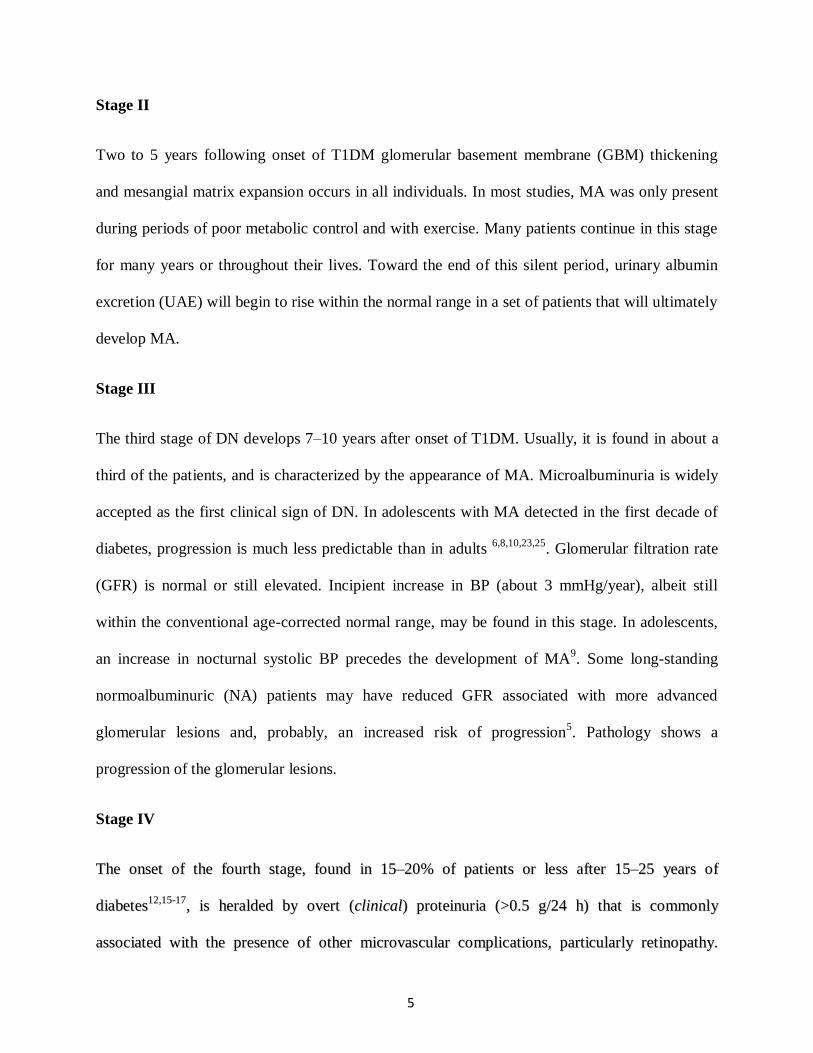
Stage II
Two to 5 years following onset of T1DM glomerular basement membrane (GBM) thickening
and mesangial matrix expansion occurs in all individuals. In most studies, MA was only present
during periods of poor metabolic control and with exercise. Many patients continue in this stage
for many years or throughout their lives. Toward the end of this silent period, urinary albumin
excretion (UAE) will begin to rise within the normal range in a set of patients that will ultimately
develop MA.
Stage III
The third stage of DN develops 7–10 years after onset of T1DM. Usually, it is found in about a
third of the patients, and is characterized by the appearance of MA. Microalbuminuria is widely
accepted as the first clinical sign of DN. In adolescents with MA detected in the first decade of
diabetes, progression is much less predictable than in adults 6,8,10,23,25
. Glomerular filtration rate
(GFR) is normal or still elevated. Incipient increase in BP (about 3 mmHg/year), albeit still
within the conventional age-corrected normal range, may be found in this stage. In adolescents,
an increase in nocturnal systolic BP precedes the development of MA9. Some long-standing
normoalbuminuric (NA) patients may have reduced GFR associated with more advanced
glomerular lesions and, probably, an increased risk of progression5. Pathology shows a
progression of the glomerular lesions.
Stage IV
TThhee oonnsseett ooff tthhee ffoouurrtthh ssttaaggee,, ffoouunndd iinn 1155––2200%% ooff ppaattiieennttss oorr lleessss aafftteerr 1155––2255 yyeeaarrss ooff
ddiiaabbeetteess1122,,1155--1177
,, iiss hheerraallddeedd bbyy oovveerrtt ((cclliinniiccaall)) pprrootteeiinnuurriiaa ((>>00..55 gg//2244 hh)) tthhaatt iiss ccoommmmoonnllyy
aassssoocciiaatteedd wwiitthh tthhee pprreesseennccee ooff ootthheerr mmiiccrroovvaassccuullaarr ccoommpplliiccaattiioonnss,, ppaarrttiiccuullaarrllyy rreettiinnooppaatthhyy..
6
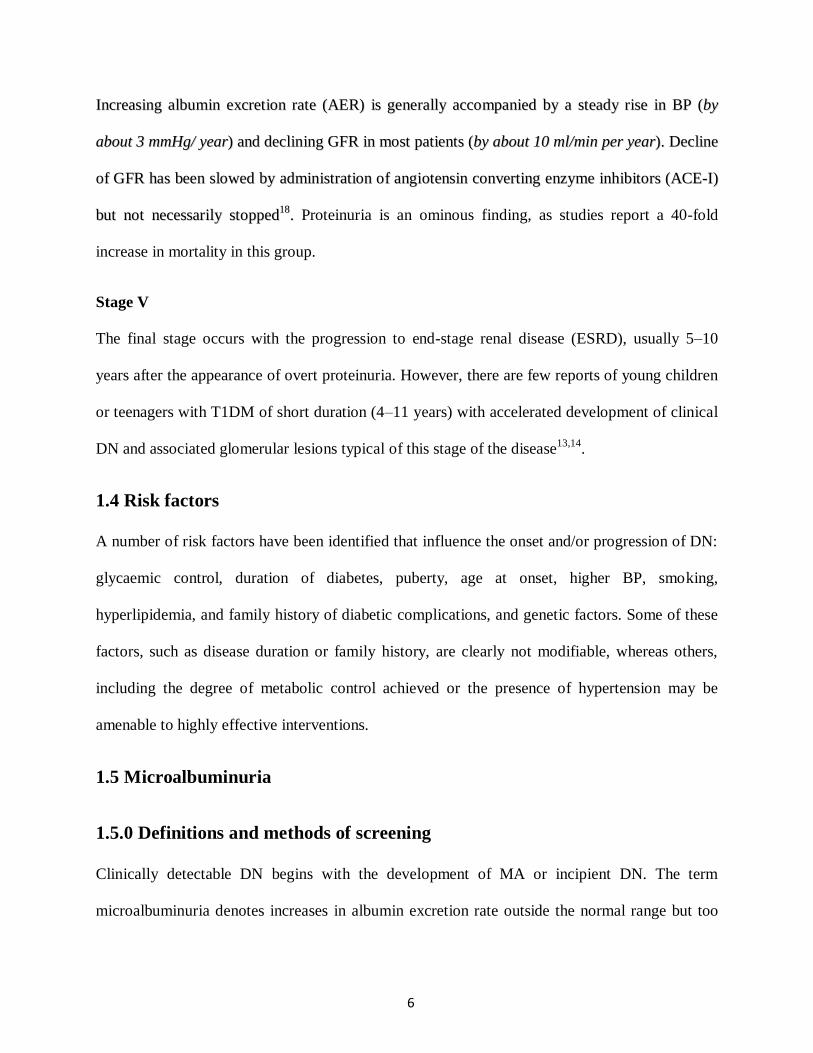
IInnccrreeaassiinngg aallbbuummiinn eexxccrreettiioonn rraattee ((AAEERR)) iiss ggeenneerraallllyy aaccccoommppaanniieedd bbyy aa sstteeaaddyy rriissee iinn BBPP ((bbyy
aabboouutt 33 mmmmHHgg// yyeeaarr)) aanndd ddeecclliinniinngg GGFFRR iinn mmoosstt ppaattiieennttss ((bbyy aabboouutt 1100 mmll//mmiinn ppeerr yyeeaarr)).. DDeecclliinnee
ooff GGFFRR hhaass bbeeeenn sslloowweedd bbyy aaddmmiinniissttrraattiioonn ooff aannggiiootteennssiinn ccoonnvveerrttiinngg eennzzyymmee iinnhhiibbiittoorrss ((AACCEE--II))
bbuutt nnoott nneecceessssaarriillyy ssttooppppeedd1188
.. Proteinuria is an ominous finding, as studies report a 40-fold
increase in mortality in this group.
Stage V
The final stage occurs with the progression to end-stage renal disease (ESRD), usually 5–10
years after the appearance of overt proteinuria. However, tthere are few reports of young children
or teenagers with T1DM of short duration (4–11 years) with accelerated development of clinical
DN and associated glomerular lesions typical of this stage of the disease13,14
.
1.4 Risk factors
A number of risk factors have been identified that influence the onset and/or progression of DN:
glycaemic control, duration of diabetes, puberty, age at onset, higher BP, smoking,
hyperlipidemia, and family history of diabetic complications, and genetic factors. Some of these
factors, such as disease duration or family history, are clearly not modifiable, whereas others,
including the degree of metabolic control achieved or the presence of hypertension may be
amenable to highly effective interventions.
1.5 Microalbuminuria
1.5.0 Definitions and methods of screening
Clinically detectable DN begins with the development of MA or incipient DN. The term
microalbuminuria denotes increases in albumin excretion rate outside the normal range but too
7
low to register on a conventional clinic testing. Microalbuminuria is an early sign of DN at a
stage when nephropathy may be reversible with careful glycaemic and BP control19
.
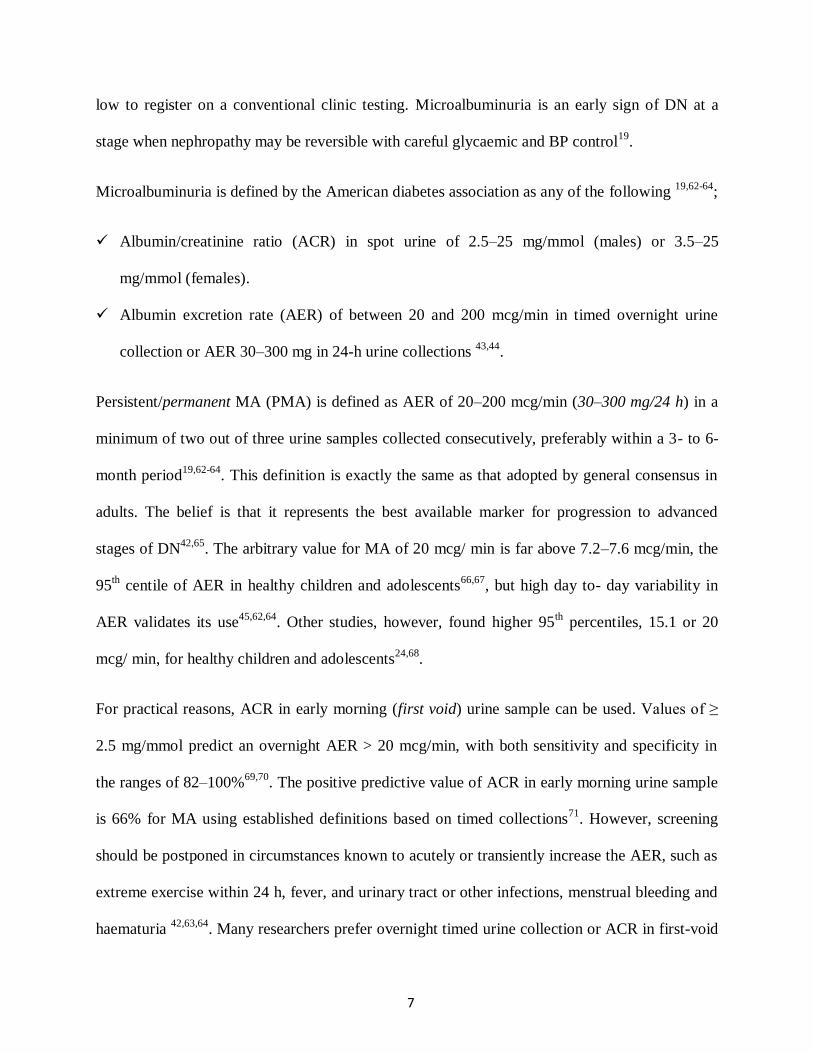
Microalbuminuria is defined by the American diabetes association as any of the following 19,62-64
;
Albumin/creatinine ratio (ACR) in spot urine of 2.5–25 mg/mmol (males) or 3.5–25
mg/mmol (females).
Albumin excretion rate (AER) of between 20 and 200 mcg/min in timed overnight urine
collection or AER 30–300 mg in 24-h urine collections 43,44
.
Persistent/permanent MA (PMA) is defined as AER of 20–200 mcg/min (30–300 mg/24 h) in a
minimum of two out of three urine samples collected consecutively, preferably within a 3- to 6-
month period19,62-64
. This definition is exactly the same as that adopted by general consensus in
adults. The belief is that it represents the best available marker for progression to advanced
stages of DN42,65
. The arbitrary value for MA of 20 mcg/ min is far above 7.2–7.6 mcg/min, the
95th centile of AER in healthy children and adolescents
66,67, but high day to- day variability in
AER validates its use45,62,64
. Other studies, however, found higher 95th
percentiles, 15.1 or 20
mcg/ min, for healthy children and adolescents24,68
.
For practical reasons, ACR in early morning (first void) urine sample can be used. Values of ≥
2.5 mg/mmol predict an overnight AER > 20 mcg/min, with both sensitivity and specificity in
the ranges of 82–100%69,70
. The positive predictive value of ACR in early morning urine sample
is 66% for MA using established definitions based on timed collections71
. However, screening
should be postponed in circumstances known to acutely or transiently increase the AER, such as
extreme exercise within 24 h, fever, and urinary tract or other infections, menstrual bleeding and
haematuria 42,63,64
. Many researchers prefer overnight timed urine collection or ACR in first-void
8
morning urine, because it reduces the influence of confounding factors45,72
. ACR in random urine
sample, although easier to obtain, may be influenced by orthostatic or post-exercise proteinuria70
.
Regardless of the procedure used, at least two of three samples over a 3 to 6-month period should
confirm MA, because AER has an intra-individual coefficient of variation of approximately 40%
19,62-64. Some researchers have recommended that at least 1 month should elapse between urine
sampling45
.
Methods used in this study
This was an index cross- sectional study in our setting. We needed to establish basis for feature
studies so we used on spot urine collection for albumin creatinine ratio recommended by the
American diabetes association as a screening strategy in children, with more intensive
investigation required for those who screen positive45,46
. It also eliminates the possibility of
orthostatic proteinuria.
1.5.1 Screening and monitoring
It is recommended that screening for MA be started depending on the age of T1DM onset 19,62,63
.
In patients with prepubertal onset, screening should start from 11 years with 2 years of diabetes
duration and from 9 years with 5 years of duration. In patients with pubertal onset of DM, annual
screening should start 2 years after diagnosis73
; more frequent testing is indicated if the AER
values are increasing.
In case of no albuminuria (NA), testing is performed annually. In patients with MA, repeated
testing should be done over the next 3– 6 months for confirming or excluding PMA. Patients
with intermittent MA should be checked monthly over 3 months because they may be at risk for

9
progression74
. When PMA is confirmed, non-T1DM-related causes of renal disease should be
excluded, with further evaluation determined by disease history and clinical examination. It is
recommended that each urinary albumin test be accompanied by BP measurements at least
annually; comparing values obtained with centile charts appropriate for sex, age, and height.
Confirmation about hypertension may be assisted by 24-h ambulatory blood pressure
monitoring62,75
. Particular attention should be paid to BP readings in those with intermittent or
persistent MA and in those with positive family history of hypertension, stroke, or kidney or
cardiovascular disease. Annual screening for retinopathy, neuropathy, and lipid abnormalities is
also recommended, and GFR is also determined annually when PMA has been confirmed.
1.5.2 Prevention and intervention
Interventions can be divided into those that prevent the onset of complications (primary
prevention) and those that slow or halt their progress (secondary intervention). The goal of a
prevention strategy involves changing potentially modifiable risk factors: optimizing blood
glucose control, discouraging smoking, encouraging healthy diet, controlling BP, and
encouraging healthy exercise 19,64,72
.
In patients with proven MA, non-pharmacological and/or pharmacological measures should be
initiated with repeated (at 6 months) testing of AER. The treatment principles are almost the
same as those adopted for the prevention of DN, although in this case, more aggressive strategies
must be used63
. The goal of treatment is to prevent progression of MA to overt proteinuria and to
mitigate the decline in renal function. Measures in adolescents with PMA include improving
metabolic control (HbA1c <8.0–8.5%), maintaining normal BP, smoking cessation, maintaining
normal plasma lipid profile, and encouraging exercise.

10
Longitudinal studies with a large number of T1DM youngsters are lacking, where normal
protein intake is recommended18,72
.
There is no general consensus among paediatrician’s on who should receive treatment with
renoprotective drugs, when and for how long, and various treatment policies are in use in
different centres75
. In an attempt to establish some rules for renoprotective drugs use, Chiarelli et
al18,72
proposed some recommendations based on the present knowledge on risk factors for
initiation or progression of DN.
Treatment with ACE inhibitors titrated to normalize albumin excretion rate was recommended
for all children with MA because of their renoprotective effect 19,63
.
11
CHAPTER TWO
2.0 Problem statement
There are about 400,000 children with diabetes with additional 70,000 annually world wide1 and
the incidence is on the increase at about 3% per year2. Uganda has an estimated 900 children
under the age of 14 years with diabetes1.
Depending on the method of screening the prevalence of MA in children and young adults with
T1DM varies world wide between 5% and 22%33,34
. Many studies3 in Africa report prevalence of
microalbuminuria of about 7.5% in both adults and children with Tanzania53
reporting
microalbuminuria in children at 29.3% studies in Ugandan54
adults reported the prevalence at
69%.
In the developed34
world enormous efforts are made to reduce chronic complications of diabetes
by control of the glycaemic level. However, in Uganda there are no studies about glycaemic
control among children with T1DM, and their frequently affected organ damage (in particular the
kidneys), making planning and management of diabetes difficult.
With erratic availability of insulin at Mulago hospital together with the lack of urine and blood
sugar monitoring devices at home, control is bound to be poor and risk of organ damage high. To
make matters worse, the lack of cold storage for insulin, travel expenses to hospitals and drug
purchase costs being unaffordable for most Ugandans. It is possible that the majority of children
with diabetes in Uganda die without ever being diagnosed or adequately treated.
12
2.1 Justification
Although microalbuminuria is generally considered to be rare in children this data is derived
primarily from North American and European populations8 where diabetes management is better.
The prevalence of MA among Ugandan diabetic children is not known. The high rates of
microvascular35
and macrovascular36
disease reported in adult studies and progression to early
renal disease, might have its origin in childhood, for those with T1DM.
This study was designed to assess the control of diabetes, describe factors associated with poor
control of diabetes and prevalence of microalbuminuria.
Results of this study are to form a background for better planning and management of children
with T1DM. However, screening for microalbuminuria and monitoring glycaemic control in the
country will be recommended if the prevalence of MA is found to be significant.
2.2 Research questions
Primary questions
1. What is the prevalence of sub-optimal glycaemic control in children with T1DM
attending Mulago hospital diabetic clinic?
2. What is the prevalence of microalbuminuria among children with T1DM attending
Mulago hospital diabetic clinic?
Secondary question
1. What are the factors associated with sub-optimal glycaemic control among children with
T1DM attending Mulago hospital diabetes clinic?
13
2.3 Objectives
General objective
This study assessed the prevalence of glycaemic control and microalbuminuria in children with
type 1 diabetes attending Mulago hospital clinic.
2.3.1 Specific objectives
Primary objective:
To determine the level of glycosylated HbA1C in children with type 1 diabetes attending
Mulago hospital diabetic clinic.
To determine the prevalence of microalbuminuria among children with T1DM attending
the Mulago hospital clinic.
Secondary objective:
To identify factors associated with sub-optimal glycaemic control among children with
TIDM attending the Mulago hospital clinic.

14
Figure 1: Conceptual frame work
Microvascular Macrovascular
Kidneys
Age of T1DM onset
Puberty
Sex
Duration of T1DM
Insulin insecurity
Lack of glucose monitoring
device
Lack of education on signs
and symptoms of DM
Sub-optimal
glycaemic control
Number of clinic visits in the last 3-months
Level of education of
caretakers and or
patient
Socioeconomic factors
.
Smoking
Alcohol
High blood pressure
Diet
Organ damage Kidneys
Increasing BP
Optic atrophy
Neuropathy
Muscular atrophy
15
CHAPTER THREE
3.0 Methods
Study design
Descriptive cross-sectional study
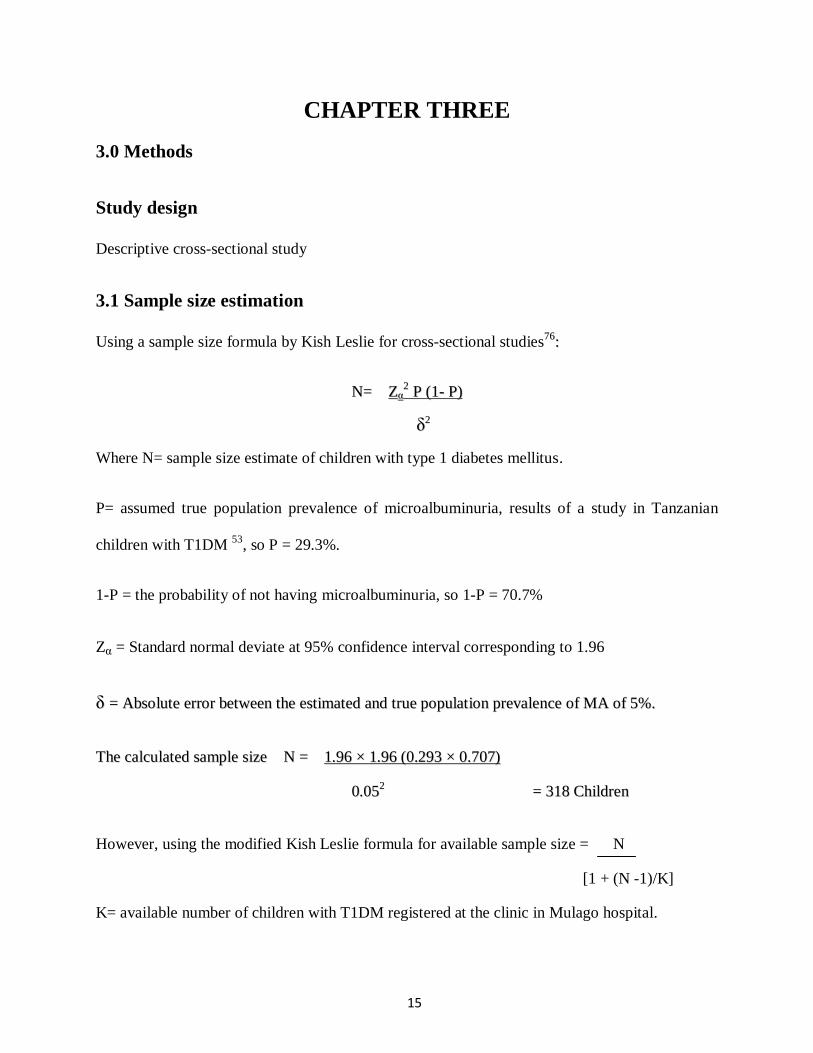
3.1 Sample size estimation
Using a sample size formula by Kish Leslie for cross-sectional studies7766::
NN== ZZαα22 PP ((11-- PP))
δδ22
Where N= sample size estimate of children with type 1 diabetes mellitus.
P= assumed true population prevalence of microalbuminuria, results of a study in Tanzanian
children with T1DM 53
, so P = 29.3%.
1-P = the probability of not having microalbuminuria, so 1-P = 70.7%
Zα = Standard normal deviate at 95% confidence interval corresponding to 1.96
δδ == AAbbssoolluuttee eerrrroorr bbeettwweeeenn tthhee eessttiimmaatteedd aanndd ttrruuee ppooppuullaattiioonn pprreevvaalleennccee ooff MMAA ooff 55%%..
TThhee ccaallccuullaatteedd ssaammppllee ssiizzee NN == 11..9966 ×× 11..9966 ((00..229933 ×× 00..770077))
00..005522 == 331188 CChhiillddrreenn
However, using the modified Kish Leslie formula for available sample size = N
[1 + (N -1)/K]
K= available number of children with T1DM registered at the clinic in Mulago hospital.
16
Hence K = 318
[1 + (318 – 1)/83] = 65.985 children
After adjusting for a 20% failure to turn up for the interviews we got a sample size of 78
children. However we studied a total of 83 children.
Study duration
The study was carried out from August 2008 to March 2009.
Target population
These were children aged 6-months to 18 years with a diagnosis of T1DM, attending Mulago
hospital clinic.
Eligible population: Were children aged six months to 18 years with known diagnosis of Type1
Diabetes Mellitus attending Mulago diabetes clinic.
3.2 Selection of patients
Inclusion criteria
Age six months to 18 years
Diagnosis of type 1diabetes mellitus.
Children whose caretakers had consented,
Children assent for those aged more than 7 years.
17
Delayed inclusion criteria for HbA1C and MA in children thought to have;
Fever (> 38 0C)
Haematuria (Bayer Multiple Reagent Strip)
Urinary tract infection (leucocyturia with consecutive subsequent positive culture result)
Alkaline urine (pH>8), which would explain false positive result in Bayer multiple reagent
strip.
Menstruation
Exclusion criteria
Congenital heart disease
Children with known diagnosis of nephrotic/ nephritic syndrome
Children with sickle cell disease/anaemia
Sampling procedure
Children were enrolled consecutively on a regular outpatient visit until the required sample was
obtained.
3.3 Study setting
The study was carried out at the Peadiatric Diabetes Clinic located on 4th floor medical out
patient department of New Mulago hospital. The hospital serves as Uganda’s national referral
unit and teaching hospital for Makerere University Medical School. Approximately eighty three
children attend to the clinic which runs every Wednesday from 9:00 AM to 2:00PM. On an
average clinic day fourteen children are seen by the diabetic team. The team consists of a
medical officer, two paediatric nurses with a special training in diabetes, a nutritionist and a
18
pharmacist. The Principal Investigator is also part of the team. The Mulago hospital pharmacy
dispenses free insulin to patients with a prescription, but the pharmacy is chronically in short
supply for insulin. The clinic is served by a side laboratory that performs urinalysis, random
blood sugar and blood slide for malaria parasites on each clinic day. More complex tests like
renal and liver functional tests are performed in the hospital main biochemistry laboratory
located on 3rd
floor.
Study instruments
A semi-structured questionnaire was used to collect data. The questionnaire was administered by
the principal investigator with the help of trained research assistants. A Salter weighing scale
was used to during the study.
3.4 Study procedure
Both new and old children registered and attending to the diabetic clinic at Mulago hospital were
involved in the study. A verbal consent from caretakers and assent from older children was
obtained by the study nurse before children were sent to the principal investigator (PI) or trained
research assistant (RA). The PI or RA explained more about the study, obtained a written
consent from caretakers and an assent from children above 7 years, took the history, and did a
physical examination.
Two millilitres of blood was drawn using a sterile disposable syringe and needle after cleaning
the anterior cubital fossa or dorsum of hand (Venipuncture site) with a swab soaked in 70%
alcohol. A drop of blood was placed on a glucometer to determine random/fasting blood glucose.
The rest of the blood sample was kept in a fluoride bottle for measurement of HbA1C. A single
sample for HbA1C was required for the study.
19
Two millilitres of fresh urine samples were collected on the spot in a clean general container,
with no advance instructions concerning fluid intake or urination. All urine samples were first
tested using Bayer multi-reagent strips to determine the presence of proteins, Ketones, nitrites,
leukocytes and sugar. Urine samples that tested 1+ or greater reading (albumin ≥ 30 mg/dl) were
considered overtly albuminuric and were not examined further. Urine samples that tested
negative on the strip were then tested quantitatively for albuminuria and creatinine by
calorimetric and alkaline Picrate methods respectively.
Both new and old children were enrolled consecutively into the study, all data including
laboratory results were recorded in a pre-coded and pre-tested questionnaire for completeness.
Recruitment of patients ended at 2:00pm on a regular outpatient visit to allow specimen handling
in the laboratory before 5:00pm.
Feedback to the patients’ and further care
Results of each patient’s test were communicated or explained to the caretaker and the patient at
their next visit by the principal investigator. However, if laboratory results indicated poor
glycaemic control and/or albuminuria, immediate evaluation of the patient was performed by the
PI and a paediatric nephrologist was consulted.
3.5 Study measurements
Measurement variables
Albumin in the on-spot urine samples measured in mg/dl.
Creatinine in the on spot urine samples measured in mmol/l.

20
Glycosylated haemoglobin (HbA1C) was determined quantitatively by the Diamat high
performance chromatography expressed as a percentage.
A systolic blood pressure above the 95th centile value for age, sex, and height was measured
by Omron blood pressure machine.
Weight and height centiles for age and sex from 2 to 18 years were considered..
3.6 Data collection procedure
Data was collected using a semi- structured pre-coded and pre-tested questionnaire. Children
with delayed inclusion criteria were treated and re-evaluated for inclusion into the study.
Sociodemographic data were entered into the questionnaire as the PI took the history, while data
from physical examination and laboratory investigations were entered as soon as they were
generated.
3.7 Laboratory methods
3.7.1 Glycosylated haemoglobin (HbA1C)
Haemoglobin A1C was measured electrophoretically according to the Diamat high-performance
liquid chromatographic method (Bio-Rad Laboratories, Hercules, Cali)77
; and the latter assay
was calibrated to match the reference system used by the central haemoglobin A1C laboratory of
the Diabetes Control and Complication Trial (DCCT). The correlation between the two sets of
results was obtained, and linear regression analysis was used to determine a conversion formula
that would yield haemoglobin A1C values that corresponds approximately to the haemoglobin A1
values obtained in our laboratory.
Haemoglobin A 1c = [haemoglobin A1 − 0.14]
1.23
21
3.7.2 Urine investigations
Bayer multiple reagent strip is a semiquantitative strip test for proteinuria, ketonuria and
glycosuria based on a purely chemical principle. Multiple Reagent test strip is based on dye
binding using a high-affinity sulfonephthalein dye. At a constant pH, the development of any
blue colour is due to the presence of albumin. In the spot urine portion the multiple strips was
used to screen for proteinuria following the manufacturer’s instructions. Semiquantitative results
of 10, 30, 80, and 150 mg albumin/l was read reflectometrically by comparing the colour scale
on the bottle following dipping the strip in fresh urine sample for 60 seconds. The
semiquantitative determination of creatinine (Bayer strip) is based on the peroxidase-like activity
of a copper creatinine complex that catalyses the reaction of diisopropyl- benzene
dihydroperoxide and 3, 3', 5, 5
'- tetramethylbenzidine. The resulting colour ranges from orange to
green to blue, corresponding to a reflectometrically read creatinine concentration of 0.9, 4.4, 8.8,
17.7, and 26.5mmol/l.
Each urine sample was analyzed for MA and creatinine concentrations. MA was measured from
the clinical chemistry laboratory of Mulago hospital by calorimetric method that is based on the
Biurets reaction principle using alkaline copper solution while the urine creatinine was measured
using the alkaline Picrate method.
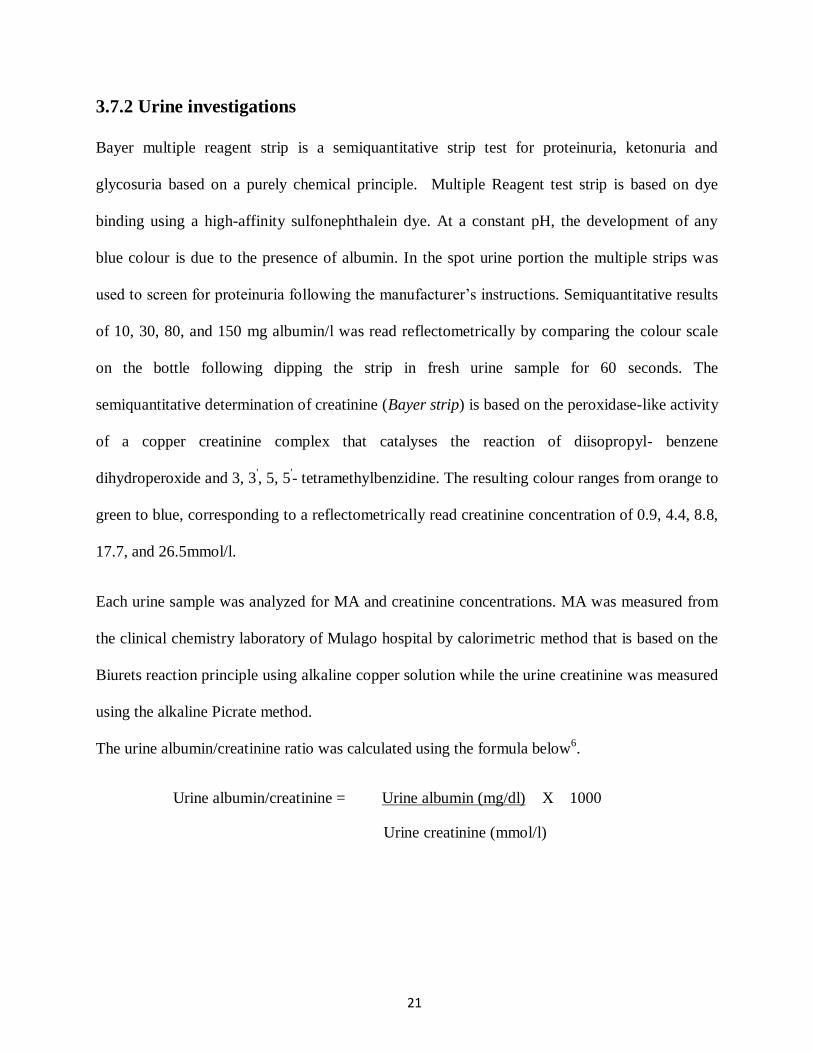
The urine albumin/creatinine ratio was calculated using the formula below6.
Urine albumin/creatinine = Urine albumin (mg/dl) X 1000
Urine creatinine (mmol/l)

22
3.8 Data management and analysis
All values are expressed as means ± SD the overall prevalence of common complications was
calculated using frequency distributions and the Fisher’s exact test. The participants were
divided into three age-groups (i.e., <- 11, 11.5- 15, and 15.5–18 years) according to the age of
onset of T1DM. Given the non- normal distribution of the variables, differences between the age
groups was tested using the Kruskal-Wallis test. Statistical analysis was performed using Stata v
10.0 software. The statistical significance level was P < 0.05.
Primary objective based on analytical component
Patients found to have HbA1C values within the normal range for age (Appendix 7) were
categorized as optimal and those above as sub-optimal. The proportion of children with sub-
optimal glycaemic control was determined by dividing the number of children with HbA1C
above normal range by the total number of children in the study.
The prevalence of microalbuminuria was computed as the number of patients with MA being
the numerator and the total number of patients studied as a denominator.
Secondary Objective based on analytical component
A bivariate Analysis was used to establish the association between individual predictors and
outcome (glycaemic control). Odds ratio was used as a measure of association and a
statistical significance was determined using a p-value of 0.05 and a 95% confidence
interval.
Quality control
The questionnaires were pre-tested, translated into Luganda, the most widely spoken local
language in the study setting so as to ensure that the patients understood the questions that were
23
being asked. Research assistants were recruited from among the health workers in the paediatric
diabetic clinic; they were briefed about the study and then trained on data collection.
Questionnaires were cross checked every day for completeness. Laboratory instruments were
calibrated using the manufacturer’s instructions to avoid errors in the data management. A Salter
weighing scale was calibrated according to the Uganda bureau of standard..
3.9 Ethical considerations
Approval to carry out the study was sought and obtained from the department of Paediatrics and
Child Health, Makerere University; Makerere University School of Medicine Ethics and
Research committee, and from Mulago hospital Ethics and Research committee. Informed
consent was obtained from all respondents and confidentiality was ensured. Access to data was
limited to those directly involved in the study, and the attending diabetes team to assist in the
management of the patients. The consent/assent form was translated into the local language so
that participants understood very well what they were signing. The study carried no potential
risks to the participants who were free to pull out at anytime of the study.
3.10. Dissemination of study findings
The results of the study will be availed to the department of Paediatrics and Child Health,
Makerere University Medical School, Makerere University School of Post graduate studies, Sir
Albert Cook Medical School Library. Results will be availed to the Deputy Director of Mulago
hospital and Ministry of Health. The work will be availed to the Uganda national council of
science and technology and will be submitted to local and international peer reviewed journals
for publication.
24
CHAPTER FOUR
4.0 Results
4.1 Description of study participants
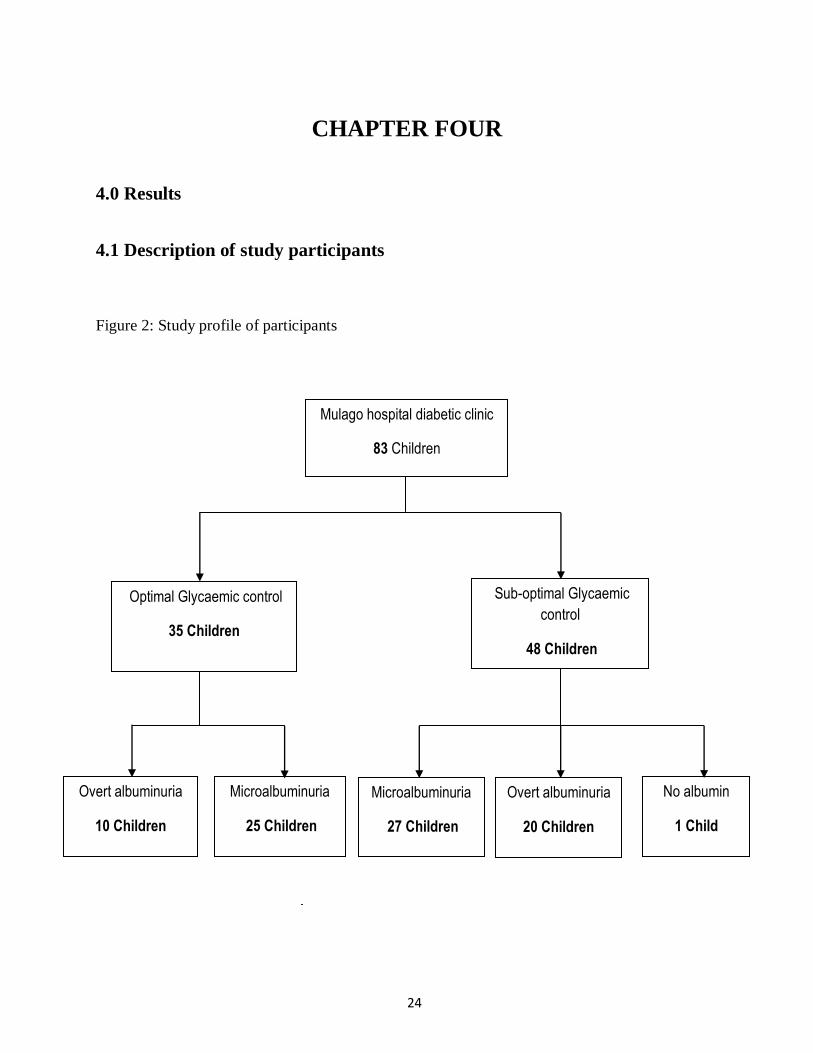
Figure 2: Study profile of participants
Mulago hospital diabetic clinic
83 Children
Sub-optimal Glycaemic
control
48 Children
Optimal Glycaemic control
35 Children
Microalbuminuria
27 Children
Overt albuminuria
20 Children
No albumin
1 Child
Microalbuminuria
25 Children
Overt albuminuria
10 Children
25
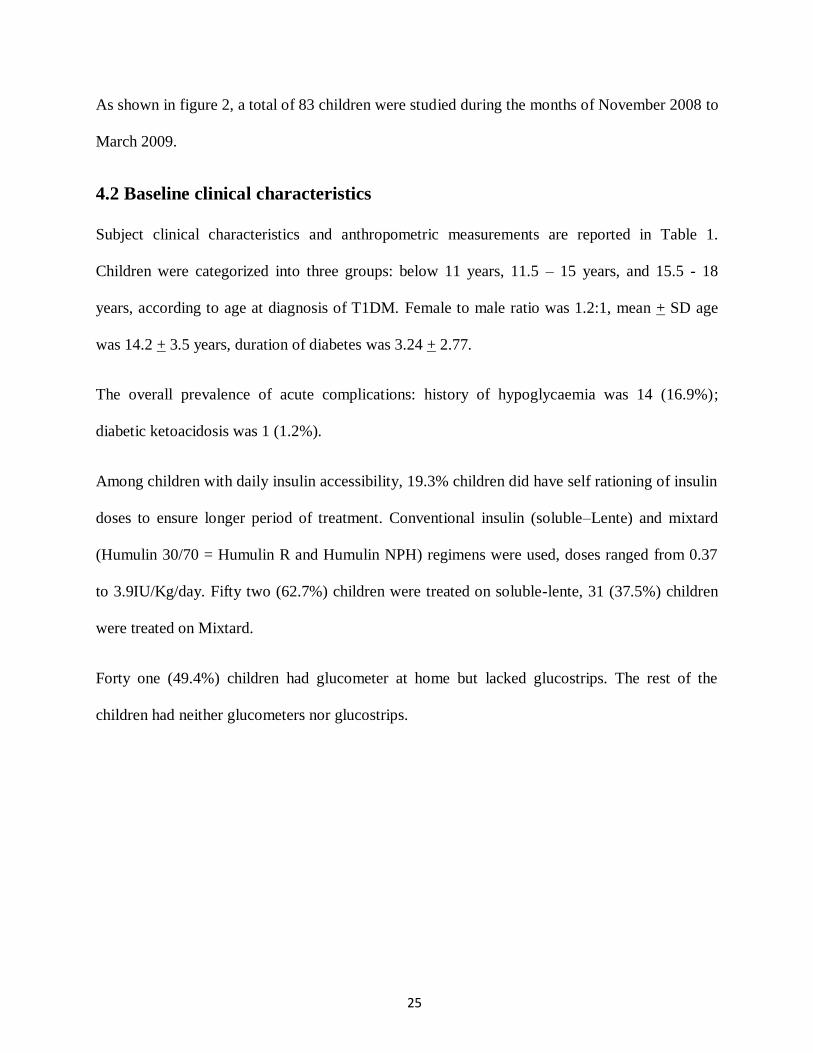
As shown in figure 2, a total of 83 children were studied during the months of November 2008 to
March 2009.
4.2 Baseline clinical characteristics
Subject clinical characteristics and anthropometric measurements are reported in Table 1.
Children were categorized into three groups: below 11 years, 11.5 – 15 years, and 15.5 - 18
years, according to age at diagnosis of T1DM. Female to male ratio was 1.2:1, mean + SD age
was 14.2 + 3.5 years, duration of diabetes was 3.24 + 2.77.
The overall prevalence of acute complications: history of hypoglycaemia was 14 (16.9%);
diabetic ketoacidosis was 1 (1.2%).
Among children with daily insulin accessibility, 19.3% children did have self rationing of insulin
doses to ensure longer period of treatment. Conventional insulin (soluble–Lente) and mixtard
(Humulin 30/70 = Humulin R and Humulin NPH) regimens were used, doses ranged from 0.37
to 3.9IU/Kg/day. Fifty two (62.7%) children were treated on soluble-lente, 31 (37.5%) children
were treated on Mixtard.
Forty one (49.4%) children had glucometer at home but lacked glucostrips. The rest of the
children had neither glucometers nor glucostrips.
26
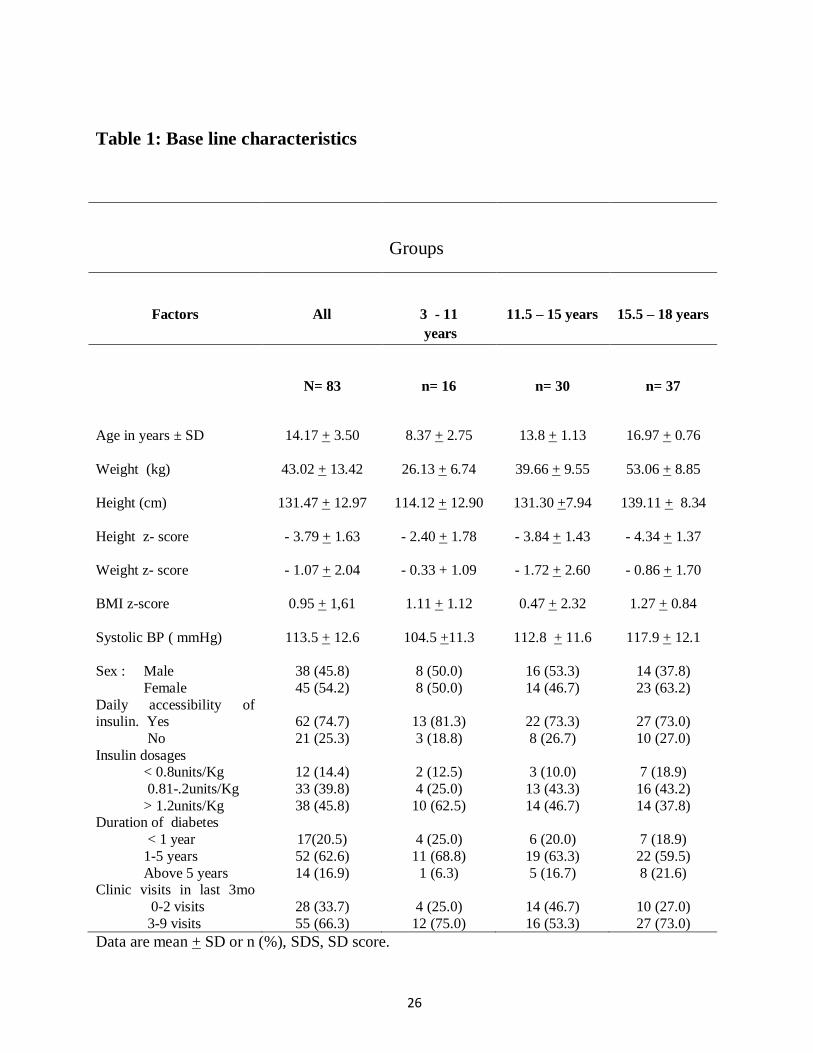
Table 1: Base line characteristics
Groups
Factors All
3 - 11
years
11.5 – 15 years 15.5 – 18 years
N= 83
n= 16
n= 30
n= 37
Age in years ± SD
14.17 + 3.50
8.37 + 2.75
13.8 + 1.13
16.97 + 0.76
Weight (kg) 43.02 + 13.42 26.13 + 6.74 39.66 + 9.55 53.06 + 8.85
Height (cm) 131.47 + 12.97 114.12 + 12.90 131.30 +7.94 139.11 + 8.34
Height z- score - 3.79 + 1.63 - 2.40 + 1.78 - 3.84 + 1.43 - 4.34 + 1.37
Weight z- score - 1.07 + 2.04 - 0.33 + 1.09 - 1.72 + 2.60 - 0.86 + 1.70
BMI z-score 0.95 + 1,61 1.11 + 1.12 0.47 + 2.32 1.27 + 0.84
Systolic BP ( mmHg) 113.5 + 12.6 104.5 +11.3 112.8 + 11.6 117.9 + 12.1
Sex : Male
Female
38 (45.8)
45 (54.2)
8 (50.0)
8 (50.0)
16 (53.3)
14 (46.7)
14 (37.8)
23 (63.2)
Daily accessibility of insulin. Yes
No
62 (74.7)
21 (25.3)
13 (81.3)
3 (18.8)
22 (73.3)
8 (26.7)
27 (73.0)
10 (27.0)
Insulin dosages < 0.8units/Kg
0.81-.2units/Kg
> 1.2units/Kg
12 (14.4)
33 (39.8)
38 (45.8)
2 (12.5)
4 (25.0)
10 (62.5)
3 (10.0)
13 (43.3)
14 (46.7)
7 (18.9)
16 (43.2)
14 (37.8) Duration of diabetes
< 1 year
1-5 years
Above 5 years
17(20.5)
52 (62.6)
14 (16.9)
4 (25.0)
11 (68.8)
1 (6.3)
6 (20.0)
19 (63.3)
5 (16.7)
7 (18.9)
22 (59.5)
8 (21.6) Clinic visits in last 3mo
0-2 visits
3-9 visits
28 (33.7)
55 (66.3)
4 (25.0)
12 (75.0)
14 (46.7)
16 (53.3)
10 (27.0)
27 (73.0)
Data are mean + SD or n (%), SDS, SD score.

27
4.3 Prevalence of sub- optimal glycaemic control and albuminuria
Among 83 children studied, forty eight (57.8%) children had sub- optimal glycaemic control
whilst 35 (42.2%) had optimal glycaemic control (figure2).
Of all studied children, the prevalence of albuminuria was; 1.2% children had no albumin, 62.7%
children had microalbuminuria, 36.1% children had overt albuminuria.
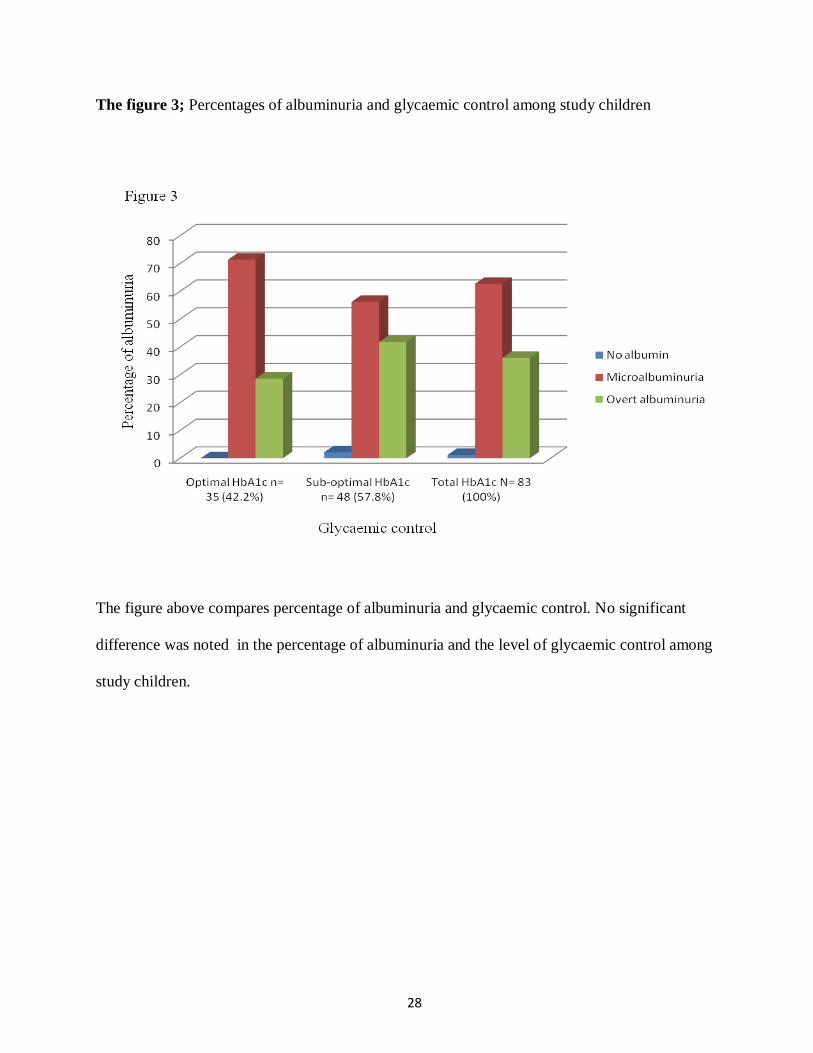
4.4 Glycaemic control and percentage of albuminuria among study children
The distribution of albuminuria among glycaemic level was; 56.2% microalbuminuria [OR
(95% CI) = 1.96 (0.8 – 5), P = 1.16], 41.6% overt albuminuria [OR (95% CI) = 0.6 (0.2 – 1.4), P
= 0.2], whilst 2.2% no albumin for Sub– optimal glycaemic control.
Optimal glycaemic control; 28.6% overt albuminuria [OR (95%CI) = 1.8 (0.7 – 4.5, P = 0.2],
71.4% microalbuminuria [OR (95%CI) = 0.51 (0.2 – 1.3), P = 0.16].
28
The figure 3; Percentages of albuminuria and glycaemic control among study children
The figure above compares percentage of albuminuria and glycaemic control. No significant
difference was noted in the percentage of albuminuria and the level of glycaemic control among
study children.

29
Table 2: Bivariate analysis of factors associated with sub optimal HbA1C levels
Factors
Glycaemic control
OR (95% CI)
P- value Sub- optimal
HbA1C, (n=48 )
Optimal
HbA1C,(n=35 )
Age
≤ 11 years
11.5-15 years
15 – 18 years
8 (50.0)
15 (50.0)
25 (67.6)
8 (50.0)
15 (50.0)
12 (32.4)
1 (0.30 - 3.36)
2.1 (0.63 - 6.90)
1.00
0.23
Sex Male / Female 23 (60.5)/25 (55.6) 15 (39.5)/20 (44.5) 0.8 (0.34 - 1.96) 0.65
Height z-score
Scores > - 2
Score < - 2
8 (80.0)
40 (54.8)
2 (20.0)
33 (45.2)
0.3 (0.06 - 1.53)
0.15
Weight z- score
z – score > - 2
z - score < - 2
12 (48.0)
36 (62.1)
13 (52.0)
22 (37.9)
1.8 (0.69 - 4.57)
0.24
BMI z-score Scores >
Score < 0
40 (57.1)
8 (61.5)
30 (42.9)
5 (38.5)
1.2 (0.36 - 4.04)
0.77
Duration of T1DM.
< 1 year
1- 5 years
Above 5 years
10 (58.8)
32 (61.5)
6 (42.9)
7 (41.2)
20 (38.5)
8 (57.1)
1.1 (0.37- 3.42)
0.5 (0.13 - 2.20)
0.84
0.38
Clinic visits in last 3 months.
0 - 2 visits
3 – maximum visits
17 (60.7)
31 (56.4)
11 (39.3)
24 (43.6)
0.8 (0.33 - 2.11)
0.70
Insulin doses
< 0.8units/Kg
0.81-1.2units/Kg
> 1.2units/Kg
6 (50.0)
19 (57.6)
23 (60.5)
6 (50.0)
14 (42.4)
15 (39.5)
1.4 (0.36 - 5.11)
1.5 (0.42 - 5.66)
0.65
0.52
Insulin type: Soluble-Lente
Mixtard
30 (57.7)
18 (58.1)
22 (42.3)
13 (41.9)
1.0 (0.41 – 2.50)
0.97
Fulltime Insulin availability in
3mo Yes
No
33 (53.2)
15 (71.4)
29 (46.8)
6 (28.8)
2.2 (0.75 - 6.41)
0.14
Insulin insecurity
Did not self ration
Did self rationing
35 (52.2)
13 (81.2)
32 (47.8)
3 (18.8)
4.0 (1.03 -15.19)
0.04
History of hypoglycaemia
Yes
No
7 (50.0)
41 (59.4)
7 (50.0)
28 (40.6)
0.7 (0.21 - 2.16)
0.52
No albuminuria 1 (100) 0 (0)
30
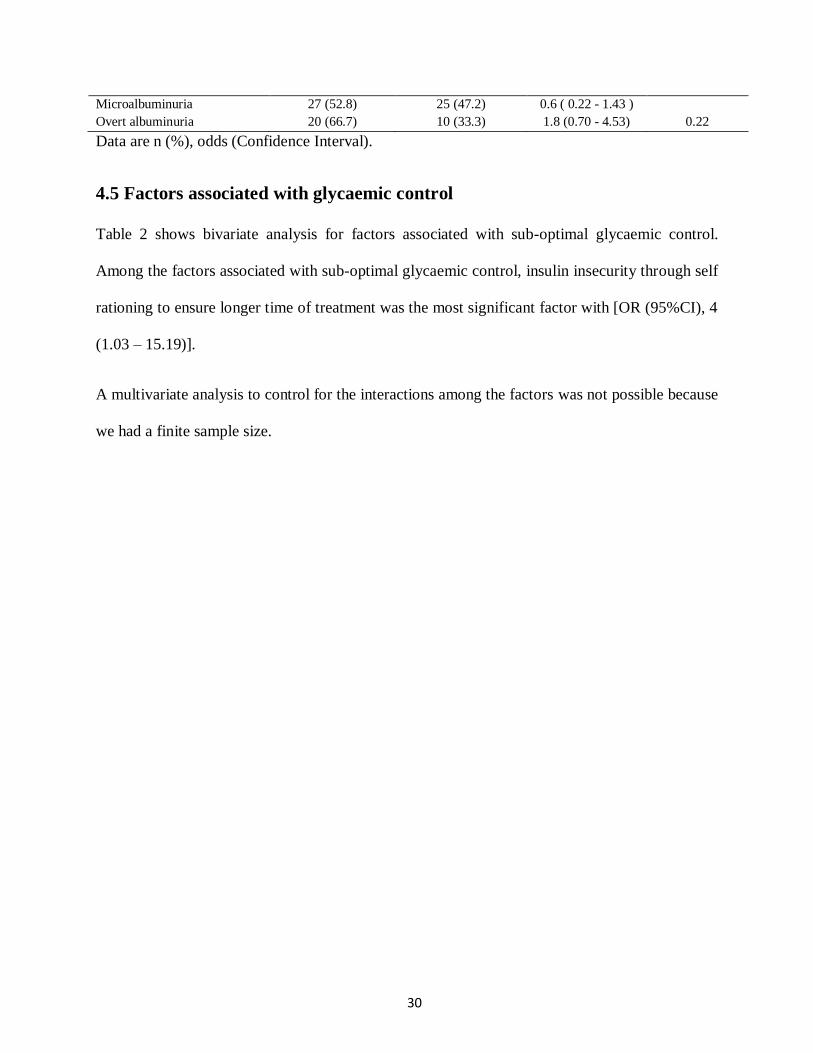
Microalbuminuria
Overt albuminuria
27 (52.8)
20 (66.7)
25 (47.2)
10 (33.3)
0.6 ( 0.22 - 1.43 )
1.8 (0.70 - 4.53)
0.22
Data are n (%), odds (Confidence Interval).
4.5 Factors associated with glycaemic control
Table 2 shows bivariate analysis for factors associated with sub-optimal glycaemic control.
Among the factors associated with sub-optimal glycaemic control, insulin insecurity through self
rationing to ensure longer time of treatment was the most significant factor with [OR (95%CI), 4
(1.03 – 15.19)].
A multivariate analysis to control for the interactions among the factors was not possible because
we had a finite sample size.
31
CHAPTER FIVE
5.0 Discussion
Introduction
A cross sectional study was conducted from November 2008 to March 2009 among children with
type 1 diabetes attending Mulago hospital clinic. The aim of the study was to determine the
prevalence of glycaemic control as measured by HbA1C and the prevalence of microalbuminuria.
We also needed to determine factors associated with sub- optimal glycaemic control as a
secondary objective.
We have reported a high prevalence of poor glycaemic control and a high prevalence of
microalbuminuria; perhaps reflecting a complex environment, in which children with type 1
diabetes live in Africa.
Studies have shown that linear growth might be impaired in children with T1DM even when
reasonable glycaemic control had been achieved78
, and this growth pattern is likely to be more
pronounced in a setting in which control of diabetes is very poor. In fact, most of our children
had short stature, mean height z- scores were low in all three age-groups (table 1) - 3.79 + 1.63
with even lower rates in the pubertal -3.84 + 1.43, and worst in the older age group -4.34 + 1.37
(table 1). The contribution of other well-known factors such as malnutrition and chronic
infections cannot be ruled out. Malnutrition leads to underweight, and subsequently to decreased
height. Poorly controlled diabetes on the other hand can lead to stunting (normal weight for
height or BMI, but poor linear growth)79
.
32
5.1 Prevalence of glycaemic control
In this study, children received soluble- lente and mixtard insulin treatment regimen. The mean
HbA1C was 9.95 + 3.97% compared to 7.5 ± 1.9% reported in developed world80,81
. The high
mean HbA1C, represents poor glycaemic control with a prevalence of 57.8% compared to 8.5%
in studies done in developed world80,81
. However, our findings were similar to a study done in
Tanzania53
, where the prevalence of poor glycaemic control was 60.9% with a mean HbA1C of
10.65 + 2.09%.
Most likely, the underlying causes of poor glycaemic control could be the interaction between
limited insulin supply, lack of self-monitoring of blood glucose, and multiple infections. In
addition to insulin insecurity, patients self rationed insulin doses to ensure longer periods of
treatment as noted in table 2
5.2 Prevalence of microalbuminuria
An overall prevalence of microalbuminuria was 62.7% (figure 3). Chronic sub-optimal
glycaemic control is an important factor in the pathogenesis of microalbuminuria55-57
. However,
depending on the method used the prevalence of microalbuminuria in children and young adults
varies world wide between 5% and 22%34
.
It is possible that the prevalence of microalbuminuria found in this study might have been
overestimated, as confounders like standing for long hours at the clinic and walking long
distances to the hospital might have been contributing factors. We acknowledge that these factors
were not considered during analysis.
The prevalence of microalbuminuria reported in developed34
world is from longitudinal studies
were at least three samples of on spot urine collection one month apart were considered to report
an average. In this study, we needed to establish the current state of glycaemic control and to
33
determine any possible renal complication. Therefore, a longitudinal study was not that was need
since no information was available in the country to compare with.
5.3 Factors associated with poor glycaemic control
In this study, 25.3% children missed insulin doses at least once over the preceding three months
(table 1). This problem was more evident among children with sub- optimal glycaemic control
who had self rationing of insulin to ensure long time of treatment [OR (95%CI) = 4.0 (1.03 -
15.19). This situation may have been exacerbated by intermittent availability of supplies such as
syringes, urine and blood testing strips, and, perhaps most crucially, by limited experience in the
management of diabetes on the part of most health care workers.
The apparently low DKA prevalence of 1.2% is probably from lack of self monitoring, poor
documentation and the arbitrary definitions used in the study. However, the most common cause
of DKA is omitted insulin injections and intercurrent illnesses, but it is more likely to reflect lack
of self monitoring.
Fourteen 14 (16.9%) children reported history of symptomatic hypoglycaemia, this low
percentage of hypoglycaemic episodes found in the study, reflect perhaps a multiplicity of
factors such as: recall bias, intercurrent infections, inappropriate feeding and low levels of
general care. However, the true prevalence of severe hypoglycaemia remains unknown in our
population. The percentage might again have been exaggerated and/ or under reported as we
depended solely on self reporting or parental reporting of these episodes in the absence of self-
monitoring of blood glucose. The prevalence of hypoglycaemia in the Tanzania’s53
study was
(55.6%). Studies have reported that patients with type 1 diabetes, and have chronically poor
glycaemic control perceive hypoglycaemia at higher levels than those with optimal glycaemic
34
control82
, suggesting the possibility that, children in this study might have had normal blood
glucose levels when they had symptoms of hypoglycaemia.
5.4 Conclusions
In this study the following were ascertained;
The prevalence of children with sub-optimal glycaemic was 57.8%, indicating a high
incidence of poor glycaemic control.
The prevalence of microalbuminuria was 62.7%, which is very high, indication that a large
number of children already have early renal disease.
5.5 Recommendations
Regular monitoring of glycaemic control and screening for microalbuminuria in Ugandan
children with T1DM should start as soon as the diagnosis is made.
And a longitudinal study should be carried out to monitor and screen for complications that
may arise in early adulthood.
5.6 Study Limitations
The limited sample size could not allow adequate description of factors associated with sub-
optimal HbA1C.
It was not possible to assess the correlation between the levels of glycaemic control and
frequency of self-monitoring of blood glucose because only 49% children had glucometers,
the majority of which were not functional. In addition, even those with glucometers did not
have glucostrips.
We used a single on spot urine collection to determining the prevalence of MA rather than at
least three on spot urine collection recommended in longitudinal studies.

35
References
1. Diamond Project Group et al. Incidence and trends of childhood type 1diabetes
worldwide 1990–1999. Diabet Med. 2006;23:857–66.
2. International Diabetic Federation; WORLD ATLAS of DIABETES:www.eatlas.idf.org,
2006.
3. Neuhann HF, Lyaruu I, Msuya L, et al. Diabetes care in Kilimanjaro region: clinical
presentation and problems of patients of the diabetes clinic at the regional referral
hospital—an inventory before structured intervention. Diabet Med. 2002;19:509 –13.
4. Amin R, Konopelska-Bahu T, Dunger DB, et al. The relationship between
microalbuminuria and glomerular filtration rate in young type 1 diabetic subjects: The
oxford regional prospective study. Kidney Int. 2005;68:1740–9.
5. CaramoriML, Fioretto P, MauerM, et al. Low glomerular filtration rate in
normoalbuminuric type 1 diabetic patients. An indicator of more advanced glomerular
lesions. Diabetes. 2003;52:1036–40.
6. Chiarelli F, Vibertt A, Morgenstern G, et al. Glomerular hyperfiltration increases the risk
of developing microalbuminuria indiabetic children. Pediatr Nephrol. 1995;9:154–8.
7. Dahlquist G, Sochett E, Rudberg S, et al. Urinary albumin excretion rate in the prediction
of diabetic nephropathy; a longterm follow-up study of childhood onset type-1 diabetic
patients. Nephrol Dial Transplant 2001;16:1382–6.
8. Gorman D, Sochett E, Daneman D, et al. The natural history of microalbuminuria in
adolescents with type I diabetes. J Pediatr. 1999;134:333–7.
9. Lurbe E, Kesani A, Batlle D, et al. Increase in nocturnal BP and progression to
microalbuminuria in type 1 diabetes. N Engl J Med 2002;347:797–805.
10. Twyman S, Mansell P, Leatherdale B, et al. Longitudinal study of urinary albumin
excretion in young diabetic patients—Wessex diabetic nephropathy project. Diabet Med.
2001;18:402–8.
11. Zerbini G, Bognetti E, Chiumello G, et al. Persistent renal hypertrophy and faster decline
of glomerular filtratio rate precede the development of microalbuminuria in type 1
diabetes. Diabetes. 2006;55:2620–5.
36
12. Bojestig M, Hermansson G, Ludvigsson J, et al. Declining incidence of nephropathy in
insulin-dependent diabetes mellitus. N Engl J Med. 1994;330:15–8.
13. Ellis EN, Pysher T, et al. Renal disease in adolescents with type I diabetes mellitus: a
report of the southwest pediatric nephrology study group. Am J Kidney Dis.
1993;22:783–90.
14. Francis J, Rafaat F, Milford DV, et al. Early onset of diabetic nephropathy. Arch Dis
Child. 1997;77:524–5.
15. Harvey J,,Craney L, Meadows PA, et al. Population-based survey and analysis of trends
in the prevalence of diabetic nephropathy in type 1 diabetes. Diabet Med. 2001;18:998–
1002.
16. Hovind P, Rossing K, Parving HH, et al. Decreasing incidence of severe diabetic
microangiopathy in type 1 diabetes. Diabetes Care. 2003;26:1258– 64.
7. Skrivarhaug T, Sandvik L, Joner G, et al. Low risk of overt nephropathy after 24 yr of
childhood-onset type 1 diabetes mellitus (T1DM) in Norway. Pediatr Diabetes.
2006;7:239–46.
18. Chiarelli F, Verrotti A, Mohn A, et al. Treatment of hypertension and microalbuminuria
in children and adolescents with type 1 diabetes mellitus. Pediatr Diabetes. 2002;3:113–
24.
19. Silverstein J, Copeland K, Clark N, et al. Care of children and adolescents with type 1
diabetes Diabetes Care. 2005;28:186–212.
20. David Segal, Rosemary Flynn, Laurie V D, et al. Diabetes youth leaders South Africa.
Training curriculum Houghton, Johannesburg Central Office education publication center
for diabetes and endocrinology (PTY) Ltd, 2007:28 of 79.
21. Lawson M L, Pacaud D, Lawrence S E, et al. Canadian clinical practice guidelines for the
management of diabetes in children and adolescents. Paediatr Child Health
2005;10(Suppl. A):5A−16A.
22. Coonrod BA, ED, Becker D, et al. Predictors of microalbuminuria in individuals with
IDDM. Pittsburgh Epidemiology of Diabetes Complications Study. Diabetes Care.
1993;16:1376–83.
37
23. Jones CA, LG, Kerr S,et al. Development and progression of microalbuminuria in a clinic
sample of patients with insulin dependent diabetes mellitus. Arch Dis Child.
1998;78:518–23.
24. Mortensen HB, Norgaard K, Parving HH, et al. A nation-wide crosssectional study of
urinary albumin excretion rate, arterial blood pressure and blood glucose control in
Danish children with type 1 diabetes mellitus. Danish Study Group on Diabetes in
Childhood. Diabet Med. 1990;7:887–97.
25. Schultz CJ, K-BT, Dalton R, et al. Microalbuminuria prevalence varies with age, sex, and
puberty in children with type 1 diabetes followed from diagnosis in a longitudinal study.
Oxford Regional Prospective Study Group. Diabetes Care. 1999;22:495–502.
26. Rudberg S, Dunger, Et al. Determinants of progression of microalbuminuria in
adolescents with IDDM. Diabetes Care. 1996;19:369–71.
27. Chaturvedi N, SJ, Fuller J, et al. The relationship between smoking and microvascular
complications in the EURODIAB IDDM Complications Study. Diabetes Care.
1995;18:785–92.
28. Doria A, Warram J, Krowleski A, et al. Genetic predisposition to diabetic nephropathy.
Evidence for a role of the angiotensin I-converting enzyme gene. Diabetes 1994;43:690–
5.
29. Quinn M, Warram JS, Krolewski AS, et al. Familial factors determine the development
of diabetic nephropathy in patients with IDDM. Diabetologia 1996;39:940–5.
30. Beran D, Yudhin JS, de Courten M, et al. Diabetes care in sub-Saharan Africa. Lancet.
2006;368:1689-95.
31. Mhando PA, Yudkin JS, et al. The pattern of diabetic complications in African patients in
Dar es Salaam. Trop Geogr Med 1980;32:A317–A23.
32. Sidibe E, Traore H, Liman-Ali L, et al. Main complications of diabetes mellitus in Africa.
Ann Med Interne (Paris). 2000;151:624–8.
33. Group E. Microvascular and acute complications in IDDM patients: the EURODIAB
IDDM Complication Study. Diabetologia. 1994;37:278– 85.
34. Moore TH, Shield, et al. Prevalence of abnormal urinary albumin excretion in
adolescents and children with insulin dependent diabetes: the MIDAC study.

38
Microalbuminuria in Diabetic Adolescents and Children (MIDAC) Research group
Archives of Disease in Childhood 2000;83:239– 43.
35. Deckert T, Borch-Johnsen K, Kofoed-Enevoldsen A, et al. Albuminuria Reflects
Widespread Vascular Damage – The Steno Hypothesis. Diabetologia. 1989;32:219–26.
36. Jensen T, Kofoed-Enevoldson A, Deckert T, et al. Coronary Heart Disease In Young
Type-1 (Insulin-Dependent) Diabetic Patients With And Without Diabetic Nephropathy:
Incidence And Risk Factors Diabetologia. 1987;30:144-8.
37. Borch-Johnsen K, AP, Deckert T, et al. The Effect Of Proteinuria On Relative Mortality
In Type-1 (Insulin-Dependent) Diabetes Mellitus. Diabetologia. 1985;28:590–6.
38. Borch-Johnsen KK, et al. Proteinuria – Value as Predictor Of Cardiovascular Mortality In
insulin dependent Diabetes-Mellitus. Br Med J.1985;294:1651–4.
39. Stephenson JM, Fuller JH, Lee E, et al. Proteinuria And Mortality In Diabetes – The Who
Multinational Study Of Vascular Disease In Diabetes. Diabet Med. 1995;12:149–55.
40. Deckert T, Borch-Johnsen, Mathiesen ER, et al. Natural history of diabetic
complications: early detection and progression (symposium). Diabetes Medicine.
1991;8:33–7.
41. Mogensen CE, Christensen CK, et al. Predicting diabetic nephropathy in insulin-
dependent patients. New England Journal of Medicine. 1984;311:89–93.
42. Mogensen CE, Jerums, G., Viberti, G. C, et al. Prevention of diabetic renal disease with
special reference to microalbuminuria. Lancet. 1995;346:1080–4.
43. Bennett PH, Keane WF, Striker GE, et al. Diabetic renal disease recommendations.
Screening and management of microalbuminuria in patients with diabetes mellitus:
Recommendations to the scientific board of the National Kidney Foundation from an ad
hoc committee on diabetes mellitus of the National Kidney Foundation. Am J Kidney
Dis. 1995;25:107– 12.
44. Mogensen CE, Chritiansen C, Pedersen MM, et al. Microalbuminemia and potential
cofounders. A review and some observations on variability of urinary albumin excretion.
Diabetes Care. 1995;18:572–81.
45. Daneman Danne, et al. Early diabetes-related complications in adolescents. Horm Res.
2005;63:75–85.
46. Danne Thomus, et al. Type 1 Diabetes. Lancet 2006;367:847–58.
39
47. Devendra D, LE, Eisenbarth G, et al. Type 1 Diabetes: Recent Developments. . Br Med
J. 2004;328:750–5.
48. Weinzimer SM, et al. Pediatric Endocrinology: Type 1 Diabetes Mellitus In Children.
The Requisites In Pediatrics. Philadelphia Elsevier Mosby. 2005.
49. Osei K, Amoah AG, Owusu SK, et al. Diabetes in Africa: pathogenesis of type 1 and type
2 diabetes mellitus in Sub- Saharan Africa: implication for transitional population. J
Cardiovasc Risk. 2003;10( ):85– 96.
50. Swai AB, Lutale J, Mclarty DG, et al. Prospective Study Of Incidence Of Juvenile
Diabetes Mellitus Over 10 Years In Dar Es Salaam, Tanzania. Br Med J. 1993;306:1570–
72.
51. Elamin A, Eltayeb B, Tuvemo T, et al. High incidence of type I diabetes mellitusin
Sudanese children,1991–1995. Ann Saudi Med 1997;17:478–80.
52. Elamin A, Zein K, Tuvemo T et al. Epidemiology Of Childhood Type I Diabetes In
Sudan,1987–1990. Diabetes Care. 1992;15:1556–59.
53. Edna S. Majaliwa, Kaushik Ramaiya, Francesco Chiarelli, et al. Survey on Acute and
Chronic Complications in Children and Adolescents With Type 1 Diabetes at Muhimbili
National Hospital in Dar es Salaam, Tanzania. Diabetes Care. 2007;30:2187–92.
54. Ibrahim Kabore, et al. The Prevalence Of Microalbuminuria In Diabetic Patients
Attending The Mulago Hospital Diabetic Clinic. Kampala: Makerere, 1999.
55. Krolewski AS, Quinn M, Warram JH, et al. Glycosylated hemoglobin and the risk of
microalbuminuria in patients with insulin-dependent diabetes mellitus. N Engl J Med.
1995;332:1251–5.
56. Mathiesen ER, Storm B, Dekert T, et al. Relationship Between blood pressure and
urinary albumin excretion in development of microalbuminuria. Diabetes. 1990;39:245–
9.
57. Sharma K, Zein F, et al. Hyperglycaemia and diabetic kidney disease. The case for
transforming growth factor-beta as a key mediator Diabetes Care. 1995;44:1139-46.
58. Mogensen CE et al. Prediction of clinical diabetic nephropathy in IDDM patients:
alternatives to microalbuminuria. Diabetes. 1990;39:761–7.
59. Shankland S, Ly H, Thai K, et al. Expression of transforming growth factor-beta 1 during
diabetic renal hypertrophy Kidney Int 1994:430-42.

40
60. Mathiesen ER, Foght V, Deckert T, et al. The natural course of microalbuminuria in
insulin-dependent diabetes mellitus. A 10 year prospective study Diabet Med.
1995;12:482–7.
61. Mogensen CE, et al. How to protect the kidney in diabetic patients with special
references to IDDM. Diabetes 1997;46(Suppl 2):104–11.
62. Donaghue KC,, Allgrove J, Dahl-Jorgensen K, et al. Microvascular and macrovascular
complications. Pediatr Diabetes. 2007; 8:163–70.
63. Gross JL, Canani LH, Zelmanovitz T et al. Diabetic nephropathy: Diagnosis, prevention,
and treatment Diabetes Care. 2005; 28:176–88.
64. KDOQI, et al. Clinical Practice Guidelines and Clinical Practice Recommendations for
Diabetes and Chronic Kidney Disease. Am J Kidney Dis. 2007; 49(2 Suppl 2):S12–S154.
65. Mogensen CE, Deckert T, Viberti GC et al. Microalbuminuria: an early marker of renal
involvement in diabetes. Uremia Invest 1985;9:85–95.
66. Chase HP, Harris S, Osberg I et al. Borderline increases in albumin excretion rate and the
relation to glycaemic control in subjects with type 1 diabetes. Clin Chem. 1991;37:2048–
52.
67. Couper JJ, Clarke CF, McCaul K et al. Progression of borderline increase in albuminuria
in adolescents with insulin-dependent diabetes. Diabet Med. 1997;14: 766–71.
68. Bangstaad HJ, Kjaersgaard P, Hanssen KF et al. Urinary albumin excretion rate and
puberty in non-diabetic children and adolescents. Acta Paediatr. 1993;82:857– 62.
69. Chiarelli F, Verrotti A, Morgese G. The importance of microalbuminuria as an indicator
of incipient diabetic nephropathy: therapeutic implications. Ann Med. 1997; 29:439–45.
70. Gatling W, Knight C, Hill RD et al. Screening for early diabetic nephropathy: which
sample to detect microalbuminuria? . Diabet Med 1985;2:451–5.
71. Shield JP,, Karavanaki K, Baum JD et al. Is microalbuminuria progressive? Arch Dis
Child. 1995;73:512–4.
72. Chiareli F, Santilli F et al. Diabetic nephropathy in children and adolescents. In: Chiarelli
F, Dahl-Jorgensen K, Kiess W (eds). Pediatr Adolesc Med Basel, Karger. 2005;10:225–
58.
73. Danne T, Hovener G, Weber B et al. Diabetic angiopathy in children. Diabet Med
1997;14:1012–25.
41
74. Campbell F et al. Microalbuminuria and nephropathy in insulin dependent diabetes
mellitus. Arch Dis Child. 1995;73:4–7.
75. Schwarze CP, Dunger DB et al. Management of early diabetic nephropathy in
adolescents with type 1 diabetes mellitus. Pract Diabetes Int. 2005;22:65–9.
76. Kish Leslie et al. survey sampling. John Wiley and Sons NY. 1965.
77. Little RR, WH, England JD et al. Interlaboratory standardization of measurements of
glycohemoglobins. Clin Chem. 1992;38:2472-8.
78. Lebl J, Schober E, Frisch H et al. Growth data in large series of 587 children and
adolescents with type 1 diabetes mellitus. Endocr Regul. 2003;37:153– 61.
79. Ahmed ML, Connors MH, Drayer NM et al. Pubertal growth in IDDM is determined by
HbA1c levels, sex and bone age. Diabetes Care. 1998;21:831– 5.
80. Australasian Peadiatric Endocrinology Group for the Department of Health and Ageing .
Clinical practice guidelines: Type 1 diabetes in children and adolescents. National Health
and Medical Research Council Accessed. http://www.nhmrc.gov.au/publications/_files/
cp102.pdf, Canberra, Australia, 2005.
81. National Institute Of excellence, et al. Type 1 diabetes: Diagnosis and management of
type 1 diabetes in children, young people and adults. National Institute of Clinical
Excellence Accessed. http://www.nice.org.UK/CG015NICEguideline, London, UK,
2004.
82. Polonsky WH, Jacobson AM, Anderson BJ et al. Hyperglycemia, hypoglycemia and
blood glucose control in diabetes: symptom perceptions and treatment strategies. Diabet
Med 1992;9:120 –5.
42
Appendices
Appendix 1: Study consent form
Study title:
GLYCAEMIC CONTROL AND PREVALENCE OF MICROALBUMINURIA AMONG
CHILDREN WITH TYPE 1 DIABETES ATTENDING MULAGO HOSPITAL DIABETIC
CLINIC.
Introduction
I am (representing) Dr Oburu Ofumbi Geoffrey from the Department of Paediatrics and child
health, Makerere University Medical school, P. O. Box 7072, Kampala Uganda, Telephone
number +256-772-540-226.
E-mail address; [email protected]
You are being requested to allow your child to take part in this study. The purpose of this study
is to determine the level of sugar control, factors associated with sub- optimal sugar control and
whether your child might be having early kidney disease.
Study procedure: Your child has been identified to participate in this study and requires your
consent. You will be asked questions about your child’s illness and a physical examination will
be carried out on your child. Blood and urine samples will be obtained from the child upon your
permission for laboratory tests for a random/fasting blood sugar, level of glucose control, urine
protein and creatinine. These are used to determine the level of diabetes control and they reflect
the likelihood for your child developing early kidney disease.
An on- spot fresh urine sample of approximately 2.0mls will be collected at the out patient
reception on the day of a regular visit. Two millitres of blood will be drawn from vessels
between the upper and fore arm joint for analysis of sugar control.
Rights of the patient: Entry into the study is entirely voluntary and no penalty will be incurred
for non-participation. Should you choose that your child withdraws from the study anytime for
43
any reason, you are free to do so and this will not affect the management of your child. In case
you are not happy with your child’s treatment, you may contact any of my supervisors:
Dr Edison Mworozi: Senior Consultant paediatrician Makerere University medical school
department of paediatrics and child health
P. O. Box 7072 Kampala- Uganda.
Tel; 0772 619 355
Dr Israel Kalyesubula
Consultant paediatrician Makerere University medical school department of paediatrics and child
health
P. O. Box 7072 Kampala- Uganda.
Tel; 0772 674 707
Dr. Amos Odiit
Consultant paediatrician Makerere University medical School department of paediatrics and
child health
P O Box 7072, Kampala-Uganda
Tel; 0772 520 991
For questions about the rights of the participants you may consult the chairman of the faculty of
medicine research and ethics committee Dr. Charles Ibingira on telephone 0414530020.
Benefits and risks: The tests done and results obtained will help the team of medical workers
managing your child to know the level of glucose control and how many are currently
developing early kidney disease. The results will be used to institute appropriate measures to
prevent progression to end stage kidney disease. No serious risks are associated with this study,
however, drawing blood from the child will be a little painful but bearable for your child. All
laboratory tests will be free during the study period for the participants.

44
Confidentiality: The identity of your child as well as yours will not be revealed in any
presentation or publications of this study. Confidential information will only be used for research
purposes only. The information obtained in the course of the study will only be communicated to
the medical team managing your child and to no one else without your written permission. This
study carries no risk to the participants. However, the participant will experience little pain on
drawing blood. .
Consent statement: I have been informed of the study to determine the glycosylated haemoglobin
and the prevalence of microalbuminuria among children and adolescents with type 1 diabetes
mellitus attending Mulago hospital.
The purpose and nature of the study, the benefits and risks to my child have all been explained to
me. I was made aware that tests on blood and urine will be done on my child and that these tests
are free of charge. I was also informed that the information given will be kept confidential and
that my child’s participation in this study is entirely voluntary and no consequences will result if
I refuse to participate or withdraw from the study.
I hereby give my informed consent to participate in this study.
.........................................................................................................................................................
Name of parent/care taker Caretaker’s signature or thumb print Date
........................................... .......................................... .........................
Name of investigator/ Signature Date
Research assistant................................Name signature Date
45
Appendix 2: Luganda version consent form
OKUNOONYEREZA KUKUZIYIZA OBULWADDE BW’ENSIGO MUBAANA ABALINA
OBULWADDE BWA SSUKAALI, ABALINA EBIRAGA NTI BAFUNYE OBULWADDE
BW’ENSIGO, NGA BAJJANJABIRWA MU DDWAALIRO E MULAGO.
Ebyanjula:
Ndi wano kulw’omunoonyereza omukulu, Dokita Oburu Ofumbi, asinzidde mu kitongole
ekijjanjaba abaana wano mu Mulago.
Ekigendererwa mukunoonyereza kuno kwekuzuula ebyo ebitera okulaga nti omwana omulwadde
wa ssukaali afunye ekirwadde ky’ensigo, nga kyakatandika.
Enkola :
Omwana wo azuuliddwa nga alina ebisanyizo by’okunoonyereza kuno. Singa omukkiriza ojja
kubuuzibwaayo ebibuuzo ku by’obulwadde bwe ate era omusawo ajja kumwekebejja omubiri
gwonna, wamu nookumuggyako omusaayi n’omusulo nabyo bikeberwe bulungi mu laboratory.
Kino kijja kuyamba abasawo okuzuula ebiraga nti omwana afunye obulwadde bw’ensigo nga
bwakatandika era kibasobozese okuziyiza ebyandivudddemu.
Kijja kwetaagisa nookufuna omusulo gw’omwana gwa mirundi esatu oguwe abasawo abali
mukunooyereza kuno.
Omusulo ogunaasooka ojja kuguggya ku mwana ku lunaku lwe mulina okudda okulaba
omusawo mukilinika.
Eddemde lyo nga nnakyewa (this means volunteer you may need to introduce it in the
English version too):
Okwenyigira mu kunoonyereza kuno kwa kyeyagalire, tewali kuwalirizibwa kwonna, woyagalira
okubivaamu nga obadde wewandiisizza, woobiviiramu, era kino tekikosa bujjanjabi bw’ofuna
okuva mu kilinika eno.
Bwe wabaawo kyeweebuuza kukunoonyereza kuno, osobola okukuba essimu nooyogera
noomunoonyereza omukulu, Dokita Oburu Ofumbi ku namba ya ssimu, 0772540226, oba omu
ku abo abalabirira okunoonyereza kuno;
1) Dokita Mworozi Edison ku namba yassimu, 0772619355,
2) Dokita Israel Kalyesubula ku namba yassimu, 0772674707
3) Dokita Odiit Amos ku namba yassimu, 0772520991
Bano bonna bali kukasanduuko ka posta namba, 7072, Kampala.
46
Emigaso n’akabi ebiri mu kunoonyereza kuno
Ebinaava mu kunoonyereza kuno bijja kuyamba abasawo abajjanjaba omwana wo okusobola
okumanya okukuuma ssukaali we nga ali wansi ate nookumanya omuwendo gw’abaana
abatandise okufuna obulwadde bw’ensigo. Okunoonyereza kwa kuyamba abasawo okusobola
okuziyiza abaana okutuuka mu mbeera embi ennyo eyoobulwadde bw’ensigo. Tewali
ky’ofiirwa nga wetabye mu kunoonyereza kuno okujjako,wajja kubaawo obulumi obutali
bwamanyi okuva kukayiso akaggyako omusaayi,
Enkuuma yebiwandiiko mu kunoonyereza:
Ebibakwataako nga abantu, ggwe n’omwana wo, bijja kuba bya kyama era nga byakukozesebwa
abo bokka abali mukunoonyereza, sibyakuwandiikako oba okukozesebwa mulujjudde olwengeri
yonna okujjako nga gwe owadde olukusa olwo.
Ensasula:
Tewajja kuba kusasulwa kwonna singa wabaawo ekituuka ku mwana mu kiseera ky’anaamala
nga ali mu kunoonyereza kuno, wabula kyonna ekisoboka okumuwa obujjanjabi obwetagisa,
kyakukolebwa.
Okussaako omukono:
Ntegezebbwa byonna ebikwata ku kunoonyereza kuno byonna, ensonga lwaki kwetaagisa, bye
nnyinza okuganyulwamu,oba okufiirwa. Ntegeezebbwa nti kijja kwetaagisa okuggya ku mwana,
omusaayi noomusulo, eby’okunoonyerezebwako, era nti ebifa kukunoonyereza bya kukuumibwa
nga bya kyama ate nga nookwetaba mu kunoonyereza kwa kyeyagalire. Wenjagalira nsobola
okubivaamu nga tewali kye nfiirwa kubujjanjabi omwana bw’afuna mukirinika.
Nzikirizza omwana wange okwetaba mu kunoonyereza. ………………………………
(Erinnya ly’omuzadde/omujjanjabi) (Ekinkumu) …........…Olunaku/omwezi/omwaka
Name of investigator/research asst Signature Date
47
Appendix 3: Assent form
Study title
GLYCAEMIC CONTROL AND PREVALENCE OF MICROALBUMINURIA AMONG
CHILDREN WITH TYPE 1 DIABETES ATTENDING MULAGO HOSPITAL DIABETIC
CLINIC.
Introduction
I am (representing) Dr. Oburu Ofumbi Geoffrey from the department of paediatrics and child
health, conducting a study to find out the level of sugar control, factors associated with sub-
optimal sugar control and the presence of early kidney disease in children attending Mulago
hospital clinic.
The findings of this study will help health worker provide appropriate treatment to children with
diabetes that may be having early kidney disease.
Procedures
During the study you will be asked questions about your illness such as fever, length of disease,
and age when first diagnosed with diabetes. You will under go a full examination, blood and
urine samples will be taken for laboratory for analysis.
You will also be asked to collect an on- spot fresh urine sample that you will collect and deliver
on the day of your next regular hospital visit.
Risks and benefits
There may be some discomfort caused by the needle prick when drawing blood. Emphasis will
be put on ensuring that blood is drawn under aseptic conditions. The laboratory tests will be
carried out free of charge and results obtained will be helpful both to the patient and to the health
workers caring for children with diabetes and early kidney disease.
Patient’s rights
Participation in this study is voluntary. Refusal to participate in this study will no way affect
your treatment. You are free to withdraw from the study at any stage. In case of any queries
contact Dr.Oburu Ofumbi from the department of paediatrics and child health, Mulago hospital
Tel. 0772-540-226. Or any of his supervisors:
Dr Edison Mworozi
48
Senior Consultant paediatrician Makerere University Medical School Department of Paediatrics
and Child Health
P. O. Box 7072 Kampala- Uganda.
Tel; 0772 619 355
Dr Israel Kalyesubula
Consultant paediatrician Makerere University medical school department of paediatrics and child
health
P. O. Box 7072 Kampala- Uganda.
Tel; 0772 674 707
Dr. Amos Odiit
Consultant paediatrician Makerere University medical School department of paediatrics and
child health
P O Box 7072, Kampala-Uganda
Tel; 0772 520 991
For questions about the rights of the participants you may consult the chairman of the faculty of
medicine research and ethics committee Dr. Charles Ibingira on telephone 0414530020.
Statement of assent
I have been informed about the nature of this study. I understand that questions will be asked of
me and I will undergo a physical examination. Urine and blood samples will be taken off for
laboratory analysis. All laboratory tests will be free of charge during the study period.
Participation is voluntary and refusal to participate in the study will be no way affecting my
treatment. I am free to withdraw from the study at anytime. I therefore, sign below as proof of
my assent.
.................................................................... ............................................
Name: Signature/Thumbprint.... Date/month
.................................................................................................................... ......................................
Name: Signature

49
Appendix 4 Luganda version of assent form:
OKUNOONYEREZA KUKUZIYIZA OBULWADDE BW’ENSIGO MUBAANA ABALINA
OBULWADDE BWA SSUKAALI, ABALINA EBIRAGA NTI BAFUNYE OBULWADDE
BW’ENSIGO, NGA BAJJANJABIRWA MU DDWAALIRO E MULAGO.
Ebyanjula:
Ndi wano kulw’omunoonyereza omukulu, Dokita Oburu Ofumbi, asinzidde mu kitongole
ekijjanjaba abaana wano mu Mulago.
Ekigendererwa mukunoonyereza kuno kwekuzuula ebyo ebitera okulaga nti omwana omulwadde
wa ssukaali afunye ekirwadde ky’ensigo, nga kyakatandika.
Enkola :
Okuyita mu kiseera ky’onomala nga wenyigidde mu kunoonyereza kuno, ojja kubuuzibwa
ebikwata kubulamu bwo, gamba nga omusujja, ebbanga lyoomaze ne ssukaali, ne ddi
lwewasooka okumanya nti olina ssukaali. Ojja kufuna okwekebejjebwa omubiri gwonna, era
oggyibweko omusaayi n’omusulo bisobole okukeberebwa obulungi.
Kijja kwetagisa okutuwa omusulo kw’olwo lw’onodda okulaba omusawo mu kilinika.
Emigaso n’akabi ebiri mu kunoonyereza kuno Wajja kubaawo obulumi obutali bwa maanyi
okuva kukayiso akaggyako omusaayi, naye nga omutindo gw’obuyonjo ogwokukozesebwa mu
kino gujja kuba gwawaggulu ddala. Okukebera okunetagisa kwonna kujja kuba kwa bwereere,
ate nga ebinaava mu kunoonyereza byakuyamba abasawo okusobola okujjanjaba abaana ababa
bakafuna obulwadde bw’ensigo.
Eddemde lyo nga nnakyewa
Okwenyigira mu kunoonyereza kuno kwa kyeyagalire, tewali kuwalirizibwa kwonna, woyagalira
okubivaamu nga obadde wewandiisizza, woobiviiramu, era kino tekikosa bujjanjabi bw’ofuna
okuva mu kilinika eno.
50
Bwe wabaawo kyeweebuuza kukunoonyereza kuno, osobola okukuba essimu nooyogera
noomunoonyereza omukulu, Dokita Oburu Ofumbi ku namba ya ssimu, 0772540226, oba omu
ku abo abalabirira okunoonyereza kuno;
1) Dokita Mworozi Edison ku namba yassimu, 0772619355,
2) Dokita Israel Kalyesubula ku namba yassimu, 0772674707
3) Dokita Odiit Amos ku namba yassimu, 0772520991
Bano bonna bali kukasanduuko kaposta namba, 7072, Kampala.
Ebikwata ku kunoonyereza nga kukyagenda mu maaso oba nga kuwedde, osobola okukubira
Dokita Ibingira Charles, 0414530020, ono nno nga yesentebe wokunoonyereza nookukwasisa
empisa mu Uganda.
Okussaako omukono:
Ntegezebbwa byonna ebikwata ku kunoonyereza kuno byonna, ensonga lwaki kwetaagisa, bye
nnyinza okuganyulwamu,oba okufiirwa. Ntegeezebbwa nti kijja kwetaagisa okuggya ku mwana,
omusaayi noomusulo, eby’okunoonyerezebwako, era nti ebifa kukunoonyereza bya kukuumibwa
nga bya kyama ate nga nookwetaba mu kunoonyereza kwa kyeyagalire. Wenjagalira nsobola
okubivaamu nga tewali kye nfiirwa kubujjanjabi omwana bw’afuna mukirinika.
Erinnya)/(Ekinkumu) ……………......………………Olunaku/omwezi/omwaka
…………………………………………………………………………...
Name (Ekinkumu)
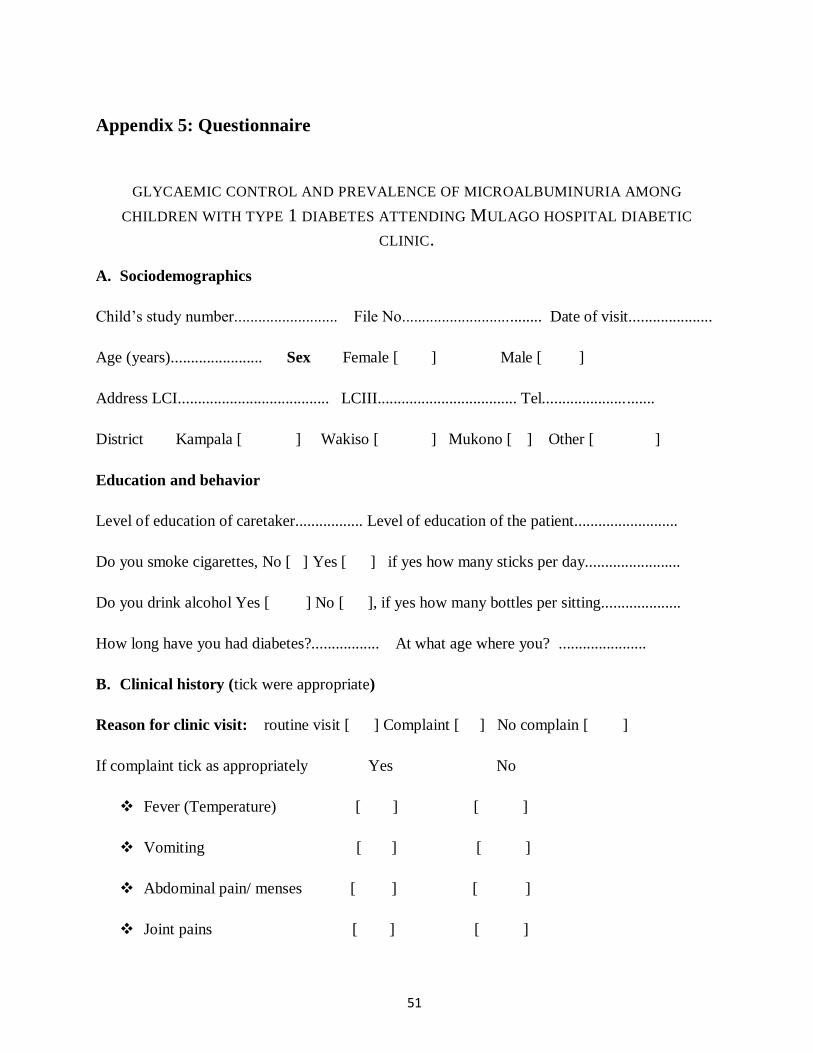
51
Appendix 5: Questionnaire
GLYCAEMIC CONTROL AND PREVALENCE OF MICROALBUMINURIA AMONG
CHILDREN WITH TYPE 1 DIABETES ATTENDING MULAGO HOSPITAL DIABETIC
CLINIC.
A. Sociodemographics
Child’s study number.......................... File No................................... Date of visit.....................
Age (years)....................... Sex Female [ ] Male [ ]
Address LCI...................................... LCIII................................... Tel............................
District Kampala [ ] Wakiso [ ] Mukono [ ] Other [ ]
Education and behavior
Level of education of caretaker................. Level of education of the patient..........................
Do you smoke cigarettes, No [ ] Yes [ ] if yes how many sticks per day........................
Do you drink alcohol Yes [ ] No [ ], if yes how many bottles per sitting....................
How long have you had diabetes?................. At what age where you? ......................
B. Clinical history (tick were appropriate)
Reason for clinic visit: routine visit [ ] Complaint [ ] No complain [ ]
If complaint tick as appropriately Yes No
Fever (Temperature) [ ] [ ]
Vomiting [ ] [ ]
Abdominal pain/ menses [ ] [ ]
Joint pains [ ] [ ]
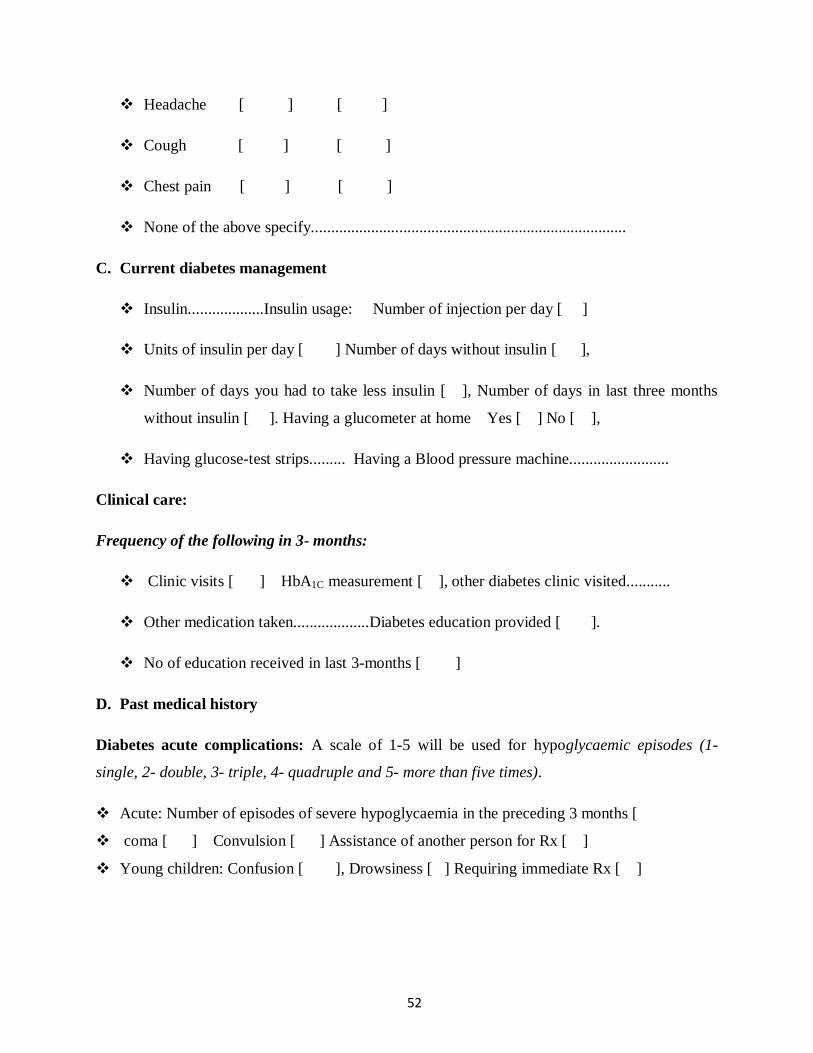
52
Headache [ ] [ ]
Cough [ ] [ ]
Chest pain [ ] [ ]
None of the above specify...............................................................................
C. Current diabetes management
Insulin...................Insulin usage: Number of injection per day [ ]
Units of insulin per day [ ] Number of days without insulin [ ],
Number of days you had to take less insulin [ ], Number of days in last three months
without insulin [ ]. Having a glucometer at home Yes [ ] No [ ],
Having glucose-test strips......... Having a Blood pressure machine.........................
Clinical care:
Frequency of the following in 3- months:
Clinic visits [ ] HbA1C measurement [ ], other diabetes clinic visited...........
Other medication taken...................Diabetes education provided [ ].
No of education received in last 3-months [ ]
D. Past medical history
Diabetes acute complications: A scale of 1-5 will be used for hypoglycaemic episodes (1-
single, 2- double, 3- triple, 4- quadruple and 5- more than five times).
Acute: Number of episodes of severe hypoglycaemia in the preceding 3 months [
coma [ ] Convulsion [ ] Assistance of another person for Rx [ ]
Young children: Confusion [ ], Drowsiness [ ] Requiring immediate Rx [ ]
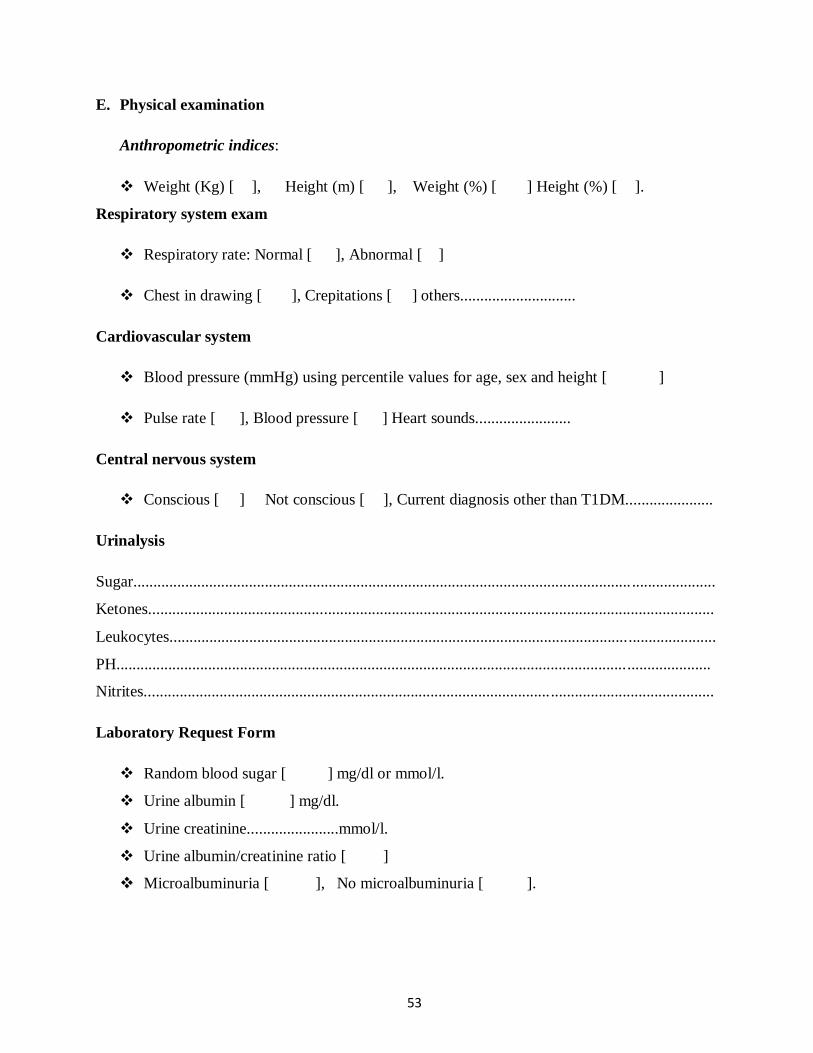
53
E. Physical examination
Anthropometric indices:
Weight (Kg) [ ], Height (m) [ ], Weight (%) [ ] Height (%) [ ].
Respiratory system exam
Respiratory rate: Normal [ ], Abnormal [ ]
Chest in drawing [ ], Crepitations [ ] others.............................
Cardiovascular system
Blood pressure (mmHg) using percentile values for age, sex and height [ ]
Pulse rate [ ], Blood pressure [ ] Heart sounds........................
Central nervous system
Conscious [ ] Not conscious [ ], Current diagnosis other than T1DM......................
Urinalysis
Sugar............................................................................................................................. .....................
Ketones..............................................................................................................................................
Leukocytes.........................................................................................................................................
PH.....................................................................................................................................................
Nitrites...............................................................................................................................................
Laboratory Request Form
Random blood sugar [ ] mg/dl or mmol/l.
Urine albumin [ ] mg/dl.
Urine creatinine.......................mmol/l.
Urine albumin/creatinine ratio [ ]
Microalbuminuria [ ], No microalbuminuria [ ].

54
Appendix 6: Urinary protein calorimetry
GLYCAEMIC CONTROL AND PREVALENCE OF MICROALBUMINURIA AMONG
CHILDREN WITH TYPE 1 DIABETES ATTENDING MULAGO HOSPITAL DIABETIC
CLINIC.
Determination of urinary protein using the calorimetric method based on the buiret’s reaction
Principle
Alkaline copper solution reacts with the peptide bonds in the protein molecule, production a
violet colour which is directly proportional to the amount of protein present.
Reagents
20% trichloroacetic acid
1M sodium hydroxide, 40mg per litre of water
Standard protein solution: 5.0g /l in 0.9% NaCl
Stock Buiret’s reagent. Dissolve 45g of sodium potassium titration in approximately in 400ml of
0.2M sodium hydroxide. Add with constant stirring 15g of copper sulphate; when in solution add
5g of KI and dilute to 1.0 litre with 0.2M NaOH.
Working Buiret’s solution
Methods
Test
To 1.0 or 2.0ml of urine add equal volume of trichloroacetic acid
Mix well and allow stand for 3 minutes.
Centrifuge
Decant the supernatant fluid without disturbing the deposit.
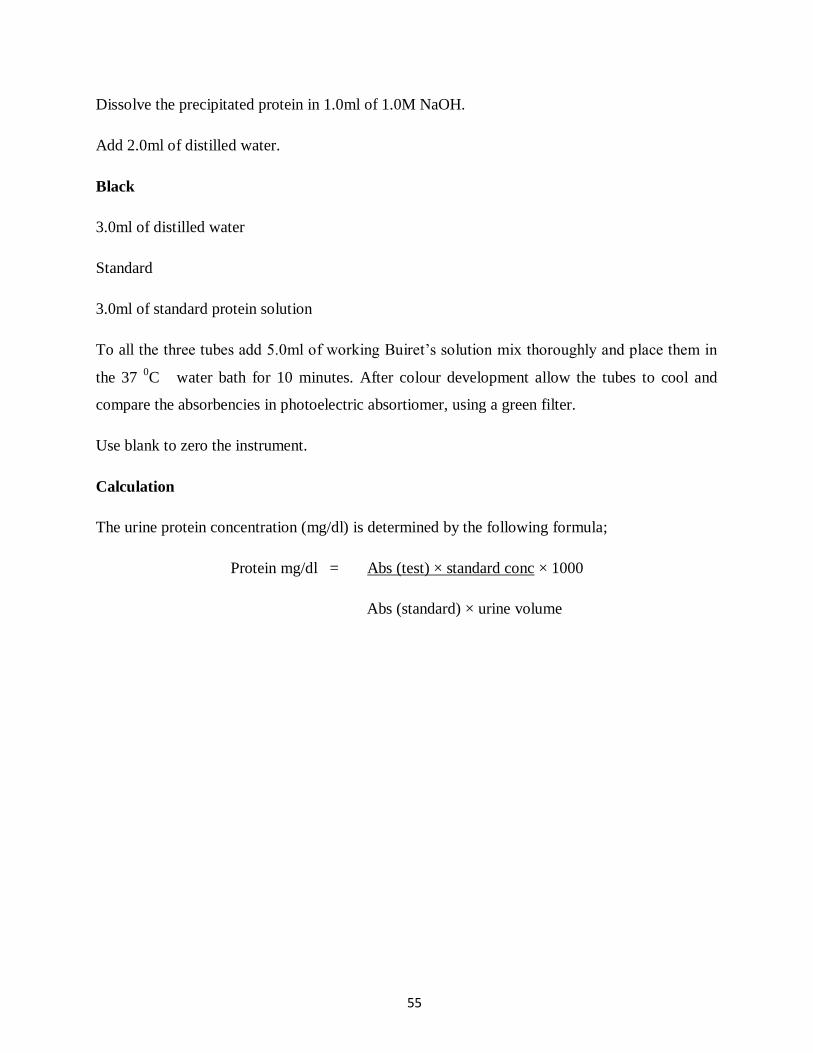
55
Dissolve the precipitated protein in 1.0ml of 1.0M NaOH.
Add 2.0ml of distilled water.
Black
3.0ml of distilled water
Standard
3.0ml of standard protein solution
To all the three tubes add 5.0ml of working Buiret’s solution mix thoroughly and place them in
the 37 0C
water bath for 10 minutes. After colour development allow the tubes to cool and
compare the absorbencies in photoelectric absortiomer, using a green filter.
Use blank to zero the instrument.
Calculation
The urine protein concentration (mg/dl) is determined by the following formula;
Protein mg/dl = Abs (test) × standard conc × 1000
Abs (standard) × urine volume
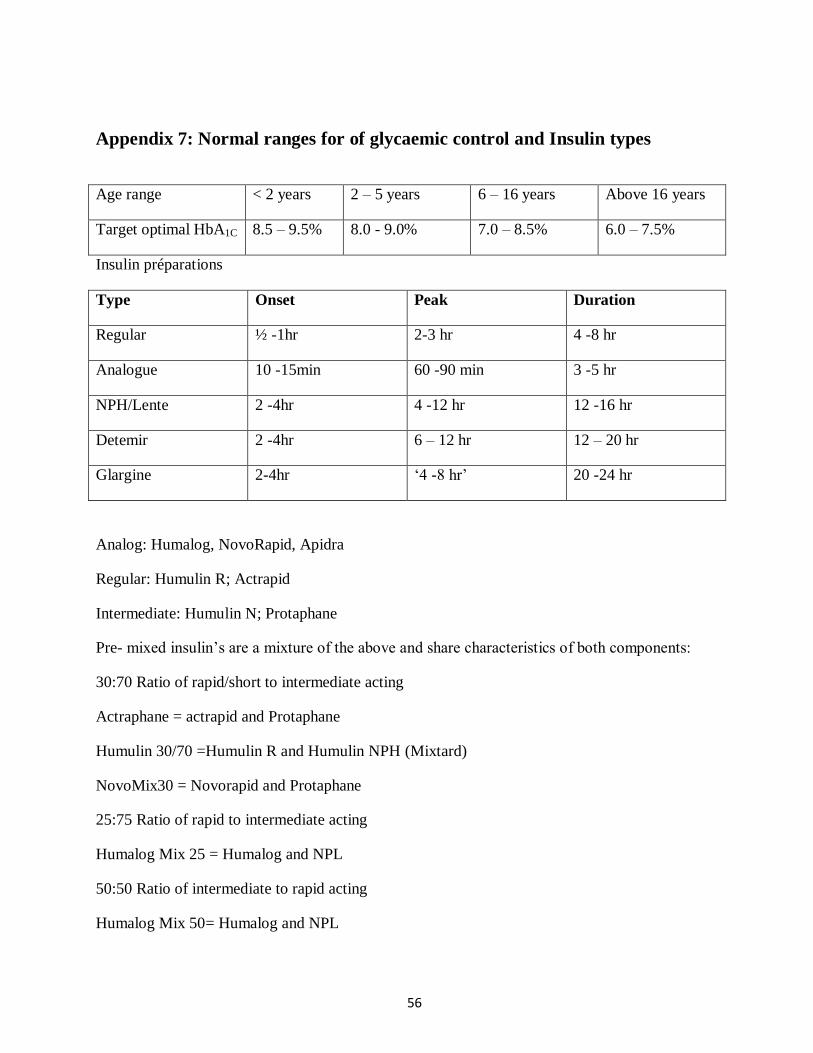
56
Appendix 7: Normal ranges for of glycaemic control and Insulin types
Age range < 2 years 2 – 5 years 6 – 16 years Above 16 years
Target optimal HbA1C 8.5 – 9.5% 8.0 - 9.0% 7.0 – 8.5% 6.0 – 7.5%
Insulin préparations
Type Onset Peak Duration
Regular ½ -1hr 2-3 hr 4 -8 hr
Analogue 10 -15min 60 -90 min 3 -5 hr
NPH/Lente 2 -4hr 4 -12 hr 12 -16 hr
Detemir 2 -4hr 6 – 12 hr 12 – 20 hr
Glargine 2-4hr ‘4 -8 hr’ 20 -24 hr
Analog: Humalog, NovoRapid, Apidra
Regular: Humulin R; Actrapid
Intermediate: Humulin N; Protaphane
Pre- mixed insulin’s are a mixture of the above and share characteristics of both components:
30:70 Ratio of rapid/short to intermediate acting
Actraphane = actrapid and Protaphane
Humulin 30/70 =Humulin R and Humulin NPH (Mixtard)
NovoMix30 = Novorapid and Protaphane
25:75 Ratio of rapid to intermediate acting
Humalog Mix 25 = Humalog and NPL
50:50 Ratio of intermediate to rapid acting
Humalog Mix 50= Humalog and NPL