Embed Size (px)
Citation preview
Name: Per: Date: _ ID: A
Math 8H Linear Graphing Review
Multiple ChoiceIdentify the choice that best completes the statement or answers the question.
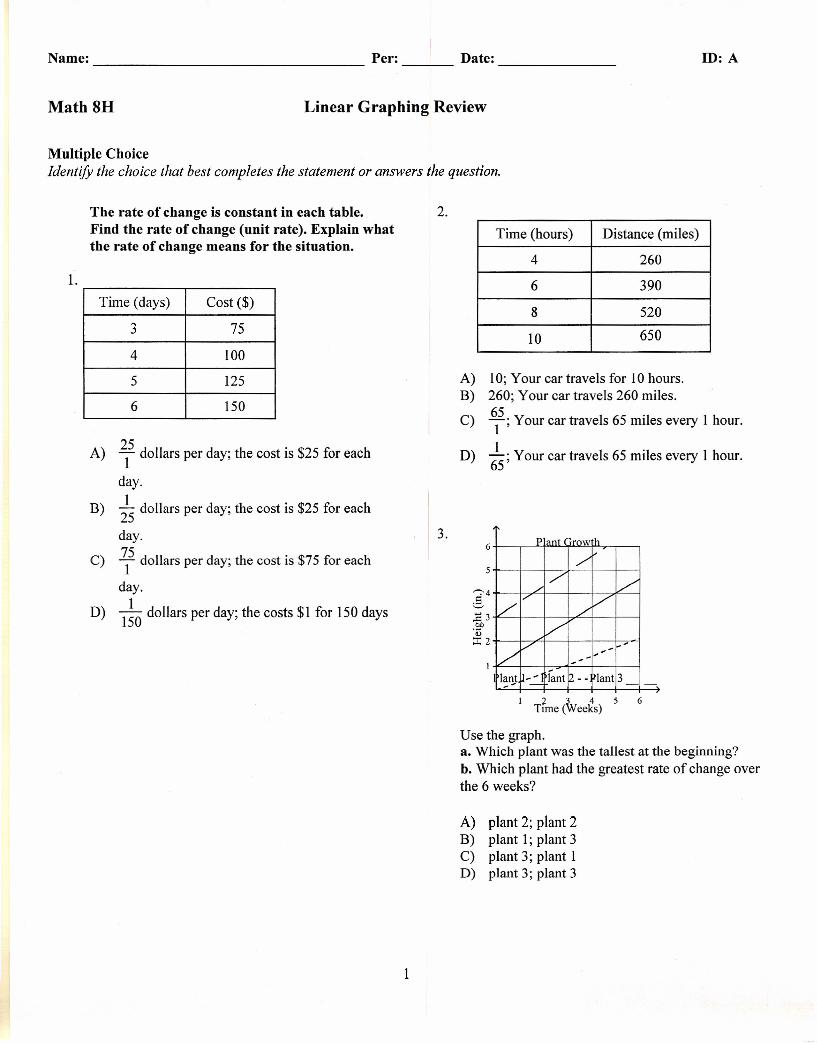
The rate of change is constant in each table. 2.Find the rate of change (unit rate). Explain whatthe rate of change means for the situation.
Time (hours) Distance (miles)
4 260
6 390
8 520
10 650
1.
Time (days) Cost ($)
3 75
4 100
5 125
6 150
A) ~5 dollars per day; the cost is $25 for each
day.
B) i5 dollars per day; the cost is $25 for each
day.
C) i5 dollars per day; the cost is $75 for each
day.1
D) 150 dollars per day; the costs $1 for 150 days
A) 10; Your car travels for 10 hours.B) 260; Your car travels 260 miles.
C) ~5; Your car travels 65 miles every 1 hour.
D) ;5; Your car travels 65 miles every 1 hour.
3.6
5
'"":'4
5;<::30/)
'0::r:2
Plant Growth./'
/
-:V
1/1/ ./ V
V./' ~
/ .•~~-~~Plant ~~~ fa~t 2 -- Plant 3 --- ~
I 'l- ).. 4 5Tune t weeks)
6
Use the graph.a. Which plant was the tallest at the beginning?h. Which plant had the greatest rate of change overthe 6 weeks?
A) plant 2; plant 2B) plant 1; plant 3C) plant 3; plant ID) plant 3; plant 3
4.
5. 4
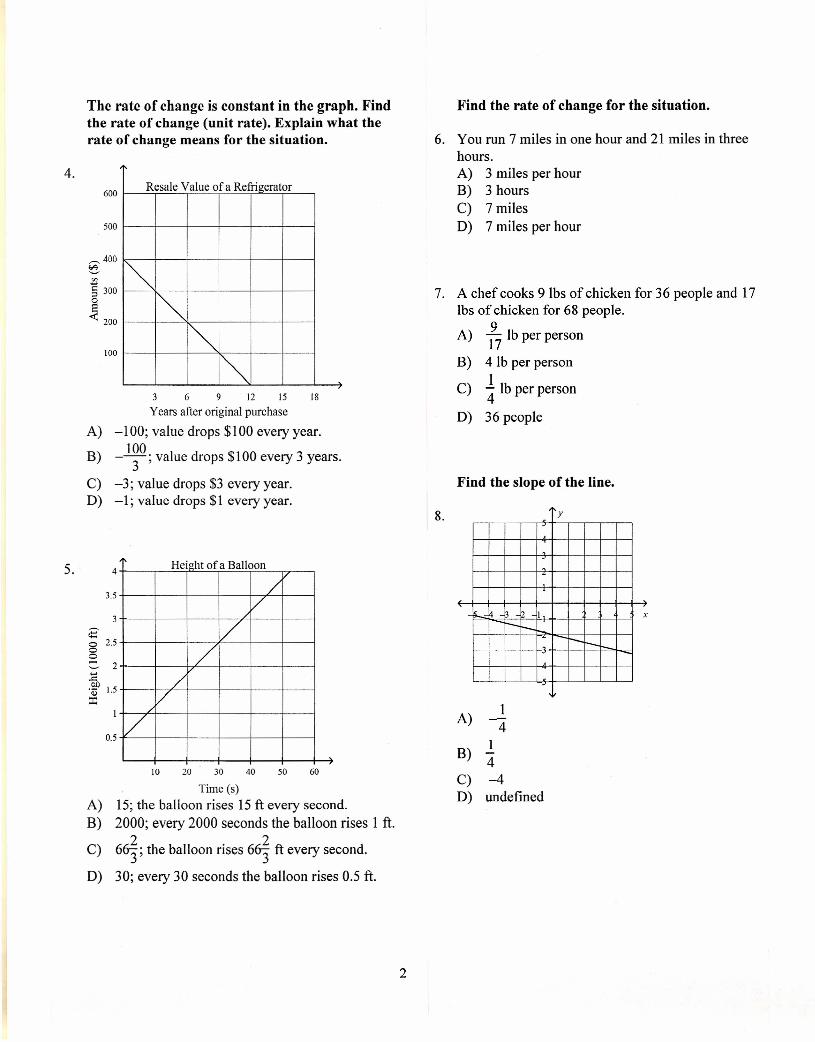
The rate of change is constant in the graph. Findthe rate of change (unit rate). Explain what therate of change means for the situation.
600Resale Value ofa Refrigerator
I~I~r-.
~
500
,-., 400!A'-'
</J
§ 300o
~ 200
100
3 6 9 12 15 18
Years after original purchase
A) -100; value drops $100 every year.100B) --3-; value drops $100 every 3 years.
C) -3; value drops $3 every year.D) -1; value drops $1 every year.
3.5
Height of a Balloon
/V
V/
/V
V
,-.,¢::o 2.5oo:::. 2
~1.5~
0.5
10 20 30 40 50 60
Time (s)A) 15; the balloon rises 15 ft every second.B) 2000; every 2000 seconds the balloon rises 1 ft.
e) 6~; the balloon rises 6~ ft every second.
0) 30; every 30 seconds the balloon rises 0.5 ft.
Find the rate of change for the situation.
6. You run 7 miles in one hour and 21 miles in threehours.A) 3 miles per hourB) 3 hoursC) 7 miles0) 7 miles per hour
7. A chef cooks 9 lbs of chicken for 36 people and 17lbs of chicken for 68 people.
9A) 17 lb per person
B) 4 lb per person1
C) "4 Ib per person
0) 36 people
Find the slope of the line.
8. y
I xr--10..-
r--14
B) 14
C) -40) undefined
A)
2
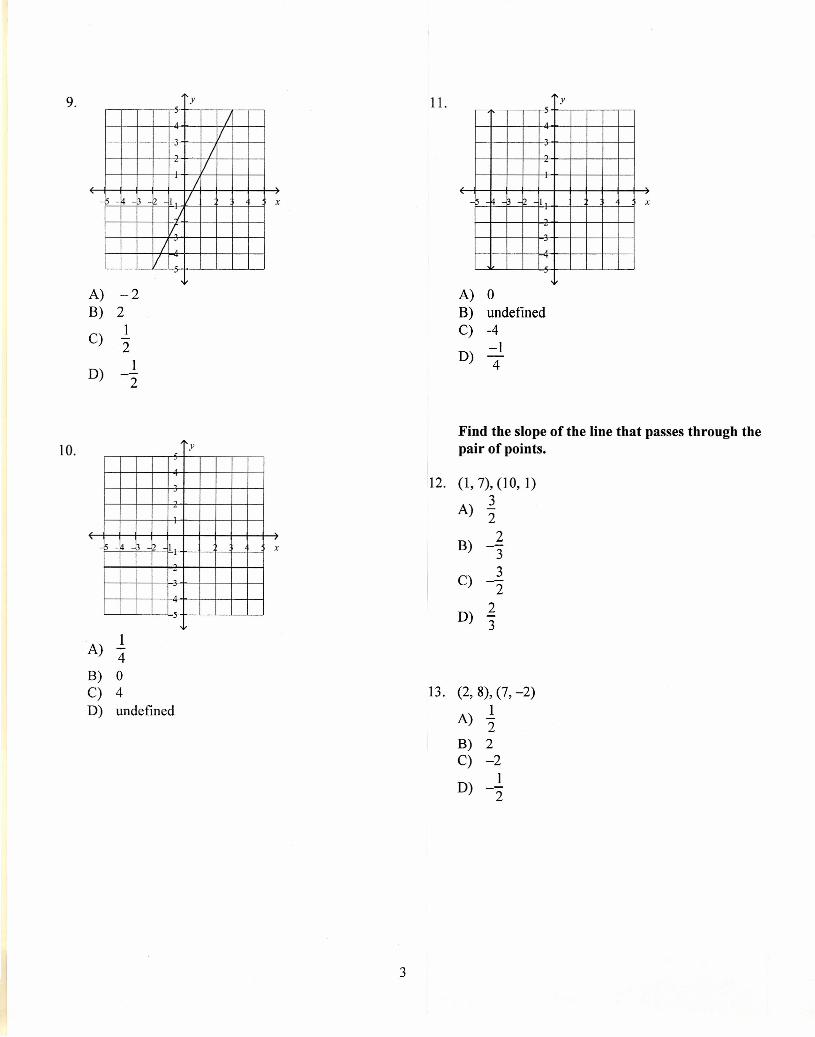
9. y
//
, III
I~ t> I II x
JI
III
11. y
,
~ I x
A) -2 A) °B) 2 B) undefined
C)1 C) -4-2 -1
D) -D)
1 42
10. y
~
I x
Find the slope of the line that passes through thepair of points.
12. (1, 7), (10, 1)
A) 3-2
B) 23
C) 32
D)2-3
A) 14
B) 0C) 4D) undefined
13. (2,8), (7, -2)1
A) 2
B) 2C) -2
1D) 2
3
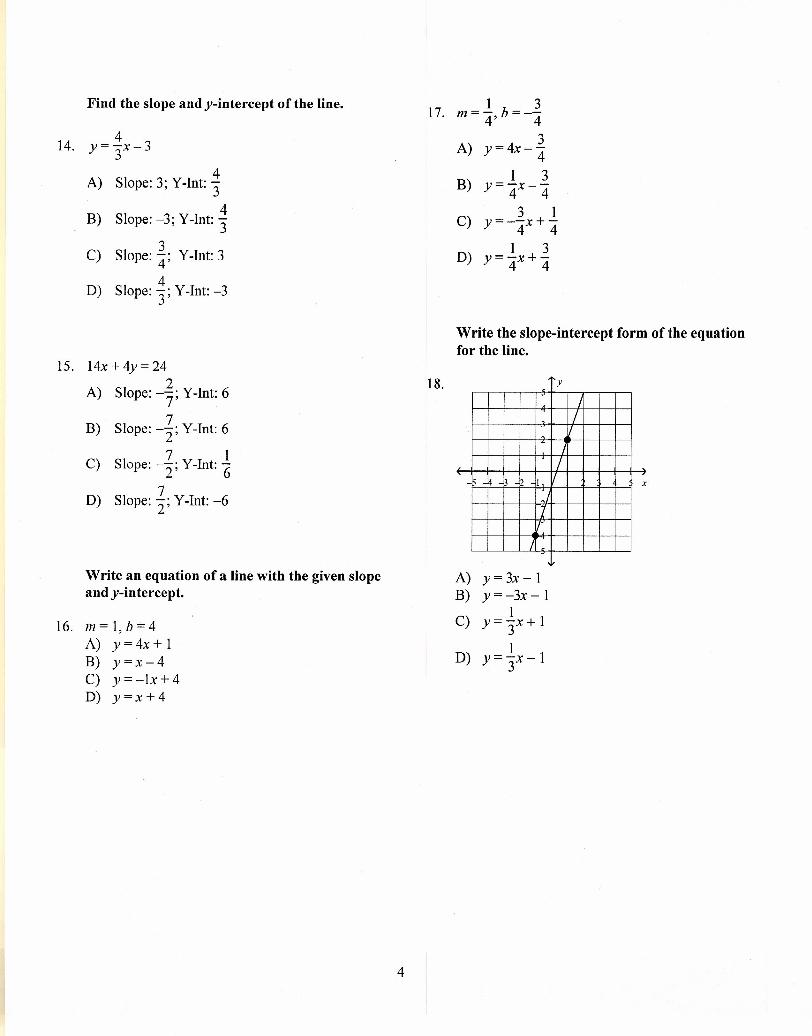
Find the slope and y-intercept of the line.17.
1 3m=- b=--4' 4
14.4 3y= -x-3 A) y=4x-'43
A) 4 1 3Slope: 3; Y-Int: 3 B) y=-x--4 4
B) 4 3 1Slope: -3; Y-Int: 3 C) y=--x+-4 4
C) 3 1 3Slope' -' Yvlnt: 3 D) y=-x+-. 4' . 4 4
D)4
Slope: 3; Y-Int: -3
15. 14x+ 4y= 24
A) 2 18.Slope: -'7; Y-Int: 6
B) 7Slope: -'2; Y-Int: 6
C) 7 1Slope: -'2; Y-Int: '6
D) 7Slope: '2; Y-Int: -6
Write an equation of a line with the given slopeand y-intercept.
16. m=l,b=4A) y =4x + 1B) y=x-4C) y =-lx + 4D) y=x+4
4
Write the slope-intercept form of the equationfor the line.
y
//
1/
//
tl 1 x
.tI
II
/ ,
A) y= 3x-1B) y= -3x-1
1C) y= 3x + 1
1D) y= 3x-1
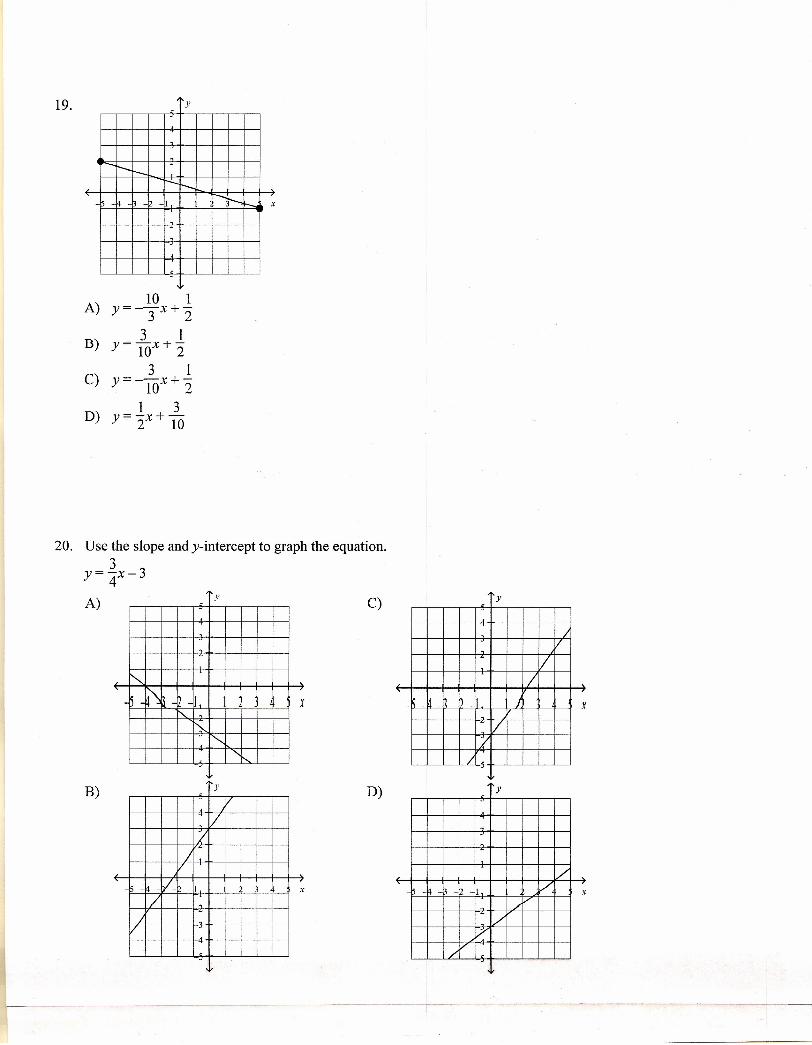
19. y
,
I---- t-'- I--
Is b-....t--1 I--. x-,
,
A)10 1y=--x+-3 2
B) 3 1Y=lOx+"2
C)3 1
Y=-lox+ "2D) 1 3
Y="2x+lO
20. Use the slope andy-intercept to graph the equation.3y="4x-3
A) y
r-,D
;\.~ I X-,r-,
<,
""y
Vl
/vIs V 1 x
//
V
r
B)
C) y
/V
//
b I ~ x
V:I
/
D) y
,
1/14 II I
,/x
/~1/
V/v
t:-
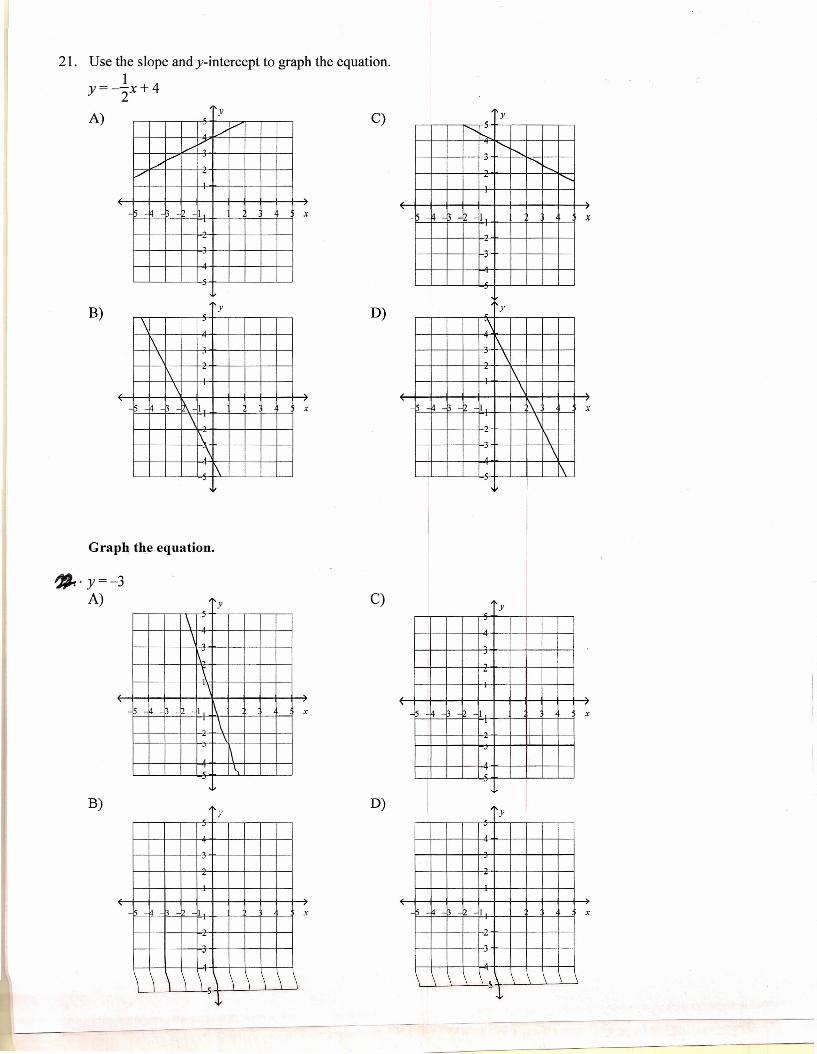
21. Use the slope andy-intercept to graph the equation.1
y= -"2x+ 4
A) y
/" V
VV
/" V
V .
~ B 1 x
B) y
\\\
1\\
t-.l x\
1\"\
\
Graph the equation.
~. y=-3A) y
\\ .
\,
\
~ b 1 '\ x
\I -.
\I \
B)y
I .r
\ I \ 1\\ \ \ \ \ JJ,
C) y<,
"'- ........<,
<,<,· <,
11 I x,
y
\\
, \\\
12 1 l\ x\
-~
\,
I \!\
D)
C) y
·~ 1 x-,
IIII·
,
D)y
,
~ 12 I x
-.
J,
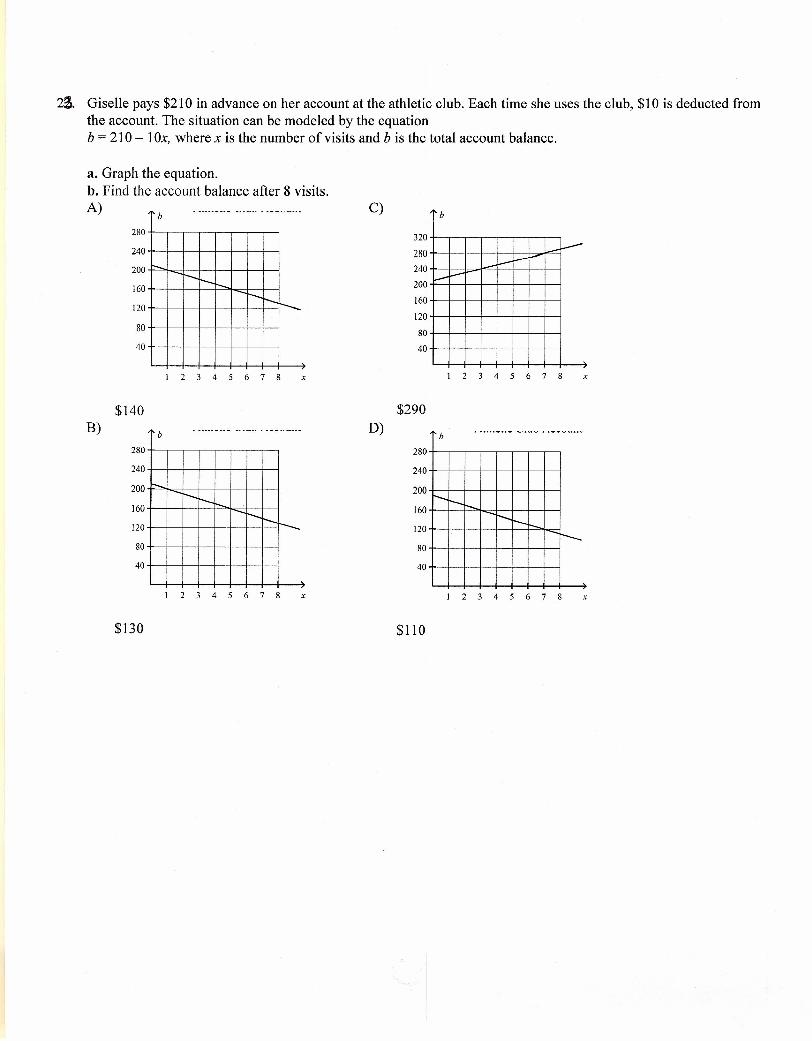
2!. Giselle pays $210 in advance on her account at the athletiF club. Each time she uses the club, $10 is deducted fromthe account. The situation can be modeled by the equationb = 210 - lOx, where x is the number of visits and b is the total account balance.
a. Graph the equation.b. Find the account balance after 8 visits.A) _..__ .__.. .
b
280
240
200 - I---160t-..
I---120 ...••..
80
40
I 2 3 4 5 6 7 8 x
$140B)
b& ~ •• &&&_ •••&- .......& ••••.••••• & ~-- ••••• _&& •••
280
240
200 '- --r-160 -r-120
80
40
I 2 3 4 5 6 7 8 x
$130
C)
320
280240
200
160
120
80
40
b
----I---
!---
12345678 x
D)b
240+--+-+-+-+--+--+--+----1
200 _
160 1'--_I--_t-..
120+--+-+-+-+--+----t-"""t-<;::1 r--...80+--+-+-+-+--+--+--+----1
12345678 x
$110
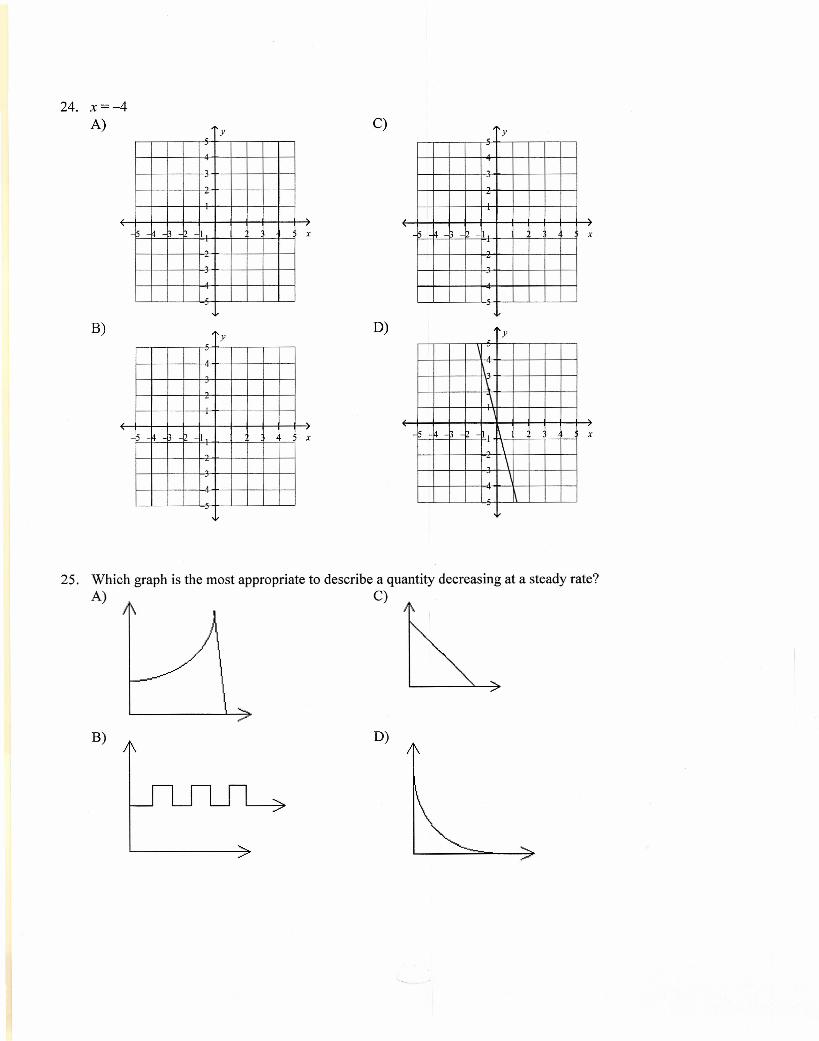
24. x =--4A) y
,
» b I x
B)y
b I x,
C)y
L
b b I X
-L
,
D) y
\~
» i2 I x1\
'\
25. Which graph is the most appropriate to describe a quantity decreasing at a steady rate?A) C)
B) D)