Embed Size (px)
Citation preview

XP POWERANNUAL REPORT & ACCOUNTS
for the year ended 31 December 2017
stock code: XPP
XPPOWER A
NN
UA
L REP
OR
T & AC
CO
UN
TS for the year ended 31 Decem
ber 2017XP POWER LIMITED
401 COMMONWEALTH DRIVEHAW PAR TECHNOCENTRE
LOBBY B #02-02SINGAPORE 149598
T: +65 6411 6900F: +65 6479 6305
Introduction
OUR PURPOSEWe provide our customers in the Healthcare, Industrial and Technology sectors with solutions to power their critical systems and get their products to market in the shortest possible time.
Electronic equipment cannot operate directly from the electricity provided by the mains supply which is a relatively high voltage alternating current. All electronic equipment requires a stable, direct current in order to operate. Our electronic power converters are designed-in to our customers’ end equipment, often with the aid of our engineering expertise, to provide this stable direct current. These power solutions also provide the vital safety barrier between the potentially lethal mains supply and the user of the end equipment.
Our target customers provide vital equipment where the cost of downtime or implications of failure are significant.
We power the world’s critical systems.
OUR VISIONTo be the first choice power solutions provider delivering the ultimate experience for our customers and our people.
OUR CORE VALUESOur core values of INTEGRITY, KNOWLEDGE, FLEXIBILITY, SPEED and CUSTOMER FOCUS are our DNA and are fundamental to our success.
CUSTOMER FOCUS KNOWLEDGE INTEGRITYFLEXIBILITY SPEEDCUSTOMER
FOCUS KNOWLEDGE INTEGRITYFLEXIBILITY SPEEDCUSTOMER FOCUS KNOWLEDGE INTEGRITYFLEXIBILITY SPEEDCUSTOMER FOCUS KNOWLEDGE INTEGRITYFLEXIBILITY SPEEDCUSTOMER
FOCUS KNOWLEDGE INTEGRITYFLEXIBILITY SPEED
Printed on Cocoon Silk 60.
A recycled paper containing 60% recycled waste and 40% virgin fibre and manufactured at a mill certified with ISO 14001 environmental management standard.
The pulp used in this product is bleached using an Elemental Chlorine Free process. (ECF)
OVE
RVI
EW
01XP Power Annual Report & Accounts for the year ended 31 December 2017 stock code: XPP
OVERVIEWIC Introduction
2 Highlights in 2017
3 Our Investment Proposition
4 XP Power at a Glance
6 Chairman’s Statement
STRATEGIC REPORT8 Our Marketplace
10 Our Growth Drivers
12 Our Business Model
14 Our Strategy
16 Our Strategy in Action
18 Our Key Performance Indicators
20 Performance: Operational Review
24 Performance: Financial Review
28 Managing Our Risks
32 Our Commitments to Sustainability
35 Our Core Values in Action
36 Our People and their Health and Safety
38 Our Customers
39 Our Suppliers
40 Our Communities
41 Our Environment
GOVERNANCE REPORT42 Chairman’s Introduction to Governance
44 Directors and Officers
46 Corporate Governance Report
50 Audit Committee Report
54 Remuneration Committee Report
55 Remuneration Policy
60 Remuneration Report – Annual Report
69 Other Governance and Statutory Disclosures
70 Statement by Directors
FINANCIALS71 Independent Auditor’s Report
77 Consolidated Statement of Comprehensive Income
78 Consolidated Balance Sheet
79 Consolidated Statement of Changes in Equity
80 Consolidated Statement of Cash Flows
81 Notes to the Consolidated Financial Statements
118 Company Balance Sheet
119 Notes to the Company Balance Sheet
129 Five Year Review
130 Advisers
CONTENTS
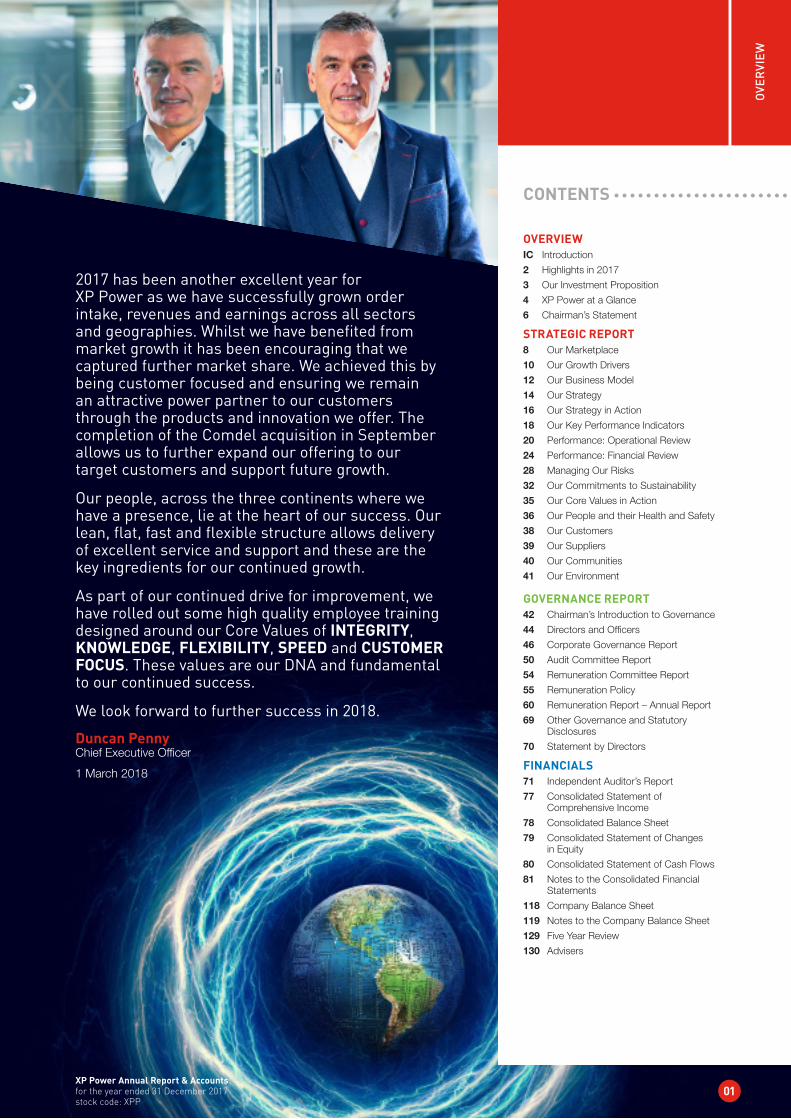
2017 has been another excellent year for XP Power as we have successfully grown order intake, revenues and earnings across all sectors and geographies. Whilst we have benefited from market growth it has been encouraging that we captured further market share. We achieved this by being customer focused and ensuring we remain an attractive power partner to our customers through the products and innovation we offer. The completion of the Comdel acquisition in September allows us to further expand our offering to our target customers and support future growth.
Our people, across the three continents where we have a presence, lie at the heart of our success. Our lean, flat, fast and flexible structure allows delivery of excellent service and support and these are the key ingredients for our continued growth.
As part of our continued drive for improvement, we have rolled out some high quality employee training designed around our Core Values of INTEGRITY, KNOWLEDGE, FLEXIBILITY, SPEED and CUSTOMER FOCUS. These values are our DNA and fundamental to our continued success.
We look forward to further success in 2018.
Duncan PennyChief Executive Officer
1 March 2018
2017
184.3
2016
133.5
2015
110.5
2014
105.1
2013
103.7
2017
148.3
2016
112.0
2015
103.7
2014
102.1
2013
95.8
2017
78
2016
71
2015
66
2014
61
2013
55
2017
166.8
2016
129.8
2015
109.7
2014
101.1
2013
101.1
2017
147.0
2016
115.3
2015
104.3
2014
101.1
2013
95.1
2018
62.0
2017
63.0
2016
62.9
2015
59.2
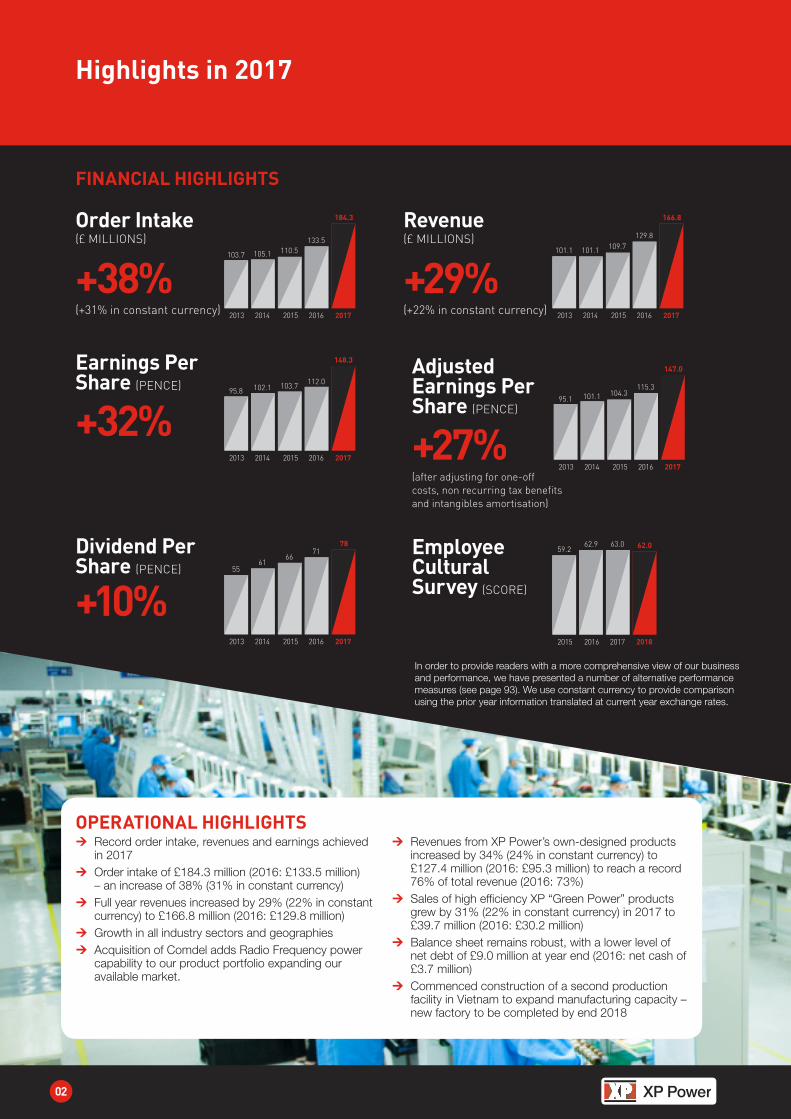
Order Intake(£ MILLIONS)
+38%(+31% in constant currency)
Revenue(£ MILLIONS)
+29%(+22% in constant currency)
Adjusted Earnings Per Share (PENCE)
+27%(after adjusting for one-off costs, non recurring tax benefits and intangibles amortisation)
Dividend Per Share (PENCE)
+10%Employee Cultural Survey (SCORE)
Earnings Per Share (PENCE)
+32%
OPERATIONAL HIGHLIGHTS ¼ Record order intake, revenues and earnings achieved in 2017
¼ Order intake of £184.3 million (2016: £133.5 million) – an increase of 38% (31% in constant currency)
¼ Full year revenues increased by 29% (22% in constant currency) to £166.8 million (2016: £129.8 million)
¼ Growth in all industry sectors and geographies ¼ Acquisition of Comdel adds Radio Frequency power capability to our product portfolio expanding our available market.
¼ Revenues from XP Power’s own-designed products increased by 34% (24% in constant currency) to £127.4 million (2016: £95.3 million) to reach a record 76% of total revenue (2016: 73%)
¼ Sales of high efficiency XP “Green Power” products grew by 31% (22% in constant currency) in 2017 to £39.7 million (2016: £30.2 million)
¼ Balance sheet remains robust, with a lower level of net debt of £9.0 million at year end (2016: net cash of £3.7 million)
¼ Commenced construction of a second production facility in Vietnam to expand manufacturing capacity – new factory to be completed by end 2018
Heading
02
Highlights in 2017
FINANCIAL HIGHLIGHTS
In order to provide readers with a more comprehensive view of our business and performance, we have presented a number of alternative performance measures (see page 93). We use constant currency to provide comparison using the prior year information translated at current year exchange rates.
XP Power Annual Report & Accounts for the year ended 31 December 2017 stock code: XPP
03
OVE
RVI
EW
Our Investment Proposition
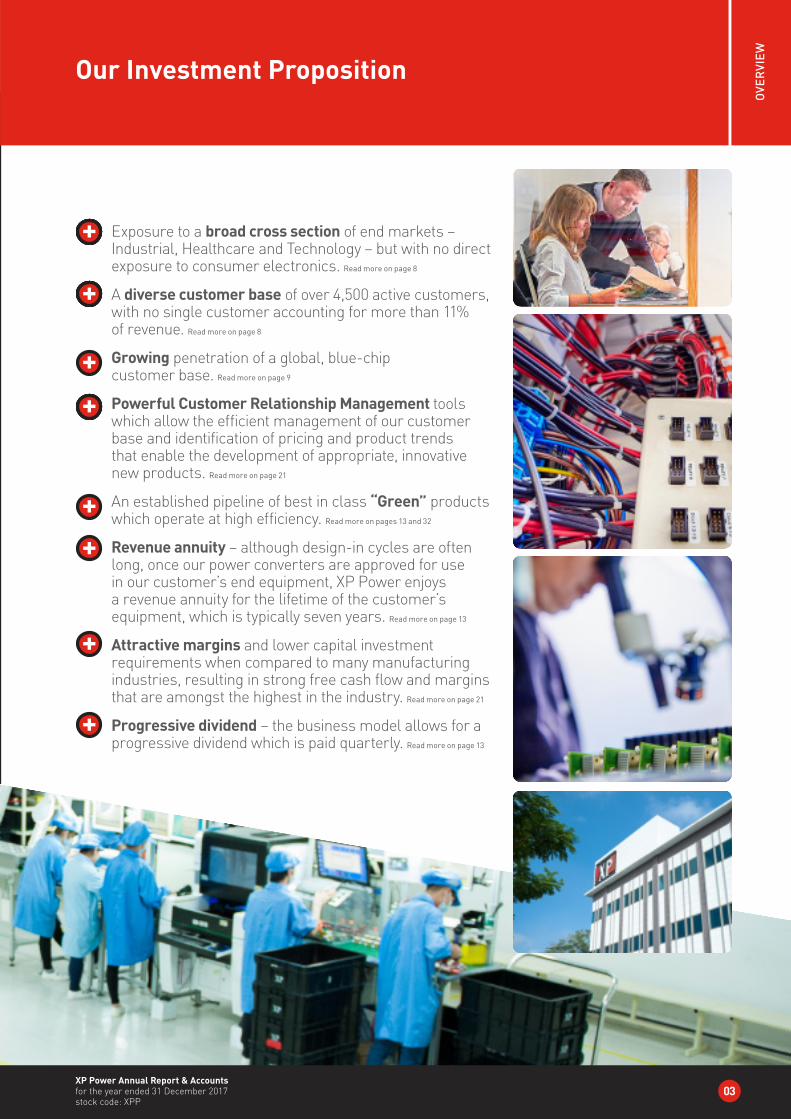
Exposure to a broad cross section of end markets – Industrial, Healthcare and Technology – but with no direct exposure to consumer electronics. Read more on page 8
A diverse customer base of over 4,500 active customers, with no single customer accounting for more than 11% of revenue. Read more on page 8
Growing penetration of a global, blue-chip customer base. Read more on page 9
Powerful Customer Relationship Management tools which allow the efficient management of our customer base and identification of pricing and product trends that enable the development of appropriate, innovative new products. Read more on page 21
An established pipeline of best in class “Green” products which operate at high efficiency. Read more on pages 13 and 32
Revenue annuity – although design-in cycles are often long, once our power converters are approved for use in our customer’s end equipment, XP Power enjoys a revenue annuity for the lifetime of the customer’s equipment, which is typically seven years. Read more on page 13
Attractive margins and lower capital investment requirements when compared to many manufacturing industries, resulting in strong free cash flow and margins that are amongst the highest in the industry. Read more on page 21
Progressive dividend – the business model allows for a progressive dividend which is paid quarterly. Read more on page 13
XP Power’s portfolio of leading edge, ultra-high efficient products are helping the world’s leading manufacturers to create new technologies and products.
Heading
04
XP Power at a Glance
Our power converters live inside the world’s critical systems, taking the electrical mains supply from the grid and converting it into the correct form of electricity to power our customers’ equipment in critical applications in the industrial, healthcare and technology industries.
The design and integration of these essential power conversion devices into the end equipment they power involves many
challenges and trade-offs. The result is a unique set of requirements from the customers who themselves are constantly attempting to differentiate their equipment from their competitors.
Our long-term investment in research and development has positioned XP Power as a key partner for the world’s leading manufacturers of critical capital equipment.
MEETING OUR CUSTOMERS’ REQUIREMENTS WITH OUR POWERFUL OFFERING } Broad, leading-edge product line with ultra-high efficiency
} Class-leading manufacturing ensuring excellent quality, reliability and competitive cost
} Class-leading customer service and support through our highly knowledgeable and experienced sales team and power systems engineers
} Engineering on three continents providing excellent support during design-in to reduce time to market
POWER OF OUR GLOBAL REACHOur global reach and target sectors help insulate us from market volatilityOur customers manufacture capital equipment and we target the healthcare, industrial and technology markets. We do not have any direct exposure to consumer electronics or high volume low margin business seen in the computing and data centre industries. The equipment our products power is often mission-critical so quality and reliability are paramount.
Increasingly, the design and manufacturing process of major international Original Equipment Manufacturers takes place across different continents, with these blue-chip companies demanding global support. In response, XP Power has established an international network of offices which offers the necessary customer support across technical sales, design engineering, logistics and operations.
This network gives XP Power a strong competitive advantage over both its smaller competitors, who do not have the scale and geographic reach to serve global customers, and its larger competitors, who often lack the operational flexibility to provide excellent service and speed. We believe that this balance is key to our success in winning new contracts and offers XP Power the opportunity to further increase its market share.
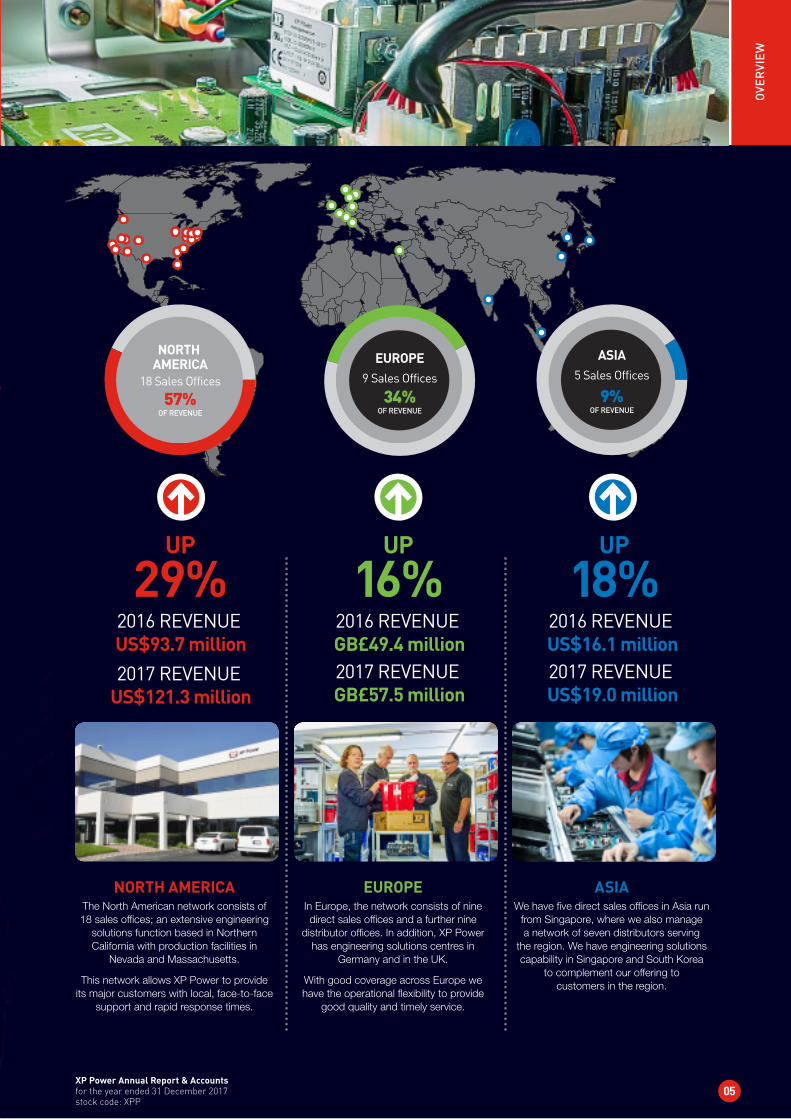
2016 REVENUE US$93.7 million2017 REVENUE
US$121.3 million
UP
29%
EUROPE9 Sales Offices
34%OF REVENUE
NORTH AMERICA
18 Sales Offices
57%OF REVENUE
2016 REVENUE GB£49.4 million2017 REVENUE GB£57.5 million
UP
16%2016 REVENUE US$16.1 million2017 REVENUE US$19.0 million
UP
18%
ASIA5 Sales Offices
9%OF REVENUE
XP Power Annual Report & Accounts for the year ended 31 December 2017 stock code: XPP
05
OVE
RVI
EW
NORTH AMERICAThe North American network consists of 18 sales offices; an extensive engineering
solutions function based in Northern California with production facilities in
Nevada and Massachusetts.
This network allows XP Power to provide its major customers with local, face-to-face
support and rapid response times.
EUROPEIn Europe, the network consists of nine direct sales offices and a further nine
distributor offices. In addition, XP Power has engineering solutions centres in
Germany and in the UK.
With good coverage across Europe we have the operational flexibility to provide
good quality and timely service.
ASIAWe have five direct sales offices in Asia run
from Singapore, where we also manage a network of seven distributors serving
the region. We have engineering solutions capability in Singapore and South Korea
to complement our offering to customers in the region.
For more information please see pages 10 and 11
Heading
06
Chairman’s Statement
Our Progress in 20172017 was another year of significant progress in the development of the Company. We have continued to execute well against our strategy and favourable market conditions, combined with new design wins entering into production, generated another set of strong results. We delivered record order intake, revenues, profits and earnings per share in the year. We also acquired Comdel, another business that significantly expands our addressable market by strengthening our capability in higher power applications. We believe we now have the most comprehensive product offering in our industry, making XP Power a compelling partner to provide power solutions to our target customers to power their critical systems.
ResultsOur financial performance in the year was strong. Revenues were £166.8 million, exceeding the prior year of £129.8 million. This was an increase of 22% in constant currency. Order intake also set a new record of £184.3 million, exceeding the £133.5 million achieved in 2016, and representing a 31% increase in constant currency.
Reported profit before tax was £32.2 million (2016: £27.8 million). After adding back acquisition costs, both completed and aborted, of £3.3 million (2016: £0.4 million) and amortisation of intangible assets of £0.6 million (2016: £0.4 million), adjusted profit before tax was £36.1 million (2016: £28.6 million), an increase of 26% over that reported in 2016. Basic earnings per share increased by 32% to 148.3 pence (2016:112.0 pence). Diluted adjusted earnings per share increased by 27% to 147.0 pence (2016: 115.3 pence).
AcquisitionWe have been clear for some time that we intend to use the strength of our balance sheet and cash generation to acquire complementary businesses that expand our product portfolio and engineering capabilities. I was pleased to report the acquisition of Comdel, a company specialising in Radio Frequency (RF) power, in September 2017. This strategic acquisition fulfils our ambition to add a high power capability to our product portfolio and is an excellent fit with the rest of the XP Power family. We are very excited about the prospects for these products and the additional value we can now provide to our customers.
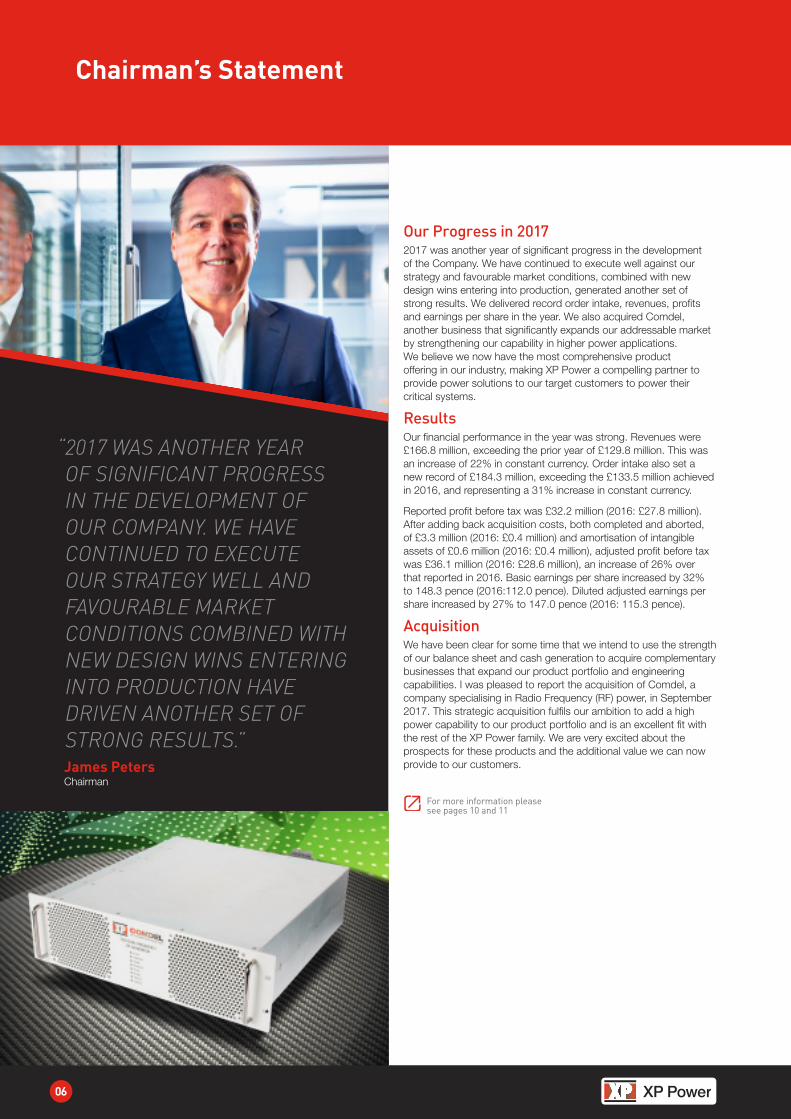
“ 2017 WAS ANOTHER YEAR OF SIGNIFICANT PROGRESS IN THE DEVELOPMENT OF OUR COMPANY. WE HAVE CONTINUED TO EXECUTE OUR STRATEGY WELL AND FAVOURABLE MARKET CONDITIONS COMBINED WITH NEW DESIGN WINS ENTERING INTO PRODUCTION HAVE DRIVEN ANOTHER SET OF STRONG RESULTS.”James Peters Chairman
For more information please see page 23
XP Power Annual Report & Accounts for the year ended 31 December 2017 stock code: XPP
07
OVE
RVI
EW
Board ChangesI would like to welcome Gavin Griggs, who joined us on 31 October 2017, to the Board as Chief Financial Officer. Gavin has worked in a range of acquisitive businesses, both public and private and with an international footprint, most recently Daisy Group Ltd, where he was Group Finance Director. Gavin’s wide-ranging financial, commercial and M&A experience, will be an asset to XP Power in the next phase of our development.
In December 2017 Peter Bucher, a Non-Executive Director, informed the Board that he would retire in December 2018 and step down from the Board.
We will begin a search for a new Non-Executive Director later this year.
For more information please see pages 44 and 45
DividendOur continued strong financial performance, strong cash flows and confidence in the Group’s long-term prospects have enabled us to increase dividends consistently over a sustained period. The Board is recommending a final dividend of 29 pence per share for the fourth quarter of 2017. This dividend will be payable to members on the register on 16 March 2018 and will be paid on 20 April 2018. When combined with the interim dividends for the previous quarters, the total dividend for the year will be 78 pence per share (2016: 71 pence), an increase of 10%.
The compound average growth rate of our dividend has been 15% over the last ten years, demonstrating the Board’s commitment to our progressive dividend policy.
Our People and Our ValuesThe success of an organisation is dependent on the people and talent within it. We have significant strength and depth within our Company, with the majority of our Executives boasting long tenures with XP Power. We have conducted annual employee engagement surveys since 2015 and I am pleased that we have shown strong scores each time we repeat the survey, having taken actions to address any issues arising from the results of the prior survey. One of the main findings from these employee surveys was that our employees are proud to be part of our Company, highlighting the significant engagement we have between the business and our people. Our cultural survey score is one of our non-financial key performance indicators.
As the Company grows we continually look to acquire more talent across the business to build even greater strength and depth. A key focus is engineering, which remains a constraint on our ability to address all the opportunities we see before us. Recruiting and on-boarding more engineering colleagues will be a priority for 2018.
Manufacturing CapacityOur continued growth means we need to add manufacturing capacity. We therefore commenced construction of a second manufacturing facility in Ho Chi Minh City, Vietnam in October 2017 which we expect to complete in the second half of 2018.
OutlookWe are encouraged by the strong performance in 2017 and a good start to 2018. The Group entered 2018 with a strong order backlog and will also benefit from a full year’s trading from the acquired Comdel business which expands our addressable market.
Although we cannot be immune from all external economic shocks resulting from cyclicality in the capital equipment markets we serve, we are optimistic regarding our prospects for 2018.
We are continuing to build a leading position in our industry to realise our vision of becoming the first choice power solutions provider delivering the ultimate experience to our customers and to our people.
James PetersChairman
Heading
08
Our Marketplace
THE MARKETS WE SERVEWe have a broad exposure to the Healthcare, Industrial and Technology markets. Our customers are manufacturers of capital equipment and their end markets all exhibit different degrees of cyclicality. Generally, the Technology markets are most cyclical but it is clear that the long-term growth prospects for technology are robust. Healthcare is our least cyclical sector with Industrial lying between Technology and Healthcare.
We have a diverse customer base of over 4,500 customers that we deal with directly and many more customers serviced through our distribution channels which have been growing strongly in recent years.
The diversity of our business is a significant strength with no single customer exceeding more than 11% of revenue. Further, there is no single dominant player in the markets we address due to the diversity of customer requirements.
We have no direct exposure to consumer products.
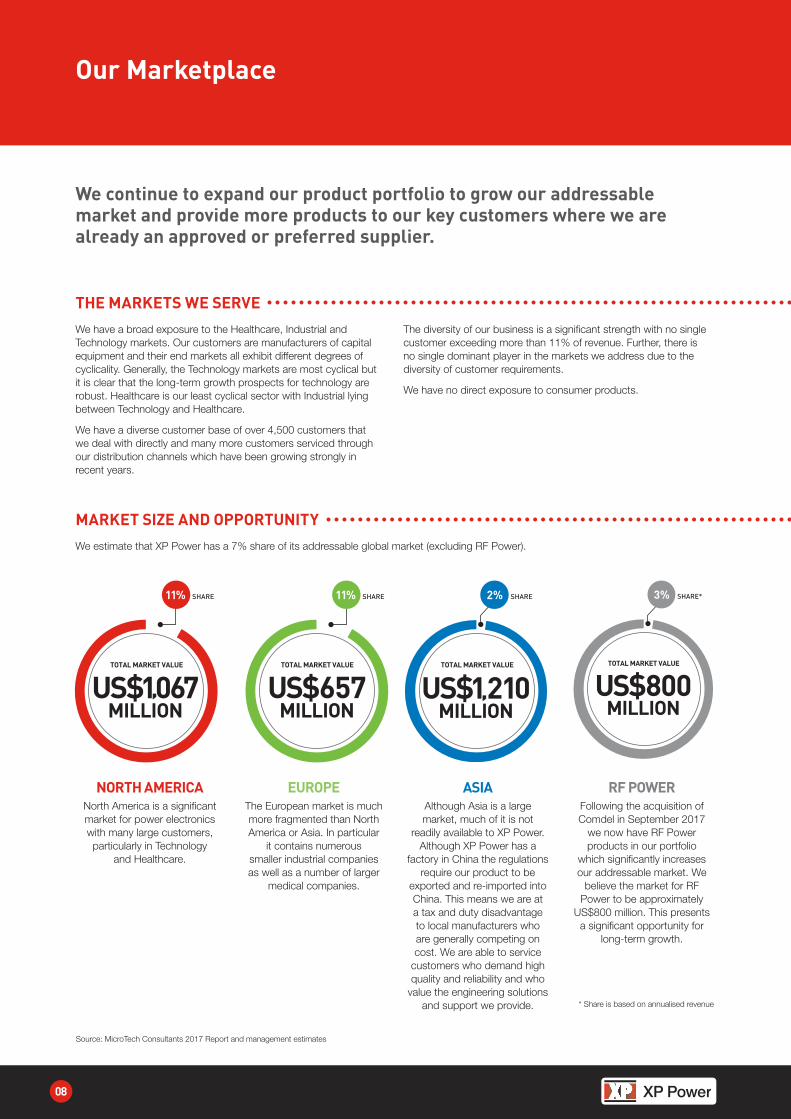
MARKET SIZE AND OPPORTUNITYWe estimate that XP Power has a 7% share of its addressable global market (excluding RF Power).
NORTH AMERICANorth America is a significant market for power electronics with many large customers, particularly in Technology
and Healthcare.
EUROPEThe European market is much more fragmented than North America or Asia. In particular
it contains numerous smaller industrial companies as well as a number of larger
medical companies.
ASIAAlthough Asia is a large market, much of it is not
readily available to XP Power. Although XP Power has a
factory in China the regulations require our product to be
exported and re-imported into China. This means we are at a tax and duty disadvantage to local manufacturers who are generally competing on cost. We are able to service
customers who demand high quality and reliability and who
value the engineering solutions and support we provide.
RF POWERFollowing the acquisition of Comdel in September 2017
we now have RF Power products in our portfolio
which significantly increases our addressable market. We
believe the market for RF Power to be approximately
US$800 million. This presents a significant opportunity for
long-term growth.
We continue to expand our product portfolio to grow our addressable market and provide more products to our key customers where we are already an approved or preferred supplier.
Source: MicroTech Consultants 2017 Report and management estimates
11% SHARE
US$1067MILLION
TOTAL MARKET VALUE
US$657MILLION
TOTAL MARKET VALUE
11% SHARE
TOTAL MARKET VALUE
US$1210MILLION
2% SHARE 3% SHARE*
US$800MILLION
TOTAL MARKET VALUE
* Share is based on annualised revenue
2017
65.6
2016
59.8
2015
48.6
2014
49.1
2013
47.5
Industrial Revenue (£ millions)
2017
121.3
2016
93.7
2015
85.5
2014
84.9
2013
78.4
North America Revenue(US$ millions)
2017
51.0
2016
37.9
2015
34.3
2014
31.0
2013
30.2
Healthcare Revenue (£ millions)
Europe Revenue (£ millions)
2017
57.5
2016
49.4
2015
45.1
2014
42.2
2013
43.7
2017
50.2
2016
32.1
2015
26.8
2014
21.0
2013
23.4
Technology Revenue (£ millions)
Asia Revenue (US$ millions)
2017
19.0
2016
16.1
2015
13.7
2014
12.6
2013
11.5
XP Power Annual Report & Accounts for the year ended 31 December 2017 stock code: XPP
09
STR
ATEG
IC R
EPO
RT
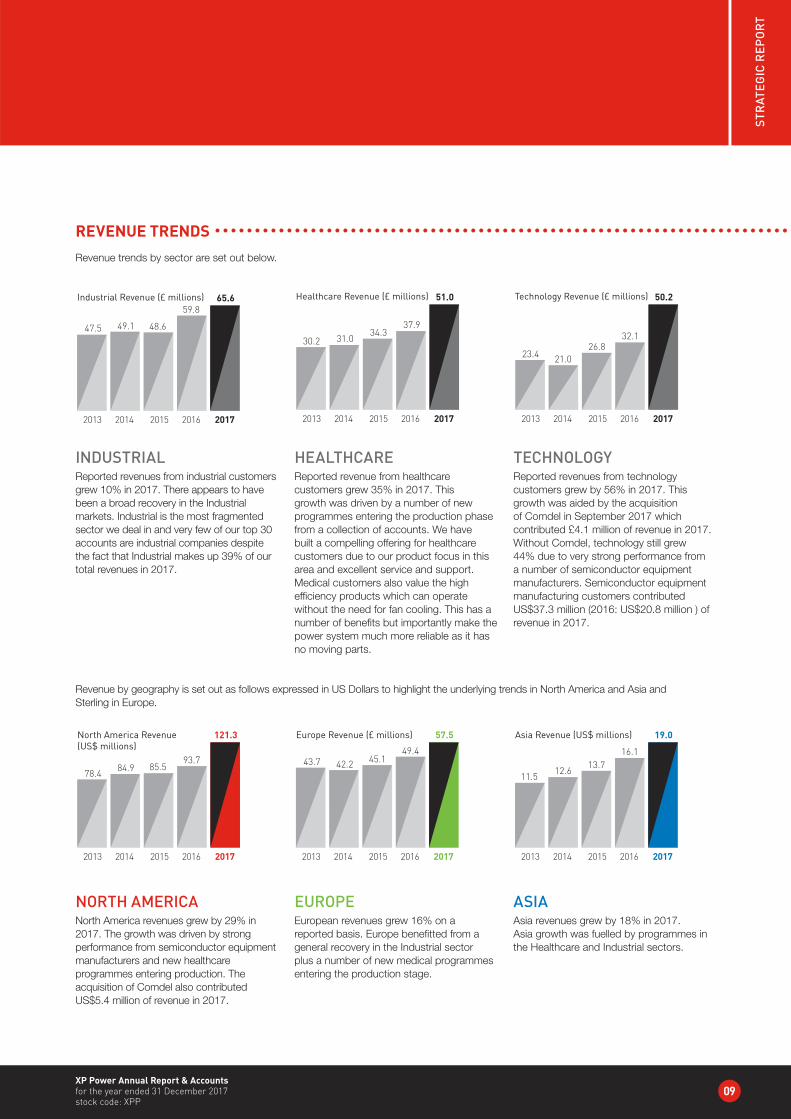
REVENUE TRENDS Revenue trends by sector are set out below.
INDUSTRIALReported revenues from industrial customers grew 10% in 2017. There appears to have been a broad recovery in the Industrial markets. Industrial is the most fragmented sector we deal in and very few of our top 30 accounts are industrial companies despite the fact that Industrial makes up 39% of our total revenues in 2017.
HEALTHCAREReported revenue from healthcare customers grew 35% in 2017. This growth was driven by a number of new programmes entering the production phase from a collection of accounts. We have built a compelling offering for healthcare customers due to our product focus in this area and excellent service and support. Medical customers also value the high efficiency products which can operate without the need for fan cooling. This has a number of benefits but importantly make the power system much more reliable as it has no moving parts.
TECHNOLOGYReported revenues from technology customers grew by 56% in 2017. This growth was aided by the acquisition of Comdel in September 2017 which contributed £4.1 million of revenue in 2017. Without Comdel, technology still grew 44% due to very strong performance from a number of semiconductor equipment manufacturers. Semiconductor equipment manufacturing customers contributed US$37.3 million (2016: US$20.8 million ) of revenue in 2017.
NORTH AMERICANorth America revenues grew by 29% in 2017. The growth was driven by strong performance from semiconductor equipment manufacturers and new healthcare programmes entering production. The acquisition of Comdel also contributed US$5.4 million of revenue in 2017.
EUROPEEuropean revenues grew 16% on a reported basis. Europe benefitted from a general recovery in the Industrial sector plus a number of new medical programmes entering the production stage.
ASIAAsia revenues grew by 18% in 2017. Asia growth was fuelled by programmes in the Healthcare and Industrial sectors.
Revenue by geography is set out as follows expressed in US Dollars to highlight the underlying trends in North America and Asia and Sterling in Europe.
Heading
10
Our Growth Drivers
DRIVER HOW WE’RE RESPONDING
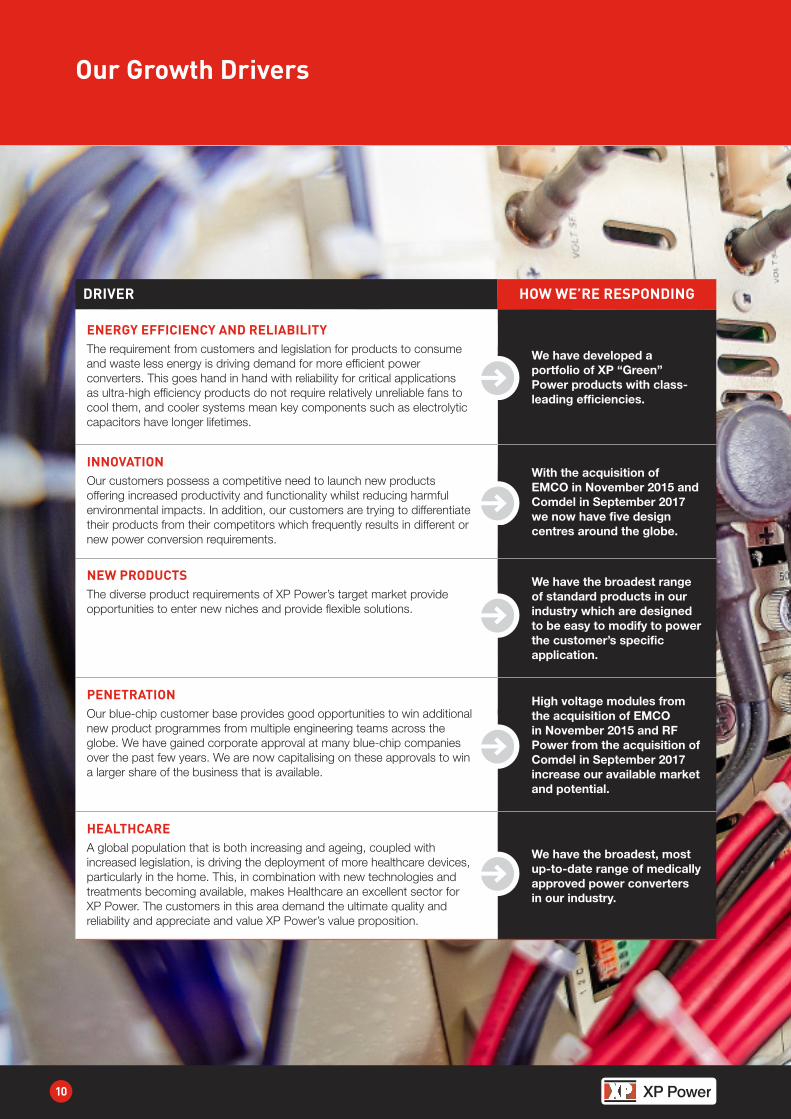
ENERGY EFFICIENCY AND RELIABILITYThe requirement from customers and legislation for products to consume and waste less energy is driving demand for more efficient power converters. This goes hand in hand with reliability for critical applications as ultra-high efficiency products do not require relatively unreliable fans to cool them, and cooler systems mean key components such as electrolytic capacitors have longer lifetimes.
We have developed a portfolio of XP “Green” Power products with class-leading efficiencies.
INNOVATIONOur customers possess a competitive need to launch new products offering increased productivity and functionality whilst reducing harmful environmental impacts. In addition, our customers are trying to differentiate their products from their competitors which frequently results in different or new power conversion requirements.
With the acquisition of EMCO in November 2015 and Comdel in September 2017 we now have five design centres around the globe.
NEW PRODUCTSThe diverse product requirements of XP Power’s target market provide opportunities to enter new niches and provide flexible solutions.
We have the broadest range of standard products in our industry which are designed to be easy to modify to power the customer’s specific application.
PENETRATIONOur blue-chip customer base provides good opportunities to win additional new product programmes from multiple engineering teams across the globe. We have gained corporate approval at many blue-chip companies over the past few years. We are now capitalising on these approvals to win a larger share of the business that is available.
High voltage modules from the acquisition of EMCO in November 2015 and RF Power from the acquisition of Comdel in September 2017 increase our available market and potential.
HEALTHCAREA global population that is both increasing and ageing, coupled with increased legislation, is driving the deployment of more healthcare devices, particularly in the home. This, in combination with new technologies and treatments becoming available, makes Healthcare an excellent sector for XP Power. The customers in this area demand the ultimate quality and reliability and appreciate and value XP Power’s value proposition.
We have the broadest, most up-to-date range of medically approved power converters in our industry.
XP Power Annual Report & Accounts for the year ended 31 December 2017 stock code: XPP
11
STR
ATEG
IC R
EPO
RT
DRIVER HOW WE’RE RESPONDING
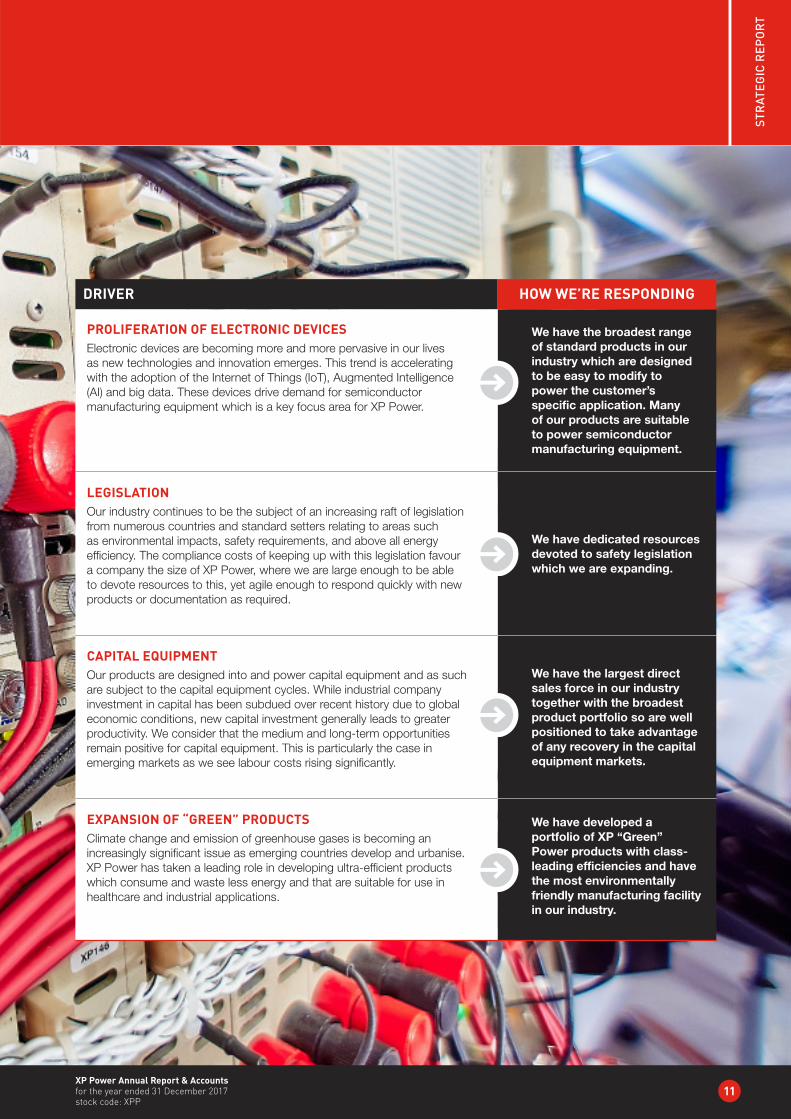
PROLIFERATION OF ELECTRONIC DEVICESElectronic devices are becoming more and more pervasive in our lives as new technologies and innovation emerges. This trend is accelerating with the adoption of the Internet of Things (IoT), Augmented Intelligence (AI) and big data. These devices drive demand for semiconductor manufacturing equipment which is a key focus area for XP Power.
We have the broadest range of standard products in our industry which are designed to be easy to modify to power the customer’s specific application. Many of our products are suitable to power semiconductor manufacturing equipment.
LEGISLATIONOur industry continues to be the subject of an increasing raft of legislation from numerous countries and standard setters relating to areas such as environmental impacts, safety requirements, and above all energy efficiency. The compliance costs of keeping up with this legislation favour a company the size of XP Power, where we are large enough to be able to devote resources to this, yet agile enough to respond quickly with new products or documentation as required.
We have dedicated resources devoted to safety legislation which we are expanding.
CAPITAL EQUIPMENTOur products are designed into and power capital equipment and as such are subject to the capital equipment cycles. While industrial company investment in capital has been subdued over recent history due to global economic conditions, new capital investment generally leads to greater productivity. We consider that the medium and long-term opportunities remain positive for capital equipment. This is particularly the case in emerging markets as we see labour costs rising significantly.
We have the largest direct sales force in our industry together with the broadest product portfolio so are well positioned to take advantage of any recovery in the capital equipment markets.
EXPANSION OF “GREEN” PRODUCTSClimate change and emission of greenhouse gases is becoming an increasingly significant issue as emerging countries develop and urbanise. XP Power has taken a leading role in developing ultra-efficient products which consume and waste less energy and that are suitable for use in healthcare and industrial applications.
We have developed a portfolio of XP “Green” Power products with class-leading efficiencies and have the most environmentally friendly manufacturing facility in our industry.
Heading
12
Our Business Model
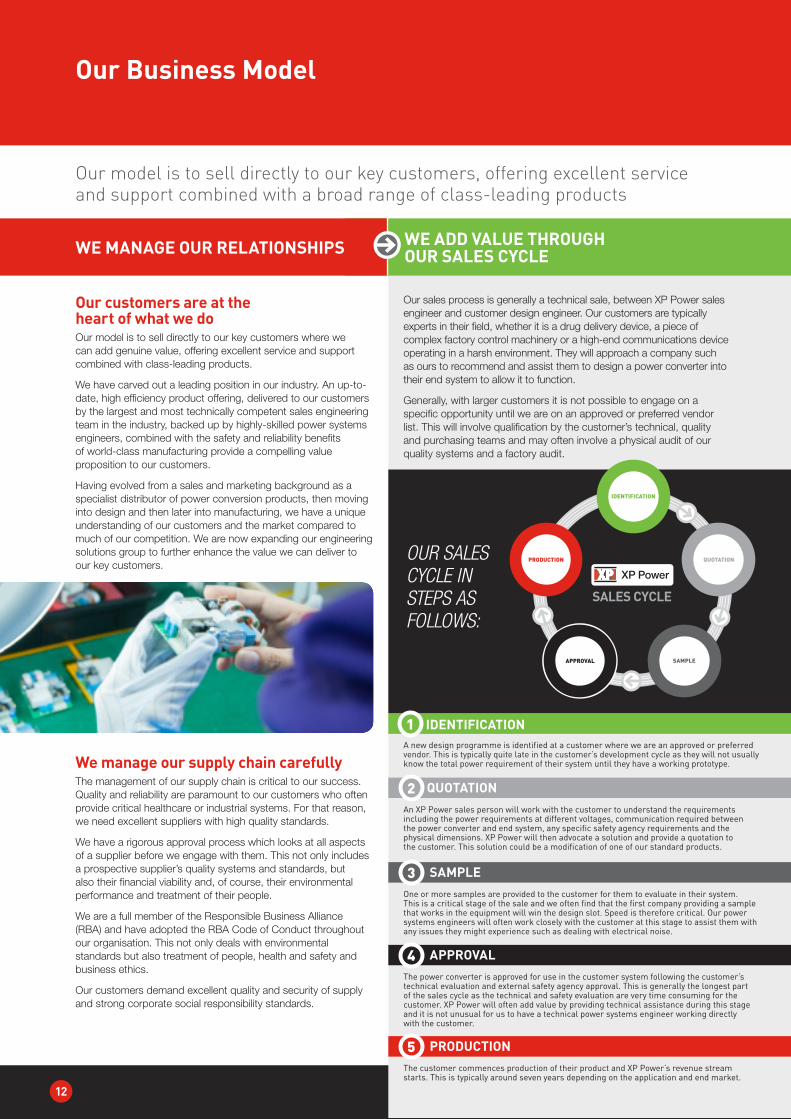
Our model is to sell directly to our key customers, offering excellent service and support combined with a broad range of class-leading products
WE ADD VALUE THROUGH OUR SALES CYCLE
OUR SALES CYCLE IN STEPS AS FOLLOWS:
Our customers are at the heart of what we doOur model is to sell directly to our key customers where we can add genuine value, offering excellent service and support combined with class-leading products.
We have carved out a leading position in our industry. An up-to-date, high efficiency product offering, delivered to our customers by the largest and most technically competent sales engineering team in the industry, backed up by highly-skilled power systems engineers, combined with the safety and reliability benefits of world-class manufacturing provide a compelling value proposition to our customers.
Having evolved from a sales and marketing background as a specialist distributor of power conversion products, then moving into design and then later into manufacturing, we have a unique understanding of our customers and the market compared to much of our competition. We are now expanding our engineering solutions group to further enhance the value we can deliver to our key customers.
We manage our supply chain carefullyThe management of our supply chain is critical to our success. Quality and reliability are paramount to our customers who often provide critical healthcare or industrial systems. For that reason, we need excellent suppliers with high quality standards.
We have a rigorous approval process which looks at all aspects of a supplier before we engage with them. This not only includes a prospective supplier’s quality systems and standards, but also their financial viability and, of course, their environmental performance and treatment of their people.
We are a full member of the Responsible Business Alliance (RBA) and have adopted the RBA Code of Conduct throughout our organisation. This not only deals with environmental standards but also treatment of people, health and safety and business ethics.
Our customers demand excellent quality and security of supply and strong corporate social responsibility standards.
Our sales process is generally a technical sale, between XP Power sales engineer and customer design engineer. Our customers are typically experts in their field, whether it is a drug delivery device, a piece of complex factory control machinery or a high-end communications device operating in a harsh environment. They will approach a company such as ours to recommend and assist them to design a power converter into their end system to allow it to function.
Generally, with larger customers it is not possible to engage on a specific opportunity until we are on an approved or preferred vendor list. This will involve qualification by the customer’s technical, quality and purchasing teams and may often involve a physical audit of our quality systems and a factory audit.
WE MANAGE OUR RELATIONSHIPS
1
2
IDENTIFICATION
QUOTATION
A new design programme is identified at a customer where we are an approved or preferred vendor. This is typically quite late in the customer’s development cycle as they will not usually know the total power requirement of their system until they have a working prototype.
An XP Power sales person will work with the customer to understand the requirements including the power requirements at different voltages, communication required between the power converter and end system, any specific safety agency requirements and the physical dimensions. XP Power will then advocate a solution and provide a quotation to the customer. This solution could be a modification of one of our standard products.
3
4
SAMPLE
APPROVAL
One or more samples are provided to the customer for them to evaluate in their system. This is a critical stage of the sale and we often find that the first company providing a sample that works in the equipment will win the design slot. Speed is therefore critical. Our power systems engineers will often work closely with the customer at this stage to assist them with any issues they might experience such as dealing with electrical noise.
The power converter is approved for use in the customer system following the customer’s technical evaluation and external safety agency approval. This is generally the longest part of the sales cycle as the technical and safety evaluation are very time consuming for the customer. XP Power will often add value by providing technical assistance during this stage and it is not unusual for us to have a technical power systems engineer working directly with the customer.
5 PRODUCTIONThe customer commences production of their product and XP Power’s revenue stream starts. This is typically around seven years depending on the application and end market.
IDENTIFICATION
QUOTATION
SAMPLEAPPROVAL
PRODUCTION
SALES CYCLE
XP Power Annual Report & Accounts for the year ended 31 December 2017 stock code: XPP
13
STR
ATEG
IC R
EPO
RT
WE GENERATE LONG-TERM REVENUE ANNUITIES AND SHAREHOLDER VALUE
WE DIFFERENTIATE OURSELVES THROUGH...
We have successfully transitioned the business from a specialist distributor, to designer, to design manufacturer ascending the value chain to grow our revenues and margins
Our peopleAs in any business the most important asset is our people. We have a large and highly technically trained sales force. Our customers deal directly with a sales engineer that can solve their power conversion problems. We do not put our key customers through distribution channels. We also provide global support.
Our Executive Leadership Team, located on three different continents, is not only talented but given a relatively young average age has an impressive average length of service. The breadth and depth of experience and collective teamwork of our people deliver genuine value to our customers.
Our productsWe have the broadest, most up-to-date product offering in the industry with over 250 product families in our portfolio. Our products are specific to the requirements of the various industries and applications we target. Our philosophy is to provide highly flexible products which are easy to modify. This saves our customers the cost, time and risk of pursuing a fully customised solution. Our product portfolio has been enhanced with high voltage modules following the acquisition of EMCO in November 2015 and Radio Frequency power from Comdel in September 2017.
Our design engineeringWe have design engineering teams on three continents – this allows us to release a high number of innovative new products required by this highly diversified market. These products often have class-leading energy efficiency and small footprints to meet the ever-higher demands of our key customers. Additional engineering service teams in Germany, North America, Singapore and the UK are able to provide value added services close to our key customers. We are able to provide modified product solutions which allow the customer to more easily integrate the power converter into their equipment, therefore delivering a cost saving.
Our green innovationEnvironmental considerations are becoming increasingly important to our customers. There is strong demand for products that consume less material, including harmful chemicals, and power converters that consume less energy. Our product portfolio reflects this with many products having class-leading efficiencies and low stand-by power consumption.
Our manufacturingOur Asian manufacturing bases in China and Vietnam are not only low cost but best-in-class. This capability is instrumental to winning new programmes with larger blue-chip customers that require the ultimate in quality and reliability. We also offer highly competitive lead times and flexible logistics arrangements.
Our qualityOur stringent quality standards ensure the ultimate in quality and reliability. This is vital to our customers. This starts from the design phase right through to production and after sales support.
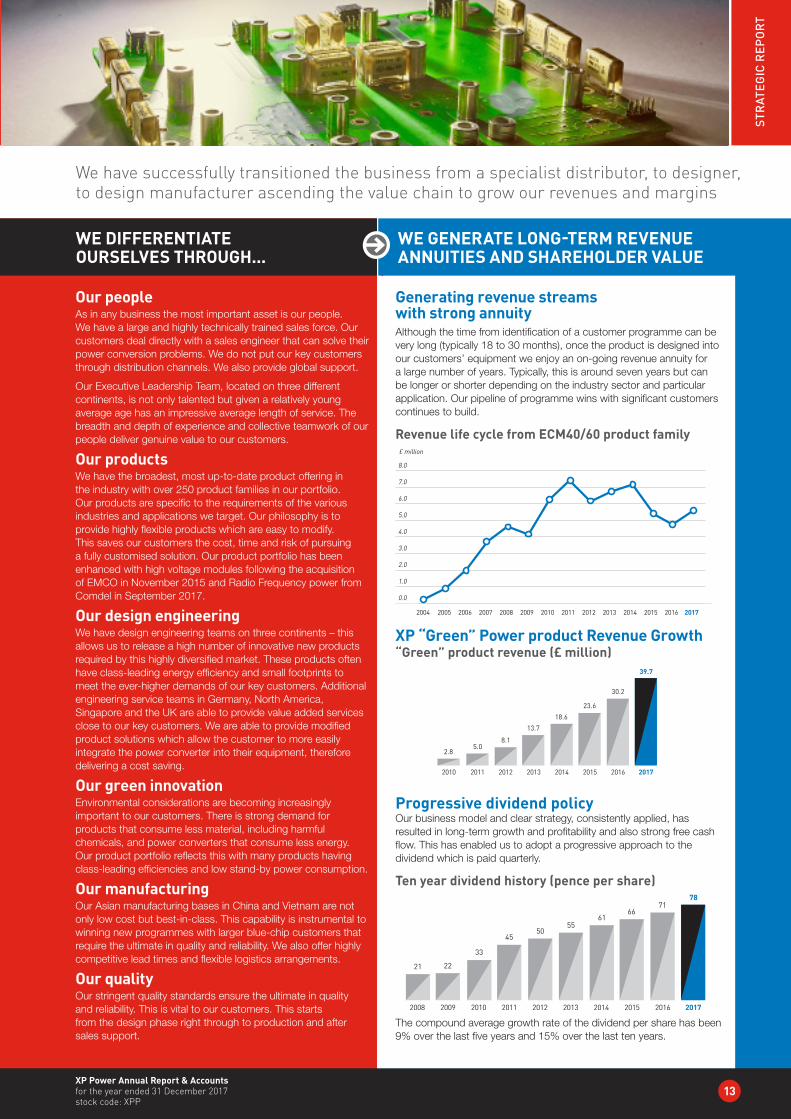
Generating revenue streams with strong annuityAlthough the time from identification of a customer programme can be very long (typically 18 to 30 months), once the product is designed into our customers’ equipment we enjoy an on-going revenue annuity for a large number of years. Typically, this is around seven years but can be longer or shorter depending on the industry sector and particular application. Our pipeline of programme wins with significant customers continues to build.
Revenue life cycle from ECM40/60 product family
2010 2011 2012 2013 2014 2015 2016 2017
0.0
1.0
2.0
3.0
4.0
5.0
6.0
7.0
8.0
200920082007200620052004
£ million
XP “Green” Power product Revenue Growth“Green” product revenue (£ million)
2011 2012 2013 2014 2015 2016
23.6
30.2
39.7
18.6
13.7
8.15.0
20172010
2.8
Progressive dividend policyOur business model and clear strategy, consistently applied, has resulted in long-term growth and profitability and also strong free cash flow. This has enabled us to adopt a progressive approach to the dividend which is paid quarterly.
Ten year dividend history (pence per share)
2011 2012 2013 2014 2015 2016
6671
78
6155
5045
33
2010
22
2009
21
2008 2017
The compound average growth rate of the dividend per share has been 9% over the last five years and 15% over the last ten years.
Heading
14
Our Strategy
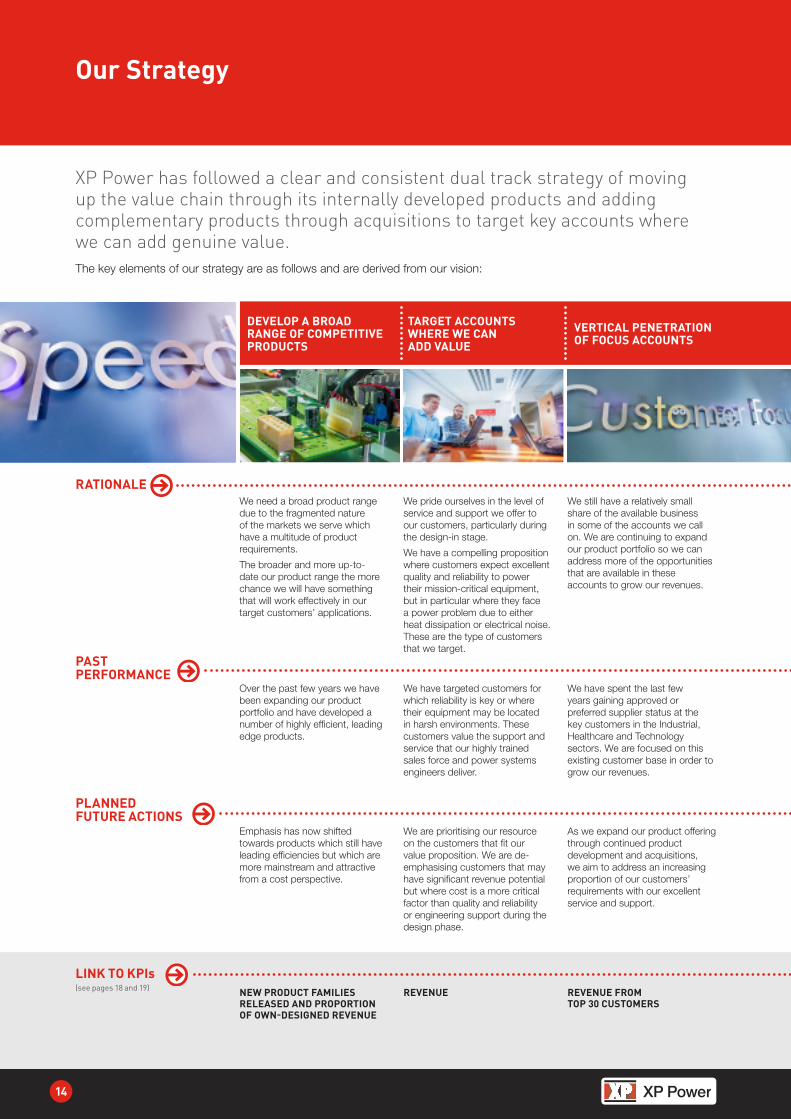
XP Power has followed a clear and consistent dual track strategy of moving up the value chain through its internally developed products and adding complementary products through acquisitions to target key accounts where we can add genuine value. The key elements of our strategy are as follows and are derived from our vision:
We need a broad product range due to the fragmented nature of the markets we serve which have a multitude of product requirements.
The broader and more up-to-date our product range the more chance we will have something that will work effectively in our target customers’ applications.
We pride ourselves in the level of service and support we offer to our customers, particularly during the design-in stage.
We have a compelling proposition where customers expect excellent quality and reliability to power their mission-critical equipment, but in particular where they face a power problem due to either heat dissipation or electrical noise. These are the type of customers that we target.
We still have a relatively small share of the available business in some of the accounts we call on. We are continuing to expand our product portfolio so we can address more of the opportunities that are available in these accounts to grow our revenues.
RATIONALE
PAST PERFORMANCE
PLANNED FUTURE ACTIONS
LINK TO KPIs(see pages 18 and 19)
Over the past few years we have been expanding our product portfolio and have developed a number of highly efficient, leading edge products.
We have targeted customers for which reliability is key or where their equipment may be located in harsh environments. These customers value the support and service that our highly trained sales force and power systems engineers deliver.
We have spent the last few years gaining approved or preferred supplier status at the key customers in the Industrial, Healthcare and Technology sectors. We are focused on this existing customer base in order to grow our revenues.
Emphasis has now shifted towards products which still have leading efficiencies but which are more mainstream and attractive from a cost perspective.
We are prioritising our resource on the customers that fit our value proposition. We are de-emphasising customers that may have significant revenue potential but where cost is a more critical factor than quality and reliability or engineering support during the design phase.
As we expand our product offering through continued product development and acquisitions, we aim to address an increasing proportion of our customers’ requirements with our excellent service and support.
NEW PRODUCT FAMILIES RELEASED AND PROPORTION OF OWN-DESIGNED REVENUE
REVENUE REVENUE FROM TOP 30 CUSTOMERS
DEVELOP A BROAD RANGE OF COMPETITIVE PRODUCTS
TARGET ACCOUNTS WHERE WE CAN ADD VALUE
VERTICAL PENETRATION OF FOCUS ACCOUNTS

XP Power Annual Report & Accounts for the year ended 31 December 2017 stock code: XPP
15
STR
ATEG
IC R
EPO
RT
In what is a highly fragmented industry, we are still a relatively new player. We have the advantage of a broad and up-to-date product portfolio and excellent service and support. Awareness of our brand in the market is key if we are to achieve our vision of being the first choice power solutions provider in the market.
It is challenging to grow in industrial markets which have intrinsically low growth rates. To do this we need an excellent product range and we need to deliver the ultimate experience in service and support for our customers. We need operational excellence in order to deliver this and to transform incremental revenues into strong profit and cash flow streams.
Strong corporate social responsibility is not only important to our key customers but also to our employees and the communities in which we operate. This incorporates not only environmental performance but also health and safety, treatment of our people and business ethics.
Our strong balance sheet and cash generative business model allow us the capacity to pursue business acquisitions. This is another avenue to expand our product offering and therefore addressable market.
Our increasing presence within the online distribution networks and our recent acquisitions have continued to enhance the XP brand.
We recognise the value of our people, the lifeblood of the Company, as the main asset that can drive operational excellence.
Over the past two years we have introduced improved training and development opportunities and better communication and collaboration.
We have been a full member of the Responsible Business Alliance (RBA). The RBA Code of Conduct to which we comply addresses all of these important ethical and environmental matters which we strongly endorse.
Through acquisitions in the past 30 months, we have added both high voltage products and RF (Radio Frequency) power to our product range.
We are able to further enhance our brand awareness through further expansion of distribution channels and use of our digital marketing tools.
We aim to provide more training courses to employees to nurture talent, encourage leadership, and discuss career progression. We are also looking to improve processes for managing performance of our people.
We will remain a committed member of the RBA.
We strive to lead our industry on environmental matters and have a committee dedicated to raising awareness of “green” initiatives, however small.
We continue to look for acquisitions to expand our product offering and other capabilities.
REVENUE CULTURAL SURVEY SCORE LIFETIME CO2 EMISSION SAVINGS FROM “GREEN” PRODUCTS
NEW PRODUCT FAMILIES RELEASED
OUR VISION
THE FIRST CHOICE POWER SOLUTIONS PROVIDER DELIVERING THE ULTIMATE EXPERIENCE FOR OUR PEOPLE AND CUSTOMERS
ENHANCE BRAND AWARENESS
ACHIEVE OPERATIONAL EXCELLENCE
LEAD OUR INDUSTRY ON ENVIRONMENTAL MATTERS
ACQUIRE BUSINESSES TO EXPAND OUR OFFERING
16
COMDEL ACQUISITION
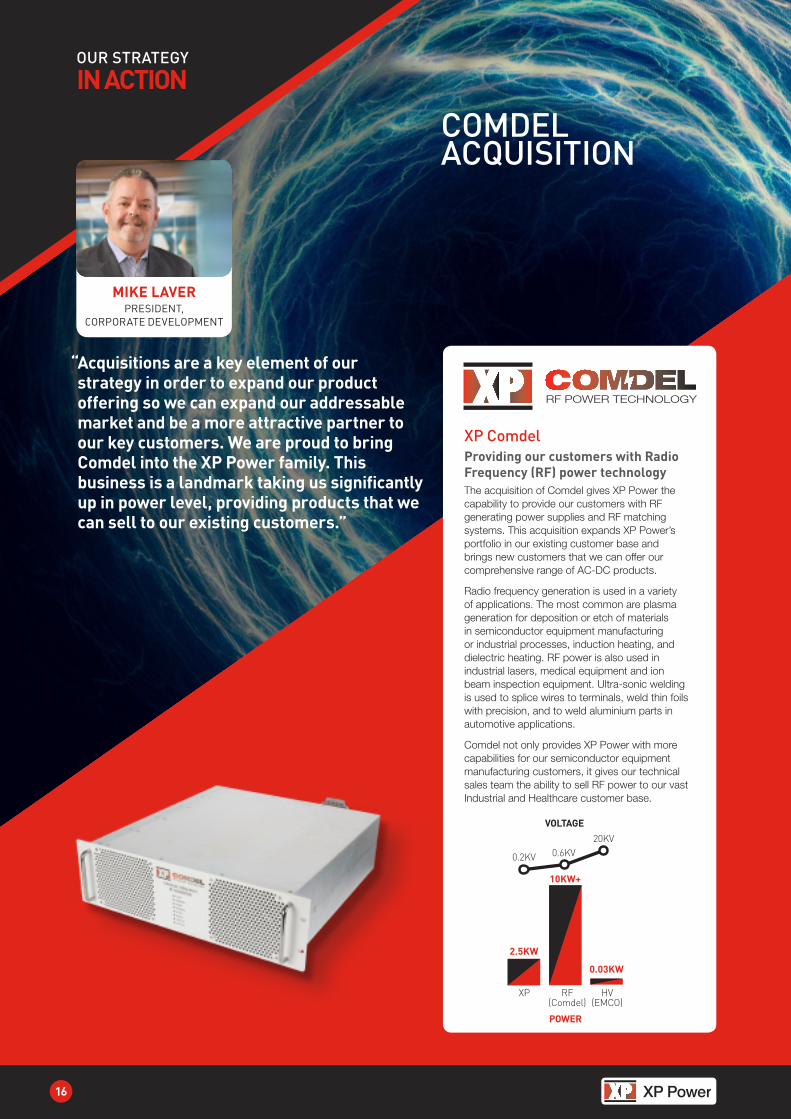
“ Acquisitions are a key element of our strategy in order to expand our product offering so we can expand our addressable market and be a more attractive partner to our key customers. We are proud to bring Comdel into the XP Power family. This business is a landmark taking us significantly up in power level, providing products that we can sell to our existing customers.”
OUR STRATEGY
IN ACTION
MIKE LAVERPRESIDENT,
CORPORATE DEVELOPMENT
XP Comdel Providing our customers with Radio Frequency (RF) power technologyThe acquisition of Comdel gives XP Power the capability to provide our customers with RF generating power supplies and RF matching systems. This acquisition expands XP Power’s portfolio in our existing customer base and brings new customers that we can offer our comprehensive range of AC-DC products.
Radio frequency generation is used in a variety of applications. The most common are plasma generation for deposition or etch of materials in semiconductor equipment manufacturing or industrial processes, induction heating, and dielectric heating. RF power is also used in industrial lasers, medical equipment and ion beam inspection equipment. Ultra-sonic welding is used to splice wires to terminals, weld thin foils with precision, and to weld aluminium parts in automotive applications.
Comdel not only provides XP Power with more capabilities for our semiconductor equipment manufacturing customers, it gives our technical sales team the ability to sell RF power to our vast Industrial and Healthcare customer base.
HV(EMCO)
RF(Comdel)
XP
2.5KW
10KW+
0.03KW
VOLTAGE
POWER
0.2KV 0.6KV20KV
XP Power Annual Report & Accounts for the year ended 31 December 2017 stock code: XPP
17
STR
ATEG
IC R
EPO
RT
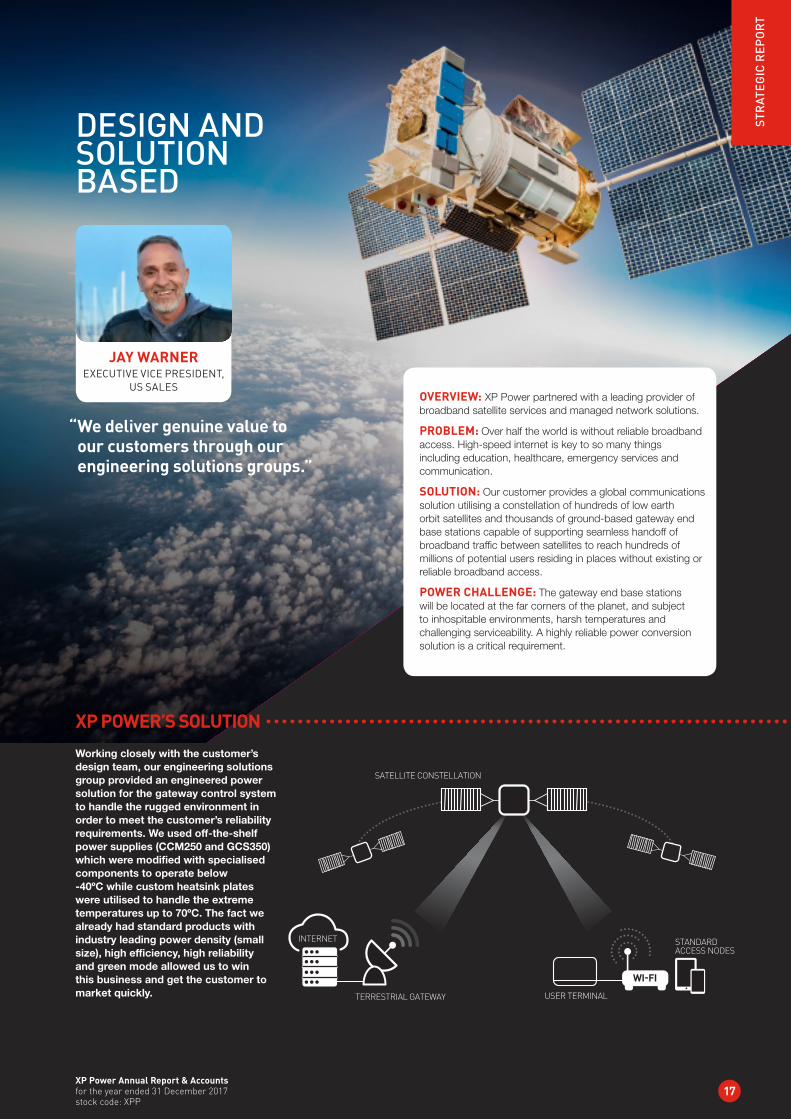
“ We deliver genuine value to our customers through our engineering solutions groups.”
STR
ATEG
IC R
EPO
RT
DESIGN AND SOLUTION BASED
Working closely with the customer’s design team, our engineering solutions group provided an engineered power solution for the gateway control system to handle the rugged environment in order to meet the customer’s reliability requirements. We used off-the-shelf power supplies (CCM250 and GCS350) which were modified with specialised components to operate below -40ºC while custom heatsink plates were utilised to handle the extreme temperatures up to 70ºC. The fact we already had standard products with industry leading power density (small size), high efficiency, high reliability and green mode allowed us to win this business and get the customer to market quickly.
OVERVIEW: XP Power partnered with a leading provider of broadband satellite services and managed network solutions.
PROBLEM: Over half the world is without reliable broadband access. High-speed internet is key to so many things including education, healthcare, emergency services and communication.
SOLUTION: Our customer provides a global communications solution utilising a constellation of hundreds of low earth orbit satellites and thousands of ground-based gateway end base stations capable of supporting seamless handoff of broadband traffic between satellites to reach hundreds of millions of potential users residing in places without existing or reliable broadband access.
POWER CHALLENGE: The gateway end base stations will be located at the far corners of the planet, and subject to inhospitable environments, harsh temperatures and challenging serviceability. A highly reliable power conversion solution is a critical requirement.
XP POWER’S SOLUTION
WI-FI
STANDARD ACCESS NODES
USER TERMINAL
SATELLITE CONSTELLATION
INTERNET
TERRESTRIAL GATEWAY
JAY WARNEREXECUTIVE VICE PRESIDENT,
US SALES
Heading
18
Our Key Performance Indicators
¼ Target 30 new product releases in 2018 with continued emphasis on higher power products.
¼ Consider further suitable bolt-on acquisitions to expand the offering.
¼ Provide increasing support to our customers through our engineering solutions group.
¼ Provide existing customers with our expanding product offering.
¼ Continue to grow our share of customers’ business where we are preferred or approved suppliers.
¼ Expansion of our product portfolio to increase our addressable market in our existing customer base.
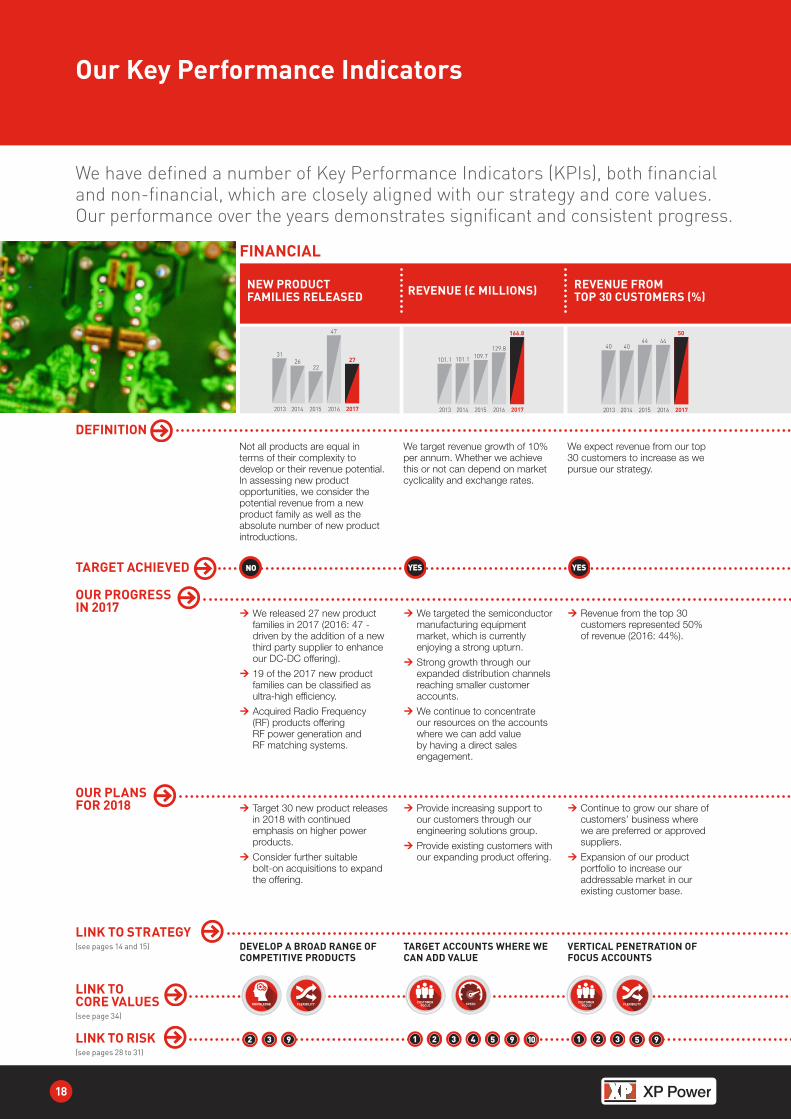
We have defined a number of Key Performance Indicators (KPIs), both financial and non-financial, which are closely aligned with our strategy and core values. Our performance over the years demonstrates significant and consistent progress.
2017
27
2016
47
2015
22
2014
26
2013
31
2017
166.8
2016
129.8
2015
109.7
2014
101.1
2013
101.1
2017
50
2016
44
2015
44
2014
40
2013
40
NEW PRODUCT FAMILIES RELEASED REVENUE (£ MILLIONS) REVENUE FROM
TOP 30 CUSTOMERS (%)
FINANCIAL
Not all products are equal in terms of their complexity to develop or their revenue potential. In assessing new product opportunities, we consider the potential revenue from a new product family as well as the absolute number of new product introductions.
We target revenue growth of 10% per annum. Whether we achieve this or not can depend on market cyclicality and exchange rates.
We expect revenue from our top 30 customers to increase as we pursue our strategy.
¼ We released 27 new product families in 2017 (2016: 47 - driven by the addition of a new third party supplier to enhance our DC-DC offering).
¼ 19 of the 2017 new product families can be classified as ultra-high efficiency.
¼ Acquired Radio Frequency (RF) products offering RF power generation and RF matching systems.
¼ We targeted the semiconductor manufacturing equipment market, which is currently enjoying a strong upturn.
¼ Strong growth through our expanded distribution channels reaching smaller customer accounts.
¼ We continue to concentrate our resources on the accounts where we can add value by having a direct sales engagement.
¼ Revenue from the top 30 customers represented 50% of revenue (2016: 44%).
DEVELOP A BROAD RANGE OF COMPETITIVE PRODUCTS
TARGET ACCOUNTS WHERE WE CAN ADD VALUE
VERTICAL PENETRATION OF FOCUS ACCOUNTS
DEFINITION
OUR PROGRESS IN 2017
LINK TO STRATEGY(see pages 14 and 15)
LINK TO CORE VALUES(see page 34)
LINK TO RISK(see pages 28 to 31)
TARGET ACHIEVED NO YES YES
OUR PLANS FOR 2018
CUSTOMER FOCUS KNOWLEDGE INTEGRITYFLEXIBILITY SPEEDCUSTOMER FOCUS KNOWLEDGE INTEGRITYFLEXIBILITY SPEED CUSTOMER
FOCUS KNOWLEDGE INTEGRITYFLEXIBILITY SPEED CUSTOMER FOCUS KNOWLEDGE INTEGRITYFLEXIBILITY SPEEDCUSTOMER
FOCUS KNOWLEDGE INTEGRITYFLEXIBILITY SPEED CUSTOMER FOCUS KNOWLEDGE INTEGRITYFLEXIBILITY SPEED
2 93 1 13 34 55 99 102 2
XP Power Annual Report & Accounts for the year ended 31 December 2017 stock code: XPP
19
STR
ATEG
IC R
EPO
RT
2017
76
2016
73
2015
68
2014
66
2013
64
2017
147.0
2016
115.3
2015
104.3
2014
101.1
2013
95.1
2018
62.0
2017
63.0
2016
62.9
2015
59.2
2017
291,000
2016
158,000
2015
133,000
2014
102,200
2013
84,000
PROPORTION OF OWN-DESIGNED REVENUE (%)
EARNINGS PER SHARE (PENCE) CULTURAL
SURVEY SCORE(index out of 100)
LIFETIME CO2 EMISSION SAVINGS FROM “GREEN” PRODUCTS (TONNES)after adjusting for one-off costs,
non-recurring tax benefits and intangibles amortisation
NON-FINANCIAL
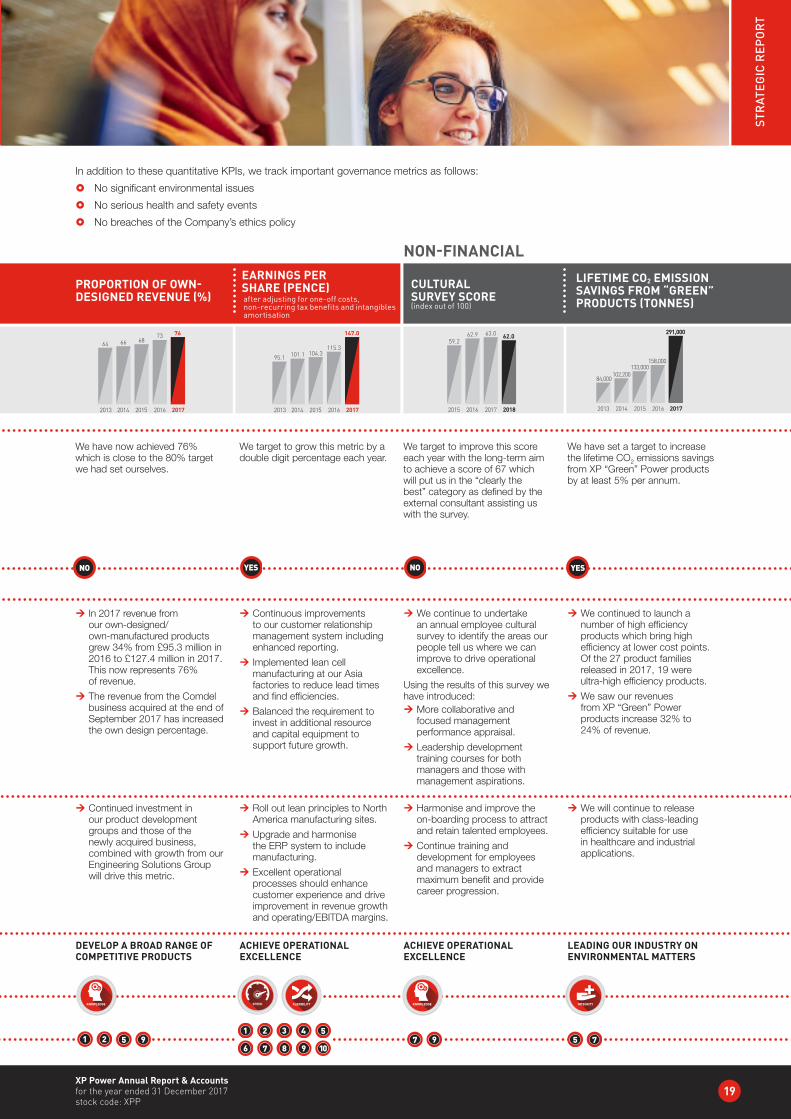
We have now achieved 76% which is close to the 80% target we had set ourselves.
We target to grow this metric by a double digit percentage each year.
We target to improve this score each year with the long-term aim to achieve a score of 67 which will put us in the “clearly the best” category as defined by the external consultant assisting us with the survey.
We have set a target to increase the lifetime CO2 emissions savings from XP “Green” Power products by at least 5% per annum.
¼ In 2017 revenue from our own-designed/ own-manufactured products grew 34% from £95.3 million in 2016 to £127.4 million in 2017. This now represents 76% of revenue.
¼ The revenue from the Comdel business acquired at the end of September 2017 has increased the own design percentage.
¼ Continuous improvements to our customer relationship management system including enhanced reporting.
¼ Implemented lean cell manufacturing at our Asia factories to reduce lead times and find efficiencies.
¼ Balanced the requirement to invest in additional resource and capital equipment to support future growth.
¼ We continue to undertake an annual employee cultural survey to identify the areas our people tell us where we can improve to drive operational excellence.
Using the results of this survey we have introduced:
¼ More collaborative and focused management performance appraisal.
¼ Leadership development training courses for both managers and those with management aspirations.
¼ We continued to launch a number of high efficiency products which bring high efficiency at lower cost points. Of the 27 product families released in 2017, 19 were ultra-high efficiency products.
¼ We saw our revenues from XP “Green” Power products increase 32% to 24% of revenue.
DEVELOP A BROAD RANGE OF COMPETITIVE PRODUCTS
ACHIEVE OPERATIONAL EXCELLENCE
ACHIEVE OPERATIONAL EXCELLENCE
LEADING OUR INDUSTRY ON ENVIRONMENTAL MATTERS
NO YES NO YES
¼ Continued investment in our product development groups and those of the newly acquired business, combined with growth from our Engineering Solutions Group will drive this metric.
¼ Roll out lean principles to North America manufacturing sites.
¼ Upgrade and harmonise the ERP system to include manufacturing.
¼ Excellent operational processes should enhance customer experience and drive improvement in revenue growth and operating/EBITDA margins.
¼ Harmonise and improve the on-boarding process to attract and retain talented employees.
¼ Continue training and development for employees and managers to extract maximum benefit and provide career progression.
¼ We will continue to release products with class-leading efficiency suitable for use in healthcare and industrial applications.
In addition to these quantitative KPIs, we track important governance metrics as follows:
} No significant environmental issues
} No serious health and safety events
} No breaches of the Company’s ethics policy
CUSTOMER FOCUS KNOWLEDGE INTEGRITYFLEXIBILITY SPEED CUSTOMER
FOCUS KNOWLEDGE INTEGRITYFLEXIBILITY SPEEDCUSTOMER FOCUS KNOWLEDGE INTEGRITYFLEXIBILITY SPEEDCUSTOMER
FOCUS KNOWLEDGE INTEGRITYFLEXIBILITY SPEEDCUSTOMER FOCUS KNOWLEDGE INTEGRITYFLEXIBILITY SPEED
1 5 921 3 4 5
6 7 8 9 10
27 59 7

Heading
20
PERFORMANCE
Operational Review
Review of Our YearXP Power has enjoyed another excellent year, achieving record order intake, revenues, profits and earnings per share. Improvement in our underlying markets started to take hold from the third quarter of 2016 and continued throughout 2017. Layered on top of this recovery were new design wins entering production, particularly in the healthcare sector, and a strong upturn in the semiconductor manufacturing equipment market. These factors combined to produce an excellent set of results. We continued to move our product portfolio up to higher power and technically more complex applications and to expand the number of design wins with higher engineering solutions content.
We announced the acquisition of Comdel in September 2017. This business gives XP Power a foothold in the Radio Frequency (RF) power market and meets our strategic aim of moving up the power scale to expand our addressable market and provide a broader product offering to our key customers.
We made strong progress toward expanding our manufacturing capacity in Vietnam when we commenced construction of an additional facility on our existing Ho Chi Minh City site during the year. We expect this new facility to come on stream in the second half of 2018. The expected capacity increase from this new facility will be phased over a number of years but has the potential to double our existing Vietnamese manufacturing capabilities in the longer term.
We continue to be excited by the future prospects for our business.
MarketplaceAll industry sectors and all geographies experienced revenue growth in 2017 over 2016 and, significantly, sequential growth in the second half of 2017 over the first half. The order performance was also strong, with order intake up 38% on the prior year (2016: 21%) and 31% ahead in constant currency (2016: 9%) which resulted in a book to bill ratio of 1.11 (2016: 1.03), demonstrating the strength of the 2017 performance. We enter 2018 with good momentum and a healthy order book.
During 2017 we specifically targeted the semiconductor manufacturing equipment market. This market is traditionally cyclical and is currently enjoying a strong upturn which has benefitted the Group. Despite its historic cyclicality this market remains highly attractive due to its robust fundamentals, which are being driven by the proliferation of applications involving the internet of things (IoT), augmented intelligence (AI), autonomous vehicles and big data.
North America revenues were US$121.3 million in 2017 (2016: US$93.7 million), an increase of 29%. The acquisition of Comdel at the end of September 2017 contributed US$5.4 million (2016: nil) to North American revenues. As well as a general recovery in the capital equipment markets, our North American business benefited from a very strong performance in the semiconductor manufacturing equipment sector which contributed US$37.3 million to revenues (2016: US$20.8 million). Order intake in North America was also very strong at US$139.2 million (2016: US$98.6 million), an increase of 41%. The acquisition of Comdel contributed US$7.7 million (2016: nil) to North American order intake in 2017. The strong book to bill ratio of 1.15 for North America bodes well for 2018.
“ WE CONTINUE TO BE EXCITED AND CONFIDENT REGARDING THE FUTURE PROSPECTS FOR OUR BUSINESS.”Duncan PennyChief Executive
XP Power Annual Report & Accounts for the year ended 31 December 2017 stock code: XPP
21
STR
ATEG
IC R
EPO
RT
Our European business grew by 16% to £57.5 million (2016: £49.4 million) which is the third successive year of growth. The industrial, healthcare and technology sectors all saw growth in Europe but healthcare showed the highest growth rate at 27%, as a number of significant new programmes at blue-chip customers entered production.
Asia revenues grew 18% in 2017 to US$19.0 million (2016: US$16.1 million). Healthcare displayed particularly good growth in 2017 in the Asia region.
Overall, North America represented 57% of revenue (2016: 53%), Asia represented 9% of revenue (2016: 9%) and Europe represented 34% of revenue (2016: 38%). The average exchange rate for the US Dollar compared to Sterling was 1.28 in 2017 versus 1.38 in 2016, representing a 7% weakening of Sterling following the Brexit vote in June 2016. This caused North America and Asia revenues to be inflated, due to translation, but similarly all of our US Dollar denominated product costs to also be inflated when translated to Sterling. We discuss the potential impact of the Brexit vote and foreign exchange volatility in more detail in our Financial Review.
Every sector grew in absolute terms but technology grew most strongly due to the strength of semiconductor manufacturing equipment sector demand, and also healthcare due to a number of new programme wins entering production. Industrial represented 39% of revenue (2016: 46%), healthcare represented 31% of revenue (2016: 29%) and technology represented 30% of revenue (2016: 25%). All our products are designed into capital equipment so our revenues will inevitably be affected by capital equipment cycles. This is particularly so in the semiconductor manufacturing equipment sector which made up 17% of our revenues in 2017 (2016: 12%), although this industry has more recently put forward the argument that the sector will be much less cyclical in the future due to the prevalence of semiconductor devices in our modern world.
However, our exposure to a large number of end markets helps mitigate the cyclicality in any particular sector, producing an underlying resilience in our diversified business model.
Adapting to the Market and the CompetitionSince listing on the London Stock Market in 2000, XP Power has evolved from a specialist distributor of power conversion products to a designer and then manufacturer of power solutions for the industrial, healthcare and technology markets.
We continue to perform well against our traditional established competition. Our broad range of standard products, now augmented by recent acquisitions, and excellent customer service delivered by the largest direct sales force in our industry is a compelling proposition. We expect future competitors to emerge from Asia as companies with low cost manufacturing and engineering attempt to enter parts of the industrial and healthcare markets in Europe and North America. We need to continually adapt our product offering and services to respond to this threat.
Low cost Asian competitors continue to become more prevalent, particularly in the low power/low complexity end of the market. It is straightforward to source low cost/low power products directly from Asian manufacturers. Engineering solutions are not so easily managed remotely and work most effectively when situated close to the customer so design discussions and design reviews can take place face-to-face. We continue to add more and more value to our customers as we expand our engineering service groups across the globe.
As well as providing a higher content of engineering solutions we have moved our product portfolio up in terms of power level and complexity to help protect our business from low cost Asian competition, which remains a significant threat. Specifically, we have expanded the capability within our product portfolio with the acquisition of Comdel which gives us Radio Frequency (RF) power at high power levels.
We are building a broad and compelling product offering which will make us an increasingly attractive partner to leading companies in the industrial, healthcare and technology sectors in order to power their mission-critical applications.
Strategic ProgressWe have followed a consistent strategy which has enabled us to produce strong results over a sustained period of time. The fundamental essence of the strategy – targeting key accounts where we can add value and gaining more of the available business in those accounts – continues to remain appropriate and effective.
Our strategy can be summarised as follows:
} Develop a broad range of competitive products;
} Target accounts where we can add value;
} Increase vertical penetration of target accounts;
} Enhance brand awareness;
} Accelerate operational excellence;
} Lead our industry on environmental matters; and
} Make selective acquisitions in identified strategic markets or of complementary businesses to expand our product offering.
We continue to make significant progress against each of these strategic objectives. We believe we have the broadest, most up-to-date portfolio of products, many of which are class-leading in terms of efficiency and low stand-by power. Our portfolio of XP “Green” Power products grew by 31% in 2017 to £39.7 million (2016: £30.2 million) demonstrating how well these products have been adopted by our customers. We also continue to see revenues from our own-designed/manufactured products grow at a faster rate than those from other products.
Heading
22
PERFORMANCE
Operational Review
We consider that our transition from a specialist distribution company, through the addition of a design capability, to designer and manufacturer is now complete. We are now clearly recognised as both a designer and manufacturer by key customers in our target markets. Revenues from our own-designed products set a new record of £127.4 million in the year (2016: £95.3 million), representing 76% of revenue (2016: 73%). We expect further improvement in the mix of own-designed products in 2018. We are now moving our business further up the value chain by providing our key customers with higher levels of engineering solutions where we add value, enabling the customer to more easily integrate the power solution into their critical systems. These services range from providing simple voltage and connector changes, through to changes in mechanical format, the addition of thermal management, communication to the customer’s end equipment utilising firmware and ultimately full custom designs. This is a much more engineering intense activity but does mean we work very closely with the customer’s design engineers to provide them with a complete power solution in the shortest possible time, delivering genuine value.
Acquisition of Comdel – Radio Frequency (RF) Power On 29 September 2017 XP Power acquired the assets and business of Comdel, a company based in Massachusetts, USA, specialising in Radio Frequency (RF) power generation products which it supplies to the industrial and technology sectors. Total consideration of US$25.2 million (£18.8 million) was paid in cash on completion.
Radio frequency power is used in a variety of applications. The most common are plasma generation for deposition or etching of materials in semiconductor manufacturing equipment or industrial processes, ultra-sonic welding, induction heating, and dielectric heating. RF power is also used in industrial lasers, medical equipment and ion beam inspection equipment. Ultra-sonic welding is used to splice wires to terminals, weld thin foils with precision, and to weld aluminium parts in automotive applications.
Comdel and XP Power share several customers, and while there is no direct overlap in product lines, the power supply solutions of the two companies are highly complementary. Comdel’s products and
engineering capabilities will enhance the Group’s ability to implement its strategy of winning a greater share of business from its target customers by achieving wider vertical penetration of these accounts. As well as a product offering suitable for an array of applications used by some of XP Power’s existing customer base, Comdel also brings a number of new customers to the Group.
The acquisition will enable XP Power to provide its existing customers with a comprehensive product offering in RF power generation and RF matching systems, a market segment with robust demand fundamentals but one in which we did not previously operate.
XP-Comdel has already experienced excellent growth in orders since the acquisition, benefiting from the favourable conditions in the semiconductor manufacturing equipment sector.
We are delighted to welcome Comdel to the XP Power Group and are excited about the opportunity of offering their complementary product ranges through our global sales channel.
The combination of XP Power’s existing low voltage power offering with the high voltage/low power DC-DC converters acquired through the acquisition of EMCO in November 2015 and now the RF power from Comdel substantially expands XP Power’s addressable market and makes us a compelling power solutions provider for many customers involved in industrial, healthcare and semiconductor manufacturing equipment.
Engineering Solutions As well as expanding our product offering we have continued to expand our engineering solutions groups in Asia, Europe and North America. Our customers frequently require a high degree of customisation to allow the power conversion system to operate within their end equipment or simply to make it easier for the customer to integrate the power conversion solution into their application. Our engineering solutions groups work closely with the customer’s engineering teams to provide these customised solutions.
XP Power Annual Report & Accounts for the year ended 31 December 2017 stock code: XPP
23
STR
ATEG
IC R
EPO
RT
Speed and proximity to the customer are critical as the power solution is often one of the last parts of the system to be designed so is invariably one of the gating items to get the end product to market. This is an area where XP Power add significant value to the customer and we are seeing increasing demand for these services. The addition of high voltage and now RF power allows our engineering solutions groups to leverage off additional standard products as building blocks to expand our addressable market.
We will expand these resources in 2018 to address the opportunities we continue to identify.
Research and DevelopmentWe have continued to invest in research and development to further expand our portfolio of products and the size of our addressable market opportunity. In particular, we increased our design engineering resource and capabilities during 2017. We released 27 new product families in 2017 (2016: 47) and 19 (2016: 33) of these can be classified as ultra-high efficiency.
The high level of new product introductions in 2016 was driven by the addition of a new third-party supplier to enhance our DC-DC product offering.
Manufacturing – Vietnam IIIn 2012, we expanded our manufacturing footprint outside China when we started manufacturing magnetic windings in a new Vietnamese facility situated close to Ho Chi Minh City. This added much needed capacity and also enhanced our cost competitiveness as production costs primarily labour in Vietnam are significantly lower than those of our existing Chinese facility.
Production volumes of magnetics windings at our Vietnam facility have continued to climb and in 2017 we produced 6.7 million windings compared to 4.9 million in 2016. We have been actively transferring the lower power/lower complexity products from China to Vietnam to improve our cost position and free up capacity in China. In 2017, we manufactured 1.0 million power supplies in our Vietnam facility compared to 0.4 million in 2016.
We continue to make process improvements in our manufacturing facilities, where we are applying more lean process principles. Our internal yields continue to improve and we have redesigned some of our processes to reduce product lead times to provide improved customer service and reduced freight costs.
In October 2017, we commenced construction of a second manufacturing facility on our existing site in Vietnam. Our Vietnamese site currently houses a 2,100m2 administration building and a three- storey 9,260m2 manufacturing facility. The new Vietnamese facility will be a four-storey building with 11,000m2 of floor area. We have spent US$0.3 million in 2017 and anticipate a further spend of US$5.0 million in 2018 to complete the project. Our longer-term planning indicates we will need this additional manufacturing capacity in the first half of 2019.
Our key operational challenge in 2017 has been keeping pace with the growth in the business. Our lean manufacturing initiatives have helped in that regard but we still have opportunities to improve our supply chain and planning processes to reduce our lead times and make our supply chain more agile.
Outlook for 2018We enter 2018 with a strong order book and good momentum in our business and a strong position in our marketplace. We also have the benefit of a full 12 months contribution from the acquisition of Comdel, providing us with RF Power capability. While we cannot be immune from any economic shocks or cyclicality in our end markets, and in particularly the semiconductor manufacturing equipment sector which represented 17% of our business in 2017, we are optimistic regarding the outlook for 2018.
We remain excited and confident regarding the long-term prospects for our Group.
Duncan PennyChief Executive Officer
Heading
24
XP Power delivered a strong performance in 2017. The significant order and revenue growth coupled with effective control of operating expenditure, has delivered strong year-on-year growth in profits. We have also made further investment in capital projects in order to build the capabilities necessary to support our future sales growth. The business exited the year with a robust financial position.
Revenue and Order IntakeThe Group generated revenue growth of 29% during the year on a reported basis (22% in constant currency and 19% on an organic constant currency basis). The Group’s performance was driven by revenue growth from XP Power’s own-designed products, a key indicator of XP Power’s strategy in action, which grew 34% (or approximately 24% in constant currency) to £127.4 million (2016: £95.3 million) representing 76% of revenue (2016: 73%).
Regionally, North America grew strongly, up 38% (29% in constant currency and 24% on an organic constant currency basis), supported by good revenue growth performances in Europe of 16% (12% in constant currency) where the Nordic markets and Italy were standout performers, up 21% and 26% respectively, and Asia, up 26% (18% constant currency), with a notable performance in South Korea, which was up 50%.
This performance was driven strong order performance of £184.3 million, an increase of 38% over 2016 on a reported basis, or 31% in constant currency.
Orders and revenue for 2017 represent a full year book to bill ratio of 1.11 (2016: 1.03) reflecting the strength of customer demand across the year.
Gross ProfitabilityGross margin declined slightly to 46.5% (2016: 47.8%), largely due to product mix and the effect of the depreciation of Sterling versus the US Dollar. Proportionately more of our product costs are denominated in US Dollars compared to our revenues. As Sterling weakens, our reported revenue increases due to the translation benefit but so does our cost of sales, although at a greater rate. The result is higher gross margin in absolute terms but the gross margin percentage declines. The average exchange rate for converting US Dollars into Sterling in 2017 was 1.28 (2016: 1.38). Operating margins declined from 21.6% in 2016 to 19.5%. This was largely due to weakness of Sterling.
Operating ExpensesThe Group increased its investment in operating resources by 29.9% to £44.8 million, with the total operating costs to revenue ratio increasing by 0.3% to 26.9% (2016: 26.6%). Payroll and staff costs increased by 20.3% and were 17.1% of revenue as a result of cost leveraging. Headcount has increased 29.7% (2017: 1,953; 2016: 1,506). Non-cash share-based payment charges amounted to £0.1 million (2016: nil) and related to a grant to senior management under the Long-Term Incentive Scheme during the year. Other operating costs up 60.3% and represented 7.0% of revenue. Depreciation and amortisation increased by 28.6% and was 2.7% of revenue, a consequence of the strong sales growth versus prior year together with a significant element of capital expenditure being in relation to projects which go live in the next financial year.
PERFORMANCE
Financial Review
“ 2017 FINANCIAL RESULTS HAVE DEMONSTRATED THAT OUR STRATEGY IS WORKING AND WE HAVE ENDED THE YEAR IN A STRONG FINANCIAL POSITION.”Gavin Griggs
Chief Financial Officer
XP Power Annual Report & Accounts for the year ended 31 December 2017 stock code: XPP
25
STR
ATEG
IC R
EPO
RT
Exceptional ItemsExceptional items are excluded from management’s assessment of profit because by their size or nature they could distort the Group’s underlying earnings. In 2017, the Group incurred £3.3 million of exceptional costs, predominantly related to costs associated with acquisitions, both completed and aborted, and £0.6 million for intangible assets amortisation.
Income statementThe Group generated continuing profit before tax and exceptional items of £36.1 million, up 26.2% compared to last year, lower than revenue growth due to a gross margin dilution of 130bps and an increase of 299bps investment in operating costs.
When reviewing XP Power’s performance, the Board and management team particularly focus on adjusted results rather than statutory results. There are a number of items that are included in statutory results but which are considered to be one-off in nature or not representative of the Group’s performance and which are excluded from adjusted results. The tables on pages 94 and 95 show the full list of adjustments between statutory operating profit and adjusted operating profit by business, as well as between statutory profit before tax and adjusted profit before tax at Group level for both 2017 and 2016.
For the current financial year, adjusted EBITDA was up 26.4% to £41.7 million and adjusted operating profit was 26.4% ahead at £36.4 million. Both metrics demonstrate the strength of performance that the Group delivered in 2017.
TaxationThe effective tax rate from continuing operations before exceptional items decreased by 1,220bps to 10.1% (2016: 22.3%). This arose mainly from the recently enacted Tax Cuts and Jobs Act in the United States, and prior year refunds predominantly in Singapore. The Tax Cuts and Jobs Act has resulted in a non-cash tax credit in 2017 relating to the revaluation of US deferred tax balances of circa £1.3 million, based on the net deferred tax liability at the end of 2017. This credit is as a result of the reduction in the federal tax rate from 35% to 21% and will be excluded from adjusted earnings.
The effective tax rate from continuing operations after exceptional items decreased by 1,150bps to 11.2% (2016: 22.7%). Going forward, XP Power expects the effective tax rate to be approximately 15-17% depending predominantly on the regional mix of profits.
Earnings Per ShareBasic and diluted earnings per share from continuing operations before exceptional items increased by 32% and 31% to 148.3 pence and 146.0 pence respectively (2016: 112.0 pence and 111.2 pence). This was driven by the increase in continuing profit before tax during the year.
After adding back costs associated with acquisitions of £3.3 million (2016: £0.4 million), £3.7 million non-recurring tax benefits (2016: nil) and intangible assets amortisation of £0.6 million (2016: £0.4 million), adjusted diluted earnings per share was 147.0 pence (2016: 115.3 pence), an increase of 27%.
Statement of Financial PositionThe Group continues to enjoy a healthy financial position including a low level of net debt at £9.0 million (2016: net cash at £3.7 million). The reduction in cash includes the consideration for Comdel at £18.2 million (excluding associated legal fees of £0.2 million and consideration payable of £0.6 million) and the dividend paid out of £14.0 million, partially offset by the free cash flow generated of £19.4 million. Net assets increased by £10.0 million to £116.9 million during the year (2016: £106.9 million).
As part of the acquisition of Comdel, XP Power entered into a revolving credit facility of US$40 million with a further US$20 million accordion structure for a further four years (with a potential one year extension) to September 2021. The finance charge associated with this facility was £0.2 million in 2017. Due to the average level of debt in 2018, the charge in 2018 is expected to be double the 2017 level.
At the forthcoming AGM, the Board is proposing an ordinary resolution to change the borrowing restriction currently stipulated in the Company’s Articles of Association in order to make it more appropriate for the size of business that XP Power has become. The resolution proposes that Group borrowings must not exceed the greater of £125 million (previously £50 million) and three times adjusted capital. This is to provide sufficient headroom in the Articles to support future growth through external borrowing, should the Board consider this appropriate in the future. It should be noted that the Board will continue to use net debt / EBITDA as the primary metric with which to measure and control the Group’s leverage. The Board believes this proposed amendment to the Articles of Association to be in the best commercial interests of the Group. As at 1st March 2018, the Group has available to its committed external borrowing facilities of up to US$40 million.
Heading
26
Fixed Asset AdditionsWe continue to invest in our business with the majority of spend on manufacturing and supporting our future sales growth. The majority of the manufacturing spend relates to our new Vietnam site located adjacent to our current facility. We plan to invest circa £10 million during the new financial year, a £4 million increase on 2017. This acceleration is principally due to the building of our new Vietnam site and an investment in upgrading our ERP system.
Statement of Cash FlowsOur high margin business model, with modest capital requirements, continues to produce excellent free cash flows.
We finished 2017 in a net debt position of £9.0 million compared with a net cash position of £3.7 million at the end of 2016. This position was achieved after funding the acquisition of Comdel (£18.2 million) and returning £14.0 million to Shareholders in the form of dividends. There was a working capital outflow which is predominately made up of higher inventory which reflects a high level of orders to be shipped in early 2018, offset by a movement in trade and other payables £5.3 million.i
DividendsThe attractive cash flow generated by the XP Power business model has enabled the Company to pursue a progressive dividend policy over a sustained period of time.
The policy is to increase dividends progressively whilst maintaining an appropriate level of cover. This year’s financial performance in terms of both profitability and cash flow has enabled us to recommend a final dividend of 29 pence per share which, together with the quarterly dividends already paid, gives a total dividend for the year of 78 pence per share (2016: 71 pence per share), an increase of 10%. Dividend cover for the year was 2.0 times.
Financial InstrumentsThe Group’s financial instruments consist of cash, money market deposits, and various other items such as trade receivables and trade payables that arise directly from its business operations.
The Group uses forward currency contracts to hedge highly probable forecast transactions. The instruments purchased are denominated in the currencies of the Group’s principal markets. The Group had £13.7 million of forward currency contracts outstanding at 31 December 2017 (2016: £11.5 million).
Substantial InterestsOther than the Directors’ interests, at 31 December 2017 the Company was aware of the following interests in 3% or more of the issued ordinary share capital of the Company:
Number of shares
Percentage of shares in
issue
Standard Life Aberdeen plc 3,156,588 16.4%
Hargreave Hale 1,693,093 8.8%
Mawer Investment Management 1,670,917 8.7%
Capital Group Companies 1,488,000 7.7%
BlackRock Investment Mgt (UK) 734,563 3.8%
Old Mutual Global Investors 724,246 3.8%
PERFORMANCE
Financial Review
XP Power Annual Report & Accounts for the year ended 31 December 2017 stock code: XPP
27
STR
ATEG
IC R
EPO
RT
As at 27 February 2018, the following information had been received in accordance with the Disclosure and Transparency Rules:
Number of shares
Percentage of shares in
issue
Standard Life Aberdeen plc 3,104,302 16.1%
Hargreave Hale 1,686,807 8.8%
Mawer Investment Management 1,661,458 8.6%
Capital Group Companies 1,488,000 7.7%
BlackRock Investment Mgt (UK) 780,508 4.1%
JP Morgan Asset Management 673,103 3.5%
Old Mutual Global Investors 644,864 3.4%
Brexit and Foreign ExchangeThe weakening of Sterling versus the US Dollar in the period following the United Kingdom Referendum on EU membership in June 2016 had a material effect on the presentation of our financial results in both 2016 and 2017.
Approximately 82% of our revenues (2016: 75%) are denominated in US Dollars and the translation of these revenues into Sterling for reporting purposes has had a beneficial effect. However, the majority of our cost of sales and a large proportion of our operating expenses are also denominated in US Dollars. While a stronger US Dollar helps our overall gross margin in absolute terms (albeit to a limited degree) it also has the effect of reducing the gross margin percentage as costs rise disproportionately to the revenues. We estimate that our reported 2017 gross margin percentage could be approximately 60bps (2016: 130bps) lower as a result.
In terms of the broader economic impacts of Brexit on our business, we do not consider that they will be material. Our products are made in Asia and are already imported into Europe where we have warehouses in both Germany and the United Kingdom and hence we could ship our product destined for the European Union directly into Germany or another appropriate location.
Systems Development Efficient and robust systems are essential in order for us to manage an international business and supply chain with a highly diverse customer base. We operate a global Customer Relationship Management system covering all three regions which allows us to collaborate, share information and provide efficient and effective customer service. The cornerstone of our supply chain is built on the SAP Enterprise Resource Management System. In 2018, we are embarking on a project to implement the latest version of SAP across our entire global supply chain with the first focus being on our China and Vietnam manufacturing facilities. We expect this first stage to have significant benefits in terms of factory planning and will of course give us significant operational advantages with the factory systems running on the same platform as sales companies. Further gains will be realised when we migrate the supply chain across.
This integrated approach ensures that we have the robust systems and reporting necessary to support our future growth.
OutlookWe have started the new financial year well with continuing momentum in new orders and revenue. We intend to invest further capital expenditure in our business in key areas such as supply chain, manufacturing and systems to support the anticipated growth of our business. We currently anticipate that orders and revenue in 2018 will be above the level seen in 2017.
Gavin GriggsChief Financial Officer
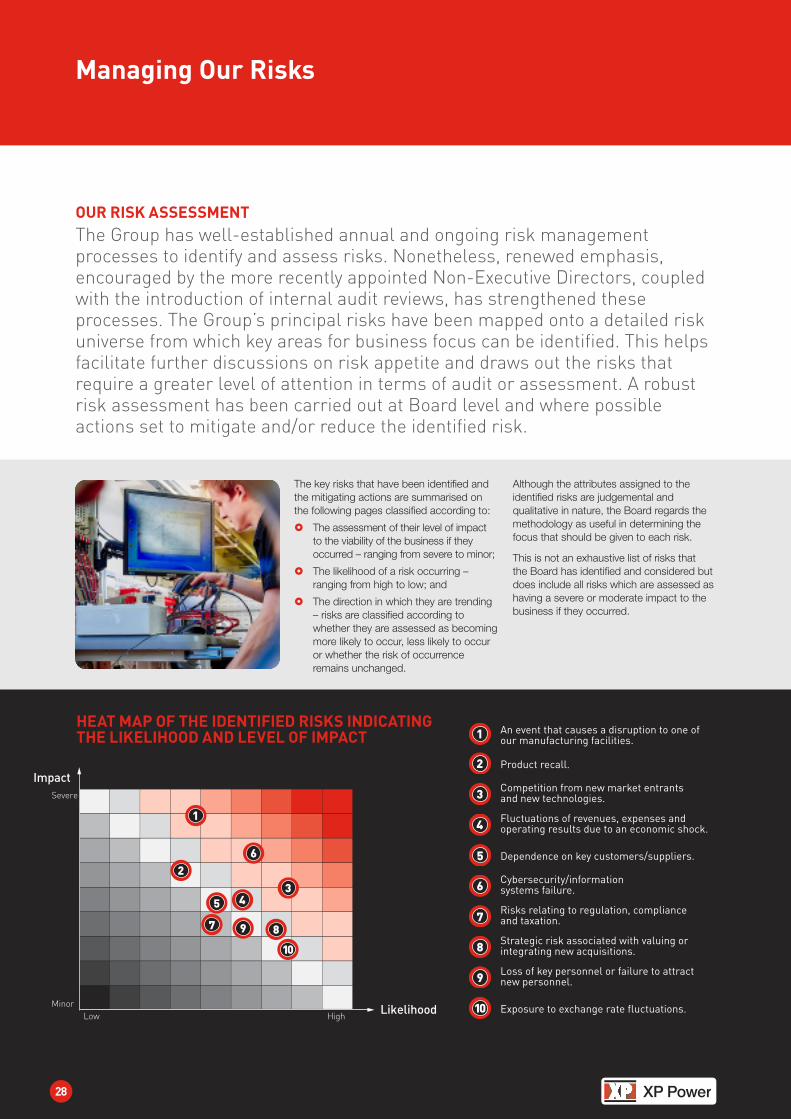
Heading
28
Managing Our Risks
OUR RISK ASSESSMENTThe Group has well-established annual and ongoing risk management processes to identify and assess risks. Nonetheless, renewed emphasis, encouraged by the more recently appointed Non-Executive Directors, coupled with the introduction of internal audit reviews, has strengthened these processes. The Group’s principal risks have been mapped onto a detailed risk universe from which key areas for business focus can be identified. This helps facilitate further discussions on risk appetite and draws out the risks that require a greater level of attention in terms of audit or assessment. A robust risk assessment has been carried out at Board level and where possible actions set to mitigate and/or reduce the identified risk.
The key risks that have been identified and the mitigating actions are summarised on the following pages classified according to:
} The assessment of their level of impact to the viability of the business if they occurred – ranging from severe to minor;
} The likelihood of a risk occurring – ranging from high to low; and
} The direction in which they are trending – risks are classified according to whether they are assessed as becoming more likely to occur, less likely to occur or whether the risk of occurrence remains unchanged.
Although the attributes assigned to the identified risks are judgemental and qualitative in nature, the Board regards the methodology as useful in determining the focus that should be given to each risk.
This is not an exhaustive list of risks that the Board has identified and considered but does include all risks which are assessed as having a severe or moderate impact to the business if they occurred.
2
Impact
Likelihood
Severe
MinorLow High
1
23
45
6
7 89
10
HEAT MAP OF THE IDENTIFIED RISKS INDICATING THE LIKELIHOOD AND LEVEL OF IMPACT 1 An event that causes a disruption to one of
our manufacturing facilities.
3 Competition from new market entrants and new technologies.
4 Fluctuations of revenues, expenses and operating results due to an economic shock.
5 Dependence on key customers/suppliers.
6 Cybersecurity/information systems failure.
7 Risks relating to regulation, compliance and taxation.
8 Strategic risk associated with valuing or integrating new acquisitions.
9 Loss of key personnel or failure to attract new personnel.
10 Exposure to exchange rate fluctuations.
2 Product recall.
XP Power Annual Report & Accounts for the year ended 31 December 2017 stock code: XPP
29
STR
ATEG
IC R
EPO
RT
Risks that could have a severe impact on the Company’s business and possibly on the viability of the Company’s business
Risk Mitigation Assessed Trend
1 AN EVENT CAUSES A DISRUPTION TO OUR MANUFACTURING FACILITIES
An event that results in the temporary or permanent loss of a manufacturing facility would be a serious issue. As the Group manufactures 76% of revenues, this would undoubtedly cause at least a short-term loss of revenues and profits and disruption to our customers and therefore damage to reputation.
¼ We now have two facilities (China and Vietnam) where we are able to produce power supplies. However, not all power converter series can be produced in both facilities.
¼ We have disaster recovery plans in place for both facilities.
¼ We have undertaken a risk review with the manufacturing management to identify and assess risks which could cause a serious disruption to manufacturing, and then identified and implemented actions to reduce or mitigate these risks where possible.
UNCHANGED
2 PRODUCT RECALL
A product recall due to a quality or safety issue would have serious repercussions to the business in terms of potential cost and reputational damage as a supplier to critical systems.
¼ We perform 100% functional testing on all own-manufactured products and 100% hi-pot testing, which determines the adequacy of electrical insulation, on own-manufactured products. This ensures the integrity of the isolation barrier between the mains supply and the end user of the equipment. We also test all the medical products we manufacture to ensure the leakage current is within the medical specifications.
¼ Where we have contracts with customers, we limit our contractual liability regarding recall costs.
¼ No single customer project accounts for more than 4% of overall revenue.
UNCHANGED
Risks that could have a moderate impact on the Company’s business
Risk Mitigation Assessed Trend
3 COMPETITION FROM NEW MARKET ENTRANTS AND NEW TECHNOLOGIES
The power supply market is diverse and competitive. The Directors believe that the development of new technologies could give rise to significant new competition to the Group, which may have a material effect on its business. At the lower end of the Group’s target market, in terms of both power range and programme size, the barriers to entry are lower and there is, therefore, a risk that competition could quickly increase, particularly from emerging low cost manufacturers in Asia.
¼ The Group reviews activities of its competition, in particular product releases, and stays up-to-date with new technological advances in our industry, especially those relating to new components and materials. The Group also tries to keep its cost base competitive by operating in low cost geographies where appropriate.
¼ The general direction of our product roadmap is to move away from lower complexity products and to increase our engineering solutions capabilities so reducing the inherent market competitiveness.
MORE LIKELY
Heading
30
Managing Our Risks
Risks that could have a moderate impact on the Company’s business
Risk Mitigation Assessed Trend
4 FLUCTUATIONS OF REVENUES, EXPENSES AND OPERATING RESULTS DUE TO AN ECONOMIC SHOCK
The revenues, expenses and operating results of the Group could vary significantly from period to period as a result of a variety of factors, some of which are outside its control. These factors include: general economic conditions; adverse movements in interest rates; conditions specific to the market; seasonal trends in revenues, capital expenditure and other costs; and the introduction of new products or services by the Group, or by their competitors. In response to a changing competitive environment, the Group may elect from time to time to make certain pricing, service, marketing decisions or acquisitions that could have a short-term material adverse effect on the Group’s revenues, results of operations and financial condition.
¼ Although not immune from an economic shock or the cyclicality of the capital equipment markets, the Group’s diverse customer base, geographic spread and revenue annuities reduce exposure to this risk.
¼ The Group’s business model is not capital intensive and the strong profit margins lead to healthy cash generation which also helps mitigate risks from these external factors.
¼ The Group benefits from good order exposure 12 months out allowing it to recognise market changes and mitigate the impact.
UNCHANGED
5 DEPENDENCE ON KEY CUSTOMERS/SUPPLIERS
The Group is dependent on retaining its key customers and suppliers. Should the Group lose a number of its key customers or key suppliers, this could have a material impact on the Group’s financial condition and results of operations. However, for the year ended 31 December 2017, no single customer accounted for more than 11% of revenue.
¼ The Group mitigates this risk by providing excellent service. Customer complaints and non-conformances are reviewed monthly by members of the Executive Leadership team.
¼ As the proportion of our own-manufactured products has increased, the reliance on suppliers for third party product has been mitigated proportionally. There has been a shift from a finished goods risk to a raw materials risk.
¼ We conduct regular audits of our key suppliers and in addition keep large amounts of safety inventory of key components.
UNCHANGED
6 CYBERSECURITY/INFORMATION SYSTEMS FAILURE
The Group is reliant on information technology in multiple aspects of the business from communications to data storage. Assets accessible online are potentially vulnerable to theft and customer channels are vulnerable to disruption. Any failure or downtime of these systems or any data theft could have a significant adverse impact on the Group’s reputation or on the results of operations.
¼ The Group has a defined Business Impact Assessment which identifies the key information assets; replication of data on different systems or in the Cloud; an established backup process in place as well as a robust anti-malware solution on our networks.
¼ Internally produced training materials are used to educate users regarding good IT security practice and to promote the Group’s IT policy.
¼ A cyber assessment carried out by the outsourced internal auditor resulted in recommendations that are being implemented to further mitigate cyber risk and safeguard the Group’s assets.
UNCHANGED
7 RISKS RELATING TO REGULATION, COMPLIANCE AND TAXATION
The Group operates in multiple jurisdictions with applicable trade and tax regulations that vary. Failing to comply with local regulations or a change in legislation could impact the profits of the Group. In addition, the effective tax rate of the Group is affected by where its profits fall geographically. The Group’s effective tax rate could therefore fluctuate over time and have an impact on earnings and potentially its share price.
¼ An outsourced internal audit function has been introduced to provide risk assurance in targeted areas of the business and recommendations for improvement. The scope of these reviews includes behaviour, culture and ethics.
¼ The Group hires employees with relevant skills and uses external advisers to keep up-to-date with changes in regulations and to remain compliant.
UNCHANGED
XP Power Annual Report & Accounts for the year ended 31 December 2017 stock code: XPP
31
STR
ATEG
IC R
EPO
RT
Risks that could have a moderate impact on the Company’s business
Risk Mitigation Assessed Trend
8 STRATEGIC RISK ASSOCIATED WITH VALUING OR INTEGRATING NEW ACQUISITIONS
The Group may elect from time to time to make strategic acquisitions. A degree of uncertainty exists in valuation and in particular in evaluating potential synergies. Post-acquisition risks arise in the form of change of control and integration challenges. Any of these could have an effect on the Group’s revenues, results of operations and financial condition.
¼ Preparation of robust business plans and cash projections with sensitivity analysis and the help of professional advisers if appropriate.
¼ Post-acquisition reviews are performed to extract “lessons learned”.
UNCHANGED
9 LOSS OF KEY PERSONNEL OR FAILURE TO ATTRACT NEW PERSONNEL
The future success of the Group is substantially dependent on the continued services and continuing contributions of its Directors, senior management and other key personnel. The loss of the services of key employees could have a material adverse effect on own business.
¼ The Group undertakes performance evaluations and reviews to help it stay close to its key personnel as well as annual employee engagement surveys. Where considered appropriate, the Group also makes use of financial retention tools such as equity awards.
MORE UNLIKELY
10 EXPOSURE TO EXCHANGE RATE FLUCTUATIONS
The Group deals in many currencies for both its purchases and sales including US Dollars, Euros and its reporting currency Pounds Sterling. In particular, North America represents an important geographic market for the Group where virtually all the revenues are denominated in US Dollars. The Group also sources components in US Dollars and the Chinese Yuan. The Group therefore has an exposure to foreign currency fluctuations. This could lead to material adverse movements in reported earnings.
¼ The Group reviews balance sheet and cash flow currency exposures and where considered appropriate, uses forward exchange contracts to hedge these exposures. Any forward contract requires the approval of both the Chief Executive Officer and Chief Financial Officer.
¼ The Group does not hedge any translation of its subsidiaries’ results to Sterling for reporting purposes.
UNCHANGED
Viability StatementIn accordance with provision C.2.2 of the 2016 revision of the UK Corporate Governance Code, the Directors are required to assess the prospects of the Company over a period longer than the 12 months required by the “Going Concern” provision.
Various options were considered, taking into account the Group’s identified risks, its current borrowing arrangements and capacity to extend borrowing and after consideration the Directors are of the opinion that the Company is viable for at least a period of three years to 31 December 2020. This timeframe is within the Group’s strategic financial planning period used to evaluate performance and liquidity and aligns with the design-in cycle for which the Group has visibility.
The Company has a business model where the Company’s product is designed into numerous applications, with numerous customers, in numerous geographies. The Company’s products are all designed into capital equipment which is generally in production for a number of consecutive years, resulting in a revenue annuity. This diversity and revenue annuity are both deemed important factors in mitigating many of the risks that could affect the long-term viability of the Group. Nevertheless, the Directors’ obligation is to assess the Company’s viability in conjunction with the principal risks that could cause a severe but plausible threat. The major risks set out on pages 28 to 31 were each modelled in a hypothetical and deliberately austere scenario to help determine the potential effect, primarily to cash flow.
Certain subjective assumptions and judgments were made to achieve this. Given the cash generative nature of the business, each risk scenario occurring in isolation did not breach the Group’s theoretical borrowing facility headroom, though factors such as a temporary dividend reduction or temporary reduction in capital expenditure may be necessary. The most severe threats occurring in isolation were found to be a serious and prolonged systems failure, such as to our ERP or CRM systems, or a temporary or permanent disruption at one of our manufacturing facilities.
Scenarios were also prepared to model the unlikely event of more than one risk occurring at the same time. A combination of a temporary or permanent disruption at one of our manufacturing facilities together with a serious and prolonged economic shock was found to compromise the viability of the Company, if mitigating actions such as expanding the debt facility were unsuccessful.
In determining the viability term, the Board assessed the deliberately austere scenarios against the controls in place to prevent or mitigate the risks occurring. It also considered them against the Group’s current banking facilities, a revolving credit facility of US$40 million with a US$20 million additional accordion, and in relation to its capacity to potentially extend borrowing. The current facility without the accordion represents 0.78 times the 2017 EBITDA.
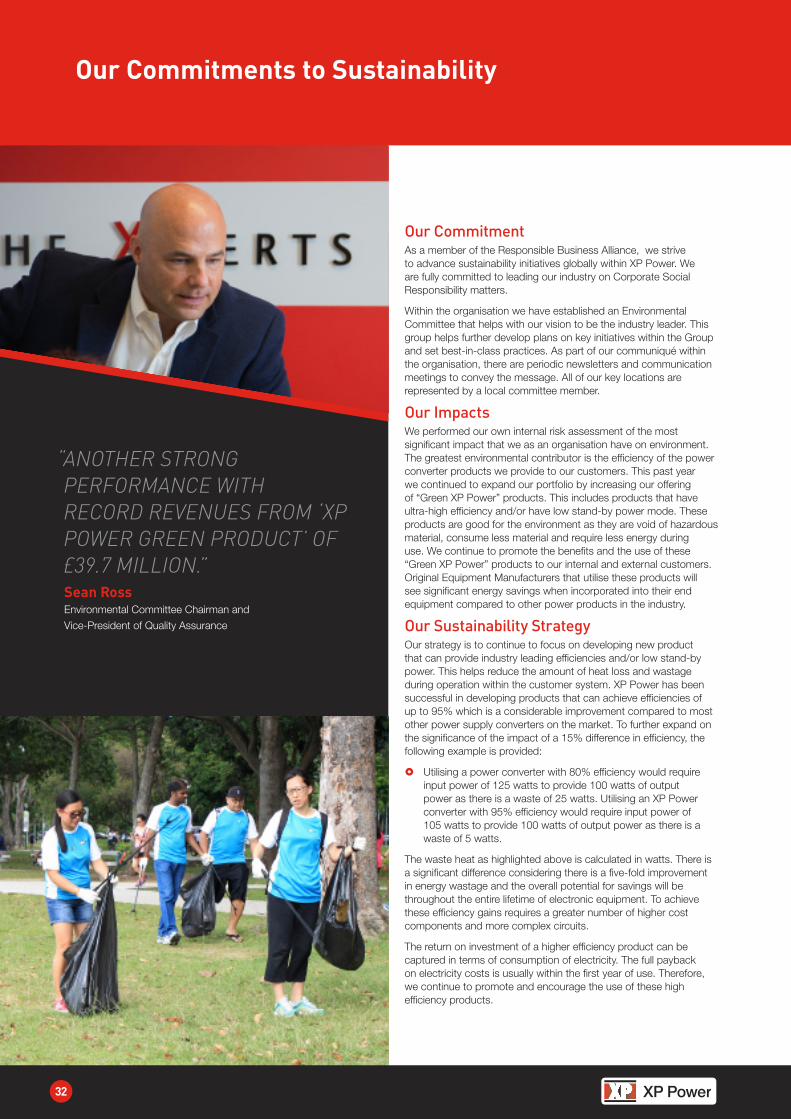
Heading
32
Our Commitments to Sustainability
Our CommitmentAs a member of the Responsible Business Alliance, we strive to advance sustainability initiatives globally within XP Power. We are fully committed to leading our industry on Corporate Social Responsibility matters.
Within the organisation we have established an Environmental Committee that helps with our vision to be the industry leader. This group helps further develop plans on key initiatives within the Group and set best-in-class practices. As part of our communiqué within the organisation, there are periodic newsletters and communication meetings to convey the message. All of our key locations are represented by a local committee member.
Our ImpactsWe performed our own internal risk assessment of the most significant impact that we as an organisation have on environment. The greatest environmental contributor is the efficiency of the power converter products we provide to our customers. This past year we continued to expand our portfolio by increasing our offering of “Green XP Power” products. This includes products that have ultra-high efficiency and/or have low stand-by power mode. These products are good for the environment as they are void of hazardous material, consume less material and require less energy during use. We continue to promote the benefits and the use of these “Green XP Power” products to our internal and external customers. Original Equipment Manufacturers that utilise these products will see significant energy savings when incorporated into their end equipment compared to other power products in the industry.
Our Sustainability StrategyOur strategy is to continue to focus on developing new product that can provide industry leading efficiencies and/or low stand-by power. This helps reduce the amount of heat loss and wastage during operation within the customer system. XP Power has been successful in developing products that can achieve efficiencies of up to 95% which is a considerable improvement compared to most other power supply converters on the market. To further expand on the significance of the impact of a 15% difference in efficiency, the following example is provided:
} Utilising a power converter with 80% efficiency would require input power of 125 watts to provide 100 watts of output power as there is a waste of 25 watts. Utilising an XP Power converter with 95% efficiency would require input power of 105 watts to provide 100 watts of output power as there is a waste of 5 watts.
The waste heat as highlighted above is calculated in watts. There is a significant difference considering there is a five-fold improvement in energy wastage and the overall potential for savings will be throughout the entire lifetime of electronic equipment. To achieve these efficiency gains requires a greater number of higher cost components and more complex circuits.
The return on investment of a higher efficiency product can be captured in terms of consumption of electricity. The full payback on electricity costs is usually within the first year of use. Therefore, we continue to promote and encourage the use of these high efficiency products.
“ ANOTHER STRONG PERFORMANCE WITH RECORD REVENUES FROM ‘XP POWER GREEN PRODUCT’ OF £39.7 MILLION.”Sean Ross
Environmental Committee Chairman and
Vice-President of Quality Assurance

XP Power Annual Report & Accounts for the year ended 31 December 2017 stock code: XPP
33
STR
ATEG
IC R
EPO
RT
The market trend through both demand and legislation for higher efficiency products is expected to continue in the electronics industry. These legislation requirements are projected to extend from consumer equipment to the industrial and healthcare markets that we serve.
Our Key Achievements in 2017We established new records for revenues of XP Green Products shipped in 2017. In 2017, we shipped £39.7 million of high efficiency products to our customer base. This represents an increase of 31% from 2016 and currently is 23.8% of our overall revenue. Of the new 27 product families we launched during this past year, 19 meet our “Green XP Power” criteria.
The annual savings in CO2 emissions from these products compared to a standard 80% efficient converter are quite significant. Based on our calculations, we estimate that the annual emission savings from the “Green XP Power” converters we sold in 2017 is 41,500 tonnes.
The annual savings will recur each year for the lifetime of the product, which we estimate conservatively as seven years. This would result in lifetime savings of 291,000 tonnes of CO2. This helps demonstrate the environmental impact that we can make by providing these types of products. XP Power also invested in LED (light-emitting diode) lighting within our Bremen, Germany location. This new lighting system will add additional energy savings which is a positive.
Sustainability Initiative – Earth Day 2017In April, we celebrated Earth Day by having an entire week of activities coordinated across the different XP Power locations. Some of the activities planned by the local environmental representatives included:
} Clean up activities at public parks and beaches.
} Vegetable picking to support locally sourced materials which are used to feed the homeless.
} Office and household E-waste collection centres.
} Ride share and public transportation campaign.
Our Plans for the Year AheadProducts: There currently are additional high efficiency products that are on our road map for 2018.
Facilities: At the facilities that we are currently utilising we are evaluating which locations we could add solar panels and/or Electric Vehicle Charging stations. This would complement those existing locations in which these are already established.
Manufacturing: Further expansion of our Vietnam manufacturing location will utilise the same industry leading environmental design as the original building envelope.
OUR PEOPLE AND THEIR HEALTH AND SAFETYSee page 36
OUR CUSTOMERSSee page 38
OUR SUPPLIERSSee page 39
READ MORE:
OUR VALUESSee page 34
OUR COMMUNITIESSee page 40
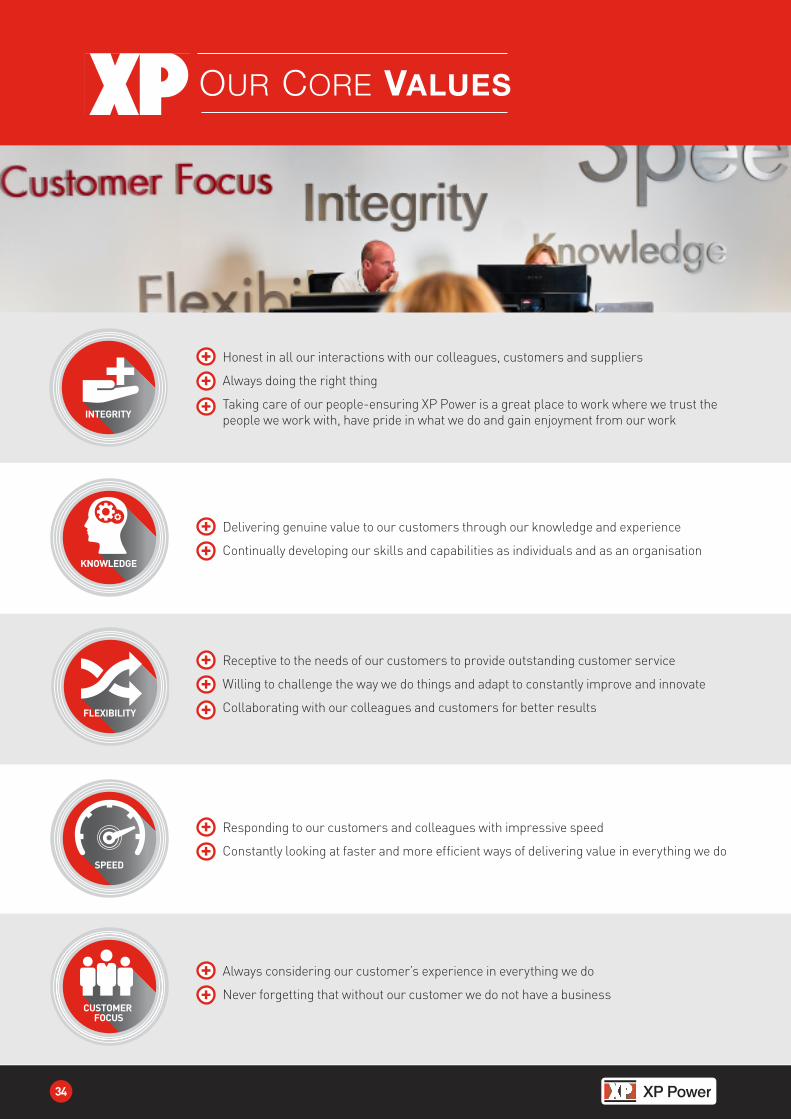
KNOWLEDGE FLEXIBILITY SPEED INTEGRITYCUSTOMER FOCUS
Honest in all our interactions with our colleagues, customers and suppliers
Always doing the right thing
Taking care of our people-ensuring XP Power is a great place to work where we trust the people we work with, have pride in what we do and gain enjoyment from our work
KNOWLEDGE FLEXIBILITY SPEED INTEGRITYCUSTOMER FOCUS
Receptive to the needs of our customers to provide outstanding customer service
Willing to challenge the way we do things and adapt to constantly improve and innovate
Collaborating with our colleagues and customers for better results
KNOWLEDGE FLEXIBILITY SPEED INTEGRITYCUSTOMER FOCUS
KNOWLEDGE FLEXIBILITY SPEED INTEGRITYCUSTOMER FOCUS
KNOWLEDGE FLEXIBILITY SPEED INTEGRITYCUSTOMER FOCUS
Delivering genuine value to our customers through our knowledge and experience
Continually developing our skills and capabilities as individuals and as an organisation
Responding to our customers and colleagues with impressive speed
Constantly looking at faster and more efficient ways of delivering value in everything we do
Always considering our customer’s experience in everything we do
Never forgetting that without our customer we do not have a business
Heading
34
KNOWLEDGE FLEXIBILITY SPEED INTEGRITYCUSTOMER FOCUS
OUR CORE VALUES
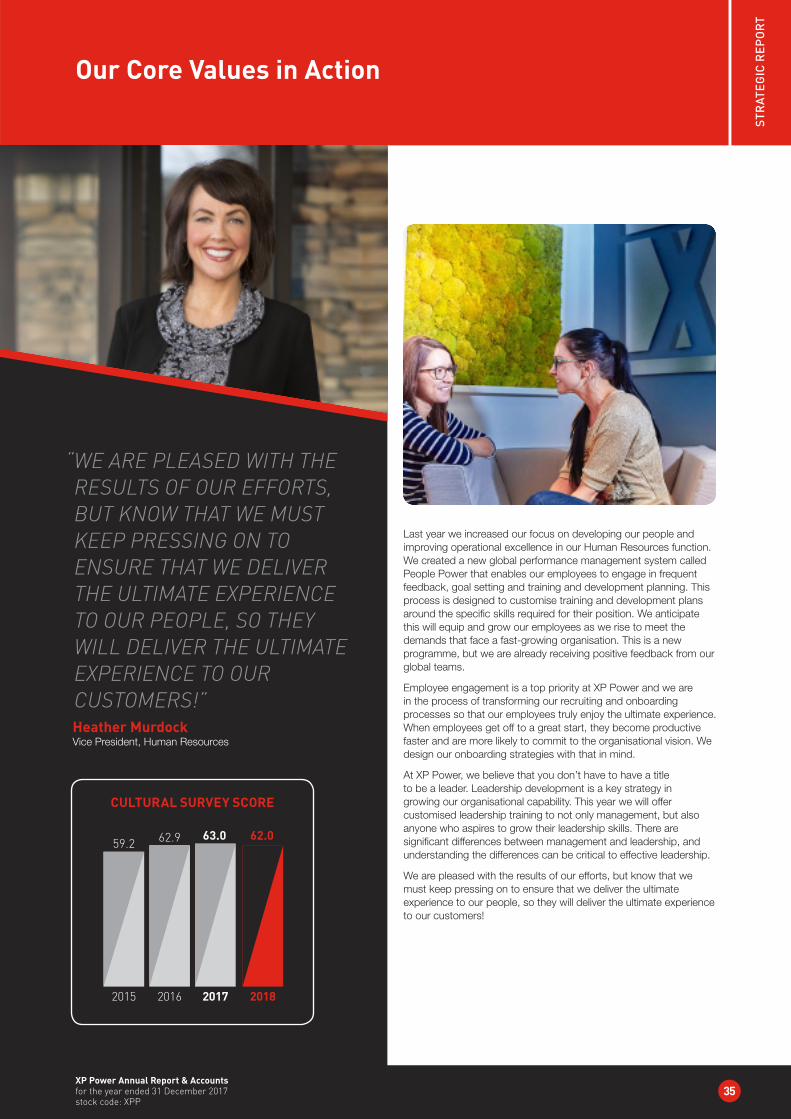
XP Power Annual Report & Accounts for the year ended 31 December 2017 stock code: XPP
35
STR
ATEG
IC R
EPO
RT
Our Core Values in Action
Last year we increased our focus on developing our people and improving operational excellence in our Human Resources function. We created a new global performance management system called People Power that enables our employees to engage in frequent feedback, goal setting and training and development planning. This process is designed to customise training and development plans around the specific skills required for their position. We anticipate this will equip and grow our employees as we rise to meet the demands that face a fast-growing organisation. This is a new programme, but we are already receiving positive feedback from our global teams.
Employee engagement is a top priority at XP Power and we are in the process of transforming our recruiting and onboarding processes so that our employees truly enjoy the ultimate experience. When employees get off to a great start, they become productive faster and are more likely to commit to the organisational vision. We design our onboarding strategies with that in mind.
At XP Power, we believe that you don’t have to have a title to be a leader. Leadership development is a key strategy in growing our organisational capability. This year we will offer customised leadership training to not only management, but also anyone who aspires to grow their leadership skills. There are significant differences between management and leadership, and understanding the differences can be critical to effective leadership.
We are pleased with the results of our efforts, but know that we must keep pressing on to ensure that we deliver the ultimate experience to our people, so they will deliver the ultimate experience to our customers!
“ WE ARE PLEASED WITH THE RESULTS OF OUR EFFORTS, BUT KNOW THAT WE MUST KEEP PRESSING ON TO ENSURE THAT WE DELIVER THE ULTIMATE EXPERIENCE TO OUR PEOPLE, SO THEY WILL DELIVER THE ULTIMATE EXPERIENCE TO OUR CUSTOMERS!”Heather Murdock Vice President, Human Resources
CULTURAL SURVEY SCORE
2017
63.0
2018
62.0
2016
62.9
2015
59.2

NORTH AMERICA
14
EUROPE
9
ASIA
9
HEALTH AND SAFETYNumber of incidents
Heading
36
IntegrityIt is imperative that all of our employees are ethical. This is one of our corporate core values and is communicated throughout the organisation. We have also posted the core values throughout our facilities and embedded them into our performance appraisal process as a reminder of the importance of these values throughout our day-to-day activities. The expectation for integrity is as follows:
} Honest in all our interactions with our colleagues, customers and suppliers.
} Always doing the right thing.
} Taking care of our people to ensure XP Power is a great place to work where we trust the people we work with, have pride in what we do and gain enjoyment from our work.
Health and SafetyAs an organisation, XP Power seriously considers the suitability of our Health and Safety programme. The programme we have in place focuses on preventive action to ensure that we are being proactive and therefore reducing the risk of incidents from occurring. In addition to meeting the requirements set out in the Responsible Business Alliance Code of Conduct, there are local requirements that we continuously set out to comply with and keep abreast of any changes. There are Committee members at each of our key sites that ensure any accidents are reported, acted upon and analysed for management review. The accidents and their severity are periodically reported to the Board of Directors to ensure visibility throughout all levels of the organisation.
Our People and their Health and Safety
Our people are our most important asset and we make great efforts to ensure we have policies in place to provide a safe working environment to protect our employees. As an organisation, it is important that XP Power promotes workforce diversity, integrity and a safe and healthy work environment.
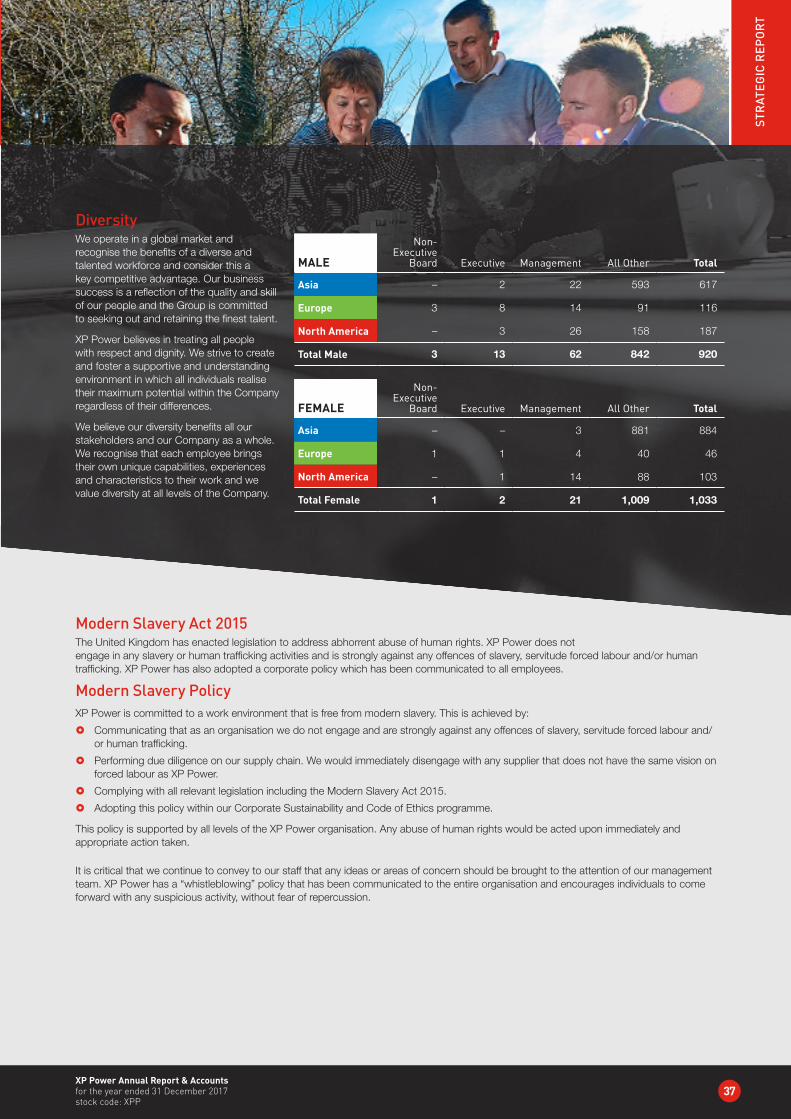
XP Power Annual Report & Accounts for the year ended 31 December 2017 stock code: XPP
37
STR
ATEG
IC R
EPO
RT
DiversityWe operate in a global market and recognise the benefits of a diverse and talented workforce and consider this a key competitive advantage. Our business success is a reflection of the quality and skill of our people and the Group is committed to seeking out and retaining the finest talent.
XP Power believes in treating all people with respect and dignity. We strive to create and foster a supportive and understanding environment in which all individuals realise their maximum potential within the Company regardless of their differences.
We believe our diversity benefits all our stakeholders and our Company as a whole. We recognise that each employee brings their own unique capabilities, experiences and characteristics to their work and we value diversity at all levels of the Company.
MALE
Non-Executive
Board Executive Management All Other Total
Asia – 2 22 593 617
Europe 3 8 14 91 116
North America – 3 26 158 187
Total Male 3 13 62 842 920
FEMALE
Non-Executive
Board Executive Management All Other Total
Asia – – 3 881 884
Europe 1 1 4 40 46
North America – 1 14 88 103
Total Female 1 2 21 1,009 1,033
Modern Slavery Act 2015The United Kingdom has enacted legislation to address abhorrent abuse of human rights. XP Power does not engage in any slavery or human trafficking activities and is strongly against any offences of slavery, servitude forced labour and/or human trafficking. XP Power has also adopted a corporate policy which has been communicated to all employees.
Modern Slavery PolicyXP Power is committed to a work environment that is free from modern slavery. This is achieved by:
} Communicating that as an organisation we do not engage and are strongly against any offences of slavery, servitude forced labour and/or human trafficking.
} Performing due diligence on our supply chain. We would immediately disengage with any supplier that does not have the same vision on forced labour as XP Power.
} Complying with all relevant legislation including the Modern Slavery Act 2015.
} Adopting this policy within our Corporate Sustainability and Code of Ethics programme.
This policy is supported by all levels of the XP Power organisation. Any abuse of human rights would be acted upon immediately and appropriate action taken.
It is critical that we continue to convey to our staff that any ideas or areas of concern should be brought to the attention of our management team. XP Power has a “whistleblowing” policy that has been communicated to the entire organisation and encourages individuals to come forward with any suspicious activity, without fear of repercussion.

Heading
38
Our Customers
Customer FocusCustomers have helped drive our growth with our “Green XP Power” offering. This is demonstrated by the increase in revenues year over year since 2010 of these product offerings. This aligns with one of our organisation’s core values, customer focus. Customers clearly see the benefit of ultra-high efficiency power converters and this has allowed us to be more focused on delivering these products to meet the customer expectations. The feedback we have also received is that customers are willing to pay a premium for these “Green” products due to the higher performance. One of the underlying benefits of a high efficiency product is that the product is inherently more reliable. Once the power converter gets to a level of efficiency that we are achieving, there is very little waste energy as heat, and there is no longer a need for a mechanical fan for cooling (which also consumes power). If the system engineer can design-in a power converter without a mechanical fan they have now removed the most unreliable part of the power system.
Furthermore, as the power converter runs cooler the electronic components which are sensitive to heat, such as electrolytic capacitors, have longer lifetimes. The result is that not only is the power system consuming and wasting less energy it has also become significantly more reliable. This is of particular benefit when we consider that many of our products are designed into critical applications in the healthcare and high end industrial sectors where product failure and downtime are not acceptable. It is with this understanding of the customer’s expectation for an ultra-high efficiency, extremely reliable power supply that we have been able to focus on providing the best solution for the customer’s requirements.
Key AchievementsWe have added 19 additional product series to our portfolio of “Green XP Power” during 2017. One example is a 65 watt desktop product that has the IP32 Environmental rating in addition to Energy Efficiency Level VI. This is the first product family that was introduced to be manufactured directly out of our environmentally friendly manufacturing facility located in Vietnam.
Our Plans AheadOur plan is to continue to invest in products we can bring to market that provide the most benefit to customers in terms of the high efficiency, and low stand-by power that meet our customers’ cost expectations.
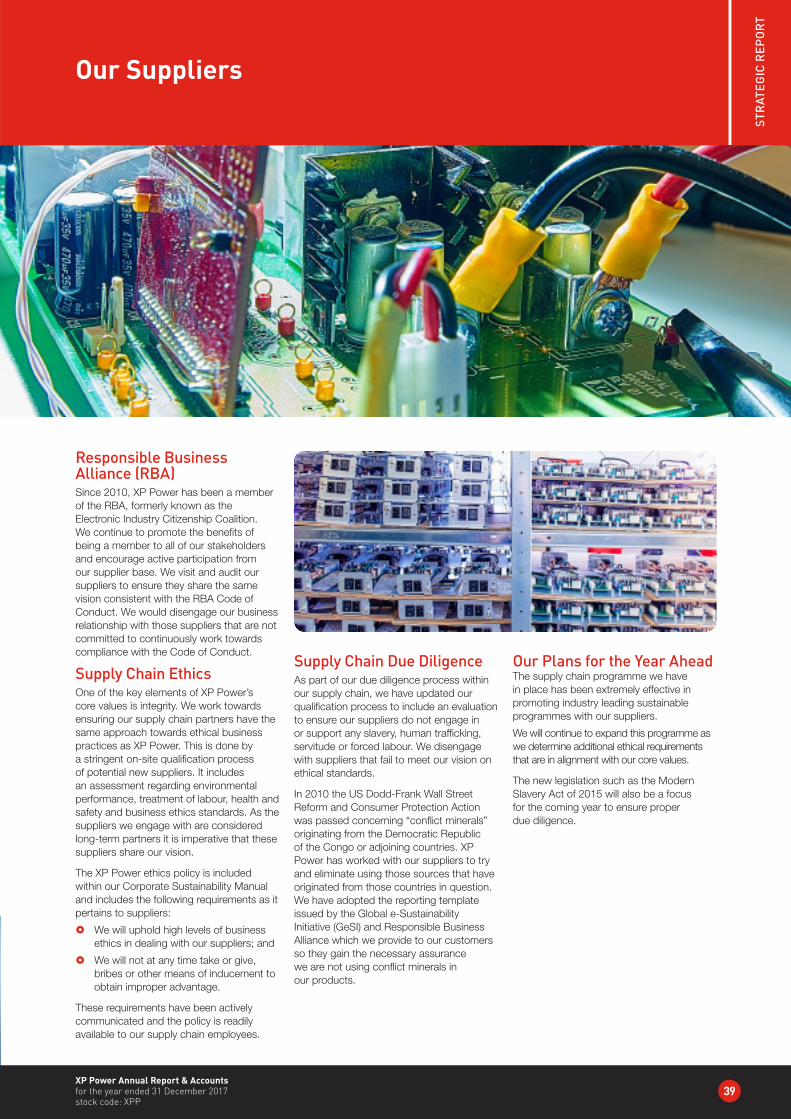
XP Power Annual Report & Accounts for the year ended 31 December 2017 stock code: XPP
39
STR
ATEG
IC R
EPO
RT
Our Suppliers
Responsible Business Alliance (RBA)Since 2010, XP Power has been a member of the RBA, formerly known as the Electronic Industry Citizenship Coalition. We continue to promote the benefits of being a member to all of our stakeholders and encourage active participation from our supplier base. We visit and audit our suppliers to ensure they share the same vision consistent with the RBA Code of Conduct. We would disengage our business relationship with those suppliers that are not committed to continuously work towards compliance with the Code of Conduct.
Supply Chain EthicsOne of the key elements of XP Power’s core values is integrity. We work towards ensuring our supply chain partners have the same approach towards ethical business practices as XP Power. This is done by a stringent on-site qualification process of potential new suppliers. It includes an assessment regarding environmental performance, treatment of labour, health and safety and business ethics standards. As the suppliers we engage with are considered long-term partners it is imperative that these suppliers share our vision.
The XP Power ethics policy is included within our Corporate Sustainability Manual and includes the following requirements as it pertains to suppliers:
} We will uphold high levels of business ethics in dealing with our suppliers; and
} We will not at any time take or give, bribes or other means of inducement to obtain improper advantage.
These requirements have been actively communicated and the policy is readily available to our supply chain employees.
Supply Chain Due DiligenceAs part of our due diligence process within our supply chain, we have updated our qualification process to include an evaluation to ensure our suppliers do not engage in or support any slavery, human trafficking, servitude or forced labour. We disengage with suppliers that fail to meet our vision on ethical standards.
In 2010 the US Dodd-Frank Wall Street Reform and Consumer Protection Action was passed concerning “conflict minerals” originating from the Democratic Republic of the Congo or adjoining countries. XP Power has worked with our suppliers to try and eliminate using those sources that have originated from those countries in question. We have adopted the reporting template issued by the Global e-Sustainability Initiative (GeSI) and Responsible Business Alliance which we provide to our customers so they gain the necessary assurance we are not using conflict minerals in our products.
Our Plans for the Year Ahead The supply chain programme we have in place has been extremely effective in promoting industry leading sustainable programmes with our suppliers.
We will continue to expand this programme as we determine additional ethical requirements that are in alignment with our core values.
The new legislation such as the Modern Slavery Act of 2015 will also be a focus for the coming year to ensure proper due diligence.

Heading
40
Our Communities
Community PolicyLast year we implemented a new policy for community service. The organisation allows for paid time off to support local community activities. This shows a level of commitment by the organisation to allow our employees to give back to the local communities in which we operate. This has been a successful programme and we have seen lots of enthusiasm for this new policy. Some of the activities that took place in 2017 included:
} Supporting the upkeep and maintenance of water passageways in the United Kingdom, in collaboration with the Canal and River Trust Foundation,
} Supporting a Rescue Mission Center in Orange County, California by donating time to stock shelves and serve food for those in unfortunate situations. This is the second year in a row supporting this organisation.
} Beach clean up’s. Members of the Singapore office volunteered in the National Environment Agency’s Clean Singapore Learning Trail. Also, in the United Kingdom employees devoted time picking up plastics, drink containers, rope and other debris from a Devon beach.
} Employees from our Sunnyvale office, California handed out race shirts, bibs and guided participants at a “Turkey Trot” – an event that raises money for charities and other good causes.
} Supporting families in Reading, UK, via the Home Start charity, three employees helped clear up an untidy backyard via our community service policy.
Second Harvest Food BankVolunteers from the Orange County office, California office helped again at the second harvest foodbank.
Our Plans for the Year AheadThe local representatives that coordinate activities continue to be fully engaged within the community. These include opportunities for volunteering, raising funds to support local charities, simply promoting awareness of events or activities that will enhance our environments. This is an ongoing agenda item as part of our local environmental teams’ periodic meetings to see how we can make a difference within the communities in which we operate.
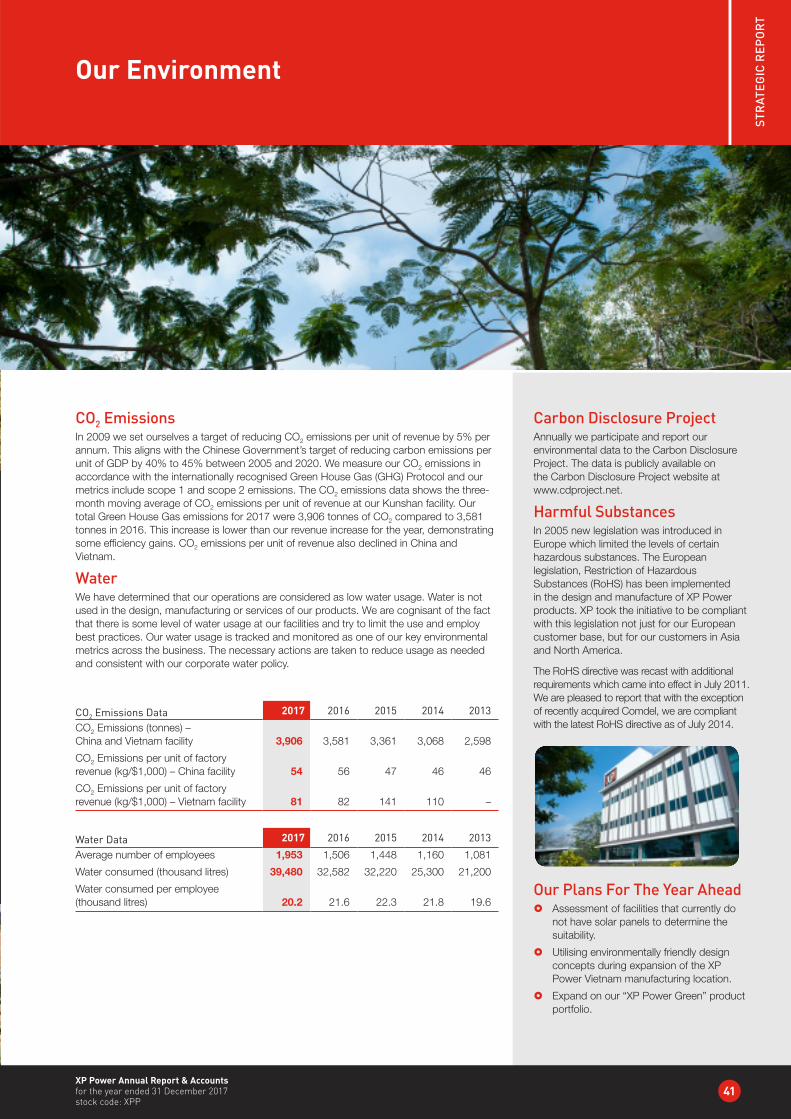
XP Power Annual Report & Accounts for the year ended 31 December 2017 stock code: XPP
41
STR
ATEG
IC R
EPO
RT
Our Environment
CO2 EmissionsIn 2009 we set ourselves a target of reducing CO2 emissions per unit of revenue by 5% per annum. This aligns with the Chinese Government’s target of reducing carbon emissions per unit of GDP by 40% to 45% between 2005 and 2020. We measure our CO2 emissions in accordance with the internationally recognised Green House Gas (GHG) Protocol and our metrics include scope 1 and scope 2 emissions. The CO2 emissions data shows the three-month moving average of CO2 emissions per unit of revenue at our Kunshan facility. Our total Green House Gas emissions for 2017 were 3,906 tonnes of CO2 compared to 3,581 tonnes in 2016. This increase is lower than our revenue increase for the year, demonstrating some efficiency gains. CO2 emissions per unit of revenue also declined in China and Vietnam.
WaterWe have determined that our operations are considered as low water usage. Water is not used in the design, manufacturing or services of our products. We are cognisant of the fact that there is some level of water usage at our facilities and try to limit the use and employ best practices. Our water usage is tracked and monitored as one of our key environmental metrics across the business. The necessary actions are taken to reduce usage as needed and consistent with our corporate water policy.
CO2 Emissions Data 2017 2016 2015 2014 2013
CO2 Emissions (tonnes) – China and Vietnam facility 3,906 3,581 3,361 3,068 2,598
CO2 Emissions per unit of factory revenue (kg/$1,000) – China facility 54 56 47 46 46
CO2 Emissions per unit of factory revenue (kg/$1,000) – Vietnam facility 81 82 141 110 –
Water Data 2017 2016 2015 2014 2013
Average number of employees 1,953 1,506 1,448 1,160 1,081
Water consumed (thousand litres) 39,480 32,582 32,220 25,300 21,200
Water consumed per employee (thousand litres) 20.2 21.6 22.3 21.8 19.6
Carbon Disclosure ProjectAnnually we participate and report our environmental data to the Carbon Disclosure Project. The data is publicly available on the Carbon Disclosure Project website at www.cdproject.net.
Harmful SubstancesIn 2005 new legislation was introduced in Europe which limited the levels of certain hazardous substances. The European legislation, Restriction of Hazardous Substances (RoHS) has been implemented in the design and manufacture of XP Power products. XP took the initiative to be compliant with this legislation not just for our European customer base, but for our customers in Asia and North America.
The RoHS directive was recast with additional requirements which came into effect in July 2011. We are pleased to report that with the exception of recently acquired Comdel, we are compliant with the latest RoHS directive as of July 2014.
Our Plans For The Year Ahead } Assessment of facilities that currently do
not have solar panels to determine the suitability.
} Utilising environmentally friendly design concepts during expansion of the XP Power Vietnam manufacturing location.
} Expand on our “XP Power Green” product portfolio.
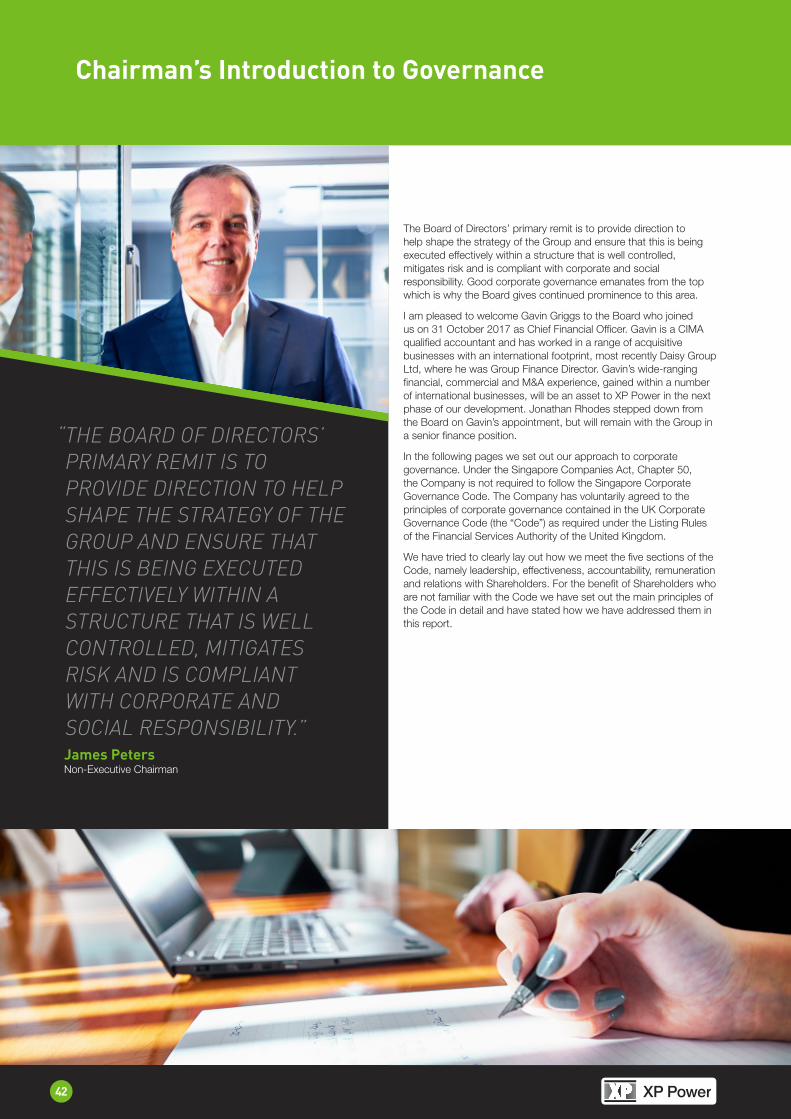
42
HeadingChairman’s Introduction to Governance
The Board of Directors’ primary remit is to provide direction to help shape the strategy of the Group and ensure that this is being executed effectively within a structure that is well controlled, mitigates risk and is compliant with corporate and social responsibility. Good corporate governance emanates from the top which is why the Board gives continued prominence to this area.
I am pleased to welcome Gavin Griggs to the Board who joined us on 31 October 2017 as Chief Financial Officer. Gavin is a CIMA qualified accountant and has worked in a range of acquisitive businesses with an international footprint, most recently Daisy Group Ltd, where he was Group Finance Director. Gavin’s wide-ranging financial, commercial and M&A experience, gained within a number of international businesses, will be an asset to XP Power in the next phase of our development. Jonathan Rhodes stepped down from the Board on Gavin’s appointment, but will remain with the Group in a senior finance position.
In the following pages we set out our approach to corporate governance. Under the Singapore Companies Act, Chapter 50, the Company is not required to follow the Singapore Corporate Governance Code. The Company has voluntarily agreed to the principles of corporate governance contained in the UK Corporate Governance Code (the “Code”) as required under the Listing Rules of the Financial Services Authority of the United Kingdom.
We have tried to clearly lay out how we meet the five sections of the Code, namely leadership, effectiveness, accountability, remuneration and relations with Shareholders. For the benefit of Shareholders who are not familiar with the Code we have set out the main principles of the Code in detail and have stated how we have addressed them in this report.
“ THE BOARD OF DIRECTORS’ PRIMARY REMIT IS TO PROVIDE DIRECTION TO HELP SHAPE THE STRATEGY OF THE GROUP AND ENSURE THAT THIS IS BEING EXECUTED EFFECTIVELY WITHIN A STRUCTURE THAT IS WELL CONTROLLED, MITIGATES RISK AND IS COMPLIANT WITH CORPORATE AND SOCIAL RESPONSIBILITY.”James Peters Non-Executive Chairman

43
GO
VER
NA
NC
E
XP Power Annual Report & Accounts for the year ended 31 December 2017 stock code: XPP
IN THIS SECTION...42 Chairman’s Introduction to Governance
44 Directors and Officers
46 Corporate Governance Report
50 Audit Committee Report
54 Remuneration Committee Report
55 Remuneration Policy
60 Remuneration Report – Annual Report
69 Other Governance and Statutory Disclosures
70 Statement by Directors

44
HeadingDirectors and Officers
XP POWERGavin has recently joined the Group.
SKILLS AND BUSINESS EXPERIENCECIMA qualified accountant who has worked in a range of acquisitive businesses with an international footprint.
Held senior finance roles at Logica, Sodexo, PepsiCo and SABMiller.
Served as CFO of Alternative Networks plc, a listed Information Technology and Telecommunications provider, prior to its acquisition by Daisy in December 2016 when he became Group Finance Director for Daisy Group.
XP POWERMike joined the Group as a result of the acquisition of ForeSight Electronics in 2000.
Mike was responsible for global sales and marketing prior to becoming Corporate Development Officer in November 2017.
SKILLS AND BUSINESS EXPERIENCEOver 28 years’ experience in the power converter industry.
After completing his degree in Electrical Engineering at UC Santa Barbara, he held several sales and technical positions with: Power Systems Distributors, Compumech and Delta Lu Research.
Mike joined ForeSight Electronics in 1991 and held various senior roles prior to their acquisition by XP Power in 2000.
XP POWERAndy joined the Group in July 2005 as General Manager for Asia where he started up the Shanghai operation.
He currently oversees the sales and marketing for Singapore, China, Japan, South Korea and India.
SKILLS AND BUSINESS EXPERIENCEOver 15 years in the power converter industry.
Graduated from Nanyang Technological University with a degree in Electrical and Electronic Engineering and an MBA from Manchester Business School.
Prior to joining the Group, he held technical and commercial roles with companies such asSilicon Systems (Singapore) and Advanced Micro Devices (Singapore).
XP POWERDuncan joined as Group Finance Director, a position he held between April 2000 and February 2003 before being promoted to Chief Executive Officer.
SKILLS AND BUSINESS EXPERIENCEExtensive experience of corporate finance matters.
Between 1985 to 1990, he spent five years at Coopers & Lybrand in general practice and corporate finance.
Worked for LSI Logic Corporation for eight years where he held senior financial positions in both Europe and Silicon Valley.
From October 1998 to March 2000, he was the Controller for the European, Middle Eastern and African regions for Dell Computer Corporation.
Duncan PennyCHIEF EXECUTIVE OFFICER
Appointed 3 February 2003
Gavin GriggsCHIEF FINANCIAL OFFICER
Appointed 31 October 2017
Mike LaverPRESIDENT, CORPORATE DEVELOPMENT
Appointed 20 August 2002
Andy SngEXECUTIVE VICE PRESIDENT, ASIA
Appointed April 2007

45
GO
VER
NA
NC
E
XP Power Annual Report & Accounts for the year ended 31 December 2017 stock code: XPP
COMMITTEESAudit (Chair)NominationRemuneration
SKILLS AND BUSINESS EXPERIENCEBetween July 1993 and May 2013, Terry spent 20 years with Meggitt PLC, the FTSE100 global engineering group specialising in extreme environment components and smart sub-systems for aerospace, defence and energy markets.
For the last 12 years at Meggitt, Terry was Chief Executive Officer and grew its revenues from £0.4 billion to £1.6 billion through a combination of organic growth and numerous successful acquisitions.
On 19 April 2018, Terry is retiring from his position as a Non-Executive Director of Essentra plc, the supplier of specialist plastic, fibre, foam and packaging products.
COMMITTEESRemunerationAudit
SKILLS AND BUSINESS EXPERIENCEPeter joined Traco Electronic AG in 1967 and was appointed Managing Director in 1985, a position he held until his retirement in 2009.
Under Peter’s leadership Traco was built into a highly respected company with revenues in excess of US$100 million.
Peter is well known within the power converter industry with excellent product knowledge.
COMMITTEESRemuneration (Chair)AuditNomination
SKILLS AND BUSINESS EXPERIENCEPolly is a chartered accountant and a former Partner at KPMG LLP. She resigned from her partnership in 2003 and has held a number of non-executive directorship roles.
She is currently a Non-Executive Director at Jupiter Fund Management plc, TSB Group plc and Royal Bank of Canada Europe Ltd. She is also a Trustee of the Guide Dogs for the Blind Association.
COMMITTEESNomination (Chair)
SKILLS AND BUSINESS EXPERIENCEJames has over 35 years' experience in the power converter industry.
Trained as an electronics engineer with Marconi Space and Defence Systems followed by roles at TDK-Lambda, a global power converter company.
Joined Powerline Electronics shortly after its formation in 1980 where he was involved in all aspects of their power business.
XP POWERJames founded XP Power in November 1988.
Appointed European Managing Director in April 2000, responsible for the development of the Group’s European business.
Became Deputy Chairman in February 2003 and moved to a non-executive role in May 2012, before his appointment as Non-Executive Chairman in June 2014.
James PetersNON-EXECUTIVE CHAIRMAN
Appointed 30 June 2014
Terry TwiggerSENIOR NON-EXECUTIVE DIRECTOR
Appointed 1 January 2015
Peter BucherNON-EXECUTIVE DIRECTOR
Appointed 1 January 2014*
Polly WilliamsNON-EXECUTIVE DIRECTOR
Appointed 1 January 2016
* Tendered his resignation in December 2017 and will retire from the Board on 31 December 2018.
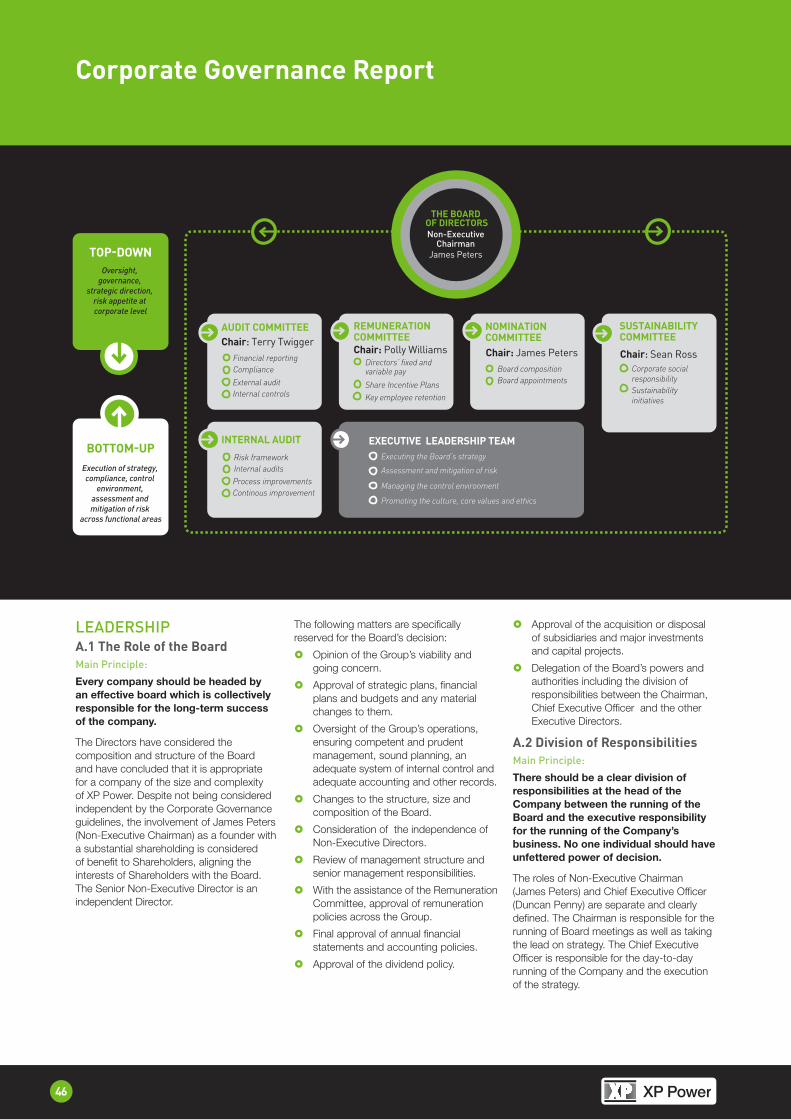
NOMINATION COMMITTEE
AUDIT COMMITTEEChair: Terry Twigger
Financial reportingCompliance
External auditInternal controls
INTERNAL AUDIT
Risk frameworkInternal auditsProcess improvementsContinous improvement
Chair: James Peters Board compositionBoard appointments
Chair: Polly Williams Directors’ fixed and variable pay
Share Incentive PlansKey employee retention
Chair: Sean RossCorporate social responsibilitySustainability initiatives
SUSTAINABILITY COMMITTEE
REMUNERATION COMMITTEE
Executing the Board’s strategy
Assessment and mitigation of risk
Managing the control environment
Promoting the culture, core values and ethics
THE BOARD OF DIRECTORSNon-Executive
Chairman James Peters TOP-DOWN
Oversight, governance,
strategic direction, risk appetite at corporate level
Execution of strategy, compliance, control
environment, assessment and mitigation of risk
across functional areas
EXECUTIVE LEADERSHIP TEAMBOTTOM-UP
46
HeadingCorporate Governance Report
LEADERSHIPA.1 The Role of the BoardMain Principle:
Every company should be headed by an effective board which is collectively responsible for the long-term success of the company.
The Directors have considered the composition and structure of the Board and have concluded that it is appropriate for a company of the size and complexity of XP Power. Despite not being considered independent by the Corporate Governance guidelines, the involvement of James Peters (Non-Executive Chairman) as a founder with a substantial shareholding is considered of benefit to Shareholders, aligning the interests of Shareholders with the Board. The Senior Non-Executive Director is an independent Director.
The following matters are specifically reserved for the Board’s decision:
} Opinion of the Group’s viability and going concern.
} Approval of strategic plans, financial plans and budgets and any material changes to them.
} Oversight of the Group’s operations, ensuring competent and prudent management, sound planning, an adequate system of internal control and adequate accounting and other records.
} Changes to the structure, size and composition of the Board.
} Consideration of the independence of Non-Executive Directors.
} Review of management structure and senior management responsibilities.
} With the assistance of the Remuneration Committee, approval of remuneration policies across the Group.
} Final approval of annual financial statements and accounting policies.
} Approval of the dividend policy.
} Approval of the acquisition or disposal of subsidiaries and major investments and capital projects.
} Delegation of the Board’s powers and authorities including the division of responsibilities between the Chairman, Chief Executive Officer and the other Executive Directors.
A.2 Division of ResponsibilitiesMain Principle:
There should be a clear division of responsibilities at the head of the Company between the running of the Board and the executive responsibility for the running of the Company’s business. No one individual should have unfettered power of decision.
The roles of Non-Executive Chairman (James Peters) and Chief Executive Officer (Duncan Penny) are separate and clearly defined. The Chairman is responsible for the running of Board meetings as well as taking the lead on strategy. The Chief Executive Officer is responsible for the day-to-day running of the Company and the execution of the strategy.
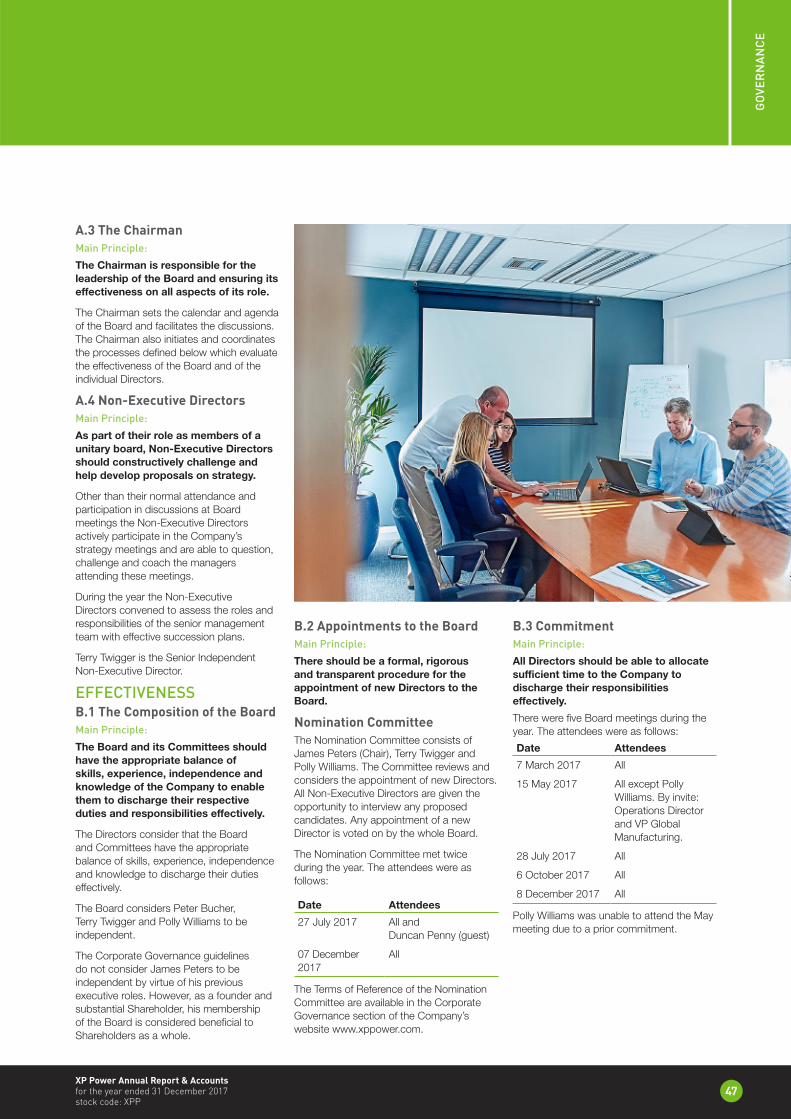
NOMINATION COMMITTEE
AUDIT COMMITTEEChair: Terry Twigger
Financial reportingCompliance
External auditInternal controls
INTERNAL AUDIT
Risk frameworkInternal auditsProcess improvementsContinous improvement
Chair: James Peters Board compositionBoard appointments
Chair: Polly Williams Directors’ fixed and variable pay
Share Incentive PlansKey employee retention
Chair: Sean RossCorporate social responsibilitySustainability initiatives
SUSTAINABILITY COMMITTEE
REMUNERATION COMMITTEE
Executing the Board’s strategy
Assessment and mitigation of risk
Managing the control environment
Promoting the culture, core values and ethics
THE BOARD OF DIRECTORSNon-Executive
Chairman James Peters TOP-DOWN
Oversight, governance,
strategic direction, risk appetite at corporate level
Execution of strategy, compliance, control
environment, assessment and mitigation of risk
across functional areas
EXECUTIVE LEADERSHIP TEAMBOTTOM-UP
47
GO
VER
NA
NC
E
XP Power Annual Report & Accounts for the year ended 31 December 2017 stock code: XPP
A.3 The ChairmanMain Principle:
The Chairman is responsible for the leadership of the Board and ensuring its effectiveness on all aspects of its role.
The Chairman sets the calendar and agenda of the Board and facilitates the discussions. The Chairman also initiates and coordinates the processes defined below which evaluate the effectiveness of the Board and of the individual Directors.
A.4 Non-Executive DirectorsMain Principle:
As part of their role as members of a unitary board, Non-Executive Directors should constructively challenge and help develop proposals on strategy.
Other than their normal attendance and participation in discussions at Board meetings the Non-Executive Directors actively participate in the Company’s strategy meetings and are able to question, challenge and coach the managers attending these meetings.
During the year the Non-Executive Directors convened to assess the roles and responsibilities of the senior management team with effective succession plans.
Terry Twigger is the Senior Independent Non-Executive Director.
EFFECTIVENESSB.1 The Composition of the BoardMain Principle:
The Board and its Committees should have the appropriate balance of skills, experience, independence and knowledge of the Company to enable them to discharge their respective duties and responsibilities effectively.
The Directors consider that the Board and Committees have the appropriate balance of skills, experience, independence and knowledge to discharge their duties effectively.
The Board considers Peter Bucher, Terry Twigger and Polly Williams to be independent.
The Corporate Governance guidelines do not consider James Peters to be independent by virtue of his previous executive roles. However, as a founder and substantial Shareholder, his membership of the Board is considered beneficial to Shareholders as a whole.
B.2 Appointments to the BoardMain Principle:
There should be a formal, rigorous and transparent procedure for the appointment of new Directors to the Board.
Nomination CommitteeThe Nomination Committee consists of James Peters (Chair), Terry Twigger and Polly Williams. The Committee reviews and considers the appointment of new Directors. All Non-Executive Directors are given the opportunity to interview any proposed candidates. Any appointment of a new Director is voted on by the whole Board.
The Nomination Committee met twice during the year. The attendees were as follows:
Date Attendees
27 July 2017 All and Duncan Penny (guest)
07 December 2017
All
The Terms of Reference of the Nomination Committee are available in the Corporate Governance section of the Company’s website www.xppower.com.
B.3 CommitmentMain Principle:
All Directors should be able to allocate sufficient time to the Company to discharge their responsibilities effectively.
There were five Board meetings during the year. The attendees were as follows:
Date Attendees
7 March 2017 All
15 May 2017 All except Polly Williams. By invite: Operations Director and VP Global Manufacturing.
28 July 2017 All
6 October 2017 All
8 December 2017 All
Polly Williams was unable to attend the May meeting due to a prior commitment.
48
HeadingCorporate Governance Report
B.4 DevelopmentMain Principle:
All Directors should receive induction on joining the Board and should regularly update and refresh their knowledge and skills.
Directors receive a full induction on joining the Board. The programme is tailored to the individual needs of each Director.
A visit to the Group’s North American facilities is planned in 2018. Non-Executive Directors will be able to update and refresh their knowledge of the business first-hand and will be able to interact with the management team and employees helping them gain a deeper understanding of the business and allowing them to contribute ideas.
During the year, the Directors also received presentations from the Operations Director and the Executive VP, Global Manufacturing. These presentations reported on systems security and the plans for expanding the Vietnam manufacturing facility, respectively.
B.5 Information and SupportMain Principle:
The Board should be supplied in a timely manner with information in a form and of a quality appropriate to enable it to discharge its duties.
The Board receives “flash” reports, detailed management accounts and detailed financial forecasts prepared on a monthly basis to enable it to review trading performance, forecasts and strategy implementation. Board meeting materials are provided in advance of Board meetings to allow Directors sufficient time to prepare adequately. The Board also received specific presentations and information from management during the year covering the results and actions of the employee survey, the results of a strengths, weaknesses, opportunities and threats review by the executive management team, compliance exception reports, insurance coverage and the sustainability policy and metrics.
B.6 EvaluationMain Principle:
The Board should undertake a formal and rigorous annual evaluation of its own performance and that of its Committees and individual Directors.
The Board’s evaluation of its own performance and that of its Committees is conducted annually using a Board effectiveness questionnaire. The questionnaire was revamped in 2016 with the help of an independent external consultant to ensure that it covered all aspects of effectiveness: capabilities and communication; culture and practice; process and organisation; as well as meeting rigour and relationships. With respect to continually improving Board effectiveness, the questionnaire also asked Directors to comment on what it should stop doing, start doing and continue doing.
The questionnaire was circulated to each Director in relation to the Board and the Committees on which they serve. The independent consultant collated the responses into an anonymous report for the Board to consider and discuss at a Board meeting.
There were no significant issues or concerns raised in the report.
B.7 Re-election Main Principle:
All Directors should be submitted for re-election at regular intervals, subject to continued satisfactory performance.
All Directors voluntarily offer themselves for re-election annually. This is in spite of the Company’s Articles of Association which require Directors to retire and offer themselves for re-election on a rotation basis and at least every three years.
ACCOUNTABILITYC.1 Financial and Business ReportingMain Principle:
The Board should present a balanced and understandable assessment of the Company’s position and prospects.
The Board considers that both the Interim Report and Annual Report and Accounts, supported by quarterly trading updates which are timetabled at the beginning of each year, comprehensively fulfil this requirement. The Annual Report includes a detailed description of the Group’s strategy and business model which has enabled it to generate significant value over a prolonged period of time. It also details the significant risks that the Group faces and how these are mitigated and includes the Board’s assessment of the longer term viability of the Group.
The Company also makes available a number of videos on its investor relations website at the time of its interim and annual reporting as well as investor videos describing products, markets, strategy, business model, growth drivers and its investment proposition.
Going Concern
The Directors, after making enquiries, are of the view, as at the time of approving the accounts, that there is a reasonable expectation that the Company will have adequate resources to continue operating for the foreseeable future and therefore the going concern basis has been adopted in preparing these accounts. In addition, in accordance with C.2.2 of the revision of the Code, the Directors have considered the prospects of the Company over the longer term and provided a viability statement on page 31.
C.2 Risk Management and Internal ControlMain Principle:
The Board is responsible for determining the nature and extent of the significant risks it is willing to take in achieving its strategic objectives. The Board should maintain sound risk management and internal control systems.
The Board acknowledges that it is responsible for the Group’s internal controls and for reviewing their effectiveness. The Group’s internal controls are designed to manage rather than eliminate the risk of failure to meet business objectives, and can only provide reasonable not absolute assurance against material misstatement or loss.
An on going process for identifying, evaluating and managing the significant risks faced by the Group was in place during the entire financial year and has remained in place up to the approval date of the Annual Report and Financial Statements. The identified risks and the processes by which these are addressed are documented, reviewed and updated at Board meetings. The Directors confirm that an assessment of the principal risks facing the Group was reviewed, further details of which are included in the Managing Our Risks and Viability Statement sections within the Strategic Report on pages 28 to 31.
49
GO
VER
NA
NC
E
XP Power Annual Report & Accounts for the year ended 31 December 2017 stock code: XPP
As might be expected in a group of this size, a key control procedure is the day-to-day supervision of the business by the Executive Directors supported by managers within the Group companies. Examples of key controls with respect to ongoing processes include:
} Authority matrices are in place to clearly define who is able to authorise particular transactions, transfer funds, commit Company resources and enter into particular agreements.
} Monthly reporting of management accounts and key metrics to senior management with performance measured to budget and material variances reported to the Board.
} Quality control checks throughout our manufacturing process, burn in, electrical testing to detect early failures, 100% functional testing, and quality inspection.
} Disaster recovery and business continuity plans are in place at all facilities, documented and communicated to key personnel to help cope with unexpected events.
} The Audit Committee reviews the effectiveness of internal controls.
} An internal audit and risk assurance programme is operating.
C.3 Audit Committee and AuditorMain Principle:
The Board should establish formal and transparent arrangements for considering how it should apply the corporate reporting and risk management and internal control principles, and for maintaining an appropriate relationship with the Company’s Auditor.
The Audit Committee Report on pages 50 to 53 sets out in detail the Group’s arrangements to ensure corporate reporting complies with legal and accounting standards together with effective risk management and internal control processes and appropriate supervision and performance of the external Auditor.
The Terms of Reference of the Audit Committee are available in the Corporate Governance section of the Company’s website www.xppower.com.
REMUNERATIOND.1 The Level and Components of RemunerationMain Principle:
Levels of remuneration should be sufficient to attract, retain and motivate Directors of the quality required to run the Company successfully, but a company should avoid paying more than is necessary for this purpose. A significant proportion of Executive Directors’ remuneration should be structured so as to link rewards to corporate and individual performance.
The Remuneration Committee report on pages 54 to 68 sets out in detail the Group’s approach to remuneration.
D.2 ProcedureMain Principle:
There should be a formal and transparent procedure for developing policy on executive remuneration and for fixing the remuneration packages of individual Directors. No Director should be involved in deciding his or her own remuneration.
The Report of the Remuneration Committee on pages 54 to 68 sets out in detail the Group’s policy on remuneration and the remuneration packages for the Board. No Director participates in the deciding of their own remuneration. Polly Williams is Chair of the Remuneration Committee.
The Terms of Reference of the Remuneration Committee are available in the Corporate Governance section of the Company’s website www.xppower.com.
RELATIONS WITH SHAREHOLDERSE.1 Dialogue with ShareholdersMain Principle:
There should be a dialogue with Shareholders based on the mutual understanding of objectives. The Board as a whole has responsibility for ensuring that a satisfactory dialogue with Shareholders takes place.
The Group engages in two-way communication with both its institutional and private investors and responds quickly to all queries received. The Group uses its
website www.xppower.com to give private investors access to the same information that institutional investors receive in terms of investor presentations. This includes video interviews with the Chief Executive Officer and Chief Financial Officer available on the morning of the day that the interim and annual results are published. The Company also makes available a number of informational videos on its investor relations website which cover products, markets, strategy, business model, growth drivers and its investment proposition.
Interested parties are also able to register for the Group’s email alert service on this website to receive timely announcements and other information published from time to time.
The Chairman and Senior Independent Director are available to meet Shareholders if required.
The Board members receive any feedback prepared by brokers or our financial PR company following meetings with Shareholders in order to keep in touch with Shareholders’ opinions.
The Remuneration Committee consulted with major Shareholders in respect of significant decisions on Executive remuneration.
E.2 Constructive Use of the Annual General MeetingMain Principle:
The Board should use the Annual General Meeting to communicate with investors and to encourage their participation.
The Annual General Meeting is an opportunity to communicate with Shareholders and certain Directors are available to answer any questions.
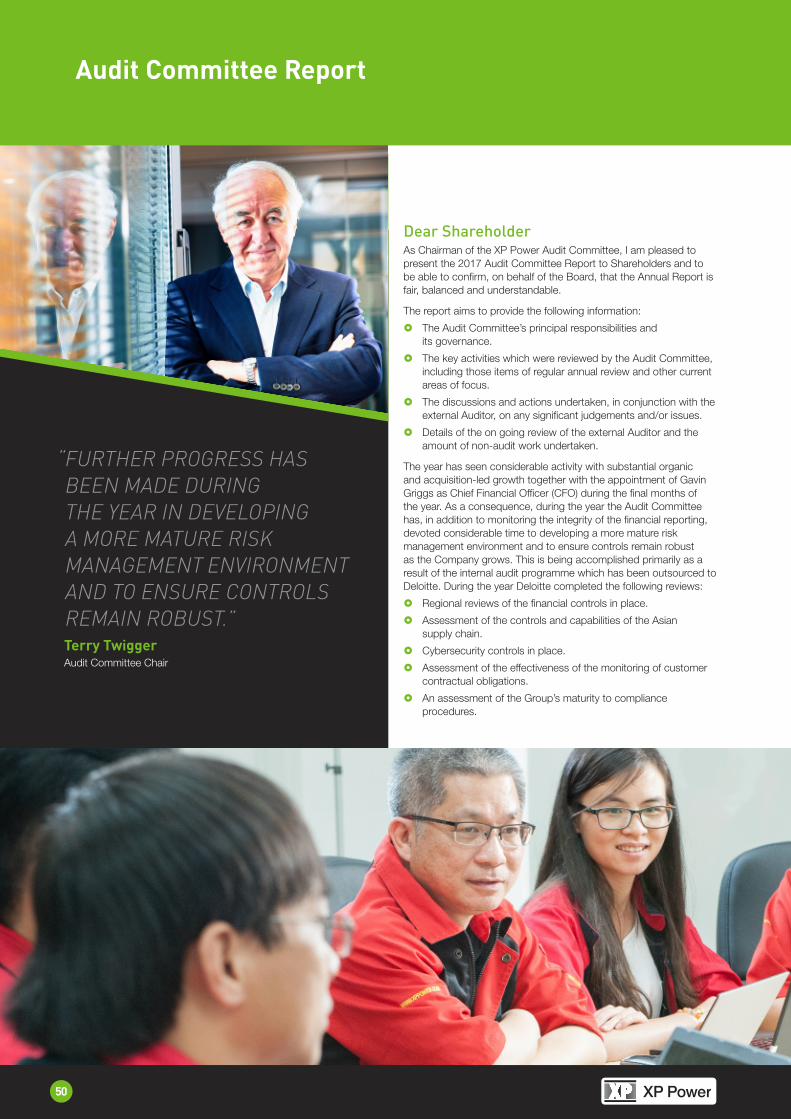
Dear ShareholderAs Chairman of the XP Power Audit Committee, I am pleased to present the 2017 Audit Committee Report to Shareholders and to be able to confirm, on behalf of the Board, that the Annual Report is fair, balanced and understandable.
The report aims to provide the following information:
} The Audit Committee’s principal responsibilities and its governance.
} The key activities which were reviewed by the Audit Committee, including those items of regular annual review and other current areas of focus.
} The discussions and actions undertaken, in conjunction with the external Auditor, on any significant judgements and/or issues.
} Details of the on going review of the external Auditor and the amount of non-audit work undertaken.
The year has seen considerable activity with substantial organic and acquisition-led growth together with the appointment of Gavin Griggs as Chief Financial Officer (CFO) during the final months of the year. As a consequence, during the year the Audit Committee has, in addition to monitoring the integrity of the financial reporting, devoted considerable time to developing a more mature risk management environment and to ensure controls remain robust as the Company grows. This is being accomplished primarily as a result of the internal audit programme which has been outsourced to Deloitte. During the year Deloitte completed the following reviews:
} Regional reviews of the financial controls in place.
} Assessment of the controls and capabilities of the Asian supply chain.
} Cybersecurity controls in place.
} Assessment of the effectiveness of the monitoring of customer contractual obligations.
} An assessment of the Group’s maturity to compliance procedures.
“ FURTHER PROGRESS HAS BEEN MADE DURING THE YEAR IN DEVELOPING A MORE MATURE RISK MANAGEMENT ENVIRONMENT AND TO ENSURE CONTROLS REMAIN ROBUST.”Terry TwiggerAudit Committee Chair
50
HeadingAudit Committee Report
Members of the Audit CommitteeTerry Twigger (Chair), Independent Non-Executive DirectorPeter Bucher, Independent Non-Executive Director Polly Williams, Independent Non-Executive Director
GovernanceThe current Audit Committee members are all independent Non-Executive Directors and have financial and/or related business experience gained in senior positions in other diverse organisations. Terry Twigger has been the Audit Committee Chair since 2015 and the Board is satisfied that Terry has recent and relevant financial experience.
Performance Evaluation of the Audit CommitteeDuring the year, the Audit Committee reviewed its performance as part of the Board’s updated evaluation process. The Audit Committee considered it had adequate qualifications and skills to perform its responsibilities, particularly through Terry Twigger’s financial and management background and Polly Williams’ financial and audit experience.
Meetings of the Audit CommitteeThe Audit Committee met four times during 2017 on the dates as follows:
Date Attendees
19 January 2017 All except Peter Bucher
6 March 2017 All
26 July 2017 All
19 October 2017 All
Peter Bucher was unable to attend the January meeting due to a prior commitment.
The Finance Director and Group Financial Controller were involved at each of the meetings as were the external Auditor, PricewaterhouseCoopers LLP, and the outsourced internal audit firm, Deloitte LLP. The Audit Committee also discussed matters with the external Auditor without the Group’s management being present.
The Audit Committee supports the Board and reports to it on a regular basis, certainly no less frequently than at every Board meeting following a meeting of the Audit Committee.
There is an annual cycle of items that are considered by the Audit Committee. The timetable of these items is scheduled in accordance with the requirement of the annual audit cycle and any other requirements of the Audit Committee.
Responsibilities of the Audit CommitteeThe Terms of Reference of the Audit Committee were reviewed during the year and are available in the Corporate Governance section of the Company’s website www.xppower.com.
The Audit Committee is responsible for, amongst other things:
} Ensuring that the financial performance of the Group is properly reported and monitored;
} Advising the Board on whether it believes the Annual Report and Accounts, taken as a whole, is fair, balanced and understandable;
} Compliance with legal requirements; } Adoption and correct implementation of
accounting standards; } Meeting the requirements of the UK
Listing Authority; } Assessing the Group’s internal control
processes and assurance framework; } Supervising the relationship and
performance of the external Auditor; and
} Reviewing the nature and extent of audit and non-audit services provided to the Group by the external Auditor.
Activities of the Audit Committee
} Reviewing and challenging the 31 December 2016 Annual Report and the 30 June 2017 Half Year Report to assess whether the reports, taken as a whole, were fair, balanced and understandable prior to recommending these to the Board for approval.
} Reviewing and challenging areas of significant risk and judgement and the level of disclosure. Some of these are described in the ‘Significant risks and judgements in the financial reporting’ section below.
} Probing and recommending for approval the going concern basis of preparation, the accounting policies and disclosures, the financial reporting issues and the assumptions and adjustments made.
These reviews continue to provide insightful perspectives and are leading to improvements in processes and controls; actions that are all the more necessary given the significant organic and acquisition growth of the Group.
In addition, during the year Ernst & Young carried out a review of the Company’s documented transfer pricing model in the light of the significant changes in international tax legislation in recent years and the Audit Committee received internal presentations on Tax and Treasury and Systems security.
I believe the Audit Committee has the necessary experience, expertise and financial understanding to fulfil its responsibilities and to continue to monitor and contribute into the various improvement initiatives.
The Audit Committee is satisfied that the Company has maintained adequate internal financial controls throughout the year, and that the internal audit programme has been devised and sufficiently resourced to confirm that these controls are effective.
The Audit Committee has proposed to the Board that the reappointment of PricewaterhouseCoopers LLP should be proposed at the forthcoming Annual General Meeting, and I hope that you will support me in this resolution.
Terry TwiggerAudit Committee Chairman01 March 2018
51
GO
VER
NA
NC
E
XP Power Annual Report & Accounts for the year ended 31 December 2017 stock code: XPP
} Continuing to develop the Group’s risk and compliance framework by guiding the outsourced internal auditors, Deloitte LLP, and reviewing the work scopes of the target areas.
} Reviewing the findings of the internal audit work and the follow ups of reviews done in the previous year.
} Reviewing the effectiveness of the Group’s internal controls and disclosures made in the Annual Report and Financial Statements.
} Challenging the assumptions and analysis produced by management in relation to the Group’s going concern and long-term viability statement.
} Reviewing the results of the finance functions’ peer to peer balance sheet reviews.
} Appraising the Group’s tax and treasury functions with a focus on areas prone to significant change.
} Assessing the accounting principles to be adopted in the preparation of the 2017 accounts including any new IFRS pronouncements.
The Audit Committee is satisfied that the Company has maintained appropriate risk management and internal controls for a company of its size throughout the year.
Significant Risks and Judgements in the Financial ReportingIn relation to the 31 December 2017 Annual Financial Statements included in this report on pages 77 to 117, the Audit Committee considered the following topics:
GoodwillThe carrying value of goodwill is a significant item within the Group’s balance sheet and is prone to further increase while the Group remains acquisitive. Impairment assessments, performed annually, require judgements in relation to discount rates and future growth forecasts to generate discounted cash flows for the cash generating units. The Audit Committee ascertains that appropriate sensitivity analysis is conducted by the external Auditor on the Company’s impairment calculations. It also assesses the carrying value in the context of the Group's wider net asset value and market capitalisation. After consideration, the Audit Committee were satisfied that there was no indication of impairment.
Capitalised product developmentThe Group’s product development activity leads to direct costs associated with new products being capitalised and amortised over the useful life of the products. The carrying value of the product development costs is rising in line with increased product development. The future success and the useful lives of these products require a degree of judgement. The Audit Committee regularly assesses the revenue streams of capitalised products that have been released for sale against their carrying value. The Audit Committee also reviews a projection of the estimated future carrying values. The Audit Committee were satisfied with the judgements used.
Deferred tax on unremitted earningsThe Group does not currently record deferred tax on the unremitted earnings held in Group subsidiaries. The Board recognises that where there is no intention to repatriate these earnings back to the parent Company, deferred tax should not be provided. The Audit Committee receive periodic updates on the unremitted earnings position including forward projections. The Audit Committee determined that there is no specific requirement to move earnings currently held in subsidiaries.
InventoryThe carrying value of the Group’s inventory has been a focus for the Audit Committee and significant progress has been made in improving finished goods inventory turns during the year. The high product mix and the effect of certain service level agreements with customers are recognised factors in the inventory levels. In addition, rapid growth and an acquisition are further reasons for an overall increase in inventory during the year. Exposure to the risk of inventory obsolescence remains an area of ongoing review. The Company’s peer to peer balance sheet reviews, which are reviewed by the Audit Committee, includes testing of the provision. The Audit Committee were satisfied with the provision.
Business combinationFollowing the acquisition of the business and assets of Comdel Inc. on 29 September 2017, the Company has performed an assessment of identifying and valuing the intangible assets with the help of a third party valuer; a process that involves judgement. The use of an independent valuer that has expertise in such judgements combined with recent experience from valuation of the EMCO intangible assets helped balance these judgements. The Audit Committee verified that the external Auditor had independently assessed these calculations and were satisfied with the values attributed to the intangible assets.
Internal ControlThe Board is ultimately responsible for the Group’s system of internal controls and the on going assessment of these further details of which are included in C.2 Risk Management and Internal Control of the Corporate Governance section on page 48.
IFRS 9 Financial Instruments (effective for annual periods beginning on or after 1 January 2018) IFRS 9 Financial Instruments is effective for accounting periods beginning on or after 1 January 2018 and replaces the existing guidance in IAS 39 Financial Instruments: Recognition and Measurement.
IFRS 9 includes revised guidance on the classification and measurement of financial instruments, impairment on financial assets and new general hedge accounting requirements. IFRS 9 relaxes the requirements for hedge effectiveness by replacing the bright line hedge effectiveness tests. It requires an economic relationship between the hedged item and hedging instrument and for the "hedged ratio" to be the same as the one management actually use for risk management purposes.
The Group has completed an initial impact assessment of IFRS 9 and determined that there will be no change in the classification and measurement of financial assets. The Group’s hedging arrangements will continue to qualify for hedge accounting upon the adoption of IFRS 9.
52
HeadingAudit Committee Report
IFRS 15 Revenue from Contracts with Customers (effective for annual periods beginning on or after 1 January 2018)IFRS 15 Revenue from Contracts with Customers is effective for accounting periods beginning on or after 1 January 2018 and establishes a comprehensive framework for determining whether, how much and when revenue is recognised. Based on an initial assessment of the adoption of IFRS 15, the Group quantify the impact as a de minimis (circa 0.02%) reduction of the total revenue as a result of the timing of the recognition of early payment discounts and volume rebate. This results in a de minimis timing impact on operating profit (less than 0.1%). On this basis, the Group does not believe it to be likely that there will be a significant impact on its consolidated financial statements.
IFRS 16 Leases (effective for annual periods beginning on or after 1 January 2019)IFRS 16 Leases is effective for accounting periods beginning on or after 1 January 2019. There will be changes to the Group’s net assets due to bringing the right of use asset relating to operating leases onto the balance sheet, and to the Group’s profit before tax as a result of the change in the treatment of the interest implicit in the lease and associated depreciation rather than the straight-line recognition of operating lease costs as they are currently recognised. The quantification of these changes and other effects on the Group is currently being assessed. The Group does not consider that any other standards, amendments or interpretations issued by the IASB, but not yet applicable, will have a significant impact on the financial statements.
Internal AuditAs the Group continues to expand in scale and complexity, the remit of the independent internal audit process by Deloitte LLP has also increased. The Audit Committee reviewed the risk framework that was developed last year in combination with the Board’s risk monitoring process to identify areas for risk assurance work and internal audits to be carried out. These included an assessment of the Group’s maturity to compliance; a review of the financial controls and capital management in the UK and USA regions; a follow up to the cybersecurity review; a logistics review comprising finished goods management, warehouse management and customer delivery; and a site visit to the Vietnam factory to assess business continuity and disaster recovery.
Findings and control observations from the reviews are rated and presented to the Audit Committee for comment or further action. The recommendations made by the internal auditors are assessed by management and addressed accordingly within an agreed timeline. The internal auditor regularly follows up on these actions and keeps the Audit Committee informed on progress against the agreed timeline.
In addition to the internal audit, the Group’s Financial Controllers conduct a formal process of peer to peer balance sheet reviews, the results of which are reported to the Audit Committee. The Audit Committee reviews and approves the scope and schedule for these reviews as a means of providing a secondary level of comfort over the financial controls.
External AuditThe current external Auditor, PricewaterhouseCoopers LLP, was appointed in 2007. The current audit engagement partner term began in 2014 with a maximum term of five years. In line with best practice, as recommended by the Financial Reporting Guideline, the external audit is anticipated to be re-tendered in
2019 at the latest. The Audit Committee has reported to the Board that the reappointment of PricewaterhouseCoopers LLP should be proposed at the forthcoming Annual General Meeting.
The Audit Committee keeps under review the role and independence of the external Auditor. A formal statement of independence is received each year together with a report on the safeguards that are in place to maintain their independence and the internal measures to ensure their objectivity. The Audit Committee is satisfied that this independence has been maintained.
The Audit Committee has formalised its policy and approved a set of procedures in relation to the appointment of external Auditors to undertake audit and non-audit work. Under this policy:
} The award of audit-related services to the Auditor in excess of £50,000 must first be approved by the Chairman of the Audit Committee, who in his decision to approve will take into account the aggregate of audit-related revenue already earned by the Auditor in that year. Audit-related services include formalities relating to borrowing, shareholder and other circulars, regulatory reports, work relating to disposals and acquisitions, tax assurance work and advice on accounting policies;
} The award of tax consulting services to the Auditor in excess of £50,000, subject to compliance with the EU member state restrictions, must first be approved by the Chairman of the Audit Committee;
} The award of other non-audit related services to the Auditor in excess of £20,000 must first be approved by the Chairman of the Audit Committee.
During the year, no non-audit fees were paid to the Auditor (2016: £25,000).
53
GO
VER
NA
NC
E
XP Power Annual Report & Accounts for the year ended 31 December 2017 stock code: XPP
w
“ THE REMUNERATION POLICY AND THE LONG-TERM INCENTIVE PLAN (LTIP) DESIGNED TO REPLACE THE SHARE OPTION PLAN WERE BOTH APPROVED AT THE LAST ANNUAL GENERAL MEETING.”Polly Williams Remuneration Committee Chair
As Chair of the XP Power Remuneration Committee, I am pleased to present the 2017 Remuneration Committee Report on behalf of the Board.
The Remuneration Policy and the Long-Term Incentive Plan (LTIP) designed to replace the Share Option Plan were both approved at the 2017 Annual General Meeting. LTIP awards under the new plan were made during the year to Executive Directors and key management personnel. As well as the incentive and retention benefits these awards provide, they also align rewards with the long-term nature of the Group’s design-in cycles and revenue annuities.
The Remuneration Committee's main focus during the year was on the fixed elements of the Executive Directors’ remuneration. Following the benchmarking report that the Remuneration Committee commissioned the previous year, it was evident that these elements of pay were not in line with market rates for a company with the scale and complexity of XP Power. The practical implications of this were clear during our search to attract a new Chief Financial Officer (CFO) with the appropriate experience to complement both the organic and acquisition growth aspirations of the Group and our discussions with him. In addition, a significant increase has been made to the base pay of the Chief Executive Officer (CEO) with effect from 1 January 2018. Further details of the remuneration packages of the CEO and CFO are in the Remuneration Report on pages 60 to 68.
As well as reviewing the Directors’ remuneration packages, the Remuneration Committee also keeps under review the fixed and variable elements of the key management personnel within the Group to ensure they comprise sufficient reward to motivate and retain.
The Group performed strongly during 2017 with adjusted pre-tax profits rising from £28.6 million in 2016 to £36.1 million in 2017, an increase of 26.2%. As a result of this strong performance, annual bonuses will be paid to Executive Directors at the upper end of the spectrum with the CEO’s bonus at the 100% cap of salary of £260,000. No long-term incentive awards were due to vest in 2017.
The Remuneration Committee was pleased that the revised policy and new LTIP received strong Shareholder support with 96.2% of votes cast being in favour of both resolutions. The level of support for the advisory vote on the Remuneration Report was lower, at 90.5%, and the Remuneration Committee recognised that proxy advisers and some Shareholders made some comments on our Executive remuneration, principally on our disclosures on annual bonuses. We have therefore reviewed all disclosures thoroughly with an advisor, and increased the level of disclosure on annual bonuses in this report. We communicated with our largest Shareholders, covering over 57% of the register, on these changes and also informed them of the details of the new packages of the CEO and CFO.
We seek your support for the Annual Report on Remuneration and the Remuneration Committee welcomes any further comments from Shareholders with respect to our approach to remuneration.
IntroductionThis report is on the activities of the Remuneration Committee for the period to 31 December 2017. It sets out the Remuneration Policy and remuneration details for the Executive and Non-Executive Directors of the Company. It has been prepared in accordance with Schedule 8 of The Large and Medium-sized Companies and Groups (Accounts and Reports) (Amendment) Regulations 2013.
The report is split into two areas:
} The annual report on remuneration; and
} The policy report.
The policy report was approved by a binding Shareholder vote at the 2017 Annual General Meeting and the policy took effect from the date on which that resolution was passed. The policy report is not subject to audit.
The annual report on remuneration provides details on remuneration in the period together with other information required by the Regulations. It will be subject to an advisory Shareholder vote at the 2018 Annual General Meeting. The Auditor has reviewed certain parts of the Directors’ Remuneration Report and is required to report if the information is materially inconsistent with the financial statements.
Polly WilliamsRemuneration Committee Chair
54
HeadingRemuneration Committee Report
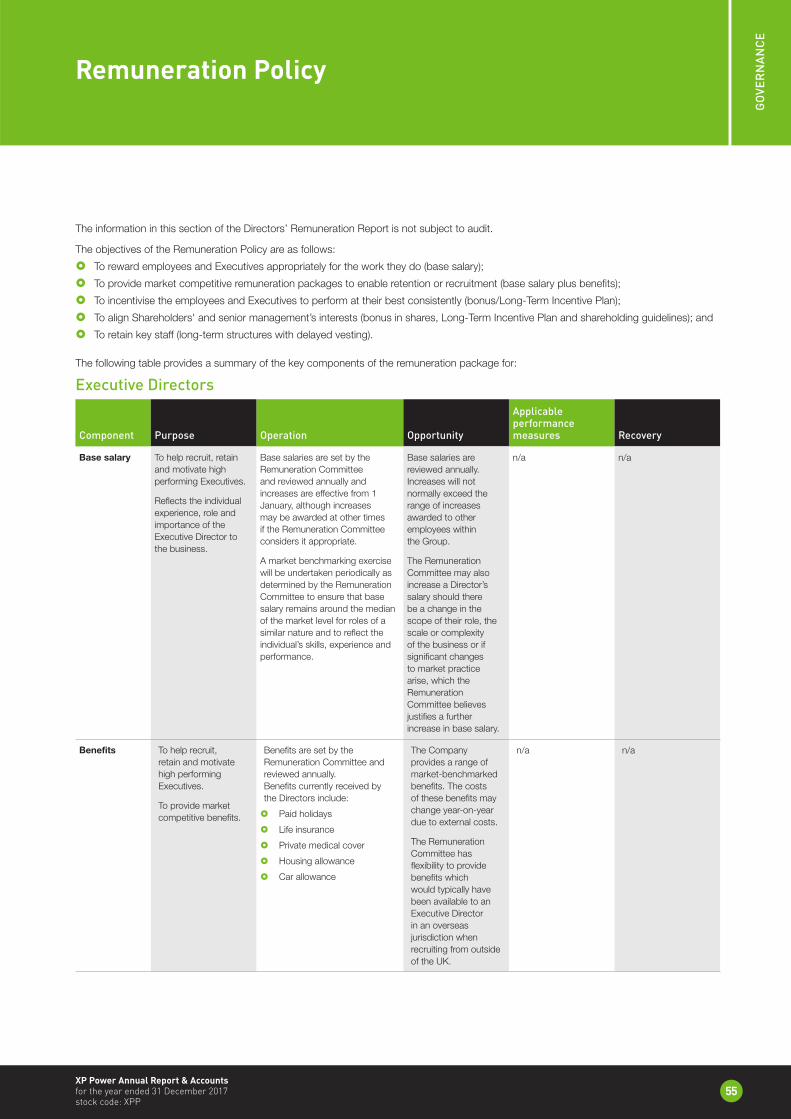
55
GO
VER
NA
NC
E
XP Power Annual Report & Accounts for the year ended 31 December 2017 stock code: XPP
Remuneration Policy
The information in this section of the Directors’ Remuneration Report is not subject to audit.
The objectives of the Remuneration Policy are as follows:
} To reward employees and Executives appropriately for the work they do (base salary);
} To provide market competitive remuneration packages to enable retention or recruitment (base salary plus benefits);
} To incentivise the employees and Executives to perform at their best consistently (bonus/Long-Term Incentive Plan);
} To align Shareholders' and senior management’s interests (bonus in shares, Long-Term Incentive Plan and shareholding guidelines); and
} To retain key staff (long-term structures with delayed vesting).
The following table provides a summary of the key components of the remuneration package for:
Executive Directors
Component Purpose Operation Opportunity
Applicable performance measures Recovery
Base salary To help recruit, retain and motivate high performing Executives.
Reflects the individual experience, role and importance of the Executive Director to the business.
Base salaries are set by the Remuneration Committee and reviewed annually and increases are effective from 1 January, although increases may be awarded at other times if the Remuneration Committee considers it appropriate.
A market benchmarking exercise will be undertaken periodically as determined by the Remuneration Committee to ensure that base salary remains around the median of the market level for roles of a similar nature and to reflect the individual’s skills, experience and performance.
Base salaries are reviewed annually. Increases will not normally exceed the range of increases awarded to other employees within the Group.
The Remuneration Committee may also increase a Director’s salary should there be a change in the scope of their role, the scale or complexity of the business or if significant changes to market practice arise, which the Remuneration Committee believes justifies a further increase in base salary.
n/a n/a
Benefits To help recruit, retain and motivate high performing Executives.
To provide market competitive benefits.
Benefits are set by the Remuneration Committee and reviewed annually.Benefits currently received by the Directors include:
} Paid holidays
} Life insurance
} Private medical cover
} Housing allowance
} Car allowance
The Company provides a range of market-benchmarked benefits. The costs of these benefits may change year-on-year due to external costs.
The Remuneration Committee has flexibility to provide benefits which would typically have been available to an Executive Director in an overseas jurisdiction when recruiting from outside of the UK.
n/a n/a
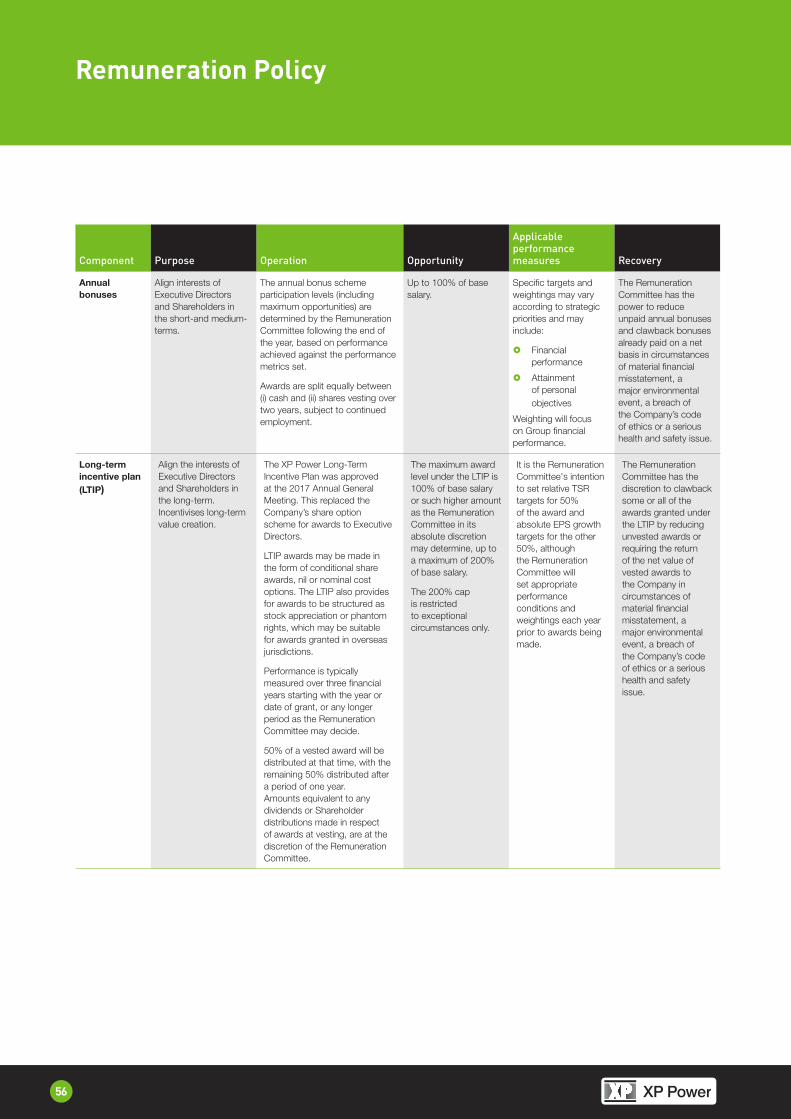
56
HeadingRemuneration Policy
Component Purpose Operation Opportunity
Applicable performance measures Recovery
Annual bonuses
Align interests of Executive Directors and Shareholders in the short-and medium-terms.
The annual bonus scheme participation levels (including maximum opportunities) are determined by the Remuneration Committee following the end of the year, based on performance achieved against the performance metrics set.
Awards are split equally between (i) cash and (ii) shares vesting over two years, subject to continued employment.
Up to 100% of base salary.
Specific targets and weightings may vary according to strategic priorities and may include:
} Financial performance
} Attainment of personal objectives
Weighting will focus on Group financial performance.
The Remuneration Committee has the power to reduce unpaid annual bonuses and clawback bonuses already paid on a net basis in circumstances of material financial misstatement, a major environmental event, a breach of the Company’s code of ethics or a serious health and safety issue.
Long-term incentive plan (LTIP)
Align the interests of Executive Directors and Shareholders in the long-term.Incentivises long-term value creation.
The XP Power Long-Term Incentive Plan was approved at the 2017 Annual General Meeting. This replaced the Company’s share option scheme for awards to Executive Directors.
LTIP awards may be made in the form of conditional share awards, nil or nominal cost options. The LTIP also provides for awards to be structured as stock appreciation or phantom rights, which may be suitable for awards granted in overseas jurisdictions.
Performance is typically measured over three financial years starting with the year or date of grant, or any longer period as the Remuneration Committee may decide.
50% of a vested award will be distributed at that time, with the remaining 50% distributed after a period of one year. Amounts equivalent to any dividends or Shareholder distributions made in respect of awards at vesting, are at the discretion of the Remuneration Committee.
The maximum award level under the LTIP is 100% of base salary or such higher amount as the Remuneration Committee in its absolute discretion may determine, up to a maximum of 200% of base salary.
The 200% cap is restricted to exceptional circumstances only.
It is the Remuneration Committee's intention to set relative TSR targets for 50% of the award and absolute EPS growth targets for the other 50%, although the Remuneration Committee will set appropriate performance conditions and weightings each year prior to awards being made.
The Remuneration Committee has the discretion to clawback some or all of the awards granted under the LTIP by reducing unvested awards or requiring the return of the net value of vested awards to the Company in circumstances of material financial misstatement, a major environmental event, a breach of the Company’s code of ethics or a serious health and safety issue.
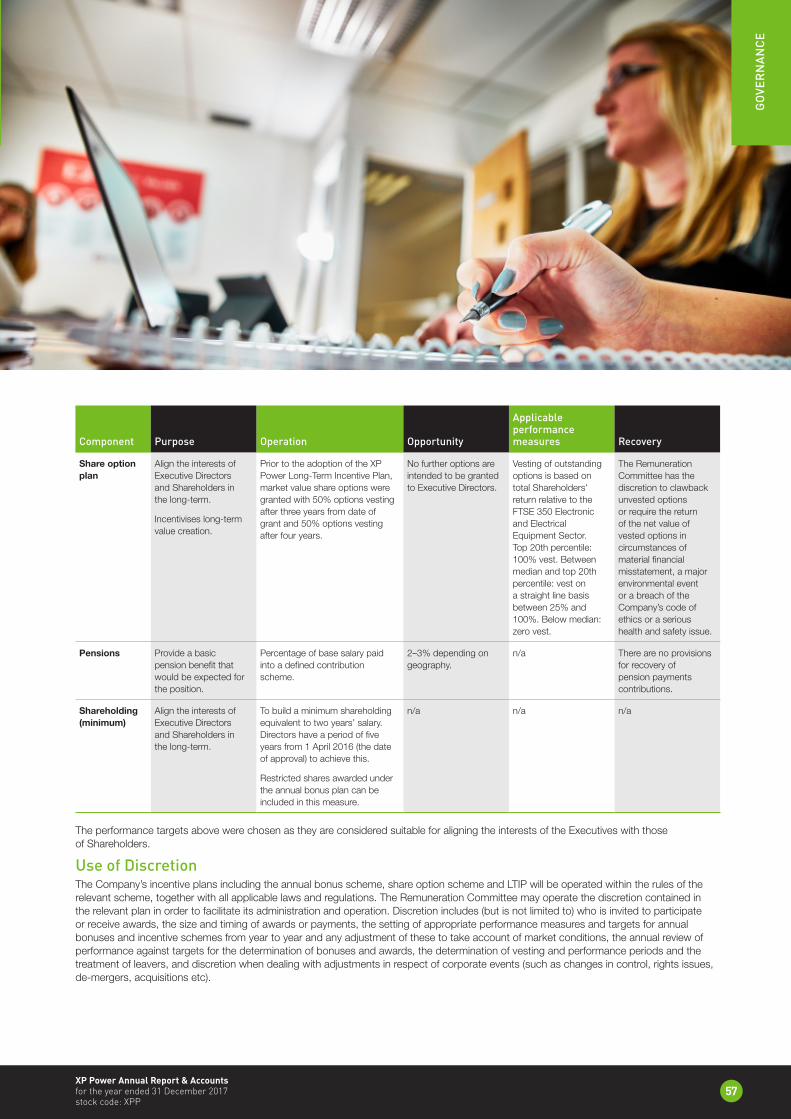
57
GO
VER
NA
NC
E
XP Power Annual Report & Accounts for the year ended 31 December 2017 stock code: XPP
Component Purpose Operation Opportunity
Applicable performance measures Recovery
Share option plan
Align the interests of Executive Directors and Shareholders in the long-term.
Incentivises long-term value creation.
Prior to the adoption of the XP Power Long-Term Incentive Plan, market value share options were granted with 50% options vesting after three years from date of grant and 50% options vesting after four years.
No further options are intended to be granted to Executive Directors.
Vesting of outstanding options is based on total Shareholders' return relative to the FTSE 350 Electronic and Electrical Equipment Sector. Top 20th percentile: 100% vest. Between median and top 20th percentile: vest on a straight line basis between 25% and 100%. Below median: zero vest.
The Remuneration Committee has the discretion to clawback unvested options or require the return of the net value of vested options in circumstances of material financial misstatement, a major environmental event or a breach of the Company’s code of ethics or a serious health and safety issue.
Pensions Provide a basic pension benefit that would be expected for the position.
Percentage of base salary paid into a defined contribution scheme.
2–3% depending on geography.
n/a There are no provisions for recovery of pension payments contributions.
Shareholding (minimum)
Align the interests of Executive Directors and Shareholders in the long-term.
To build a minimum shareholding equivalent to two years’ salary. Directors have a period of five years from 1 April 2016 (the date of approval) to achieve this.
Restricted shares awarded under the annual bonus plan can be included in this measure.
n/a n/a n/a
The performance targets above were chosen as they are considered suitable for aligning the interests of the Executives with those of Shareholders.
Use of DiscretionThe Company’s incentive plans including the annual bonus scheme, share option scheme and LTIP will be operated within the rules of the relevant scheme, together with all applicable laws and regulations. The Remuneration Committee may operate the discretion contained in the relevant plan in order to facilitate its administration and operation. Discretion includes (but is not limited to) who is invited to participate or receive awards, the size and timing of awards or payments, the setting of appropriate performance measures and targets for annual bonuses and incentive schemes from year to year and any adjustment of these to take account of market conditions, the annual review of performance against targets for the determination of bonuses and awards, the determination of vesting and performance periods and the treatment of leavers, and discretion when dealing with adjustments in respect of corporate events (such as changes in control, rights issues, de-mergers, acquisitions etc).
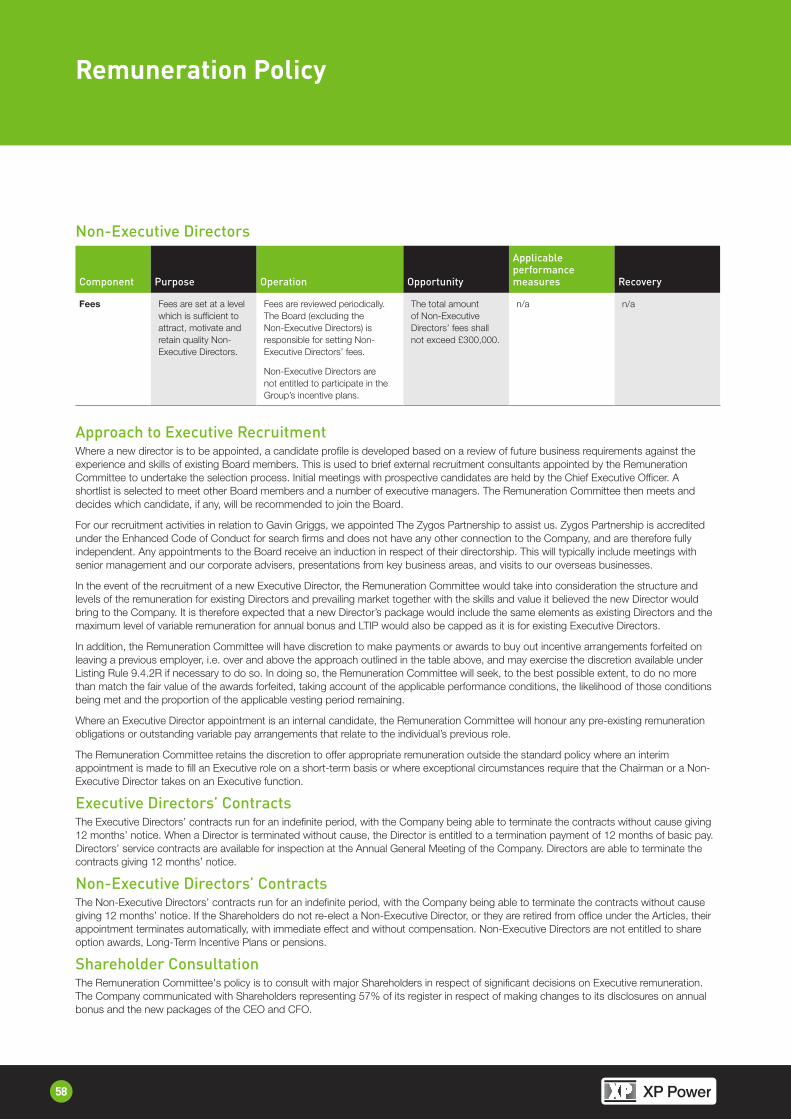
58
HeadingRemuneration Policy
Non-Executive Directors
Component Purpose Operation Opportunity
Applicable performance measures Recovery
Fees Fees are set at a level which is sufficient to attract, motivate and retain quality Non-Executive Directors.
Fees are reviewed periodically. The Board (excluding the Non-Executive Directors) is responsible for setting Non-Executive Directors’ fees.
Non-Executive Directors are not entitled to participate in the Group’s incentive plans.
The total amount of Non-Executive Directors’ fees shall not exceed £300,000.
n/a n/a
Approach to Executive RecruitmentWhere a new director is to be appointed, a candidate profile is developed based on a review of future business requirements against the experience and skills of existing Board members. This is used to brief external recruitment consultants appointed by the Remuneration Committee to undertake the selection process. Initial meetings with prospective candidates are held by the Chief Executive Officer. A shortlist is selected to meet other Board members and a number of executive managers. The Remuneration Committee then meets and decides which candidate, if any, will be recommended to join the Board.
For our recruitment activities in relation to Gavin Griggs, we appointed The Zygos Partnership to assist us. Zygos Partnership is accredited under the Enhanced Code of Conduct for search firms and does not have any other connection to the Company, and are therefore fully independent. Any appointments to the Board receive an induction in respect of their directorship. This will typically include meetings with senior management and our corporate advisers, presentations from key business areas, and visits to our overseas businesses.
In the event of the recruitment of a new Executive Director, the Remuneration Committee would take into consideration the structure and levels of the remuneration for existing Directors and prevailing market together with the skills and value it believed the new Director would bring to the Company. It is therefore expected that a new Director’s package would include the same elements as existing Directors and the maximum level of variable remuneration for annual bonus and LTIP would also be capped as it is for existing Executive Directors.
In addition, the Remuneration Committee will have discretion to make payments or awards to buy out incentive arrangements forfeited on leaving a previous employer, i.e. over and above the approach outlined in the table above, and may exercise the discretion available under Listing Rule 9.4.2R if necessary to do so. In doing so, the Remuneration Committee will seek, to the best possible extent, to do no more than match the fair value of the awards forfeited, taking account of the applicable performance conditions, the likelihood of those conditions being met and the proportion of the applicable vesting period remaining.
Where an Executive Director appointment is an internal candidate, the Remuneration Committee will honour any pre-existing remuneration obligations or outstanding variable pay arrangements that relate to the individual’s previous role.
The Remuneration Committee retains the discretion to offer appropriate remuneration outside the standard policy where an interim appointment is made to fill an Executive role on a short-term basis or where exceptional circumstances require that the Chairman or a Non-Executive Director takes on an Executive function.
Executive Directors’ ContractsThe Executive Directors’ contracts run for an indefinite period, with the Company being able to terminate the contracts without cause giving 12 months’ notice. When a Director is terminated without cause, the Director is entitled to a termination payment of 12 months of basic pay. Directors’ service contracts are available for inspection at the Annual General Meeting of the Company. Directors are able to terminate the contracts giving 12 months’ notice.
Non-Executive Directors’ ContractsThe Non-Executive Directors’ contracts run for an indefinite period, with the Company being able to terminate the contracts without cause giving 12 months’ notice. If the Shareholders do not re-elect a Non-Executive Director, or they are retired from office under the Articles, their appointment terminates automatically, with immediate effect and without compensation. Non-Executive Directors are not entitled to share option awards, Long-Term Incentive Plans or pensions.
Shareholder ConsultationThe Remuneration Committee's policy is to consult with major Shareholders in respect of significant decisions on Executive remuneration. The Company communicated with Shareholders representing 57% of its register in respect of making changes to its disclosures on annual bonus and the new packages of the CEO and CFO.
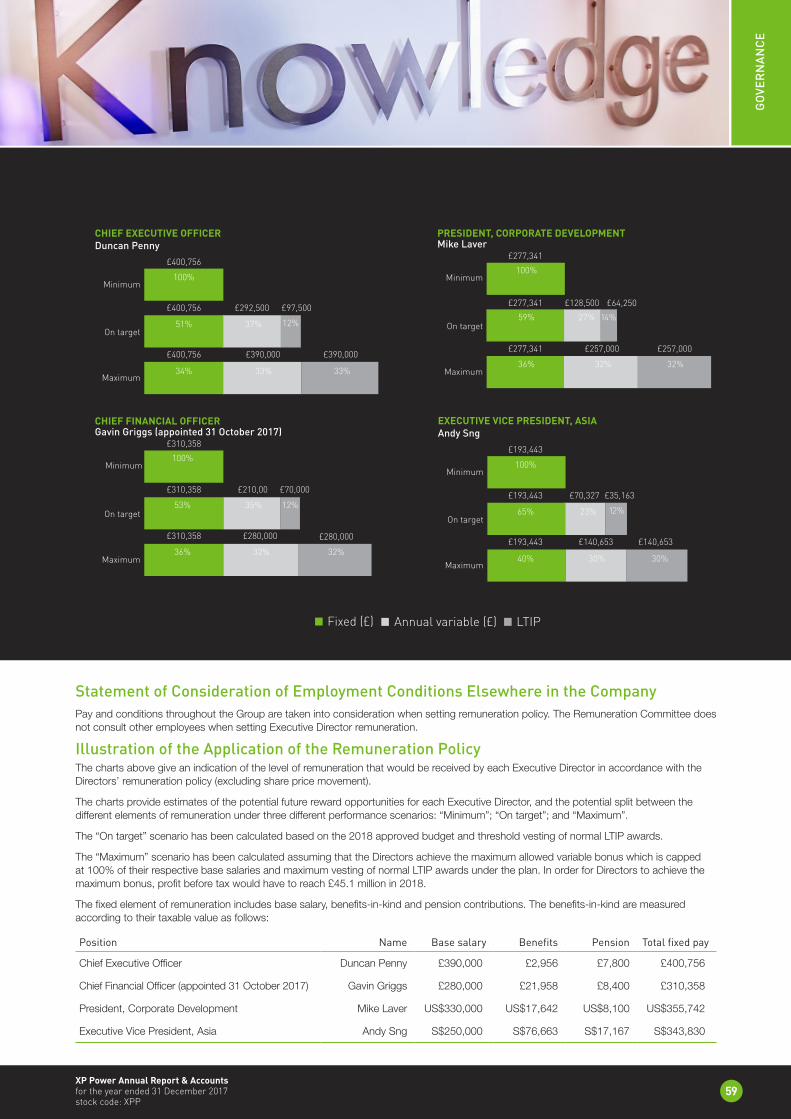
59
GO
VER
NA
NC
E
XP Power Annual Report & Accounts for the year ended 31 December 2017 stock code: XPP
Statement of Consideration of Employment Conditions Elsewhere in the Company Pay and conditions throughout the Group are taken into consideration when setting remuneration policy. The Remuneration Committee does not consult other employees when setting Executive Director remuneration.
Illustration of the Application of the Remuneration PolicyThe charts above give an indication of the level of remuneration that would be received by each Executive Director in accordance with the Directors’ remuneration policy (excluding share price movement).
The charts provide estimates of the potential future reward opportunities for each Executive Director, and the potential split between the different elements of remuneration under three different performance scenarios: “Minimum”; “On target”; and “Maximum”.
The “On target” scenario has been calculated based on the 2018 approved budget and threshold vesting of normal LTIP awards.
The “Maximum” scenario has been calculated assuming that the Directors achieve the maximum allowed variable bonus which is capped at 100% of their respective base salaries and maximum vesting of normal LTIP awards under the plan. In order for Directors to achieve the maximum bonus, profit before tax would have to reach £45.1 million in 2018.
The fixed element of remuneration includes base salary, benefits-in-kind and pension contributions. The benefits-in-kind are measured according to their taxable value as follows:
Position Name Base salary Benefits Pension Total fixed pay
Chief Executive Officer Duncan Penny £390,000 £2,956 £7,800 £400,756
Chief Financial Officer (appointed 31 October 2017) Gavin Griggs £280,000 £21,958 £8,400 £310,358
President, Corporate Development Mike Laver US$330,000 US$17,642 US$8,100 US$355,742
Executive Vice President, Asia Andy Sng S$250,000 S$76,663 S$17,167 S$343,830
£400,756
£400,756 £292,500
£400,756 £390,000
£277,341
£277,341 £128,500
£277,341 £257,000
Minimum
On target
Maximum
Minimum
On target
Maximum
Duncan Penny Mike LaverCHIEF EXECUTIVE OFFICER PRESIDENT, CORPORATE DEVELOPMENT
Fixed (£)
0 200 400 600 800 1000 1200
£310,358
£310,358 £210,00
£310,358 £280,000
Minimum
On target
Maximum
Gavin Griggs (appointed 31 October 2017)CHIEF FINANCIAL OFFICER
100%
53% 35%
£70,000
12%
36% 32%
£280,000
32%
100%
51% 37%
£97,500
12%
34% 33%
£390,000
33%
100%
59% 27%
£64,250
14%
36% 32%
£257,000
32%
£193,443
£193,443 £70,327
£193,443 £140,653
Minimum
On target
Maximum
Andy SngEXECUTIVE VICE PRESIDENT, ASIA
100%
65% 23%
£35,163
12%
40% 30%
£140,653
30%
LTIPAnnual variable (£)
60
HeadingRemuneration Report – Annual Report
Responsibilities of the Remuneration CommitteeExecutive remuneration packages are prudently designed to attract, motivate and retain Directors of the high calibre needed to maintain the Group’s position and to reward them for enhancing Shareholder value. It is the responsibility of the Remuneration Committee to consider the experience and value the individual Directors contribute to the Group; measure the performance of the Executive Directors and key members of senior management and determine of their annual remuneration package.
Members of the Remuneration CommitteePolly Williams (Chair), Independent Non-Executive Director
Peter Bucher, Independent Non-Executive Director
Terry Twigger, Independent Non-Executive Director
Meetings of the Remuneration CommitteeThe Remuneration Committee met four times during 2017 with attendance on the dates as follows:
Date Attendees
6 March 2017 All
9 June 2017 All except Peter Bucher
6 October 2017 All
8 December 2017 All
Peter Bucher was unable to attend the June meeting due to a prior commitment.
Performance Evaluation of the Remuneration CommitteeDuring the year, the Remuneration Committee reviewed its performance as part of the Board’s evaluation process. The Remuneration Committee considered it had adequate skills and experience to perform its responsibilities and, where considered appropriate, employs the services of outside remuneration consultants. The Remuneration Committee used advisory services as outlined on page 68.
Remuneration for the Executive DirectorsThere are five main elements of the remuneration package for Executive Directors and senior management:
} Basic annual salary;
} Benefits-in-kind;
} Pension arrangements;
} Annual bonus; and
} Long-term share incentives.
The Company’s policy is that a significant proportion of the remuneration of the Executive Directors should be performance-related. As described below, Executive Directors may earn an annual bonus together with the long-term benefits of participation in share award schemes.
The Remuneration Committee makes recommendations to the Board. No Director plays a part in any discussion regarding his or her own remuneration.
Basic salaryDirectors’ basic salaries are reviewed by the Remuneration Committee each year and when an individual changes position or responsibility. Basic salaries for all Directors were reviewed against a benchmarking study that had been commissioned by the Remuneration Committee at the end of the previous year. The companies used in the study were assessed for their suitability and relevance to the Company. No changes were made to base salaries for the year commencing 1 January 2017.
Gavin Griggs was appointed CFO on 31 October 2017 with a base salary of £280,000.
61
GO
VER
NA
NC
E
XP Power Annual Report & Accounts for the year ended 31 December 2017 stock code: XPP
Benefits-in-kindThe Executive and Non-Executive Directors receive certain benefits-in-kind, principally life assurance and private medical insurance. In addition, Gavin Griggs receives a car allowance and Andy Sng receives a housing allowance relating to his relocation to Shanghai where he spends approximately half his time.
Pension ArrangementsIn the UK, the Group operates a “Stakeholder Pension Scheme” and contributes 3% of base salary into this scheme on behalf of the participants including Executive Directors.
In the USA, the Group operates a defined contribution “401K Plan”. The Group matches the participants’ contribution to this plan, includes Executive Directors, up to 3% of the Director’s salary and bonus.
Annual BonusesThe Remuneration Committee establishes the profit thresholds that must be met for each financial year before a cash or share bonus is to be paid. Account is also taken of the relative success of the different parts of the business for which the Executive Directors are responsible.
2017 performance targets for Executive Directors other than Andy Sng
Target Weighting Threshold Target Stretch / max Actual
Adjusted profit before tax 100% £25.7m £31.5m £35.3m – £44.9m £36.1m
Percentage of salary for Executive Directors at different levels of performance
Duncan Penny £260,000 0% 60% 100%* 100%
Gavin Griggs (appointed 31 October 2017) £47,744 0% 40% 100% 72%
Mike Laver £257,272 0% 30% 100%* 54%
Jonathan Rhodes (resigned from Board 31 October 2017) £140,000 0% 40% 100%* 72%
2017 performance target for Andy Sng – Executive Vice President, Asia
Target Weighting Threshold Target Stretch / max Actual
Asia gross margin 100% US$2.0m US$6.4m US$22.9m US$6.8m
Percentage of salary paid for Andy Sng at different levels of performance £126,608 0% 21% 100% 22%
* To meet the 100% bonus pay out for each of these Executive Directors, the corresponding adjusted profit before tax target are as follows: Duncan Penny - £35.3 million, Mike Laver - £44.9 million and Jonathan Rhodes - £40.1 million.
The 2017 annual bonus for Duncan Penny, Jonathan Rhodes and Mike Laver was based solely on the Group’s adjusted profit before tax. The threshold for bonuses to start was £25.7 million with on-target performance set at £31.5 million, 10% ahead of adjusted profit before tax achieved in 2016. The bonus was structured on a linear pro-rata basis. Gavin Griggs’ 2017 bonus was pro-rated to reflect his date of joining of 31 October 2017.
In line with the Remuneration Policy, 50% of annual bonuses will be paid out and the remaining 50% will be awarded in shares vesting over two years from 31 December 2017. The details of each Executive Director are shown in the table on page 65.
62
HeadingRemuneration Report – Annual Report
Long-Term Share IncentivesDetails of all outstanding long-term incentive awards and deferred bonus awards held by Executive Directors are laid out later in this report. Details of the terms and performance conditions applied to each round of awards are set out below.
Long-Term Incentive PlanThe Group operated the XP Power Limited Long-Term Incentive Plan (LTIP) as approved by Shareholders at the 2017 Annual General Meeting. This replaced the Company’s Share Option Plan for equity awards to Executive Directors.
LTIP awards may be made in the form of conditional share awards, nil or nominal cost options or deferred cash. The LTIP will also provide for awards to be structured as stock appreciation or phantom rights, which may be suitable for awards granted in overseas jurisdictions.
The vesting of these awards depends on two separate performance conditions over a three-year period as outlined below. 50% of the award will vest three years after the grant date with the remaining 50% vesting 12 months later. Vesting at threshold performance levels is 25% of the maximum.
Up to 50% of the total Shares subject to the Award will vest dependent upon compound annual growth rates of adjusted Earnings Per Share (EPS) over a three-year period.
Adjusted EPS performance Vesting
10% compound annual growth 100%
5% compound annual growth 25%
Below 5% compound annual growth No vesting
Vesting between the 5% and 10% adjusted EPS targets will be measured on a straight-line basis.
Up to 50% of the total Shares subject to the Award will vest dependent upon the achievement of the Company’s Total Shareholder Return (“TSR”) measured against that of the FTSE 250 over the same three-year period.
TSR performance Vesting
75th percentile 100%
Median (50th percentile) 25%
Below the median No vesting
Vesting between the median and the 75th percentile will be measured on a straight-line basis.
On 30 May 2017, 39,400 nominal-priced options were awarded under this plan including to Executive Directors. The performance period for the EPS and TSR condition is measured from 1 January 2017 to 31 December 2019.
On 1 November 2017, 8,000 nominal-priced options were awarded to Gavin Griggs under this plan. The performance period for the EPS and TSR condition is measured from 1 January 2018 to 31 December 2020.
The detail of the LTIP awards by Executive Director is shown in the table on page 66.
Share Option PlansThe Group operated The XP Power Share Option Plan (the “Plan”) as approved by the Shareholders on 2 April 2012. This Plan allowed the Company to grant options up to 1,924,229 shares, representing 10% of the issued share capital at the time the Plan was set up.
Some of the share options awarded to Executive Directors under this Plan have not vested. The share options granted in February 2016 vest 50% after three years and 50% after four years, subject to the performance condition being met. Vesting of these outstanding options is based on Total Shareholder Return relative to the FTSE 350 Electronic and Electrical Equipment Sector.
No awards were due to vest in 2017.
At 31 December 2017, the total number of unvested share options in this scheme was 385,000. Their potential value, assuming 100% of the awards vest using the closing share price of £34.30 on 31 December 2017, was £7,266,875.
The detail of historic Share Option Plan awards by Executive Director is shown in the table on page 66.
No further options are intended to be granted to Executive Directors or employees under this Plan.
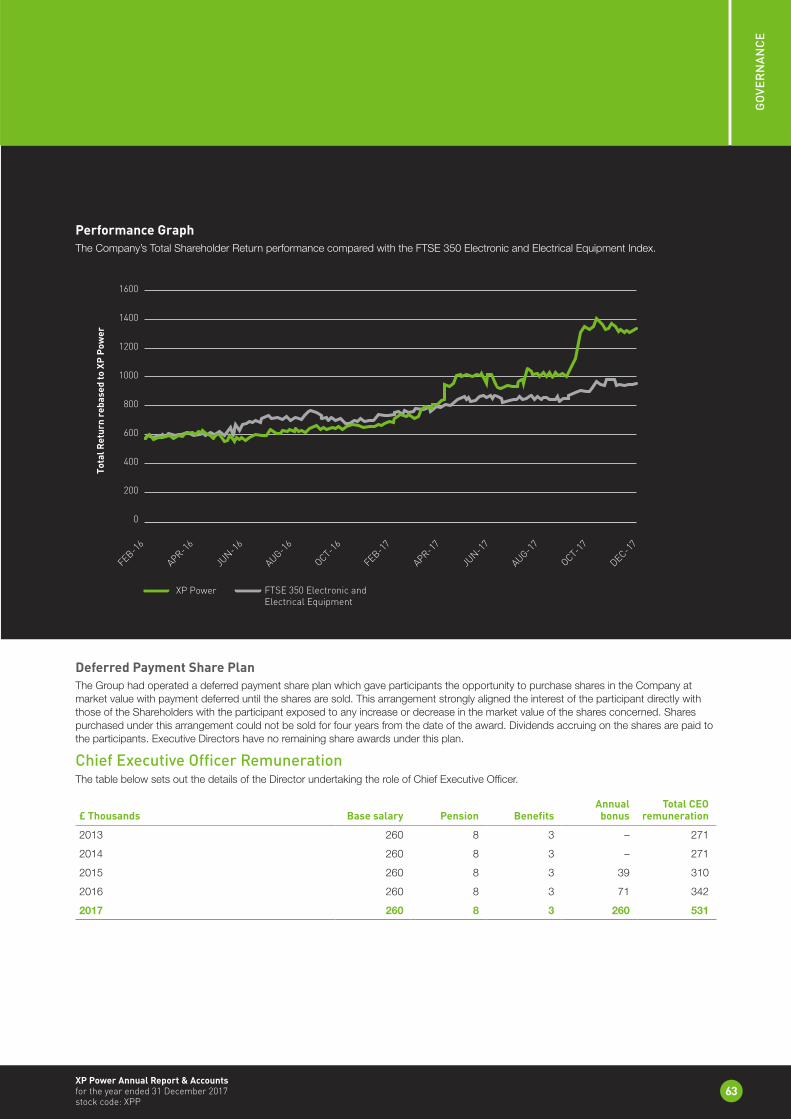
63
GO
VER
NA
NC
E
XP Power Annual Report & Accounts for the year ended 31 December 2017 stock code: XPP
Performance GraphThe Company’s Total Shareholder Return performance compared with the FTSE 350 Electronic and Electrical Equipment Index.
0
200
400
600
800
1000
1200
1400
1600
Tota
l Ret
urn
reba
sed
to X
P Po
wer
XP Power FTSE 350 Electronic and Electrical Equipment
FEB-16
DEC-17
OCT-17
AUG-17
JUN-1
7
APR-17
FEB-17
JUN-1
6
AUG-16
OCT-16
APR-16
Deferred Payment Share PlanThe Group had operated a deferred payment share plan which gave participants the opportunity to purchase shares in the Company at market value with payment deferred until the shares are sold. This arrangement strongly aligned the interest of the participant directly with those of the Shareholders with the participant exposed to any increase or decrease in the market value of the shares concerned. Shares purchased under this arrangement could not be sold for four years from the date of the award. Dividends accruing on the shares are paid to the participants. Executive Directors have no remaining share awards under this plan.
Chief Executive Officer RemunerationThe table below sets out the details of the Director undertaking the role of Chief Executive Officer.
£ Thousands Base salary Pension BenefitsAnnual
bonus Total CEO
remuneration
2013 260 8 3 – 271
2014 260 8 3 – 271
2015 260 8 3 39 310
2016 260 8 3 71 342
2017 260 8 3 260 531
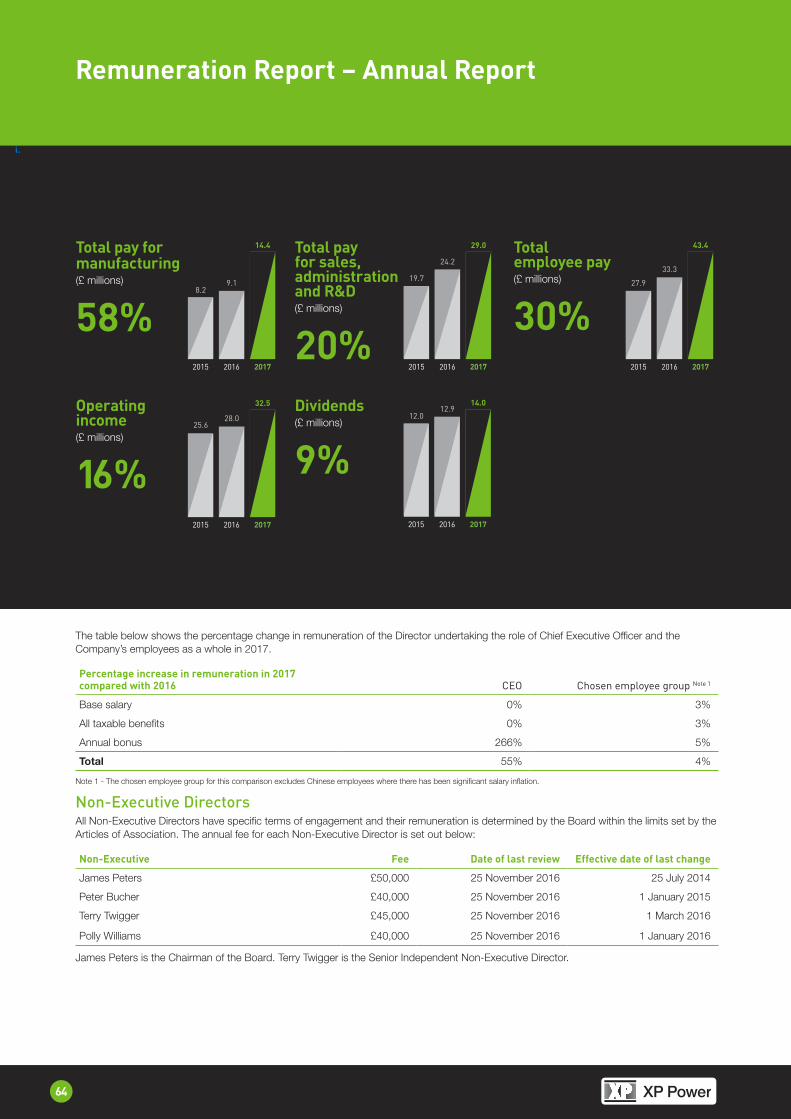
64
HeadingRemuneration Report – Annual Report
The table below shows the percentage change in remuneration of the Director undertaking the role of Chief Executive Officer and the Company’s employees as a whole in 2017.
Percentage increase in remuneration in 2017 compared with 2016 CEO Chosen employee group Note 1
Base salary 0% 3%
All taxable benefits 0% 3%
Annual bonus 266% 5%
Total 55% 4%
Note 1 - The chosen employee group for this comparison excludes Chinese employees where there has been significant salary inflation.
Non-Executive DirectorsAll Non-Executive Directors have specific terms of engagement and their remuneration is determined by the Board within the limits set by the Articles of Association. The annual fee for each Non-Executive Director is set out below:
Non-Executive Fee Date of last review Effective date of last change
James Peters £50,000 25 November 2016 25 July 2014
Peter Bucher £40,000 25 November 2016 1 January 2015
Terry Twigger £45,000 25 November 2016 1 March 2016
Polly Williams £40,000 25 November 2016 1 January 2016
James Peters is the Chairman of the Board. Terry Twigger is the Senior Independent Non-Executive Director.
i.
Total pay for manufacturing(£ millions)
58%2015 2016 2017
14.4
9.18.2
Operating income(£ millions)
16%2015 2016 2017
32.5
28.025.6
Total pay for sales, administration and R&D(£ millions)
20%2015 2016 2017
29.0
24.2
19.7
Dividends(£ millions)
9%2015 2016 2017
14.012.9
12.0
Total employee pay(£ millions)
30%2015 2016 2017
43.4
33.3
27.9
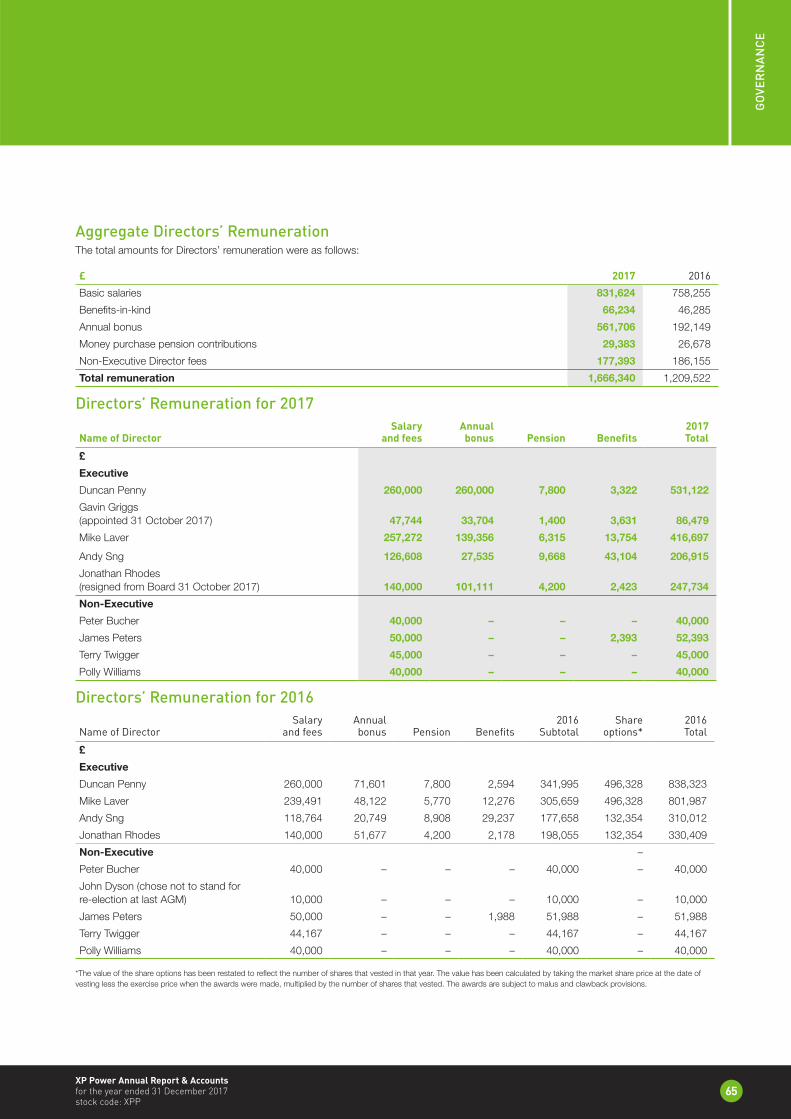
65
GO
VER
NA
NC
E
XP Power Annual Report & Accounts for the year ended 31 December 2017 stock code: XPP
Aggregate Directors’ RemunerationThe total amounts for Directors’ remuneration were as follows:
£ 2017 2016
Basic salaries 831,624 758,255
Benefits-in-kind 66,234 46,285
Annual bonus 561,706 192,149
Money purchase pension contributions 29,383 26,678
Non-Executive Director fees 177,393 186,155
Total remuneration 1,666,340 1,209,522
Directors’ Remuneration for 2017
Name of DirectorSalary
and feesAnnual
bonus Pension Benefits2017 Total
£
Executive
Duncan Penny 260,000 260,000 7,800 3,322 531,122
Gavin Griggs (appointed 31 October 2017) 47,744 33,704 1,400 3,631 86,479
Mike Laver 257,272 139,356 6,315 13,754 416,697
Andy Sng 126,608 27,535 9,668 43,104 206,915
Jonathan Rhodes (resigned from Board 31 October 2017) 140,000 101,111 4,200 2,423 247,734
Non-Executive
Peter Bucher 40,000 – – – 40,000
James Peters 50,000 – – 2,393 52,393
Terry Twigger 45,000 – – – 45,000
Polly Williams 40,000 – – – 40,000
Directors’ Remuneration for 2016
Name of DirectorSalary
and feesAnnual bonus Pension Benefits
2016 Subtotal
Share options*
2016Total
£
Executive
Duncan Penny 260,000 71,601 7,800 2,594 341,995 496,328 838,323
Mike Laver 239,491 48,122 5,770 12,276 305,659 496,328 801,987
Andy Sng 118,764 20,749 8,908 29,237 177,658 132,354 310,012
Jonathan Rhodes 140,000 51,677 4,200 2,178 198,055 132,354 330,409
Non-Executive –
Peter Bucher 40,000 – – – 40,000 – 40,000
John Dyson (chose not to stand for re-election at last AGM) 10,000 – – – 10,000 – 10,000
James Peters 50,000 – – 1,988 51,988 – 51,988
Terry Twigger 44,167 – – – 44,167 – 44,167
Polly Williams 40,000 – – – 40,000 – 40,000
*The value of the share options has been restated to reflect the number of shares that vested in that year. The value has been calculated by taking the market share price at the date of vesting less the exercise price when the awards were made, multiplied by the number of shares that vested. The awards are subject to malus and clawback provisions.
i.
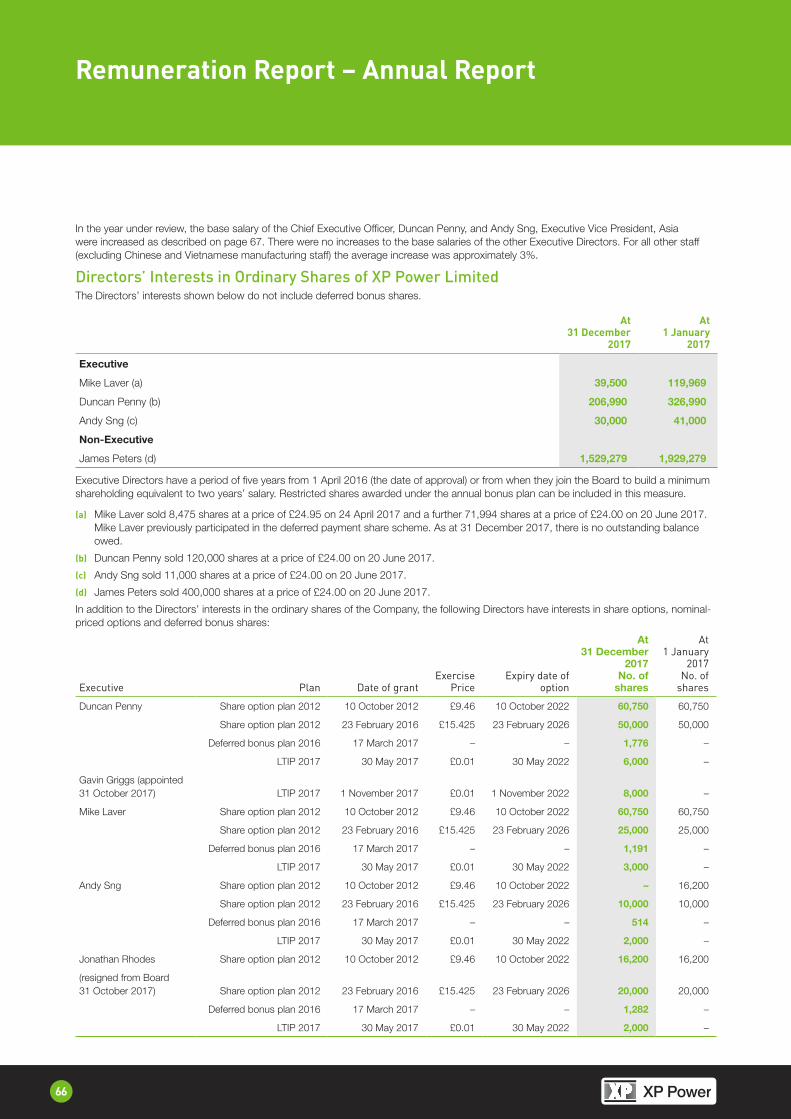
66
HeadingRemuneration Report – Annual Report
In the year under review, the base salary of the Chief Executive Officer, Duncan Penny, and Andy Sng, Executive Vice President, Asia were increased as described on page 67. There were no increases to the base salaries of the other Executive Directors. For all other staff (excluding Chinese and Vietnamese manufacturing staff) the average increase was approximately 3%.
Directors’ Interests in Ordinary Shares of XP Power LimitedThe Directors’ interests shown below do not include deferred bonus shares.
At 31 December
2017
At 1 January
2017
Executive
Mike Laver (a) 39,500 119,969
Duncan Penny (b) 206,990 326,990
Andy Sng (c) 30,000 41,000
Non-Executive
James Peters (d) 1,529,279 1,929,279
Executive Directors have a period of five years from 1 April 2016 (the date of approval) or from when they join the Board to build a minimum shareholding equivalent to two years’ salary. Restricted shares awarded under the annual bonus plan can be included in this measure.
(a) Mike Laver sold 8,475 shares at a price of £24.95 on 24 April 2017 and a further 71,994 shares at a price of £24.00 on 20 June 2017.Mike Laver previously participated in the deferred payment share scheme. As at 31 December 2017, there is no outstanding balance owed.
(b) Duncan Penny sold 120,000 shares at a price of £24.00 on 20 June 2017.
(c) Andy Sng sold 11,000 shares at a price of £24.00 on 20 June 2017.
(d) James Peters sold 400,000 shares at a price of £24.00 on 20 June 2017.
In addition to the Directors’ interests in the ordinary shares of the Company, the following Directors have interests in share options, nominal-priced options and deferred bonus shares:
Executive Plan Date of grantExercise
PriceExpiry date of
option
At 31 December
2017No. of
shares
At 1 January
2017No. of
shares
Duncan Penny Share option plan 2012 10 October 2012 £9.46 10 October 2022 60,750 60,750
Share option plan 2012 23 February 2016 £15.425 23 February 2026 50,000 50,000
Deferred bonus plan 2016 17 March 2017 – – 1,776 –
LTIP 2017 30 May 2017 £0.01 30 May 2022 6,000 –
Gavin Griggs (appointed 31 October 2017) LTIP 2017 1 November 2017 £0.01 1 November 2022 8,000 –
Mike Laver Share option plan 2012 10 October 2012 £9.46 10 October 2022 60,750 60,750
Share option plan 2012 23 February 2016 £15.425 23 February 2026 25,000 25,000
Deferred bonus plan 2016 17 March 2017 – – 1,191 –
LTIP 2017 30 May 2017 £0.01 30 May 2022 3,000 –
Andy Sng Share option plan 2012 10 October 2012 £9.46 10 October 2022 – 16,200
Share option plan 2012 23 February 2016 £15.425 23 February 2026 10,000 10,000
Deferred bonus plan 2016 17 March 2017 – – 514 –
LTIP 2017 30 May 2017 £0.01 30 May 2022 2,000 –
Jonathan Rhodes Share option plan 2012 10 October 2012 £9.46 10 October 2022 16,200 16,200
(resigned from Board 31 October 2017) Share option plan 2012 23 February 2016 £15.425 23 February 2026 20,000 20,000
Deferred bonus plan 2016 17 March 2017 – – 1,282 –
LTIP 2017 30 May 2017 £0.01 30 May 2022 2,000 –
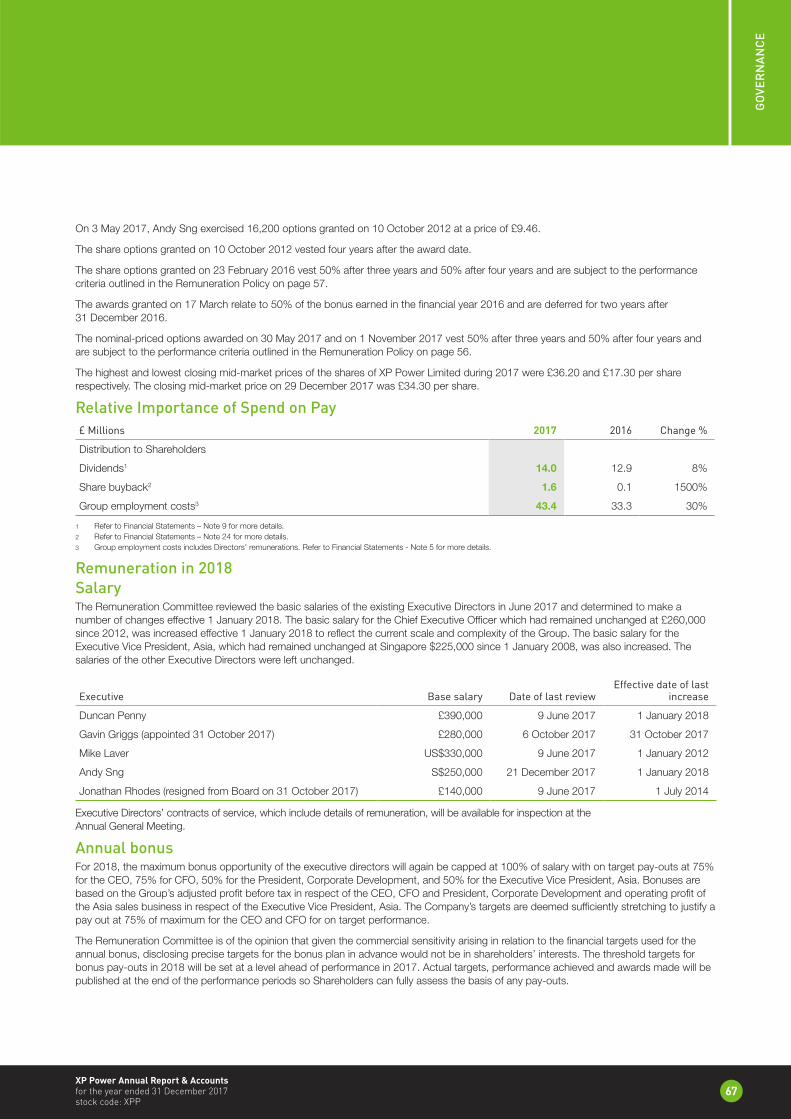
67
GO
VER
NA
NC
E
XP Power Annual Report & Accounts for the year ended 31 December 2017 stock code: XPP
On 3 May 2017, Andy Sng exercised 16,200 options granted on 10 October 2012 at a price of £9.46.
The share options granted on 10 October 2012 vested four years after the award date.
The share options granted on 23 February 2016 vest 50% after three years and 50% after four years and are subject to the performance criteria outlined in the Remuneration Policy on page 57.
The awards granted on 17 March relate to 50% of the bonus earned in the financial year 2016 and are deferred for two years after 31 December 2016.
The nominal-priced options awarded on 30 May 2017 and on 1 November 2017 vest 50% after three years and 50% after four years and are subject to the performance criteria outlined in the Remuneration Policy on page 56.
The highest and lowest closing mid-market prices of the shares of XP Power Limited during 2017 were £36.20 and £17.30 per share respectively. The closing mid-market price on 29 December 2017 was £34.30 per share.
Relative Importance of Spend on Pay£ Millions 2017 2016 Change %
Distribution to Shareholders
Dividends1 14.0 12.9 8%
Share buyback2 1.6 0.1 1500%
Group employment costs3 43.4 33.3 30%
1 Refer to Financial Statements – Note 9 for more details.2 Refer to Financial Statements – Note 24 for more details.3 Group employment costs includes Directors’ remunerations. Refer to Financial Statements - Note 5 for more details.
Remuneration in 2018 SalaryThe Remuneration Committee reviewed the basic salaries of the existing Executive Directors in June 2017 and determined to make a number of changes effective 1 January 2018. The basic salary for the Chief Executive Officer which had remained unchanged at £260,000 since 2012, was increased effective 1 January 2018 to reflect the current scale and complexity of the Group. The basic salary for the Executive Vice President, Asia, which had remained unchanged at Singapore $225,000 since 1 January 2008, was also increased. The salaries of the other Executive Directors were left unchanged.
Executive Base salary Date of last reviewEffective date of last
increase
Duncan Penny £390,000 9 June 2017 1 January 2018
Gavin Griggs (appointed 31 October 2017) £280,000 6 October 2017 31 October 2017
Mike Laver US$330,000 9 June 2017 1 January 2012
Andy Sng S$250,000 21 December 2017 1 January 2018
Jonathan Rhodes (resigned from Board on 31 October 2017) £140,000 9 June 2017 1 July 2014
Executive Directors’ contracts of service, which include details of remuneration, will be available for inspection at the Annual General Meeting.
Annual bonusFor 2018, the maximum bonus opportunity of the executive directors will again be capped at 100% of salary with on target pay-outs at 75% for the CEO, 75% for CFO, 50% for the President, Corporate Development, and 50% for the Executive Vice President, Asia. Bonuses are based on the Group’s adjusted profit before tax in respect of the CEO, CFO and President, Corporate Development and operating profit of the Asia sales business in respect of the Executive Vice President, Asia. The Company’s targets are deemed sufficiently stretching to justify a pay out at 75% of maximum for the CEO and CFO for on target performance.
The Remuneration Committee is of the opinion that given the commercial sensitivity arising in relation to the financial targets used for the annual bonus, disclosing precise targets for the bonus plan in advance would not be in shareholders’ interests. The threshold targets for bonus pay-outs in 2018 will be set at a level ahead of performance in 2017. Actual targets, performance achieved and awards made will be published at the end of the performance periods so Shareholders can fully assess the basis of any pay-outs.
68
HeadingRemuneration Report – Annual Report
Long-term incentive awards2018The Remuneration Committee expects to make further awards to Executive Directors under the 2017 LTIP during 2018. The precise performance conditions attached to awards will be determined immediately before the awards are made and disclosed when the awards are made and in the 2018 annual report.
Non-Executive remunerationNo changes were made to the fees of Non-Executive Directors for 2018.
Advice on RemunerationDuring the year, h2glenfern Remuneration Advisory provided advice to the Company with respect to the Executive Directors’ remuneration. Fees were charged on a cost incurred basis and totalled £10,400 in the year to 31 December 2017. h2glenfern Remuneration Advisory had previously provided advice to the Company on remuneration and has no other connection with the Company.
h2glenfern Remuneration Advisory has confirmed that it has operated in accordance with the Code of Conduct of the Remuneration Consultants’ Group in relation to Executive remuneration consulting in the United Kingdom. The Remuneration Committee has therefore satisfied itself that all advice provided by h2glenfern was objective and independent.
Statement of Voting at the Annual General MeetingThe following table sets out actual voting in respect of the approval of the 2017 Remuneration Policy, the remuneration report and the Long-Term Incentive Plan:
Number of votes cast in
favour
Percentage of votes cast
for
Number of votes cast
against
Percentage of votes cast
against
Number of votes
withheld
Approval of Remuneration Policy 14,034,082 96.2% 561,028 3.84% 2,266
Approval of Remuneration Report 13,161,504 90.5% 1,373,868 9.45% 62,003
Approval of the Long-Term Incentive Plan 14,036,112 96.2% 560,498 3.84% 266
The Group is committed to on going Shareholders dialogue and takes an active interest in voting outcomes. Where there are substantial votes against resolutions in relation to Directors’ remuneration, the reasons for any such vote will be sought, and any actions in response will be detailed here.
Whilst the voting at the last Annual General Meeting was mostly favourable, some areas of concern arose from low disclosure on annual bonus targets and the disclosure of the potential value of share option awards made in the year.
The disclosure issues have been addressed in this report with improved detail on bonus awards. The Remuneration Committee communicated with its major Shareholders in relation to the remuneration package of the CFO, the increase in the salary of the CEO and the issues set out above in advance of the publication of this annual report.
Statement of Consideration of Employment Conditions Elsewhere in the CompanyThe Remuneration Committee takes account of the pay and employment conditions of employees elsewhere in the Company when setting the remuneration of Executive Directors. However, it does not consult other employees when setting Executive Directors’ remuneration.
Statement of Shareholder ViewsThe Company has received views from Shareholders that James Peters was not considered independent by virtue of him previously holding an executive position within the Company. James Peters is a major Shareholder and the Board considers that his interests would therefore be strongly aligned with all Shareholders.
ApprovalThis report was approved by the Board of Directors on 1 March 2018.
DirectorsThe Directors of the Company in office at the date of this report are as follows:
Peter Bucher Gavin Griggs (appointed 31 October 2017)
Mike Laver Duncan Penny
James Peters Andy Sng
Terry Twigger Polly Williams
All Directors will retire and being eligible offer themselves for re-election at the forthcoming Annual General Meeting on 6 April 2018.
Directors’ Interests in Shares or Share OptionsThe present membership of the Board and the interests of the Directors in the shares of XP Power Limited are set out in the Directors’ Remuneration Report.
DividendsInterim dividends were paid and are proposed as follows:
Period Payment date Amount 2016 Comparative
First Quarter 10 July 2017 15.0 pence 14.0 pence
Second Quarter 12 October 2017 16.0 pence 15.0 pence
Third Quarter 11 January 2018 18.0 pence 16.0 pence
Fourth Quarter (proposed) 20 April 2018 29.0 pence 26.0 pence
Total 78.0 pence 71.0 pence
We are proposing a final dividend of 29.0 pence per share which would be payable to members on the register on 16 March 2018 and will be paid on 20 April 2018. This would make the total dividend for the year 78.0 pence (2016: 71.0 pence) which is an increase of 10%.
Audit CommitteeThe members of the Audit Committee at the end of the financial year were as follows:
Terry Twigger (Chair)Peter Bucher Polly Williams
All members of the Audit Committee were Non-Executive Directors.
The Audit Committee carried out its functions in accordance with Section 201B(5) of the Singapore Companies Act. In performing those functions, the Audit Committee reviewed:
} The audit plan of the Company’s independent Auditor and its report on internal accounting controls arising from the statutory audit;
} The assistance given by the Company’s management to the independent Auditor; and
} The balance sheet of the Company and the consolidated financial statements of the Group for the financial year ended 31 December 2017 before their submission to the Board of Directors, as well as the independent Auditor’s report on the balance sheet of the Company and the consolidated financial statements of the Group.
The Audit Committee has recommended to the Board that the independent Auditor, PricewaterhouseCoopers LLP, be nominated for reappointment at the forthcoming Annual General Meeting of the Company.
Independent AuditorThe independent Auditor, PricewaterhouseCoopers LLP, has expressed its willingness to accept reappointment.
On behalf of the Directors
James PetersChairman1 March 2018
Duncan PennyChief Executive Officer
69
GO
VER
NA
NC
E
XP Power Annual Report & Accounts for the year ended 31 December 2017 stock code: XPP
Other Governance and Statutory Disclosures
In the opinion of the Directors,a. the balance sheet of the Company and the consolidated financial statements of the Group as set out on pages 77 to 128 are drawn up
so as to give a true and fair view of the state of affairs of the Company and of the Group as at 31 December 2017 and of the results of the business, changes in equity and cash flows of the Group for the financial year then ended; and
b. at the date of this statement, there are reasonable grounds to believe that the Company will be able to pay its debts as and when they fall due.
On behalf of the Directors
70
HeadingStatement by Directors
James PetersNon-Executive Chairman1 March 2018
James Peters Non-Executive Chairman 8 March 2017
Duncan PennyChief Executive Officer
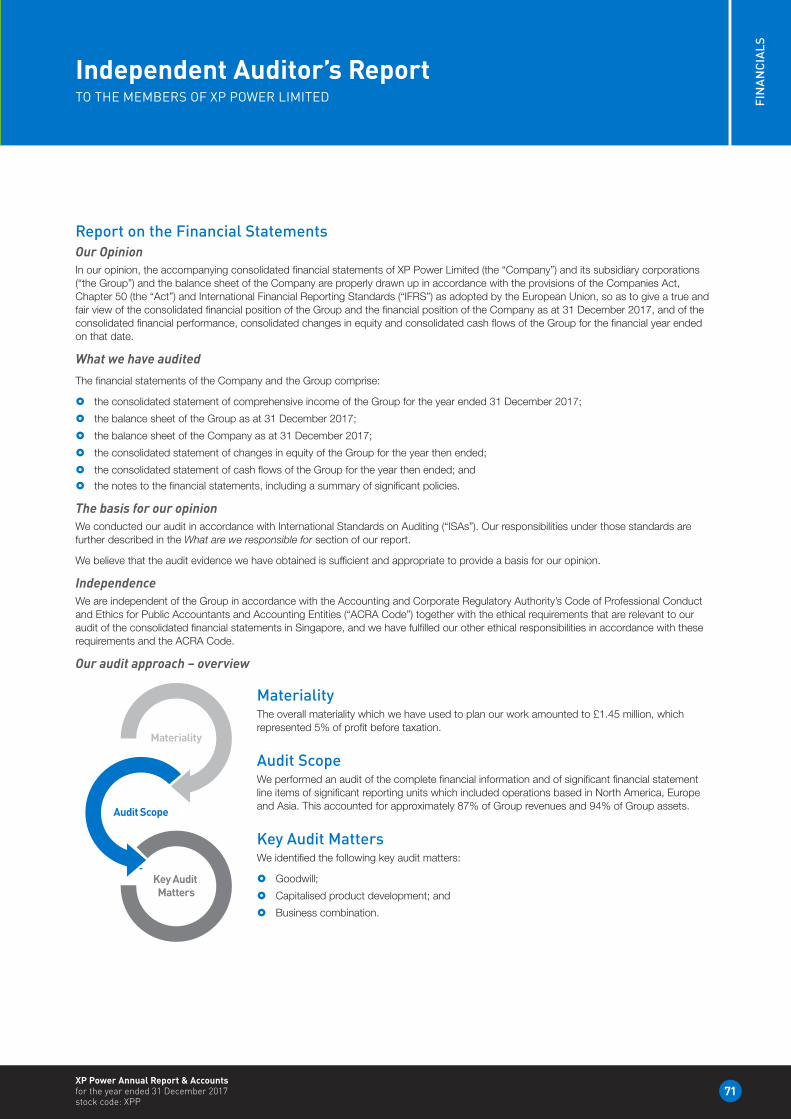
71
FIN
AN
CIA
LS
XP Power Annual Report & Accounts for the year ended 31 December 2017 stock code: XPP
Independent Auditor’s ReportTO THE MEMBERS OF XP POWER LIMITED
Report on the Financial StatementsOur OpinionIn our opinion, the accompanying consolidated financial statements of XP Power Limited (the “Company”) and its subsidiary corporations (“the Group”) and the balance sheet of the Company are properly drawn up in accordance with the provisions of the Companies Act, Chapter 50 (the “Act”) and International Financial Reporting Standards (“IFRS”) as adopted by the European Union, so as to give a true and fair view of the consolidated financial position of the Group and the financial position of the Company as at 31 December 2017, and of the consolidated financial performance, consolidated changes in equity and consolidated cash flows of the Group for the financial year ended on that date.
What we have audited
The financial statements of the Company and the Group comprise:
} the consolidated statement of comprehensive income of the Group for the year ended 31 December 2017;
} the balance sheet of the Group as at 31 December 2017;
} the balance sheet of the Company as at 31 December 2017;
} the consolidated statement of changes in equity of the Group for the year then ended;
} the consolidated statement of cash flows of the Group for the year then ended; and
} the notes to the financial statements, including a summary of significant policies.
The basis for our opinionWe conducted our audit in accordance with International Standards on Auditing (“ISAs”). Our responsibilities under those standards are further described in the What are we responsible for section of our report.
We believe that the audit evidence we have obtained is sufficient and appropriate to provide a basis for our opinion.
IndependenceWe are independent of the Group in accordance with the Accounting and Corporate Regulatory Authority’s Code of Professional Conduct and Ethics for Public Accountants and Accounting Entities (“ACRA Code”) together with the ethical requirements that are relevant to our audit of the consolidated financial statements in Singapore, and we have fulfilled our other ethical responsibilities in accordance with these requirements and the ACRA Code.
Our audit approach – overview
Materiality
Key Audit Matters
Audit Scope
MaterialityThe overall materiality which we have used to plan our work amounted to £1.45 million, which represented 5% of profit before taxation.
Audit ScopeWe performed an audit of the complete financial information and of significant financial statement line items of significant reporting units which included operations based in North America, Europe and Asia. This accounted for approximately 87% of Group revenues and 94% of Group assets.
Key Audit MattersWe identified the following key audit matters:
} Goodwill;
} Capitalised product development; and
} Business combination.
72
HeadingIndependent Auditor’s ReportTO THE MEMBERS OF XP POWER LIMITED
How we determined materialityThe scope of our audit was influenced by our application of materiality. We set certain quantitative thresholds for materiality. These, together with qualitative considerations, helped us to determine the scope of our audit and the nature, timing and extent of our audit procedures and to evaluate the effect of misstatements, both individually and on the financial statements as a whole.
Based on our professional judgement, we determined that the benchmark of profit before taxation is appropriate as it reflects the Group’s growth and investment plans. We believe this is a key measure used by Shareholders in assessing the performance of the Group.
We agreed with the Audit Committee that we would report to them misstatements identified during our audit above £145,000 as well as misstatements below that amount that, in our view, warranted reporting for qualitative reasons.
How we tailored the audit scopeThe Group operates across North America, Europe and Asia. In establishing the overall approach to the Group audit, we determined the type of work that needed to be performed at the local operations by us, as the Group engagement team, or component auditors from other PwC network firms operating under our instruction. Where the work was performed by component auditors, we determined the level of involvement we needed to have in the audit work at those local operations to be able to conclude whether sufficient appropriate audit evidence had been obtained as a basis for our opinion on the Group financial statements as a whole. In the current year, the Group engagement team visited the Group’s offices in North America.
We designed our audit of the Group by determining materiality and assessing the risks of material misstatement in the financial statements. In particular, we looked at where management made subjective judgements, for example in respect of significant accounting estimates, that involved making assumptions and considering future events that are inherently uncertain. As in all of our audits, we also addressed the risk of management override of internal controls, including evaluating whether there was evidence of bias by the management that represented a risk of material misstatement due to fraud.
We tailored the scope of our audit to ensure that we performed enough work to be able to give an opinion on the financial statements as a whole, taking into account the geographic structure of the Group, the accounting processes and controls, and the industry in which the Group operates.
Having obtained sufficient appropriate audit evidence of the local operations, we performed audit procedures at the Group level over the consolidation process, goodwill, capitalised product development, taxation and business combination.
What are the key audit mattersThe matters that had the greatest effect on our audit for the year ended 31 December 2017, including the allocation of our resources and effort, are identified as “Key Audit Matters” in the table below. We have also set out how we tailored our audit to address these specific areas in order to provide an opinion on the financial statements as a whole, and in forming our opinion thereon, and we do not provide a separate opinion on these matters.
73
FIN
AN
CIA
LS
XP Power Annual Report & Accounts for the year ended 31 December 2017 stock code: XPP
Key audit matters How did our audit address these
Goodwill
Refer to page 52 (Report from the Chair of the Audit Committee), page 90 (Critical accounting judgements and key sources of estimation uncertainty – Impairment of Goodwill) and page 98 (Note 11 – Goodwill).
The Group has goodwill of £40.4 million at 31 December 2017 contained within three cash-generating units (“CGUs”) defined by its geographical split – North America, Europe and Asia.
We focused on this area due to the relative size of the carrying amount of goodwill, which represented 23% of total assets, and because management’s assessment of the “value-in-use” of the Group’s CGUs involves significant judgements about the future results of the business and the discount rates applied to future cash flow forecasts.
Key judgements about the future results of the business include: revenue and profit growth rates, expected changes to overhead costs as well as risks specific to the three geographical areas.
We assessed the appropriateness of management’s identification of the Group’s CGUs and the process to test for goodwill impairment. There were no significant issues noted.
We evaluated the suitability and appropriateness of the impairment model as prepared by management and noted no significant exceptions.
We assessed the reasonableness of the inputs used in the derivation of the discount rates. We also focused on understanding and challenging management’s plans for future growth for each of the three CGUs. Forecasted growth in revenue and profits are driven by constant innovation in the development of new product families as well as the broadening of the customer base in the three geographical areas. We benchmarked key market-related assumptions in management’s forecasts such as revenue and profit growth rates and changes in the overhead costs with relevant economic and industry indicators and considered that such targets as set by management were achievable. Sensitivity analyses were also performed on the discount rates and growth rates. We agreed with management that no impairment was required.
Capitalised product development
Refer to page 52 (Report from the Chair of the Audit Committee), page 90 (Critical accounting judgements and key sources of estimation uncertainty – Recoverability of Capitalised R&D) and page 99 (Note 12 – Intangible assets).
Part of the Group’s strategy is to invest in research and development to create new products. As at 31 December 2017, the carrying value of product development costs capitalised as an intangible asset is £16.0 million, of which £5.2 million was capitalised in the current financial year.
We focused on the appropriateness of capitalisation of product development costs due to the relative size of the carrying amount of this intangible asset, which represented 9% of total assets, and because significant judgement is involved in determining whether the criteria to capitalise such product development costs, as set out in IAS 38, have been fulfilled.
We also identified the useful lives of the capitalised product development costs as an area involving significant judgement. The carrying value of the capitalised product development costs is heavily dependent on the useful lives of the developed products. Management determined the useful lives of the developed products based on the expected life cycle of these products, taking into consideration expected customer demand and technological innovation.
We assessed the appropriateness of capitalisation of product development costs by ensuring compliance with the criteria to capitalise product development costs as set out in IAS 38, and challenged management through discussions and qualitative reviews of the products’ feasibility. We also tested the accuracy and allocation of capitalised material costs and labour costs. Management was able to support the capitalisation of product development costs.
In the assessment of the useful lives of the capitalised product development costs, we performed a benchmarking exercise to compare the useful lives of the capitalised product development costs against other companies within the same industry. For selected samples of developed products, we reviewed the actual sales during the year to ensure that the capitalised development costs are supported by demand. For products in development, we noted the existence of customer demand for selected samples, by perusing sales quotations and/or correspondences between the customers and the Group. The useful lives as determined by management are in line with that of the industry and consistent with our understanding of the life cycle of the products.
74
HeadingIndependent Auditor’s ReportTO THE MEMBERS OF XP POWER LIMITED
Key audit matters How did our audit address these
Business combination
Refer to page 52 (Report from the Chair of the Audit Committee), page 99 (Note 12 – Intangible assets) and page 116 (Note 31 – Business combination).
On 29 September 2017, the Group announced the acquisition of the assets and business of Comdel, Inc (“Comdel”), a US-based designer and manufacturer of radio frequency power supplies. The final purchase consideration was US$25.2 million (£18.8 million). Management assessed that the acquisition of Comdel qualifies as a business combination by applying the definition in IFRS 3.
Management determined that the fair value of the net identifiable assets acquired was US$20.0 million (£14.9 million) with US$9.3 million (£6.9 million) relating to intangible assets that arose from the business combination. The valuation of the intangible assets was performed as part of the Purchase Price Allocation.
We focused on the intangible assets arising from the business combination as a significant area of judgement. The valuation methodology, as well as the inputs and assumptions in the model, will affect the fair value of the intangible assets.
The goodwill arising from the acquisition of Comdel of US$5.2 million (£3.9 million) is also highly dependent on the fair value of the identifiable assets acquired and the liabilities assumed at the acquisition date.
We reviewed management’s assessment that the acquisition of Comdel should be accounted for as a business combination and determined that it was appropriately performed in accordance with the definition set out in IFRS 3.
We assessed the appropriateness of the identifiable assets acquired and the liabilities assumed at the acquisition date by reviewing the clauses laid out in the purchase agreement. We also reviewed management’s procedure for determining the fair value of the net identifiable assets acquired and noted no significant exceptions.
We reviewed the appropriateness of recognition of the identified intangible assets in accordance with IAS 38. We agreed with management’s assessment that the intangible assets are separately identifiable and the Group has control over the future economic benefits flowing from the intangible assets.
We reviewed the useful lives of the identified intangible assets as determined by management and consider them to be reasonable.
The valuation methodologies used for determining the fair values of the identified intangible assets were also assessed to be appropriate.
We focused on understanding and challenging management’s inputs into the valuation model, which will have an impact on the fair value of the intangible assets. We assessed the projected future revenue growth and margins based not only on the historical performance of Comdel, but also relevant economic and industry indicators and considered such projections, as set by management, to be reasonable.
We tested the calculation of the goodwill arising from the acquisition of Comdel, being the difference between the total purchase consideration and the fair value of the net identifiable assets and noted that management’s computation was in line with IFRS 3.
Also, the goodwill arising from the acquisition has been determined by management to be part of the North American CGU (please see key audit matter “Goodwill” on Page 73). We have assessed management’s determination of the CGU and noted no significant exceptions.
75
FIN
AN
CIA
LS
XP Power Annual Report & Accounts for the year ended 31 December 2017 stock code: XPP
Information other than the Financial Statements and Auditor’s Report thereonGoing concernUnder the UK Listing Rules (“Listing Rules”) we are required to review the Directors’ statement, set out on page 70, in relation to going concern. We have nothing to report having performed our review.
The Directors’ assessment of the prospects of the Group Under the Listing Rules we are required to review the Directors’ statement that they have carried out a robust assessment of the principal risks facing the Group and the Directors’ statement in relation to the longer-term viability of the Group, set out on page 31. Our review was substantially less in scope than an audit and only consisted of making enquiries and considering the Directors’ process supporting their statements; checking that the statements are in alignment with the relevant provisions of the UK Corporate Governance Code; and considering whether the statements are consistent with the knowledge acquired by us in the course of performing our audit. We have nothing to report having performed our review.
Corporate governance statementUnder the Listing Rules, we are required to review the part of the Corporate Governance Statement relating to eleven further provisions of the UK Corporate Governance Code, set out in the “Accountability” section on pages 48 to 49. We have nothing to report having performed our review.
Other informationManagement is responsible for the other information. The other information comprises the “Overview” section set out on pages 1 to 7, “Strategic Report” set out on pages 8 to 41, “Governance Report” set out on pages 42 to 70, and the “Financials” section on page 129 of the Annual Report. Other information, as defined in this section, does not include matters that we are required to review and report on under the Listing Rules, as described above.
Our opinion on the financial statements does not cover the other information and we do not and will not express any form of assurance conclusion thereon.
In connection with our audit of the financial statements, our responsibility is to read the other information and, in doing so, consider whether the other information is materially inconsistent with the financial statements or our knowledge obtained in the audit or otherwise appears to be materially misstated.
If, based on the work we have performed, we conclude that there is a material misstatement of this other information, we are required to report that fact. We have nothing to report in this regard.
Responsibilities for the financial statements and the auditWhat are Management and Directors responsible forManagement is responsible for the preparation of financial statements that give a true and fair view in accordance with the provisions of the Act and IFRS as adopted by the European Union, and for devising and maintaining a system of internal accounting controls sufficient to provide a reasonable assurance that assets are safeguarded against loss from unauthorised use or disposition; and transactions are properly authorised and that they are recorded as necessary to permit the preparation of true and fair financial statements and to maintain accountability of assets.
In preparing the financial statements, management is responsible for assessing the Group’s ability to continue as a going concern, disclosing, as applicable, matters related to going concern and using the going concern basis of accounting unless management either intends to liquidate the Group or to cease operations, or has no realistic alternative but to do so.
The Directors are responsible for overseeing the Group’s financial reporting process.
What are we responsible forOur objectives are to obtain reasonable assurance about whether the financial statements as a whole are free from material misstatement, whether due to fraud or error, and to issue an auditor’s report that includes our opinion. Reasonable assurance is a high level of assurance, but is not a guarantee that an audit conducted in accordance with ISAs will always detect a material misstatement when it exists. Misstatements can arise from fraud or error and are considered material if, individually or in the aggregate, they could reasonably be expected to influence the economic decisions of users taken on the basis of these financial statements.
76
HeadingIndependent Auditor’s ReportTO THE MEMBERS OF XP POWER LIMITED
As part of an audit in accordance with ISAs, we exercise professional judgement and maintain professional scepticism throughout the audit. We also:
} Identify and assess the risks of material misstatement of the consolidated financial statements, whether due to fraud or error, design and perform audit procedures responsive to those risks, and obtain audit evidence that is sufficient and appropriate to provide a basis for our opinion. The risk of not detecting a material misstatement resulting from fraud is higher than for one resulting from error, as fraud may involve collusion, forgery, intentional omissions, misrepresentations, or the override of internal control.
} Obtain an understanding of internal control relevant to the audit in order to design audit procedures that are appropriate in the circumstances, but not for the purpose of expressing an opinion on the effectiveness of the Group’s internal control.
} Evaluate the appropriateness of accounting policies used and the reasonableness of accounting estimates and related disclosures made by management.
} Conclude on the appropriateness of management’s use of the going concern basis of accounting and based on the audit evidence obtained, whether a material uncertainty exists related to events or conditions that may cast significant doubt on the Group’s ability to continue as a going concern. If we conclude that a material uncertainty exists, we are required to draw attention in our auditor’s report to the related disclosures in the consolidated financial statements or, if such disclosures are inadequate, to modify our opinion. Our conclusions are based on the audit evidence obtained up to the date of our auditor’s report. However, future events or conditions may cause the Group to cease to continue as a going concern.
} Evaluate the overall presentation, structure and content of the consolidated financial statements, including the disclosures, and whether the consolidated financial statements represent the underlying transactions and events in a manner that achieves fair presentation.
} Obtain sufficient appropriate audit evidence regarding the financial information of the entities or business activities within the Group to express an opinion on the consolidated financial statements. We are responsible for the direction, supervision and performance of the Group audit. We remain solely responsible for our audit opinion.
We communicate with the Audit Committee regarding, among other matters, the planned scope and timing of the audit and significant audit findings, including any significant deficiencies in internal control that we identify during our audit.
We also provide the Audit Committee with a statement that we have complied with relevant ethical requirements regarding independence, and to communicate with them all relationships and other matters that may reasonably be thought to bear on our independence, and where applicable, related safeguards.
From the matters communicated with the Audit Committee, we determine those matters that were of most significance in the audit of the consolidated financial statements of the current year and are therefore the key audit matters. We describe these matters in our auditor’s report, unless law or regulation precludes public disclosure about the matter or when, in extremely rare circumstances, we determine that a matter should not be communicated in our report because the adverse consequences of doing so would reasonably be expected to outweigh the public interest benefits of such communication.
Report on other legal and regulatory requirementsIn our opinion, the accounting and other records required by the Act to be kept by the Company and by those subsidiaries incorporated in Singapore of which we are the auditors, have been properly kept in accordance with the provisions of the Act.
The engagement partner on the audit resulting in this independent auditor’s report is Hans Koopmans.
PricewaterhouseCoopers LLPPublic Accountants and Chartered AccountantsSingapore1 March 2018
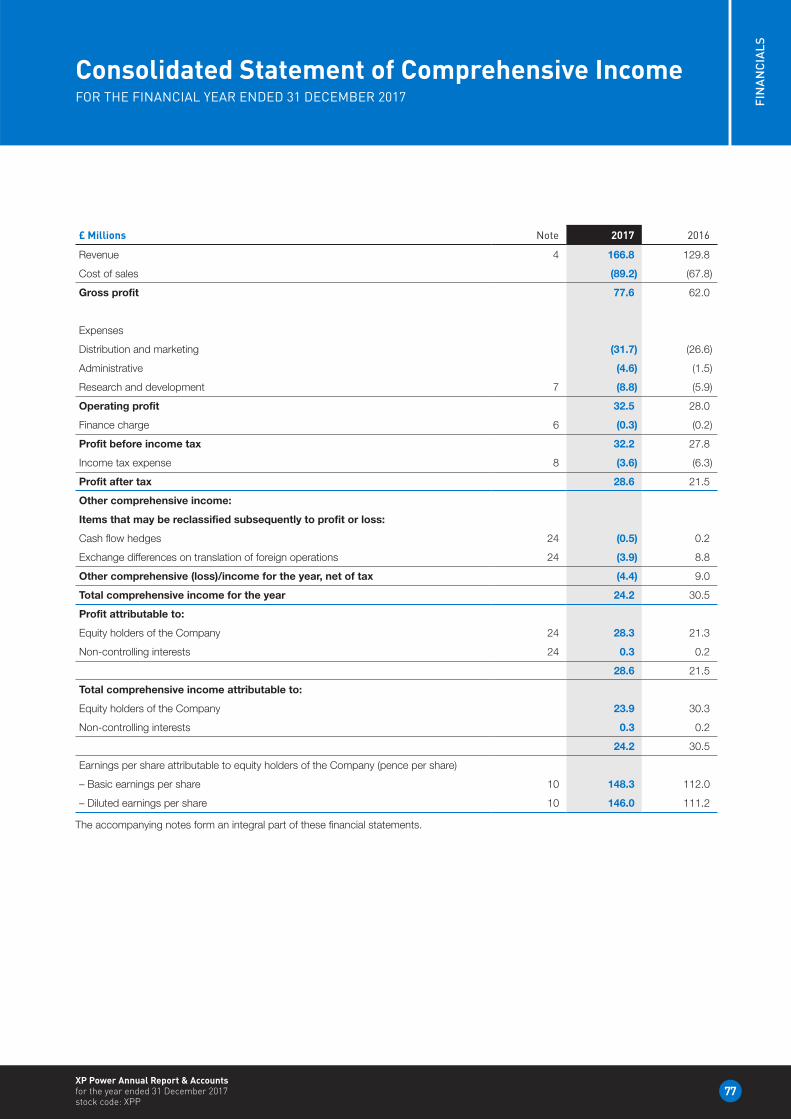
77
FIN
AN
CIA
LS
XP Power Annual Report & Accounts for the year ended 31 December 2017 stock code: XPP
Consolidated Statement of Comprehensive Income FOR THE FINANCIAL YEAR ENDED 31 DECEMBER 2017
£ Millions Note 2017 2016
Revenue 4 166.8 129.8
Cost of sales (89.2) (67.8)
Gross profit 77.6 62.0
Expenses
Distribution and marketing (31.7) (26.6)
Administrative (4.6) (1.5)
Research and development 7 (8.8) (5.9)
Operating profit 32.5 28.0
Finance charge 6 (0.3) (0.2)
Profit before income tax 32.2 27.8
Income tax expense 8 (3.6) (6.3)
Profit after tax 28.6 21.5
Other comprehensive income:
Items that may be reclassified subsequently to profit or loss:
Cash flow hedges 24 (0.5) 0.2
Exchange differences on translation of foreign operations 24 (3.9) 8.8
Other comprehensive (loss)/income for the year, net of tax (4.4) 9.0
Total comprehensive income for the year 24.2 30.5
Profit attributable to:
Equity holders of the Company 24 28.3 21.3
Non-controlling interests 24 0.3 0.2
28.6 21.5
Total comprehensive income attributable to:
Equity holders of the Company 23.9 30.3
Non-controlling interests 0.3 0.2
24.2 30.5
Earnings per share attributable to equity holders of the Company (pence per share)
– Basic earnings per share 10 148.3 112.0
– Diluted earnings per share 10 146.0 111.2
The accompanying notes form an integral part of these financial statements.
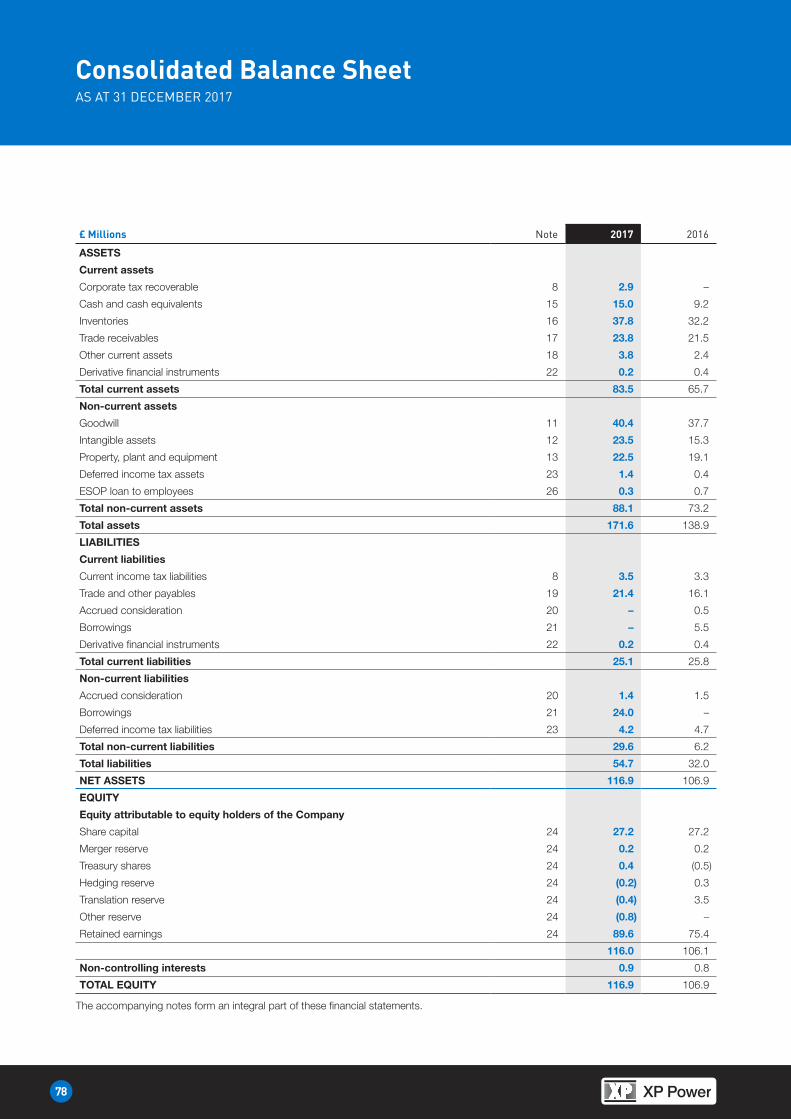
78
HeadingConsolidated Balance SheetAS AT 31 DECEMBER 2017
£ Millions Note 2017 2016
ASSETS
Current assets
Corporate tax recoverable 8 2.9 –
Cash and cash equivalents 15 15.0 9.2
Inventories 16 37.8 32.2
Trade receivables 17 23.8 21.5
Other current assets 18 3.8 2.4
Derivative financial instruments 22 0.2 0.4
Total current assets 83.5 65.7
Non-current assets
Goodwill 11 40.4 37.7
Intangible assets 12 23.5 15.3
Property, plant and equipment 13 22.5 19.1
Deferred income tax assets 23 1.4 0.4
ESOP loan to employees 26 0.3 0.7
Total non-current assets 88.1 73.2
Total assets 171.6 138.9
LIABILITIES
Current liabilities
Current income tax liabilities 8 3.5 3.3
Trade and other payables 19 21.4 16.1
Accrued consideration 20 – 0.5
Borrowings 21 – 5.5
Derivative financial instruments 22 0.2 0.4
Total current liabilities 25.1 25.8
Non-current liabilities
Accrued consideration 20 1.4 1.5
Borrowings 21 24.0 –
Deferred income tax liabilities 23 4.2 4.7
Total non-current liabilities 29.6 6.2
Total liabilities 54.7 32.0
NET ASSETS 116.9 106.9
EQUITY
Equity attributable to equity holders of the Company
Share capital 24 27.2 27.2
Merger reserve 24 0.2 0.2
Treasury shares 24 0.4 (0.5)
Hedging reserve 24 (0.2) 0.3
Translation reserve 24 (0.4) 3.5
Other reserve 24 (0.8) –
Retained earnings 24 89.6 75.4
116.0 106.1
Non-controlling interests 0.9 0.8
TOTAL EQUITY 116.9 106.9
The accompanying notes form an integral part of these financial statements.
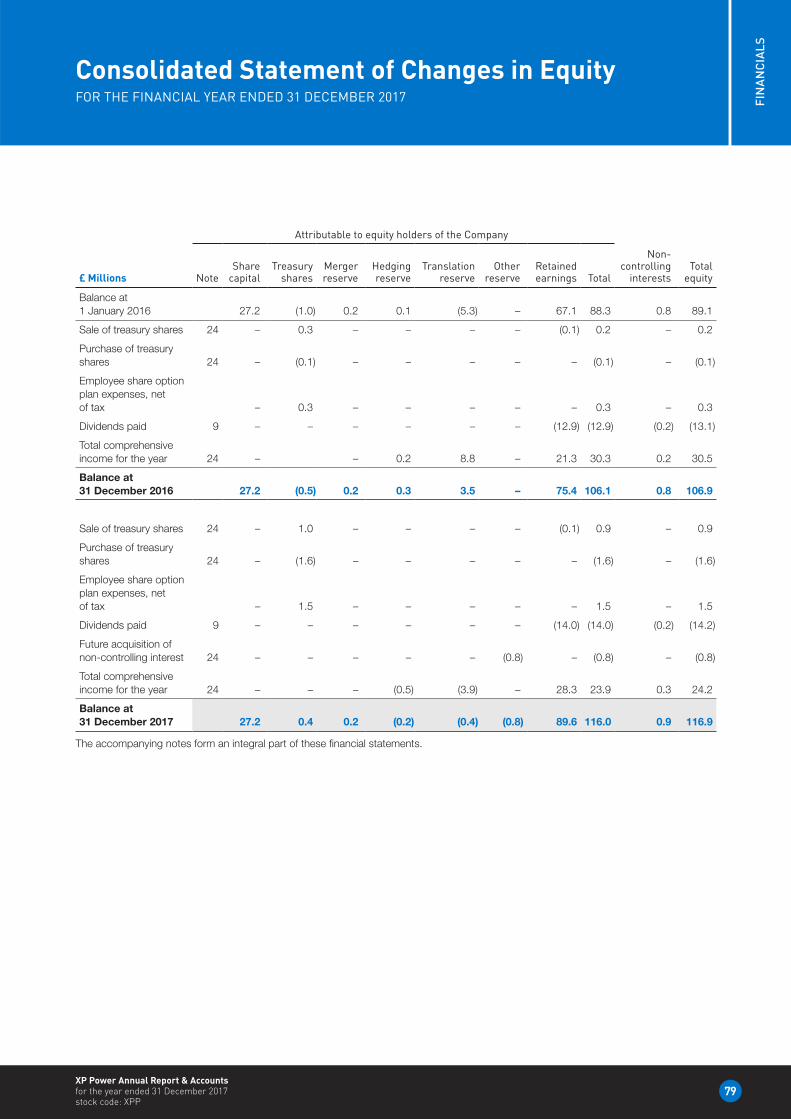
79
FIN
AN
CIA
LS
XP Power Annual Report & Accounts for the year ended 31 December 2017 stock code: XPP
Consolidated Statement of Changes in EquityFOR THE FINANCIAL YEAR ENDED 31 DECEMBER 2017
Attributable to equity holders of the Company
£ Millions NoteShare
capitalTreasury
sharesMerger reserve
Hedging reserve
Translation reserve
Other reserve
Retained earnings Total
Non-controlling
interestsTotal
equity
Balance at 1 January 2016 27.2 (1.0) 0.2 0.1 (5.3) – 67.1 88.3 0.8 89.1
Sale of treasury shares 24 – 0.3 – – – – (0.1) 0.2 – 0.2
Purchase of treasury shares 24 – (0.1) – – – – – (0.1) – (0.1)
Employee share option plan expenses, net of tax – 0.3 – – – – – 0.3 – 0.3
Dividends paid 9 – – – – – – (12.9) (12.9) (0.2) (13.1)
Total comprehensive income for the year 24 – – 0.2 8.8 – 21.3 30.3 0.2 30.5
Balance at 31 December 2016 27.2 (0.5) 0.2 0.3 3.5 – 75.4 106.1 0.8 106.9
Sale of treasury shares 24 – 1.0 – – – – (0.1) 0.9 – 0.9
Purchase of treasury shares 24 – (1.6) – – – – – (1.6) – (1.6)
Employee share option plan expenses, net of tax – 1.5 – – – – – 1.5 – 1.5
Dividends paid 9 – – – – – – (14.0) (14.0) (0.2) (14.2)
Future acquisition of non-controlling interest 24 – – – – – (0.8) – (0.8) – (0.8)
Total comprehensive income for the year 24 – – – (0.5) (3.9) – 28.3 23.9 0.3 24.2
Balance at 31 December 2017 27.2 0.4 0.2 (0.2) (0.4) (0.8) 89.6 116.0 0.9 116.9
The accompanying notes form an integral part of these financial statements.
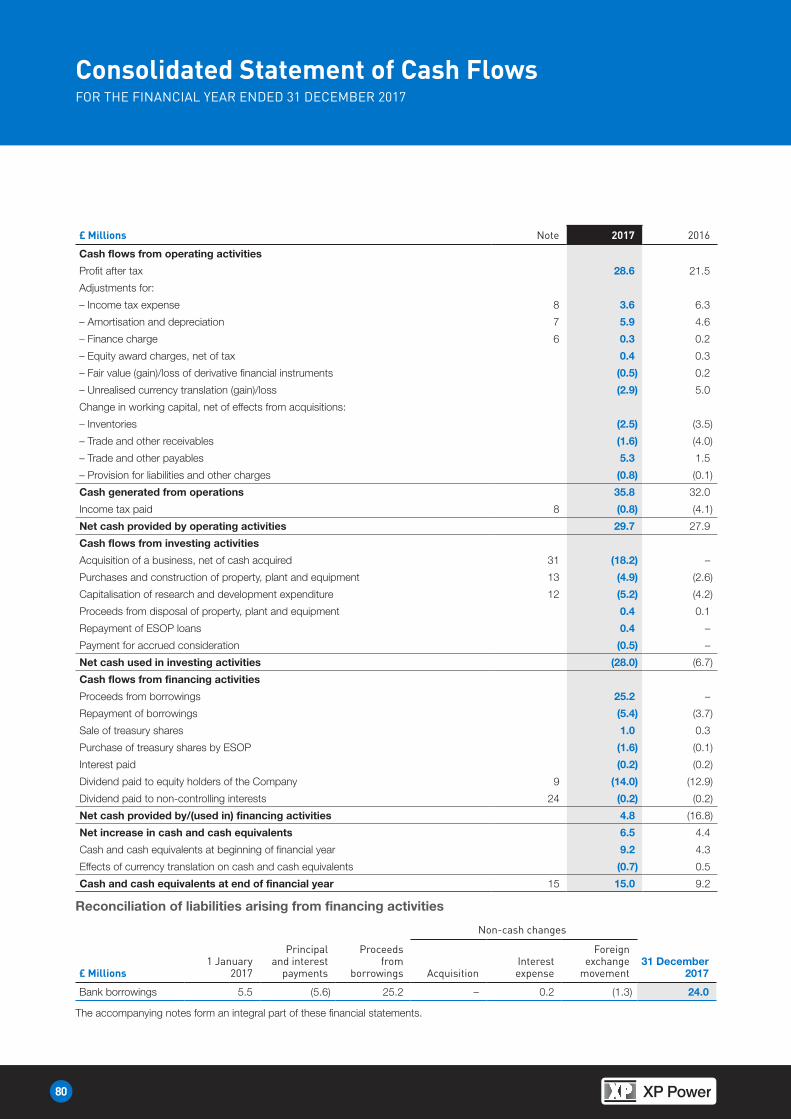
80
HeadingConsolidated Statement of Cash FlowsFOR THE FINANCIAL YEAR ENDED 31 DECEMBER 2017
£ Millions Note 2017 2016
Cash flows from operating activities
Profit after tax 28.6 21.5
Adjustments for:
– Income tax expense 8 3.6 6.3
– Amortisation and depreciation 7 5.9 4.6
– Finance charge 6 0.3 0.2
– Equity award charges, net of tax 0.4 0.3
– Fair value (gain)/loss of derivative financial instruments (0.5) 0.2
– Unrealised currency translation (gain)/loss (2.9) 5.0
Change in working capital, net of effects from acquisitions:
– Inventories (2.5) (3.5)
– Trade and other receivables (1.6) (4.0)
– Trade and other payables 5.3 1.5
– Provision for liabilities and other charges (0.8) (0.1)
Cash generated from operations 35.8 32.0
Income tax paid 8 (0.8) (4.1)
Net cash provided by operating activities 29.7 27.9
Cash flows from investing activities
Acquisition of a business, net of cash acquired 31 (18.2) –
Purchases and construction of property, plant and equipment 13 (4.9) (2.6)
Capitalisation of research and development expenditure 12 (5.2) (4.2)
Proceeds from disposal of property, plant and equipment 0.4 0.1
Repayment of ESOP loans 0.4 –
Payment for accrued consideration (0.5) –
Net cash used in investing activities (28.0) (6.7)
Cash flows from financing activities
Proceeds from borrowings 25.2 –
Repayment of borrowings (5.4) (3.7)
Sale of treasury shares 1.0 0.3
Purchase of treasury shares by ESOP (1.6) (0.1)
Interest paid (0.2) (0.2)
Dividend paid to equity holders of the Company 9 (14.0) (12.9)
Dividend paid to non-controlling interests 24 (0.2) (0.2)
Net cash provided by/(used in) financing activities 4.8 (16.8)
Net increase in cash and cash equivalents 6.5 4.4
Cash and cash equivalents at beginning of financial year 9.2 4.3
Effects of currency translation on cash and cash equivalents (0.7) 0.5
Cash and cash equivalents at end of financial year 15 15.0 9.2
Reconciliation of liabilities arising from financing activities
Non-cash changes
£ Millions1 January
2017
Principal and interest
payments
Proceeds from
borrowings AcquisitionInterest expense
Foreign exchange
movement31 December
2017
Bank borrowings 5.5 (5.6) 25.2 – 0.2 (1.3) 24.0
The accompanying notes form an integral part of these financial statements.
81
FIN
AN
CIA
LS
XP Power Annual Report & Accounts for the year ended 31 December 2017 stock code: XPP
Notes to the Consolidated Financial StatementsFOR THE FINANCIAL YEAR ENDED 31 DECEMBER 2017
1. General InformationXP Power Limited (the “Company”) is listed on the London Stock Exchange and incorporated and domiciled in Singapore. The address of its registered office is 401 Commonwealth Drive, Lobby B, #02-02, Haw Par Technocentre, Singapore 149598.
The nature of XP Power Limited and its subsidiaries’ operations and its principal activities are set out in the Markets and Products sections of the Annual Report on pages 8 to 9.
2. Summary of significant accounting policiesThe principal accounting policies applied in the preparation of these consolidated financial statements are set out below. These policies have been consistently applied to all the years presented, unless otherwise stated.
2.1 Basis of preparationThe consolidated financial statements of XP Power Limited and its subsidiaries (the “Group”) have been prepared in accordance with International Financial Reporting Standards (“IFRS”) as adopted by the European Union (IFRS as adopted by the EU).
The consolidated financial statements have been prepared on the historical cost convention except as disclosed in the accounting policies below.
The preparation of financial statements in conformity with IFRS requires management to make judgements, estimates and assumptions that affect the application of these accounting policies and the reported amounts of assets, liabilities, income and expenses. The estimates and associated assumptions are based on historical experience and various other factors that are believed to be reasonable under the circumstances, the results of which forms the basis of making the judgements about carrying amounts of assets and liabilities that are not readily apparent from other sources. Areas involving a higher degree of judgement or complexity, or areas where assumptions and estimates are significant to the consolidated financial statements, are disclosed in Note 3.
(a) Going concern
After making enquiries, the Directors have a reasonable expectation that the Group has adequate resources to continue in operational existence for the foreseeable future. The Group therefore continues to adopt the going concern basis in preparing its consolidated financial statements.
(b) Changes in accounting policy and disclosures
i. New and amended standards adopted by the Group
There are no IFRS or International Financial Reporting Interpretations Committee (“IFRIC”) interpretations that are effective for the first time for the financial year beginning on 1 January 2017 that have a material impact on the Group.
ii. New standards and interpretations issued not yet adopted
IFRS 9 Financial Instruments (effective for annual periods beginning on or after 1 January 2018)
IFRS 9 Financial Instruments is effective for accounting periods beginning on or after 1 January 2018 and replaces the existing guidance in IAS 39 Financial Instruments: Recognition and Measurement.
IFRS 9 includes revised guidance on the classification and measurement of financial instruments, impairment on financial assets and new general hedge accounting requirements. IFRS 9 relaxes the requirements for hedge effectiveness by replacing the bright line hedge effectiveness tests. It requires an economic relationship between the hedged item and hedging instrument and for the “hedged ratio” to be the same as the one management actually use for risk management purposes.
The Group has completed an initial impact assessment of IFRS 9 and determined that there will be no changes in the classification and an insignificant change in the measurement of financial assets. The Group’s hedging arrangements will continue to qualify for hedge accounting upon the adoption of IFRS 9.
IFRS 15 Revenue from Contracts with Customers (effective for annual periods beginning on or after 1 January 2018)
IFRS 15 Revenue from Contracts with Customers is effective for accounting periods beginning on or after 1 January 2018 and establishes a comprehensive framework for determining whether, how much and when revenue is recognised. Based on an initial assessment of the adoption of IFRS 15, the Group quantified the impact as a de minimis (circa 0.02%) reduction of the total revenue as a result of the timing of the recognition of early payment discounts and volume rebate. This results in a de minimis timing impact on operating profit (less than 0.1%). On this basis, the Group does not believe it to be likely that there will be a significant impact on its consolidated financial statements.
82
HeadingNotes to the Consolidated Financial StatementsFOR THE FINANCIAL YEAR ENDED 31 DECEMBER 2017
2. Summary of significant accounting policies (continued)2.1 Basis of preparation (continued)(b) Changes in accounting policy and disclosures (continued)
ii. New standards and interpretations issued not yet adopted (continued)
IFRS 16 Leases (effective for annual periods beginning on or after 1 January 2019)
IFRS 16 Leases is effective for accounting periods beginning on or after 1 January 2019. There will be changes to the Group’s net assets due to bringing the right of use asset relating to operating leases onto the balance sheet, and to the Group’s profit before tax as a result of the change in the treatment of the interest implicit in the lease and associated depreciation rather than the straight-line recognition of operating lease costs as they are currently recognised. The quantification of these changes and other effects on the Group is currently being assessed. The Group does not consider that any other standards, amendments or interpretations issued by the IASB, but not yet applicable, will have a significant impact on the financial statements.
2.2 Foreign currency translation(a) Functional and presentation currency
Items included in the financial statements of each entity in the Group are measured using the currency of the primary economic environment in which the entity operates (“functional currency”). The consolidated financial statements are presented in Pounds Sterling, which is different from the Company’s functional currency. The Company’s functional currency is the United States Dollar.
The financial statements are presented in Pounds Sterling, as the majority of the Company’s Shareholders are based in the UK and the Company is listed on the London Stock Exchange. It is the currency that the Directors of the Group use when controlling and monitoring the performance and financial position of the Group.
(b) Transactions and balances
Foreign currency transactions are translated into the functional currency at the exchange rates prevailing at the dates of the transactions or valuation where items are remeasured. Foreign exchange gains and losses resulting from the settlement of such transactions and from the translation at year-end exchange rates of monetary assets and liabilities denominated in foreign currencies are recognised in the statement of comprehensive income, except when deferred in other currency translation reserve as qualifying cash flow hedges.
Non-monetary items measured at fair value in foreign currencies are translated using exchange rates at the date when the fair values are determined. Currency translation differences on these items are included in other comprehensive income.
(c) Translation of Group entities’ financial statements
The results and financial position of all the Group entities that have a functional currency different from the presentation currency are translated into the presentation currency as follows:
i. assets and liabilities of the Group’s foreign operations are translated at exchange rates prevailing on the balance sheet date;
ii. income and expense items are translated at the average exchange rates for the period unless exchange rates fluctuate significantly and the average rate is not considered a reasonable approximation of the cumulative effect of the rates prevailing on the transaction dates in which case income and expenses are translated using the exchange rates at the dates of the transactions;
iii. exchange differences arising, if any, are recognised in other comprehensive income and accumulated in the currency translation reserve. These currency translation differences are reclassified to profit or loss on disposal or partial disposal of the entity giving rise to such reserve; and
iv. goodwill and fair value adjustments arising on the acquisition of a foreign entity are treated as assets and liabilities of the foreign entity and translated at the closing rate at the date of the balance sheet. The Group has elected to treat goodwill and fair value adjustments arising on the acquisitions before the date of transition to IFRS as Pound Sterling denominated assets and liabilities converted using the exchange rates at the dates of acquisition.
83
FIN
AN
CIA
LS
XP Power Annual Report & Accounts for the year ended 31 December 2017 stock code: XPP
2. Summary of significant accounting policies (continued)2.3 Revenue recognitionRevenue comprises the fair value of the consideration received or receivable for goods provided in the ordinary course of the Group’s business, net of discounts, Value Added Tax/Goods and Services Tax, returns and rebates, and after eliminating sales within the Group. The Group recognises revenue when the amount of revenue and related cost can be reliably measured, it is probable that the collectability of the related receivables is reasonably assured and when the specific criteria for each of the Group’s activities are met as follows:
(a) Sales of goods are recognised when a Group entity has shipped the goods to locations specified by its customers in accordance with the sales contract and the collectability of the related receivable is reasonably assured.
(b) Interest income is recognised using the effective interest method.
2.4 Group accounting(a) Subsidiaries
Subsidiaries are all entities (including special purpose entities) over which the Group has control. The Group controls an entity when the Group is exposed to, or has the rights to, variable returns from its involvement with the entity and has the ability to affect those returns through its power over the entity. The existence and effect of potential voting rights that are currently exercisable or convertible are considered when assessing whether the Group controls another entity. Subsidiaries are fully consolidated from the date on which control is transferred to the Group. They are deconsolidated from the date that control ceases.
The Group uses the acquisition method of accounting to account for business combinations. The consideration transferred for the acquisition of a subsidiary comprises the fair value of the assets transferred, the liabilities incurred and the equity interests issued by the Group. The consideration transferred also includes the fair value of any asset or liability resulting from a contingent consideration arrangement and the fair value of any pre-existing equity interest in the subsidiary. Acquisition-related costs are expensed as incurred. Identifiable assets acquired and liabilities and contingent liabilities assumed in a business combination are measured initially at their fair values at the acquisition date. On an acquisition-by-acquisition basis, the Group recognises any non-controlling interest in the acquiree either at fair value or at the non-controlling interest’s proportionate share of the acquiree’s net assets.
The excess of the consideration transferred, the amount of any non-controlling interest in the acquiree and the acquisition-date fair value of any previously held equity interest in the acquiree over the fair value of the identifiable net assets acquired, is recorded as goodwill. If this is less than the fair value of the net assets of the subsidiary acquired in the case of a bargain purchase, the difference is recognised directly in the statement of comprehensive income.
Inter-company transactions, balances and unrealised gains on transactions between Group companies are eliminated. Unrealised losses are also eliminated. Accounting policies of subsidiaries have been changed where necessary to ensure consistency with the policies adopted by the Group.
Investments in subsidiaries are accounted for at cost less impairment in the separate financial statements. This cost of investment is subsequently adjusted to reflect changes in contingent consideration, if any. In the separate financial statements, cost of investment in subsidiaries also includes directly attributable acquisition costs.
(b) Transactions with non-controlling interests
Non-controlling interests comprise the portion of a subsidiary’s net results of operations and its net assets, which is attributable to the interests that are not owned directly or indirectly by the equity holders of the Company. They are shown separately in the consolidated statement of comprehensive income, statement of changes in equity, and balance sheet. Total comprehensive income is attributed to the non-controlling interests based on their respective interests in a subsidiary, even if this results in the non-controlling interests having a deficit balance.
The Group treats transactions with non-controlling interests as transactions with equity owners of the Group. For purchases of shares from non-controlling interests, the difference between any consideration paid and the relevant share acquired of the carrying value of net assets of the subsidiary, is recorded in equity. Gains or losses on disposals to non-controlling interests are also recorded in equity.
When the Group ceases to have control or significant influence, any retained interest in the entity is remeasured to its fair value, with the change in carrying amount recognised in the statement of comprehensive income. The fair value is the initial carrying amount for the purposes of subsequently accounting for the retained interest as an associate, joint venture or financial asset. In addition, any amounts previously recognised in other comprehensive income in respect of that entity are accounted for as if the Group had directly disposed of the related assets or liabilities. This may mean that amounts previously recognised in other comprehensive income are reclassified to the statement of comprehensive income.

84
HeadingNotes to the Consolidated Financial StatementsFOR THE FINANCIAL YEAR ENDED 31 DECEMBER 2017
2. Summary of significant accounting policies (continued)2.5 InventoriesInventories are stated at the lower of cost and net realisable value. The cost of finished goods and work-in-progress comprises raw materials, direct labour, other direct costs and related production overheads (based on normal operating capacity) but excludes borrowing costs.
Cost is calculated using the weighted average method. Net realisable value represents the estimated selling price less all estimated costs of completion and costs to be incurred in marketing, selling and distribution.
2.6 Property, plant and equipmentItems of property, plant and equipment, including land and buildings, are stated at historical cost less accumulated depreciation and any recognised impairment losses.
The historical cost of an item of property, plant and equipment initially recognised includes its purchase price and any cost that is directly attributable to bringing the asset to the location and condition necessary for it to be capable of operating in the manner intended by management.
Subsequent costs are included in the asset’s carrying amount, as appropriate, only when it is probable that future economic benefits associated with the item will flow to the Group and the cost of the item can be measured reliably. All other repairs and maintenance are charged to the statement of comprehensive income during the financial period in which they are incurred.
Freehold land and property under development are not depreciated. Depreciation on other items of property, plant and equipment is calculated using the straight-line method to allocate their cost over their estimated useful lives as follows:
Plant and equipment – 10 – 33%Motor vehicles – 20 – 25%Building improvements – 10 – 33%Buildings – 2 – 5%Leasehold land and buildings – 2 – 5%
The residual values, estimated useful lives and depreciation method of property, plant and equipment are reviewed, and adjusted as appropriate, at each balance sheet date. The effects of any revision are recognised in the statement of comprehensive income when the changes arise.
An asset’s carrying amount is written down immediately to its recoverable amount if the asset’s carrying amount is greater than its estimated recoverable amount.
Gains or losses arising on the disposal or retirement of an asset are determined as the difference between the sale proceeds less cost to sell and the carrying amount of the asset, and are recognised in the statement of comprehensive income.
2.7 Intangible assets(a) Goodwill
The excess of the consideration transferred, the amount of non-controlling interest in the acquiree and the acquisition-date fair value of any previous equity interest in the acquiree over the fair value of the Group’s share of identifiable net assets acquired, is recorded as goodwill.
Goodwill is tested annually for impairment and whenever there is an indication that the goodwill may be impaired. Goodwill is carried at cost less accumulated impairment losses. Impairment losses on goodwill are not reversed. Gains and losses on the disposal of an entity include the carrying amount of goodwill relating to the entity sold.
Goodwill is allocated to cash-generating units for the purpose of impairment testing. The allocation is made to those cash-generating units or groups of cash-generating units that are expected to benefit from the business combination in which the goodwill arose, identified according to operating segment.
85
FIN
AN
CIA
LS
XP Power Annual Report & Accounts for the year ended 31 December 2017 stock code: XPP
2. Summary of significant accounting policies (continued)2.7 Intangible assets (continued)(b) Internally generated intangible assets – research and development expenditure
Expenditure on research activities is recognised as an expense as incurred.
An internally generated intangible asset arising from the Group’s product development is recognised only if all of the following criteria are met:
} There is an ability to use or sell the asset;
} Management intends to complete the asset and use or sell it;
} It can be demonstrated the asset will generate probable future economic benefits;
} It is technically feasible to complete the asset so that it will be available for use;
} Adequate technical, financial and other resources to complete the development and to use or sell the asset are available; and
} The expenditure attributable to the asset during its development can be reliably measured.
Internally generated intangible assets are amortised on a straight-line basis over their useful lives, which vary between four and seven years depending on the exact nature of the project undertaken. Amortisation commences when the product is ready and available for use.
(c) Other intangible assets
Other intangible assets that are acquired by the Group are initially recognised at cost. The cost of intangible assets acquired in a business combination is its fair value as at the date of acquisition. Following initial recognition, intangible assets are carried at cost less any accumulated amortisation. Amortisation is recognised in the statement of comprehensive income on a straight-line basis over the estimated useful lives, which vary between two and ten years, of the intangible assets.
2.8 Impairment of non-financial assets(a) Goodwill
Goodwill recognised separately as an intangible asset is tested for impairment annually and whenever there is indication that the goodwill may be impaired.
For the purpose of impairment testing of goodwill, goodwill is allocated to each of the Group’s cash-generating units (“CGU”) expected to benefit from synergies arising from the business combination.
An impairment loss is recognised when the carrying amount of a CGU, including the goodwill, exceeds the recoverable amount of the CGU. The recoverable amount of a CGU is the higher of the CGU’s fair value less cost to sell and value-in-use.
The total impairment loss of a CGU is allocated first to reduce the carrying amount of goodwill allocated to the CGU and then to the other assets of the CGU pro-rata on the basis of the carrying amount of each asset in the CGU.
An impairment loss on goodwill is recognised as an expense and is not reversed in a subsequent period.
(b) Intangible assetsProperty, plant and equipmentInvestments in subsidiaries
Assets that are subject to amortisation and depreciation are reviewed for impairment whenever events or changes in circumstances indicate that the carrying amount may not be recoverable. An impairment loss is recognised for the amount by which the asset’s carrying amount exceeds its recoverable amount. The recoverable amount is the higher of an asset’s fair value less costs to sell and value-in-use. For the purposes of assessing impairment, assets are grouped at the lowest levels for which there are separately identifiable cash flows (cash-generating units). Non-financial assets other than goodwill that suffered impairment are reviewed for possible reversal of the impairment at each reporting date.
2.9 Fair value estimation of financial assets and liabilitiesThe fair values of financial instruments traded in active markets (such as exchange-traded and over-the-counter securities and derivatives) are based on quoted market prices at the balance sheet date. The quoted market prices used for financial assets are the current bid prices; the appropriate quoted market prices used for financial liabilities are the current asking prices.
The fair values of currency forwards are determined using actively quoted forward exchange rates.
The fair values of current financial assets and liabilities carried at amortised cost approximate their carrying amounts.
86
HeadingNotes to the Consolidated Financial StatementsFOR THE FINANCIAL YEAR ENDED 31 DECEMBER 2017
2. Summary of significant accounting policies (continued)2.10 Financial assets(a) Classification
The Group classifies its financial assets depending on the nature of the asset and the purpose for which the assets were acquired. Management determines the classification of its financial assets at initial recognition. The Group’s financial assets comprise loans and receivables.
Loans and receivables are non-derivative financial assets with fixed or determinable payments that are not quoted in an active market. They are presented as current assets, except for those maturing later than 12 months after the balance sheet date, which are presented as non-current assets. Loans and receivables are presented as “trade receivables”, “other current assets”, “cash and cash equivalents” and “ESOP loans to employees” in the balance sheet.
(b) Recognition/derecognition
Regular purchases and sales of financial assets are recognised on the trade-date – the date on which the Group commits to purchase or sell the asset. Financial assets are derecognised when the rights to receive cash flows from the financial assets have expired or have been transferred and the Group has transferred substantially all risks and rewards of ownership. On disposal of a financial asset, the difference between the carrying amount and the sale proceeds is recognised in the statement of comprehensive income. Loans and receivables are initially recognised at fair value plus transaction costs and subsequently carried at amortised cost using the effective interest method.
(c) Impairment
The Group assesses at the end of each reporting period whether there is objective evidence that a financial asset or group of financial assets is impaired. A financial asset or a group of financial assets is impaired and impairment losses are incurred only if there is objective evidence of impairment as a result of one or more events that occurred after the initial recognition of the asset (a “loss event”) and that loss event (or events) has an impact on the estimated future cash flows of the financial asset or group of financial assets that can be reliably estimated.
The amount of the loss is measured as the difference between the asset’s carrying amount and the present value of estimated future cash flows (excluding future credit losses that have not been incurred) discounted at the financial asset’s original effective interest rate. The carrying amount of the asset is reduced and the amount of the loss is recognised in the statement of comprehensive income.
If, in a subsequent period, the amount of the impairment loss decreases and the decrease can be related objectively to an event occurring after the impairment was recognised (such as an improvement in the debtor’s credit rating), the reversal of the previously recognised impairment loss is recognised in the statement of comprehensive income.
(d) Offsetting financial instruments
Financial assets and liabilities are offset and the net amount reported in the balance sheet when there is a legally enforceable right to offset and there is an intention to settle on a net basis or realise the asset and the liability simultaneously.
2.11 Trade and other payablesTrade payables are obligations to pay for goods and services that have been acquired in the ordinary course of business from suppliers. Accounts payable are classified as current liabilities if payment is due within one year or less (or in the normal operating cycle of the business if longer). If not, they are presented as non-current liabilities.
Trade and other payables are initially recognised at fair value, and subsequently carried at amortised cost using the effective interest method.
2.12 ProvisionsProvisions are recognised when the Group has a present legal or constructive obligation as a result of past events, and it is more likely than not that an outflow of resources will be required to settle the obligation and the amount has been reliably estimated.
Provisions are measured at the present value of the expenditure expected to be required to settle the obligation using a pre-tax discount rate that reflects the current market assessment of the time value of money and the risks specific to the obligation. The increase in the provision due to the passage of time is recognised as a finance expense. Changes in the estimated timing or amount of the expenditure or discount rate are recognised in the statement of comprehensive income when the changes arise.
87
FIN
AN
CIA
LS
XP Power Annual Report & Accounts for the year ended 31 December 2017 stock code: XPP
2. Summary of significant accounting policies (continued)2.13 BorrowingsBorrowings are recognised initially at fair value, net of transaction costs incurred. Borrowings are subsequently carried at amortised cost; any difference between the proceeds (net of transaction costs) and the redemption value is recognised in the statement of comprehensive income over the period of the borrowings using the effective interest method.
Fees paid on the establishment of loan facilities are recognised as transaction costs of the loan to the extent that it is probable that some or all of the facility will be drawn down. In this case, the fee is deferred until the drawdown occurs. To the extent there is no evidence that it is probable that some or all of the facility will be drawn down, the fee is capitalised as a prepayment for liquidity services and amortised over the period of the facility to which it relates.
Borrowings are presented as current liabilities unless the Group has an unconditional right to defer settlement for at least 12 months after the balance sheet date, in which case they are presented as non-current liabilities.
2.14 LeasesLeases in which a significant portion of the risks and rewards of ownership are retained by the lessors are classified as operating leases. Payments made under operating leases (net of any incentives received from the lessors) are charged to the statement of comprehensive income on a straight-line basis over the period of the lease.
2.15 Derivative financial instruments and hedging activitiesDerivatives are initially recognised at fair value on the date the contract is entered into and are subsequently remeasured at their fair value. The method of recognising the resulting gain or loss depends on whether the derivative is designated as a hedging instrument, and if so, the nature of the item being hedged.
The Group designates certain derivatives as hedges of a particular risk associated with a recognised asset or liability or a highly probable forecast transaction (cash flow hedge).
The Group documents at the inception of the transaction the relationship between the hedging instruments and hedged items, as well as its risk management objective and strategies for undertaking various hedge transactions. The Group also documents its assessment, both at hedge inception and on an ongoing basis, on whether the derivatives designated as hedging instruments are highly effective in offsetting changes in fair value or cash flows of the hedged items.
The Group’s activities expose it primarily to the financial risks of changes in foreign currency exchange rates and interest rates. The Group periodically uses foreign exchange forward contracts to hedge the foreign currency exposures.
Cash flow hedge
i. Currency forwards
The Group has entered into currency forwards that qualify as cash flow hedges against highly probable forecasted transactions in foreign currencies. The effective portion of changes in the fair value of derivatives that are designated and qualify as cash flow hedges is recognised in other comprehensive income. The gain or loss relating to the ineffective portion is recognised immediately in the statement of comprehensive income.
When a hedging instrument expires or is sold, or when a hedge no longer meets the criteria for hedge accounting, any cumulative gain or loss existing in equity at that time is recognised when the forecasted transaction is ultimately recognised in the statement of comprehensive income. When a forecasted transaction is no longer expected to occur, the cumulative gains and losses that were previously recognised in equity are transferred to the statement of comprehensive income immediately.
Certain derivative instruments do not qualify for hedge accounting. Changes in the fair value of these derivative instruments are recognised immediately in the statement of comprehensive income.
Amounts accumulated in equity are reclassified to the statement of comprehensive income in the periods when the hedged item affects profit or loss.
The fair values of various derivative instruments used for hedging purposes are disclosed in Note 22. Movements on the hedging reserve in other comprehensive income are shown in Note 24. The full fair value of a hedging derivative is classified as a non-current asset or liability when the remaining expected life/or maturity of the hedged item is more than 12 months, and as a current asset or liability when the remaining maturity of the hedged item is less than 12 months.
88
HeadingNotes to the Consolidated Financial StatementsFOR THE FINANCIAL YEAR ENDED 31 DECEMBER 2017
2. Summary of significant accounting policies (continued)2.16 Current and deferred income taxThe tax expense represents the sum of the tax currently payable and deferred tax.
The tax currently payable is based on the taxable profit for the year. Taxable profit differs from net profit as reported in the statement of comprehensive income because it excludes items of income or expense that are taxable or deductible in other years and it further excludes items that are never taxable or deductible. The Group’s liability for current tax is calculated using tax rates that have been enacted or substantively enacted by the balance sheet date.
Deferred tax is the tax expected to be payable or recoverable on differences between the carrying amounts of assets and liabilities in the financial statements and the corresponding tax bases used in the computation of taxable profit, and is accounted for using the balance sheet liability method.
Deferred tax liabilities are generally recognised for all taxable temporary differences and deferred tax assets are recognised to the extent that it is probable that taxable profits will be available against which deductible temporary differences can be utilised. Such assets and liabilities are not recognised if the temporary difference arises from goodwill or from the initial recognition (other than in a business combination) of other assets and liabilities in a transaction that affects neither the tax profit nor the accounting profit.
Deferred tax liabilities are recognised for taxable temporary differences arising on investments in subsidiaries and associates, and interests in joint ventures, except where the Group is able to control the reversal of the temporary difference and it is probable that the temporary difference will not reverse in the foreseeable future.
Deferred tax is calculated at the tax rates that are expected to apply in the period when the liability is settled or the asset is realised. Deferred tax is charged or credited in the statement of comprehensive income, except when it relates to items charged or credited directly to equity in which case the deferred tax is also dealt with in equity.
Deferred tax assets and liabilities are offset when there is a legally enforceable right to set off current tax assets against current tax liabilities and when they relate to income taxes levied by the same taxation authority and the Group intends to settle its current tax assets and liabilities on a net basis.
As the timing of the tax deduction and the recognition of the employee share option expense differs, FRS 12 requires the recognition of the related deferred tax asset if the deferred tax asset recognition criteria are met. For an equity-settled share-based payment, if the cumulative amount of tax deduction exceeds the tax effect of the related cumulative remuneration expense at the reporting date, the excess of the associated deferred tax shall be recognised directly in equity. All taxes related to cash-settled share-based payments shall be recognised in profit or loss.
2.17 Cash and cash equivalentsFor the purpose of presentation in the consolidated cash flow statement, cash and cash equivalents include cash on hand, deposits with financial institutions and bank overdrafts. Bank overdrafts are presented as current liabilities on the balance sheet.
2.18 Share-based paymentsThe Group issues equity-settled share-based payments to certain employees. Equity-settled share-based payments are measured at fair value at the date of grant. The fair value determined at the grant date of the equity-settled share-based payments is expensed on a straight-line basis over the vesting period, based on the Group’s estimate of shares that will eventually vest. The vesting conditions are service conditions and performance conditions only. At each balance sheet date, the Group revises its estimates of the number of shares under options that are expected to become exercisable on the vesting date and recognises the impact of the revision of the estimates in the statement of comprehensive income, with a corresponding adjustment to the treasury share reserve over the remaining vesting period.
When the options are exercised, the proceeds received (net of transaction costs) and the related balance previously recognised in the share option reserve are credited to share capital account, when new ordinary shares are issued, or to the “treasury shares” account, when treasury shares are reissued to the employees.
89
FIN
AN
CIA
LS
XP Power Annual Report & Accounts for the year ended 31 December 2017 stock code: XPP
2. Summary of significant accounting policies (continued)2.19 Defined contribution plansThe Group operates several defined contribution plans. Defined contribution plans are post-employment benefit plans under which the Group pays fixed contributions into separate entities on a mandatory, contracted or voluntary basis. The Group has no further payment obligations once the contributions have been paid.
2.20 Employee leave entitlementsEmployee entitlements to annual leave are recognised in the statement of comprehensive income when they accrue to employees. A provision is made for the estimated liability for leave as a result of services rendered by employees up to the balance sheet date.
2.21 Share capital and treasury sharesOrdinary shares are classified as equity. Incremental costs directly attributable to the issue of new ordinary shares are shown in equity, net of tax, from the proceeds.
When any entity within the Group purchases the Company’s ordinary shares (“treasury shares”), the consideration paid, including any directly attributable incremental cost (net of income taxes), is deducted from equity attributable to the Company’s equity holders, until they are cancelled, sold or reissued.
When treasury shares are subsequently cancelled, the cost of treasury shares are deducted against the share capital account if the shares are purchased out of capital of the Company, or against the retained earnings of the Company if the shares are purchased out of earnings of the Company.
When treasury shares are subsequently sold or reissued pursuant to the employee share option scheme, the cost of treasury shares is reversed from the treasury share reserve and the realised gain or loss on sale or reissue, net of any directly attributable incremental transaction costs and related income tax, is recognised in the retained earnings of the Company.
Other reserve comprises future transactions with the non-controlling interest. The amount that may become payable under the agreement is initially recognised at the present value of the redemption amount within liabilities with a corresponding charge directly to equity. The liability is subsequently accreted through finance charges up to the redemption amount that is payable at the date at which the agreement first becomes exercisable.
2.22 Dividend distributionDividend distributions to the Company’s Shareholders are recognised when the dividends are approved for payment or, in the case of interim dividends, when paid.
2.23 Segment reportingOperating segments are reported in a manner consistent with the internal reporting provided to the Chief Operating Decision Makers who are responsible for allocating resources and assessing performance of the operating segments. Segment reporting is disclosed in Note 4.
90
HeadingNotes to the Consolidated Financial StatementsFOR THE FINANCIAL YEAR ENDED 31 DECEMBER 2017
3. Critical accounting judgements and key sources of estimation uncertaintyIn the process of applying the Group’s accounting policies, as described in Note 2, management has made the following judgements and estimations that have the most significant effect on the amounts recognised in the financial statements.
(a) Recoverability of Capitalised R&D
During the year £5.2 million (2016: £4.2 million) of development costs were capitalised, bringing the total amount of development costs capitalised as intangible assets as at 31 December 2017 to £16.0 million (2016: £14.2 million), net of amortisation. Management has reviewed the balances by project, compared the carrying amount to expected future revenues and profits and is satisfied that no impairment exists and that the costs capitalised will be fully recovered as the products are launched to market. New product projects are monitored regularly and should the technical or market feasibility of a new product be in question, the project would be cancelled and capitalised costs to date will be removed from the balance sheet and charged to the statement of comprehensive income.
(b) Impairment of Goodwill
The Group tests annually for impairment of goodwill, or more frequently if there are indications that goodwill might be impaired.
An impairment loss is recognised when the carrying amount of a CGU, including the goodwill, exceeds the recoverable amount of the CGU. The recoverable amount of a CGU is the higher of the CGU’s fair value less cost to sell and value-in-use.
The recoverable amount of the goodwill is determined from value-in-use calculations. The key assumptions and estimates for the value-in-use calculations are those regarding the discount rates, growth rates and expected changes to sales and overheads during the period. Management estimates discount rates using pre-tax rates that reflect current market assessments of the time value of money and the risks specific to the cash generating units.
The Group prepares cash flow forecasts derived from the most recent financial results and takes into account industry growth forecasts for the next five years and extrapolates cash flows for the following five years assuming no growth from that date. The carrying amount of goodwill as at 31 December 2017 was £41.0 million (2016: £37.7 million) with no impairment adjustment required for 2017.
Management assessed that there are no realistic foreseeable changes that will result in impairment loss on the goodwill allocated to the North America, Europe and Asia operating segments.
(c) Estimation of future accrued consideration payments
As at the balance sheet date, the Group has recorded an estimated future payment related to the acquisition of the final 10.1% of Powersolve Electronics Limited. The Group will acquire the remaining 10.1% of Powersolve Electronics Limited in early 2022. When discounted to present value, the total of these payments is estimated at £0.6 million and that amount is reflected on the balance sheet. Since the final payment will be dependent on the actual financial performance of the business, an estimate is required to approximate future business conditions. Refer to Note 20 for more details.
As at the balance sheet date, the Group has recorded an estimated future payment related to the acquisition of additional 30.0% of Hanpower Co., Ltd. The Group will acquire 15.0% of Hanpower Co., Ltd in early 2020 and the remaining 15.0% in early 2025. When discounted to present value, the total of these payments is estimated at £0.9 million and that amount is reflected on the balance sheet. Since the final payment will be dependent on the actual financial performance of the business, an estimate is required to approximate future business conditions. Refer to Note 20 for more details.
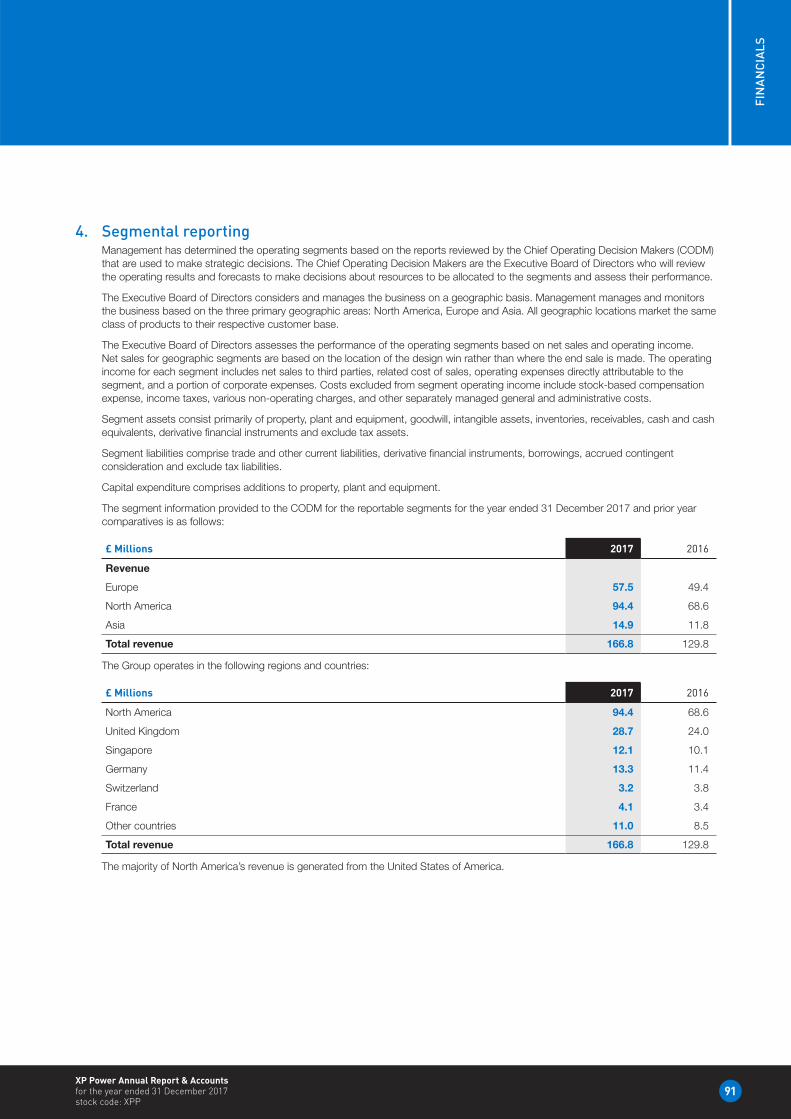
91
FIN
AN
CIA
LS
XP Power Annual Report & Accounts for the year ended 31 December 2017 stock code: XPP
4. Segmental reportingManagement has determined the operating segments based on the reports reviewed by the Chief Operating Decision Makers (CODM) that are used to make strategic decisions. The Chief Operating Decision Makers are the Executive Board of Directors who will review the operating results and forecasts to make decisions about resources to be allocated to the segments and assess their performance.
The Executive Board of Directors considers and manages the business on a geographic basis. Management manages and monitors the business based on the three primary geographic areas: North America, Europe and Asia. All geographic locations market the same class of products to their respective customer base.
The Executive Board of Directors assesses the performance of the operating segments based on net sales and operating income. Net sales for geographic segments are based on the location of the design win rather than where the end sale is made. The operating income for each segment includes net sales to third parties, related cost of sales, operating expenses directly attributable to the segment, and a portion of corporate expenses. Costs excluded from segment operating income include stock-based compensation expense, income taxes, various non-operating charges, and other separately managed general and administrative costs.
Segment assets consist primarily of property, plant and equipment, goodwill, intangible assets, inventories, receivables, cash and cash equivalents, derivative financial instruments and exclude tax assets.
Segment liabilities comprise trade and other current liabilities, derivative financial instruments, borrowings, accrued contingent consideration and exclude tax liabilities.
Capital expenditure comprises additions to property, plant and equipment.
The segment information provided to the CODM for the reportable segments for the year ended 31 December 2017 and prior year comparatives is as follows:
£ Millions 2017 2016
Revenue
Europe 57.5 49.4
North America 94.4 68.6
Asia 14.9 11.8
Total revenue 166.8 129.8
The Group operates in the following regions and countries:
£ Millions 2017 2016
North America 94.4 68.6
United Kingdom 28.7 24.0
Singapore 12.1 10.1
Germany 13.3 11.4
Switzerland 3.2 3.8
France 4.1 3.4
Other countries 11.0 8.5
Total revenue 166.8 129.8
The majority of North America’s revenue is generated from the United States of America.
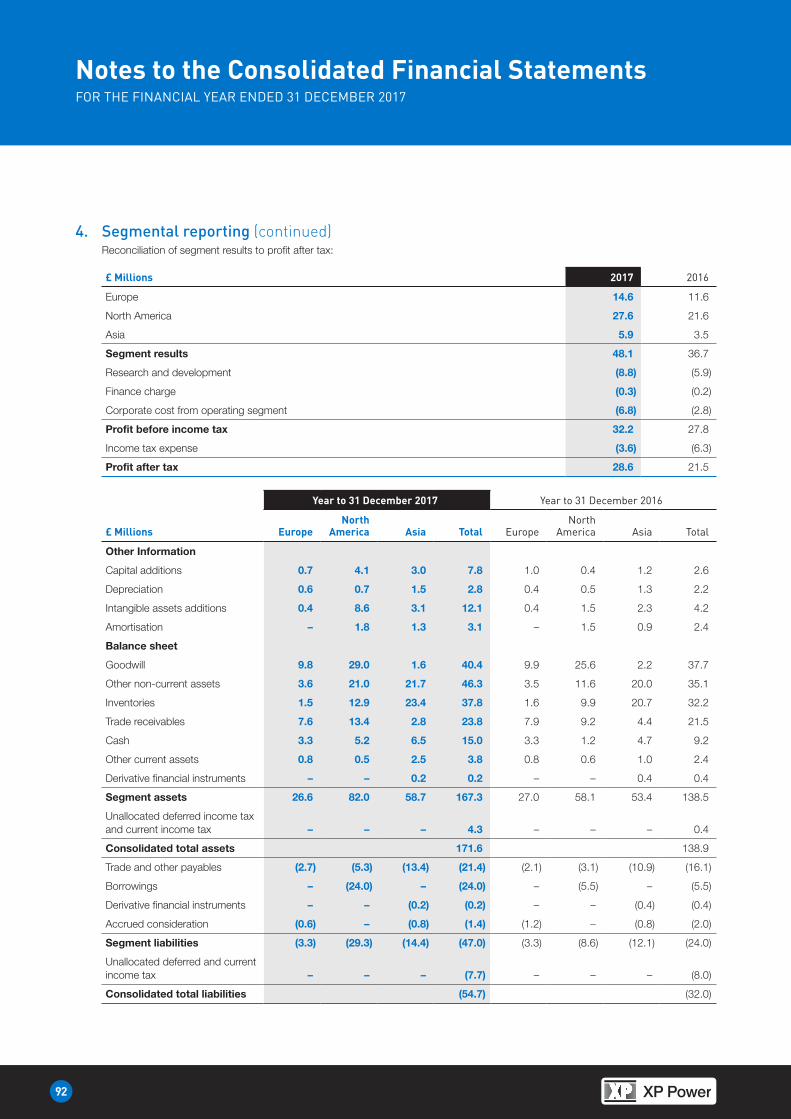
92
HeadingNotes to the Consolidated Financial StatementsFOR THE FINANCIAL YEAR ENDED 31 DECEMBER 2017
4. Segmental reporting (continued)Reconciliation of segment results to profit after tax:
£ Millions 2017 2016
Europe 14.6 11.6
North America 27.6 21.6
Asia 5.9 3.5
Segment results 48.1 36.7
Research and development (8.8) (5.9)
Finance charge (0.3) (0.2)
Corporate cost from operating segment (6.8) (2.8)
Profit before income tax 32.2 27.8
Income tax expense (3.6) (6.3)
Profit after tax 28.6 21.5
Year to 31 December 2017 Year to 31 December 2016
£ Millions EuropeNorth
America Asia Total EuropeNorth
America Asia Total
Other Information
Capital additions 0.7 4.1 3.0 7.8 1.0 0.4 1.2 2.6
Depreciation 0.6 0.7 1.5 2.8 0.4 0.5 1.3 2.2
Intangible assets additions 0.4 8.6 3.1 12.1 0.4 1.5 2.3 4.2
Amortisation – 1.8 1.3 3.1 – 1.5 0.9 2.4
Balance sheet
Goodwill 9.8 29.0 1.6 40.4 9.9 25.6 2.2 37.7
Other non-current assets 3.6 21.0 21.7 46.3 3.5 11.6 20.0 35.1
Inventories 1.5 12.9 23.4 37.8 1.6 9.9 20.7 32.2
Trade receivables 7.6 13.4 2.8 23.8 7.9 9.2 4.4 21.5
Cash 3.3 5.2 6.5 15.0 3.3 1.2 4.7 9.2
Other current assets 0.8 0.5 2.5 3.8 0.8 0.6 1.0 2.4
Derivative financial instruments – – 0.2 0.2 – – 0.4 0.4
Segment assets 26.6 82.0 58.7 167.3 27.0 58.1 53.4 138.5
Unallocated deferred income tax and current income tax – – – 4.3 – – – 0.4
Consolidated total assets 171.6 138.9
Trade and other payables (2.7) (5.3) (13.4) (21.4) (2.1) (3.1) (10.9) (16.1)
Borrowings – (24.0) – (24.0) – (5.5) – (5.5)
Derivative financial instruments – – (0.2) (0.2) – – (0.4) (0.4)
Accrued consideration (0.6) – (0.8) (1.4) (1.2) – (0.8) (2.0)
Segment liabilities (3.3) (29.3) (14.4) (47.0) (3.3) (8.6) (12.1) (24.0)
Unallocated deferred and current income tax – – – (7.7) – – – (8.0)
Consolidated total liabilities (54.7) (32.0)
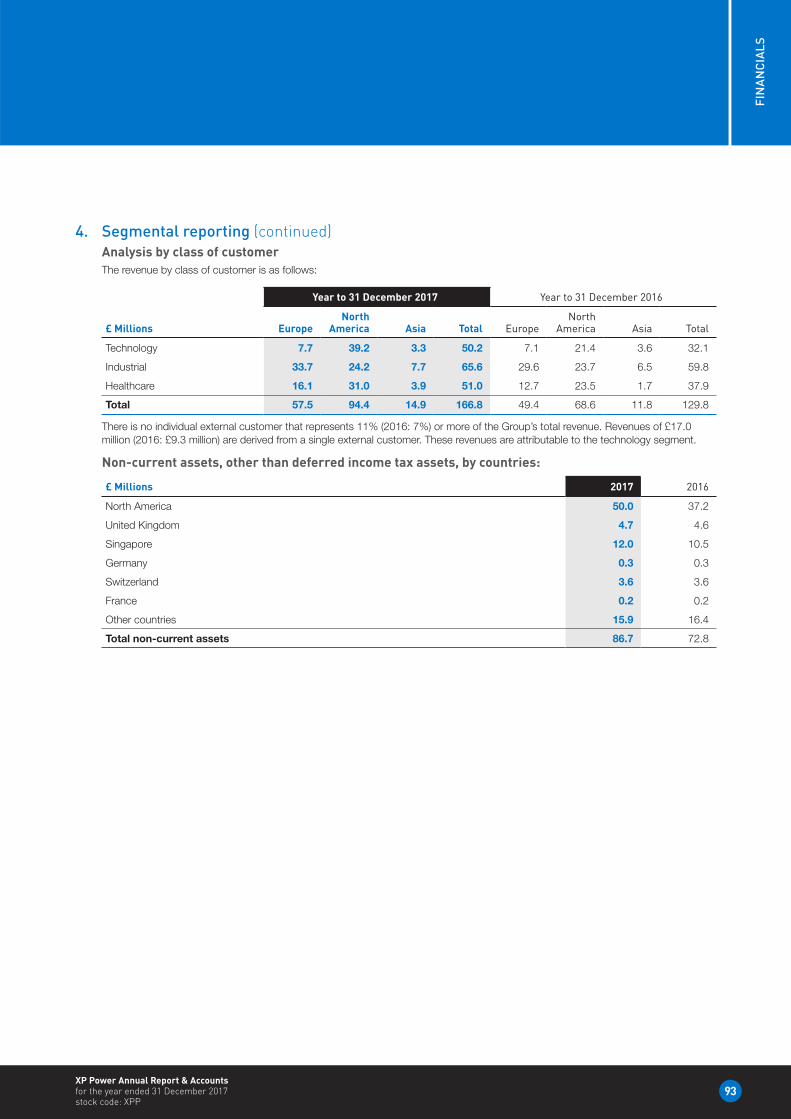
93
FIN
AN
CIA
LS
XP Power Annual Report & Accounts for the year ended 31 December 2017 stock code: XPP
4. Segmental reporting (continued)Analysis by class of customerThe revenue by class of customer is as follows:
Year to 31 December 2017 Year to 31 December 2016
£ Millions EuropeNorth
America Asia Total EuropeNorth
America Asia Total
Technology 7.7 39.2 3.3 50.2 7.1 21.4 3.6 32.1
Industrial 33.7 24.2 7.7 65.6 29.6 23.7 6.5 59.8
Healthcare 16.1 31.0 3.9 51.0 12.7 23.5 1.7 37.9
Total 57.5 94.4 14.9 166.8 49.4 68.6 11.8 129.8
There is no individual external customer that represents 11% (2016: 7%) or more of the Group’s total revenue. Revenues of £17.0 million (2016: £9.3 million) are derived from a single external customer. These revenues are attributable to the technology segment.
Non-current assets, other than deferred income tax assets, by countries:
£ Millions 2017 2016
North America 50.0 37.2
United Kingdom 4.7 4.6
Singapore 12.0 10.5
Germany 0.3 0.3
Switzerland 3.6 3.6
France 0.2 0.2
Other countries 15.9 16.4
Total non-current assets 86.7 72.8
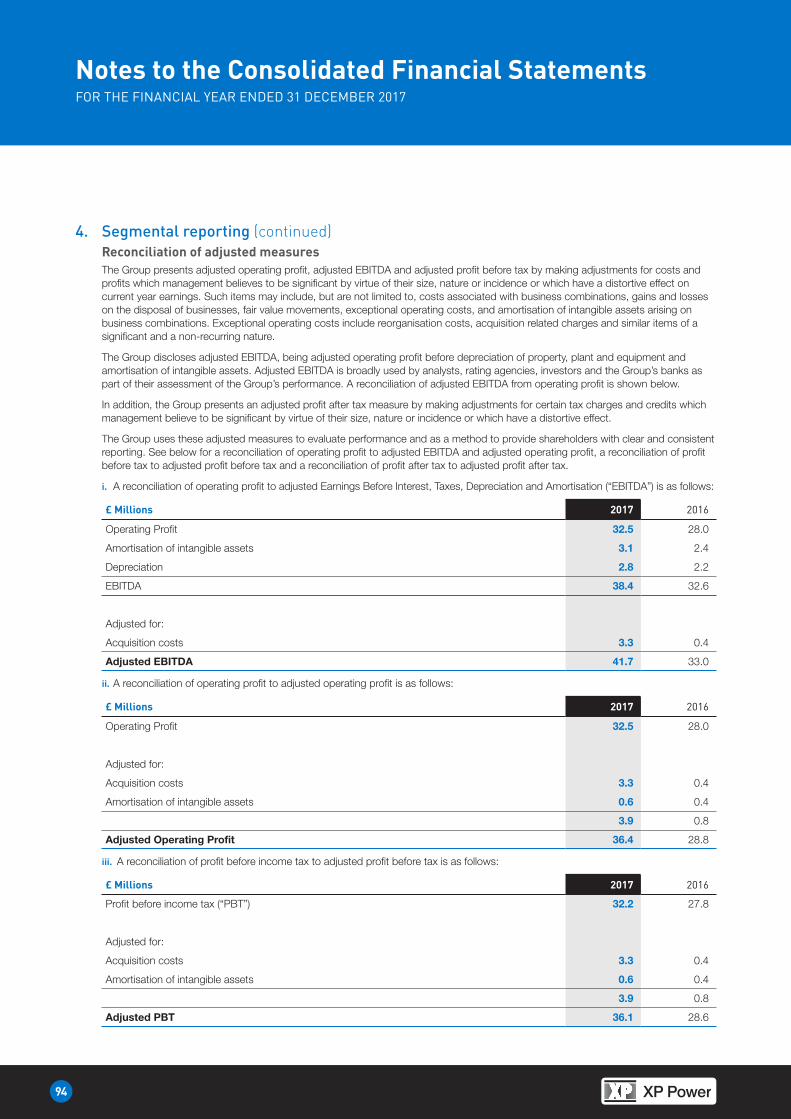
94
HeadingNotes to the Consolidated Financial StatementsFOR THE FINANCIAL YEAR ENDED 31 DECEMBER 2017
4. Segmental reporting (continued)Reconciliation of adjusted measuresThe Group presents adjusted operating profit, adjusted EBITDA and adjusted profit before tax by making adjustments for costs and profits which management believes to be significant by virtue of their size, nature or incidence or which have a distortive effect on current year earnings. Such items may include, but are not limited to, costs associated with business combinations, gains and losses on the disposal of businesses, fair value movements, exceptional operating costs, and amortisation of intangible assets arising on business combinations. Exceptional operating costs include reorganisation costs, acquisition related charges and similar items of a significant and a non-recurring nature.
The Group discloses adjusted EBITDA, being adjusted operating profit before depreciation of property, plant and equipment and amortisation of intangible assets. Adjusted EBITDA is broadly used by analysts, rating agencies, investors and the Group’s banks as part of their assessment of the Group’s performance. A reconciliation of adjusted EBITDA from operating profit is shown below.
In addition, the Group presents an adjusted profit after tax measure by making adjustments for certain tax charges and credits which management believe to be significant by virtue of their size, nature or incidence or which have a distortive effect.
The Group uses these adjusted measures to evaluate performance and as a method to provide shareholders with clear and consistent reporting. See below for a reconciliation of operating profit to adjusted EBITDA and adjusted operating profit, a reconciliation of profit before tax to adjusted profit before tax and a reconciliation of profit after tax to adjusted profit after tax.
i. A reconciliation of operating profit to adjusted Earnings Before Interest, Taxes, Depreciation and Amortisation (“EBITDA”) is as follows:
£ Millions 2017 2016
Operating Profit 32.5 28.0
Amortisation of intangible assets 3.1 2.4
Depreciation 2.8 2.2
EBITDA 38.4 32.6
Adjusted for:
Acquisition costs 3.3 0.4
Adjusted EBITDA 41.7 33.0
ii. A reconciliation of operating profit to adjusted operating profit is as follows:
£ Millions 2017 2016
Operating Profit 32.5 28.0
Adjusted for:
Acquisition costs 3.3 0.4
Amortisation of intangible assets 0.6 0.4
3.9 0.8
Adjusted Operating Profit 36.4 28.8
iii. A reconciliation of profit before income tax to adjusted profit before tax is as follows:
£ Millions 2017 2016
Profit before income tax (“PBT”) 32.2 27.8
Adjusted for:
Acquisition costs 3.3 0.4
Amortisation of intangible assets 0.6 0.4
3.9 0.8
Adjusted PBT 36.1 28.6
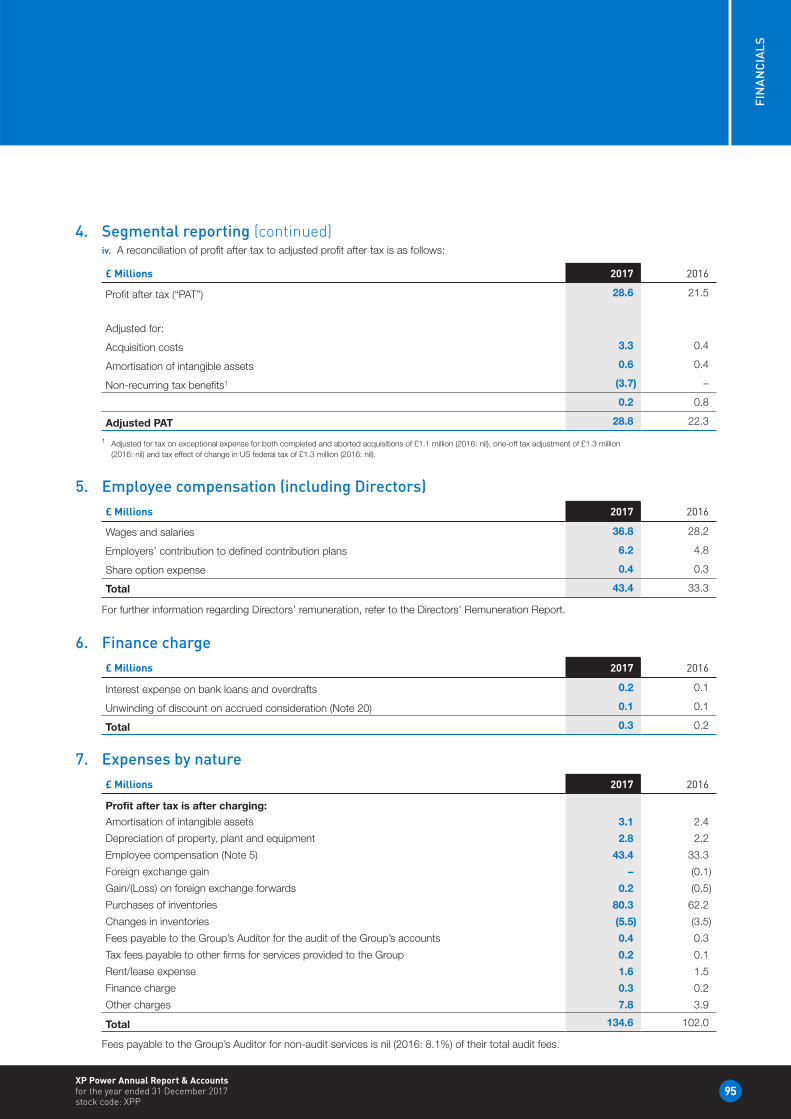
95
FIN
AN
CIA
LS
XP Power Annual Report & Accounts for the year ended 31 December 2017 stock code: XPP
4. Segmental reporting (continued)iv. A reconciliation of profit after tax to adjusted profit after tax is as follows:
£ Millions 2017 2016
Profit after tax (“PAT”) 28.6 21.5
Adjusted for:
Acquisition costs 3.3 0.4
Amortisation of intangible assets 0.6 0.4
Non-recurring tax benefits1 (3.7) –
0.2 0.8
Adjusted PAT 28.8 22.3
1 Adjusted for tax on exceptional expense for both completed and aborted acquisitions of £1.1 million (2016: nil), one-off tax adjustment of £1.3 million (2016: nil) and tax effect of change in US federal tax of £1.3 million (2016: nil).
5. Employee compensation (including Directors)£ Millions 2017 2016
Wages and salaries 36.8 28.2
Employers’ contribution to defined contribution plans 6.2 4.8
Share option expense 0.4 0.3
Total 43.4 33.3
For further information regarding Directors’ remuneration, refer to the Directors’ Remuneration Report.
6. Finance charge£ Millions 2017 2016
Interest expense on bank loans and overdrafts 0.2 0.1
Unwinding of discount on accrued consideration (Note 20) 0.1 0.1
Total 0.3 0.2
7. Expenses by nature£ Millions 2017 2016
Profit after tax is after charging:
Amortisation of intangible assets 3.1 2.4
Depreciation of property, plant and equipment 2.8 2.2
Employee compensation (Note 5) 43.4 33.3
Foreign exchange gain – (0.1)
Gain/(Loss) on foreign exchange forwards 0.2 (0.5)
Purchases of inventories 80.3 62.2
Changes in inventories (5.5) (3.5)
Fees payable to the Group’s Auditor for the audit of the Group’s accounts 0.4 0.3
Tax fees payable to other firms for services provided to the Group 0.2 0.1
Rent/lease expense 1.6 1.5
Finance charge 0.3 0.2
Other charges 7.8 3.9
Total 134.6 102.0
Fees payable to the Group’s Auditor for non-audit services is nil (2016: 8.1%) of their total audit fees.
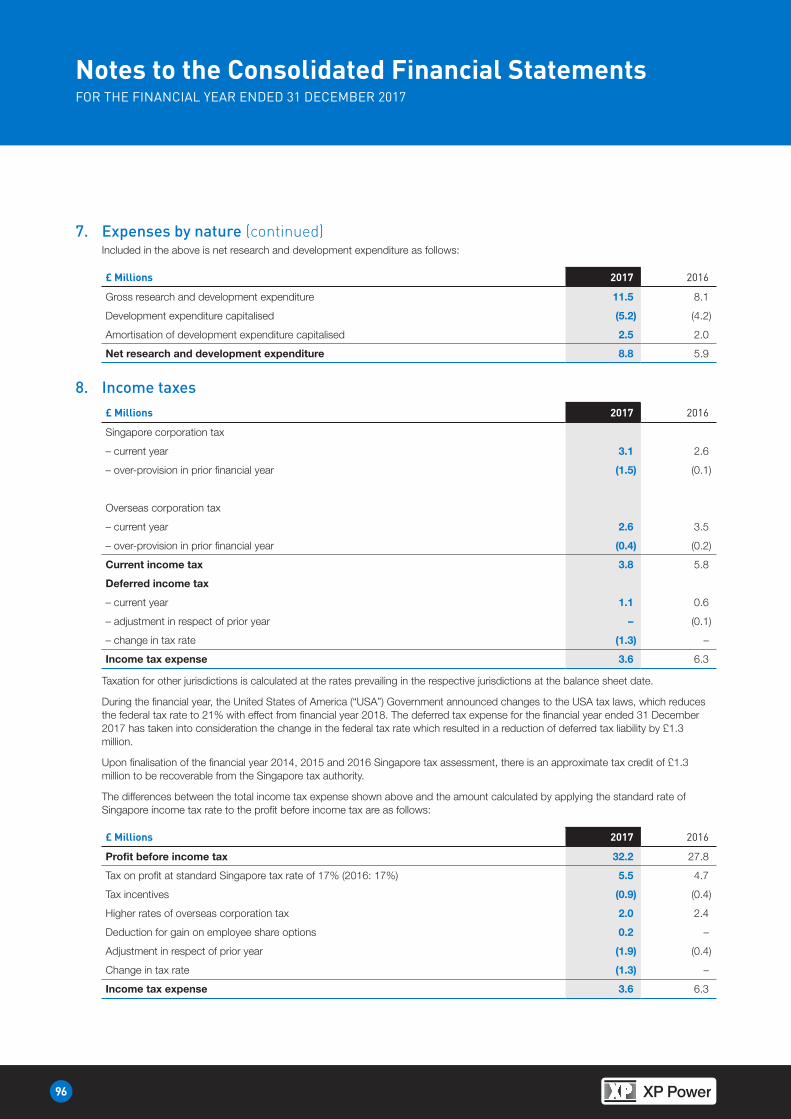
96
HeadingNotes to the Consolidated Financial StatementsFOR THE FINANCIAL YEAR ENDED 31 DECEMBER 2017
7. Expenses by nature (continued)Included in the above is net research and development expenditure as follows:
£ Millions 2017 2016
Gross research and development expenditure 11.5 8.1
Development expenditure capitalised (5.2) (4.2)
Amortisation of development expenditure capitalised 2.5 2.0
Net research and development expenditure 8.8 5.9
8. Income taxes£ Millions 2017 2016
Singapore corporation tax
– current year 3.1 2.6
– over-provision in prior financial year (1.5) (0.1)
Overseas corporation tax
– current year 2.6 3.5
– over-provision in prior financial year (0.4) (0.2)
Current income tax 3.8 5.8
Deferred income tax
– current year 1.1 0.6
– adjustment in respect of prior year – (0.1)
– change in tax rate (1.3) –
Income tax expense 3.6 6.3
Taxation for other jurisdictions is calculated at the rates prevailing in the respective jurisdictions at the balance sheet date.
During the financial year, the United States of America (“USA”) Government announced changes to the USA tax laws, which reduces the federal tax rate to 21% with effect from financial year 2018. The deferred tax expense for the financial year ended 31 December 2017 has taken into consideration the change in the federal tax rate which resulted in a reduction of deferred tax liability by £1.3 million.
Upon finalisation of the financial year 2014, 2015 and 2016 Singapore tax assessment, there is an approximate tax credit of £1.3 million to be recoverable from the Singapore tax authority.
The differences between the total income tax expense shown above and the amount calculated by applying the standard rate of Singapore income tax rate to the profit before income tax are as follows:
£ Millions 2017 2016
Profit before income tax 32.2 27.8
Tax on profit at standard Singapore tax rate of 17% (2016: 17%) 5.5 4.7
Tax incentives (0.9) (0.4)
Higher rates of overseas corporation tax 2.0 2.4
Deduction for gain on employee share options 0.2 –
Adjustment in respect of prior year (1.9) (0.4)
Change in tax rate (1.3) –
Income tax expense 3.6 6.3
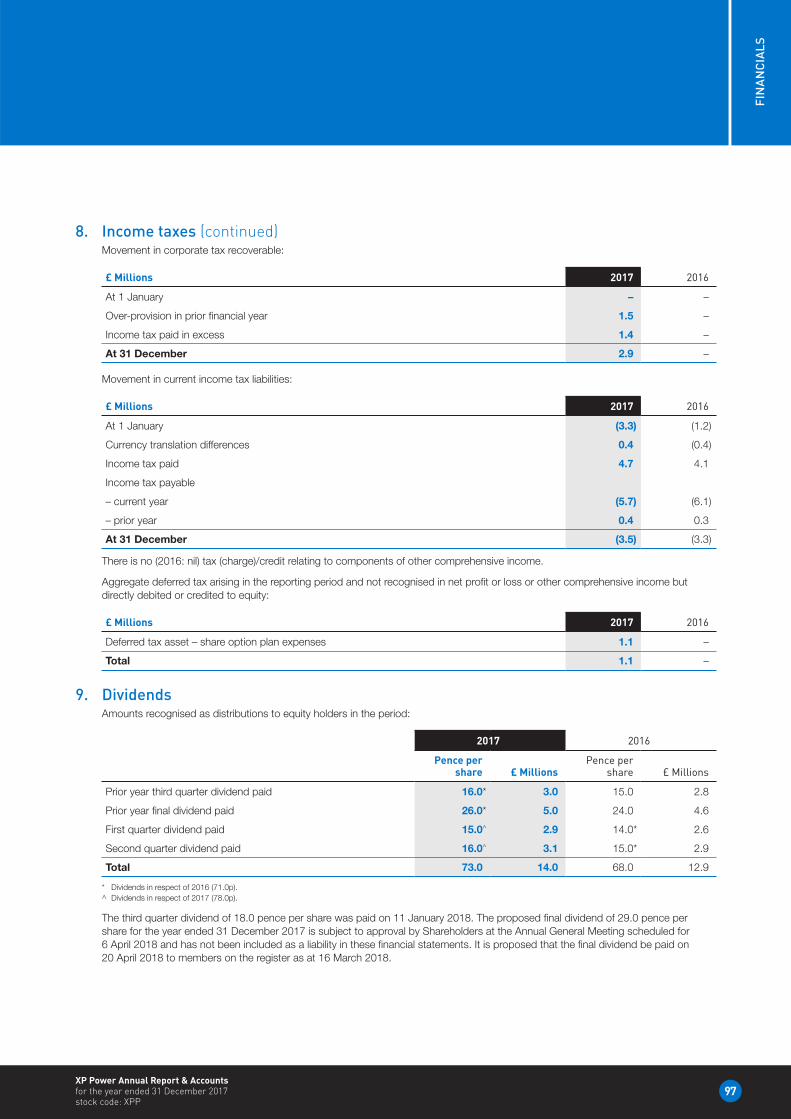
97
FIN
AN
CIA
LS
XP Power Annual Report & Accounts for the year ended 31 December 2017 stock code: XPP
8. Income taxes (continued)Movement in corporate tax recoverable:
£ Millions 2017 2016
At 1 January – –
Over-provision in prior financial year 1.5 –
Income tax paid in excess 1.4 –
At 31 December 2.9 –
Movement in current income tax liabilities:
£ Millions 2017 2016
At 1 January (3.3) (1.2)
Currency translation differences 0.4 (0.4)
Income tax paid 4.7 4.1
Income tax payable
– current year (5.7) (6.1)
– prior year 0.4 0.3
At 31 December (3.5) (3.3)
There is no (2016: nil) tax (charge)/credit relating to components of other comprehensive income.
Aggregate deferred tax arising in the reporting period and not recognised in net profit or loss or other comprehensive income but directly debited or credited to equity:
£ Millions 2017 2016
Deferred tax asset – share option plan expenses 1.1 –
Total 1.1 –
9. DividendsAmounts recognised as distributions to equity holders in the period:
2017 2016
Pence per share £ Millions
Pence per share £ Millions
Prior year third quarter dividend paid 16.0* 3.0 15.0 2.8
Prior year final dividend paid 26.0* 5.0 24.0 4.6
First quarter dividend paid 15.0^ 2.9 14.0* 2.6
Second quarter dividend paid 16.0^ 3.1 15.0* 2.9
Total 73.0 14.0 68.0 12.9
* Dividends in respect of 2016 (71.0p).^ Dividends in respect of 2017 (78.0p).
The third quarter dividend of 18.0 pence per share was paid on 11 January 2018. The proposed final dividend of 29.0 pence per share for the year ended 31 December 2017 is subject to approval by Shareholders at the Annual General Meeting scheduled for 6 April 2018 and has not been included as a liability in these financial statements. It is proposed that the final dividend be paid on 20 April 2018 to members on the register as at 16 March 2018.
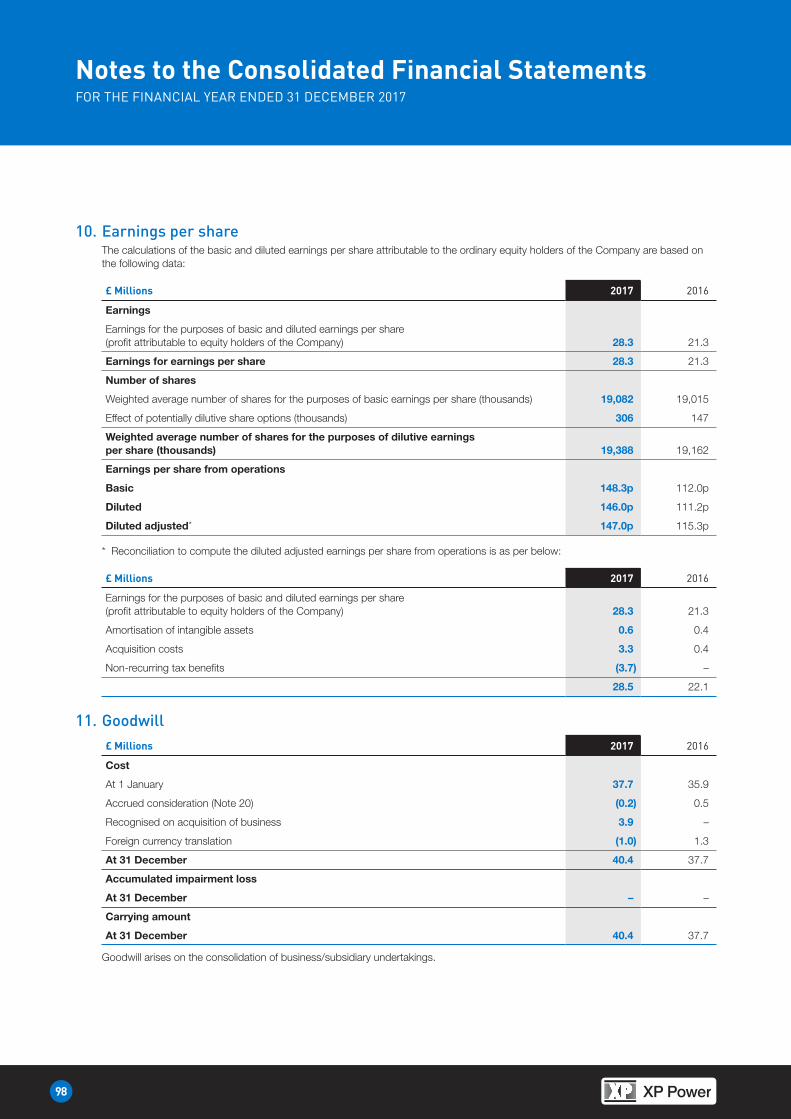
98
HeadingNotes to the Consolidated Financial StatementsFOR THE FINANCIAL YEAR ENDED 31 DECEMBER 2017
10. Earnings per shareThe calculations of the basic and diluted earnings per share attributable to the ordinary equity holders of the Company are based on the following data:
£ Millions 2017 2016
Earnings
Earnings for the purposes of basic and diluted earnings per share (profit attributable to equity holders of the Company) 28.3 21.3
Earnings for earnings per share 28.3 21.3
Number of shares
Weighted average number of shares for the purposes of basic earnings per share (thousands) 19,082 19,015
Effect of potentially dilutive share options (thousands) 306 147
Weighted average number of shares for the purposes of dilutive earnings per share (thousands) 19,388 19,162
Earnings per share from operations
Basic 148.3p 112.0p
Diluted 146.0p 111.2p
Diluted adjusted* 147.0p 115.3p
* Reconciliation to compute the diluted adjusted earnings per share from operations is as per below:
£ Millions 2017 2016
Earnings for the purposes of basic and diluted earnings per share (profit attributable to equity holders of the Company) 28.3 21.3
Amortisation of intangible assets 0.6 0.4
Acquisition costs 3.3 0.4
Non-recurring tax benefits (3.7) –
28.5 22.1
11. Goodwill£ Millions 2017 2016
Cost
At 1 January 37.7 35.9
Accrued consideration (Note 20) (0.2) 0.5
Recognised on acquisition of business 3.9 –
Foreign currency translation (1.0) 1.3
At 31 December 40.4 37.7
Accumulated impairment loss
At 31 December – –
Carrying amount
At 31 December 40.4 37.7
Goodwill arises on the consolidation of business/subsidiary undertakings.
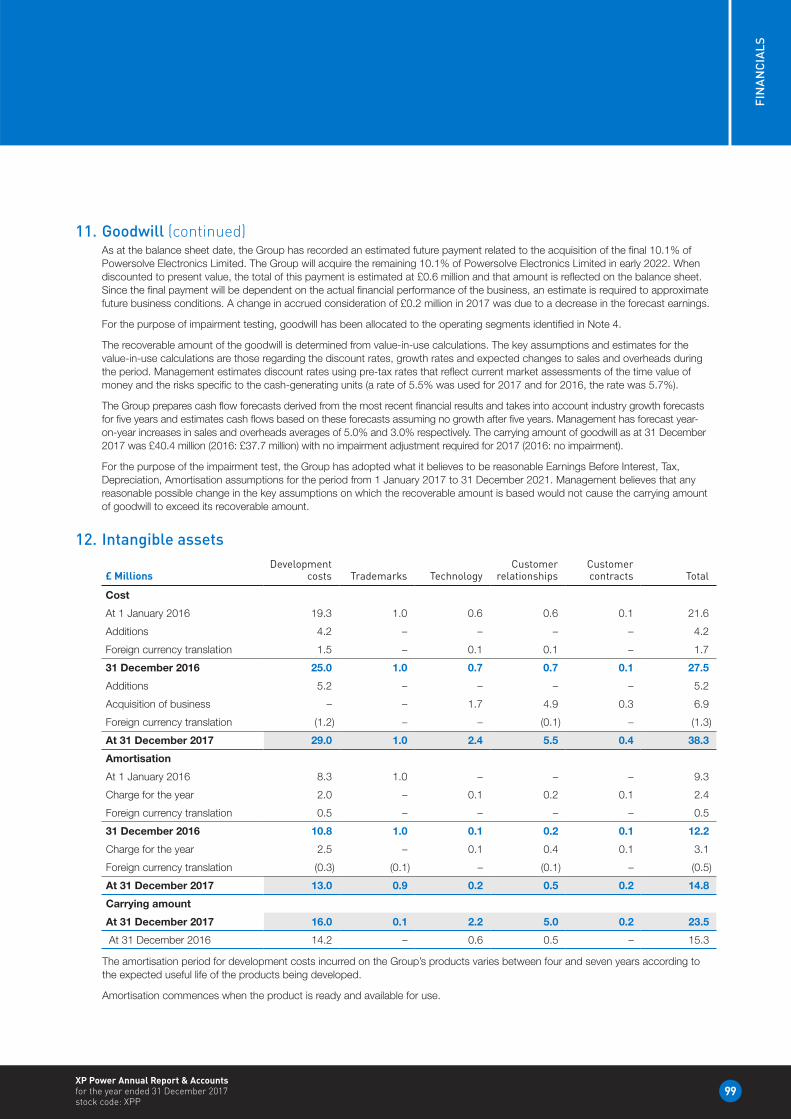
99
FIN
AN
CIA
LS
XP Power Annual Report & Accounts for the year ended 31 December 2017 stock code: XPP
11. Goodwill (continued)As at the balance sheet date, the Group has recorded an estimated future payment related to the acquisition of the final 10.1% of Powersolve Electronics Limited. The Group will acquire the remaining 10.1% of Powersolve Electronics Limited in early 2022. When discounted to present value, the total of this payment is estimated at £0.6 million and that amount is reflected on the balance sheet. Since the final payment will be dependent on the actual financial performance of the business, an estimate is required to approximate future business conditions. A change in accrued consideration of £0.2 million in 2017 was due to a decrease in the forecast earnings.
For the purpose of impairment testing, goodwill has been allocated to the operating segments identified in Note 4.
The recoverable amount of the goodwill is determined from value-in-use calculations. The key assumptions and estimates for the value-in-use calculations are those regarding the discount rates, growth rates and expected changes to sales and overheads during the period. Management estimates discount rates using pre-tax rates that reflect current market assessments of the time value of money and the risks specific to the cash-generating units (a rate of 5.5% was used for 2017 and for 2016, the rate was 5.7%).
The Group prepares cash flow forecasts derived from the most recent financial results and takes into account industry growth forecasts for five years and estimates cash flows based on these forecasts assuming no growth after five years. Management has forecast year-on-year increases in sales and overheads averages of 5.0% and 3.0% respectively. The carrying amount of goodwill as at 31 December 2017 was £40.4 million (2016: £37.7 million) with no impairment adjustment required for 2017 (2016: no impairment).
For the purpose of the impairment test, the Group has adopted what it believes to be reasonable Earnings Before Interest, Tax, Depreciation, Amortisation assumptions for the period from 1 January 2017 to 31 December 2021. Management believes that any reasonable possible change in the key assumptions on which the recoverable amount is based would not cause the carrying amount of goodwill to exceed its recoverable amount.
12. Intangible assets
£ MillionsDevelopment
costs Trademarks TechnologyCustomer
relationshipsCustomer contracts Total
Cost
At 1 January 2016 19.3 1.0 0.6 0.6 0.1 21.6
Additions 4.2 – – – – 4.2
Foreign currency translation 1.5 – 0.1 0.1 – 1.7
31 December 2016 25.0 1.0 0.7 0.7 0.1 27.5
Additions 5.2 – – – – 5.2
Acquisition of business – – 1.7 4.9 0.3 6.9
Foreign currency translation (1.2) – – (0.1) – (1.3)
At 31 December 2017 29.0 1.0 2.4 5.5 0.4 38.3
Amortisation
At 1 January 2016 8.3 1.0 – – – 9.3
Charge for the year 2.0 – 0.1 0.2 0.1 2.4
Foreign currency translation 0.5 – – – – 0.5
31 December 2016 10.8 1.0 0.1 0.2 0.1 12.2
Charge for the year 2.5 – 0.1 0.4 0.1 3.1
Foreign currency translation (0.3) (0.1) – (0.1) – (0.5)
At 31 December 2017 13.0 0.9 0.2 0.5 0.2 14.8
Carrying amount
At 31 December 2017 16.0 0.1 2.2 5.0 0.2 23.5
At 31 December 2016 14.2 – 0.6 0.5 – 15.3
The amortisation period for development costs incurred on the Group’s products varies between four and seven years according to the expected useful life of the products being developed.
Amortisation commences when the product is ready and available for use.
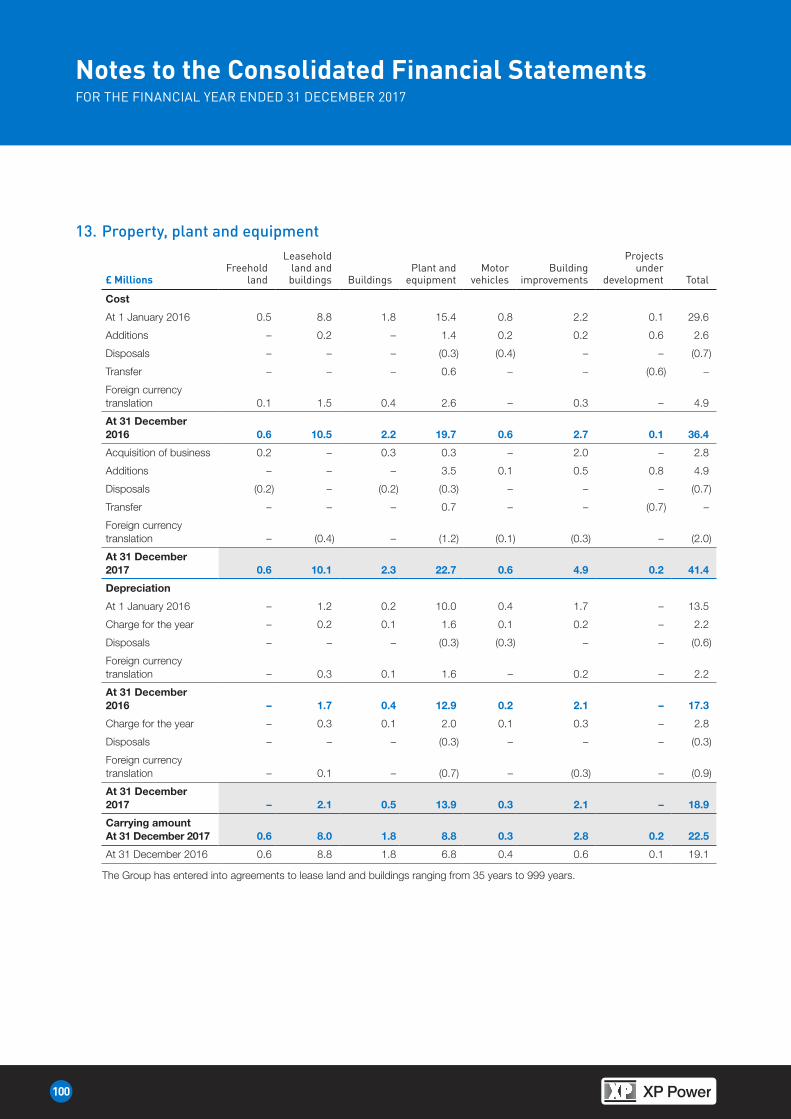
100
HeadingNotes to the Consolidated Financial StatementsFOR THE FINANCIAL YEAR ENDED 31 DECEMBER 2017
13. Property, plant and equipment
£ MillionsFreehold
land
Leasehold land and buildings Buildings
Plant and equipment
Motor vehicles
Building improvements
Projects under
development Total
Cost
At 1 January 2016 0.5 8.8 1.8 15.4 0.8 2.2 0.1 29.6
Additions – 0.2 – 1.4 0.2 0.2 0.6 2.6
Disposals – – – (0.3) (0.4) – – (0.7)
Transfer – – – 0.6 – – (0.6) –
Foreign currency translation 0.1 1.5 0.4 2.6 – 0.3 – 4.9
At 31 December 2016 0.6 10.5 2.2 19.7 0.6 2.7 0.1 36.4
Acquisition of business 0.2 – 0.3 0.3 – 2.0 – 2.8
Additions – – – 3.5 0.1 0.5 0.8 4.9
Disposals (0.2) – (0.2) (0.3) – – – (0.7)
Transfer – – – 0.7 – – (0.7) –
Foreign currency translation – (0.4) – (1.2) (0.1) (0.3) – (2.0)
At 31 December 2017 0.6 10.1 2.3 22.7 0.6 4.9 0.2 41.4
Depreciation
At 1 January 2016 – 1.2 0.2 10.0 0.4 1.7 – 13.5
Charge for the year – 0.2 0.1 1.6 0.1 0.2 – 2.2
Disposals – – – (0.3) (0.3) – – (0.6)
Foreign currency translation – 0.3 0.1 1.6 – 0.2 – 2.2
At 31 December 2016 – 1.7 0.4 12.9 0.2 2.1 – 17.3
Charge for the year – 0.3 0.1 2.0 0.1 0.3 – 2.8
Disposals – – – (0.3) – – – (0.3)
Foreign currency translation – 0.1 – (0.7) – (0.3) – (0.9)
At 31 December 2017 – 2.1 0.5 13.9 0.3 2.1 – 18.9
Carrying amount At 31 December 2017 0.6 8.0 1.8 8.8 0.3 2.8 0.2 22.5
At 31 December 2016 0.6 8.8 1.8 6.8 0.4 0.6 0.1 19.1
The Group has entered into agreements to lease land and buildings ranging from 35 years to 999 years.
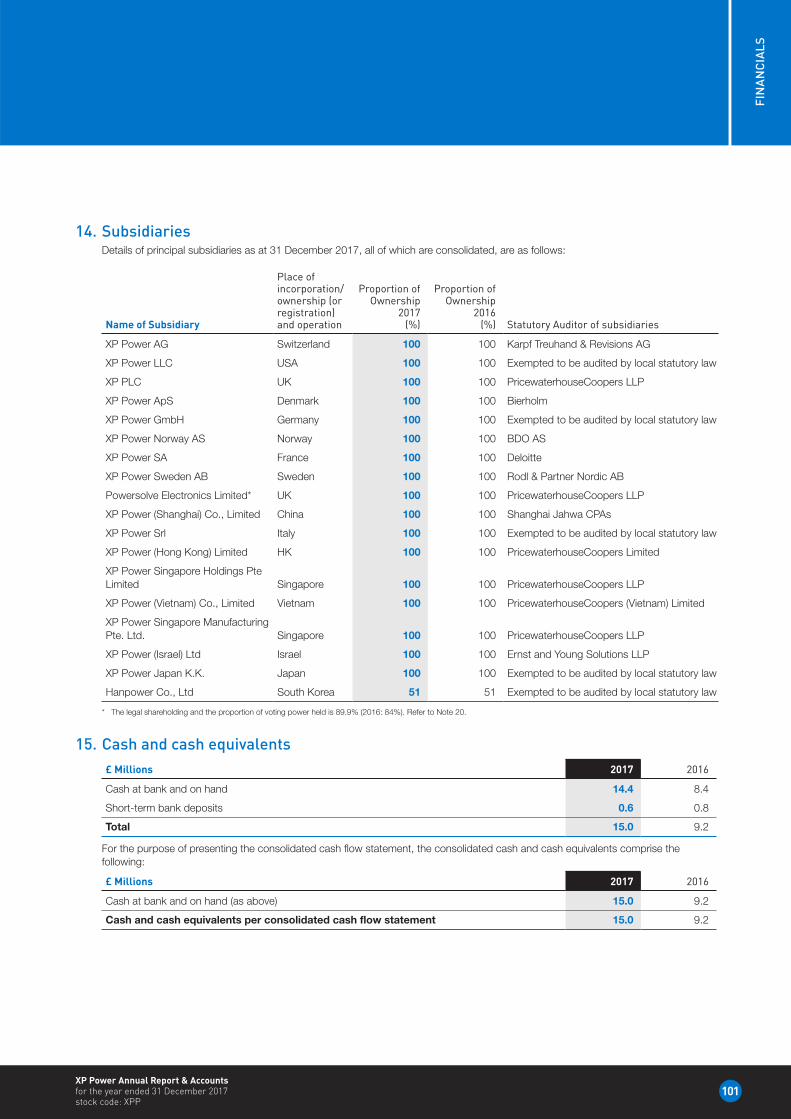
101
FIN
AN
CIA
LS
XP Power Annual Report & Accounts for the year ended 31 December 2017 stock code: XPP
14. SubsidiariesDetails of principal subsidiaries as at 31 December 2017, all of which are consolidated, are as follows:
Name of Subsidiary
Place of incorporation/ownership (or registration) and operation
Proportion of Ownership
2017(%)
Proportion of Ownership
2016(%) Statutory Auditor of subsidiaries
XP Power AG Switzerland 100 100 Karpf Treuhand & Revisions AG
XP Power LLC USA 100 100 Exempted to be audited by local statutory law
XP PLC UK 100 100 PricewaterhouseCoopers LLP
XP Power ApS Denmark 100 100 Bierholm
XP Power GmbH Germany 100 100 Exempted to be audited by local statutory law
XP Power Norway AS Norway 100 100 BDO AS
XP Power SA France 100 100 Deloitte
XP Power Sweden AB Sweden 100 100 Rodl & Partner Nordic AB
Powersolve Electronics Limited* UK 100 100 PricewaterhouseCoopers LLP
XP Power (Shanghai) Co., Limited China 100 100 Shanghai Jahwa CPAs
XP Power Srl Italy 100 100 Exempted to be audited by local statutory law
XP Power (Hong Kong) Limited HK 100 100 PricewaterhouseCoopers Limited
XP Power Singapore Holdings Pte Limited Singapore 100 100 PricewaterhouseCoopers LLP
XP Power (Vietnam) Co., Limited Vietnam 100 100 PricewaterhouseCoopers (Vietnam) Limited
XP Power Singapore Manufacturing Pte. Ltd. Singapore 100 100 PricewaterhouseCoopers LLP
XP Power (Israel) Ltd Israel 100 100 Ernst and Young Solutions LLP
XP Power Japan K.K. Japan 100 100 Exempted to be audited by local statutory law
Hanpower Co., Ltd South Korea 51 51 Exempted to be audited by local statutory law
* The legal shareholding and the proportion of voting power held is 89.9% (2016: 84%). Refer to Note 20.
15. Cash and cash equivalents£ Millions 2017 2016
Cash at bank and on hand 14.4 8.4
Short-term bank deposits 0.6 0.8
Total 15.0 9.2
For the purpose of presenting the consolidated cash flow statement, the consolidated cash and cash equivalents comprise the following:
£ Millions 2017 2016
Cash at bank and on hand (as above) 15.0 9.2
Cash and cash equivalents per consolidated cash flow statement 15.0 9.2
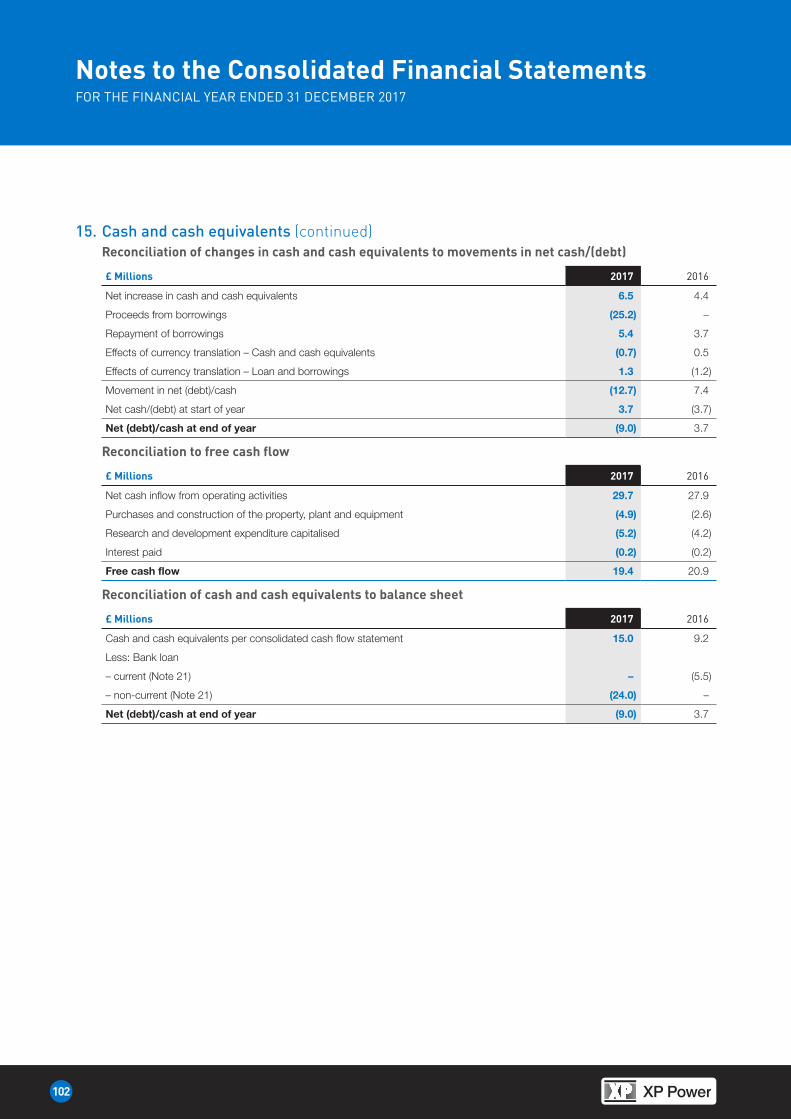
102
HeadingNotes to the Consolidated Financial StatementsFOR THE FINANCIAL YEAR ENDED 31 DECEMBER 2017
15. Cash and cash equivalents (continued)Reconciliation of changes in cash and cash equivalents to movements in net cash/(debt)
£ Millions 2017 2016
Net increase in cash and cash equivalents 6.5 4.4
Proceeds from borrowings (25.2) –
Repayment of borrowings 5.4 3.7
Effects of currency translation – Cash and cash equivalents (0.7) 0.5
Effects of currency translation – Loan and borrowings 1.3 (1.2)
Movement in net (debt)/cash (12.7) 7.4
Net cash/(debt) at start of year 3.7 (3.7)
Net (debt)/cash at end of year (9.0) 3.7
Reconciliation to free cash flow
£ Millions 2017 2016
Net cash inflow from operating activities 29.7 27.9
Purchases and construction of the property, plant and equipment (4.9) (2.6)
Research and development expenditure capitalised (5.2) (4.2)
Interest paid (0.2) (0.2)
Free cash flow 19.4 20.9
Reconciliation of cash and cash equivalents to balance sheet
£ Millions 2017 2016
Cash and cash equivalents per consolidated cash flow statement 15.0 9.2
Less: Bank loan
– current (Note 21) – (5.5)
– non-current (Note 21) (24.0) –
Net (debt)/cash at end of year (9.0) 3.7
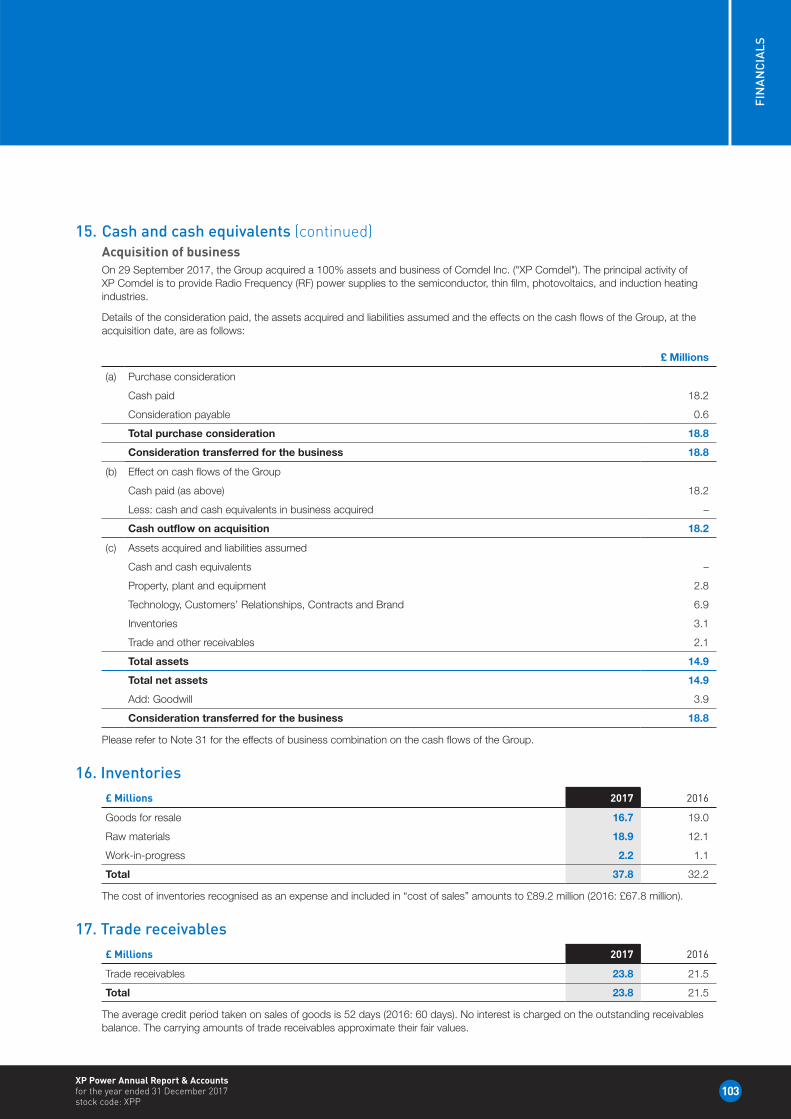
103
FIN
AN
CIA
LS
XP Power Annual Report & Accounts for the year ended 31 December 2017 stock code: XPP
15. Cash and cash equivalents (continued)Acquisition of businessOn 29 September 2017, the Group acquired a 100% assets and business of Comdel Inc. ("XP Comdel"). The principal activity of XP Comdel is to provide Radio Frequency (RF) power supplies to the semiconductor, thin film, photovoltaics, and induction heating industries.
Details of the consideration paid, the assets acquired and liabilities assumed and the effects on the cash flows of the Group, at the acquisition date, are as follows:
£ Millions
(a) Purchase consideration
Cash paid 18.2
Consideration payable 0.6
Total purchase consideration 18.8
Consideration transferred for the business 18.8
(b) Effect on cash flows of the Group
Cash paid (as above) 18.2
Less: cash and cash equivalents in business acquired –
Cash outflow on acquisition 18.2
(c) Assets acquired and liabilities assumed
Cash and cash equivalents –
Property, plant and equipment 2.8
Technology, Customers’ Relationships, Contracts and Brand 6.9
Inventories 3.1
Trade and other receivables 2.1
Total assets 14.9
Total net assets 14.9
Add: Goodwill 3.9
Consideration transferred for the business 18.8
Please refer to Note 31 for the effects of business combination on the cash flows of the Group.
16. Inventories£ Millions 2017 2016
Goods for resale 16.7 19.0
Raw materials 18.9 12.1
Work-in-progress 2.2 1.1
Total 37.8 32.2
The cost of inventories recognised as an expense and included in “cost of sales” amounts to £89.2 million (2016: £67.8 million).
17. Trade receivables£ Millions 2017 2016
Trade receivables 23.8 21.5
Total 23.8 21.5
The average credit period taken on sales of goods is 52 days (2016: 60 days). No interest is charged on the outstanding receivables balance. The carrying amounts of trade receivables approximate their fair values.
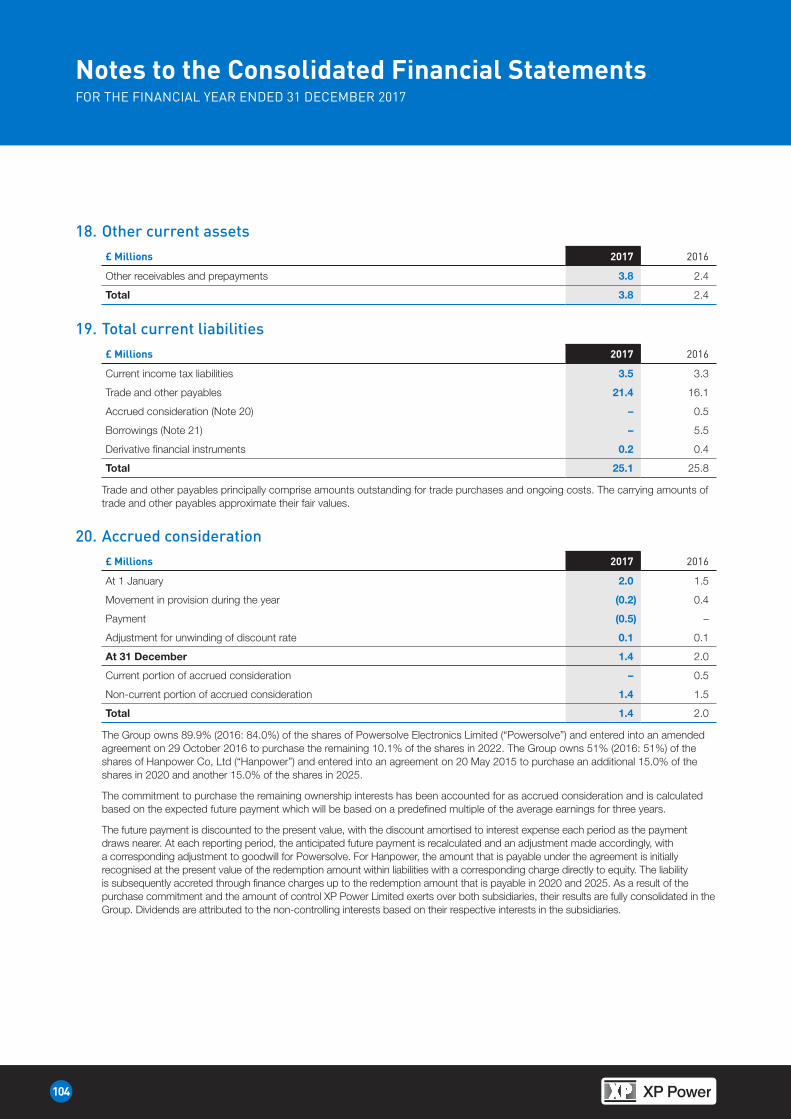
104
HeadingNotes to the Consolidated Financial StatementsFOR THE FINANCIAL YEAR ENDED 31 DECEMBER 2017
18. Other current assets£ Millions 2017 2016
Other receivables and prepayments 3.8 2.4
Total 3.8 2.4
19. Total current liabilities£ Millions 2017 2016
Current income tax liabilities 3.5 3.3
Trade and other payables 21.4 16.1
Accrued consideration (Note 20) – 0.5
Borrowings (Note 21) – 5.5
Derivative financial instruments 0.2 0.4
Total 25.1 25.8
Trade and other payables principally comprise amounts outstanding for trade purchases and ongoing costs. The carrying amounts of trade and other payables approximate their fair values.
20. Accrued consideration£ Millions 2017 2016
At 1 January 2.0 1.5
Movement in provision during the year (0.2) 0.4
Payment (0.5) –
Adjustment for unwinding of discount rate 0.1 0.1
At 31 December 1.4 2.0
Current portion of accrued consideration – 0.5
Non-current portion of accrued consideration 1.4 1.5
Total 1.4 2.0
The Group owns 89.9% (2016: 84.0%) of the shares of Powersolve Electronics Limited (“Powersolve”) and entered into an amended agreement on 29 October 2016 to purchase the remaining 10.1% of the shares in 2022. The Group owns 51% (2016: 51%) of the shares of Hanpower Co, Ltd (“Hanpower”) and entered into an agreement on 20 May 2015 to purchase an additional 15.0% of the shares in 2020 and another 15.0% of the shares in 2025.
The commitment to purchase the remaining ownership interests has been accounted for as accrued consideration and is calculated based on the expected future payment which will be based on a predefined multiple of the average earnings for three years.
The future payment is discounted to the present value, with the discount amortised to interest expense each period as the payment draws nearer. At each reporting period, the anticipated future payment is recalculated and an adjustment made accordingly, with a corresponding adjustment to goodwill for Powersolve. For Hanpower, the amount that is payable under the agreement is initially recognised at the present value of the redemption amount within liabilities with a corresponding charge directly to equity. The liability is subsequently accreted through finance charges up to the redemption amount that is payable in 2020 and 2025. As a result of the purchase commitment and the amount of control XP Power Limited exerts over both subsidiaries, their results are fully consolidated in the Group. Dividends are attributed to the non-controlling interests based on their respective interests in the subsidiaries.
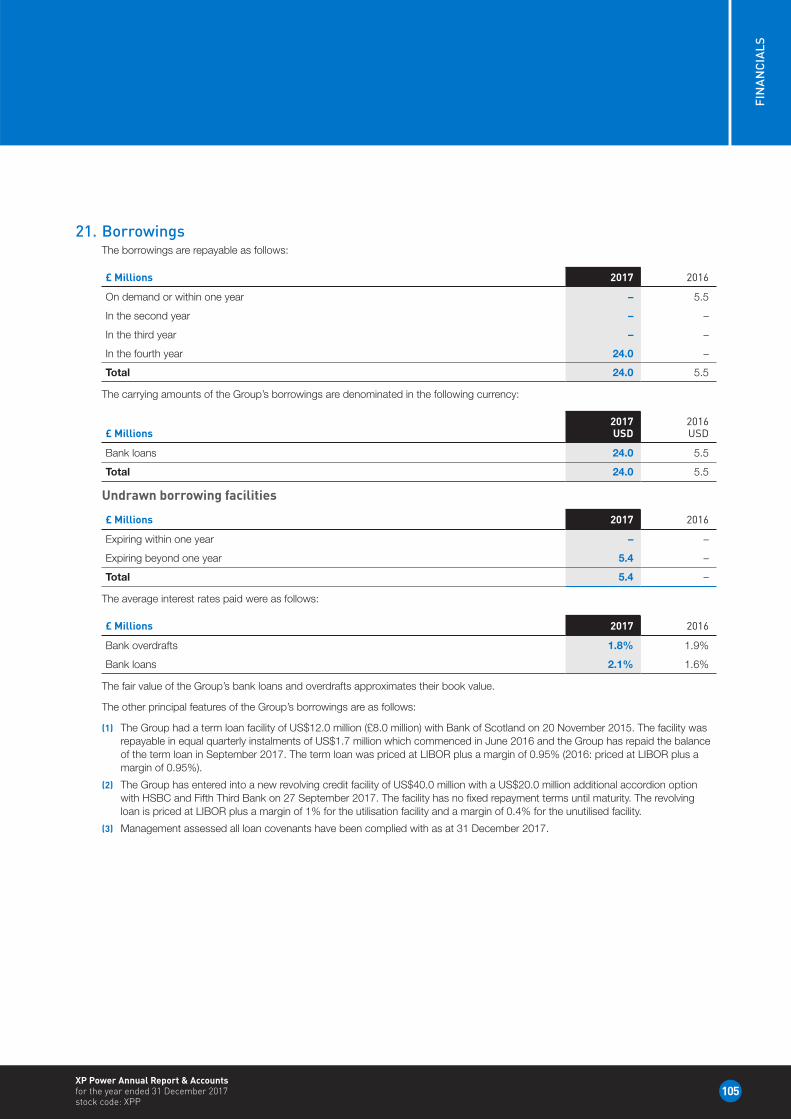
105
FIN
AN
CIA
LS
XP Power Annual Report & Accounts for the year ended 31 December 2017 stock code: XPP
21. BorrowingsThe borrowings are repayable as follows:
£ Millions 2017 2016
On demand or within one year – 5.5
In the second year – –
In the third year – –
In the fourth year 24.0 –
Total 24.0 5.5
The carrying amounts of the Group’s borrowings are denominated in the following currency:
£ Millions 2017
USD2016USD
Bank loans 24.0 5.5
Total 24.0 5.5
Undrawn borrowing facilities
£ Millions 2017 2016
Expiring within one year – –
Expiring beyond one year 5.4 –
Total 5.4 –
The average interest rates paid were as follows:
£ Millions 2017 2016
Bank overdrafts 1.8% 1.9%
Bank loans 2.1% 1.6%
The fair value of the Group’s bank loans and overdrafts approximates their book value.
The other principal features of the Group’s borrowings are as follows:
(1) The Group had a term loan facility of US$12.0 million (£8.0 million) with Bank of Scotland on 20 November 2015. The facility was repayable in equal quarterly instalments of US$1.7 million which commenced in June 2016 and the Group has repaid the balance of the term loan in September 2017. The term loan was priced at LIBOR plus a margin of 0.95% (2016: priced at LIBOR plus a margin of 0.95%).
(2) The Group has entered into a new revolving credit facility of US$40.0 million with a US$20.0 million additional accordion option with HSBC and Fifth Third Bank on 27 September 2017. The facility has no fixed repayment terms until maturity. The revolving loan is priced at LIBOR plus a margin of 1% for the utilisation facility and a margin of 0.4% for the unutilised facility.
(3) Management assessed all loan covenants have been complied with as at 31 December 2017.
This is in style marked up on go-proof...think it should be in body text
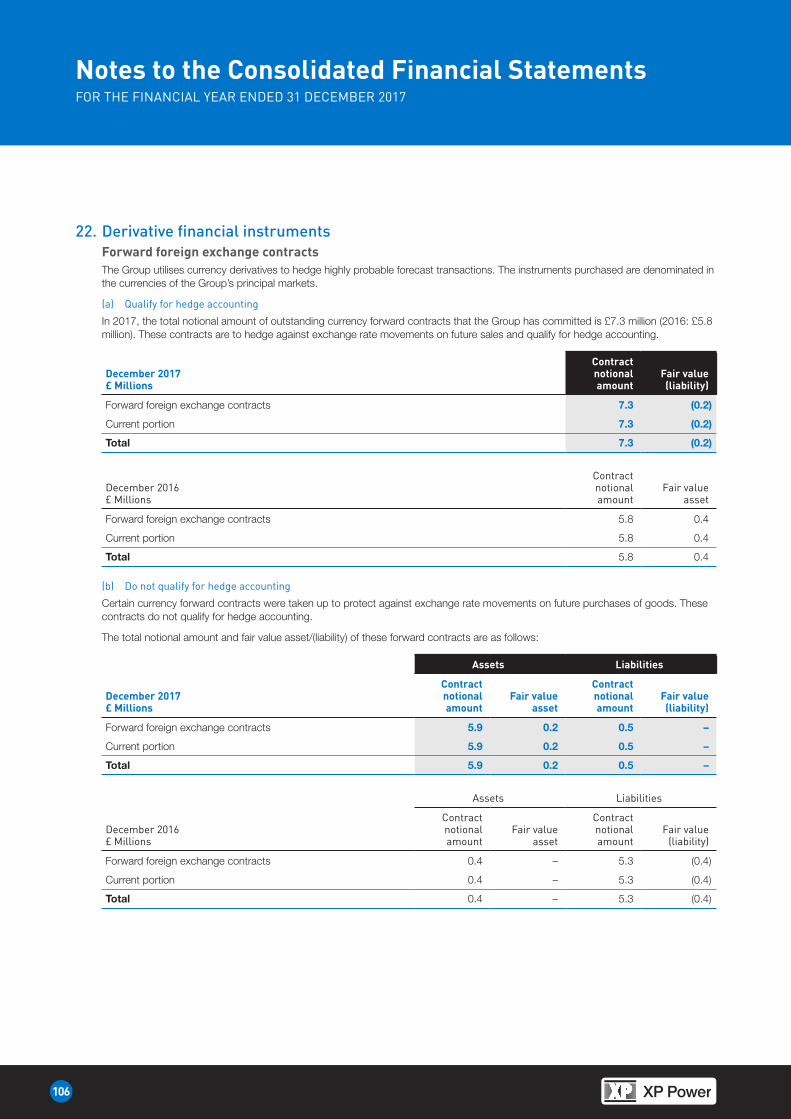
106
HeadingNotes to the Consolidated Financial StatementsFOR THE FINANCIAL YEAR ENDED 31 DECEMBER 2017
22. Derivative financial instrumentsForward foreign exchange contractsThe Group utilises currency derivatives to hedge highly probable forecast transactions. The instruments purchased are denominated in the currencies of the Group’s principal markets.
(a) Qualify for hedge accounting
In 2017, the total notional amount of outstanding currency forward contracts that the Group has committed is £7.3 million (2016: £5.8 million). These contracts are to hedge against exchange rate movements on future sales and qualify for hedge accounting.
December 2017£ Millions
Contract notional amount
Fair value (liability)
Forward foreign exchange contracts 7.3 (0.2)
Current portion 7.3 (0.2)
Total 7.3 (0.2)
December 2016£ Millions
Contract notional amount
Fair value asset
Forward foreign exchange contracts 5.8 0.4
Current portion 5.8 0.4
Total 5.8 0.4
(b) Do not qualify for hedge accounting
Certain currency forward contracts were taken up to protect against exchange rate movements on future purchases of goods. These contracts do not qualify for hedge accounting.
The total notional amount and fair value asset/(liability) of these forward contracts are as follows:
Assets Liabilities
December 2017£ Millions
Contract notional amount
Fair value asset
Contract notional amount
Fair value (liability)
Forward foreign exchange contracts 5.9 0.2 0.5 –
Current portion 5.9 0.2 0.5 –
Total 5.9 0.2 0.5 –
Assets Liabilities
December 2016£ Millions
Contract notional amount
Fair value asset
Contract notional amount
Fair value (liability)
Forward foreign exchange contracts 0.4 – 5.3 (0.4)
Current portion 0.4 – 5.3 (0.4)
Total 0.4 – 5.3 (0.4)
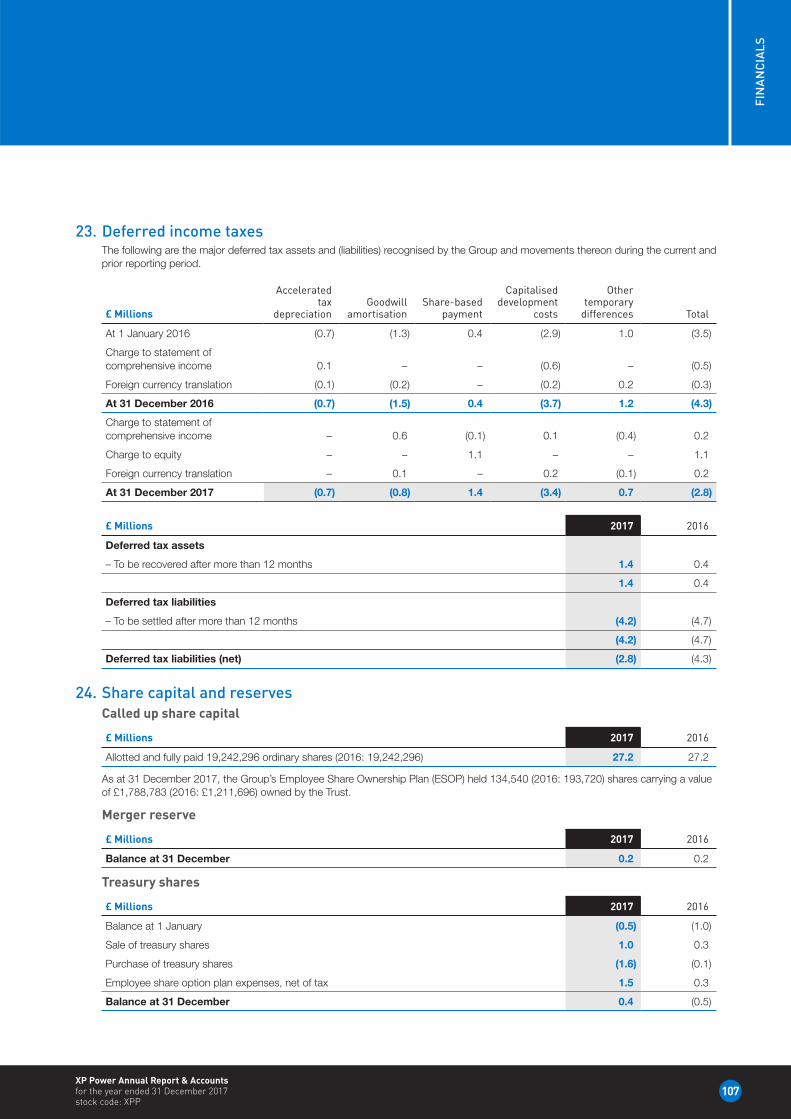
107
FIN
AN
CIA
LS
XP Power Annual Report & Accounts for the year ended 31 December 2017 stock code: XPP
23. Deferred income taxesThe following are the major deferred tax assets and (liabilities) recognised by the Group and movements thereon during the current and prior reporting period.
£ Millions
Accelerated tax
depreciationGoodwill
amortisationShare-based
payment
Capitalised development
costs
Other temporary
differences Total
At 1 January 2016 (0.7) (1.3) 0.4 (2.9) 1.0 (3.5)
Charge to statement of comprehensive income 0.1 – – (0.6) – (0.5)
Foreign currency translation (0.1) (0.2) – (0.2) 0.2 (0.3)
At 31 December 2016 (0.7) (1.5) 0.4 (3.7) 1.2 (4.3)
Charge to statement of comprehensive income – 0.6 (0.1) 0.1 (0.4) 0.2
Charge to equity – – 1.1 – – 1.1
Foreign currency translation – 0.1 – 0.2 (0.1) 0.2
At 31 December 2017 (0.7) (0.8) 1.4 (3.4) 0.7 (2.8)
£ Millions 2017 2016
Deferred tax assets
– To be recovered after more than 12 months 1.4 0.4
1.4 0.4
Deferred tax liabilities
– To be settled after more than 12 months (4.2) (4.7)
(4.2) (4.7)
Deferred tax liabilities (net) (2.8) (4.3)
24. Share capital and reservesCalled up share capital
£ Millions 2017 2016
Allotted and fully paid 19,242,296 ordinary shares (2016: 19,242,296) 27.2 27.2
As at 31 December 2017, the Group’s Employee Share Ownership Plan (ESOP) held 134,540 (2016: 193,720) shares carrying a value of £1,788,783 (2016: £1,211,696) owned by the Trust.
Merger reserve
£ Millions 2017 2016
Balance at 31 December 0.2 0.2
Treasury shares
£ Millions 2017 2016
Balance at 1 January (0.5) (1.0)
Sale of treasury shares 1.0 0.3
Purchase of treasury shares (1.6) (0.1)
Employee share option plan expenses, net of tax 1.5 0.3
Balance at 31 December 0.4 (0.5)
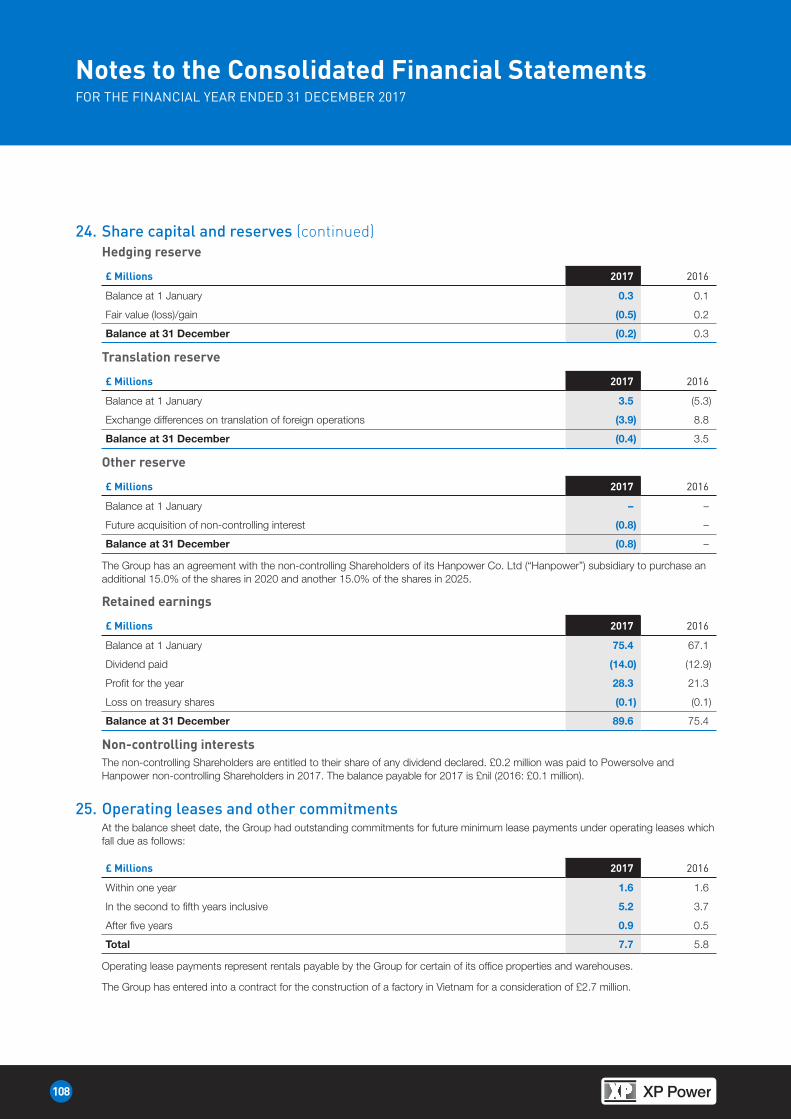
108
HeadingNotes to the Consolidated Financial StatementsFOR THE FINANCIAL YEAR ENDED 31 DECEMBER 2017
24. Share capital and reserves (continued)Hedging reserve
£ Millions 2017 2016
Balance at 1 January 0.3 0.1
Fair value (loss)/gain (0.5) 0.2
Balance at 31 December (0.2) 0.3
Translation reserve
£ Millions 2017 2016
Balance at 1 January 3.5 (5.3)
Exchange differences on translation of foreign operations (3.9) 8.8
Balance at 31 December (0.4) 3.5
Other reserve
£ Millions 2017 2016
Balance at 1 January – –
Future acquisition of non-controlling interest (0.8) –
Balance at 31 December (0.8) –
The Group has an agreement with the non-controlling Shareholders of its Hanpower Co. Ltd (“Hanpower”) subsidiary to purchase an additional 15.0% of the shares in 2020 and another 15.0% of the shares in 2025.
Retained earnings
£ Millions 2017 2016
Balance at 1 January 75.4 67.1
Dividend paid (14.0) (12.9)
Profit for the year 28.3 21.3
Loss on treasury shares (0.1) (0.1)
Balance at 31 December 89.6 75.4
Non-controlling interestsThe non-controlling Shareholders are entitled to their share of any dividend declared. £0.2 million was paid to Powersolve and Hanpower non-controlling Shareholders in 2017. The balance payable for 2017 is £nil (2016: £0.1 million).
25. Operating leases and other commitmentsAt the balance sheet date, the Group had outstanding commitments for future minimum lease payments under operating leases which fall due as follows:
£ Millions 2017 2016
Within one year 1.6 1.6
In the second to fifth years inclusive 5.2 3.7
After five years 0.9 0.5
Total 7.7 5.8
Operating lease payments represent rentals payable by the Group for certain of its office properties and warehouses.
The Group has entered into a contract for the construction of a factory in Vietnam for a consideration of £2.7 million.
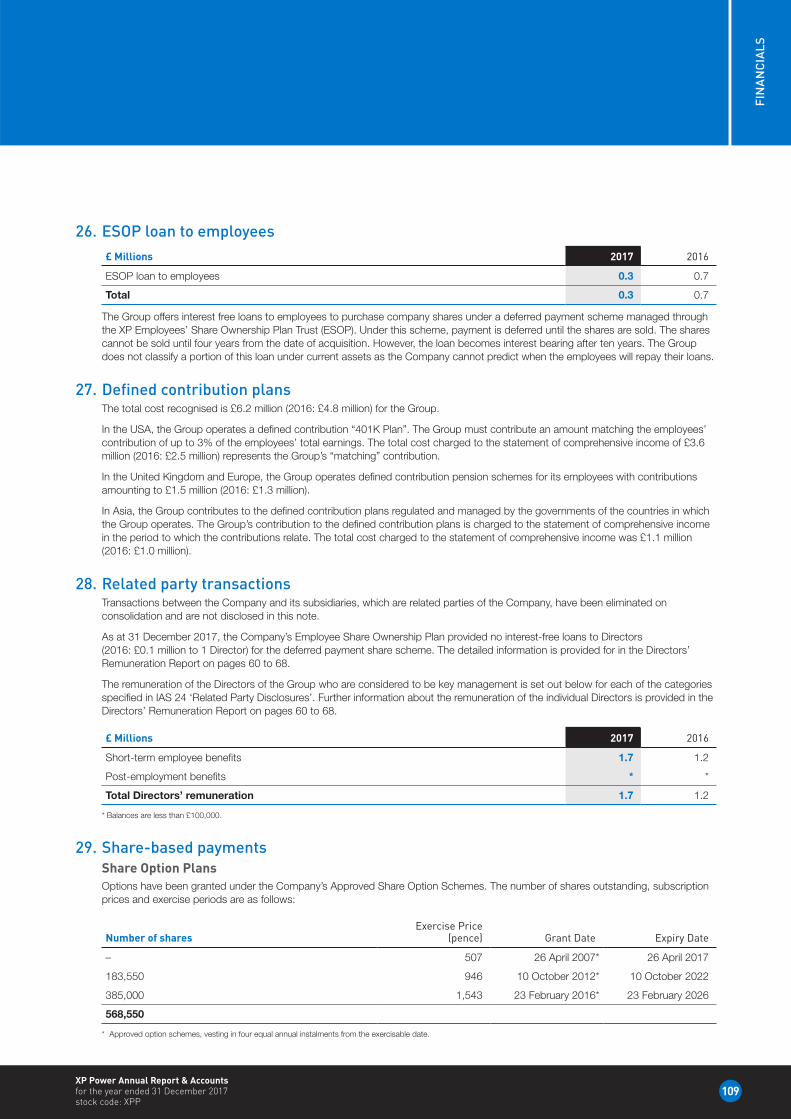
109
FIN
AN
CIA
LS
XP Power Annual Report & Accounts for the year ended 31 December 2017 stock code: XPP
26. ESOP loan to employees£ Millions 2017 2016
ESOP loan to employees 0.3 0.7
Total 0.3 0.7
The Group offers interest free loans to employees to purchase company shares under a deferred payment scheme managed through the XP Employees’ Share Ownership Plan Trust (ESOP). Under this scheme, payment is deferred until the shares are sold. The shares cannot be sold until four years from the date of acquisition. However, the loan becomes interest bearing after ten years. The Group does not classify a portion of this loan under current assets as the Company cannot predict when the employees will repay their loans.
27. Defined contribution plansThe total cost recognised is £6.2 million (2016: £4.8 million) for the Group.
In the USA, the Group operates a defined contribution “401K Plan”. The Group must contribute an amount matching the employees’ contribution of up to 3% of the employees’ total earnings. The total cost charged to the statement of comprehensive income of £3.6 million (2016: £2.5 million) represents the Group’s “matching” contribution.
In the United Kingdom and Europe, the Group operates defined contribution pension schemes for its employees with contributions amounting to £1.5 million (2016: £1.3 million).
In Asia, the Group contributes to the defined contribution plans regulated and managed by the governments of the countries in which the Group operates. The Group’s contribution to the defined contribution plans is charged to the statement of comprehensive income in the period to which the contributions relate. The total cost charged to the statement of comprehensive income was £1.1 million (2016: £1.0 million).
28. Related party transactionsTransactions between the Company and its subsidiaries, which are related parties of the Company, have been eliminated on consolidation and are not disclosed in this note.
As at 31 December 2017, the Company’s Employee Share Ownership Plan provided no interest-free loans to Directors (2016: £0.1 million to 1 Director) for the deferred payment share scheme. The detailed information is provided for in the Directors’ Remuneration Report on pages 60 to 68.
The remuneration of the Directors of the Group who are considered to be key management is set out below for each of the categories specified in IAS 24 ‘Related Party Disclosures’. Further information about the remuneration of the individual Directors is provided in the Directors’ Remuneration Report on pages 60 to 68.
£ Millions 2017 2016
Short-term employee benefits 1.7 1.2
Post-employment benefits * *
Total Directors’ remuneration 1.7 1.2
* Balances are less than £100,000.
29. Share-based paymentsShare Option PlansOptions have been granted under the Company’s Approved Share Option Schemes. The number of shares outstanding, subscription prices and exercise periods are as follows:
Number of sharesExercise Price
(pence) Grant Date Expiry Date
– 507 26 April 2007* 26 April 2017
183,550 946 10 October 2012* 10 October 2022
385,000 1,543 23 February 2016* 23 February 2026
568,550
* Approved option schemes, vesting in four equal annual instalments from the exercisable date.
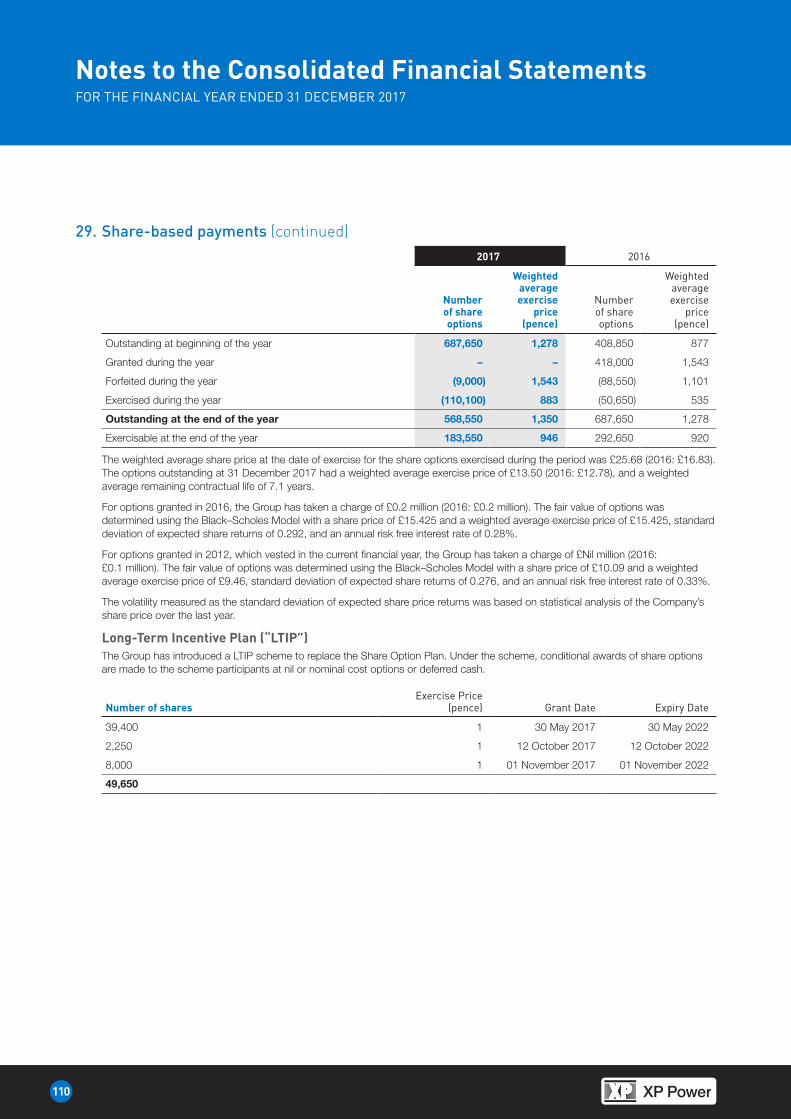
110
HeadingNotes to the Consolidated Financial StatementsFOR THE FINANCIAL YEAR ENDED 31 DECEMBER 2017
29. Share-based payments (continued)2017 2016
Number of share options
Weighted average exercise
price (pence)
Number of share options
Weighted average exercise
price (pence)
Outstanding at beginning of the year 687,650 1,278 408,850 877
Granted during the year – – 418,000 1,543
Forfeited during the year (9,000) 1,543 (88,550) 1,101
Exercised during the year (110,100) 883 (50,650) 535
Outstanding at the end of the year 568,550 1,350 687,650 1,278
Exercisable at the end of the year 183,550 946 292,650 920
The weighted average share price at the date of exercise for the share options exercised during the period was £25.68 (2016: £16.83). The options outstanding at 31 December 2017 had a weighted average exercise price of £13.50 (2016: £12.78), and a weighted average remaining contractual life of 7.1 years.
For options granted in 2016, the Group has taken a charge of £0.2 million (2016: £0.2 million). The fair value of options was determined using the Black–Scholes Model with a share price of £15.425 and a weighted average exercise price of £15.425, standard deviation of expected share returns of 0.292, and an annual risk free interest rate of 0.28%.
For options granted in 2012, which vested in the current financial year, the Group has taken a charge of £Nil million (2016: £0.1 million). The fair value of options was determined using the Black–Scholes Model with a share price of £10.09 and a weighted average exercise price of £9.46, standard deviation of expected share returns of 0.276, and an annual risk free interest rate of 0.33%.
The volatility measured as the standard deviation of expected share price returns was based on statistical analysis of the Company’s share price over the last year.
Long-Term Incentive Plan (“LTIP”)The Group has introduced a LTIP scheme to replace the Share Option Plan. Under the scheme, conditional awards of share options are made to the scheme participants at nil or nominal cost options or deferred cash.
Number of sharesExercise Price
(pence) Grant Date Expiry Date
39,400 1 30 May 2017 30 May 2022
2,250 1 12 October 2017 12 October 2022
8,000 1 01 November 2017 01 November 2022
49,650
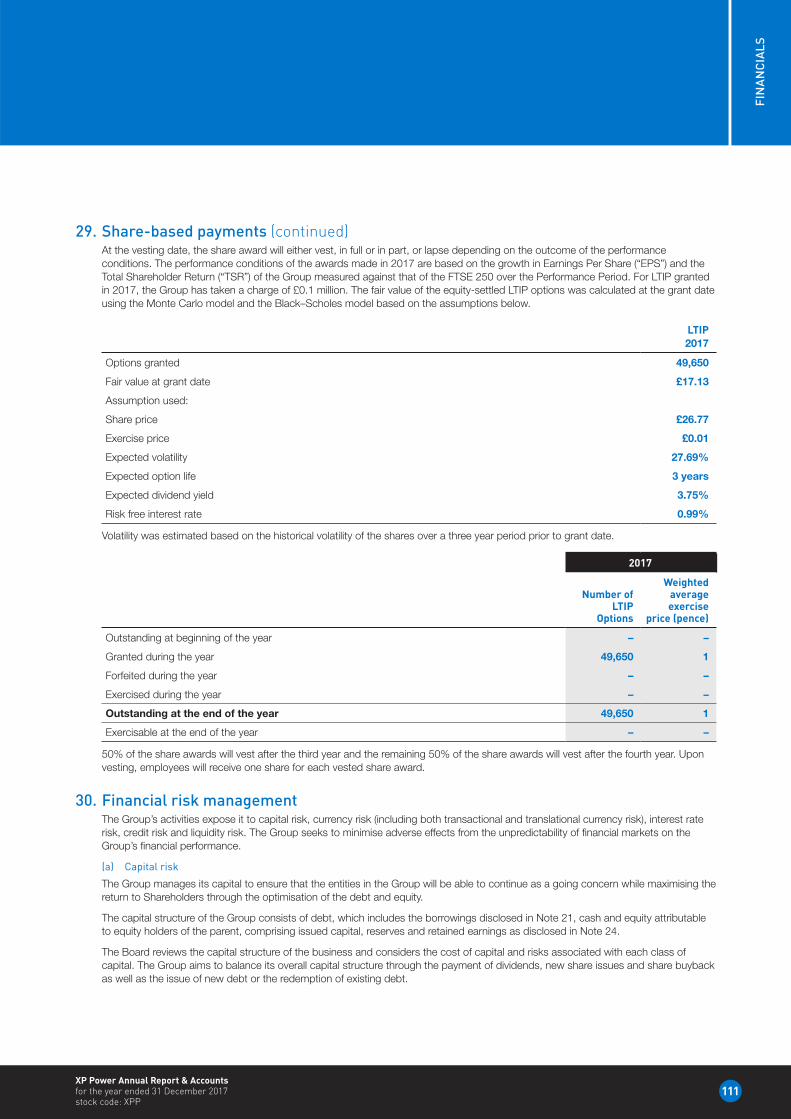
111
FIN
AN
CIA
LS
XP Power Annual Report & Accounts for the year ended 31 December 2017 stock code: XPP
29. Share-based payments (continued)At the vesting date, the share award will either vest, in full or in part, or lapse depending on the outcome of the performance conditions. The performance conditions of the awards made in 2017 are based on the growth in Earnings Per Share (“EPS”) and the Total Shareholder Return (“TSR”) of the Group measured against that of the FTSE 250 over the Performance Period. For LTIP granted in 2017, the Group has taken a charge of £0.1 million. The fair value of the equity-settled LTIP options was calculated at the grant date using the Monte Carlo model and the Black–Scholes model based on the assumptions below.
LTIP2017
Options granted 49,650
Fair value at grant date £17.13
Assumption used:
Share price £26.77
Exercise price £0.01
Expected volatility 27.69%
Expected option life 3 years
Expected dividend yield 3.75%
Risk free interest rate 0.99%
Volatility was estimated based on the historical volatility of the shares over a three year period prior to grant date.
2017
Number of LTIP
Options
Weighted average exercise
price (pence)
Outstanding at beginning of the year – –
Granted during the year 49,650 1
Forfeited during the year – –
Exercised during the year – –
Outstanding at the end of the year 49,650 1
Exercisable at the end of the year – –
50% of the share awards will vest after the third year and the remaining 50% of the share awards will vest after the fourth year. Upon vesting, employees will receive one share for each vested share award.
30. Financial risk managementThe Group’s activities expose it to capital risk, currency risk (including both transactional and translational currency risk), interest rate risk, credit risk and liquidity risk. The Group seeks to minimise adverse effects from the unpredictability of financial markets on the Group’s financial performance.
(a) Capital risk
The Group manages its capital to ensure that the entities in the Group will be able to continue as a going concern while maximising the return to Shareholders through the optimisation of the debt and equity.
The capital structure of the Group consists of debt, which includes the borrowings disclosed in Note 21, cash and equity attributable to equity holders of the parent, comprising issued capital, reserves and retained earnings as disclosed in Note 24.
The Board reviews the capital structure of the business and considers the cost of capital and risks associated with each class of capital. The Group aims to balance its overall capital structure through the payment of dividends, new share issues and share buyback as well as the issue of new debt or the redemption of existing debt.
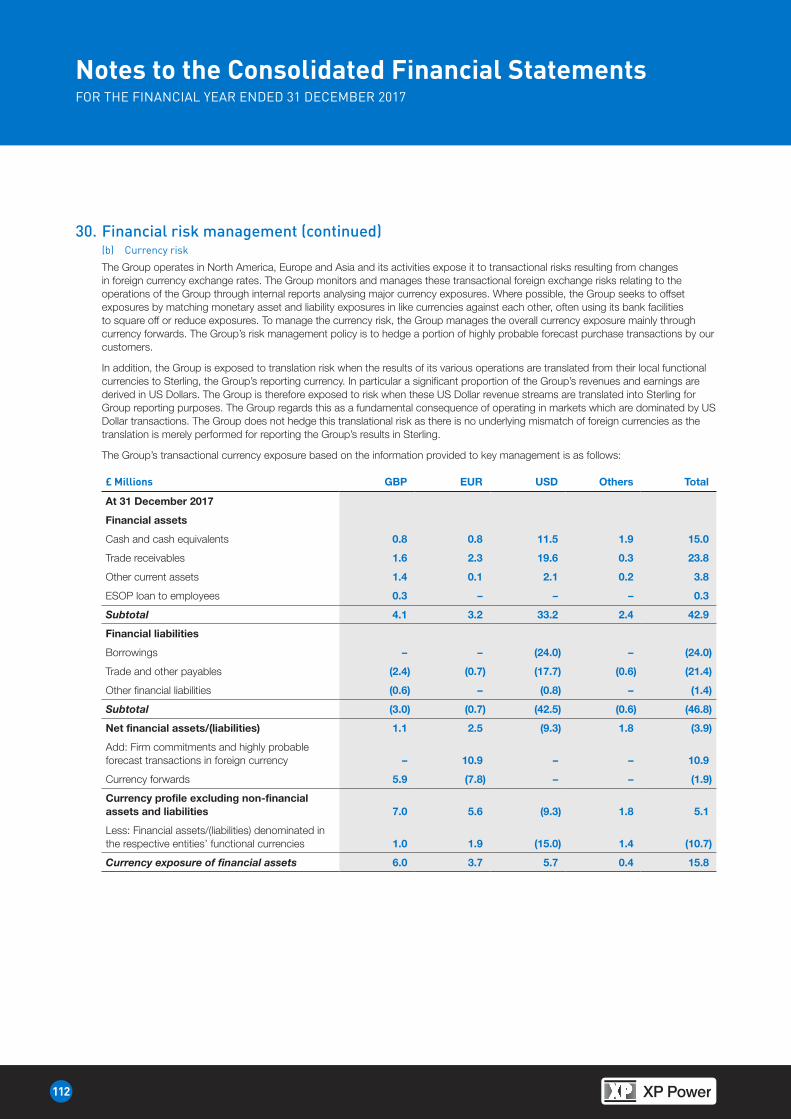
112
HeadingNotes to the Consolidated Financial StatementsFOR THE FINANCIAL YEAR ENDED 31 DECEMBER 2017
30. Financial risk management (continued)(b) Currency risk
The Group operates in North America, Europe and Asia and its activities expose it to transactional risks resulting from changes in foreign currency exchange rates. The Group monitors and manages these transactional foreign exchange risks relating to the operations of the Group through internal reports analysing major currency exposures. Where possible, the Group seeks to offset exposures by matching monetary asset and liability exposures in like currencies against each other, often using its bank facilities to square off or reduce exposures. To manage the currency risk, the Group manages the overall currency exposure mainly through currency forwards. The Group’s risk management policy is to hedge a portion of highly probable forecast purchase transactions by our customers.
In addition, the Group is exposed to translation risk when the results of its various operations are translated from their local functional currencies to Sterling, the Group’s reporting currency. In particular a significant proportion of the Group’s revenues and earnings are derived in US Dollars. The Group is therefore exposed to risk when these US Dollar revenue streams are translated into Sterling for Group reporting purposes. The Group regards this as a fundamental consequence of operating in markets which are dominated by US Dollar transactions. The Group does not hedge this translational risk as there is no underlying mismatch of foreign currencies as the translation is merely performed for reporting the Group’s results in Sterling.
The Group’s transactional currency exposure based on the information provided to key management is as follows:
£ Millions GBP EUR USD Others Total
At 31 December 2017
Financial assets
Cash and cash equivalents 0.8 0.8 11.5 1.9 15.0
Trade receivables 1.6 2.3 19.6 0.3 23.8
Other current assets 1.4 0.1 2.1 0.2 3.8
ESOP loan to employees 0.3 – – – 0.3
Subtotal 4.1 3.2 33.2 2.4 42.9
Financial liabilities
Borrowings – – (24.0) – (24.0)
Trade and other payables (2.4) (0.7) (17.7) (0.6) (21.4)
Other financial liabilities (0.6) – (0.8) – (1.4)
Subtotal (3.0) (0.7) (42.5) (0.6) (46.8)
Net financial assets/(liabilities) 1.1 2.5 (9.3) 1.8 (3.9)
Add: Firm commitments and highly probable forecast transactions in foreign currency – 10.9 – – 10.9
Currency forwards 5.9 (7.8) – – (1.9)
Currency profile excluding non-financial assets and liabilities 7.0 5.6 (9.3) 1.8 5.1
Less: Financial assets/(liabilities) denominated in the respective entities’ functional currencies 1.0 1.9 (15.0) 1.4 (10.7)
Currency exposure of financial assets 6.0 3.7 5.7 0.4 15.8
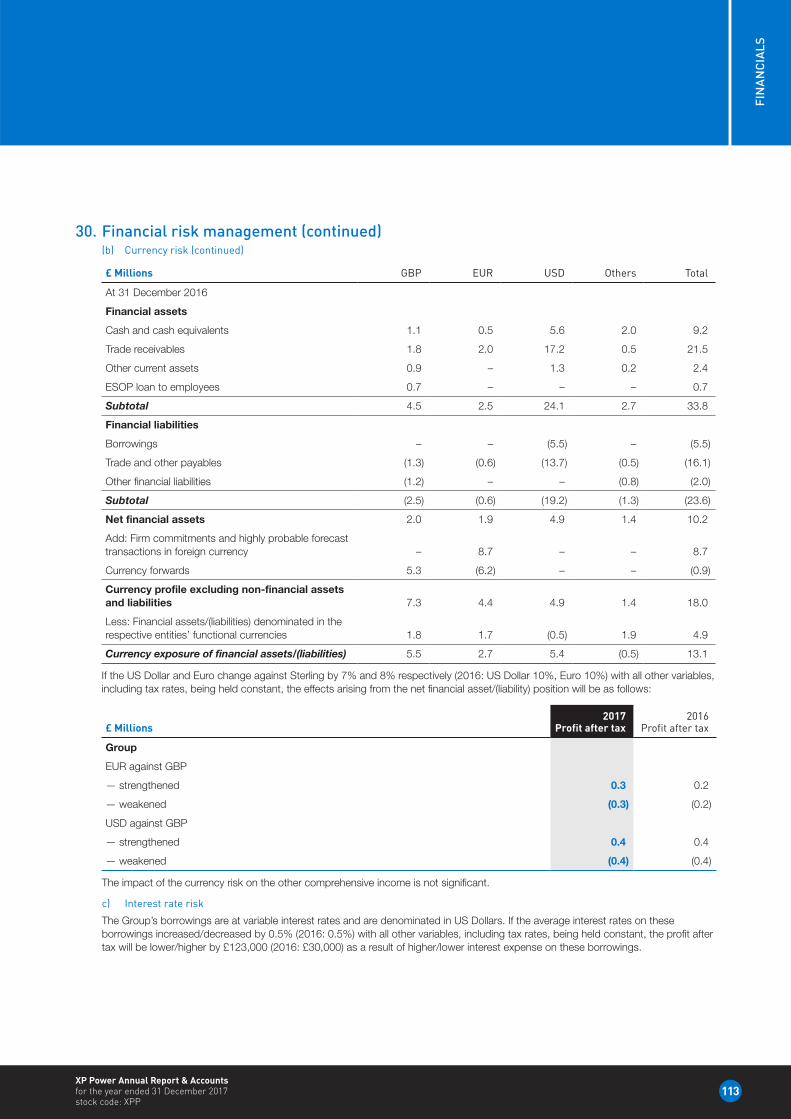
113
FIN
AN
CIA
LS
XP Power Annual Report & Accounts for the year ended 31 December 2017 stock code: XPP
30. Financial risk management (continued)(b) Currency risk (continued)
£ Millions GBP EUR USD Others Total
At 31 December 2016
Financial assets
Cash and cash equivalents 1.1 0.5 5.6 2.0 9.2
Trade receivables 1.8 2.0 17.2 0.5 21.5
Other current assets 0.9 – 1.3 0.2 2.4
ESOP loan to employees 0.7 – – – 0.7
Subtotal 4.5 2.5 24.1 2.7 33.8
Financial liabilities
Borrowings – – (5.5) – (5.5)
Trade and other payables (1.3) (0.6) (13.7) (0.5) (16.1)
Other financial liabilities (1.2) – – (0.8) (2.0)
Subtotal (2.5) (0.6) (19.2) (1.3) (23.6)
Net financial assets 2.0 1.9 4.9 1.4 10.2
Add: Firm commitments and highly probable forecast transactions in foreign currency – 8.7 – – 8.7
Currency forwards 5.3 (6.2) – – (0.9)
Currency profile excluding non-financial assets and liabilities 7.3 4.4 4.9 1.4 18.0
Less: Financial assets/(liabilities) denominated in the respective entities’ functional currencies 1.8 1.7 (0.5) 1.9 4.9
Currency exposure of financial assets/(liabilities) 5.5 2.7 5.4 (0.5) 13.1
If the US Dollar and Euro change against Sterling by 7% and 8% respectively (2016: US Dollar 10%, Euro 10%) with all other variables, including tax rates, being held constant, the effects arising from the net financial asset/(liability) position will be as follows:
£ Millions2017
Profit after tax2016
Profit after tax
Group
EUR against GBP
— strengthened 0.3 0.2
— weakened (0.3) (0.2)
USD against GBP
— strengthened 0.4 0.4
— weakened (0.4) (0.4)
The impact of the currency risk on the other comprehensive income is not significant.
c) Interest rate risk
The Group’s borrowings are at variable interest rates and are denominated in US Dollars. If the average interest rates on these borrowings increased/decreased by 0.5% (2016: 0.5%) with all other variables, including tax rates, being held constant, the profit after tax will be lower/higher by £123,000 (2016: £30,000) as a result of higher/lower interest expense on these borrowings.
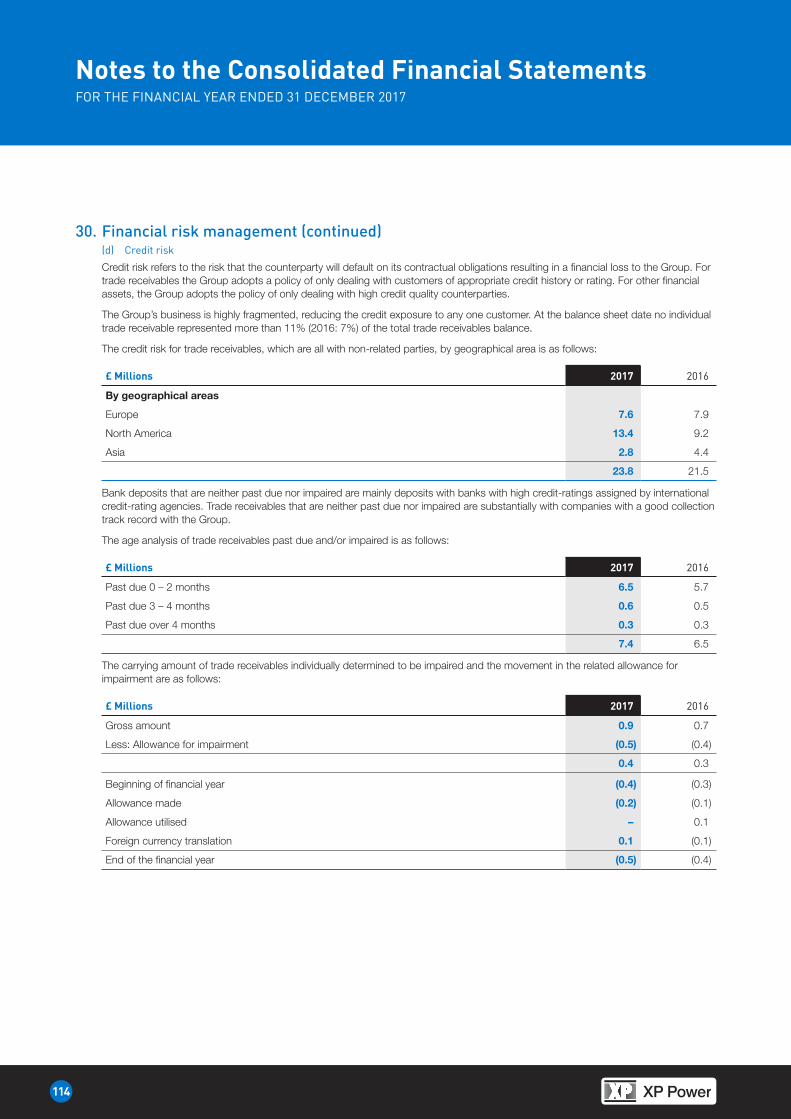
114
HeadingNotes to the Consolidated Financial StatementsFOR THE FINANCIAL YEAR ENDED 31 DECEMBER 2017
30. Financial risk management (continued)(d) Credit risk
Credit risk refers to the risk that the counterparty will default on its contractual obligations resulting in a financial loss to the Group. For trade receivables the Group adopts a policy of only dealing with customers of appropriate credit history or rating. For other financial assets, the Group adopts the policy of only dealing with high credit quality counterparties.
The Group’s business is highly fragmented, reducing the credit exposure to any one customer. At the balance sheet date no individual trade receivable represented more than 11% (2016: 7%) of the total trade receivables balance.
The credit risk for trade receivables, which are all with non-related parties, by geographical area is as follows:
£ Millions 2017 2016
By geographical areas
Europe 7.6 7.9
North America 13.4 9.2
Asia 2.8 4.4
23.8 21.5
Bank deposits that are neither past due nor impaired are mainly deposits with banks with high credit-ratings assigned by international credit-rating agencies. Trade receivables that are neither past due nor impaired are substantially with companies with a good collection track record with the Group.
The age analysis of trade receivables past due and/or impaired is as follows:
£ Millions 2017 2016
Past due 0 – 2 months 6.5 5.7
Past due 3 – 4 months 0.6 0.5
Past due over 4 months 0.3 0.3
7.4 6.5
The carrying amount of trade receivables individually determined to be impaired and the movement in the related allowance for impairment are as follows:
£ Millions 2017 2016
Gross amount 0.9 0.7
Less: Allowance for impairment (0.5) (0.4)
0.4 0.3
Beginning of financial year (0.4) (0.3)
Allowance made (0.2) (0.1)
Allowance utilised – 0.1
Foreign currency translation 0.1 (0.1)
End of the financial year (0.5) (0.4)
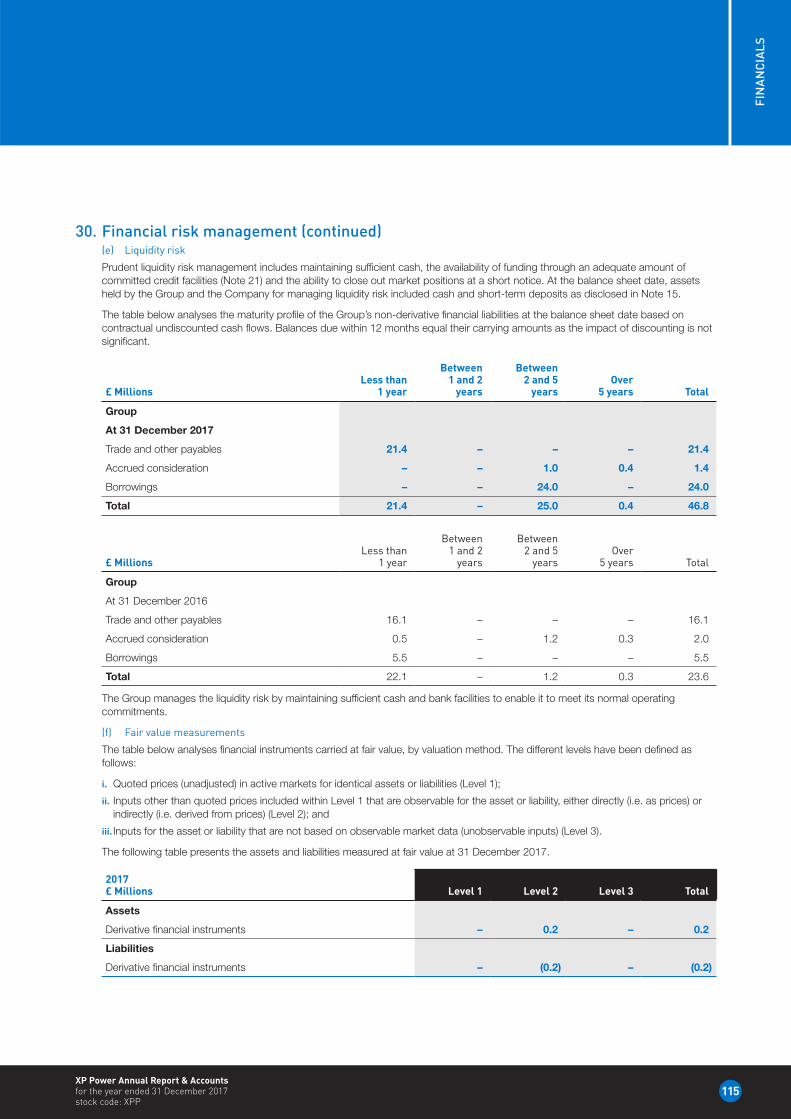
115
FIN
AN
CIA
LS
XP Power Annual Report & Accounts for the year ended 31 December 2017 stock code: XPP
30. Financial risk management (continued)(e) Liquidity risk
Prudent liquidity risk management includes maintaining sufficient cash, the availability of funding through an adequate amount of committed credit facilities (Note 21) and the ability to close out market positions at a short notice. At the balance sheet date, assets held by the Group and the Company for managing liquidity risk included cash and short-term deposits as disclosed in Note 15.
The table below analyses the maturity profile of the Group’s non-derivative financial liabilities at the balance sheet date based on contractual undiscounted cash flows. Balances due within 12 months equal their carrying amounts as the impact of discounting is not significant.
£ MillionsLess than
1 year
Between1 and 2
years
Between 2 and 5
yearsOver
5 years Total
Group
At 31 December 2017
Trade and other payables 21.4 – – – 21.4
Accrued consideration – – 1.0 0.4 1.4
Borrowings – – 24.0 – 24.0
Total 21.4 – 25.0 0.4 46.8
£ MillionsLess than
1 year
Between 1 and 2
years
Between 2 and 5
yearsOver
5 years Total
Group
At 31 December 2016
Trade and other payables 16.1 – – – 16.1
Accrued consideration 0.5 – 1.2 0.3 2.0
Borrowings 5.5 – – – 5.5
Total 22.1 – 1.2 0.3 23.6
The Group manages the liquidity risk by maintaining sufficient cash and bank facilities to enable it to meet its normal operating commitments.
(f) Fair value measurements
The table below analyses financial instruments carried at fair value, by valuation method. The different levels have been defined as follows:
i. Quoted prices (unadjusted) in active markets for identical assets or liabilities (Level 1);
ii. Inputs other than quoted prices included within Level 1 that are observable for the asset or liability, either directly (i.e. as prices) or indirectly (i.e. derived from prices) (Level 2); and
iii. Inputs for the asset or liability that are not based on observable market data (unobservable inputs) (Level 3).
The following table presents the assets and liabilities measured at fair value at 31 December 2017.
2017£ Millions Level 1 Level 2 Level 3 Total
Assets
Derivative financial instruments – 0.2 – 0.2
Liabilities
Derivative financial instruments – (0.2) – (0.2)
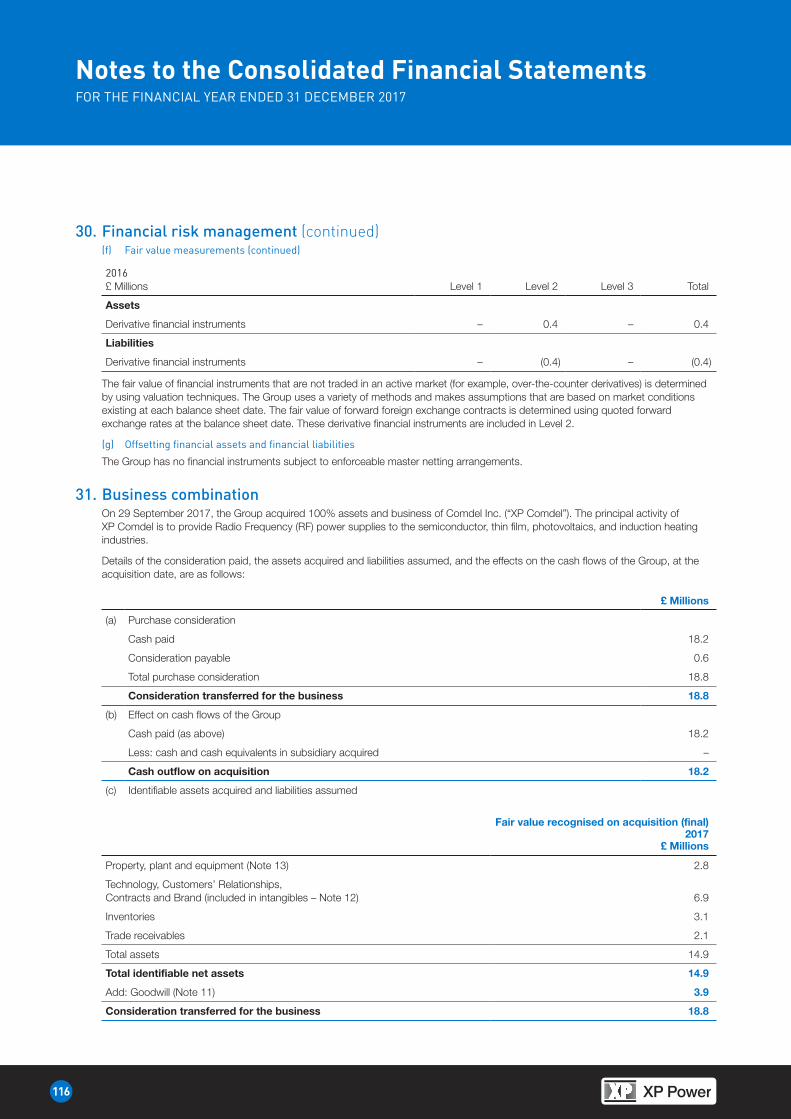
116
HeadingNotes to the Consolidated Financial StatementsFOR THE FINANCIAL YEAR ENDED 31 DECEMBER 2017
30. Financial risk management (continued)(f) Fair value measurements (continued)
2016£ Millions Level 1 Level 2 Level 3 Total
Assets
Derivative financial instruments – 0.4 – 0.4
Liabilities
Derivative financial instruments – (0.4) – (0.4)
The fair value of financial instruments that are not traded in an active market (for example, over-the-counter derivatives) is determined by using valuation techniques. The Group uses a variety of methods and makes assumptions that are based on market conditions existing at each balance sheet date. The fair value of forward foreign exchange contracts is determined using quoted forward exchange rates at the balance sheet date. These derivative financial instruments are included in Level 2.
(g) Offsetting financial assets and financial liabilities
The Group has no financial instruments subject to enforceable master netting arrangements.
31. Business combinationOn 29 September 2017, the Group acquired 100% assets and business of Comdel Inc. (“XP Comdel”). The principal activity of XP Comdel is to provide Radio Frequency (RF) power supplies to the semiconductor, thin film, photovoltaics, and induction heating industries.
Details of the consideration paid, the assets acquired and liabilities assumed, and the effects on the cash flows of the Group, at the acquisition date, are as follows:
£ Millions
(a) Purchase consideration
Cash paid 18.2
Consideration payable 0.6
Total purchase consideration 18.8
Consideration transferred for the business 18.8
(b) Effect on cash flows of the Group
Cash paid (as above) 18.2
Less: cash and cash equivalents in subsidiary acquired –
Cash outflow on acquisition 18.2
(c) Identifiable assets acquired and liabilities assumed
Fair value recognised on acquisition (final) 2017
£ Millions
Property, plant and equipment (Note 13) 2.8
Technology, Customers’ Relationships, Contracts and Brand (included in intangibles – Note 12) 6.9
Inventories 3.1
Trade receivables 2.1
Total assets 14.9
Total identifiable net assets 14.9
Add: Goodwill (Note 11) 3.9
Consideration transferred for the business 18.8
117
FIN
AN
CIA
LS
XP Power Annual Report & Accounts for the year ended 31 December 2017 stock code: XPP
31. Business combination (continued)(d) Acquisition-related costs Acquisition-related costs of £0.2 million are included in “administrative expenses” in the consolidated statement of
comprehensive income and in operating cash flows in the consolidated statement of cash flows for the year ended 31 December 2017.
(e) Acquired receivables The fair value of trade receivables is £2.1 million. The gross contractual amount for trade receivables due is £2.2 million, of
which £0.1 million is expected to be uncollectible.
(f) Final fair values The fair value of the acquired identifiable intangible assets of £6.9 million (brand, technology, customers’ relationships and
contracts) has been determined.
(g) Goodwill The goodwill of £3.9 million arising from the acquisition is attributable to the distribution network in America and the synergies
expected to arise from the economies of scale in combining the operations of the Group with those of XP Comdel.
(h) Revenue and profit contribution The acquired business contributed revenue of £4.1 million and net profit of £0.7 million to the Group from the period from
29 September 2017 to 31 December 2017. Had XP Comdel been consolidated from 1 January 2017, consolidated revenue and consolidated profit before tax for the year ended 31 December 2017 would have been £177.2 million and £31.7 million respectively.
32. Other informationThese financial statements were authorised for issue in accordance with a resolution of the Board of Directors of XP Power Limited on 1 March 2018.
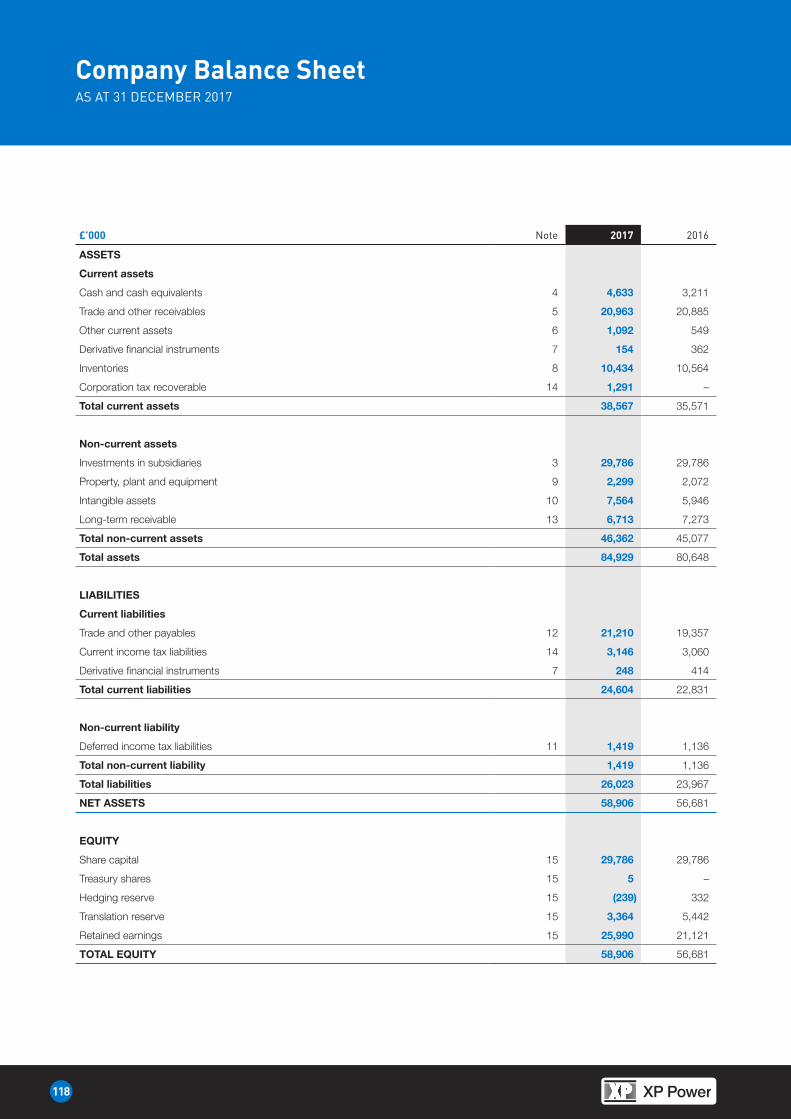
118
HeadingCompany Balance SheetAS AT 31 DECEMBER 2017
£’000 Note 2017 2016
ASSETS
Current assets
Cash and cash equivalents 4 4,633 3,211
Trade and other receivables 5 20,963 20,885
Other current assets 6 1,092 549
Derivative financial instruments 7 154 362
Inventories 8 10,434 10,564
Corporation tax recoverable 14 1,291 –
Total current assets 38,567 35,571
Non-current assets
Investments in subsidiaries 3 29,786 29,786
Property, plant and equipment 9 2,299 2,072
Intangible assets 10 7,564 5,946
Long-term receivable 13 6,713 7,273
Total non-current assets 46,362 45,077
Total assets 84,929 80,648
LIABILITIES
Current liabilities
Trade and other payables 12 21,210 19,357
Current income tax liabilities 14 3,146 3,060
Derivative financial instruments 7 248 414
Total current liabilities 24,604 22,831
Non-current liability
Deferred income tax liabilities 11 1,419 1,136
Total non-current liability 1,419 1,136
Total liabilities 26,023 23,967
NET ASSETS 58,906 56,681
EQUITY
Share capital 15 29,786 29,786
Treasury shares 15 5 –
Hedging reserve 15 (239) 332
Translation reserve 15 3,364 5,442
Retained earnings 15 25,990 21,121
TOTAL EQUITY 58,906 56,681
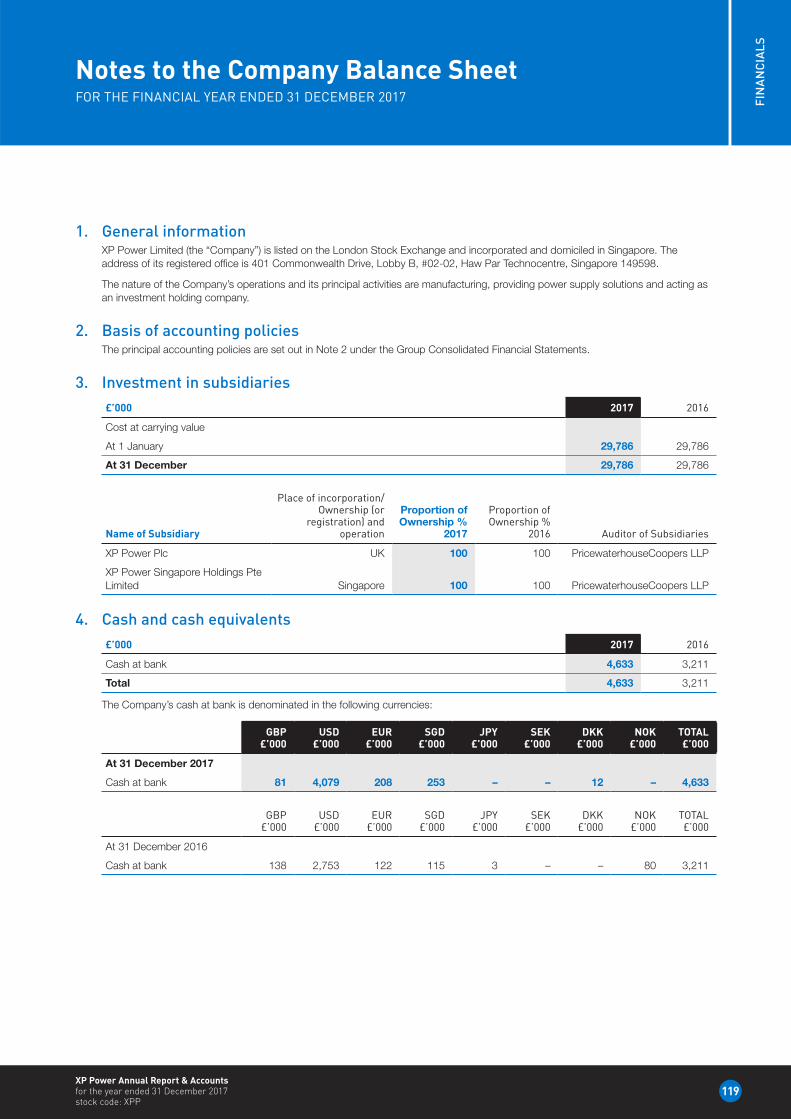
119
FIN
AN
CIA
LS
XP Power Annual Report & Accounts for the year ended 31 December 2017 stock code: XPP
Notes to the Company Balance SheetFOR THE FINANCIAL YEAR ENDED 31 DECEMBER 2017
1. General informationXP Power Limited (the “Company”) is listed on the London Stock Exchange and incorporated and domiciled in Singapore. The address of its registered office is 401 Commonwealth Drive, Lobby B, #02-02, Haw Par Technocentre, Singapore 149598.
The nature of the Company’s operations and its principal activities are manufacturing, providing power supply solutions and acting as an investment holding company.
2. Basis of accounting policiesThe principal accounting policies are set out in Note 2 under the Group Consolidated Financial Statements.
3. Investment in subsidiaries£’000 2017 2016
Cost at carrying value
At 1 January 29,786 29,786
At 31 December 29,786 29,786
Name of Subsidiary
Place of incorporation/Ownership (or
registration) and operation
Proportion of Ownership %
2017
Proportion of Ownership %
2016 Auditor of Subsidiaries
XP Power Plc UK 100 100 PricewaterhouseCoopers LLP
XP Power Singapore Holdings Pte Limited Singapore 100 100 PricewaterhouseCoopers LLP
4. Cash and cash equivalents£’000 2017 2016
Cash at bank 4,633 3,211
Total 4,633 3,211
The Company’s cash at bank is denominated in the following currencies:
GBP
£’000USD
£’000EUR
£’000SGD
£’000JPY
£’000SEK
£’000DKK
£’000NOK
£’000TOTAL£’000
At 31 December 2017
Cash at bank 81 4,079 208 253 – – 12 – 4,633
GBP
£’000USD
£’000EUR
£’000SGD
£’000JPY
£’000SEK
£’000DKK
£’000NOK
£’000TOTAL£’000
At 31 December 2016
Cash at bank 138 2,753 122 115 3 – – 80 3,211
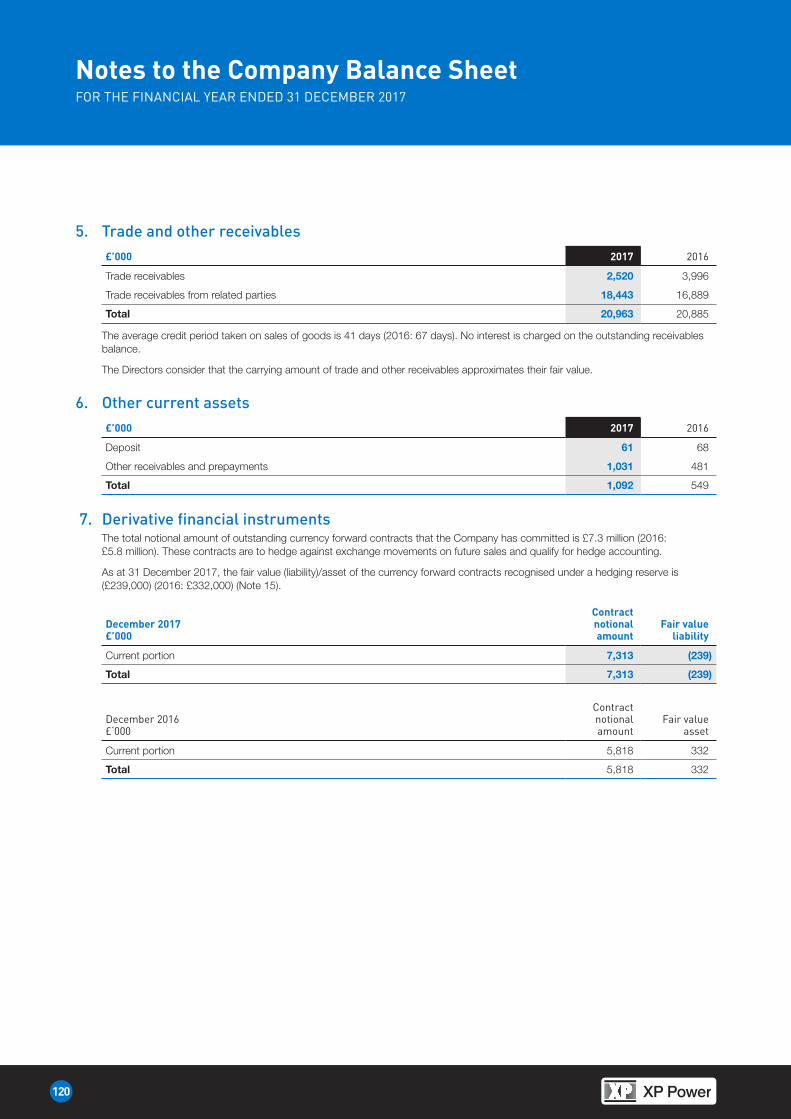
120
HeadingNotes to the Company Balance SheetFOR THE FINANCIAL YEAR ENDED 31 DECEMBER 2017
5. Trade and other receivables£’000 2017 2016
Trade receivables 2,520 3,996
Trade receivables from related parties 18,443 16,889
Total 20,963 20,885
The average credit period taken on sales of goods is 41 days (2016: 67 days). No interest is charged on the outstanding receivables balance.
The Directors consider that the carrying amount of trade and other receivables approximates their fair value.
6. Other current assets£’000 2017 2016
Deposit 61 68
Other receivables and prepayments 1,031 481
Total 1,092 549
7. Derivative financial instrumentsThe total notional amount of outstanding currency forward contracts that the Company has committed is £7.3 million (2016: £5.8 million). These contracts are to hedge against exchange movements on future sales and qualify for hedge accounting.
As at 31 December 2017, the fair value (liability)/asset of the currency forward contracts recognised under a hedging reserve is (£239,000) (2016: £332,000) (Note 15).
December 2017£’000
Contract notional amount
Fair value liability
Current portion 7,313 (239)
Total 7,313 (239)
December 2016£‘000
Contract notional amount
Fair value asset
Current portion 5,818 332
Total 5,818 332
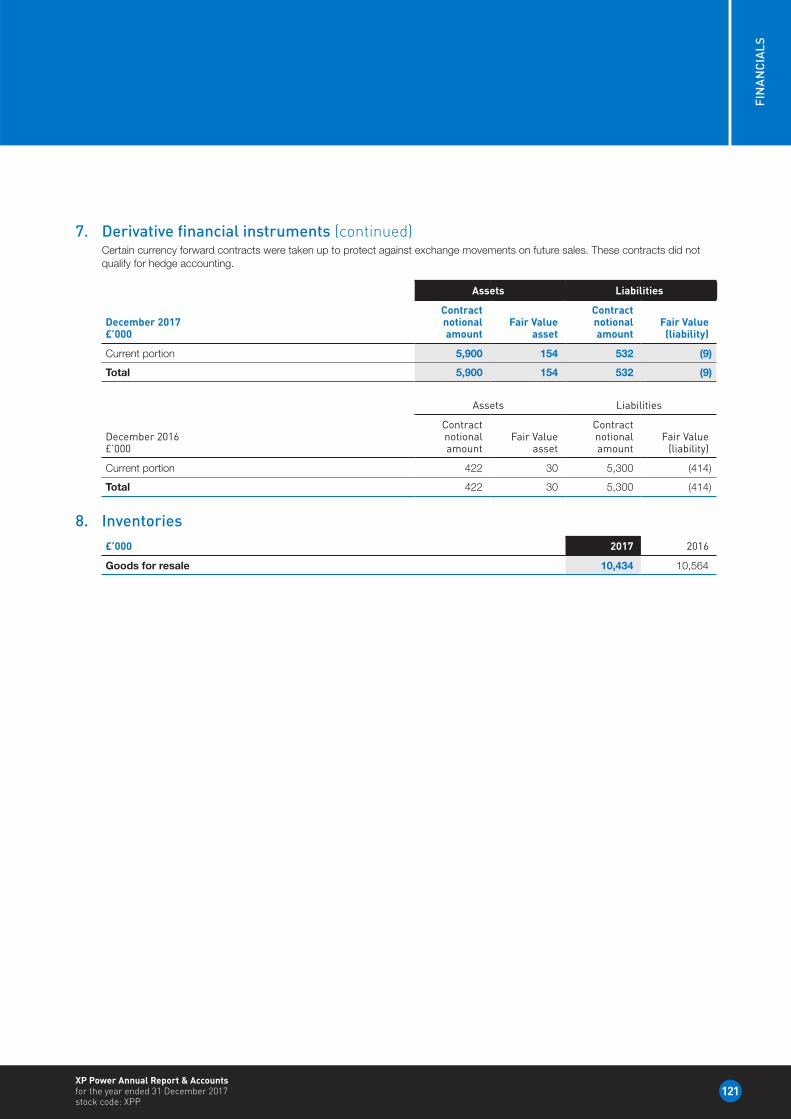
121
FIN
AN
CIA
LS
XP Power Annual Report & Accounts for the year ended 31 December 2017 stock code: XPP
7. Derivative financial instruments (continued)Certain currency forward contracts were taken up to protect against exchange movements on future sales. These contracts did not qualify for hedge accounting.
Assets Liabilities
December 2017£’000
Contract notional amount
Fair Value asset
Contract notional amount
Fair Value (liability)
Current portion 5,900 154 532 (9)
Total 5,900 154 532 (9)
Assets Liabilities
December 2016£’000
Contract notional amount
Fair Value asset
Contract notional amount
Fair Value (liability)
Current portion 422 30 5,300 (414)
Total 422 30 5,300 (414)
8. Inventories£’000 2017 2016
Goods for resale 10,434 10,564
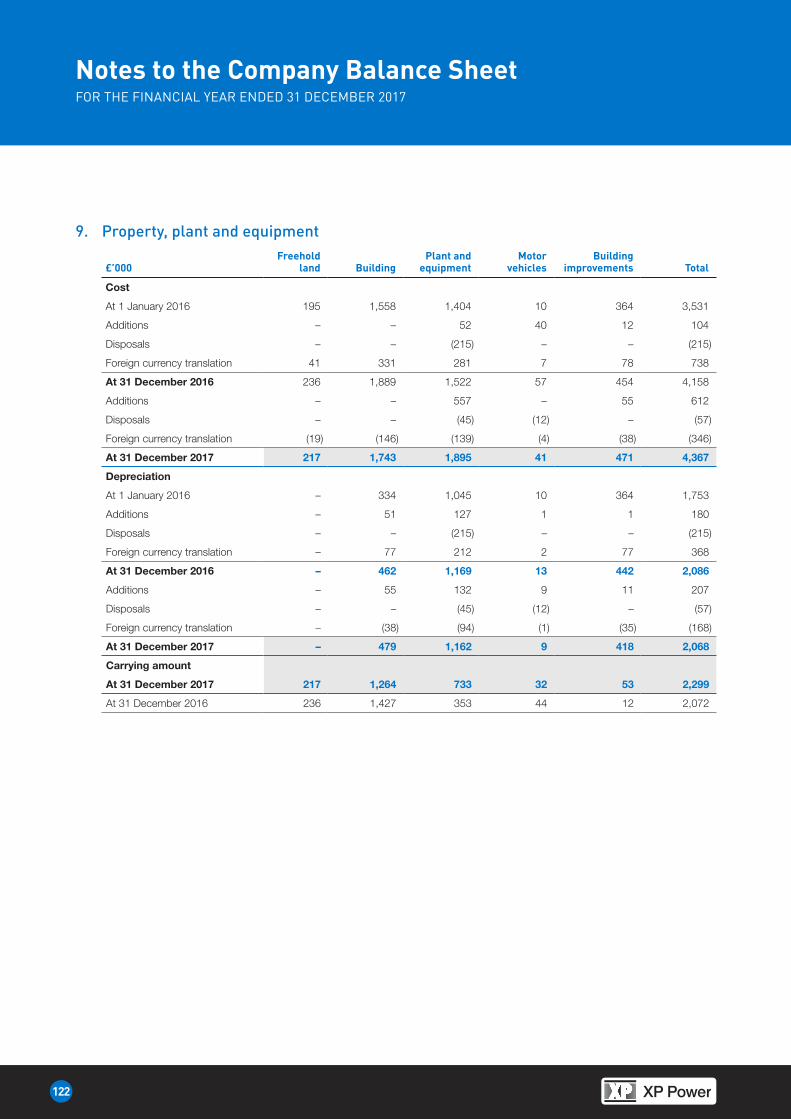
122
HeadingNotes to the Company Balance SheetFOR THE FINANCIAL YEAR ENDED 31 DECEMBER 2017
9. Property, plant and equipment
£’000Freehold
land BuildingPlant and
equipmentMotor
vehiclesBuilding
improvements Total
Cost
At 1 January 2016 195 1,558 1,404 10 364 3,531
Additions – – 52 40 12 104
Disposals – – (215) – – (215)
Foreign currency translation 41 331 281 7 78 738
At 31 December 2016 236 1,889 1,522 57 454 4,158
Additions – – 557 – 55 612
Disposals – – (45) (12) – (57)
Foreign currency translation (19) (146) (139) (4) (38) (346)
At 31 December 2017 217 1,743 1,895 41 471 4,367
Depreciation
At 1 January 2016 – 334 1,045 10 364 1,753
Additions – 51 127 1 1 180
Disposals – – (215) – – (215)
Foreign currency translation – 77 212 2 77 368
At 31 December 2016 – 462 1,169 13 442 2,086
Additions – 55 132 9 11 207
Disposals – – (45) (12) – (57)
Foreign currency translation – (38) (94) (1) (35) (168)
At 31 December 2017 – 479 1,162 9 418 2,068
Carrying amount
At 31 December 2017 217 1,264 733 32 53 2,299
At 31 December 2016 236 1,427 353 44 12 2,072
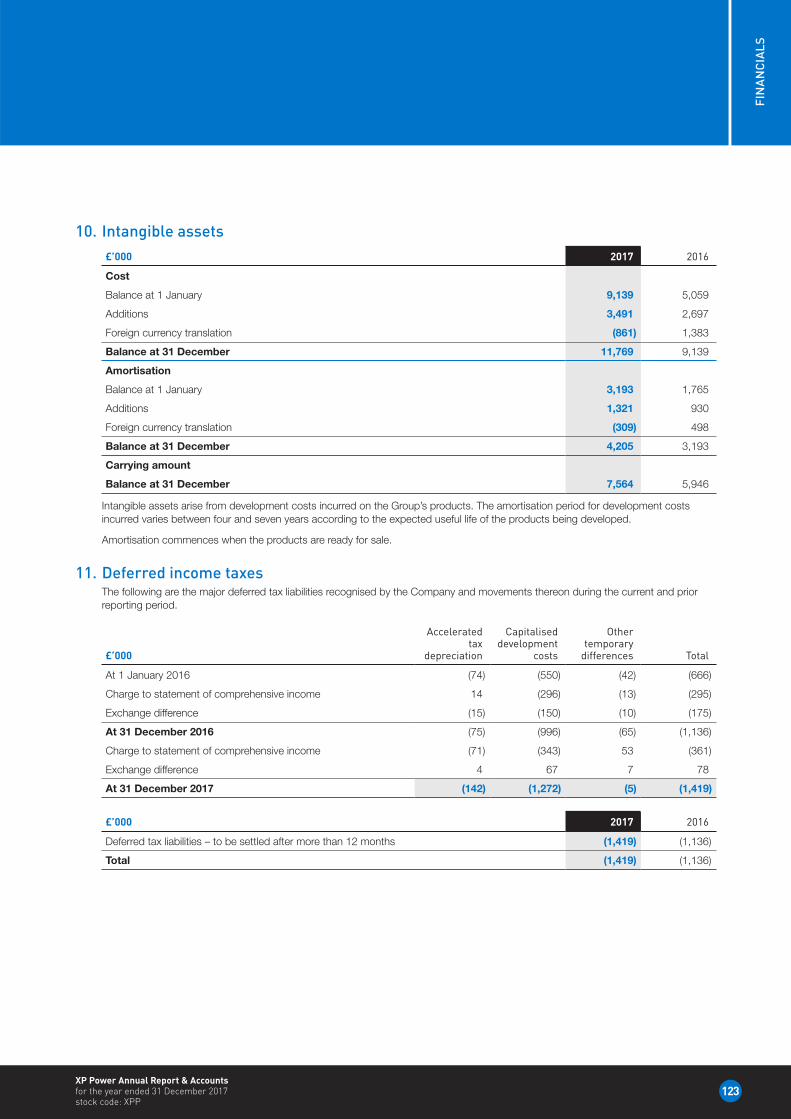
123
FIN
AN
CIA
LS
XP Power Annual Report & Accounts for the year ended 31 December 2017 stock code: XPP
10. Intangible assets£’000 2017 2016
Cost
Balance at 1 January 9,139 5,059
Additions 3,491 2,697
Foreign currency translation (861) 1,383
Balance at 31 December 11,769 9,139
Amortisation
Balance at 1 January 3,193 1,765
Additions 1,321 930
Foreign currency translation (309) 498
Balance at 31 December 4,205 3,193
Carrying amount
Balance at 31 December 7,564 5,946
Intangible assets arise from development costs incurred on the Group’s products. The amortisation period for development costs incurred varies between four and seven years according to the expected useful life of the products being developed.
Amortisation commences when the products are ready for sale.
11. Deferred income taxesThe following are the major deferred tax liabilities recognised by the Company and movements thereon during the current and prior reporting period.
£’000
Accelerated tax
depreciation
Capitalised development
costs
Other temporary
differences Total
At 1 January 2016 (74) (550) (42) (666)
Charge to statement of comprehensive income 14 (296) (13) (295)
Exchange difference (15) (150) (10) (175)
At 31 December 2016 (75) (996) (65) (1,136)
Charge to statement of comprehensive income (71) (343) 53 (361)
Exchange difference 4 67 7 78
At 31 December 2017 (142) (1,272) (5) (1,419)
£’000 2017 2016
Deferred tax liabilities – to be settled after more than 12 months (1,419) (1,136)
Total (1,419) (1,136)
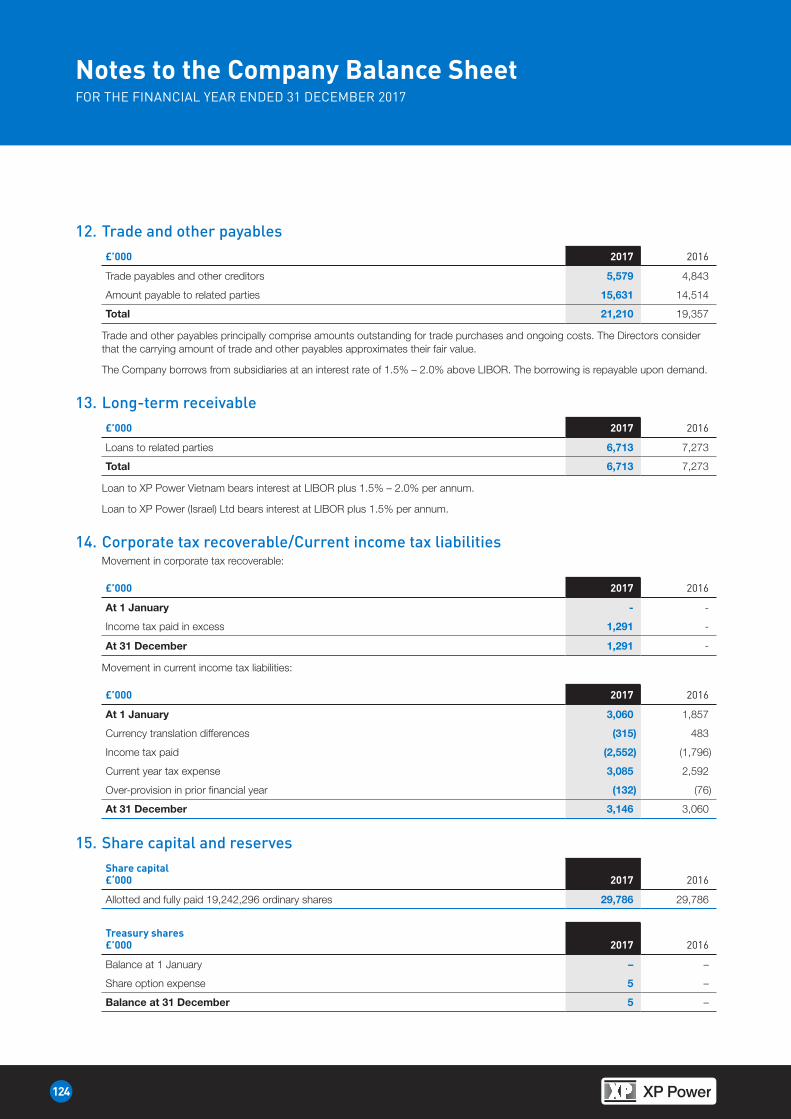
124
HeadingNotes to the Company Balance SheetFOR THE FINANCIAL YEAR ENDED 31 DECEMBER 2017
12. Trade and other payables£’000 2017 2016
Trade payables and other creditors 5,579 4,843
Amount payable to related parties 15,631 14,514
Total 21,210 19,357
Trade and other payables principally comprise amounts outstanding for trade purchases and ongoing costs. The Directors consider that the carrying amount of trade and other payables approximates their fair value.
The Company borrows from subsidiaries at an interest rate of 1.5% – 2.0% above LIBOR. The borrowing is repayable upon demand.
13. Long-term receivable£’000 2017 2016
Loans to related parties 6,713 7,273
Total 6,713 7,273
Loan to XP Power Vietnam bears interest at LIBOR plus 1.5% – 2.0% per annum.
Loan to XP Power (Israel) Ltd bears interest at LIBOR plus 1.5% per annum.
14. Corporate tax recoverable/Current income tax liabilitiesMovement in corporate tax recoverable:
£’000 2017 2016
At 1 January - -
Income tax paid in excess 1,291 -
At 31 December 1,291 -
Movement in current income tax liabilities:
£’000 2017 2016
At 1 January 3,060 1,857
Currency translation differences (315) 483
Income tax paid (2,552) (1,796)
Current year tax expense 3,085 2,592
Over-provision in prior financial year (132) (76)
At 31 December 3,146 3,060
15. Share capital and reservesShare capital£‘000 2017 2016
Allotted and fully paid 19,242,296 ordinary shares 29,786 29,786
Treasury shares£’000 2017 2016
Balance at 1 January – –
Share option expense 5 –
Balance at 31 December 5 –
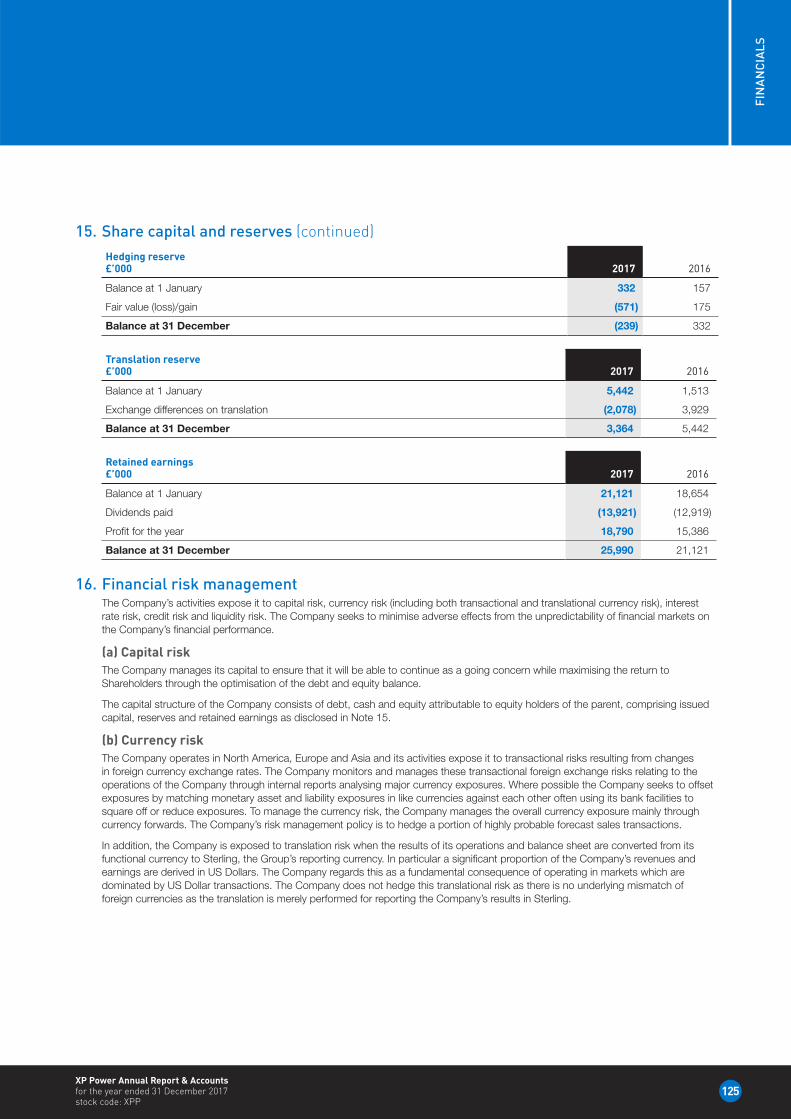
125
FIN
AN
CIA
LS
XP Power Annual Report & Accounts for the year ended 31 December 2017 stock code: XPP
15. Share capital and reserves (continued)Hedging reserve£’000 2017 2016
Balance at 1 January 332 157
Fair value (loss)/gain (571) 175
Balance at 31 December (239) 332
Translation reserve £’000 2017 2016
Balance at 1 January 5,442 1,513
Exchange differences on translation (2,078) 3,929
Balance at 31 December 3,364 5,442
Retained earnings £’000 2017 2016
Balance at 1 January 21,121 18,654
Dividends paid (13,921) (12,919)
Profit for the year 18,790 15,386
Balance at 31 December 25,990 21,121
16. Financial risk managementThe Company’s activities expose it to capital risk, currency risk (including both transactional and translational currency risk), interest rate risk, credit risk and liquidity risk. The Company seeks to minimise adverse effects from the unpredictability of financial markets on the Company’s financial performance.
(a) Capital riskThe Company manages its capital to ensure that it will be able to continue as a going concern while maximising the return to Shareholders through the optimisation of the debt and equity balance.
The capital structure of the Company consists of debt, cash and equity attributable to equity holders of the parent, comprising issued capital, reserves and retained earnings as disclosed in Note 15.
(b) Currency riskThe Company operates in North America, Europe and Asia and its activities expose it to transactional risks resulting from changes in foreign currency exchange rates. The Company monitors and manages these transactional foreign exchange risks relating to the operations of the Company through internal reports analysing major currency exposures. Where possible the Company seeks to offset exposures by matching monetary asset and liability exposures in like currencies against each other often using its bank facilities to square off or reduce exposures. To manage the currency risk, the Company manages the overall currency exposure mainly through currency forwards. The Company’s risk management policy is to hedge a portion of highly probable forecast sales transactions.
In addition, the Company is exposed to translation risk when the results of its operations and balance sheet are converted from its functional currency to Sterling, the Group’s reporting currency. In particular a significant proportion of the Company’s revenues and earnings are derived in US Dollars. The Company regards this as a fundamental consequence of operating in markets which are dominated by US Dollar transactions. The Company does not hedge this translational risk as there is no underlying mismatch of foreign currencies as the translation is merely performed for reporting the Company’s results in Sterling.
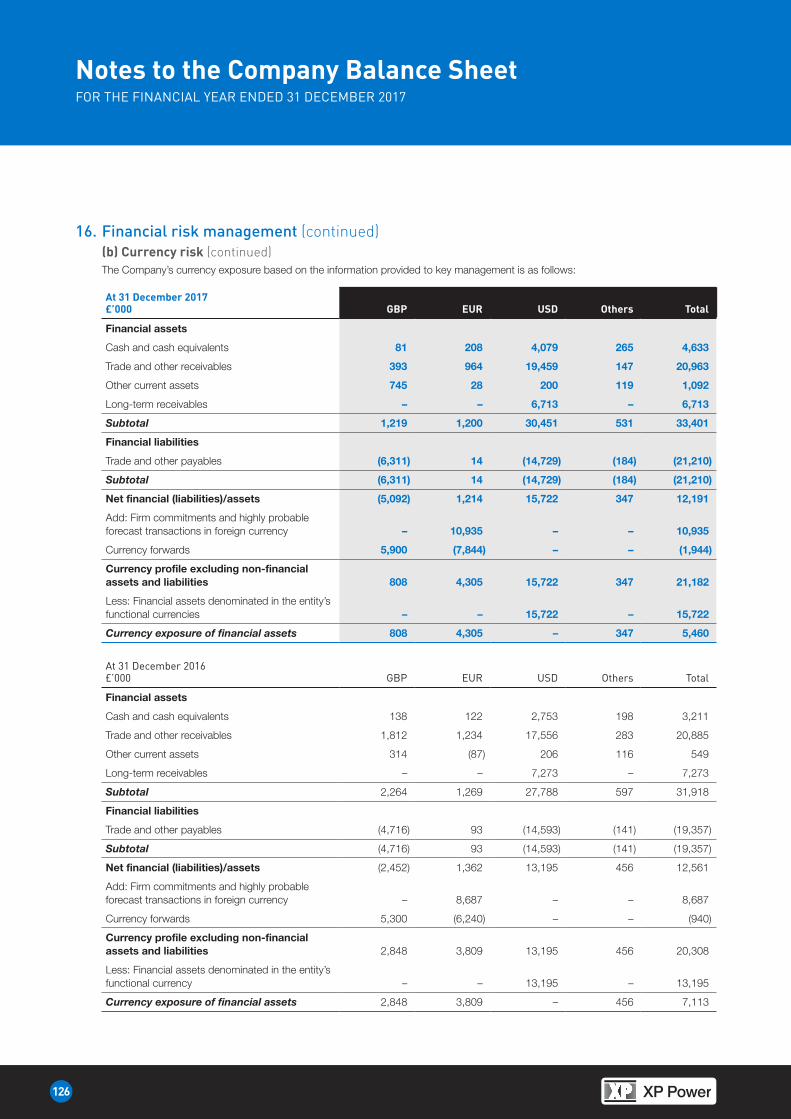
126
HeadingNotes to the Company Balance SheetFOR THE FINANCIAL YEAR ENDED 31 DECEMBER 2017
16. Financial risk management (continued)(b) Currency risk (continued)The Company’s currency exposure based on the information provided to key management is as follows:
At 31 December 2017£’000 GBP EUR USD Others Total
Financial assets
Cash and cash equivalents 81 208 4,079 265 4,633
Trade and other receivables 393 964 19,459 147 20,963
Other current assets 745 28 200 119 1,092
Long-term receivables – – 6,713 – 6,713
Subtotal 1,219 1,200 30,451 531 33,401
Financial liabilities
Trade and other payables (6,311) 14 (14,729) (184) (21,210)
Subtotal (6,311) 14 (14,729) (184) (21,210)
Net financial (liabilities)/assets (5,092) 1,214 15,722 347 12,191
Add: Firm commitments and highly probable forecast transactions in foreign currency – 10,935 – – 10,935
Currency forwards 5,900 (7,844) – – (1,944)
Currency profile excluding non-financial assets and liabilities 808 4,305 15,722 347 21,182
Less: Financial assets denominated in the entity’s functional currencies – – 15,722 – 15,722
Currency exposure of financial assets 808 4,305 – 347 5,460
At 31 December 2016 £’000 GBP EUR USD Others Total
Financial assets
Cash and cash equivalents 138 122 2,753 198 3,211
Trade and other receivables 1,812 1,234 17,556 283 20,885
Other current assets 314 (87) 206 116 549
Long-term receivables – – 7,273 – 7,273
Subtotal 2,264 1,269 27,788 597 31,918
Financial liabilities
Trade and other payables (4,716) 93 (14,593) (141) (19,357)
Subtotal (4,716) 93 (14,593) (141) (19,357)
Net financial (liabilities)/assets (2,452) 1,362 13,195 456 12,561
Add: Firm commitments and highly probable forecast transactions in foreign currency – 8,687 – – 8,687
Currency forwards 5,300 (6,240) – – (940)
Currency profile excluding non-financial assets and liabilities 2,848 3,809 13,195 456 20,308
Less: Financial assets denominated in the entity’s functional currency – – 13,195 – 13,195
Currency exposure of financial assets 2,848 3,809 – 456 7,113
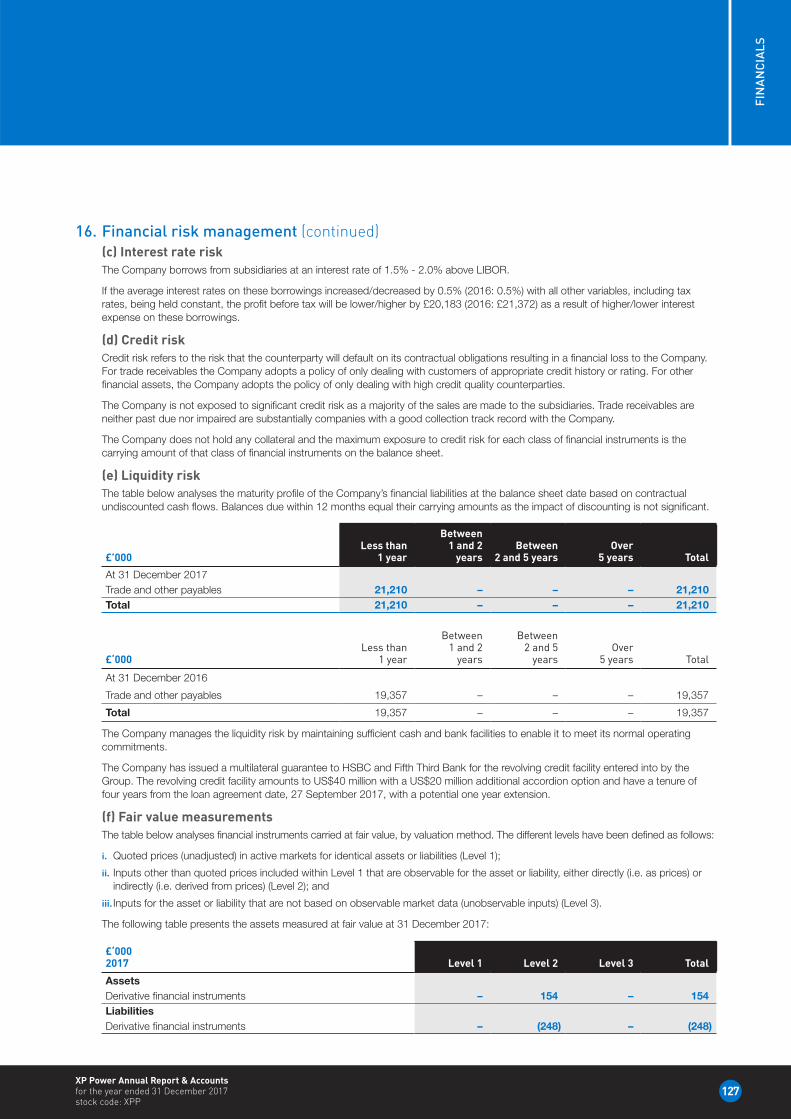
127
FIN
AN
CIA
LS
XP Power Annual Report & Accounts for the year ended 31 December 2017 stock code: XPP
16. Financial risk management (continued)(c) Interest rate riskThe Company borrows from subsidiaries at an interest rate of 1.5% - 2.0% above LIBOR.
If the average interest rates on these borrowings increased/decreased by 0.5% (2016: 0.5%) with all other variables, including tax rates, being held constant, the profit before tax will be lower/higher by £20,183 (2016: £21,372) as a result of higher/lower interest expense on these borrowings.
(d) Credit riskCredit risk refers to the risk that the counterparty will default on its contractual obligations resulting in a financial loss to the Company. For trade receivables the Company adopts a policy of only dealing with customers of appropriate credit history or rating. For other financial assets, the Company adopts the policy of only dealing with high credit quality counterparties.
The Company is not exposed to significant credit risk as a majority of the sales are made to the subsidiaries. Trade receivables are neither past due nor impaired are substantially companies with a good collection track record with the Company.
The Company does not hold any collateral and the maximum exposure to credit risk for each class of financial instruments is the carrying amount of that class of financial instruments on the balance sheet.
(e) Liquidity riskThe table below analyses the maturity profile of the Company’s financial liabilities at the balance sheet date based on contractual undiscounted cash flows. Balances due within 12 months equal their carrying amounts as the impact of discounting is not significant.
£’000Less than
1 year
Between 1 and 2
yearsBetween
2 and 5 yearsOver
5 years Total
At 31 December 2017Trade and other payables 21,210 – – – 21,210Total 21,210 – – – 21,210
£‘000Less than
1 year
Between 1 and 2
years
Between 2 and 5
yearsOver
5 years Total
At 31 December 2016
Trade and other payables 19,357 – – – 19,357
Total 19,357 – – – 19,357
The Company manages the liquidity risk by maintaining sufficient cash and bank facilities to enable it to meet its normal operating commitments.
The Company has issued a multilateral guarantee to HSBC and Fifth Third Bank for the revolving credit facility entered into by the Group. The revolving credit facility amounts to US$40 million with a US$20 million additional accordion option and have a tenure of four years from the loan agreement date, 27 September 2017, with a potential one year extension.
(f) Fair value measurementsThe table below analyses financial instruments carried at fair value, by valuation method. The different levels have been defined as follows:
i. Quoted prices (unadjusted) in active markets for identical assets or liabilities (Level 1);
ii. Inputs other than quoted prices included within Level 1 that are observable for the asset or liability, either directly (i.e. as prices) or indirectly (i.e. derived from prices) (Level 2); and
iii. Inputs for the asset or liability that are not based on observable market data (unobservable inputs) (Level 3).
The following table presents the assets measured at fair value at 31 December 2017:
£‘000 2017 Level 1 Level 2 Level 3 Total
AssetsDerivative financial instruments – 154 – 154LiabilitiesDerivative financial instruments – (248) – (248)
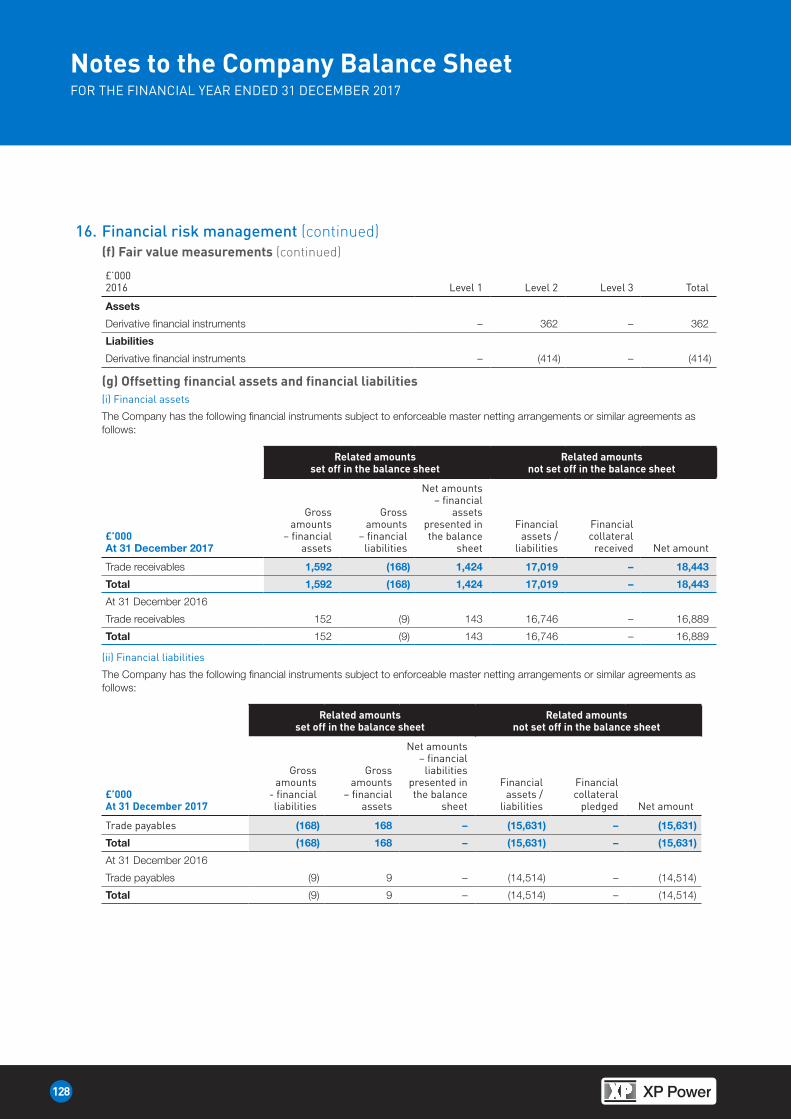
128
Heading
16. Financial risk management (continued)(f) Fair value measurements (continued)
£’000 2016 Level 1 Level 2 Level 3 Total
Assets
Derivative financial instruments – 362 – 362
Liabilities
Derivative financial instruments – (414) – (414)
(g) Offsetting financial assets and financial liabilities(i) Financial assets
The Company has the following financial instruments subject to enforceable master netting arrangements or similar agreements as follows:
Related amounts set off in the balance sheet
Related amounts not set off in the balance sheet
£’000At 31 December 2017
Gross amounts
– financial assets
Gross amounts
– financial liabilities
Net amounts – financial
assets presented in the balance
sheet
Financial assets /
liabilities
Financial collateral
received Net amount
Trade receivables 1,592 (168) 1,424 17,019 – 18,443
Total 1,592 (168) 1,424 17,019 – 18,443
At 31 December 2016
Trade receivables 152 (9) 143 16,746 – 16,889
Total 152 (9) 143 16,746 – 16,889
(ii) Financial liabilities
The Company has the following financial instruments subject to enforceable master netting arrangements or similar agreements as follows:
Related amounts set off in the balance sheet
Related amounts not set off in the balance sheet
£’000At 31 December 2017
Gross amounts
- financial liabilities
Gross amounts
– financial assets
Net amounts – financial
liabilities presented in the balance
sheet
Financial assets /
liabilities
Financial collateral
pledged Net amount
Trade payables (168) 168 – (15,631) – (15,631)
Total (168) 168 – (15,631) – (15,631)
At 31 December 2016
Trade payables (9) 9 – (14,514) – (14,514)
Total (9) 9 – (14,514) – (14,514)
Notes to the Company Balance SheetFOR THE FINANCIAL YEAR ENDED 31 DECEMBER 2017
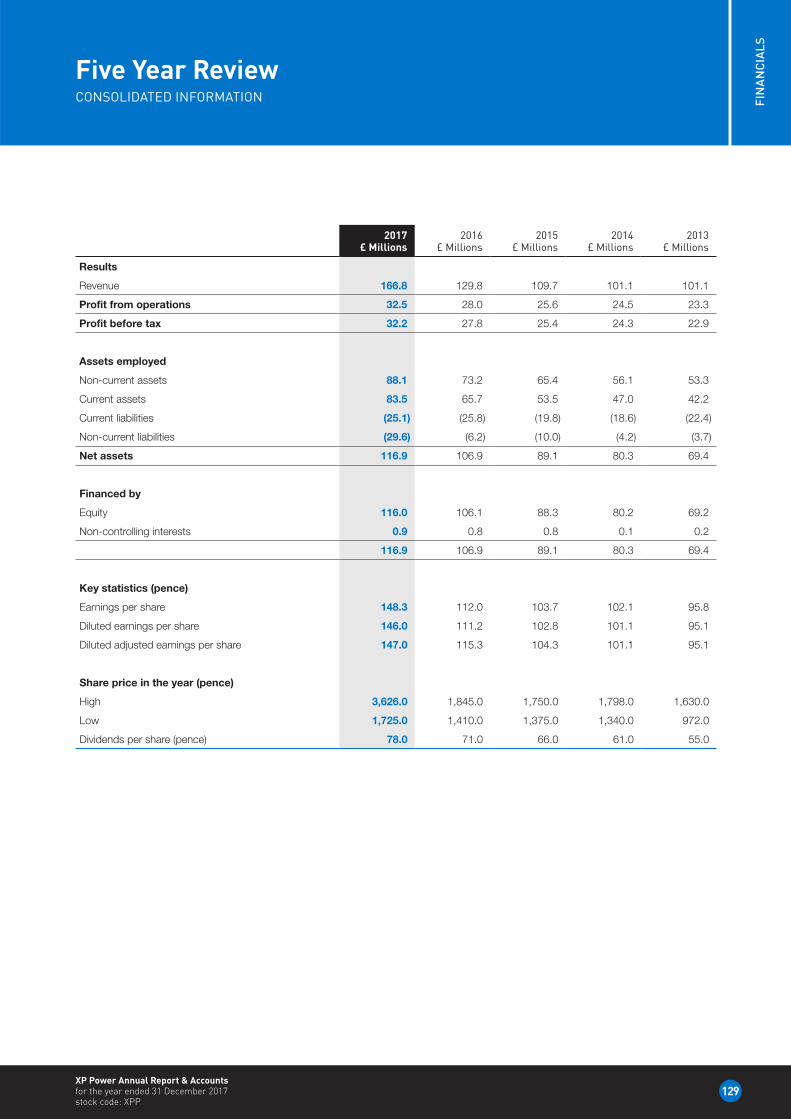
129
FIN
AN
CIA
LS
XP Power Annual Report & Accounts for the year ended 31 December 2017 stock code: XPP
Five Year ReviewCONSOLIDATED INFORMATION
2017£ Millions
2016£ Millions
2015£ Millions
2014£ Millions
2013£ Millions
Results
Revenue 166.8 129.8 109.7 101.1 101.1
Profit from operations 32.5 28.0 25.6 24.5 23.3
Profit before tax 32.2 27.8 25.4 24.3 22.9
Assets employed
Non-current assets 88.1 73.2 65.4 56.1 53.3
Current assets 83.5 65.7 53.5 47.0 42.2
Current liabilities (25.1) (25.8) (19.8) (18.6) (22.4)
Non-current liabilities (29.6) (6.2) (10.0) (4.2) (3.7)
Net assets 116.9 106.9 89.1 80.3 69.4
Financed by
Equity 116.0 106.1 88.3 80.2 69.2
Non-controlling interests 0.9 0.8 0.8 0.1 0.2
116.9 106.9 89.1 80.3 69.4
Key statistics (pence)
Earnings per share 148.3 112.0 103.7 102.1 95.8
Diluted earnings per share 146.0 111.2 102.8 101.1 95.1
Diluted adjusted earnings per share 147.0 115.3 104.3 101.1 95.1
Share price in the year (pence)
High 3,626.0 1,845.0 1,750.0 1,798.0 1,630.0
Low 1,725.0 1,410.0 1,375.0 1,340.0 972.0
Dividends per share (pence) 78.0 71.0 66.0 61.0 55.0
130
HeadingXP Power Limited Advisers
Company BrokersInvestec2 Gresham StreetLondonEC2V 7QPUnited Kingdom
Principal BankersHSBC Bank plcLevel 7Thames TowerStation RoadReading
SolicitorsOsborne Clarke2 Temple Back EastTemple QuayBristolBS1 6EGUnited Kingdom
RegistrarsLink Asset ServicesThe Registry34 Beckenham RoadBeckenhamKentBR3 4TUUnited Kingdom
Company SecretaryM & C Services Private Limited112 Robinson Road #05-01The Corporate OfficeSingapore 068902
AuditorsPricewaterhouseCoopers LLP7 Straits ViewMarina One, East Tower, Level 12Singapore 018936

Introduction
OUR PURPOSEWe provide our customers in the Healthcare, Industrial and Technology sectors with solutions to power their critical systems and get their products to market in the shortest possible time.
Electronic equipment cannot operate directly from the electricity provided by the mains supply which is a relatively high voltage alternating current. All electronic equipment requires a stable, direct current in order to operate. Our electronic power converters are designed-in to our customers’ end equipment, often with the aid of our engineering expertise, to provide this stable direct current. These power solutions also provide the vital safety barrier between the potentially lethal mains supply and the user of the end equipment.
Our target customers provide vital equipment where the cost of downtime or implications of failure are significant.
We power the world’s critical systems.
OUR VISIONTo be the first choice power solutions provider delivering the ultimate experience for our customers and our people.
OUR CORE VALUESOur core values of INTEGRITY, KNOWLEDGE, FLEXIBILITY, SPEED and CUSTOMER FOCUS are our DNA and are fundamental to our success.
CUSTOMER FOCUS KNOWLEDGE INTEGRITYFLEXIBILITY SPEEDCUSTOMER
FOCUS KNOWLEDGE INTEGRITYFLEXIBILITY SPEEDCUSTOMER FOCUS KNOWLEDGE INTEGRITYFLEXIBILITY SPEEDCUSTOMER FOCUS KNOWLEDGE INTEGRITYFLEXIBILITY SPEEDCUSTOMER
FOCUS KNOWLEDGE INTEGRITYFLEXIBILITY SPEED
Printed on Cocoon Silk 60.
A recycled paper containing 60% recycled waste and 40% virgin fibre and manufactured at a mill certified with ISO 14001 environmental management standard.
The pulp used in this product is bleached using an Elemental Chlorine Free process. (ECF)

XP POWERANNUAL REPORT & ACCOUNTS
for the year ended 31 December 2017
stock code: XPP
XPPOWER A
NN
UA
L REP
OR
T & AC
CO
UN
TS for the year ended 31 Decem
ber 2017
XP POWER LIMITED401 COMMONWEALTH DRIVEHAW PAR TECHNOCENTRE
LOBBY B #02-02SINGAPORE 149598
T: +65 6411 6900F: +65 6479 6305


![z a) 4,200B 2,500B T E L : 080-1244-5635 FAX : 03-6411 ... · z a) 4,200B 2,500B T E L : 080-1244-5635 FAX : 03-6411-1783 E-mail : info@chinju-no-mori.or.jp 7 r INISHIE NIGHT]](https://img.pdfslide.us/doc/110x75/5f3304178d6ced53374fb71a/z-a-4200b-2500b-t-e-l-080-1244-5635-fax-03-6411-z-a-4200b-2500b-t.jpg)


![[XLS]help.carecentrix.comhelp.carecentrix.com/ProviderResources/CareCentrix... · Web view6477 6478 6479 6480 6481 6482 6483 6484 6485 6486 6487 6488 6489 6490 6491 6492 6493 6494](https://img.pdfslide.us/doc/110x75/5af3fdb47f8b9a74448c4006/xlshelp-view6477-6478-6479-6480-6481-6482-6483-6484-6485-6486-6487-6488-6489.jpg)