Embed Size (px)
Citation preview

B0 − B0
oscillations and measurements of |Vub|/|Vcb|at LEP
Achille Stocchi
February 4, 1999
Laboratoire de l’Accelerateur LineaireIN2P3-CNRS et Universite de Paris-Sud
B.P. 34 - 91898 Orsay Cedex
Abstract
In this paper a review of the LEP analyses on B0 − B0 oscillations and on themeasurement of |Vub|/|Vcb| is presented . These measurements are of fundamentalimportance in constraining the ρ and η parameters of the CKM matrix. A reviewof the current status of the VCKM matrix determination is also given.
Introduction
The data registration at the Z0 pole has stopped at the end of 1995. The four LEPexperiments (ALEPH, DELPHI, L3 and OPAL) have collected about 4M hadronic Z0
decays per experiment.
In the past three years, the quality of the data analysis has continuously improved,thanks to a better understanding of the behaviour of all components of the detector. Atthe same time, new ideas, and then, new analyses have been tried. A more performantstatistical treatment of the information has been also developed. As a result, the pre-cision on the ∆md parameter has been improved and above all, the sensitivity for the∆ms parameter has been tremendously increased. The new and precise LEP analyses on|Vub|/|Vcb| are also a consequence of these improvements. Many analyses described in thispaper have been presented at the last ’98 Summer Conferences and are still preliminary.This paper is organized as follows. The first sections are dedicated to the oscillationsand |Vub|/|Vcb| analyses. In the last section the present status of the VCKM matrix isgiven with a special emphasis placed on the impact of the measurements presented in thispaper.
1

The oscillation analyses
The probability that a B0 meson oscillates into a B0
or stays as a B0 is given by:
PB0
q→B0q(B
0q)
=1
2e−t/τq (1± cos∆mqt) (1)
where the effect of CP violation has been neglected. τq is the lifetime of the B0q meson,
∆mq = mB01−mB0
2is the mass difference between the two mass eigenstates1 and gives the
period of the time oscillations (the effect of a lifetime difference between the two stateshas been also neglected).
The Standard Model predicts:
∆md ∝ A2λ6[(1− ρ)2 + η2]f2BdBd ; ∆ms ∝ A2λ4f2Bs
Bs (2)
The difference in the λ dependence of these expressions (λ ∼ 0.22) implies that ∆ms ∼20 ∆md. It is then clear that a very good proper time resolution is needed to measure
the ∆ms parameter. A time dependent study of B0 − B0
oscillations requires:- the measurement of the decay proper time,
- to know if a B0 or a B0
decays at t = to (decay tag)- to know if a b or a b quark has been produced at t = 0 (production tag).
0.1
0.2
0.3
0.4
0.5
0.6
0.7
0.8
-2 0 2 4 6 8 10
t ( ps )
R =
(lik
e-s
ign
)/(lik
e-s
ign
+ u
nlik
e-s
ign
)
Figure 1: The plot shows the time dependence behaviour of the B0d−B0
d oscillation. The pointswith error bars are the data. The curve shows the result of the fit using ∆md = 0.47 ps−1.
The precision on the ∆m measurement is given by the following relation:
error =
√NfB0d(s)
(2ε1 − 1)(2ε2 − 1)e−(
∆md(s)σt
2
)2−1
(3)
1∆mq is usually given in ps−1. 1 ps−1 corresponds to 6.58 10−4eV.
2

where N is the total number of events in the sample; fB0d(s)
is the fraction of events in
which a B0d(s) meson has been produced; ε2, ε1 are the tagging purities at the decay and
production times respectively, defined as ε =Nright
Nright+Nwrong, where Nright(Nwrong) are the
numbers of correctly (incorrectly) tagged events and σt is the proper time resolution given,
approximately, as σt =
√(m2
p2
)σ2
L +(
σp
p
)2t2, where σL and σp are the decay length and
the momentum resolutions respectively.
∆md measurements
A lot of analyses have been performed since 1994. A typical time distribution is shownin Figure 1. The time dependence behaviour with frequency ∆md ∼ 0.470 ps−1, for the
B0d−B
0d oscillation is clearly visible. This will be a textbook plot ! The present summary
of the results on ∆md, as given by [1], is shown in Figure 2. Combining LEP/CDF andSLD measurements it follows that:
∆md = (0.477± 0.017)ps−1 (4)
∆md is known with a precision of 3.4% relative error.
Analyses on ∆ms
Four types of analyses have been performed.
Table 1: The characteristics of the different analyses are given in terms of statistics (N), B0s
purity (fBs), tagging purity at the production and decay time (ε1, ε2) and time resolution in thefirst pico-second
Analysis N(events) fBSε1 ε2 σt(t < 1ps)
Inclusive lepton ∼ 50000 ∼ 10% ∼ 70% ∼ 90% ∼ 0.25 psD±
s h∓ ∼ 3000 ∼ 15% ∼ 72% ∼ 90% ∼ 0.22 psD±
s `∓ ∼ 400 ∼ 60% ∼ 78% ∼ 90% ∼ 0.18 psExclusive B0
S ∼ 25 ∼ 70% ∼ 78% ∼ 100% ∼ 0.08 ps
For all of them, the latest analyses make use of the combined tag method for tagginga b or a b at production time. At LEP, the produced b and b quarks fragment indepen-dently and the events can be divided in two separate hemispheres. If the measurementof the proper time is performed in one of those (same hemisphere), the other (oppositehemisphere) can be used to determine if a b or a b quark was produced in that hemi-sphere. Several variables are considered in the opposite hemisphere:
• Q =∑n
i=1qi(~pi.~eS)0.6∑n
i=1(~pi.~eS)0.6 the hemisphere charge, defined as the charge of all (n) charged
tracks (qi) present in the hemisphere, weighted by their momentum (pi) projected alongthe thrust axis (~eS) with a chosen value for the exponent (0.6),
3

• the hemisphere charge, considering only identified kaons,• the charge of primary and secondary vertices,• the presence of high pt leptons.
The use of these variables allow to have a tagging purity of the order of 70%.
0.35 0.4 0.45 0.5 0.55 0.6 0.65
∆md (ps-1)
preliminary averageincluding Υ(4S) data
0.471 ±0.016 ps-1
preliminary average 0.477 ±0.017 ps-1
SLD l/Qjet+pol(93-95 prel)
0.520 ±0.072 ±0.035 ps-1SLD l+D/Qjet+pol
(93-95 prel)0.452 ±0.074 ±0.049 ps-1
SLD dipole/Qjet+pol(93-95 prel)
0.561 ±0.078 ±0.039 ps-1SLD K/Qjet+pol
(93-95 prel)0.580 ±0.066 ±0.075 ps-1
OPAL D*/l(90-94)
0.567 ±0.089 +0.029 ps-10.567 ±0.089 -0.023
OPAL D*l/Qjet(90-94)
0.539 ±0.060 ±0.024 ps-1OPAL l/Qjet
(91-94)0.444 ±0.029 +0.020 ps-10.444 ±0.029 -0.017
OPAL l/l(91-94)
0.430 ±0.043 +0.028 ps-10.430 ±0.043 -0.030
L3 l/l(IP)(94-95)
0.472 ±0.049 ±0.053 ps-1L3 l/Qjet
(94-95)0.437 ±0.043 ±0.044 ps-1
L3 l/l(94-95)
0.458 ±0.046 ±0.032 ps-1DELPHI D */Qjet
(91-94)0.523 ±0.072 ±0.043 ps-1
DELPHI l/l(91-94)
0.480 ±0.040 ±0.051 ps-1DELPHI π* l/Qjet
(91-94)0.499 ±0.053 ±0.015 ps-1
DELPHI l/Qjet(91-94)
0.493 ±0.042 ±0.027 ps-1CDF D*l/l
(92-95 prel)0.512 +0.095 +0.031 ps-10.512 -0.0930.512 +0.095 -0.038
CDF l/l,Qjet(94-95 prel)
0.496 ±0.052 ±0.048 ps-1CDF µ/µ
(92-95 prel)0.503 ±0.064 ±0.071 ps-1
CDF e/µ(92-95 prel)
0.450 ±0.045 ±0.051 ps-1CDF Dl/SST
(92-95)0.471 +0.078 ±0.034 ps-10.471 -0.068
ALEPH vtx/Qjet(91-95 prel)
0.441 ±0.026 ±0.029 ps-1ALEPH l/l
(91-94)0.452 ±0.039 ±0.044 ps-1
ALEPH l/Qjet(91-94)
0.404 ±0.045 ±0.027 ps-1ALEPH D */l,Qjet
(91-94)0.482 ±0.044 ±0.024 ps-1
LEP B OscillationsWorking Group
Figure 2: Summary of the ∆md results from the LEP, SLD and CDF Collaborations are given.Details on how the different results have been combined are given in [1].
Tracks in the same hemisphere can be used also. This procedure is peculiarly clean ifall the tracks from the B0
s have been reconstructed (as for D±s `∓ and exclusive Bs analyses).
In this case, tracks from the B0s decay can be removed and the others, coming from the
primary vertex can be used. The addition of informations from the same hemisphereallows to reach a tagging purity of 74%. Finally the use of all these informations on anevent by event basis gives a purity of 78%.
4

The tagging of a B or a B meson at decay time depends on the specific analysis andwill be given in the following. Before describing the different analyses, the method usedto measure or put a limit on ∆ms is briefly discussed.
The amplitude method
The method used to measure or to put a limit on ∆ms consists in modifying equation 1 inthe following way: 1± cos∆mst → 1±Acos∆mst. A and σA are measured at fixed valuesof ∆ms instead of ∆ms itself. In case of a clear oscillation signal, at given ∆ms, the valueof the amplitude is compatible with A = 1 for this ∆ms and with A = 0 elsewhere. Withthis method it is also easy to set a limit. The values of ∆ms excluded at 95% C.L. arethose satisfying the condition A(∆ms) + 1.645 σA(∆ms) < 1.
With this method, it is easy to combine different experiments and to treat systematicuncertainties in an usual way since, at each value of ∆ms, a value for A with a gaussianerror σA, is measured. Furthermore, the sensitivity of the experiment can be defined as thevalue of ∆ms corresponding to 1.645 σA(∆ms) = 1 (for A(∆ms) = 0, namely supposingthat the “true” value of ∆ms is well above the measurable value of ∆ms). The sensitivityis the limit which would be reached in 50% of the experiments.
The inclusive lepton/combined tag analysis
This analysis uses high pt leptons which are mainly coming from direct b semileptonicdecays (b → `). The sign of the lepton tags the B0
s at decay time. The initial sampleconsists in 80% leptons from B decays (and among those 90% b → ` (direct) and 10%b → c → ` (cascade)) and of 20% leptons from charm decays or misidentification. The
events b → c → ` give the wrong tag for the B0s meson at decay time.
To reconstruct a B decay proper time, algorithms have been developed which aim atidentifying charged (neutral) tracks which are more likely to come from the B0
s decays.As result, in more than 50% of the cases, the error on the decay length is σL ∼ 250µmand the relative error on the B energy is better than 10%, resulting in an error on theproper time of the order of 0.25 ps in the first pico-second.
A second crucial point for this analysis consists in trying to increase the B0s purity of
the sample (the natural B0s purity of b events is around 10%) and to reduce the contri-
bution from cascade decays. To enrich the sample in direct b semileptonic decays and,among those, in events coming from B0
s decays, several variables have been used as themomentum and transverse momentum of the lepton, the impact parameters of all tracksin the opposite hemisphere relative to the main event vertex, the kaons in primary andsecondary vertices in the same hemisphere, and the charge of the secondary vertex.
The result of this procedure is to increase the B0s purity by 30% and to reach more
than 90% purity for the tagging at the decay time.
D±s `∓/combined tag analysis
The use of events in which a reconstructed Ds is accompanied by a high pt lepton withan electric charge opposite in sign allows to select a sample having 60% Bs purity. The
5

proper time resolution benefits also from the fact that the only missing particle is the
neutrino: B0s → D+
s e−νe. In the first pico-second the time resolution is about 0.18 ps inmore than 80% of the events.
The limiting factor is the available statistics because accessible Ds branching fractionsare quite small (between ∼ 1% and ∼ 5%). Several decay modes have to be selected.Figure 3 shows an example in which six hadronic and two semileptonic decay modes havebeen reconstructed.
0
20
40
60
80
100
120
140
160
1.8 2 2.2M(Ds)(GeV/c2)
Eve
nts/
(15
MeV
/c2 )
M(KK)(GeV/c2)
Eve
nts/
(2 M
eV/c2 )
0
5
10
15
20
25
30
1 1.02 1.04 1.06
Figure 3: DELPHI D±s `∓ candidates. The figure on the left shows the Ds mass
spectrum reconstructed from the following decay modes: D+s → φπ+, φπ+π0, φπ+π−π+,
K∗0
K+,K∗0
K+ and K0SK
+. The figure on the right shows the φ mass spectrum from thedecays D+
s → φe+νe and φµ+νµ. The sum of the two samples gives 230 ± 18 B0s candidates.
Exclusive B0s/combined tag analysis
At the 1998 Moriond Conference, the DELPHI Collaboration has proposed the use ofexclusively reconstructed B0
s decays for ∆ms analyses. These events have an excellentproper time resolution σt ∼ 0.08 ps and provide a gain in sensitivity at high valuesof ∆ms (equation 3). Figure 4 shows the B0
s mass spectrum using the decay modes:B0
s → Dsπ(or a1) and B0s → D0Kπ(or a1). The Ds has been reconstructed in six hadronic
decay modes, as in the D±s `∓ analysis, and the D0 is observed using Kπ and Kπππ decay
modes. 17 ± 8 events have been reconstructed in the B0s mass region. The combinatorial
background is estimated to be 35%.
Summary of ∆ms analyses
The combined result of LEP/SLD/CDF [1] analyses is shown in Figure 5 and is:
∆ms > 12.4 ps−1 at 95% C.L.
The sensitivity is at 13.8 ps−1. LEP alone has a limit at 11.5 ps−1 at 95% C.L., with asensitivity at 12.9 ps−1. ∆ms = 0 is excluded between 14.5 ps−1 and 16.5 ps−1 with a 2σsignificance at 15 ps−1. The present summary of the results is given in Figure 5.
6

Figure 4: The B0s mass spectrum obtained by the DELPHI Collaboration. The points with the
error bars are the data with the fit superimposed. The contributions from non-B0s decays, as
given by the Monte Carlo simulation, are also shown.
-1
-0.5
0
0.5
1
1.5
2
2.5
3
0 2 4 6 8 10 12 14 16 18 20
∆ms (ps-1)
Am
plitu
de
data ± 1 σ 95% CL limit 12.4 ps-1
1.645 σ sensitivity 13.8 ps-1
data ± 1.645 σdata ± 1.645 σ (stat only)
World average (prel.)
amplitude at ∆ms = 10.0ps-1
amplitude(sensitivity)10.6 ps-1
5.1 ps-1
10.4 ps-1
4.8 ps-1
4.2 ps-1
13.8 ps-1World average 0.21±0.35
SLD 0.66±1.13OPAL 3.14±1.60
DELPHI -0.07±0.58CDF -0.74±1.12
ALEPH 0.28±0.53
-3 -2 -1 0 1 2 3 4 5
Figure 5: The plot on the left shows the combined ∆ms results from LEP/SLD/CDF analysesshown in an amplitude versus ∆ms plot. The point with error bars are the data; the lines showthe 95% C.L. curves (in dark the systematics have been included). The dotted curve shows thesensitivity. The plot on the right shows the summary of the ∆ms results per experiment. Theerror are given at ∆ms = 10 ps−1 (the sensitivity is also given). The way in which the combinedvalue is obtained is described in [1].
7

|Vub|/|Vcb| measurement
The presence of leptons above the kinematical limit for those produced in the decayB → D`ν` (b → c transition proportional to the |Vcb| CKM matrix element) is attributedto the transition b → u`ν` (proportional to the |Vub| CKM matrix element).
The CLEO and ARGUS Collaborations have been pioneers in this measurement. Nev-ertheless, as only a small fraction of the energy spectrum of these leptons is measurable,the systematic uncertainties in the modelling of the b → u transition to evaluate theratio |Vub|/|Vcb| are quite large (of the order of 20%-25% relative error). Recently LEPexperiments have shown their capabilities of measuring |Vub| with a statistical precisionsimilar to the one from CLEO and with reduced systematic uncertainties. They use sev-eral kinematical variables, in events with an identified high transverse momentum lepton,which have a distinctive power to discriminate between b → c and b → u transitions.The first measurement has been performed by the ALEPH Collaboration by means of aneural network discriminating method.
The DELPHI measurement is simpler. With respect to the ALEPH analysis theinformation from the presence of a secondary vertex from the D decay is used. Inb → u transitions, all tracks are coming from the B decay vertex. The presence ofkaons at the D meson vertex is also used. The method is based on the fact that thehadronic system recoiling against the lepton in b → u`ν decays is expected to havean invariant mass lower than the charm mass [2]. The sample is finally divided into ab → u enriched and a b → u depleted components and the energy of the lepton in the Brest frame is calculated. The result is shown in Figure 6 together with the summary ofthe results on |Vub|.
-40
-20
0
20
40
60
80
0 0.5 1 1.5 2 2.5 3
E* Lepton (GeV)
Dat
a -
Bac
kgro
und
MC
E* Lepton (GeV)
Dat
a -
Bac
kgro
und
MC
-40
-20
0
20
40
60
80
0 0.5 1 1.5 2 2.5 3Vub×103
World average 3.56±0.56
L3 inclusif 6.00±1.84±0.60
DELPHI inclusif 4.08±0.83±0.35
ALEPH inclusif 4.16±0.95±0.31
CLEO vector 3.20±0.39±0.60
CLEO exclusif 3.30±0.40±0.70
CLEO end-point 3.10±0.36±0.80
0 1 2 3 4 5 6 7 8 9 10
Figure 6: The plots on the left show the energy of the lepton in the B rest frame after thebackground subtraction for the b → u enriched and b → u depleted samples. On the right thesummary of |Vub| results is given.
8

Status of the VVCM matrix
Table 2: The four constraints which allow, at present, to define the accessible region for theρ and η parameters are listed in the first column. In the second column the dependence ofthese constraints relative to the different parameters is given. The last column gives the explicitdependence in terms of ρ and η.
Measurement VCKM× other Constraintb → u/ b → c (|Vub|/|Vcb|)2 ρ2 + η2
∆md |Vtd|2f2BdBBd
f(mt) (1 - ρ)2 + η2
∆md/∆ms
∣∣∣Vtd
Vts
∣∣∣2 f2BdBBd
f2BdBBs
(1 - ρ)2 + η2
εK f(A, η, ρ, BK) ∼ η(1− ρ)
The VCKM matrix can be parametrized in terms of four parameters: λ, A, ρ and η(the Wolfenstein parametrization [3]). The Standard Model predicts relations between thedifferent processes which depend on these parameters. The unitarity of the VCKM matrixcan be visualized as a triangle in the ρ−η plane. Several quantities which depend on ρ andη have to be measured and, if Standard Model is correct, they must define compatiblevalues for the two parameters inside measurement errors and theoretical uncertainties.The measurement of b → u/ b → c transitions gives a constraint of the form ρ2 + η2.2
The measurement of ∆md gives a constraint of the form (1 - ρ)2 + η2. A measurement ofthe ratio ∆md/∆ms gives the same type of constraint in the ρ−η plane, as a measurementof ∆md, but this ratio is expected to have smaller theoretical uncertainties since the ratiof2Bs
BBs/f2BdBBd
is better known than the absolute value f2BdBBd
.All details of the analysis presented here can be found in [4]. Using the available and
most recent measurements and up to date theoretical calculations [4] the allowed regionin the ρ− η plane can be determined. It is shown in Figure 7 and corresponds to:
ρ = 0.189± 0.074 ; η = 0.354± 0.045
It is of interest to determine the central values and the uncertainties on the quanti-ties sin 2α, sin 2β and γ which will be directly measured at future B-factories or LHCexperiments. The result is shown in Figure 8 and is:
sin2β = 0.73± 0.08 ; sin2α = −0.15± 0.30 ; γ = (62± 10)0 (5)
The value of sin 2β is rather precisely determined with an accuracy already at thelevel expected after the first years of running at B factories. Finally it is possible toremove from the calculation the information of one of the constraint and to obtain itsprobability density function. The result for ∆ms and |Vub|/|Vcb| is shown in Figure 9 andsummarized in Table 3.
2ρ(η) = ρ(η)(1 − λ2/2)
9

0
0.2
0.4
0.6
0.8
1
-1 -0.8 -0.6 -0.4 -0.2 0 0.2 0.4 0.6 0.8 1
Figure 7: The ρ − η allowed region. The contours at 68% and 95% C.L. are shown. Thecontinous lines correspond to the constraints obtained from the measurements of |Vub|
|Vcb| ,∆md,
and εK . The dotted curve corresponds to the 95% C.L. limit obtained from the experimentallimit on ∆ms.
0
1
2
3
4
5
0 0.2 0.4 0.6 0.8 10
0.2
0.4
0.6
0.8
1
1.2
1.4
-1 -0.5 0 0.5 1
Figure 8: The sin 2β and sin 2α probability density distributions. The dark-shaded and theclear shaded intervals correspond to 68% and 95% C.L. regions respectively.
10
0
0.02
0.04
0.06
0.08
0.1
0 5 10 15 20 25 30 35 40 0
5
10
15
0 0.05 0.1 0.15 0.2 0.25 0.3
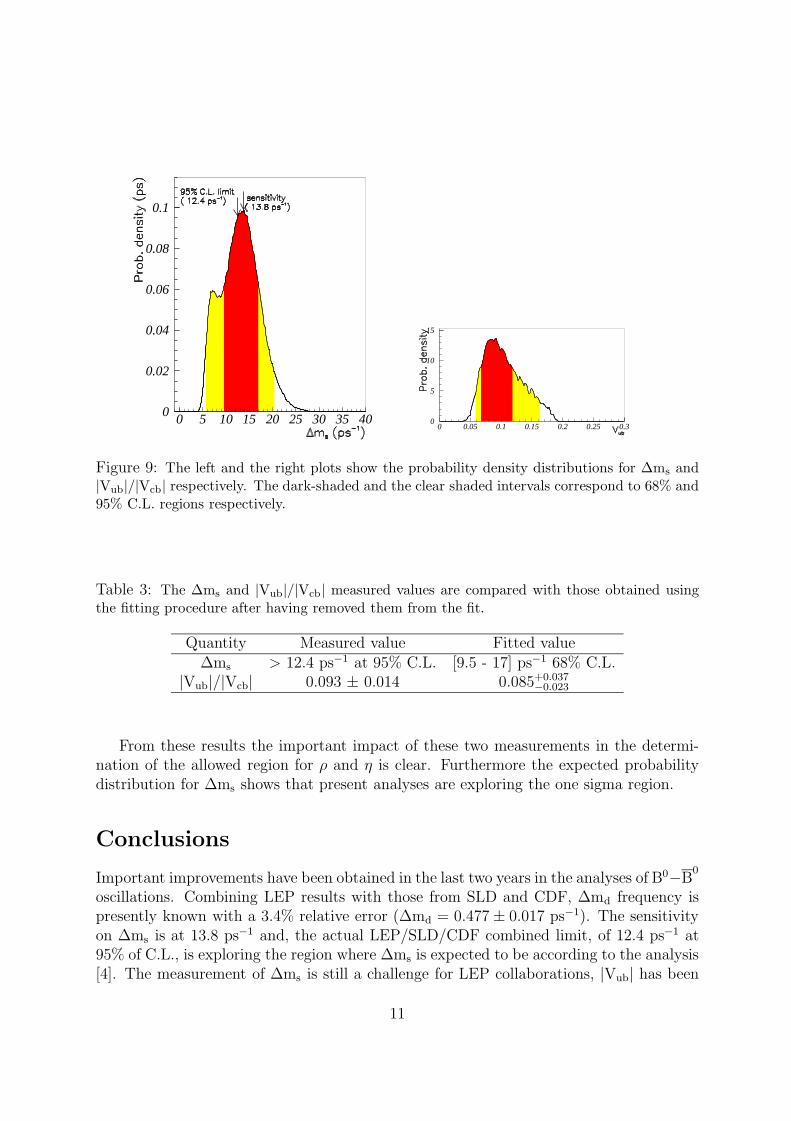
Figure 9: The left and the right plots show the probability density distributions for ∆ms and|Vub|/|Vcb| respectively. The dark-shaded and the clear shaded intervals correspond to 68% and95% C.L. regions respectively.
Table 3: The ∆ms and |Vub|/|Vcb| measured values are compared with those obtained usingthe fitting procedure after having removed them from the fit.
Quantity Measured value Fitted value∆ms > 12.4 ps−1 at 95% C.L. [9.5 - 17] ps−1 68% C.L.
|Vub|/|Vcb| 0.093 ± 0.014 0.085+0.037−0.023
From these results the important impact of these two measurements in the determi-nation of the allowed region for ρ and η is clear. Furthermore the expected probabilitydistribution for ∆ms shows that present analyses are exploring the one sigma region.
Conclusions
Important improvements have been obtained in the last two years in the analyses of B0−B0
oscillations. Combining LEP results with those from SLD and CDF, ∆md frequency ispresently known with a 3.4% relative error (∆md = 0.477± 0.017 ps−1). The sensitivityon ∆ms is at 13.8 ps−1 and, the actual LEP/SLD/CDF combined limit, of 12.4 ps−1 at95% of C.L., is exploring the region where ∆ms is expected to be according to the analysis[4]. The measurement of ∆ms is still a challenge for LEP collaborations, |Vub| has been
11

measured at LEP with about the same experimental precision as the one obtained byCLEO and with a reduced dependence on theoretical models.
The phenomenological analysis presented in this paper gives:
ρ = 0.189± 0.074 ; η = 0.354± 0.045
and, in an indirect way:
sin2β = 0.73± 0.08 ; sin2α = −0.15± 0.30 ; γ = (62± 10)0
The situation will still be improved, at least until the next summer ’99, before the startingof B-factories.
Acknowledgement
I would like to thank the organisers of HQ98 for the warm and nice atmosphere duringthe conference and for the unforgettable banquet at the Shedd Aquarium. Many thanksto Fabrizio Parodi and Patrick Roudeau for their help in the preparation and redactionof this contribution. Finally a grand merci to Jocelyne Brosselard, kind and efficient asusual in the preparation of this manuscript.
References
[1] The LEP B Oscillation Working Group “Combined Results on B0 Oscillations: up-date for the summer 1998 Conferences” LEPBOSC 98/2
[2] Barger, V., Kim, C.S., and Phillips, R.J.N. Phys. Lett. B251 (1990) 629Falk, A.F., Ligeti, Z., and Wise, M.B. CALT-68-2110, hep/9705235Bigi, I., Dikeman, R.D. and Uraltsev, N. TPI-MINN-97/21-T, hep-ph/9706250
[3] Wolfenstein, L. Phys. Rev. Lett. 51 (1983) 1945
[4] Paganini P., Parodi, F., Roudeau, P., and Stocchi, A., LAL (97-79), hep-ph/9711261 submitted to Physica ScriptaParodi, F., Roudeau, P. and Stocchi, A. LAL 98-49, hep-ph/9802289Parodi, F., Roudeau, P. and Stocchi, A. paper 586 contributed to the ICHEP98Conference (Vancouver 23th-29th July 1998)
12