Embed Size (px)
Citation preview
Regulation and Standards in the Energy Sector and their Effect on Solar Deployment Version 2
December 2011
Matt Croucher, Alex Hill, and Tim James
L. William Seidman Research Institute
W. P. Carey School of Business
Arizona State University
This paper is part of the Az Smart Research Program. Further details can be found at
www.azsmart.org.
Az SMART is sponsored by Arizona Public Service Company, BrightSource Energy, Inc.,
Create-a-Soft, Salt River Project, Science Foundation Arizona, Tucson Electric Power, and Viasol
Energy Solutions under grant number SRG STI 0407-08.
Seidman Research Institute, W. P. Carey School of Business Page i
Arizona’s Solar Market Analysis and Research Tool (Az SMART)
Arizona’s Solar Market Analysis and Research Tool (Az SMART) is a breakthrough analysis
environment that will enable stakeholders to examine the complex interaction of economic,
security, environmental, and technological issues that impact Arizona’s ability to become a
global leader in solar power innovation, development and deployment. Multi-disciplinary
research efforts and capabilities at Arizona State University and the University of Arizona are
being utilized in close collaboration with partners from industry and government in the
creation and use of Az SMART.
The goal of the three-year project is to develop a unique analysis tool, tailored to the
examination of a successful roll-out of large-scale solar energy infrastructure in Arizona, and
the required electric grid technologies to enable that infrastructure.
The principal outputs of the project are solar technical feasibility research, a Solar Scorecard for
Arizona, and ultimately, the analytical tool that integrates them into a decision support
framework. The end product will be accessible by remote web access (www.azsmart.org), as well
as at the Decision Theater, a dynamic, immersive visualization environment facility at Arizona
State University.
Seidman Research Institute, W. P. Carey School of Business Page ii
Arizona’s Solar Scorecard
Researchers at the L. William Seidman Research Institute of the W. P. Carey School of Business at
Arizona State University are developing Arizona’s Solar Scorecard. The Solar Scorecard comprises
metrics drawn from energy usage forecasts, environmental valuation analyses, economic development
analyses, and energy security evaluations. It is assembled from a series of whitepapers which provide the
research and analysis to translate commercial and public policy choices into measures of economic,
environmental, social and energy security impact on Arizona. These papers will be completed over a
three year span, with the first year largely concentrated on utility-scale power generation. The second
and third years concentrate on distributed generation and transportation. The completed and currently
planned 14 whitepapers are as follows:
1. Energy Sector Technology;
2. The Market-Determined Cost of Inputs to Utility-Scale Electricity Generation;
3. Incentives and Taxation;
4. Regulations and Standards in the Energy Sector and their Effect on Solar Promotion;
5. AZ Energy Demand Analysis;
6. Present and Future Cost of New Utility-Scale Electricity Generation;
7. Energy Usage/ Supply Forecasts;
8. Emissions/Pollution Analysis;
9. Solar Export Potential;
10. Environmental Valuation Analysis;
11. Solar Inter-State Competition;
12. Economic Development Analysis;
13. Energy Security Issues;
14. The Determinants of the Financial Return from Residential Photovoltaic Systems.
Seidman Research Institute, W. P. Carey School of Business Page iii
About This Paper
This white paper is the 4th paper of a series of 14 white papers that make up the Solar Scorecard. The goal
of the paper is to inform the reader about mechanisms that encourage a reduction in carbon emissions
through government intervention and, directly or indirectly, promote the use of renewable resources such
as solar. The paper separates the mechanisms used by governments into two categories: direct (Cap-and-
Trade and Carbon Tax) and indirect (Renewable Portfolio Standard, Energy Efficiency, and Loading
Order). In addition, governments use subsidies to encourage a reduction in carbon emissions. An
analysis on subsidies is available in the 3rd paper of this series: Taxes and Incentives.
This paper will develop over time and contribute to future papers in the Az SMART project. The first
version focuses on the impact of government intervention on electricity generation in the state. In later
versions, the paper will focus on the impact of regulations and standards on transportation.
Seidman Research Institute, W. P. Carey School of Business Page iv
Executive Summary
The U.S. utility sector currently generates electricity at a price that does not reflect its social cost,
which includes the negative externality of greenhouse gas (GHG) emissions.1 To improve social
welfare outcomes, the government could intervene in the market. Government intervention
could influence utilities to invest in generation technologies that reduce GHG emissions and
decrease consumption of electricity to the socially optimal level.2 Reaching the socially optimal
level requires individuals and firms to internalize the cost of GHG emissions. Governments
have the ability to enforce, or move closer to, the socially optimal level of electricity production
and consumption by intervening in the electricity market directly, through regulation, or
indirectly, through carbon pricing and subsidies.
Government Mandated Indirect Mechanisms
Indirect government intervention in the electricity generation sector adjusts the cost of
generating electricity to encourage utilities and other power producers to adopt alternative
carbon-reduced technologies. The increased cost decreases GHG emissions by shifting
generation technology and lowering electricity consumption. The two indirect government
mechanisms used to reduce GHG emissions from the electricity sector are a Pigouvian tax and a
cap-and-trade system.
The most important step in implementing a Pigouvian tax on carbon is for lawmakers to set the
correct tax level. If the tax is too low, it will not change the behavior of utilities sufficiently to
induce a significant decrease in carbon emissions. If the tax is set too high, it will discourage
potential technology solutions from being adopted and increase electricity prices higher than
necessary. After the level is set, the tax is applied to any generation technology that emits
1 There is a significant debate within the literature in determining what the value of the externality is. This will be examined in future papers.
2 The social optimum of generation is dependent upon the external costs associated with GHG emissions. Since there is some debate surrounding the valuation of the external cost, there is some debate about what the social optimum is (much of this will be discussed in a future paper). However, while the social optimum is debatable, there is a consensus about the impact that policies that take these external costs into account have on electricity generation.
Seidman Research Institute, W. P. Carey School of Business Page v
carbon dioxide. At this point, the tax functions as a price on carbon, increasing the cost of
carbon-emitting generation technologies.
Cap-and-trade systems place a price on carbon by setting a limit (“cap”) on the quantity of
carbon dioxide emissions allowed by electricity generating firms. Once the limit has been
determined, allowances to emit carbon are distributed via some mechanism. The most
important criteria in the design of a successful cap-and-trade system are the total amount and
distribution method of allowances (by quota or auction), and whether to regulate the emissions
upstream, midstream, or downstream.
All else being constant, the competitiveness of electricity generating technologies that rely on
fossil fuels without any use of novel technologies, like carbon capture and storage (CCS), would
be impacted most by a carbon pricing mechanism. In other words, an explicit carbon price
would raise the cost of fossil fuels like coal and natural gas, while lowering the relative cost of
all resources that emit less or no carbon (or are carbon neutral). Among the former, coal-fired
power plants might see their production costs rise further relative to their natural gas-fired
counterparts. The latter group (resources that emit little to no carbon) includes coal and natural
gas with carbon capture and storage (CCS) equipment, nuclear and all renewable sources.3
However, it is important to note that depending on the actual regulatory mechanism (and the
effective carbon price level) and characteristics of the regional power market, coal and natural
gas-fueled power generation technologies might remain competitive (vis-à-vis renewables) even
after a carbon pricing mechanism is put in place.
The impact of carbon pricing on solar energy is not easily quantified. On one hand, carbon
pricing would level the playing field by better reflecting the true cost fossil fuel-based
generation and make renewable resources, like solar, more competitive. On the other hand,
without any direct regulatory requirement for solar, the share of solar power, relative to nuclear
and technologies with CCS equipment, would change very little. Therefore, regulation
3 Referring to GHG emissions from power generation only -- not lifecycle emissions from mining, refining and transport of fuels, and other upstream sources of emissions that might be attributable to all generation technologies, renewable or not.
Seidman Research Institute, W. P. Carey School of Business Page vi
(additional to a carbon pricing mechanism) that specifically targets solar energy might be
necessary to accelerate solar adoption in markets such as Arizona.
Government Mandated Direct Mechanisms
Government-mandated direct mechanisms enforce a particular solution or set of solutions on
the electricity generation sector. Renewable energy requirements, energy efficiency programs,
and loading order all promote particular technologies over other solutions that the market may
choose without direct intervention. As a result, such measures may be more successful in
promoting solar power than a carbon pricing mechanism, because they prevent carbon-limited
alternatives, such as nuclear, natural gas, and clean coal, from competing with solar.
Renewable portfolio standards (RPS) require regulated utilities to generate a certain amount of
their total electricity generation from renewable resources. The standard method of
measurement is a percentage of electricity retail sales (ERS) generated by renewable resources
by a target year. The state of Arizona provides rates of generation required each year to prevent
utilities from ramping up renewable generation in the final year and creating regulatory and
production complications. An alternative method of measurement in use is a required amount
of renewable capacity available by a certain date.
Energy efficiency programs are government-mandated methods for improving the energy
efficiency of buildings and electrical appliances, leading to a reduction in electricity demand. In
the United States, more than twenty states had programs that either require a certain percentage
of electricity supply to be reduced through energy efficiency measures, or allow such measures
to qualify as an eligible resource for its RPS (as of September 2011). The ability of energy
efficiency gains to offset state RPS requirements is important for states with limited low-cost
renewable resources. Although market intervention often leads to inefficiency, energy
efficiency programs are the exception because there are cost-effective improvements available.
One of the reasons significant energy efficiency gains are available is because electricity
consumers, who have the greatest incentive to buy energy efficient devices, do not make the
efficient choice, largely due to information deficiency (U.S. DOE Energy Efficiency and
Renewable Energy, 2010).
Seidman Research Institute, W. P. Carey School of Business Page vii
Loading order is a method of regulation that seeks to meet increasing electricity demand with a
pre-determined set of preferred resources. In the California loading order system, energy
efficiency, demand response, renewable resources, and distributed generation are given
preference over other resources for meeting increases in future electricity demand. The other
resources would include nuclear as well as coal, natural gas, and petroleum with or without
carbon emission reducing technology. By making this distinction, California regulators are
signaling their preference for renewable resources and reducing electricity demand as tools for
mitigating carbon emissions over nuclear and clean coal and natural gas.
Seidman Research Institute, W. P. Carey School of Business Page viii
Table of Contents
ARIZONA’S SOLAR MARKET ANALYSIS AND RESEARCH TOOL (AZ SMART) ................................ I
ARIZONA’S SOLAR SCORECARD ..................................................................................................................... II
ABOUT THIS PAPER ............................................................................................................................................. III
EXECUTIVE SUMMARY ....................................................................................................................................... IV
LIST OF FIGURES ..................................................................................................................................................... X
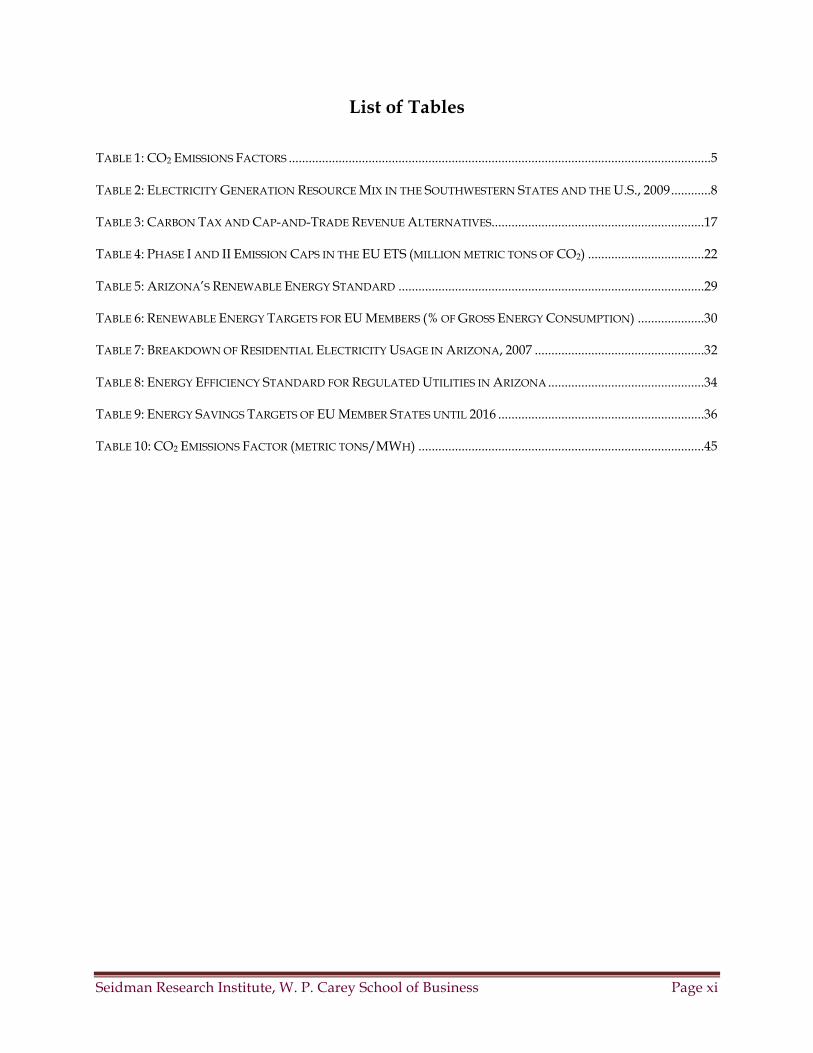
LIST OF TABLES ..................................................................................................................................................... XI
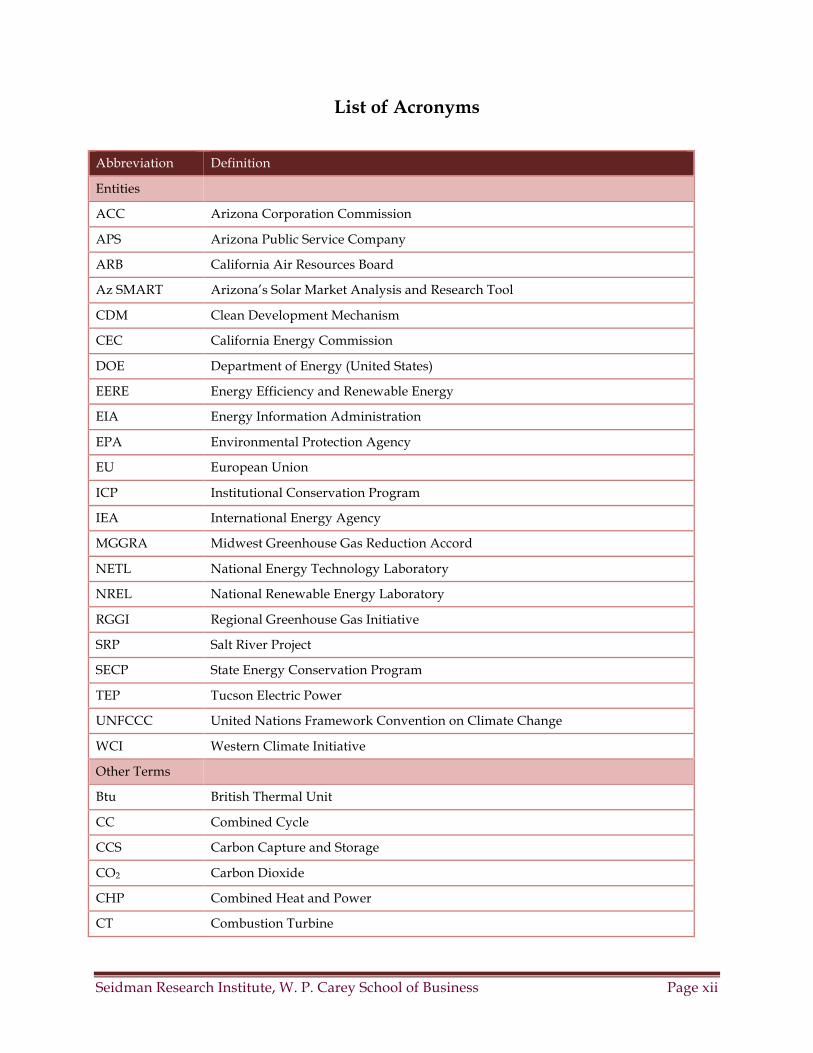
LIST OF ACRONYMS ........................................................................................................................................... XII
1 INTRODUCTION ...............................................................................................................................................1
2 GOVERNMENT MANDATED INDIRECT MECHANISMS ....................................................................2
2.1 CARBON PRICE ................................................................................................................................................2
2.1.1 Impact on Existing Power Generation .....................................................................................................7
2.1.2 Global Carbon Prices ................................................................................................................................9
2.1.3 Impact on Solar Power .............................................................................................................................9
2.2 PIGOUVIAN TAX ON CARBON .......................................................................................................................10
2.2.1 Global Adoption ......................................................................................................................................11
2.3 CAP-AND-TRADE ..........................................................................................................................................14
2.3.1 Offsets .....................................................................................................................................................16
2.3.2 Carbon Price Revenue Alternatives .......................................................................................................17
2.3.3 Global Adoption ......................................................................................................................................19
3 GOVERNMENT-MANDATED DIRECT MECHANISMS ......................................................................23
3.1 RENEWABLE ENERGY REQUIREMENTS .........................................................................................................24
3.1.1 Impact on Solar Power ...........................................................................................................................27
3.1.2 Global Adoption ......................................................................................................................................27
3.2 ENERGY EFFICIENCY ......................................................................................................................................31
3.2.1 Impact on Solar Power ...........................................................................................................................33
3.2.2 Global Adoption ......................................................................................................................................34
3.3 LOADING ORDER ...........................................................................................................................................37
3.3.1 Impact on Solar Power ...........................................................................................................................38
3.3.2 Global Adoption ......................................................................................................................................39
4 CONCLUSION ..................................................................................................................................................39

Seidman Research Institute, W. P. Carey School of Business Page ix
GLOSSARY ................................................................................................................................................................42
APPENDIX 1: CARBON DIOXIDE EMISSION FACTORS OF GENERATION TECHNOLOGIES ......45
APPENDIX 2: STATE ELECTRICITY GENERATION RESOURCE MIX (2009) .........................................48
APPENDIX 3: STATE RENEWABLE PORTFOLIO STANDARDS AND GOALS .....................................50
BIBLIOGRAPHY.......................................................................................................................................................51
Seidman Research Institute, W. P. Carey School of Business Page x
List of Figures
FIGURE 1: SHARE OF NET ELECTRICITY GENERATION BY FUEL TYPE, 2009 ................................................................3
FIGURE 2: RELATIVE IMPACT OF CARBON PRICING ON LEVELIZED COSTS OF NEW ENTRANT TECHNOLOGIES .......7
FIGURE 3: RENEWABLE RESOURCE AVAILABILITY IN ARIZONA ................................................................................10
FIGURE 4: SHARE OF U.S. RENEWABLE ELECTRICITY GENERATION, 1990 – 2009 ....................................................25
FIGURE 5: ELECTRICITY GENERATION RESOURCE MIX FOR CALIFORNIA AND ARIZONA, 2009 ...............................38
Seidman Research Institute, W. P. Carey School of Business Page xi
List of Tables
TABLE 1: CO2 EMISSIONS FACTORS ...............................................................................................................................5
TABLE 2: ELECTRICITY GENERATION RESOURCE MIX IN THE SOUTHWESTERN STATES AND THE U.S., 2009 ............8
TABLE 3: CARBON TAX AND CAP-AND-TRADE REVENUE ALTERNATIVES ................................................................17
TABLE 4: PHASE I AND II EMISSION CAPS IN THE EU ETS (MILLION METRIC TONS OF CO2) ...................................22
TABLE 5: ARIZONA’S RENEWABLE ENERGY STANDARD ............................................................................................29
TABLE 6: RENEWABLE ENERGY TARGETS FOR EU MEMBERS (% OF GROSS ENERGY CONSUMPTION) ....................30
TABLE 7: BREAKDOWN OF RESIDENTIAL ELECTRICITY USAGE IN ARIZONA, 2007 ...................................................32
TABLE 8: ENERGY EFFICIENCY STANDARD FOR REGULATED UTILITIES IN ARIZONA ...............................................34
TABLE 9: ENERGY SAVINGS TARGETS OF EU MEMBER STATES UNTIL 2016 ..............................................................36
TABLE 10: CO2 EMISSIONS FACTOR (METRIC TONS/MWH) ......................................................................................45
Seidman Research Institute, W. P. Carey School of Business Page xii
List of Acronyms
Abbreviation Definition
Entities
ACC Arizona Corporation Commission
APS Arizona Public Service Company
ARB California Air Resources Board
Az SMART Arizona’s Solar Market Analysis and Research Tool
CDM Clean Development Mechanism
CEC California Energy Commission
DOE Department of Energy (United States)
EERE Energy Efficiency and Renewable Energy
EIA Energy Information Administration
EPA Environmental Protection Agency
EU European Union
ICP Institutional Conservation Program
IEA International Energy Agency
MGGRA Midwest Greenhouse Gas Reduction Accord
NETL National Energy Technology Laboratory
NREL National Renewable Energy Laboratory
RGGI Regional Greenhouse Gas Initiative
SRP Salt River Project
SECP State Energy Conservation Program
TEP Tucson Electric Power
UNFCCC United Nations Framework Convention on Climate Change
WCI Western Climate Initiative
Other Terms
Btu British Thermal Unit
CC Combined Cycle
CCS Carbon Capture and Storage
CO2 Carbon Dioxide
CHP Combined Heat and Power
CT Combustion Turbine
Seidman Research Institute, W. P. Carey School of Business Page xiii
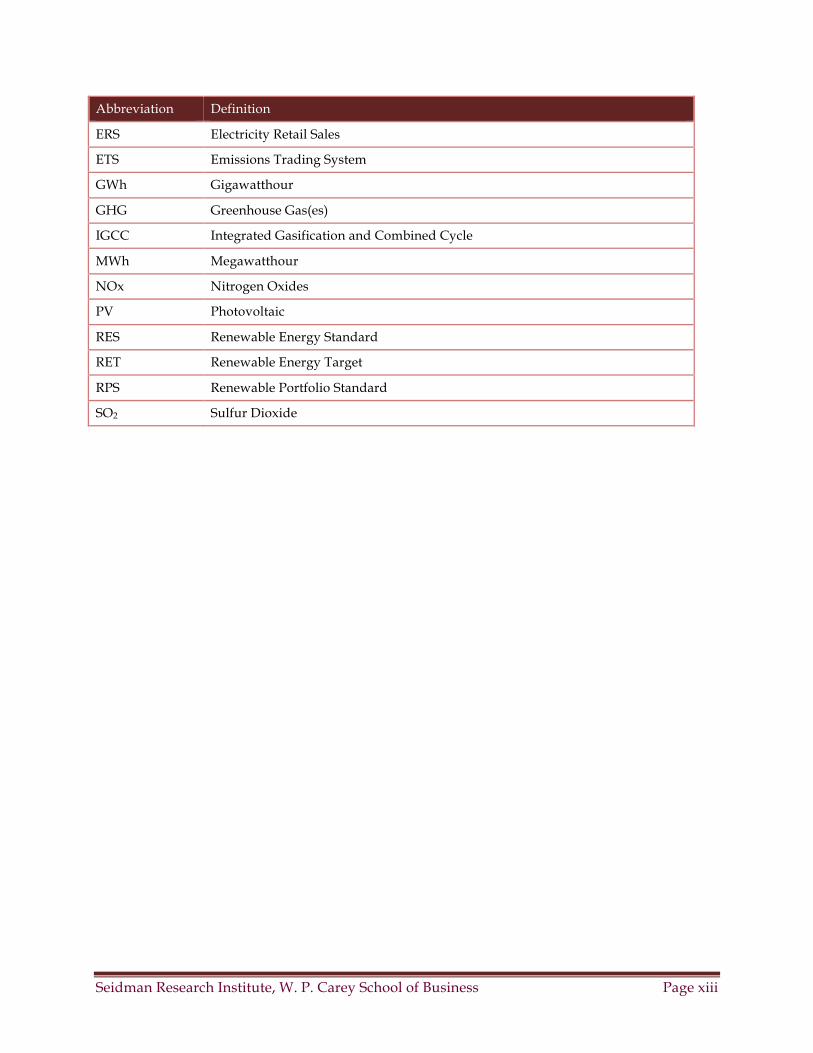
Abbreviation Definition
ERS Electricity Retail Sales
ETS Emissions Trading System
GWh Gigawatthour
GHG Greenhouse Gas(es)
IGCC Integrated Gasification and Combined Cycle
MWh Megawatthour
NOx Nitrogen Oxides
PV Photovoltaic
RES Renewable Energy Standard
RET Renewable Energy Target
RPS Renewable Portfolio Standard
SO2 Sulfur Dioxide
Seidman Research Institute, W. P. Carey School of Business Page 1
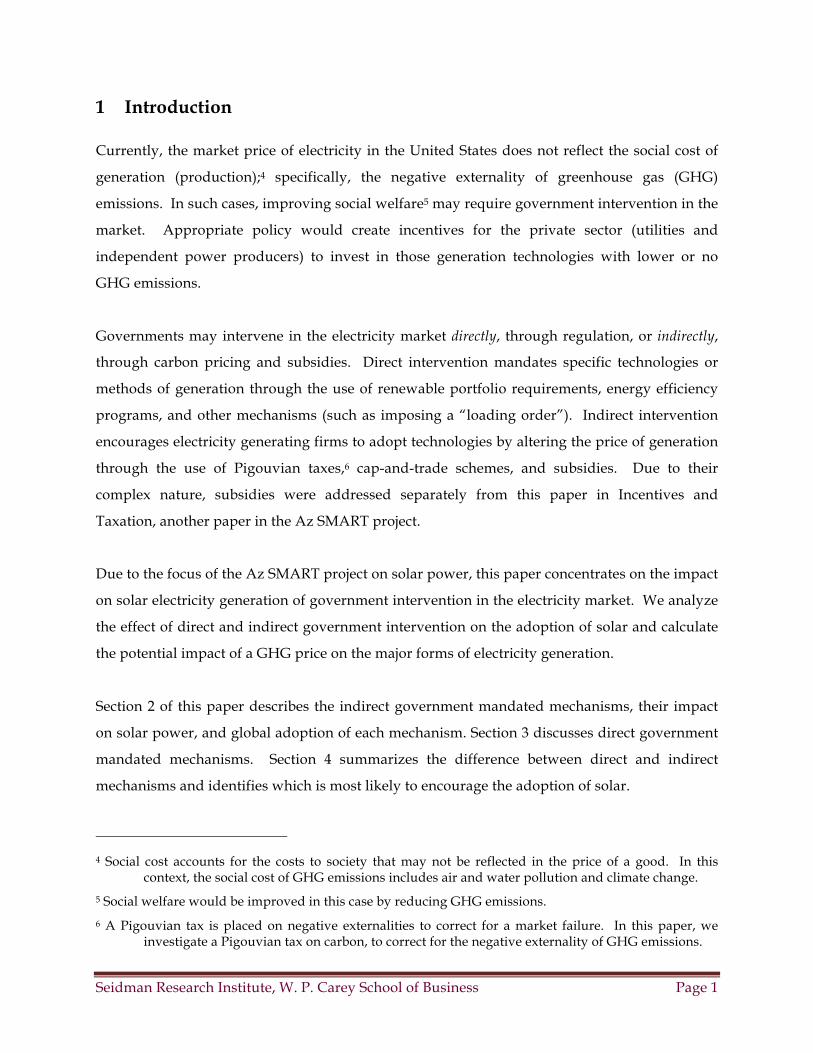
1 Introduction
Currently, the market price of electricity in the United States does not reflect the social cost of
generation (production);4 specifically, the negative externality of greenhouse gas (GHG)
emissions. In such cases, improving social welfare5 may require government intervention in the
market. Appropriate policy would create incentives for the private sector (utilities and
independent power producers) to invest in those generation technologies with lower or no
GHG emissions.
Governments may intervene in the electricity market directly, through regulation, or indirectly,
through carbon pricing and subsidies. Direct intervention mandates specific technologies or
methods of generation through the use of renewable portfolio requirements, energy efficiency
programs, and other mechanisms (such as imposing a “loading order”). Indirect intervention
encourages electricity generating firms to adopt technologies by altering the price of generation
through the use of Pigouvian taxes,6 cap-and-trade schemes, and subsidies. Due to their
complex nature, subsidies were addressed separately from this paper in Incentives and
Taxation, another paper in the Az SMART project.
Due to the focus of the Az SMART project on solar power, this paper concentrates on the impact
on solar electricity generation of government intervention in the electricity market. We analyze
the effect of direct and indirect government intervention on the adoption of solar and calculate
the potential impact of a GHG price on the major forms of electricity generation.
Section 2 of this paper describes the indirect government mandated mechanisms, their impact
on solar power, and global adoption of each mechanism. Section 3 discusses direct government
mandated mechanisms. Section 4 summarizes the difference between direct and indirect
mechanisms and identifies which is most likely to encourage the adoption of solar.
4 Social cost accounts for the costs to society that may not be reflected in the price of a good. In this context, the social cost of GHG emissions includes air and water pollution and climate change.
5 Social welfare would be improved in this case by reducing GHG emissions.
6 A Pigouvian tax is placed on negative externalities to correct for a market failure. In this paper, we investigate a Pigouvian tax on carbon, to correct for the negative externality of GHG emissions.
Seidman Research Institute, W. P. Carey School of Business Page 2
2 Government Mandated Indirect Mechanisms
Indirect government intervention in the electricity generation sector involves altering the cost of
generating electricity to encourage utilities and other power producers to adopt alternative
carbon-reduced generation technologies. These technologies are generally more expensive than
the previous generation technologies because, without intervention, electricity generating firms
choose the lowest cost form of generation. The majority of the cost increase is passed on to
electricity consumers in the form of higher electricity prices,7 which reduces electricity
consumption. The combination of lowering electricity consumption towards the socially
optimal level and increasing the importance of non-carbon emitting technologies in utilities
generation portfolio is the goal of indirect government intervention.
There are currently two indirect government mechanisms used globally to reduce GHG
emissions from the electricity sector. A Pigouvian tax increases the cost of GHG-emitting
technologies through a tax based on the level of GHGs each technology emits. A cap-and-trade
system places a cap on allowed GHG emissions, which increases the cost of GHG-emitting
technologies due to emitting entities needing to obtain a permit to emit.8 The resulting GHG
price alters the cost of technology options for electricity generating firms and reduces GHG
emissions. In the area of environmental policy, a GHG price is typically referred to as a carbon
price, so from this point forward, the term carbon price will be used.9
2.1 Carbon Price
Increasing the cost of GHG-emitting technologies decreases GHG emissions in two ways. The
first effect on GHG emissions is the result of a shift in generation technologies from GHG-
emitting technologies to technologies that do not emit GHGs.10 GHG-emitting technologies
7 The elasticity of demand for electricity is generally low.
8 Some of these costs can be offset if some (all) of the permits are distributed freely to utilities.
9 While other GHG gases also damage the environment, the size of annual carbon emissions and their impact on the environment make carbon dioxide being the most targeted GHG gas.
10 The carbon dioxide emission factors of major generation technologies are available in Appendix 1. Carbon dioxide is the most prevalent GHG, making it the focus of environmental emissions data compiled (EPA, 2010). It is important to note that these estimates are for the carbon emitted
Seidman Research Institute, W. P. Carey School of Business Page 3
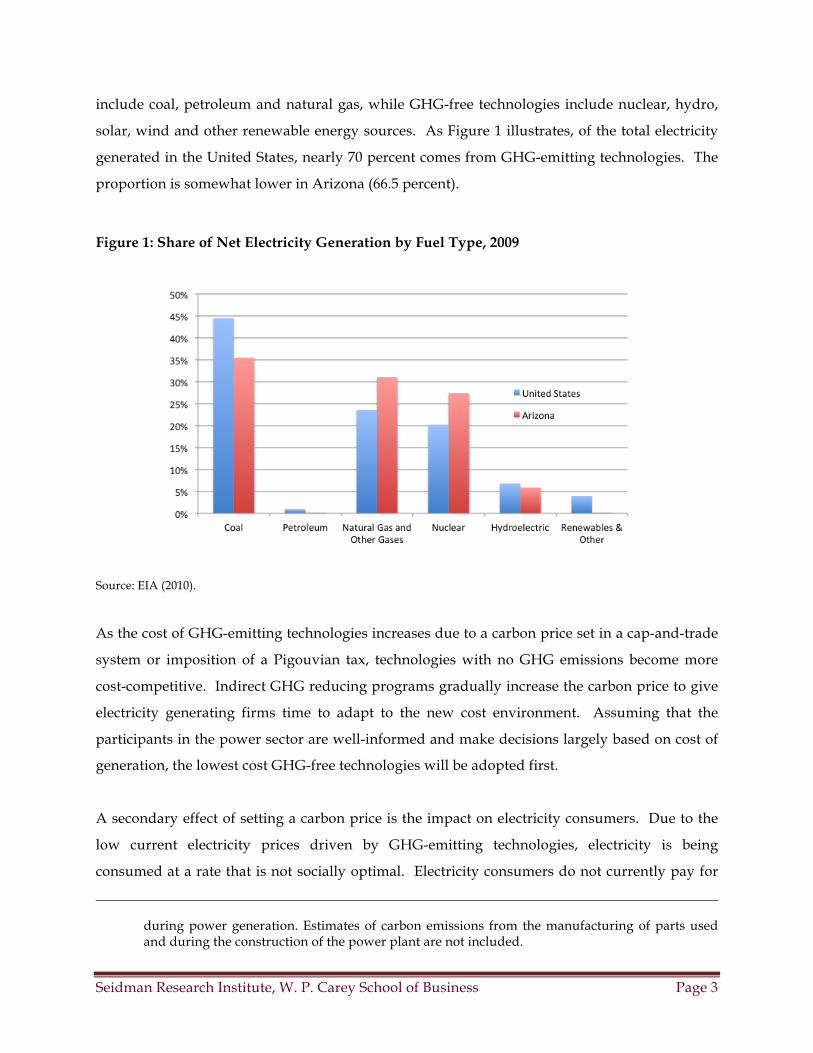
include coal, petroleum and natural gas, while GHG-free technologies include nuclear, hydro,
solar, wind and other renewable energy sources. As Figure 1 illustrates, of the total electricity
generated in the United States, nearly 70 percent comes from GHG-emitting technologies. The
proportion is somewhat lower in Arizona (66.5 percent).
Figure 1: Share of Net Electricity Generation by Fuel Type, 2009
Source: EIA (2010).
As the cost of GHG-emitting technologies increases due to a carbon price set in a cap-and-trade
system or imposition of a Pigouvian tax, technologies with no GHG emissions become more
cost-competitive. Indirect GHG reducing programs gradually increase the carbon price to give
electricity generating firms time to adapt to the new cost environment. Assuming that the
participants in the power sector are well-informed and make decisions largely based on cost of
generation, the lowest cost GHG-free technologies will be adopted first.
A secondary effect of setting a carbon price is the impact on electricity consumers. Due to the
low current electricity prices driven by GHG-emitting technologies, electricity is being
consumed at a rate that is not socially optimal. Electricity consumers do not currently pay for
during power generation. Estimates of carbon emissions from the manufacturing of parts used and during the construction of the power plant are not included.
Seidman Research Institute, W. P. Carey School of Business Page 4
the environmental impact of their electricity use, resulting in overconsumption. By
implementing a carbon pricing mechanism, electricity prices will increase and consumers will
use less electricity.11 A decrease in electricity demand reduces the generation supply necessary
to meet demand, which reduces the need for GHG-emitting technologies.
The advantage of an indirect mechanism is that it allows electricity generating firms to make
decisions on which technologies to pursue. These firms will calculate the potential carbon price,
its impact on the levelized cost of electricity for each generation technology, and what GHG-
limited technologies become cost-competitive at various levels of carbon prices. The
disadvantage of an indirect mechanism is that it does not promote technologies that are
beneficial in areas other than cost (i.e., have positive externalities). Electricity generating firms
do not make generation choices based only on cost. These firms look at energy security, the
ability of generation technologies to meet the demand profile, and the future availability of
resources when planning their generation mix. For example, if a utility is interested in
replacing its coal plants with a GHG-free generating technology, the inability of intermittent
resources, such as wind and solar, to replace a baseload technology without backup generation
is a major factor in their decision.
However, all else being the same, the levelized cost of a generating technology is the most
important investment criteria. Three factors determine the levelized cost impact on each
generating technology: carbon content of the fuel, the heat rate of conversion (power
generation) technology, and the carbon price. The most important of these is the carbon
content of the fuel source.12 Power plants in the United States use three carbon-emitting (a.k.a.
“fossil”) fuels: coal, natural gas and petroleum.13 Carbon dioxide emissions from the
11 It is important to note that each individual electricity consumer will be impacted differently by a GHG
price. For example, electricity intensive industries will be impacted more by this policy than industries that do not use large amounts of electricity. In the residential case, an increase in electricity prices influences the decisions of individual with less disposable income compared to those with more.
12 The EIA reports the carbon content of each generation fuel (pre-combustion). However, emissions are post-combustion and therefore are typically reported in terms of carbon dioxide emitted (EIA, 2010).
13 Petroleum-fired power plants use various petroleum products, including: distillate fuel oil, petroleum liquids and petroleum coke. The carbon content calculated for petroleum assumed a mix of 65% petroleum coke, 25% petroleum liquids and 10% distillate fuel oil (EIA, 2010).
Seidman Research Institute, W. P. Carey School of Business Page 5
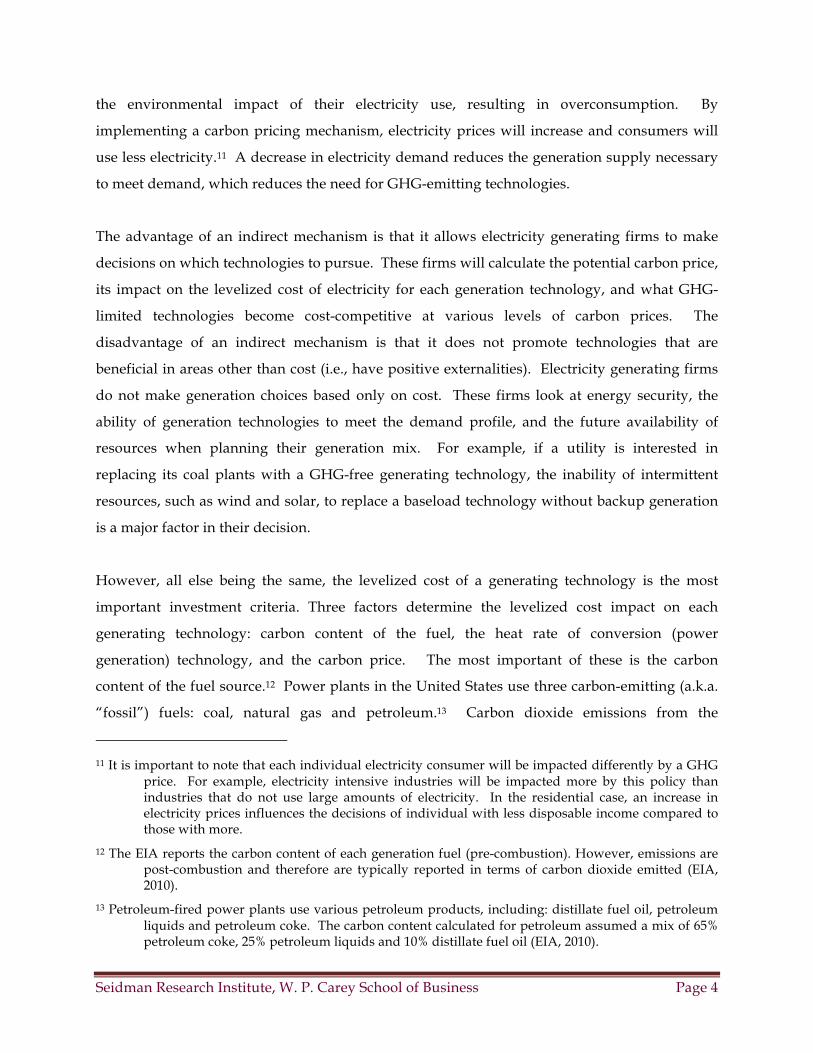
combustion of these fossil fuels are then reported as metric tons emitted per billion British
thermal units (Btu). As Table 1 illustrates, the carbon content of coal and petroleum is
significantly greater than that of natural gas. When incorporated, the CCS technology is
estimated to eliminate 90 percent of carbon dioxide emissions (MIT, 2007).
Table 1: CO2 Emissions Factors from Coal and Natural Gas Fueled Power Generation
Power Generating Technology Fuel
CO2 Emissions (Metric
Tons/Billion Btu)
Heat Rate* of Generating Technology (Btu/kWh)
CO2 Emissions Factor (Metric
Tons/MWh)
Scrubbed New Coal Coal 94.7 8,800 0.83
IGCC Coal 94.7 8,700 0.82
IGCC with CCS Coal 9.47 10,700 0.10
Conv. Gas CC Natural Gas 53.06 7,050 0.37
Adv. Gas CC Natural Gas 53.06 6,430 0.34
Adv. CC with CCS Natural Gas 5.306 7,525 0.04
Conv. Gas CT Natural Gas 53.06 10,745 0.57
Adv. Gas CT Natural Gas 53.06 9,750 0.52
(*) Heat rate for new entrant technologies as estimated in the EIA’s Annual Energy Outlook (2011).
Source: EIA and MIT (2007).
Electricity output (generation) is measured in some scale of watt-hours,14 rather than Btus,
because each fuel generates a different amount of megawatt-hours (MWh) based on the
conversion efficiency of the turbine used in combustion of that fuel. This conversion, or thermal,
efficiency of generation is simply referred to as the “heat rate.” The heat rate measures how
many Btus of fuel are necessary to generate a certain quantity of MWh; the more efficient a
given power generating technology is, the lower is its the heat rate.
In Table 1, the heat rate of each technology is used to convert CO2 emissions to a CO2 factor
expressed in metric tons/MWh.15 In general, the combined cycle (CC) technologies are more
efficient16 than combustion turbine (CT) and scrubbed coal. While CCS reduces the amount of
14 In this case, MWh (1,000,000 watt-hours) are used.
15 Metric Tons of CO2 emitted per MWh = Metric Tons of CO2 per Billion Btu * (1-CCS factor) / Heat Rate.
16 More efficient generation technologies generate more watt-hours of electricity per unit of fuel input.
Seidman Research Institute, W. P. Carey School of Business Page 6
carbon dioxide released by up to 90 percent, power plants equipped with CCS will experience a
decrease in thermal efficiency (i.e., they will have higher heat rates than their non-CCS versions)
due to the additional energy required to operate the CCS equipment.
Combining the carbon content of each fuel and the heat rate (generating efficiency) of each
generating technology, it is possible to construct an indicative ranking of the levelized costs and
consider the impact of a carbon pricing scheme. All else being constant (financing, construction
lead-times, economic life of technology, fuel costs and other operational constraints), the
relative cost impact on each technology would closely mirror their CO2 factors in Table 1. Based
on that, the least impacted fossil fuel technology would be advanced natural gas combined
cycle (CC) with carbon capture and sequestration. This is due to the lower carbon dioxide
content of the fuel, the efficiency of the CC generation process, and the ability of CCS to
radically reduce emissions actually released into the atmosphere. The most impacted
technology would be scrubbed coal.
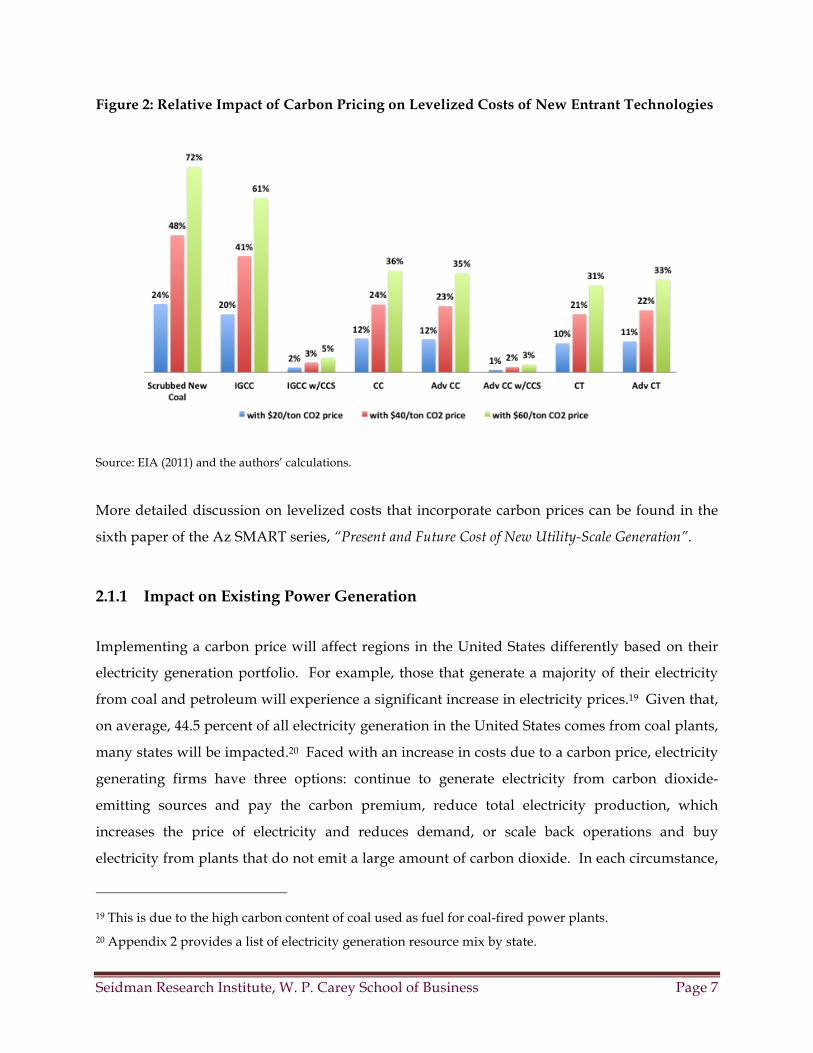
Figure 2 demonstrates the levelized cost impact of carbon pricing on those generating
technologies listed in Table 1. Four different, hypothetical carbon (dioxide) price levels are
assumed: $20, $40 and $60 per metric ton. In addition, the levelized price impact is evaluated
assuming these plants would be new entrants to the market, using indicative operating
characteristics as of 2010-2011.17 This cost impact is reported in terms of percentage increase
over levelized costs with no (zero) carbon pricing.18
17 New entrant characteristics by generating technology (typical size/capacity, construction lead time, overnight capital costs, variable and fixed operating and maintenance expenses, and heat rates) obtained from the EIA’s Assumptions to Annual Energy Outlook 2011, Electricity Market Module, Table 8.2, retrieved from http://www.eia.gov/forecasts/aeo/assumptions /pdf/electricity.pdf on December 2, 2011. Capacity (load) factors by technology were also obtained from the EIA, retrieved from http://www.eia.gov/oiaf/aeo/electricity _generation.html on December 2, 2011. Delivered natural gas prices were assumed to average $6 per MMBtu, and delivered coal prices were assumed average $2.5 per MMBtu (in real terms), indicative of market outlook for these fuels as of December 2011. Projects were assigned equal economic lives and financing terms.
18 Note that those plants or technologies, all else being constant, that have the least relative levelized cost impact due to carbon pricing (i.e., percentage increase in the levelized cost with carbon pricing over the levelized cost without carbon pricing), may not have the lowest overall levelized cost in dollar terms.
Seidman Research Institute, W. P. Carey School of Business Page 7
Figure 2: Relative Impact of Carbon Pricing on Levelized Costs of New Entrant Technologies
Source: EIA (2011) and the authors’ calculations.
More detailed discussion on levelized costs that incorporate carbon prices can be found in the
sixth paper of the Az SMART series, “Present and Future Cost of New Utility-Scale Generation”.
2.1.1 Impact on Existing Power Generation
Implementing a carbon price will affect regions in the United States differently based on their
electricity generation portfolio. For example, those that generate a majority of their electricity
from coal and petroleum will experience a significant increase in electricity prices.19 Given that,
on average, 44.5 percent of all electricity generation in the United States comes from coal plants,
many states will be impacted.20 Faced with an increase in costs due to a carbon price, electricity
generating firms have three options: continue to generate electricity from carbon dioxide-
emitting sources and pay the carbon premium, reduce total electricity production, which
increases the price of electricity and reduces demand, or scale back operations and buy
electricity from plants that do not emit a large amount of carbon dioxide. In each circumstance,
19 This is due to the high carbon content of coal used as fuel for coal-fired power plants.
20 Appendix 2 provides a list of electricity generation resource mix by state.
Seidman Research Institute, W. P. Carey School of Business Page 8
electricity costs will increase, a portion of which electricity generating firms will seek to pass on
to consumers in the form of higher electricity prices to maintain a sufficient rate of return.
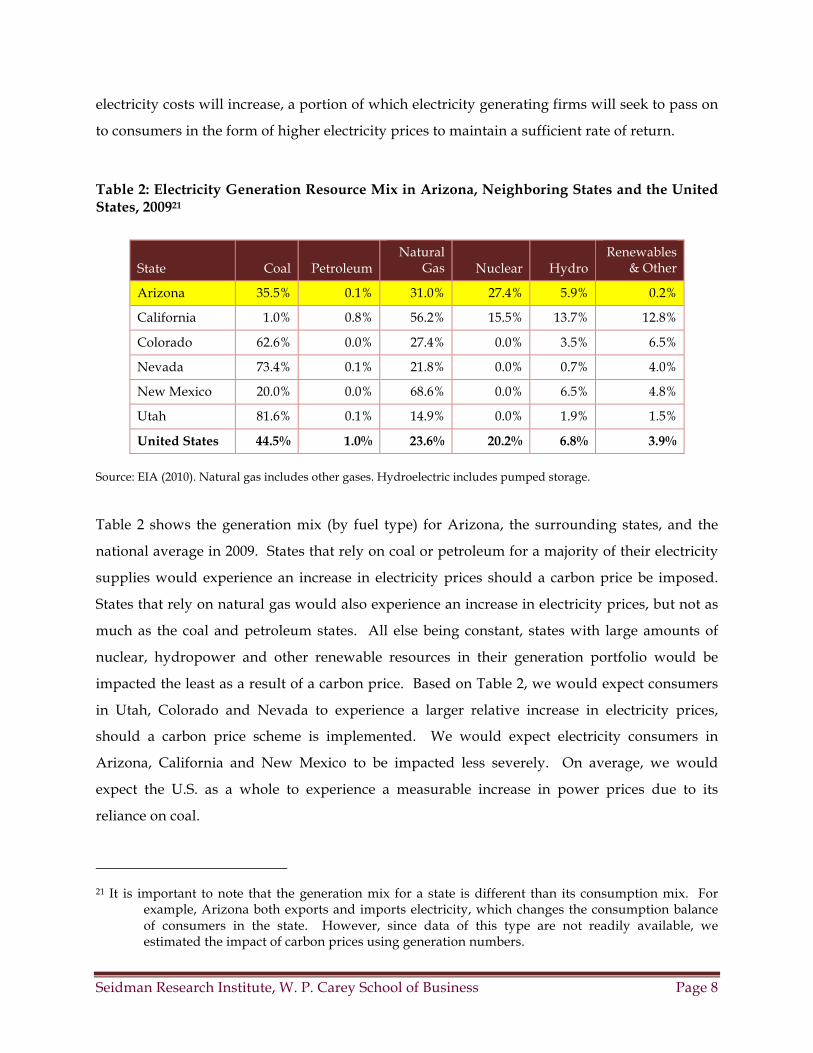
Table 2: Electricity Generation Resource Mix in Arizona, Neighboring States and the United States, 200921
State Coal Petroleum Natural
Gas Nuclear Hydro Renewables
& Other
Arizona 35.5% 0.1% 31.0% 27.4% 5.9% 0.2%
California 1.0% 0.8% 56.2% 15.5% 13.7% 12.8%
Colorado 62.6% 0.0% 27.4% 0.0% 3.5% 6.5%
Nevada 73.4% 0.1% 21.8% 0.0% 0.7% 4.0%
New Mexico 20.0% 0.0% 68.6% 0.0% 6.5% 4.8%
Utah 81.6% 0.1% 14.9% 0.0% 1.9% 1.5%
United States 44.5% 1.0% 23.6% 20.2% 6.8% 3.9%
Source: EIA (2010). Natural gas includes other gases. Hydroelectric includes pumped storage.
Table 2 shows the generation mix (by fuel type) for Arizona, the surrounding states, and the
national average in 2009. States that rely on coal or petroleum for a majority of their electricity
supplies would experience an increase in electricity prices should a carbon price be imposed.
States that rely on natural gas would also experience an increase in electricity prices, but not as
much as the coal and petroleum states. All else being constant, states with large amounts of
nuclear, hydropower and other renewable resources in their generation portfolio would be
impacted the least as a result of a carbon price. Based on Table 2, we would expect consumers
in Utah, Colorado and Nevada to experience a larger relative increase in electricity prices,
should a carbon price scheme is implemented. We would expect electricity consumers in
Arizona, California and New Mexico to be impacted less severely. On average, we would
expect the U.S. as a whole to experience a measurable increase in power prices due to its
reliance on coal.
21 It is important to note that the generation mix for a state is different than its consumption mix. For example, Arizona both exports and imports electricity, which changes the consumption balance of consumers in the state. However, since data of this type are not readily available, we estimated the impact of carbon prices using generation numbers.
Seidman Research Institute, W. P. Carey School of Business Page 9
2.1.2 Global Carbon Prices
There are several cap-and-trade programs and carbon tax schemes in operation around the
world. The European Union Emissions Trading System (EU ETS), the largest GHG cap-and-
trade program currently in existence, has been operating since 2005, and will enter its third
phase in 2012. Recent (2009-2011) allowance prices under the EU ETS have varied from $14 to
$28 per metric ton of carbon dioxide (Bloomberg, 2011). In the United States, several climate
bills that featured a cap-and-trade program were introduced since 2007, but none passed.
Currently, there are only regional and state-level efforts towards cap-and-trade, such as the
Regional Greenhouse Gas Initiative (RGGI) that covers ten northeastern states, active since 2009,
and the Western Climate Initiative (WCI), spearheaded by California, which is slated to
commence operations in 2012. Allowance prices in RGGI have remained under $5 per ton of
CO2 since the program’s launch. The French carbon tax, which was to be introduced in 2010
until economic concerns prevented its launch, would have started at €17 per metric ton of CO2
in (Carbon Tax Center, 2010). Lastly, the carbon tax in British Columbia, which is currently
C$10 per metric ton of CO2, will increase C$5 a year until it reaches C$30 in 2012 (Lang
Michener, 2009). Most recently, Australia introduced a tax on carbon, set at AUS$23 per ton
starting in 2012; however, the tax will transition into a cap-and-trade scheme in 2015 (Australian
Government, 2011).
2.1.3 Impact on Solar Power
Initially, the implementation of a carbon pricing mechanism appears to improve the relative
economics of solar power. By raising the cost of coal and natural gas-fired power generation, a
carbon price makes resources that do not emit carbon more cost-competitive. The resources
that emit little to no carbon are coal and natural gas-fired power plants equipped with CCS
technology, nuclear power, and electricity generated from renewable energy sources. Below,
Figure 3 illustrates that, besides solar, Arizona does not have many renewable resources suited
for large-scale power generation. This leaves nuclear power, coal and natural gas-fired power
plants (equipped with CCS technology) and electricity imports (from out of state) as alternatives
to solar power in Arizona.
Seidman Research Institute, W. P. Carey School of Business Page 10
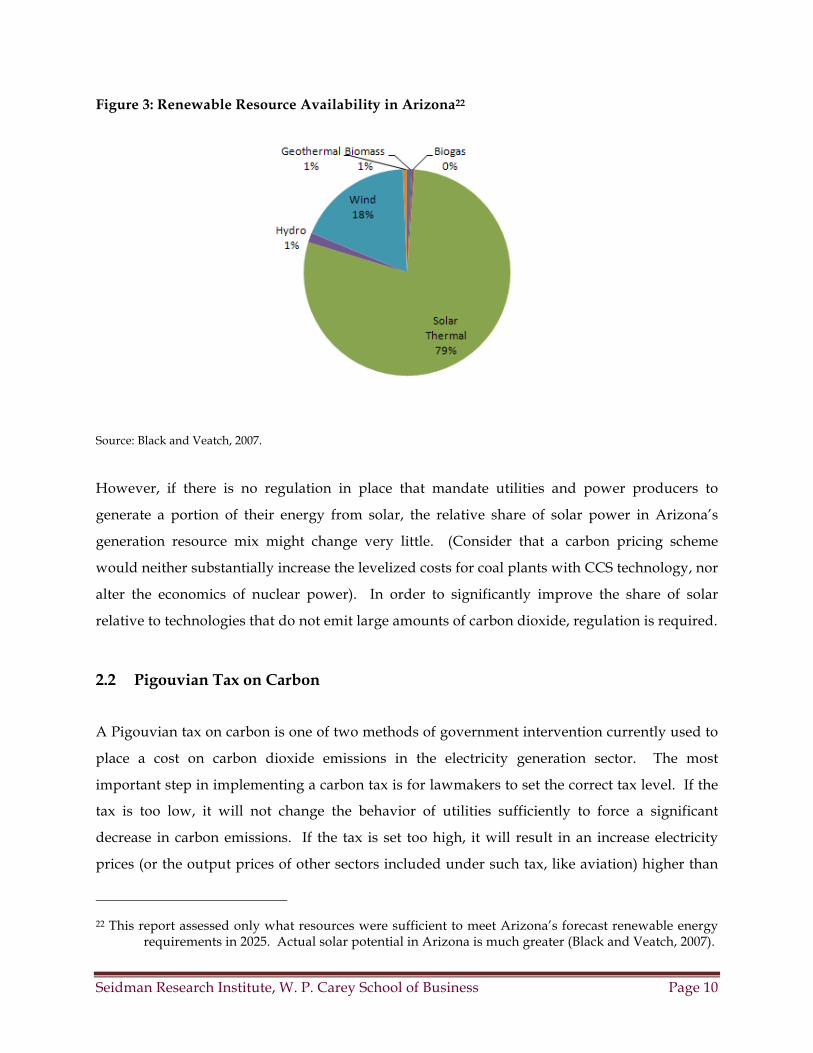
Figure 3: Renewable Resource Availability in Arizona22
Source: Black and Veatch, 2007.
However, if there is no regulation in place that mandate utilities and power producers to
generate a portion of their energy from solar, the relative share of solar power in Arizona’s
generation resource mix might change very little. (Consider that a carbon pricing scheme
would neither substantially increase the levelized costs for coal plants with CCS technology, nor
alter the economics of nuclear power). In order to significantly improve the share of solar
relative to technologies that do not emit large amounts of carbon dioxide, regulation is required.
2.2 Pigouvian Tax on Carbon
A Pigouvian tax on carbon is one of two methods of government intervention currently used to
place a cost on carbon dioxide emissions in the electricity generation sector. The most
important step in implementing a carbon tax is for lawmakers to set the correct tax level. If the
tax is too low, it will not change the behavior of utilities sufficiently to force a significant
decrease in carbon emissions. If the tax is set too high, it will result in an increase electricity
prices (or the output prices of other sectors included under such tax, like aviation) higher than
22 This report assessed only what resources were sufficient to meet Arizona’s forecast renewable energy requirements in 2025. Actual solar potential in Arizona is much greater (Black and Veatch, 2007).
Seidman Research Institute, W. P. Carey School of Business Page 11
were required to generate the desired reduction in emissions. Therefore, the ability of a carbon
tax to produce the desired outcome depends entirely on choices made by the government.
After the level is set, the tax is applied to any power generation technology (or any other sectors
of the economy) that emits carbon dioxide. At this point, the tax functions like a price on
carbon, increasing the cost of carbon dioxide-emitting generation technologies.
By increasing the cost of carbon dioxide-emitting generation technologies, a carbon tax
decreases such emissions by decreasing the relative cost of carbon-free technologies and
reducing electricity demand due to higher electricity prices.23 It may also raise significant
amounts of revenue for the government. The potential options for this revenue, and their
impact on electricity users, is discussed further in the cap-and-trade section of this paper.
2.2.1 Global Adoption
Carbon taxes have grown in popularity within the past few years and have been successfully
implemented in several regions and countries around the world. In 1990, Finland was the first
country to impose a carbon tax, at €1.12 per metric ton of CO2 (about $1.36) which, by 2010, was
raised to €20 (about $27). In January 2011, the carbon tax structure in Finland reverted back to a
combined carbon/energy tax (which was the format used from 1994 to 1997). Under this
method, fossil fuels are taxed based on both their energy content and their CO2 emissions.
Finland raised the tax rates considerably as a result of this revision. For instance, the tax rate for
transport fuels is up from €20 per metric ton of CO2 to €50, and to €30 for heating fuels (which
will be applied at a 50 percent reduced rate for heating fuels used in CHP facilities). (Finland
Ministry of the Environment, 2011).
In 1991, a tax on CO2 was added to the Sweden’s existing energy tax system, along with a tax on
emissions of sulfur dioxide and nitrogen oxides. The tax is based on the carbon content of all
fuels except for biofuels and peat. Since 1991, the tax rate increased several times, reaching SEK
1.05 per kilogram of CO2 (more than $150 per metric ton of CO2) in 2009. However, this rate is
reduced significantly (by nearly 80 percent) for industry and agriculture (IEA, 2011).
23 The severity of this increase depends on the amount of the cost increase that the electricity generating firm is able to pass on to its customers.
Seidman Research Institute, W. P. Carey School of Business Page 12
The United Kingdom instituted a revenue neutral “climate change levy” in 2001 on energy use
in the end-use sectors. Examples of rates for 2011 are 0.169 pence/kWh for gas (about 0.27
cents) and 0.485 pence/kWh (about 0.78 cents) for electricity. Electricity generated from new
renewable energy and fuel used for certain combined heat and power (CHP) facilities are
exempt (HM Revenue & Customs, 2011). The Netherlands (1990), Norway (1991), Denmark
(1992), Switzerland (2008), and Ireland (2010) are other European countries that have instituted
some form of carbon tax (IEA, 2011).
Quebec became the first North American state or province to impose a carbon tax, starting on
October 1, 2007. The tax mainly affects transport fuels (gasoline and diesel), heating oil, and
coal, but is relatively small in amount (the initial average tax rate was about C$3.5 per metric
ton of CO2).24 The tax is expected to generate about C$200 million per year to finance climate
change initiatives and public transit projects. In Quebec, only a small portion of electricity is
generated from fossil fuels (the primary resource is hydroelectricity), the tax does not have a
significant impact on electricity prices (National Renewable Energy Laboratory - NREL, 2009).
British Columbia introduced a revenue-neutral carbon tax in July 2008, applicable to
transportation fuels, natural gas, and fossil fuels used in industrial processes. Road, rail, marine,
and air transportation within the province are all covered by the tax (but not interstate
transportation). The program maintains revenue neutrality by returning the tax revenues to
taxpayers as reductions in individual and corporate income taxes. The tax rate started at C$10
per metric ton of CO2 and has increased every year by C$5 per ton, until it reaches the C$30
maximum level in 2012 (NREL, 2009). Further increases beyond the C$30 level are possible,
since it has been estimated that a C$75 per ton carbon tax is required to meet British Columbia’s
emissions reduction commitment, which is 10 percent below 1990 levels by 2020 (Pembina
Institute, 2008).
24 Actual tax rates vary by fuel. For instance, for the initial year (2007), the rates were 0.8 cents/liter for gasoline, 0.9 cents/liter for diesel, about 1 cent/liter for heating oil, 1.3 cents/liter for petroleum coke, 0.5 cents/liter for propane, and C$8/ton for coal (all figures in Canadian Dollars).
Seidman Research Institute, W. P. Carey School of Business Page 13
Most recently, the lower chamber of the Australian Parliament voted narrowly in favor of a tax
of AUS$23 per metric ton of CO2 to be levied on the 500 largest polluters in the country, starting
July 2012. This tax rate will rise at 2.5 percent annually, when, in 2015, it will transition into a
market-based (cap-and-trade) scheme. In the meantime, many of the impacted sectors (like the
household sector) will be directly compensated by the government (i.e., some of the collected
tax will be returned to the public). The legislation is expected to become law once it passes the
Senate before the end of 2011 (Australian Government, 2011).
The City of Boulder, Colorado implemented the United States’ first tax on carbon dioxide
emissions from electricity in April 2007. The tax rates are set based on electricity consumption
($ per kWh), and vary for residential, commercial and industrial users. In 2009, the rates were
raised to the maximum level allowed by the city ordinance, which corresponds to an average of
$12 per ton of CO2. According to the City of Boulder, the tax generates about $1 million
annually, with the revenues used to fund the city’s climate action plan. The tax is set to expire in
March 2013, unless voters choose to extend it (City of Boulder, 2011). A similar city-wide
carbon tax was also implemented in the San Francisco metro area25 in July 2008. The 2009 tax
rate was 4.5 cents per metric ton of CO2. The tax revenues are used to support city efforts to
reduce GHG emissions (NREL, 2011).
On the other hand, to date, a carbon tax has not been implemented in the United States on
either the state or federal level. When negotiations were ongoing at the Kyoto Conference, the
U.S. delegation showed its preference for a cap-and-trade system over a carbon tax for
enforcement reasons (The Economist, 2009).26 With the momentum of the country behind cap-
and-trade systems,27 it appears unlikely that the United States will implement a carbon tax in
the near future (Carbon Tax Center, 2010). In the European Union, an emissions trading scheme
25 Specifically, the Bay Area Air Quality Management District (BAAQMD), which incorporates nine counties of the San Francisco Bay Area.
26 The U.S. delegation assumed that a carbon tax would be harder to pass through the legislature and that a cap-and-trade system would provide more room to maneuver around carbon cuts.
27 The Western Climate Initiative (WCI) and the Regional Greenhouse Gas Initiative (RGGI) (discussed in more detail later in the text), and the Waxman-Markey Bill and the Kerry-Lieberman Act all either utilize or proposed a cap-and-trade scheme.
Seidman Research Institute, W. P. Carey School of Business Page 14
(i.e., cap-and-trade) has been implemented to achieve GHG emissions reductions, rather than a
carbon tax.
2.3 Cap-and-Trade
Cap-and-trade systems28 allow the market to determine a price for carbon by setting a limit on
the quantity of emissions allowed. Once the limit has been determined, allowances to emit
carbon are, in most cases, distributed to regulated entities. Allowances can be distributed in two
ways: by quota or auction. If the allowances are distributed by quota, the regulating body must
determine the manner in which they are distributed. While there are many different ways to
distribute allowances,29 the impact of the distribution on the regulated firms is important to
consider. For example, if allowances are distributed by carbon emissions, electricity generating
firms that have already reduced their carbon emissions will not receive credit for this in the
system.
If allowances are distributed by a quota system, there is only one circumstance in which
allowances will not be traded after initial distribution. If allowances are distributed based on
ability to switch to less carbon-emitting fuels, there is no opportunity for trade since the
allowances will already have been efficiently distributed. However, if this is not the case, a
secondary market for allowances will be created after distribution by quota. Firms with low
carbon abatement costs will offer to sell their allowances at a price that is greater than the
difference between the carbon-emitting source they are moving away from and the carbon-
reduced30 source they are adopting. Firms with high carbon abatement costs will purchase
allowances at a price that is less than the difference between the carbon-reduced option
available and the carbon-emitting source they seek to continue using. Over time, the cap is
28 Ideally, a cap-and-trade system assumes the market is operating with perfect information, allowing each firm to make the most cost-effective choice.
29 Examples include by production, population, carbon emissions or electricity produced. In the now defunct Waxman-Markey bill, if a state had an RPS, it would have received more allowances than a state without one.
30 It is important to note that firms will not necessarily choose carbon-free sources. If technologies are available that emit small amounts of carbon dioxide at a price that becomes competitive after a carbon dioxide price is implemented, firms may choose these technologies. Examples include coal and natural gas plants with CCS equipment.
Seidman Research Institute, W. P. Carey School of Business Page 15
designed to decrease, which will increase the cost of allowances in the secondary market and
encourage more firms to adopt carbon-reduced sources. The reason more firms will adopt
carbon-reduced sources is because, with higher allowance costs imposing a higher carbon price,
carbon-reduced technologies experience a relative price decrease. Due to the cost of allowances,
a carbon price emerges from the cap-and-trade system. In this case, the government receives no
revenue because allowances are given freely by quota.
If regulators decide to not allocate allowances freely, they will hold an auction where firms will
purchase allowances. If all allowances are auctioned, a secondary market for allowance trading
will not be created. Each entity purchases allowances at the level of its abatement cost, which
leaves no arbitrage opportunities.31 If a portion of the allowances are auctioned, and the rest
distributed by quota, a secondary market will exist and operate in a similar manner to the
market that would result from distributing 100 percent of the allowances by quota. The
secondary market price will be higher than the auction price because, if it is not, no firm will
participate in the auction due to the lower price available in the secondary market. In the case
where allowances are auctioned off, the carbon price is a product of the auction price. The
government gains revenue from the process and, if the allowances placed into auction are 100
percent sold, the cap-and-trade system will be fundamentally similar to a carbon tax.
When regulators enforce a cap on carbon dioxide emissions, they must determine whether the
cap will be enacted upstream, midstream, or downstream. Upstream regulation enforces the
cap where carbon-based fuels first enter the economy, so it will impact fuel suppliers in the
electricity generation sector. Many systems have been proposed with upstream regulation
because the process will not require participation from 99.9% of American companies and 100%
of American households (Durning, 2009). Midstream regulation will require compliance from
retailers and impact electricity generators directly. Downstream regulation will impact
individual consumers who buy carbon-based energy, such as the residential, commercial and
31 A purchaser of allowances might hope to take advantage of an arbitrage opportunity by buying allowances in the auction and selling them after for a higher price. However, it is assumed that firms will purchase allowances at their abatement cost, so if they required allowances, they would have bought them for a higher price at auction rather than in the secondary market. Therefore, no arbitrage opportunity exists.
Seidman Research Institute, W. P. Carey School of Business Page 16
industrial consumers of electricity. Typically, the farther down regulation occurs, the harder it
is to enforce and the more it impacts individual energy consumers.
2.3.1 Offsets
One feature of cap-and-trade systems that alters the process of obtaining allowance is the use of
carbon offsets. A carbon offset represents an amount of avoided carbon dioxide emissions in a
sector that is not covered by the cap-and-trade system. Some programs allow carbon offsets to
be acquired internationally as well as from uncovered domestic sectors, and others only allow
offsets to originate from the same jurisdiction as the emitter. After the signing of the Kyoto
Protocol, a world market for carbon offsets was created under the direction of the Clean
Development Mechanism (CDM), which is a part of the United Nations Framework Convention
on Climate Change (UNFCCC). The CDM creates and monitors international offsets to prevent
false offsets from entering the market. An example of one of these projects would be a utility in
the United States funding a portion of a hydropower plant in Nigeria, which would have built a
coal plant if the additional funding was not available. Due to the nature of this exchange,
offsets are popular in developing countries because they are a source of income (UNFCCC,
2010).
Developed countries favor offsets as a cost-effective method of compliance with regulation. A
firm in the United States operating under a cap-and-trade system will enter the market for
carbon offsets if there are projects available that are less expensive than the cost of an allowance.
As a result, offsets may reduce the price of allowances in a potential cap-and-trade system. One
of the most important issues with offsets, from a regulation standpoint, is ensuring that the
offsets are legitimate.
This process has proven difficult, as it is not easy to determine what would have happened to
certain projects if funding was not available through carbon offsets (Bradsher, 2007). For
example, the CDM has received criticism for financing a portion of 20 gas-fired power plants in
China (The Economist, 2009). Although it is true that these plants prevented the construction of
more coal-fired power plants, China had previously announced an energy policy angled away
from coal for reasons other than climate change. Carbon offsets serve a useful purpose in the
Seidman Research Institute, W. P. Carey School of Business Page 17
development of a cost-effective cap-and-trade system, but if they are not carefully monitored,
offsets will negatively impact the overall goal of the system, which is to limit carbon emissions.
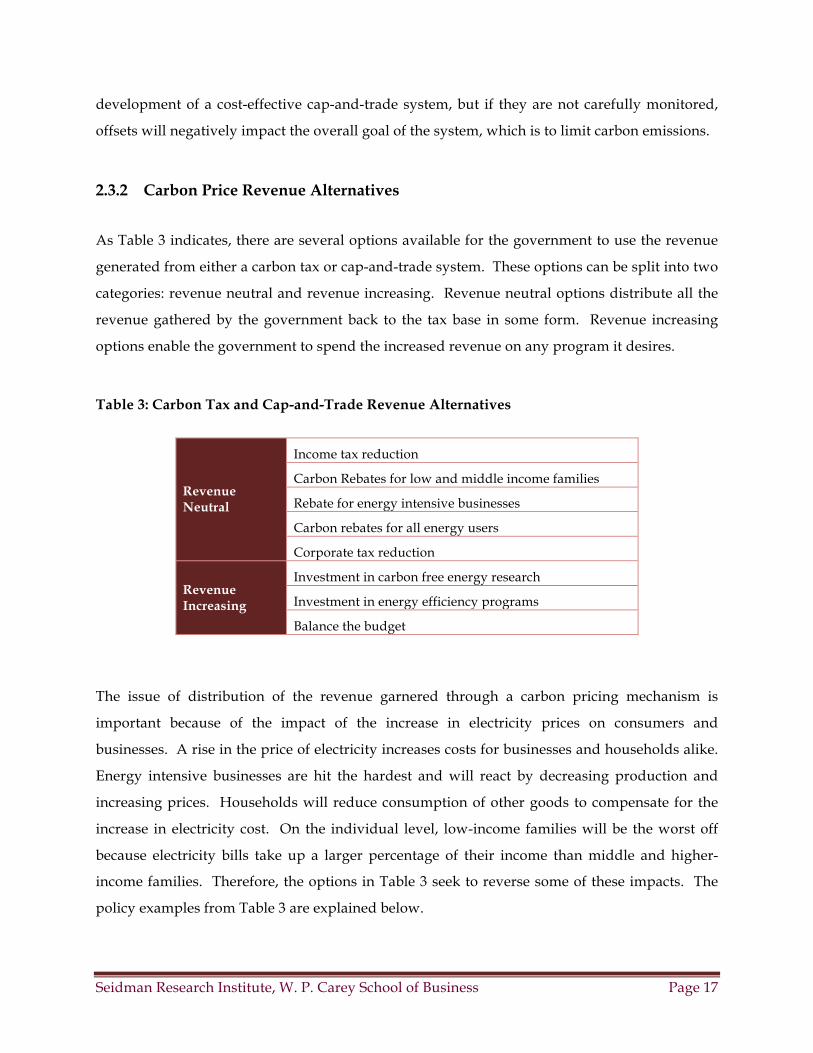
2.3.2 Carbon Price Revenue Alternatives
As Table 3 indicates, there are several options available for the government to use the revenue
generated from either a carbon tax or cap-and-trade system. These options can be split into two
categories: revenue neutral and revenue increasing. Revenue neutral options distribute all the
revenue gathered by the government back to the tax base in some form. Revenue increasing
options enable the government to spend the increased revenue on any program it desires.
Table 3: Carbon Tax and Cap-and-Trade Revenue Alternatives
Revenue Neutral
Income tax reduction
Carbon Rebates for low and middle income families
Rebate for energy intensive businesses
Carbon rebates for all energy users
Corporate tax reduction
Revenue Increasing
Investment in carbon free energy research
Investment in energy efficiency programs
Balance the budget
The issue of distribution of the revenue garnered through a carbon pricing mechanism is
important because of the impact of the increase in electricity prices on consumers and
businesses. A rise in the price of electricity increases costs for businesses and households alike.
Energy intensive businesses are hit the hardest and will react by decreasing production and
increasing prices. Households will reduce consumption of other goods to compensate for the
increase in electricity cost. On the individual level, low-income families will be the worst off
because electricity bills take up a larger percentage of their income than middle and higher-
income families. Therefore, the options in Table 3 seek to reverse some of these impacts. The
policy examples from Table 3 are explained below.
Seidman Research Institute, W. P. Carey School of Business Page 18
Income tax reduction- Applied across the board, an income tax reduction gives each income tax
filer a percentage of their annual tax back. However, it is not distributed based on the impact of
higher electricity prices and favors high-income individuals. Additionally, it does not
compensate businesses for their higher electricity expenses.
Carbon rebates for low and middle-income families- The rebate amount is based on income
level, with low-income families receiving more than middle-income families. The advantage of
this tax is that it offsets some of the impact of higher electricity prices on the individuals that are
affected the most. However, it does not compensate businesses for their higher electricity
expenses.
Rebate for energy-intensive businesses- The rebate is based on the level of energy use by each
business. The rebate is advantageous because it compensates for the increase in business
operating costs, which are higher due to electricity price increases. However, this rebate doesn’t
help individuals that face higher electricity bills, particularly low-income families.
Carbon rebates for all users- This tax rebate is applied to all individuals and firms based on
their electricity use. While it does partially offset the increase in electricity costs for all parties
affected, low-income families will be worse off because the rebate will not be able to cover the
entire impact of the increase in electricity prices.
Corporate tax reduction- Drawing on the British Columbia model, corporate tax reduction
lowers costs for businesses. However, it does not lessen the impact of electricity prices on
individual families or businesses.
Investment in carbon-free energy research- Rather than refunding individuals impacted by
electricity price increases, an investment in carbon-free energy research is designed to improve
carbon-free technology so electricity prices will decline in the future. While the additional
investment will aid carbon-free technology, it will be offset by the impact on businesses and
families of higher electricity prices.
Seidman Research Institute, W. P. Carey School of Business Page 19
Investment in energy-efficiency programs- Investing in energy-efficient appliances and
processes will reduce the demand for energy and reduce the need for additional electricity
generating power plants. However, this program will not lessen the direct financial impact of
the carbon price scheme on businesses and families.
Balancing the federal budget- Due to recent assistance for the financial sector and fiscal
stimulus, the federal deficit has substantially increased. As a result, there has been a call to
balance the budget using revenues from a carbon pricing mechanism.32 However, this will not
lessen the impact of higher electricity prices on businesses and families.
2.3.3 Global Adoption
Cap-and-trade systems have been adopted both in the United States and internationally over
the past 30 years as a preferred mechanism for reducing harmful emissions from electricity
generation.
In the United States, the most successful adoption of a cap-and-trade system has been the acid
rain program introduced in the 1990 Clean Air Act Amendments. Designed to influence
utilities to invest in technologies that reduce emissions of sulfur dioxide and nitrogen oxides, by
2002 the program resulted in a decrease in sulfur dioxide emissions of more than 41% below
1980 levels, and by 2005, a 57 percent reduction was achieved in emissions of nitrogen oxides
from 2000 levels (Environmental Protection Agency (EPA), 2011).33
More recently, there have been attempts to develop state or regional cap-and-trade schemes to
combat carbon dioxide emissions. For instance, ten New England and Mid-Atlantic states
adopted the Regional Greenhouse Gas Initiative (RGGI) to reduce regional carbon dioxide
32 The proposal to use funds from a carbon price program to reduce the deficit has appeared as an option in both the Waxman-Markey Bill and the Kerry-Lieberman Act.
33 In addition to the requirements of the acid rain program, the EPA has introduced the 2005 Clean Air Interstate Rule (CAIR), which aimed to permanently cap emissions of sulfur dioxide and nitrogen oxides in the 28 eastern states and the District of Columbia. CAIR, which was challenged in federal courts, will expire at the end of 2011. It is expected be replaced by the similar Cross-State Air Pollution Rule (CSAPR). These rules aim to address the upwind/downwind transport of harmful emissions from power generation across state borders (EPA, 2011).
Seidman Research Institute, W. P. Carey School of Business Page 20
emissions from the power generation sector.34 RGGI has been operating since 2009, and average
allowance prices (at auction and in the secondary market) have ranged from $2 to $3 per short
ton of CO2 (RGGI, 2011). A similar initiative, called the Western Climate Initiative (WCI),
involves six western states and four Canadian provinces.35 WCI is slated to become operational
by January 2012, under the leadership of California (see below). A third regional initiative, the
Midwest Greenhouse Gas Reduction Accord (MGGRA), which would have covered much of
the Midwest, was announced in 2007, but has been shelved due to the lingering economic
recession (Midwest Energy News, 2011).
California is the only state developing a stand-alone cap-and-trade program targeting GHG
emissions. As mandated by the 2006 Assembly Bill 32 (AB 32), the state needs to cut GHG
emissions to 1990 levels by 2020, which corresponds to a reduction of nearly 30 percent. The
California Air Resources Board (ARB) identified cap-and-trade as one of the key strategies to
achieve this reduction. While the ARB is coordinating with the WCI to develop a regional cap-
and-trade program that can deliver larger GHG emission reductions at lower cost, instead of a
California-only program, it is likely that California will forge ahead regardless of WCI
participation. The ARB is expected to finalize a cap-and-trade regulation soon to allow trading
to begin in 2012 (California ARB, 2011).
However, these efforts are limited in comparison with the results that could be achieved with a
potential federal cap-and-trade scheme. Since 2007, five pieces of legislation36 have been
34 The ten participating states in the RGGI are Connecticut, Delaware, Maine, Maryland, Massachusetts,
New Hampshire, New Jersey, New York, Rhode Island, and Vermont. The program caps total emissions from power plants larger than 25 MW (about 200 installations) at 188 million short tons per year until 2014. This cap will decline at a rate of 2.5 percent annually from 2015 until 2018 in line with the 10 percent reduction target. RGGI will complete its first three-year compliance period at the end of 2011 (RGGI, 2011).
35 The WCI aims to reduce regional GHG emissions to 15 percent below 2005 levels by 2020. The partner jurisdictions are British Columbia, California, Manitoba, Montana, New Mexico, Ontario, Oregon, Quebec, Utah and Washington (WCI, 2011). Arizona, a founding member, withdrew from the WCI in 2010. (See “The Governor’s Policy on Climate Change: Executive Order 2010-06,” retrieved from http://www.azclimatechange.gov/download/eo-2010-06.pdf.)
36 Climate Stewardship and Innovation Act of 2007 (S.280) introduced by Senators Lieberman and McCain; Low Carbon Economy Act of 2007 (S.1766) by Senators Bingaman and Specter; Lieberman–Warner Climate Security Act of 2008 (S.2191) by Senators Lieberman and Warner; American Clean Energy and Security Act of 2009 (H.R. 2454) by Representatives Waxman and Markey; and American Power Act of 2010 by Senators Kerry and Lieberman (EPA, 2011).
Seidman Research Institute, W. P. Carey School of Business Page 21
proposed to the U.S. Congress towards that end; however, none garnered sufficient legislative
support. Nonetheless, should any federal climate change-related legislation is enacted in the
United States, it is expected to include a GHG emissions regulation scheme of the cap-and-trade
variety.
Internationally, the Kyoto Protocol,37 which has been the most significant international
agreement on global climate change, encouraged the adoption of cap-and-trade programs to
reduce GHG emissions. The Protocol set binding targets for 37 industrialized countries for
reducing GHG emissions, by an average of five percent from 1990 levels during the first
compliance period of 2008 to 2012. .
Today, the European Union’s Emissions Trading System (EU ETS), which started operations in
2005, is the largest and the best developed cap-and-trade system. The timing of the EU ETS
Phase II (2008-2012) was designed to overlap with the first compliance period under the Kyoto
Protocol. During this phase of the program,38 the overall cap is set at 6.5 percent below 2005
levels. This cap will be tightened to 21 percent below 2005 levels in 2020. At the end of 2010, the
program covered nearly eleven thousand facilities that accounted for nearly half of the CO2
emissions in the EU. Aviation sector will be part of the ETS starting in 2012. Coverage of the
program will also expand to include GHGs other than carbon dioxide in the third phase.
During Phase II of the EU ETS there was an over-supply of allowances, mainly as a result of the
recession (which led to a fall in industrial output and power generation in 2008 and 2009).
However, since the caps were tighter (compared to the test phase) and participants were not
allowed to bank allowances for use in future trading periods, the allowance prices did not
collapse. Allowance prices traded around $35 per metric ton of CO2 during most of 2008. Since
2009, allowances have traded $14 and $28 per metric ton of CO2.
37 Adopted on December 11, 1997, the Kyoto Protocol has been ratified by more than 190 countries (United Nations Framework Convention on Climate Change, UNFCCC, 2011). The protocol set biding targets for 37 industrialized countries to reduce their emissions of six main greenhouse gases (carbon dioxide, methane, nitrous oxide, sulfur hexafluoride, hydrofluorocarbons and perfluorocarbons) by about 5% from their 1990 levels during the 2008-2012 compliance period. (See http://unfccc.int/essential_background/kyoto_protocol/items/6034.php and http://unfccc.int/essential_background/convention/status_of_ratification/items/2631.php).
38 Phase I of the EU ETS was a trial period that ran from 2005 to 2007.
Seidman Research Institute, W. P. Carey School of Business Page 22
The stricter emission targets under Phase III are expected to generate higher allowance prices.
Moreover, during Phase III, more than half of allowances will be allocated via auctions (starting
in 2013) and there will be no free allocation for the power sector. Allowances for Phase I (trial)
and Phase II were allocated to participating installations free of charge.39 In Phase III, the
proportion of allowances subject to auction will increase each year, and free allocation of
allowances to all sectors will be phased out by 2027 (IEA, 2010).
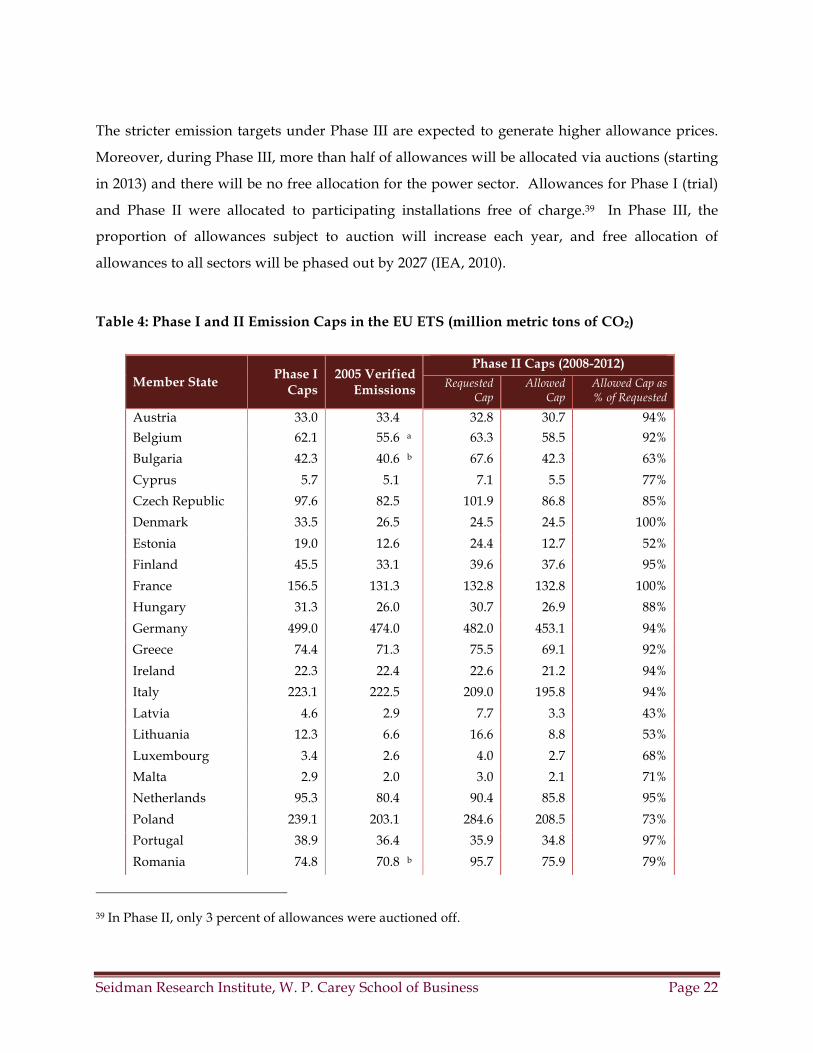
Table 4: Phase I and II Emission Caps in the EU ETS (million metric tons of CO2)
Member State Phase I
Caps 2005 Verified
Emissions
Phase II Caps (2008-2012) Requested
Cap Allowed
Cap Allowed Cap as % of Requested
Austria 33.0 33.4 32.8 30.7 94% Belgium 62.1 55.6 a 63.3 58.5 92%
Bulgaria 42.3 40.6 b 67.6 42.3 63%
Cyprus 5.7 5.1 7.1 5.5 77%
Czech Republic 97.6 82.5 101.9 86.8 85%
Denmark 33.5 26.5 24.5 24.5 100%
Estonia 19.0 12.6 24.4 12.7 52%
Finland 45.5 33.1 39.6 37.6 95%
France 156.5 131.3 132.8 132.8 100%
Hungary 31.3 26.0 30.7 26.9 88%
Germany 499.0 474.0 482.0 453.1 94%
Greece 74.4 71.3 75.5 69.1 92%
Ireland 22.3 22.4 22.6 21.2 94%
Italy 223.1 222.5 209.0 195.8 94%
Latvia 4.6 2.9 7.7 3.3 43%
Lithuania 12.3 6.6 16.6 8.8 53%
Luxembourg 3.4 2.6 4.0 2.7 68%
Malta 2.9 2.0 3.0 2.1 71%
Netherlands 95.3 80.4 90.4 85.8 95%
Poland 239.1 203.1 284.6 208.5 73%
Portugal 38.9 36.4 35.9 34.8 97%
Romania 74.8 70.8 b 95.7 75.9 79%
39 In Phase II, only 3 percent of allowances were auctioned off.
Seidman Research Institute, W. P. Carey School of Business Page 23
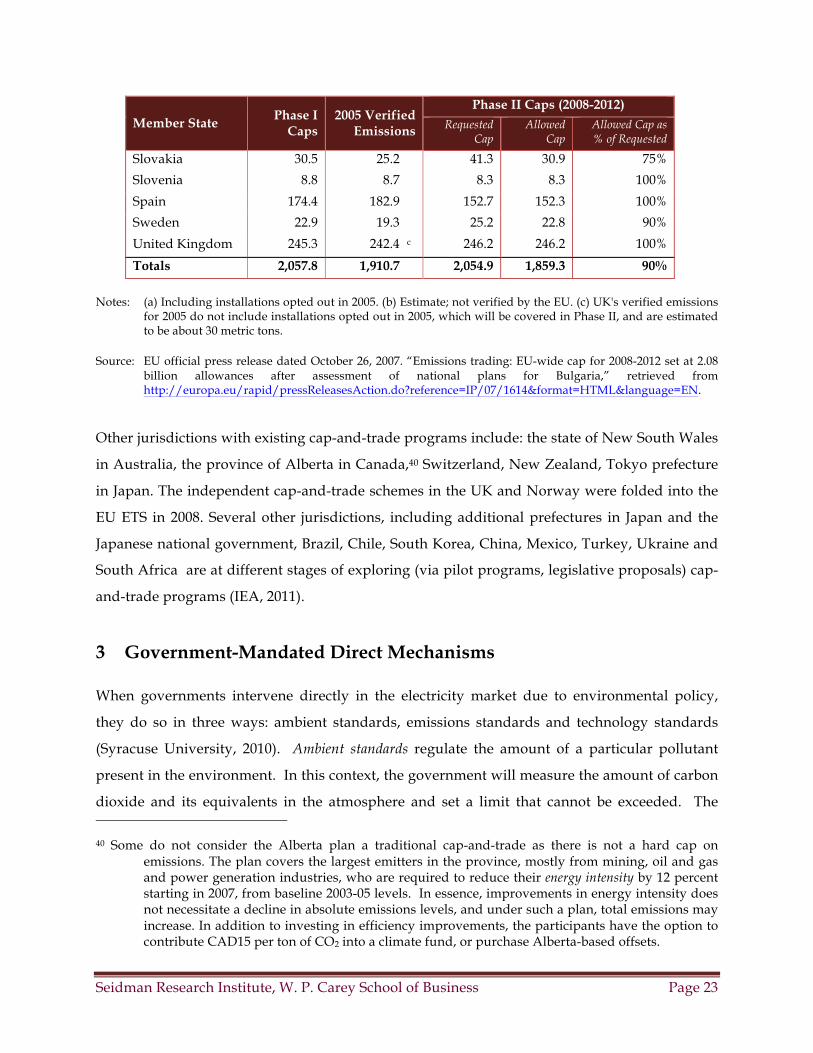
Member State Phase I
Caps 2005 Verified
Emissions
Phase II Caps (2008-2012)
Requested Cap
Allowed Cap
Allowed Cap as % of Requested
Slovakia 30.5 25.2 41.3 30.9 75%
Slovenia 8.8 8.7 8.3 8.3 100%
Spain 174.4 182.9 152.7 152.3 100%
Sweden 22.9 19.3 25.2 22.8 90%
United Kingdom 245.3 242.4 c 246.2 246.2 100%
Totals 2,057.8 1,910.7 2,054.9 1,859.3 90%
Notes: (a) Including installations opted out in 2005. (b) Estimate; not verified by the EU. (c) UK's verified emissions for 2005 do not include installations opted out in 2005, which will be covered in Phase II, and are estimated to be about 30 metric tons.
Source: EU official press release dated October 26, 2007. “Emissions trading: EU-wide cap for 2008-2012 set at 2.08 billion allowances after assessment of national plans for Bulgaria,” retrieved from http://europa.eu/rapid/pressReleasesAction.do?reference=IP/07/1614&format=HTML&language=EN.
Other jurisdictions with existing cap-and-trade programs include: the state of New South Wales
in Australia, the province of Alberta in Canada,40 Switzerland, New Zealand, Tokyo prefecture
in Japan. The independent cap-and-trade schemes in the UK and Norway were folded into the
EU ETS in 2008. Several other jurisdictions, including additional prefectures in Japan and the
Japanese national government, Brazil, Chile, South Korea, China, Mexico, Turkey, Ukraine and
South Africa are at different stages of exploring (via pilot programs, legislative proposals) cap-
and-trade programs (IEA, 2011).
3 Government-Mandated Direct Mechanisms
When governments intervene directly in the electricity market due to environmental policy,
they do so in three ways: ambient standards, emissions standards and technology standards
(Syracuse University, 2010). Ambient standards regulate the amount of a particular pollutant
present in the environment. In this context, the government will measure the amount of carbon
dioxide and its equivalents in the atmosphere and set a limit that cannot be exceeded. The
40 Some do not consider the Alberta plan a traditional cap-and-trade as there is not a hard cap on emissions. The plan covers the largest emitters in the province, mostly from mining, oil and gas and power generation industries, who are required to reduce their energy intensity by 12 percent starting in 2007, from baseline 2003-05 levels. In essence, improvements in energy intensity does not necessitate a decline in absolute emissions levels, and under such a plan, total emissions may increase. In addition to investing in efficiency improvements, the participants have the option to contribute CAD15 per ton of CO2 into a climate fund, or purchase Alberta-based offsets.
Seidman Research Institute, W. P. Carey School of Business Page 24
region that emits in excess of this standard is required to formulate and execute a plan of action
to attain compliance. However, this is difficult with carbon dioxide emissions for two reasons.
First, the responsible region is the entire planet, which requires the participation and agreement
of the countries responsible for significant carbon dioxide emissions. As the Kyoto Conference
illustrated, this is not an easy task. The second problem is that carbon dioxide emissions are
retained in the atmosphere for a period of 50 years or longer (EPA, 2009). Any attempt to
achieve compliance by reducing emissions will not have an effect for years, if not decades.
Emissions standards regulate the level of emissions, which are enforced at the source. For the
electricity generation sector, this would impact the emissions of a plant as well as suppliers of
coal and natural gas. The advantage of this system is its regulatory simplicity. In comparison
to an ambient standard, an emissions standard can be easily measured, does not require
international cooperation, and can target particular companies and regions for enforcement.
However, ambient standards are unable to account for other factors that contribute to the
problems associated with carbon dioxide emissions, such as weather conditions and other
human behavior.
Technology standards enforce particular technology solutions or techniques. The introduction of
scrubbers to reduce sulfur dioxide emissions was an example of a technology solution in the
electricity generation sector. A technology standard is useful due to its simple implementation
and direct impact on carbon dioxide emissions. However, it is only useful when the
government has a clearly defined better available control technology. This is often not the case.
In the case of the electricity generation sector, the government chooses a particular generation
technology or piece of equipment that it has decided is preferable over what the market would
choose without the regulation. There are three technology standards that national or state
governments have imposed on the electricity market. Each will be explained below, along with
their impact on solar power and the global adoption of each type of mechanism.
3.1 Renewable Energy Requirements
The EIA defines a renewable resource as an energy resource that is naturally replenishing but
flow-limited. These include bio-fuels, biomass, geothermal, hydro, solar, tidal, wave, and wind.
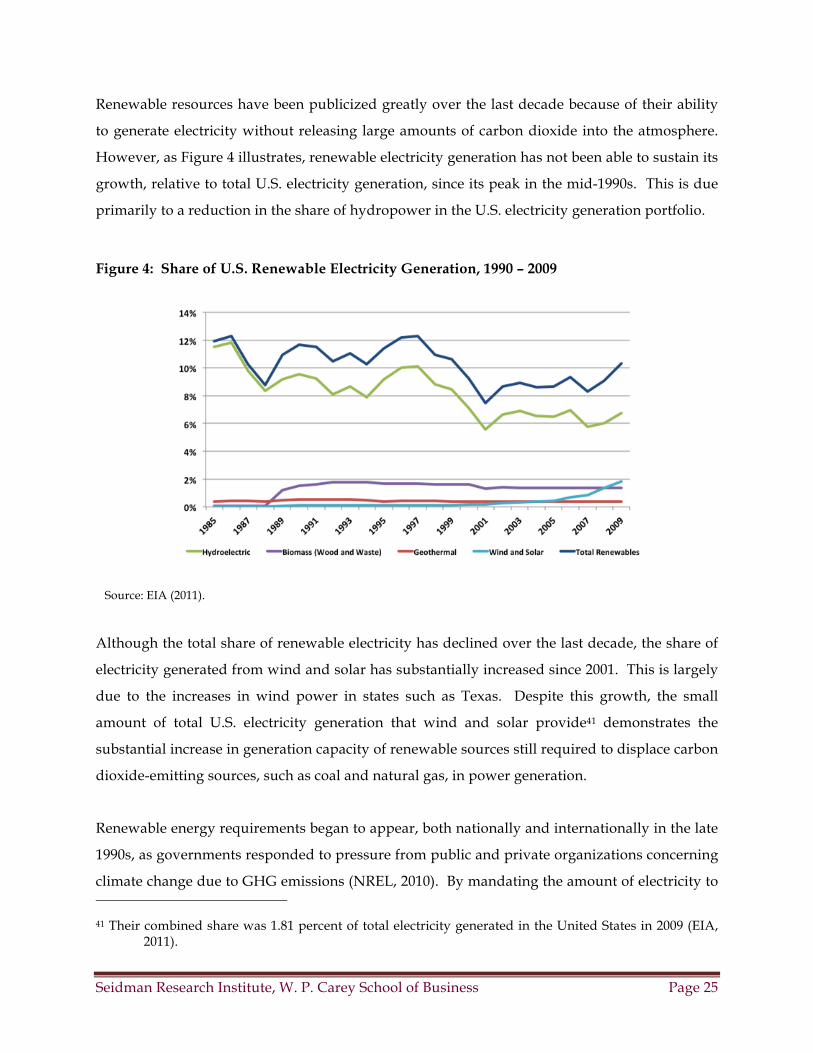
Seidman Research Institute, W. P. Carey School of Business Page 25
Renewable resources have been publicized greatly over the last decade because of their ability
to generate electricity without releasing large amounts of carbon dioxide into the atmosphere.
However, as Figure 4 illustrates, renewable electricity generation has not been able to sustain its
growth, relative to total U.S. electricity generation, since its peak in the mid-1990s. This is due
primarily to a reduction in the share of hydropower in the U.S. electricity generation portfolio.
Figure 4: Share of U.S. Renewable Electricity Generation, 1990 – 2009
Source: EIA (2011).
Although the total share of renewable electricity has declined over the last decade, the share of
electricity generated from wind and solar has substantially increased since 2001. This is largely
due to the increases in wind power in states such as Texas. Despite this growth, the small
amount of total U.S. electricity generation that wind and solar provide41 demonstrates the
substantial increase in generation capacity of renewable sources still required to displace carbon
dioxide-emitting sources, such as coal and natural gas, in power generation.
Renewable energy requirements began to appear, both nationally and internationally in the late
1990s, as governments responded to pressure from public and private organizations concerning
climate change due to GHG emissions (NREL, 2010). By mandating the amount of electricity to
41 Their combined share was 1.81 percent of total electricity generated in the United States in 2009 (EIA, 2011).
Seidman Research Institute, W. P. Carey School of Business Page 26
be generated from renewable sources by a certain date, governments seek to work with
electricity-generating firms to steadily introduce renewable sources into the electricity
generation portfolio.
Renewable energy requirements are relatively simple to monitor and enforce. They require
regulated utilities to generate a certain amount of their total electricity generation from
renewable resources. The standard method of measurement is a percentage of electricity retail
sales (ERS) generated by renewable resources by a target year. Regulators provide rates of
generation required each year to prevent utilities from ramping up renewable generation in the
final year and creating regulatory and production complications. An alternative method of
measurement in use is a required amount of renewable capacity available by a certain date. The
only difference in these two approaches is actual generation versus available capacity,42 which
can be a significant issue for intermittent sources like wind and solar. However, both satisfy the
overall goal of encouraging electricity generation from renewable resources.
The advantage of a regulatory scheme is that it focuses the utilities’ resources on a particular
technology, or group of technologies. In the case of a renewable energy requirement, it ensures
that a percentage of electricity retail sales, or installed capacity, of a particular resource that is in
line with the goals of regulators, will be in use. However, it excludes potential carbon-reduced
sources, such as nuclear and clean coal. The adoption of this mechanism, in conjunction with a
carbon tax or cap-and-trade system, limits the effectiveness of carbon-pricing mechanisms. By
imposing particular technology solutions on the electricity market, electricity generating firms
will be forced to adopt renewable sources, even if they are more expensive and less effective at
meeting the demand profile than potential low-cost forms of generation that do not emit large
amounts of carbon but are not renewable.
42 The percentage of ERS regulatory approach is based on actual electricity generation, while the renewable capacity regulatory approach targets a certain amount of power generation capacity to be installed. For those resources / technologies that have a lower capacity factors (under 40 percent, like wind and solar), the difference in actual contribution of renewables to a jurisdiction’s power resource mix would be significant.
Seidman Research Institute, W. P. Carey School of Business Page 27
3.1.1 Impact on Solar Power
A renewable energy requirement can be a very effective policy for increasing adoption of solar
power. By requiring electricity-generating firms to generate a certain percentage of their
electricity from renewable sources, it eliminates lower cost carbon-free competitors, such as
nuclear. A renewable energy requirement has a greater effect on the adoption of solar power in
states which lack sufficient renewable alternatives to solar, provided they do not purchase
electricity from renewable sources outside the state. As shown in Figure 3, Arizona’s potential
for non-solar renewable power generation is limited. In order to meet the State’s renewable
energy requirement (discussed further in the following section), Arizona utilities (that are
bound by the requirement) are expected to rely heavily on solar power.43 In addition to
promoting solar through requiring renewable generation, several states, including Arizona,44
have a distributed generation requirement. Given the advantage of solar photovoltaic (PV) over
other distributed generation technologies,45 distributed requirements will generate increased
investment in solar power technology and encourage large-scale commercial adoption.
3.1.2 Global Adoption
Renewable energy requirement programs have been adopted by states and countries to compel
electricity generating firms to increase the amount of renewable resources in their generating
portfolio. By looking at the adoption of these programs, both nationally and internationally, we
can determine how widespread their use is and how important they are to the global movement
to reduce carbon emissions.
Due to the widespread adoption of these programs, renewable use in the United States has
substantially increased (NREL, 2010). In the United States, renewable energy requirement
43 Assuming Arizona utilities will not purchase a significant amount of their renewable requirement from outside the state. Arizona utilities currently have power purchase agreements with wind and geothermal energy producers in New Mexico and California.
44 Arizona’s PV requirement is split 50/50 between commercial and residential.
45 In parts of the country, distributed wind generation is available. However, distributed wind turbines pose significant technical and land use challenges. Fuel cell technology has distributed potential as well, but has yet to be adopted commercially (NREL, 2010).
Seidman Research Institute, W. P. Carey School of Business Page 28
programs are typically called Renewable Portfolio Standards (RPS). In absence of a federal RPS
measure in the United States,46 the current adoption of such programs is only at the state level.
As of September 2011, twenty-nine U.S. states and the District of Columbia had an RPS program
in place, and another eight states declared non-mandatory “renewable portfolio goals”. Among
these, a majority of states and the District of Columbia have a percentage ERS requirement,
while four states have a specific capacity or generation amount requirement, or a combination.
The state with the most aggressive RPS target is California, which aims for 33 percent of its ERS
to come from renewable resources by 2020 (Database of State Renewable Energy Incentives,
2011). The full list of state RPS programs is provided in Appendix 3.
The Arizona Renewable Energy Standard (RES), which was enacted in 2006 and became
effective in August 2007, requires that renewable resources constitute 15 percent of electricity
retail sales (ERS) of regulated utilities.47 The program further requires that output from
distributed resources (i.e., non-utility) meet a portion of the total RES. Arizona Public Service
(APS), the largest utility in Arizona, plans to exceed the RES guideline of 5 percent by 2015 by
generating 10 percent of its ERS from renewable sources by 2015 (APS, 2009). Salt River Project
(SRP), the second largest utility in Arizona, is not bound by the RES, but has agreed to mirror its
requirements (SRP, 2010).48 The state’s third largest utility, Tucson Electric Power (TEP), also
exceeded its 2010 requirements under the RES (TEP, 2011). Table 5 summarizes the annual
renewable energy requirements for the Arizona utilities.49
46 For instance, had it been enacted, the Waxman-Markey bill would have created a federal RPS target of 20 percent by 2020, along with a provision for up to 40 percent of this target to be met through investment in energy efficiency measures (All Business, 2009).
47 The Arizona RES superseded a similar rule called the “Environmental Portfolio Standard.”
48 SRP already has significant hydroelectric resources that account for about 6 percent of its ERS.
49 The two investor-owned utilities in Arizona (APS and TEP) constitute 51 percent of ERS in Arizona and SRP accounts for 36 percent (2009 data).
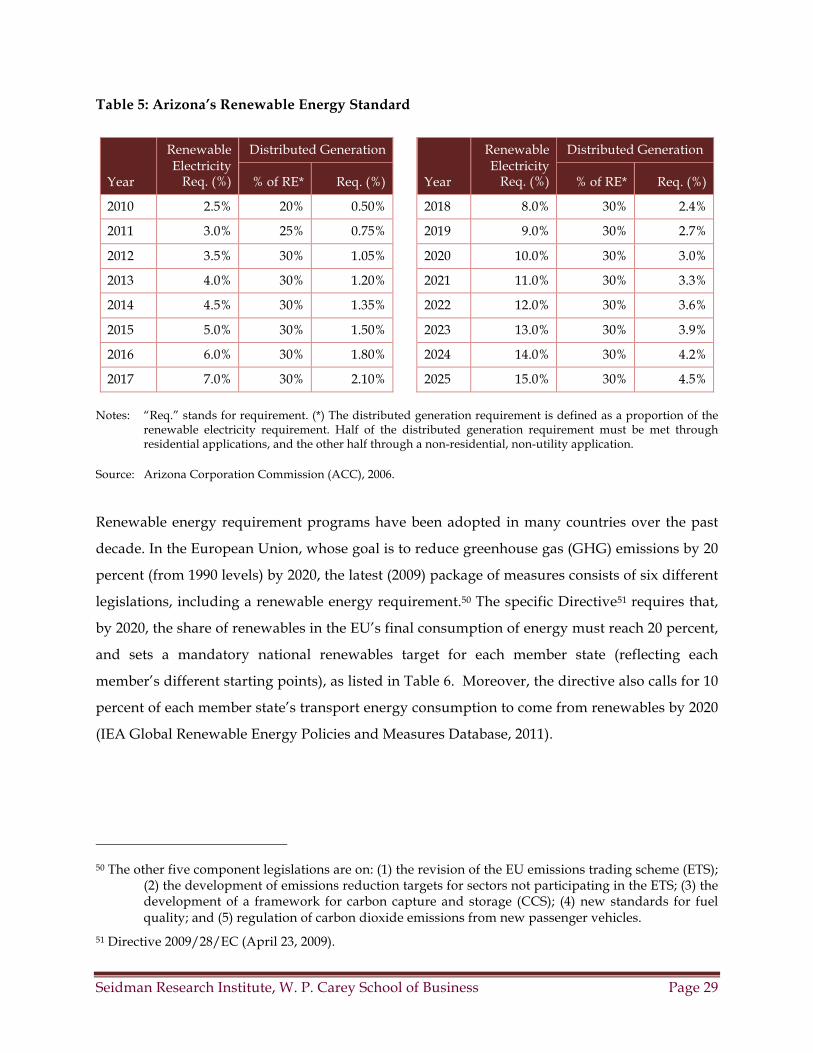
Seidman Research Institute, W. P. Carey School of Business Page 29
Table 5: Arizona’s Renewable Energy Standard
Year
Renewable Electricity
Req. (%)
Distributed Generation
Year
Renewable Electricity
Req. (%)
Distributed Generation
% of RE* Req. (%) % of RE* Req. (%)
2010 2.5% 20% 0.50% 2018 8.0% 30% 2.4%
2011 3.0% 25% 0.75% 2019 9.0% 30% 2.7%
2012 3.5% 30% 1.05% 2020 10.0% 30% 3.0%
2013 4.0% 30% 1.20% 2021 11.0% 30% 3.3%
2014 4.5% 30% 1.35% 2022 12.0% 30% 3.6%
2015 5.0% 30% 1.50% 2023 13.0% 30% 3.9%
2016 6.0% 30% 1.80% 2024 14.0% 30% 4.2%
2017 7.0% 30% 2.10% 2025 15.0% 30% 4.5%
Notes: “Req.” stands for requirement. (*) The distributed generation requirement is defined as a proportion of the renewable electricity requirement. Half of the distributed generation requirement must be met through residential applications, and the other half through a non-residential, non-utility application.
Source: Arizona Corporation Commission (ACC), 2006.
Renewable energy requirement programs have been adopted in many countries over the past
decade. In the European Union, whose goal is to reduce greenhouse gas (GHG) emissions by 20
percent (from 1990 levels) by 2020, the latest (2009) package of measures consists of six different
legislations, including a renewable energy requirement.50 The specific Directive51 requires that,
by 2020, the share of renewables in the EU’s final consumption of energy must reach 20 percent,
and sets a mandatory national renewables target for each member state (reflecting each
member’s different starting points), as listed in Table 6. Moreover, the directive also calls for 10
percent of each member state’s transport energy consumption to come from renewables by 2020
(IEA Global Renewable Energy Policies and Measures Database, 2011).
50 The other five component legislations are on: (1) the revision of the EU emissions trading scheme (ETS); (2) the development of emissions reduction targets for sectors not participating in the ETS; (3) the development of a framework for carbon capture and storage (CCS); (4) new standards for fuel quality; and (5) regulation of carbon dioxide emissions from new passenger vehicles.
51 Directive 2009/28/EC (April 23, 2009).
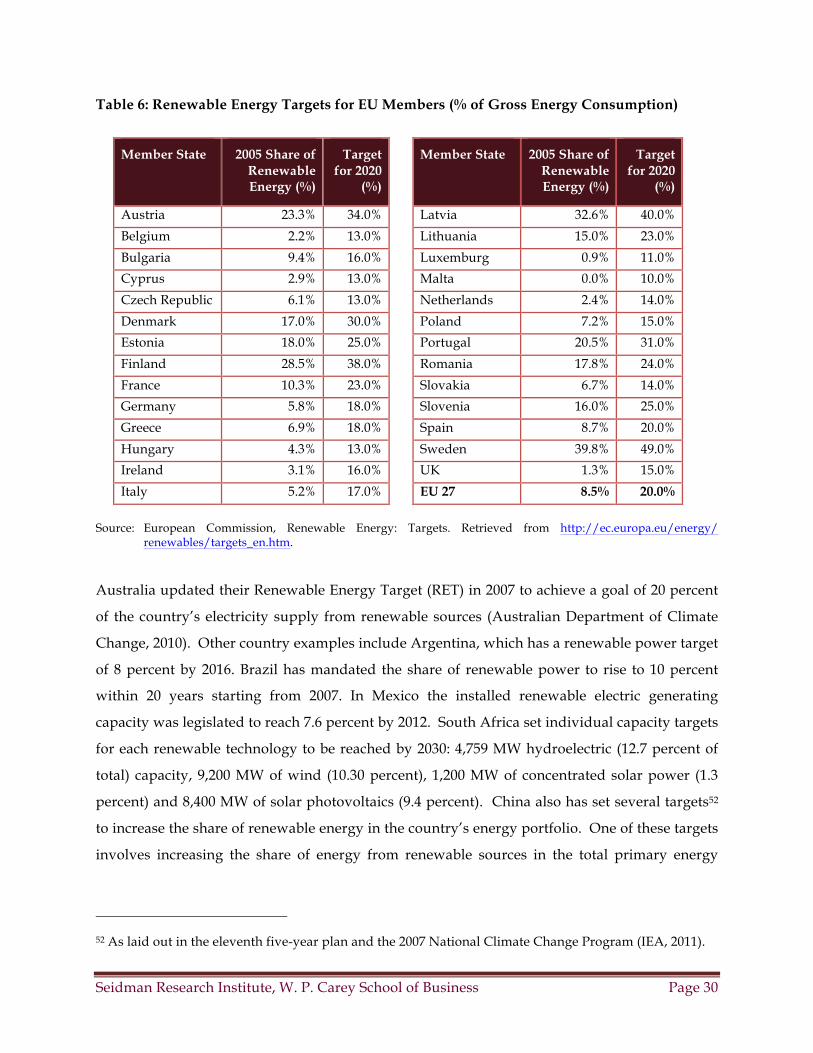
Seidman Research Institute, W. P. Carey School of Business Page 30
Table 6: Renewable Energy Targets for EU Members (% of Gross Energy Consumption)
Member State 2005 Share of Renewable Energy (%)
Target for 2020
(%)
Member State 2005 Share of Renewable Energy (%)
Target for 2020
(%)
Austria 23.3% 34.0% Latvia 32.6% 40.0%
Belgium 2.2% 13.0% Lithuania 15.0% 23.0%
Bulgaria 9.4% 16.0% Luxemburg 0.9% 11.0%
Cyprus 2.9% 13.0% Malta 0.0% 10.0%
Czech Republic 6.1% 13.0% Netherlands 2.4% 14.0%
Denmark 17.0% 30.0% Poland 7.2% 15.0%
Estonia 18.0% 25.0% Portugal 20.5% 31.0%
Finland 28.5% 38.0% Romania 17.8% 24.0%
France 10.3% 23.0% Slovakia 6.7% 14.0%
Germany 5.8% 18.0% Slovenia 16.0% 25.0%
Greece 6.9% 18.0% Spain 8.7% 20.0%
Hungary 4.3% 13.0% Sweden 39.8% 49.0%
Ireland 3.1% 16.0% UK 1.3% 15.0%
Italy 5.2% 17.0% EU 27 8.5% 20.0%
Source: European Commission, Renewable Energy: Targets. Retrieved from http://ec.europa.eu/energy/ renewables/targets_en.htm.
Australia updated their Renewable Energy Target (RET) in 2007 to achieve a goal of 20 percent
of the country’s electricity supply from renewable sources (Australian Department of Climate
Change, 2010). Other country examples include Argentina, which has a renewable power target
of 8 percent by 2016. Brazil has mandated the share of renewable power to rise to 10 percent
within 20 years starting from 2007. In Mexico the installed renewable electric generating
capacity was legislated to reach 7.6 percent by 2012. South Africa set individual capacity targets
for each renewable technology to be reached by 2030: 4,759 MW hydroelectric (12.7 percent of
total) capacity, 9,200 MW of wind (10.30 percent), 1,200 MW of concentrated solar power (1.3
percent) and 8,400 MW of solar photovoltaics (9.4 percent). China also has set several targets52
to increase the share of renewable energy in the country’s energy portfolio. One of these targets
involves increasing the share of energy from renewable sources in the total primary energy
52 As laid out in the eleventh five-year plan and the 2007 National Climate Change Program (IEA, 2011).
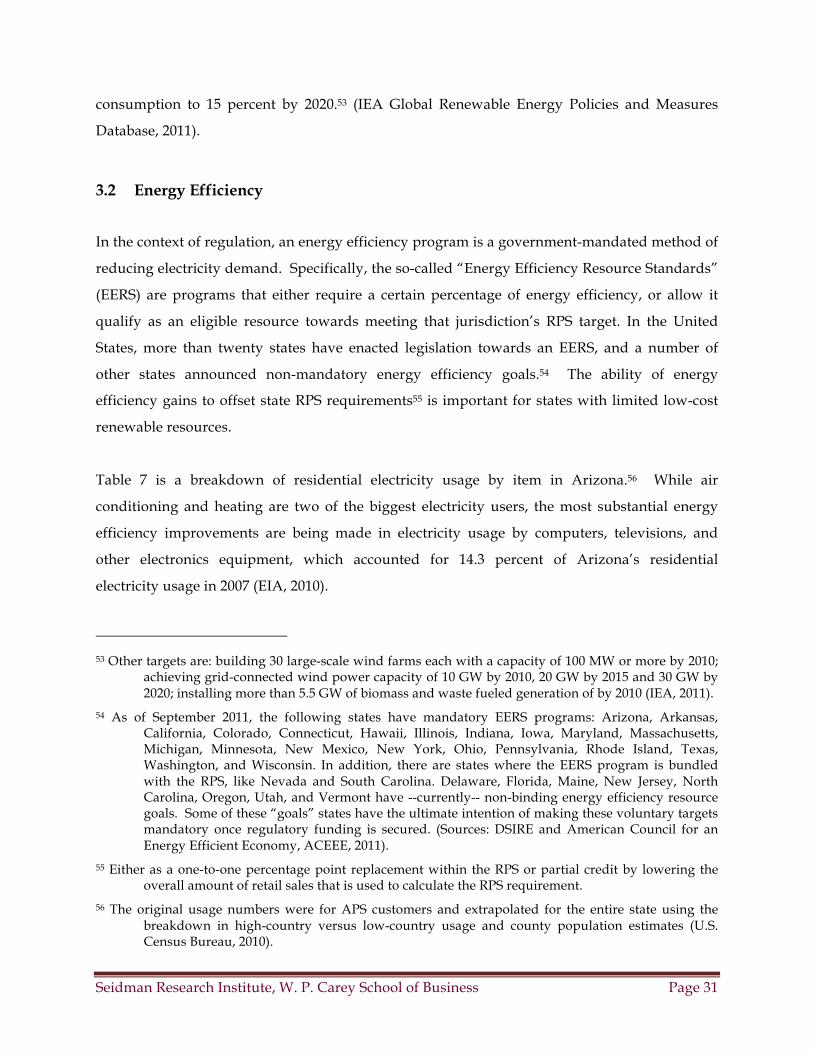
Seidman Research Institute, W. P. Carey School of Business Page 31
consumption to 15 percent by 2020.53 (IEA Global Renewable Energy Policies and Measures
Database, 2011).
3.2 Energy Efficiency
In the context of regulation, an energy efficiency program is a government-mandated method of
reducing electricity demand. Specifically, the so-called “Energy Efficiency Resource Standards”
(EERS) are programs that either require a certain percentage of energy efficiency, or allow it
qualify as an eligible resource towards meeting that jurisdiction’s RPS target. In the United
States, more than twenty states have enacted legislation towards an EERS, and a number of
other states announced non-mandatory energy efficiency goals.54 The ability of energy
efficiency gains to offset state RPS requirements55 is important for states with limited low-cost
renewable resources.
Table 7 is a breakdown of residential electricity usage by item in Arizona.56 While air
conditioning and heating are two of the biggest electricity users, the most substantial energy
efficiency improvements are being made in electricity usage by computers, televisions, and
other electronics equipment, which accounted for 14.3 percent of Arizona’s residential
electricity usage in 2007 (EIA, 2010).
53 Other targets are: building 30 large-scale wind farms each with a capacity of 100 MW or more by 2010; achieving grid-connected wind power capacity of 10 GW by 2010, 20 GW by 2015 and 30 GW by 2020; installing more than 5.5 GW of biomass and waste fueled generation of by 2010 (IEA, 2011).
54 As of September 2011, the following states have mandatory EERS programs: Arizona, Arkansas, California, Colorado, Connecticut, Hawaii, Illinois, Indiana, Iowa, Maryland, Massachusetts, Michigan, Minnesota, New Mexico, New York, Ohio, Pennsylvania, Rhode Island, Texas, Washington, and Wisconsin. In addition, there are states where the EERS program is bundled with the RPS, like Nevada and South Carolina. Delaware, Florida, Maine, New Jersey, North Carolina, Oregon, Utah, and Vermont have --currently-- non-binding energy efficiency resource goals. Some of these “goals” states have the ultimate intention of making these voluntary targets mandatory once regulatory funding is secured. (Sources: DSIRE and American Council for an Energy Efficient Economy, ACEEE, 2011).
55 Either as a one-to-one percentage point replacement within the RPS or partial credit by lowering the overall amount of retail sales that is used to calculate the RPS requirement.
56 The original usage numbers were for APS customers and extrapolated for the entire state using the breakdown in high-country versus low-country usage and county population estimates (U.S. Census Bureau, 2010).
Seidman Research Institute, W. P. Carey School of Business Page 32
Table 7: Breakdown of Residential Electricity Usage in Arizona, 200757
Appliance Usage
Central Air Conditioning 39.3%
Hot Water Heating 10.3%
Refrigeration 9.6%
Space Heating 8.5%
Room Air Conditioning 4.4%
Lighting 3.5%
Freezer 2.7%
Clothes Washer 2.7%
Dishwasher 2.7%
Pool Pump 2.7%
Other58 13.8%
Source: ICF International. The total may be different from 100% due to independent rounding of categories.
Energy efficiency programs are not specifically a technology standard, since the government
does not specify the technology used to reduce electricity demand. Rather, electricity
generating firms are allowed the freedom to encourage any program or technology necessary to
reduce demand to stipulated levels. Intervening in the market may leads to inefficiency, but in
the case of energy efficiency programs, it has turned out to be efficient due to the flexibility of
each program. The potential for significant gains from energy efficiency was suggested by the
Waxman-Markey bill, which would have allowed up to 40 percent of the national renewable
target to be met from such programs. The reason significant energy efficiency gains are
available is because electricity consumers, who have the greatest incentive to buy energy
efficient devices, do not always make the efficient choice, largely due to information deficiencies
(U.S. DOE Energy Efficiency and Renewable Energy (EERE), 2010).
An example of the lack of consumer oversight creating inefficiency is the power adaptor, which
converts high-voltage alternating current from the main line to low-voltage direct current for
electronic gadgets. Until five years ago, a copper wire was used in this conversion and as much
57 The data are taken from a study of APS service areas and, therefore, do not include any SRP, TEP, or co-op customers. However, given that APS serves both low and high country customers, the numbers are good estimates of overall state consumption.
58 Other includes plug load, computer equipment, etc.
Seidman Research Institute, W. P. Carey School of Business Page 33
as 80 percent of electricity was lost. Converting the energy using integrated circuits only cost 30
percent more than the copper wiring and reduced losses to less than 20 percent. However,
these devices cost $2 or less, making a 30% increase in cost unnecessary, provided that the
market did not value integrated circuits over copper wires. Noticing the inefficiency in the
process, regulators adopted rules that required integrated circuits for use in the United States.
The switch, which was adopted globally, has decreased power consumption worth around $2
billion each year, or 13 million tons of carbon dioxide (The Economist, 2009).
A concern regarding energy efficiency programs, known as the rebound effect, is that
improvements in energy efficiency actually lead to greater use of energy. First used to describe
the phenomenon of a more efficient steam engine increasing coal use in Britain in 1865, the
theory is applicable to energy efficiency gains. By making energy appear cheaper than other
inputs and increasing economic growth, energy efficiency increases the use of energy. For
example, if there is an improvement in the energy use of air conditioners, individuals who are
deterred by the cost of electricity due to running the air conditioner will use it more because it is
cheaper. As a result, the reduction in energy use due to improvements in efficiency is less than
one to one.
3.2.1 Impact on Solar Power
Without considering RPS requirements, energy efficiency programs are an alternative method
of satisfying electricity demand without emitting carbon. Each watt-hour of electricity saved
through efficiency techniques is one less watt-hour that electricity generating firms must
provide. In a state like California, which generates most of its electricity from natural gas,
renewable sources, and nuclear, the net environmental benefit of energy efficiency programs
might be less than it would be in a state like Utah, which generates a majority of its electricity
from coal and does not have a mandatory RPS program. In other words, each state (or
jurisdiction) would evaluate the environmental benefits of energy efficiency differently with
respect to solar, depending on the existence and structure of an RPS program and its existing
generation portfolio.
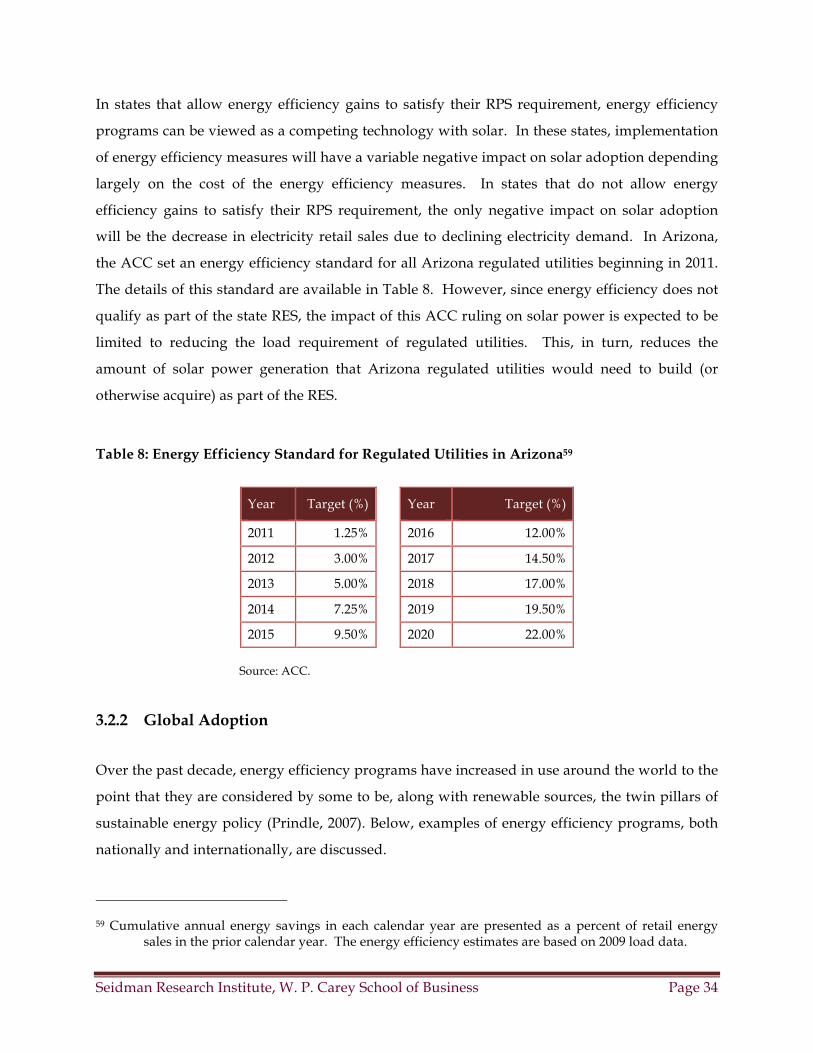
Seidman Research Institute, W. P. Carey School of Business Page 34
In states that allow energy efficiency gains to satisfy their RPS requirement, energy efficiency
programs can be viewed as a competing technology with solar. In these states, implementation
of energy efficiency measures will have a variable negative impact on solar adoption depending
largely on the cost of the energy efficiency measures. In states that do not allow energy
efficiency gains to satisfy their RPS requirement, the only negative impact on solar adoption
will be the decrease in electricity retail sales due to declining electricity demand. In Arizona,
the ACC set an energy efficiency standard for all Arizona regulated utilities beginning in 2011.
The details of this standard are available in Table 8. However, since energy efficiency does not
qualify as part of the state RES, the impact of this ACC ruling on solar power is expected to be
limited to reducing the load requirement of regulated utilities. This, in turn, reduces the
amount of solar power generation that Arizona regulated utilities would need to build (or
otherwise acquire) as part of the RES.
Table 8: Energy Efficiency Standard for Regulated Utilities in Arizona59
Year Target (%) Year Target (%)
2011 1.25% 2016 12.00%
2012 3.00% 2017 14.50%
2013 5.00% 2018 17.00%
2014 7.25% 2019 19.50%
2015 9.50% 2020 22.00%
Source: ACC.
3.2.2 Global Adoption
Over the past decade, energy efficiency programs have increased in use around the world to the
point that they are considered by some to be, along with renewable sources, the twin pillars of
sustainable energy policy (Prindle, 2007). Below, examples of energy efficiency programs, both
nationally and internationally, are discussed.
59 Cumulative annual energy savings in each calendar year are presented as a percent of retail energy sales in the prior calendar year. The energy efficiency estimates are based on 2009 load data.
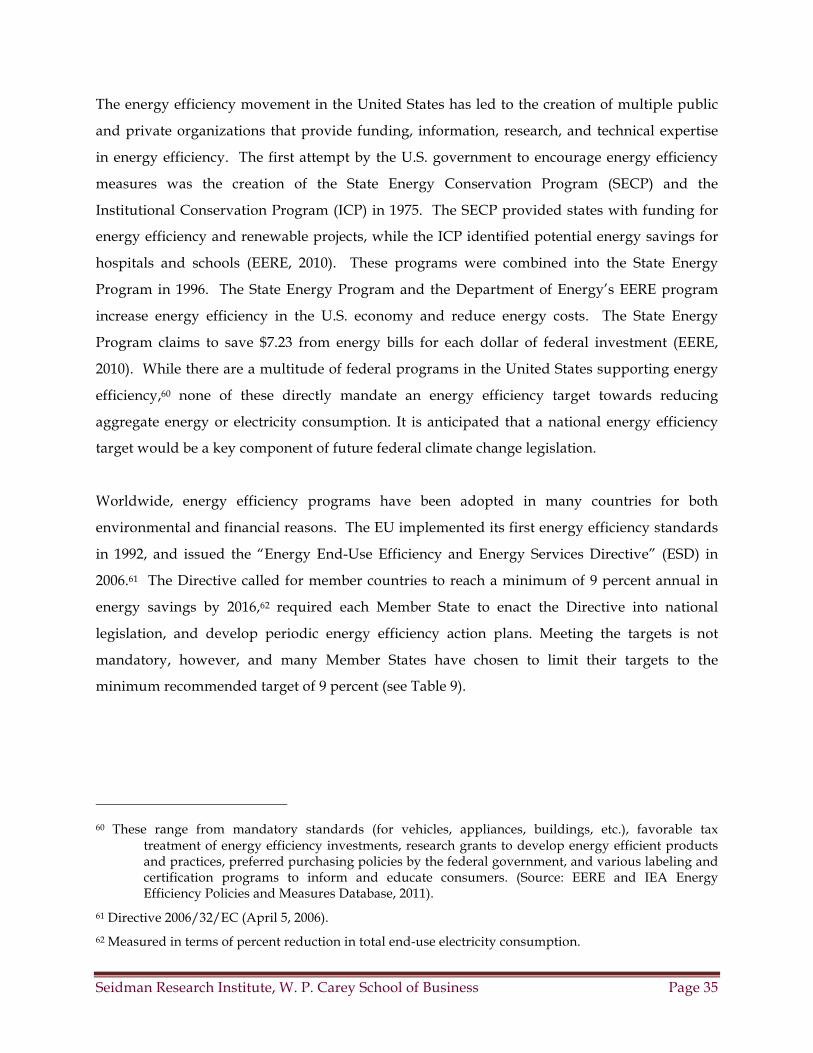
Seidman Research Institute, W. P. Carey School of Business Page 35
The energy efficiency movement in the United States has led to the creation of multiple public
and private organizations that provide funding, information, research, and technical expertise
in energy efficiency. The first attempt by the U.S. government to encourage energy efficiency
measures was the creation of the State Energy Conservation Program (SECP) and the
Institutional Conservation Program (ICP) in 1975. The SECP provided states with funding for
energy efficiency and renewable projects, while the ICP identified potential energy savings for
hospitals and schools (EERE, 2010). These programs were combined into the State Energy
Program in 1996. The State Energy Program and the Department of Energy’s EERE program
increase energy efficiency in the U.S. economy and reduce energy costs. The State Energy
Program claims to save $7.23 from energy bills for each dollar of federal investment (EERE,
2010). While there are a multitude of federal programs in the United States supporting energy
efficiency,60 none of these directly mandate an energy efficiency target towards reducing
aggregate energy or electricity consumption. It is anticipated that a national energy efficiency
target would be a key component of future federal climate change legislation.
Worldwide, energy efficiency programs have been adopted in many countries for both
environmental and financial reasons. The EU implemented its first energy efficiency standards
in 1992, and issued the “Energy End-Use Efficiency and Energy Services Directive” (ESD) in
2006.61 The Directive called for member countries to reach a minimum of 9 percent annual in
energy savings by 2016,62 required each Member State to enact the Directive into national
legislation, and develop periodic energy efficiency action plans. Meeting the targets is not
mandatory, however, and many Member States have chosen to limit their targets to the
minimum recommended target of 9 percent (see Table 9).
60 These range from mandatory standards (for vehicles, appliances, buildings, etc.), favorable tax treatment of energy efficiency investments, research grants to develop energy efficient products and practices, preferred purchasing policies by the federal government, and various labeling and certification programs to inform and educate consumers. (Source: EERE and IEA Energy Efficiency Policies and Measures Database, 2011).
61 Directive 2006/32/EC (April 5, 2006).
62 Measured in terms of percent reduction in total end-use electricity consumption.
Seidman Research Institute, W. P. Carey School of Business Page 36
Table 9: Energy Savings Targets of EU Member States until 2016
Member State Target for 2016 Member State Target for 2016
Austria 9.0% Latvia 9.0%
Belgium 9.0% Lithuania 9.7%
Bulgaria 9.0% Luxemburg 9.0%
Cyprus 10.0% Malta 9.0%
Czech Republic 9.0% Netherlands 9.0%
Denmark* 9.2% - 10.7% Poland 9.0%
Estonia 9.0% Portugal 9.8%
Finland 9.0% Romania 13.5%
France 9.0% Slovakia 9.0%
Germany 9.0% Slovenia 9.0%
Greece 9.0% Spain 11.4%
Hungary 9.0% Sweden 9.0%
Ireland 9.0% UK 9.0%
Italy 9.6% EU 27 9.5% - 10.7%
(*) Denmark has developed a high and a low target.
Source: European Council for an Energy Efficient Economy, Energy Efficiency Watch Project (2009).
In June 2011, the European Commission has put forth a new plan with much stricter energy
efficiency targets that calls for a 20 percent reduction in primary energy consumption by 2020
(European Commission, 2011). Under this proposal, the member country targets would remain
voluntary until 2014, and should the Commission decide they are not sufficient to achieve the
EU-wide 20 percent goal, mandatory energy efficiency targets would replace them.
China has made energy conservation a primary focus in its five-year plan for 2006 through 2010.
The country is hoping to focus particularly on highly-consuming industries in the industrial
sector, which include power, iron, steel, and others. The focus will be particularly beneficial to
the environment due to China’s reliance on coal for much of its energy (Post Carbon Institute,
2010). Among other examples, we can cite Brazil’s plans for a 10 percent reduction in electricity
consumption by 2030; South Africa’s 12 percent reduction target of total energy demand; and
Australia and Japan’s national strategy/policy declarations to improve energy efficiency.
Seidman Research Institute, W. P. Carey School of Business Page 37
3.3 Loading Order
Loading order is a method of regulation that seeks to meet incremental electricity demand first
with a set of preferred resource options that take priority over other, less preferred generation
technologies. California developed the first loading order system in 2003 with the goal of
shifting the priorities of the electricity generation sector (California Energy Commission (CEC),
2005). In the California loading order system, energy efficiency, demand response, renewable
resources, and distributed generation are given preference over other resources for meeting
increases in future electricity demand. The other resources would include nuclear as well as
coal, natural gas, and petroleum with or without carbon emission reducing technology. By
making this distinction, California regulators are signaling their preference for renewable
resources and reducing electricity demand as tools for mitigating carbon emissions over nuclear
and clean coal and natural gas.
Load ordering is not a perfect system. Like any other regulatory mechanism that restricts
utilities from making independent generation mix decisions, it might lead to distorted or
unintended economic (consumption and investment) outcomes. Utilities have been reticent in
embracing the methods of meeting future electricity demand detailed in the loading order for
several reasons. First, integrating loading order resources requires significantly increased
cooperation and planning which has been difficult to coordinate and puts further strain on
regulatory and utility resources. Second, regulatory and legal challenges, such as low demand
response to current regulation, intricate building codes and lack of incentives for utility
participation, prevent the California system from running optimally. The third reason for
utility reticence is the significant pressure placed on the infrastructure. Examples include the
requirement of metering for demand response and the ability of utilities to manage significant
amounts of power from intermittent resources. Lastly, a system for monitoring and evaluating
demand response and distributed generation systems is not in place, making the process
extremely difficult to manage.
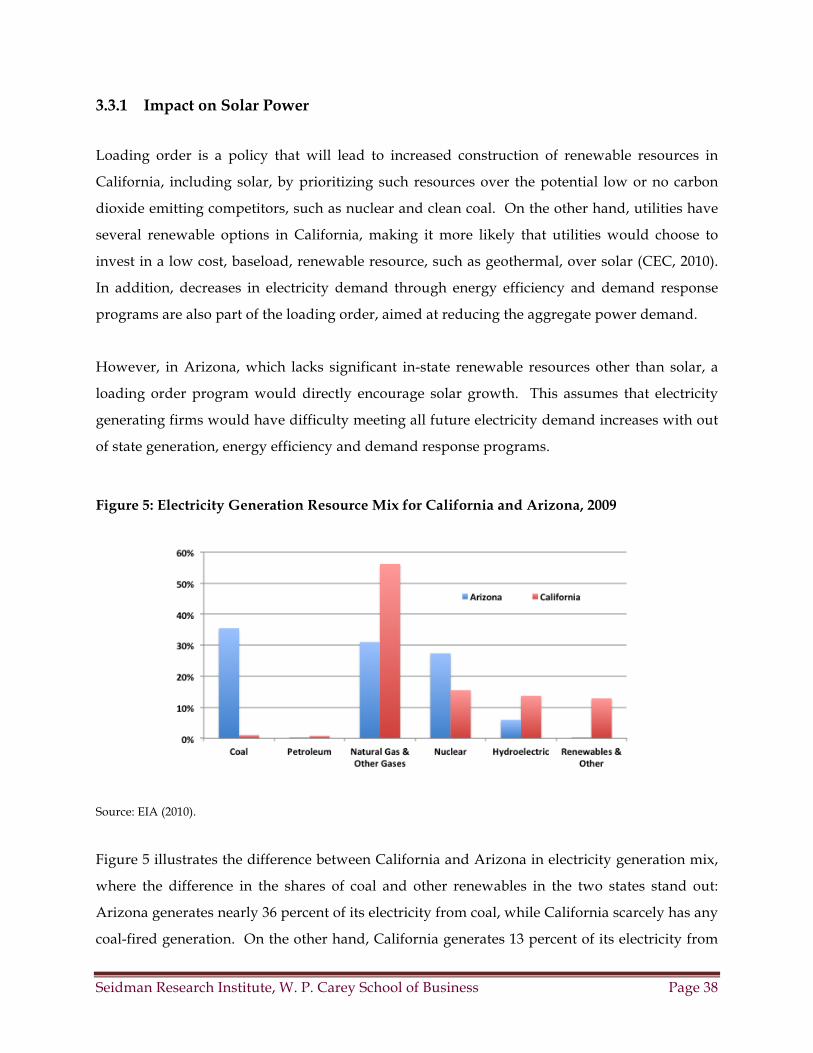
Seidman Research Institute, W. P. Carey School of Business Page 38
3.3.1 Impact on Solar Power
Loading order is a policy that will lead to increased construction of renewable resources in
California, including solar, by prioritizing such resources over the potential low or no carbon
dioxide emitting competitors, such as nuclear and clean coal. On the other hand, utilities have
several renewable options in California, making it more likely that utilities would choose to
invest in a low cost, baseload, renewable resource, such as geothermal, over solar (CEC, 2010).
In addition, decreases in electricity demand through energy efficiency and demand response
programs are also part of the loading order, aimed at reducing the aggregate power demand.
However, in Arizona, which lacks significant in-state renewable resources other than solar, a
loading order program would directly encourage solar growth. This assumes that electricity
generating firms would have difficulty meeting all future electricity demand increases with out
of state generation, energy efficiency and demand response programs.
Figure 5: Electricity Generation Resource Mix for California and Arizona, 2009
Source: EIA (2010).
Figure 5 illustrates the difference between California and Arizona in electricity generation mix,
where the difference in the shares of coal and other renewables in the two states stand out:
Arizona generates nearly 36 percent of its electricity from coal, while California scarcely has any
coal-fired generation. On the other hand, California generates 13 percent of its electricity from

Seidman Research Institute, W. P. Carey School of Business Page 39
renewable resources (other than hydropower), compared to 0.2 percent for Arizona. Therefore,
the difference in the electricity generation resource mix suggests that a loading order system
would be more successful in California than Arizona, where such a program could meet stiff
opposition as it would aim to displace the state’s primary source of electricity.
3.3.2 Global Adoption
To date, California has the longest experience with a loading order program. Following in
California’s footsteps, Rhode Island and Maine have also enacted loading order programs (in
2007 and 2010, respectively), and Massachusetts is considering a loading order program
(American Council for an Energy Efficient Economy, ACEEE, 2011). Other states and
jurisdictions require energy efficiency to factor into the long-term resource plans of regional
utilities, and such plans may eventually transform into mandatory loading order programs. For
instance, the four-state63 Northwest Power and Conservation Council identified energy
efficiency as “the cheapest and most readily available energy resource for meeting load
growth—enough to meet all load growth through 2012 and about 50 percent of load growth
through 2024” (ACEEE, 2011). Given the worldwide impetus for increased renewable energy
usage and the potential gains available from energy efficiency, more states and countries may
consider loading order programs to secure gains from energy efficiency in the future.
4 Conclusion
Government intervention in the electricity generation market is one option to correct for
electricity generation and consumption choices that are not socially optimal. Regulators have
the choice of intervening directly, through renewable requirements, energy efficiency programs,
and loading order, or indirectly, through carbon taxes and cap-and-trade. The impact of these
programs on electricity prices and the economy are at the center of the debate concerning which
policy to adopt. In the case of either carbon pricing scheme and renewable requirement
programs, intervention in the market will move electricity generating firms away from low-cost,
carbon-emitting sources, such as coal, to more costly, carbon-reduced sources, such as solar.
63 Washington, Oregon, Idaho, and Montana.
Seidman Research Institute, W. P. Carey School of Business Page 40
This shift will result in higher electricity prices, which will decrease electricity consumption as
individuals respond to the increasing cost of electricity.
The severity of the impact on electricity prices depends on the difference in levelized cost
between the existing generation portfolio and the future portfolio. The new portfolio will be
shaped by the technologies determined by the intervention mechanism in use. Therefore, the
decision of which intervention mechanism to promote has far-reaching consequences. The
indirect mechanism uses a carbon price to shift electricity generation away from carbon-
emitting sources. The implementation of an effective carbon price leaves generation mix
decisions to electricity generating firms by setting a price that is high enough for these firms to
choose generating technologies that emit lower amounts of carbon.
Direct intervention mechanisms dictate particular technologies or standards for the market to
adopt. In the movement to reduce carbon emissions, direct mechanisms have changed the
decision-making process for electricity generating firms. By not allowing particular
technologies, regulators essentially signal that electricity generating firms will not
independently choose those technologies desired by regulators.
In choosing which mechanism is the preferred method for lowering carbon emissions from the
electricity industry, the answer lies in determining the better decision-maker: the electricity
market or the regulating body. If the only goals of a carbon-reduction policy are to reduce
carbon while limiting the increase in electricity prices, then the electricity market is best suited
for this task. The market has chosen low-cost electricity generating technologies for decades
and, provided that there is a deterrent in place for carbon emissions, will choose the correct
technology. However, if there are additional factors involved, such as national security and
concerns over nuclear waste disposal, then there is a purpose for direct government
intervention.
Implications for Solar Power
The choice between direct and indirect mechanisms has a significant effect on solar adoption.
The spread of renewable energy requirements, in both the U.S. and internationally, has been
Seidman Research Institute, W. P. Carey School of Business Page 41
important for the development of solar (NREL, 2010). The existence of these requirements
prevents low-cost technologies, such as coal, natural gas, and nuclear, from competing with
solar. The continued use of renewable energy requirements, particularly in solar resource-rich
states like Arizona and California, will spur development in solar power. However, if these
requirements are replaced with a carbon pricing mechanism, solar will be competing with
nuclear, natural gas, clean coal, and clean natural gas as well as other renewable energy sources.
Therefore, for the express purpose of developing of solar power, a direct mechanism to reduce
carbon dioxide emissions is preferable to an indirect mechanism.
Seidman Research Institute, W. P. Carey School of Business Page 42
Glossary64
Baseload plant: A plant which is normally operated to take all or part of the minimum load of a
system, and which consequently produces electricity at an essentially constant rate and runs
continuously. These units are operated to maximize system mechanical and thermal efficiency
and minimize system operating costs.
British thermal unit: The quantity of heat required to raise the temperature of 1 pound of liquid
water by 1 degree Fahrenheit at the temperature at which water has its greatest density
(approximately 39 degrees Fahrenheit).
Carbon cycle: All carbon sinks and exchanges of carbon from one sink to another by various
chemical, physical, geological, and biological processes.
Carbon dioxide (CO2): A colorless, odorless, non-poisonous gas that is a normal part of Earth's
atmosphere. Carbon dioxide is a product of fossil-fuel combustion as well as other processes. It
is considered a greenhouse gas as it traps heat (infrared energy) radiated by the Earth into the
atmosphere and thereby contributes to the potential for global warming. The global warming
potential of other greenhouse gases is measured in relation to that of carbon dioxide, which by
international scientific convention is assigned a value of one.
Carbon intensity: The amount of carbon by weight emitted per unit of energy consumed. A
common measure of carbon intensity is weight of carbon per British thermal unit (Btu) of
energy. When there is only one fossil fuel under consideration, the carbon intensity and the
emissions coefficient are identical. When there are several fuels, carbon intensity is based on
their combined emissions coefficients weighted by their energy consumption levels.
Carbon sequestration: The fixation of atmospheric carbon dioxide in a carbon sink through
biological or physical processes.
64 Retrieved from the EIA Glossary.
Seidman Research Institute, W. P. Carey School of Business Page 43
Clean Development Mechanism (CDM): A Kyoto Protocol program that enables industrialized
countries to finance emissions-avoiding projects in developing countries and receive credit for
reductions achieved against their own emissions limitation targets.
Climate change: A term used to refer to all forms of climatic inconsistency, but especially to
significant change from one prevailing climatic condition to another. In some cases, “climate
change” has been used synonymously with the term “global warming”; scientists, however,
tend to use the term in a wider sense inclusive of natural changes in climate, including climatic
cooling.
Combined cycle: An electric generating technology in which electricity is produced from
otherwise lost waste heat exiting from one or more gas (combustion) turbines. The exiting heat
is routed to a conventional boiler or to a heat recovery steam generator for utilization by a
steam turbine in the production of electricity. This process increases the efficiency of the electric
generating unit.
Global warming: An increase in the near surface temperature of the Earth. Global warming has
occurred in the distant past as the result of natural influences, but the term is today most often
used to refer to the warming some scientists predict will occur as a result of increased
anthropogenic emissions of greenhouse gases.
Greenhouse effect: The result of water vapor, carbon dioxide, and other atmospheric gases
trapping radiant energy, thereby keeping the earth's surface warmer than it would otherwise
be. Greenhouse gases within the lower levels of the atmosphere trap this radiation, which
would otherwise escape into space, and subsequent re-radiation of some of this energy back to
the Earth maintains higher surface temperatures than would occur if the gases were absent.
Greenhouse gases (GHG): Those gases, such as water vapor, carbon dioxide, nitrous oxide,
methane, hydrofluorocarbons (HFCs), perfluorocarbons (PFCs) and sulfur hexafluoride, that are
transparent to solar (short-wave) radiation but opaque to long-wave (infrared) radiation, thus
preventing long-wave radiant energy from leaving Earth's atmosphere. The net effect is a
trapping of absorbed radiation and a tendency to warm the planet's surface.
Seidman Research Institute, W. P. Carey School of Business Page 44
Heat rate: A measure of generating station thermal efficiency commonly stated as Btu per kWh.
Hydrofluorocarbons (HFCs): A group of man-made chemicals composed of one or two carbon
atoms and varying numbers of hydrogen and fluorine atoms. Most HFCs have 100-year Global
Warming Potentials in the thousands.
Integrated gasification-combined cycle technology: Coal, water, and oxygen are fed to a
gasifier, which produces syngas. This medium-Btu gas is cleaned (particulates and sulfur
compounds removed) and is fed to a gas turbine. The hot exhaust of the gas turbine and heat
recovered from the gasification process are routed through a heat-recovery routed through a
heat-recovery generator to produce steam, which drives a steam turbine to produce electricity.
Kyoto Protocol: The result of negotiations at the third Conference of the Parties in Kyoto, Japan,
in December of 1997. The Kyoto Protocol sets binding greenhouse gas emissions targets for
countries that sign and ratify the agreement. The gases covered under the Protocol include
carbon dioxide, methane, nitrous oxide, hydrofluorocarbons (HFCs), perfluorocarbons (PFCs)
and sulfur hexafluoride.
Levelized cost: The present value of the total cost of building and operating a generating plant
over its economic life, converted to equal annual payments. Costs are levelized in real dollars.
Perfluorocarbons (PFCs): A group of man-made chemicals composed of one or two carbon
atoms and four to six fluorine atoms, containing no chlorine. PFCs have no commercial uses
and are emitted as a byproduct of aluminum smelting and semiconductor manufacturing. PFCs
have very high 100-year Global Warming Potentials and are very long-lived in the atmosphere.
Sulfur dioxide (SO2): A toxic, irritating, colorless gas soluble in water, alcohol, and ether. Used
as a chemical intermediate, in paper pulping and ore refining, and as a solvent.
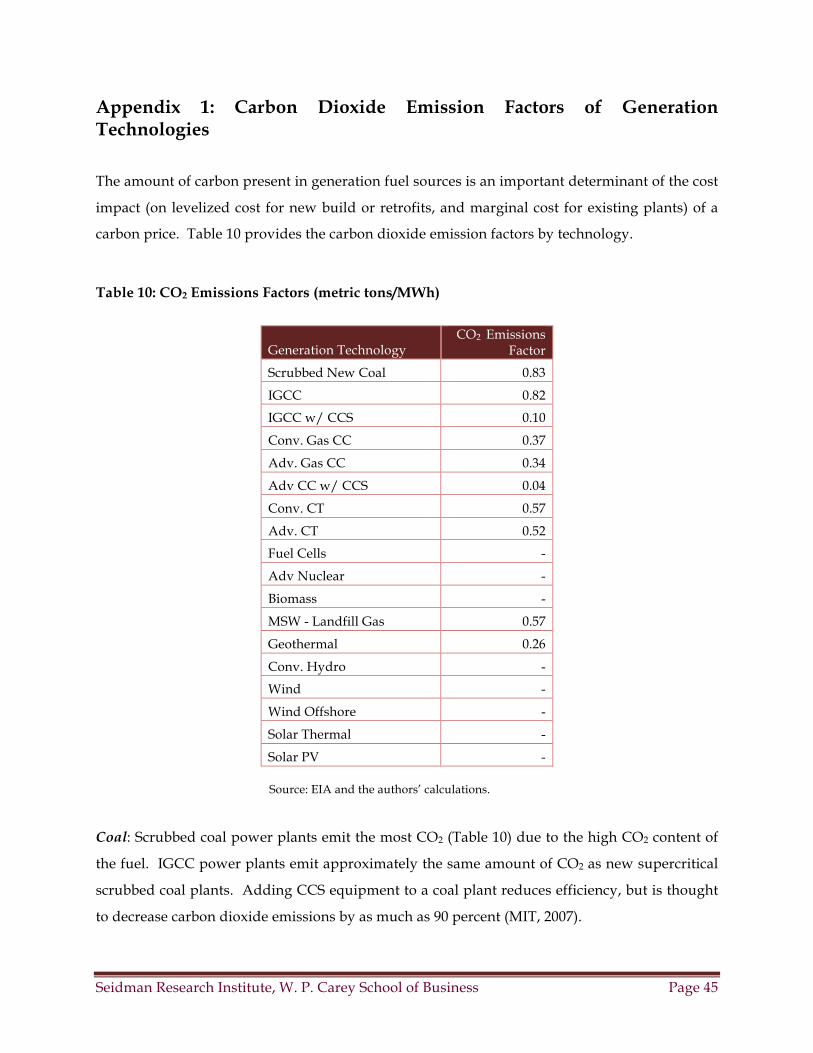
Seidman Research Institute, W. P. Carey School of Business Page 45
Appendix 1: Carbon Dioxide Emission Factors of Generation Technologies
The amount of carbon present in generation fuel sources is an important determinant of the cost
impact (on levelized cost for new build or retrofits, and marginal cost for existing plants) of a
carbon price. Table 10 provides the carbon dioxide emission factors by technology.
Table 10: CO2 Emissions Factors (metric tons/MWh)
Generation Technology CO2 Emissions
Factor
Scrubbed New Coal 0.83
IGCC 0.82
IGCC w/ CCS 0.10
Conv. Gas CC 0.37
Adv. Gas CC 0.34
Adv CC w/ CCS 0.04
Conv. CT 0.57
Adv. CT 0.52
Fuel Cells -
Adv Nuclear -
Biomass -
MSW - Landfill Gas 0.57
Geothermal 0.26
Conv. Hydro -
Wind -
Wind Offshore -
Solar Thermal -
Solar PV -
Source: EIA and the authors’ calculations.
Coal: Scrubbed coal power plants emit the most CO2 (Table 10) due to the high CO2 content of
the fuel. IGCC power plants emit approximately the same amount of CO2 as new supercritical
scrubbed coal plants. Adding CCS equipment to a coal plant reduces efficiency, but is thought
to decrease carbon dioxide emissions by as much as 90 percent (MIT, 2007).
Seidman Research Institute, W. P. Carey School of Business Page 46
Natural Gas: Natural gas is used as fuel in both CT and combined cycle CC plants. The
increased efficiency of CC plants reduces carbon emissions in comparison with CT plants. CCS
is thought to decrease carbon dioxide emissions from natural gas power plants by as much as 90
percent (MIT, 2007).
Oil/Petroleum: Petroleum-fired power plants are used mainly in the United States as peaking
plants due to the rising price of oil. Oil is only suitable for combustion turbine plants and uses
several different types of oil to fuel petroleum-fired power plants, including petroleum coke,
distillate oil, residual oil, and others. The high carbon dioxide emission level is due to
petroleum coke, which emits greater than 112 metric tons per billion Btu (EIA, 2009).
Fuel Cells: Fuel cells are able to use natural gas as well as hydrogen as a fuel. Hydrogen-fueled
cells do not have carbon dioxide emissions during their operation. However, hydrogen itself is
generally obtained from either natural gas or coal (National Hydrogen Association, 2009), and
this refining process does result in carbon dioxide emissions. It is possible to make hydrogen
using renewable sources such as solar, wind and biomass, but hydrogen production is currently
dominated by fuels that emit carbon dioxide.
Uranium: Nuclear power plants use uranium-235 as a fuel source (EIA, 2009). While there are
safety concerns with the disposal of nuclear waste, the electricity generation process in nuclear
plants emits no carbon dioxide. Among all the non-carbon dioxide emitting resources used to
generate electricity in the United States, nuclear energy is the most used.65
Biomass: Biomass power plants burn wood and wood waste to generate electricity. While this
process does emit carbon dioxide, since the resources are part of the living carbon cycle, the
process is considered not to add to the build-up of greenhouse gases (EPA, 2009). This “carbon-
neutral” feature of biomass has been subject of debate as more and more jurisdictions treat their
biomass stock (forests) as a renewable resource.66
65 In 2009, the United States generated 20.2% of its electricity from nuclear power. Hydroelectricity is the second most used non-carbon dioxide emitting resource (6.8%) (EIA, 2011).
66 In a 2010 study, researchers found that the use of forests as biomass for power generation (mainly due to the low thermal efficiency of the process) created a larger “carbon debt” over coal, and that debt took longer to pay (via the growth of new forest), than originally thought. The study also
Seidman Research Institute, W. P. Carey School of Business Page 47
MSW-Landfill Gas: Municipal solid waste (MSW) and landfill gas are used as bio-fuels to
generate electricity. Both types of power plants are useful in capturing and burning potentially
harmful methane from reaching the atmosphere. The process does emit a substantial amount of
carbon dioxide into the atmosphere.
Geothermal: Geothermal power plants use geothermal heat from under the Earth’s surface to
generate electricity. This process emits a small amount of carbon dioxide into the atmosphere.
Wind: Wind turbines are driven by wind currents and are carbon dioxide emission free.
Water: Hydroelectric generating stations are located on rivers and use the current of the water
to generate electricity. This process emits no carbon dioxide.
Solar Radiation: Energy from the sun is used to generate electricity in two ways. Solar PV
panels convert sunlight directly into electricity while solar thermal devices use the sun’s heat to
indirectly generate electricity. Both processes emit no carbon dioxide.
found that the use of forest biomass for heating (or cogeneration) is more efficient compared to power generation. (Massachusetts Department of Energy Resources, 2010.)
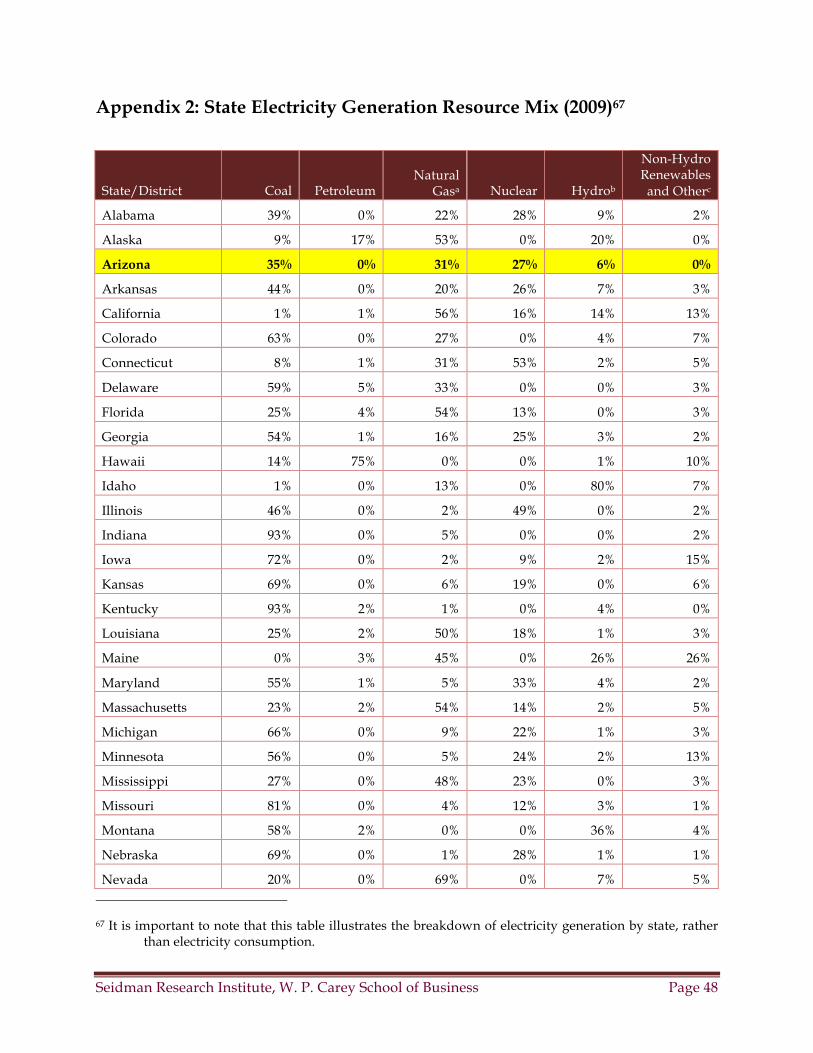
Seidman Research Institute, W. P. Carey School of Business Page 48
Appendix 2: State Electricity Generation Resource Mix (2009)67
State/District Coal Petroleum Natural
Gasa Nuclear Hydrob
Non-Hydro Renewables and Otherc
Alabama 39% 0% 22% 28% 9% 2%
Alaska 9% 17% 53% 0% 20% 0%
Arizona 35% 0% 31% 27% 6% 0%
Arkansas 44% 0% 20% 26% 7% 3%
California 1% 1% 56% 16% 14% 13%
Colorado 63% 0% 27% 0% 4% 7%
Connecticut 8% 1% 31% 53% 2% 5%
Delaware 59% 5% 33% 0% 0% 3%
Florida 25% 4% 54% 13% 0% 3%
Georgia 54% 1% 16% 25% 3% 2%
Hawaii 14% 75% 0% 0% 1% 10%
Idaho 1% 0% 13% 0% 80% 7%
Illinois 46% 0% 2% 49% 0% 2%
Indiana 93% 0% 5% 0% 0% 2%
Iowa 72% 0% 2% 9% 2% 15%
Kansas 69% 0% 6% 19% 0% 6%
Kentucky 93% 2% 1% 0% 4% 0%
Louisiana 25% 2% 50% 18% 1% 3%
Maine 0% 3% 45% 0% 26% 26%
Maryland 55% 1% 5% 33% 4% 2%
Massachusetts 23% 2% 54% 14% 2% 5%
Michigan 66% 0% 9% 22% 1% 3%
Minnesota 56% 0% 5% 24% 2% 13%
Mississippi 27% 0% 48% 23% 0% 3%
Missouri 81% 0% 4% 12% 3% 1%
Montana 58% 2% 0% 0% 36% 4%
Nebraska 69% 0% 1% 28% 1% 1%
Nevada 20% 0% 69% 0% 7% 5%
67 It is important to note that this table illustrates the breakdown of electricity generation by state, rather than electricity consumption.
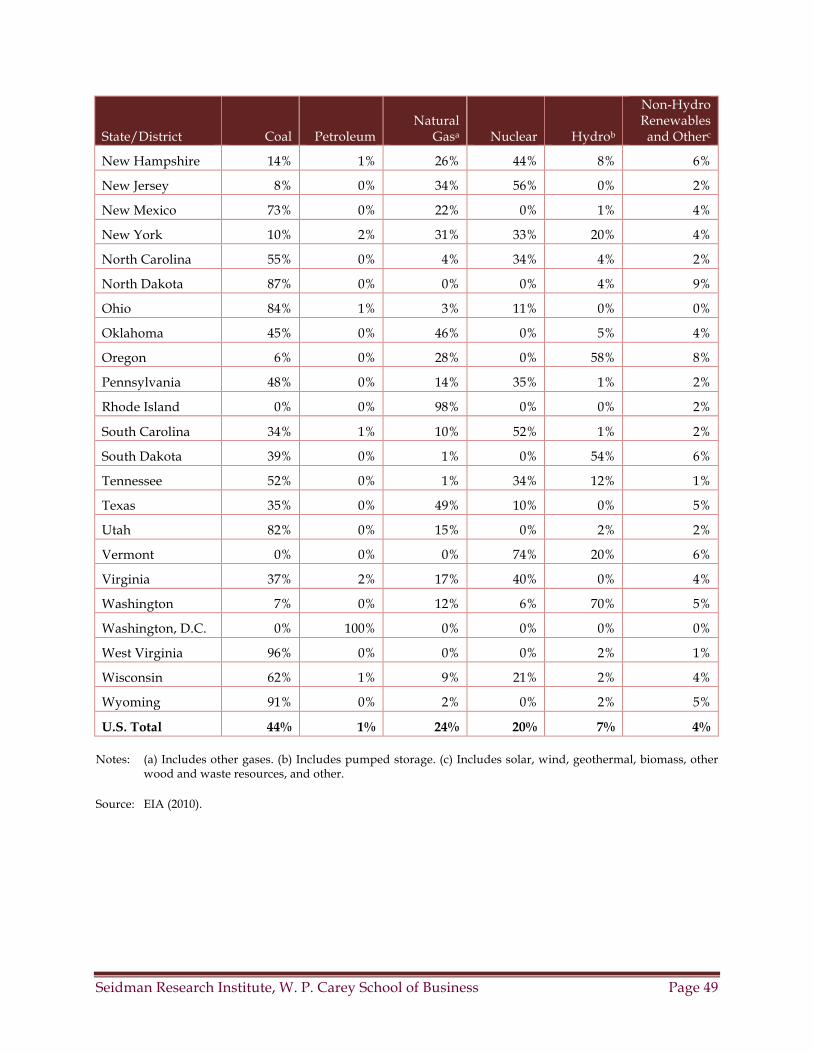
Seidman Research Institute, W. P. Carey School of Business Page 49
State/District Coal Petroleum Natural
Gasa Nuclear Hydrob
Non-Hydro Renewables and Otherc
New Hampshire 14% 1% 26% 44% 8% 6%
New Jersey 8% 0% 34% 56% 0% 2%
New Mexico 73% 0% 22% 0% 1% 4%
New York 10% 2% 31% 33% 20% 4%
North Carolina 55% 0% 4% 34% 4% 2%
North Dakota 87% 0% 0% 0% 4% 9%
Ohio 84% 1% 3% 11% 0% 0%
Oklahoma 45% 0% 46% 0% 5% 4%
Oregon 6% 0% 28% 0% 58% 8%
Pennsylvania 48% 0% 14% 35% 1% 2%
Rhode Island 0% 0% 98% 0% 0% 2%
South Carolina 34% 1% 10% 52% 1% 2%
South Dakota 39% 0% 1% 0% 54% 6%
Tennessee 52% 0% 1% 34% 12% 1%
Texas 35% 0% 49% 10% 0% 5%
Utah 82% 0% 15% 0% 2% 2%
Vermont 0% 0% 0% 74% 20% 6%
Virginia 37% 2% 17% 40% 0% 4%
Washington 7% 0% 12% 6% 70% 5%
Washington, D.C. 0% 100% 0% 0% 0% 0%
West Virginia 96% 0% 0% 0% 2% 1%
Wisconsin 62% 1% 9% 21% 2% 4%
Wyoming 91% 0% 2% 0% 2% 5%
U.S. Total 44% 1% 24% 20% 7% 4%
Notes: (a) Includes other gases. (b) Includes pumped storage. (c) Includes solar, wind, geothermal, biomass, other wood and waste resources, and other.
Source: EIA (2010).
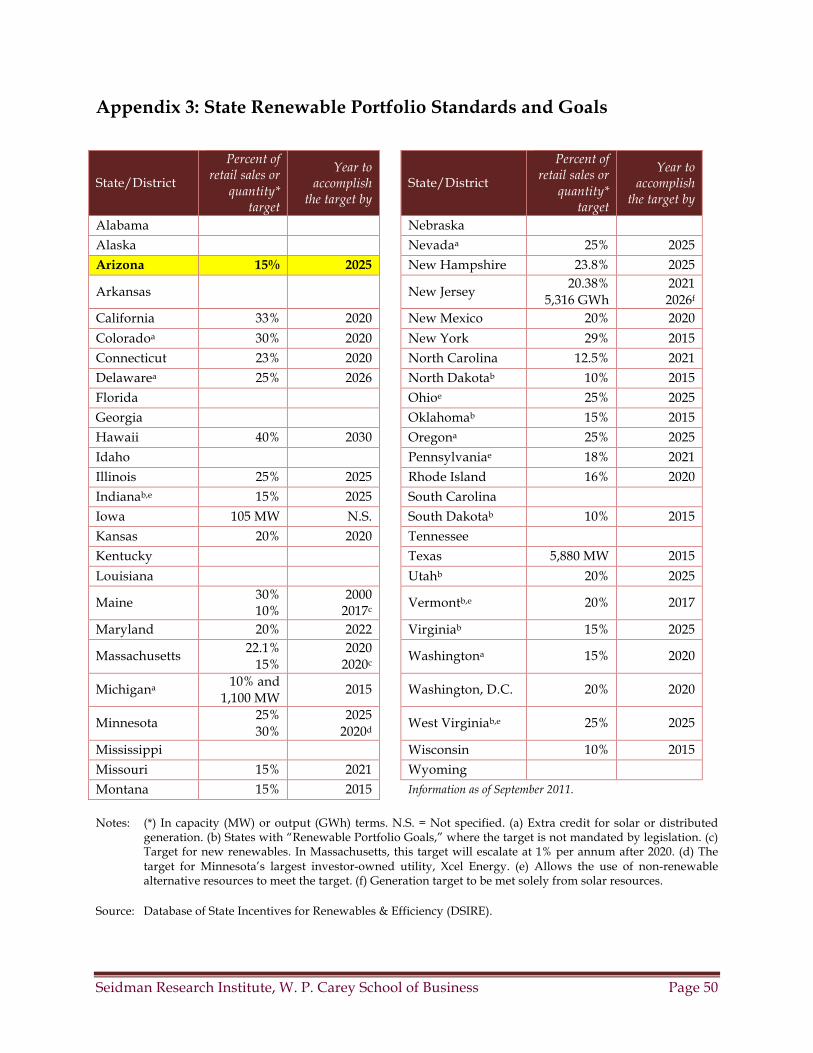
Seidman Research Institute, W. P. Carey School of Business Page 50
Appendix 3: State Renewable Portfolio Standards and Goals
State/District
Percent of retail sales or
quantity* target
Year to accomplish
the target by State/District
Percent of retail sales or
quantity* target
Year to accomplish
the target by
Alabama Nebraska Alaska Nevadaa 25% 2025 Arizona 15% 2025 New Hampshire 23.8% 2025
Arkansas New Jersey 20.38%
5,316 GWh 2021 2026f
California 33% 2020 New Mexico 20% 2020 Coloradoa 30% 2020 New York 29% 2015 Connecticut 23% 2020 North Carolina 12.5% 2021 Delawarea 25% 2026 North Dakotab 10% 2015 Florida Ohioe 25% 2025 Georgia Oklahomab 15% 2015 Hawaii 40% 2030 Oregona 25% 2025 Idaho Pennsylvaniae 18% 2021 Illinois 25% 2025 Rhode Island 16% 2020 Indianab,e 15% 2025 South Carolina Iowa 105 MW N.S. South Dakotab 10% 2015 Kansas 20% 2020 Tennessee Kentucky Texas 5,880 MW 2015 Louisiana Utahb 20% 2025
Maine 30% 10%
2000 2017c
Vermontb,e 20% 2017
Maryland 20% 2022 Virginiab 15% 2025
Massachusetts 22.1% 15%
2020 2020c
Washingtona 15% 2020
Michigana 10% and 1,100 MW
2015 Washington, D.C. 20% 2020
Minnesota 25% 30%
2025 2020d
West Virginiab,e 25% 2025
Mississippi Wisconsin 10% 2015 Missouri 15% 2021 Wyoming Montana 15% 2015 Information as of September 2011.
Notes: (*) In capacity (MW) or output (GWh) terms. N.S. = Not specified. (a) Extra credit for solar or distributed generation. (b) States with “Renewable Portfolio Goals,” where the target is not mandated by legislation. (c) Target for new renewables. In Massachusetts, this target will escalate at 1% per annum after 2020. (d) The target for Minnesota’s largest investor-owned utility, Xcel Energy. (e) Allows the use of non-renewable alternative resources to meet the target. (f) Generation target to be met solely from solar resources.
Source: Database of State Incentives for Renewables & Efficiency (DSIRE).
Seidman Research Institute, W. P. Carey School of Business Page 51
Bibliography
All Business (2009, October 23). United State: Energy and clean technology alert: Climate bill differences: Waxman-Markey versus Kerry-Boxer. Retrieved from http://www.allbusiness.com/government/government-bodies-offices/13315077-1.html.
American Council for an Energy-Efficient Economy (ACEEE) (2011, June). Energy Efficiency Resource Standards: A
Progress Report on State Experience by Michael Sciortino, et al. Retrieved from http://www.aceee.org/research-report/u112.
ACEEE (2011). Energy Efficiency Resource Standards. Retrieved from http://www.aceee.org/topics/eers. ACEEE (2007, May 1). The Twin Pillars of Sustainable Energy: Synergies Between Energy Efficiency and Renewable
Energy Technology Policy by William Prindle, et al. Retrieved from http://www.aceee.org/research-report/e074.
Arizona Corporation Commission (ACC) (2010). Retrieved from www.cc.state.az.us. ACC (2006, November 14). Renewable Energy Standard & Tariff. Retrieved from http://www.azcc.gov/
divisions/utilities/electric/res.pdf. Arizona Public Service Company (2009, January 29). Resource Plan Report. Retrieved from
http://www.aps.com/_files/various/ResourceAlt/APS_2009_Resource_Plan_Report_sFINAL_012909.pdf. Australian Government Department of Climate Change (2009, October 9). Renewable Energy Target. Retrieved from
http://www.climatechange.gov.au/government/initiatives/renewable-target.aspx. Australian Government (2011, July). Securing A Clean Energy Future: The Australian Government’s Climate Change
Plan. Retrieved from http://www.cleanenergyfuture.gov.au/wp-content/uploads/2011/07/Consolidated-Final.pdf.
Black & Veatch Corporation (2007, September). Arizona Renewable Energy Assessment. Retrieved from
www.bv.com/Downloads/Resources/Brochures/rsrc_ENR_AZ_RenewableEnergyAssessment.pdf-2009-06-10.
Bloomberg (2011). Spot Carbon Dioxide (CO2) Emissions EUA Price/Europe (EUETSSY1:IND). Retrieved from
http://www.bloomberg.com/apps/quote?ticker=EUETSSY1:IND (as of October 20, 2011). Bradsher, K. (2007, May 8). UN program to fight global warming is target of criticism. The New York Times.
Retrieved from http://www.nytimes.com/2007/05/08/business/worldbusiness/08iht-carbon.5.5625200.html.
California Environmental Protection Agency, Air Resources Board (California ARB) (2011). Cap and Trade Program:
Status of Rulemaking. Retrieved from http://arb.ca.gov/cc/capandtrade/capandtrade.htm. California ARB (2006). Assembly Bill 32: Global Warming Solutions Act. Retrieved from
http://www.arb.ca.gov/cc/ab32/ab32.htm. California Energy Commission (2005, July). Implementing California’s loading order for electricity resources.
Retrieved from http://www.energy.ca.gov/2005publications/CEC-400-2005-043/CEC-400-2005-043.PDF. California Energy Commission (2010). Retrieved from www.energy.ca.gov. Carbon Tax Center (2010). Retrieved from http://www.carbontax.org/. Chestney, N. (2010, February 7). UK should press EU for tighter carbon caps. Reuters. Retrieved from
http://www.reuters.com/article/idUSTRE61701J20100208.
Seidman Research Institute, W. P. Carey School of Business Page 52
City of Boulder, Colorado (2011). Climate Action Plan Tax. Retrieved from http://www.bouldercolorado.gov/ index.php ?option=com_content&task=view&id=7698&Itemid=2844.
Database of State Incentives for Renewables & Efficiency (DSIRE) (2011, September). Energy Efficiency Resource
Standards: Summary Map. Retrieved from http://www.dsireusa.org/summarymaps/ index.cfm?ee=1&RE=1.
DSIRE (2011, September). RPS Policies: Summary Map. Retrieved from http://www.dsireusa.org/summarymaps/
index.cfm?ee=1&RE=1. Durning, A., Fahey A., de Place, E., Stiffler, L., & Williams-Derry, C. (2009, July). Cap and Trade 101: A Federal
Climate Policy Primer. Retrieved from http://www.sightline.org/research/energy/res_pubs/cap-and-trade-101/Cap-Trade_online.pdf.
Ellerman, A.D. & Joskow, P.L. (2008, May). The European Union’s Emissions Trading System in Perspective. Pew
Center on Global Climate Change. Retrieved from http://www.pewclimate.org/docUploads/EU-ETS-In-Perspective-Report.pdf.
Environmental Defense Fund (2010). Retrieved from www.edf.org. Federal Ministry for the Environment, Nature Conservation, and Nuclear Safety. (2010). Retrieved from
http://www.bmu.de/english/aktuell/4152.php. Energy Information Administration (2010). Retrieved from http://www.eia.doe.gov/. Environmental Protection Agency (EPA) (2011). Climate Change - Climate Economics - Economic Analyses.
Retrieved from http://www.epa.gov/climatechange/economics/economicanalyses.html. EPA (2009). Acid Rain and Related Programs: 2009 Highlights and 15 Years of Results (1995 to 2009). Retrieved from
http://www.epa.gov/airmarkets/progress/ARP09_4.html. EPA (2009). Retrieved from http://www.epa.gov/. European Commission (2011, June 22). Proposal for a Directive of the European Parliament and of the Council on
Energy Efficiency and Repealing Directives 2004/8/EC and 2006/32/EC, Brussels, COM(2011) 370 (Final). Retrieved from http://eur-lex.europa.eu/LexUriServ/LexUriServ.do?uri=COM:2011:0370:FIN:EN:PDF.
European Council for an Energy Efficient Economy, Energy Efficiency Watch Project (2009). Promoting Energy
Efficiency in Europe: Insights, Experiences and Lessons learnt from the National Energy Efficiency Action Plans. Retrieved from http://www.eceee.org/EEES/EEW_brochure.
European Union (EU) Directive 2009/28/EC (April 23, 2009). Retrieved from http://eur-
lex.europa.eu/en/index.htm. EU Directive 2006/32/EC (2006, April 5). Retrieved from http://eur-lex.europa.eu/en/index.htm. Finland Ministry of the Environment (2011). Environmentally Related Energy Taxation in Finland (2011). Retrieved
from http://www.ymparisto.fi/default.asp?contentid=381824&lan=EN. HM Revenue & Customs (2011). Climate Change Levy – Introduction. Retrieved from
http://www.hmrc.gov.uk/index.htm. International Energy Agency (IEA) (2011). Addressing Climate Change Policies and Measures Database. Retrieved
from http://www.iea.org /textbase/pm/?mode=cc. IEA (2011). Global Renewable Energy Policies and Measures Database. Retrieved from http://www.iea.org
/textbase/pm/?mode=re.
Seidman Research Institute, W. P. Carey School of Business Page 53
IEA (2011). Energy Efficiency Policies and Measures Database. Retrieved from http://www.iea.org/ textbase/pm/?mode=pm.
IEA (2011, August). Energy Efficiency Policy and Carbon Pricing. Information Paper by Lisa Ryan, et al. Retrieved
from www.iea.org/papers/2011/EE_Carbon_Pricing.pdf. IEA (2010, November). Reviewing Existing and Proposed Emissions Trading Systems. Information Paper by
Christina Hood. Retrieved from http://www.iea.org/papers/2010/ ets_paper2010.pdf. IEA (2010). Retrieved from http://www.iea.org/. Lang Michener LLC (2009). Year One – A Review of British Columbia’s Carbon Tax. Retrieved from
http://www.langmichener.ca/index.cfm?fuseaction=content.contentDetail&ID=10704&tID=24. Massachusetts Institute of Technology (2007). The Future of Coal. Cambridge: Massachusetts Institute of Technology. Massachusetts Department of Energy Resources (2010, June). Biomass Sustainability and Carbon Policy Study by the
Manomet Center for Conservation Sciences. Retrieved from http://www.mass.gov/Eoeea/docs/doer/ renewables/biomass/Manomet_Biomass_Report_Full_HiRez.pdf.
Midwest Energy News (2011, March 4). Midwest cap and trade: Not dead, just sleeping. Retrieved from
http://www.midwestenergynews.com/2011/03/04/midwest-cap-and-trade-is-it-dead-or-no/. Ministry of Small Business and Revenue (2008, February). British Columbia Carbon Tax. Retrieved from
http://www.sbr.gov.bc.ca/documents_library/notices/British_Columbia_Carbon_Tax.pdf. National Renewable Energy Laboratory (2010). Retrieved from http://www.nrel.gov/. National Renewable Energy Laboratory (2009, December). Technical Report NREL/TP-6A2-47312. Carbon Taxes: A
Review of Experience and Policy Design Considerations, by Jenny Sumner, Lori Bird, and Hillary Smith. Retrieved from http://www.nrel.gov/docs/fy10osti/47312.pdf.
Pembina Institute (2008, October 24). British Columbia’s carbon tax – strengths and opportunities. Retrieved from
http://pubs.pembina.org/reports/bc-submission-carbon-tax.pdf. Post Carbon Institute (2010). China outlines ten programs for energy efficiency. Retrieved from
http://www.energybulletin.net/node/3566. Reuters (2010, January 7). BarCap Ups EU Carbon Permit Price Forecasts. Retrieved from
http://www.reuters.com/article/idUSTRE60645Y20100107. The Regional Greenhouse Gas Initiative (RGGI) (2011, April 19). Market Monitor Reports - Annual Report on the
Market for RGGI CO2 Allowances: 2010. Retrieved from http://www.rggi.org/market/market_monitor. RGGI (2010, August 19). RGGI Fact Sheet. Retrieved from http://www.rggi.org/docs/RGGI_Fact_Sheet.pdf. RGGI (2010, August 4). Market Monitor Reports - Annual Report on the Market for RGGI CO2 Allowances: 2009.
Retrieved from http://www.rggi.org/market/market_monitor. Salt River Project (2010). Retrieved from https://www.srpnet.com/Default.aspx. Syracuse University (2010). Retrieved from http://www.syr.edu/. Tucson Electric Power (2011, April 1). 2011 Renewable Energy Standard and Tariff Compliance Report. Retrieved
from http://www.azcc.gov/Divisions/Utilities/Electric/REST%20PLANS/2010/1_2010%20Annual%20 REST%20Plan.pdf.
United Nations Framework Convention on Climate Change (2010). Status of Ratification. Retrieved from
http://unfccc.int/kyoto_protocol/status_of_ratification/items/2613.php.

Seidman Research Institute, W. P. Carey School of Business Page 54
U.S. Department of Energy, Office of Energy Efficiency and Renewable Energy (EERE) (2010). Retrieved from www.eere.energy.gov.
Western Climate Initiative (WCI) (2011). Retrieved from http://www.westernclimateinitiative.org/.