Embed Size (px)
Citation preview

Ayat, S., Wrobel, R., Goss, J., & Drury, D. (2017). Experimentalcalibration in thermal analysis of PM electrical machines. In ECCE2016 - IEEE Energy Conversion Congress and Exposition,Proceedings [7855093] Institute of Electrical and ElectronicsEngineers (IEEE). https://doi.org/10.1109/ECCE.2016.7855093
Peer reviewed version
Link to published version (if available):10.1109/ECCE.2016.7855093
Link to publication record in Explore Bristol ResearchPDF-document
This is the author accepted manuscript (AAM). The final published version (version of record) is available onlinevia IEEE at http://ieeexplore.ieee.org/document/7855093/ . Please refer to any applicable terms of use of thepublisher.
University of Bristol - Explore Bristol ResearchGeneral rights
This document is made available in accordance with publisher policies. Please cite only thepublished version using the reference above. Full terms of use are available:http://www.bristol.ac.uk/red/research-policy/pure/user-guides/ebr-terms/

Experimental Calibration in Thermal Analysis of PM Electrical Machines
Sabrina Ayat¹², Rafal Wrobel¹², James Goss², David Drury²
¹ Motor Design Ltd. 4 Scotland Street
Ellesmere, SY12 0EG [email protected] [email protected]
² Department of Electrical and Electronic Engineering University of Bristol
Bristol BS8 1UB [email protected] [email protected]
Abstract— Thermal design of electric machines frequently involves tests on a fully constructed prototype to calibrate various build factors associated with the manufacture, assembly and materials used in the hardware construction. The prototype machine is usually instrumented with multiple temperature sensors providing a detailed insight into the temperature distribution. The resolution of the experimentally gathered data is usually limited by the number of temperature sensors, and therefore the quality of model calibration is highly affected by the input data. This paper investigates the issue of thermal model calibration in the context of available machine hardware and measured data resolution. Also, the research evaluates the most suitable thermocouple location with reference to the model complexity, from reduced-order lumped-parameters circuit to high-fidelity finite element method (FEM). The investigation is focused on the stator-winding assembly, which is frequently associated with the main source of power loss within a PM machine body. A prototype of a PM generator has been selected to illustrate the effects associated with the model calibration. Tests on a representative stator-winding sub-assembly (motorette) have been used in the analysis. The results suggest that the measured data from alternative sensor locations for a given machine region has a significant impact on the quality of the model calibration and consequently temperature predictions.
Keywords— Model calibration, reduced-order machine sub-assembly; thermal analysis; PM electrical machine, hardware testing.
I. INTRODUCTION
There is a large variety of modelling approaches adopted in the thermal design of electrical machines including reduced-order Thermal Equivalent Circuit (TEC), and high fidelity Finite Element Method (FEM) or Computational Fluid Dynamic (CFD). The TEC method uses lumped-parameter thermal networks, where each sub-region of the machine assembly is represented by a temperature node. The method is analogous to the electrical network. The FEM and CFD approaches solve appropriate heat and mass transfer differential equations to provide detailed temperature field solution. FEM allows for conduction heat transfer in solid components to be analyzed, while CFD accounts for convective heat transfer between solid and fluid domains. Due to its low solving-time, the TEC method is usually preferred for initial machine sizing, transient duty analysis and design-optimization. The FEM and CFD are usually chosen for investigations, where a more detailed solution is required.
Each of these methods requires a degree of model calibration from tests on a hardware assembly [1]-[23]. Some of the thermal parameters that are obtained from tests on the machine hardware include contact thermal resistance [1]-[7], heat transfer coefficients [8]-[11], equivalent thermal conductivity [12]-[15] and loss components separation [16]-[20]. It is important to note that the thermal model parameters depend on the assembly and manufacturing factors along with the particular machine configuration and operating regime [1]-[3].
There are two approaches commonly used in the calibration of thermal models. The first involves tests on a complete machine prototype, where a series of experiments allow for the parameters of interest to be derived concurrently [1], [9], [21]-[23]. The second approach includes representative machine sub-assemblies, e.g. stator-winding sectors, so called motorettes [3]-[7], [11]. The custom designed experiments [8], [12]-[14] are also used. In this case, geometries that are simpler to evaluate empirically are used in order to derive generic trends for the thermal parameters. The sub-assembly hardware provides an attractive alternative to the complete machine testing, allowing the design process to be informed at an early stage of the development. Furthermore, the approach enables cost and time effective manufacture and testing of multiple design iterations [3]-[8], [11]-[14]. Regardless of the hardware used in the thermal model calibration, the resolution of the input data frequently affects the temperature predictions [21]-[23]. Therefore, careful consideration needs to be taken when locating the thermal sensors in the machine assembly.
This investigation is focused on the machine stator-winding assembly, which is often the main loss source within a machine body, and thus makes the heat extraction associated with that region an important design issue [1]-[8]. In particular, the winding body to stator core pack interface is known to have a significant impact on the machine thermal performance, and is usually informed from appropriate experiments [11]-[14]. Temperature data from sensors located on both sides of the interface allow for the derivation of the thermal contact resistances. The common approach adopted when locating the temperature sensors within the stator-winding assembly is to use the expected hot-spot location together with the main paths of heat transfer. The overall number of sensors is dependent on various factors, e.g. cost per sensor, accessibility of the particular machine regions, measurement redundancy,

and measurement accuracy. The paper investigates the influence of the temperature sensor locations and the thermal data resolution on the model calibration. An objective is to provide a guideline for the most suitable thermocouple location with reference to the model calibration, from reduced-order TEC to high-fidelity FEM. A prototype of a PM generator and its representative motorette hardware have been used to illustrate these effects.
II. HARDWARE EXEMPLARS
A. Complete PM Generator
The permanent magnet (PM) generator selected for the illustration consists of an outer rotor, open-slot stator topology with double-layer concentrated winding. The outer rotor assembly comprises of a surface mounted PM array. The heat from the stator-winding assembly is extracted via a liquid-cooled shaft arrangement. The basic machine data is listed in Table I, and Fig. 1 presents schematically the machine structure with all the active regions indicated.
TABLE I: BASIC MACHINE DATA Number of poles 10 Number of slots 12 Rated speed 4000 rpm Rated output power 30 kW Rated current 141
Fig. 1: Outline of the PM generator.
B. Stator-Winding Sub-Assembly (Motorette)
Fig. 2 presents the representative motorette hardware with the various sub-regions highlighted. The laminated core pack has been manufactured using SiFe (M250-35A), whereas the winding has been built from 1.4x7mm² profiled rectangular copper conductors. The complete assembly has been impregnated with varnish (Elmotherm 073-1010 by Elantas) in order to enhance the heat transfer from the winding body across the laminated core pack. Also, a number of material samples have been manufactured and tested in order to estimate the equivalent thermal conductivities for the laminated core pack and impregnated winding assemblies respectively [12], [13]. It is important to note that the materials and processes used in the construction of the material samples, motorette and complete machine hardware are identical. The equivalent thermal conductivities are obtained from the material tests and/or provided by the manufacturer [24]. The data are listed in Table II and have then been used in the thermal analyses, which are discussed later in this paper.
TABLE II: THERMAL CONDUCTIVITY DATA
Fig. 2: Motorette hardware instrumented with thermocouples and placed on an interfacing plate.
Fig. 3: Thermal sensor location, the colors denote the region node; a) Blue – winding active length, Yellow – end-winding, b) Pink – Back iron yoke, Purple – Back iron tooth.
The motorette hardware has been instrumented with multiple type-K thermocouples located in various sub-regions including the laminated core pack, winding and liquid cooled heat sink. Fig. 3 illustrates the location of thermocouples on the motorette assembly. Due to symmetry, only one eighth of the motorette is shown at Fig. 3. The winding assembly incorporates thermal sensors in the middle of the active length (thermocouple 4 and mirrored over the symmetry planes 5, 6, and 7) and at the top, middle and bottom of the end winding (sensors 1-3 and 8-10). The stator core pack, or back iron, is divided in two regions, the tooth (thermocouples 16-18, 19-21 and mirrored over the symmetry plane 27-32) and the yoke (thermocouple 16-18, 19-21 and mirrored over the symmetry plane 27-32). The large number of thermocouples allows for an investigation to be carried out on the influence of the thermal sensor location on the model calibration. Two thermocouples, which are not shown in Fig. 3, were used respectively to measure the ambient temperature within the thermal chamber, and the temperature of the aluminum interface plate used for the active heat extraction when testing the motorette assembly. Table III lists the motorette regions together with the temperature sensor labeling.
TABLE III: MOTORETTE SUB-REGIONS AND RELATED SENSORS Model sub-region Sensor number Stator yoke – Y 11-15; 22-26 Stator tooth – T 16-21; 27-32 Complete stator core – BI 11-32 Winding active length – AL 4-7 Winding end region – EW 1-3; 8;10 Complete winding - W 1-10
Model sub-region k [W/m.K] k [W/m.K] k [W/m.K] Winding amalgam 2.0 2.2 330.0 Stator core 22.0 22.0 4.1 Slot liner (Nomex) 0.13 (150°C) 0.13 (150°C) 0.13 (150°C)

III. EXPERIMENTATION
A. Experimental Setup
A series of thermal tests with DC excitation of the stator-winding assembly has been carried out to gather data for the model calibration. The DC excitation provides well-defined testing conditions with a single source of power loss located in the winding. Fig. 4a) presents the experimental setup used in the thermal tests. During the test, the motorette hardware is placed into an insulated chamber, Fig. 4b), and the winding is excited with DC current. The heat generated in the winding body is conducted across the laminated core pack assembly to the liquid-cooled plate. Such arrangement is equivalent to heat extraction using machine housing with liquid-cooled jacket as in the analyzed case. It is important to note that the testing approach is applicable for a wide variety of machine topologies, allowing for a well-defined heat path from the heat source into the heat sink. The insulated chamber ensures adiabatic-like conditions, which represent the worst-case scenario in terms of machine operation, i.e. no heat transfer from the stator assembly through the machine air-gap.
Fig. 4: Experimental setup for DC motorette thermal tests, a) complete setup, b) instrumented motorette assembly placed in the thermal chamber.
An aluminum plate interfacing with the liquid-cooled cold plate has been manufactured to provide ‘good’ heat transfer across the assembly parts, Fig. 2. To further improve heat transfer a thermal paste has been used between various interfacing surfaces including the stator core pack to interfacing plate and interfacing plate to liquid-cooled cold plate. The motorette is secured using a clamping feature providing a ‘good’ contact between components of the experimental setup, Fig. 4b).
B. Testing Procedure
The testing procedure includes a number of set points with a different level of DC excitation current. For each of the test points, the temperature and power loss data are logged until the thermal equilibrium is reached. The thermal equilibrium is defined as temperature variations lower than 1˚C over 10 minutes. An alternative to the steady state thermal tests with DC excitation uses the transient approach [15]. The technique is particularly useful for large machines, where the duration of the steady state thermal tests is frequently prohibitively high.
The temperature within various sub-regions of the motorette is measured using multiple type-K thermocouples. Furthermore, the winding average temperature has been evaluated from the measured winding resistance. The change
in the winding DC power loss due to the temperature is described at (1).
= (1 + ( − )), (1)
where is the winding DC resistance at and α is the temperature coefficient of electrical resistivity of the conductor material used. Here, copper conductors have been used, α=3.93×10 . The averaged winding temperature T is then derived from (1) using the winding resistance measurements for each level of DC excitation current. This is particularly useful when none or a limited number of thermal sensors is available within the winding body.
IV. MATHEMATICAL MODELS
A. Reduced Order TEC Model Definition
TEC approach is based on a lumped parameter network linking together temperature nodes in the main or selected heat paths. The method allows for the average or hot spot temperature derivation with model complexity altered to particular needs. One of the main advantages of low-resolution TECs is the ease of the circuit construction, as these models only comprise a limited number of nodes. However, setting-up a reliable low-order model also requires a good understanding of the assembly thermal behavior in order to choose the adequate sub-region separation and a minimum number of nodes.
Fig. 5 presents the two reduced order TEC models used in this analysis, where the temperature in the individual nodes corresponds to the averaged region temperature. The first model, Fig. 5a), represents the motorette with only two nodes, the stator back iron BI and the winding assembly W averaged temperatures, and is referred to as ‘Model 1’. In order to get a more detailed estimate of the motorette temperature, in the second model, Fig. 5b), referred to as ‘Model 2’, the node BI is replaced by two nodes representing the stator tooth T and the stator yoke Y respectively. The other two nodes AL and EW, representing the winding active length and end-winding region respectively, substitute the node W. The power loss associated with the regions is injected directly in the appropriate nodes, e.g. winding DC power loss in active length AL and end-winding EW.
Fig. 5: 2D FEM model of 1/2 of the motorette together with equivalent TEC circuit, a) Model 1, b) Model 2.
B. FE Model Definition
The two-dimensional (2D) and three-dimensional (3D) FEM thermal analyses were undertaken in order to show the impact of the measured data resolution used in calibration on the model temperature predictions. Fig. 6 presents the 3D FE

model representation of the motorette with all sub-regions highlighted. Due to symmetry, only one quarter of the complete assembly has been modelled. The thermal material data used in FE analysis is listed in Table II. Both the stator core pack and winding assembly have anisotropic thermal properties. A fixed temperature boundary condition is used to represent the interfacing plate, and the remaining motorette surfaces are defined with adiabatic boundary condition emulating the adopted testing procedure.
Fig. 6: 3D FE model of 1/4 of the motorette.
The impregnated winding assembly frequently contains imperfections associated with the impregnation material and technique, winding arrangement together with the manufacture and assembly process used. ‘Good’ heat path from the winding body across slot liner into the stator core pack has been shown to be essential in effective heat evacuation from the stator-winding assembly [11]-[14]. The winding to stator contact thermal resistance is notoriously difficult to predict theoretically and is usually informed from hardware tests. In order to simplify the model definition and reduce solving time, the winding to stator interface, which comprises of a slot liner and impregnation amalgam, is defined as an equivalent composite region referred here as ‘equivalent winding-to-stator region’. Similarly, the interface between interfacing plate and stator core pack, which depends on the contact pressure, surface finish, and thermal paste distribution, is referred here as an ‘equivalent stator-to-housing region’. It is important to note that the stator-to-housing interface is not representative of that present in the complete machine assembly with heat shrunk casing due to different contact pressure. However, the interface for the complete machine can be found from available data or tests on the complete stator-winding assembly with housing [5].
C. Reduced-Order Model Calibration
The TEC thermal resistances can be derived from measurements, FE models or analytically. Here, the reduced order of the models makes complicated the analytical calculation of the thermal resistances, as multiple regions might be represented via a single element. Therefore, only direct measurements or calibrated FE models can be used for the thermal resistance derivation. Regardless of the method selected for this derivation, the temperature sensor location and the thermal data resolution might influence the model calibration.
The data from the measurements provide first insight into the impact of the temperature sensors on the interpretation of
thermal performance. Fig. 7 shows the winding temperature rise above the stator back iron temperature versus winding power loss at thermal steady state. A set of plots shown in Fig. 7 corresponds to different temperature data from the winding region used to average the overall winding temperature. The averaged back iron temperature used here as reference has been derived using the complete set of thermal sensors, listed in Table III. Data collected from the winding active-length, winding end region and combined active and end regions is presented in Fig. 7. The slopes of the individual plots, dΔT/dP, represent here an equivalent winding-to-stator back iron thermal resistance. It is evident that thermal measurements with limited number of thermal sensors might not be sufficient to adequately calibrate thermal model. For example, there is 25% discrepancy between dΔT/dP obtained using the data from the winding active length and end winding region respectively. The results indicate that the indirect temperature measurements by the use of DC winding resistance provides ‘good’ alternative for the experimentations with limited number of temperature sensors.
Fig. 7: Temperature rise above back iron vs. winding DC power loss.
It is important to note that the number of thermal sensors used for in-volume manufacture of electrical machine is usually limited. Additional thermal sensors can be added post manufacture; however accessibility to various sub-regions of the machine assembly might be limited. Two analyzed case variants, where thermal data from the winding active length and end regions are available only, represent here such scenarios. In contrast, the machine prototyping allows for more detailed instrumentation of the machine assembly. Ideally, all integral parts of the machine body across which the heat is transferred should be instrumented with thermal sensors to provide comprehensive information regarding the machine thermal behavior.
Fig. 8: Temperature rise above back iron to winding DC power loss vs. winding sub-regions

Fig. 8 presents the variation of the dΔT/dP factors with location of the thermal sensors in the winding assembly. The measured results show expected trends, where the temperature and consequently dΔT/dP is higher for the assembly regions further away from the heat sink. For example, dΔT/dP measurements for the end-winding region with thermocouple location close to the stator back iron (bottom end-winding) are lower than for the case where the temperature sensor is placed in the slot opening (top end-winding). Further to this, selecting the reference core temperature has a prominent effect on the dΔT/dP factor. As previously mentioned, the factor is reduced for the reference core temperatures from the core regions further away from the heat sink.
The various rates of temperature rise to winding power loss constitute the thermal resistances for the TEC models, Fig. 5. An alternative technique for TEC definition is to make use of the FEM predictions to calculate the average temperature for each model sub-region and the heat flux across the sub-region boundaries [19]. The thermal resistances are then directly obtained from the temperature difference between the sub-regions divided by the heat flux across the boundaries multiplied by the area across which the heat is transferred. In particular, FEM calculations provide an insight into the hot-spot temperature in addition to the averaged one, and TEC can be adapted to represent both average and hot spot temperature [25]. The thermal resistances of the TEC previously defined in Fig.5, Model 1 and Model 2, are derived from measurements and ideal FEM 3D model. The thermal resistances are listed in Table IV and Table V for Model 1 and Model 2, respectively.
TABLE IV: TEC MODEL 1 - THERMAL RESISTANCES Sub-regions W-BI
[°C/W] 1.0 , [°C/W] 0.4
TABLE V: TEC MODEL 2 - THERMAL RESISTANCES Sub-regions AL-Y AL-T Y-T AL-EW
[°C/W] 1.0 0.7 0.3 0.2 , [°C/W] 0.3 0.1 0.05 0.01
It is evident that FE model informed thermal resistances are smaller as compared with the values directly derived from the experiments. This is attributed with the contact thermal resistance winding-to-stator case, which is not accounted for in the ideal FE model definition. Clearly, the reduced-order models calibrated from the ideal FE model would underestimate the temperature predictions for the motorette/complete machine assembly.
D. FE Model Calibration
The FE model used in this investigation has been informed with thermal data derived from experiments for the composite material sub-regions including both the winding and laminated core region. The remaining factors required to fully define the model are the contact resistances between winding and core pack and core pack and motorette heat sink.
The thermal conductivity of the equivalent stator-to-housing region, , , is first calibrated, due to the relatively
low sensitivity of the winding average temperature to this value. The average temperatures for the winding region and stator core pack are calculated using FEM models for different levels of DC current excitation, and the rate of temperature rise to winding power loss dΔT/dP is derived. Here, ΔT represents the temperature difference between the cold plate and the stator yoke. The calibration is completed by adjusting , such that the measured and calculated dΔT/dP factors correlate. A value of 0.3W/mK has been obtained for , . This corresponds to an equivalent air cavity region thickness
equal to 15 µm [3]. The equivalent air cavity thickness has been derived using (2). , + = ,, , (2)
where and refer to the thermal conductivity of the thermal paste (2.9 W/mK) and air (0.0131 W/mK) respectively, and l and A are the thicknesses and surface areas across which the heat is transferred. The equivalent air cavity allows for the characterization of the thermal interface, which is useful when comparing several tests with a different set-up [3], [7]. Similarly, after calibration, the equivalent air cavity for the equivalent stator-to-winding interface can be obtained by replacing and by and in (2). The values and correspond respectively with the slot liner thermal conductivity and thickness.
The temperature difference between the stator core pack and the winding assembly is crucial for the accurate estimation of the thermal conductivity of the equivalent winding-to-stator region, , , and therefore the winding temperature needs to be carefully evaluated. An important element to account for when calculating winding temperature is the temperature and power loss interdependence. An increase of the winding temperature results in an increase of the electrical resistivity of the winding conductor and consequently elevated DC power loss at higher temperature. The commonly used technique of updating the DC winding power loss with temperature is based on (1), where the power loss is iteratively updated with averaged temperature of the winding region.
Fig. 9: Measured averaged winding temperature rise vs. winding power loss.
Fig. 9 presents the variation of the measured average winding temperature versus winding power loss at thermal steady state showing the linear relationship between the winding temperature and power loss. The measured data can be directly used in the FEM models to update the DC winding loss with the temperature by the use of the loss function T(P) given at Fig. 9. As for the equivalent stator-to-housing region, the calibration of the equivalent winding-to-stator region is
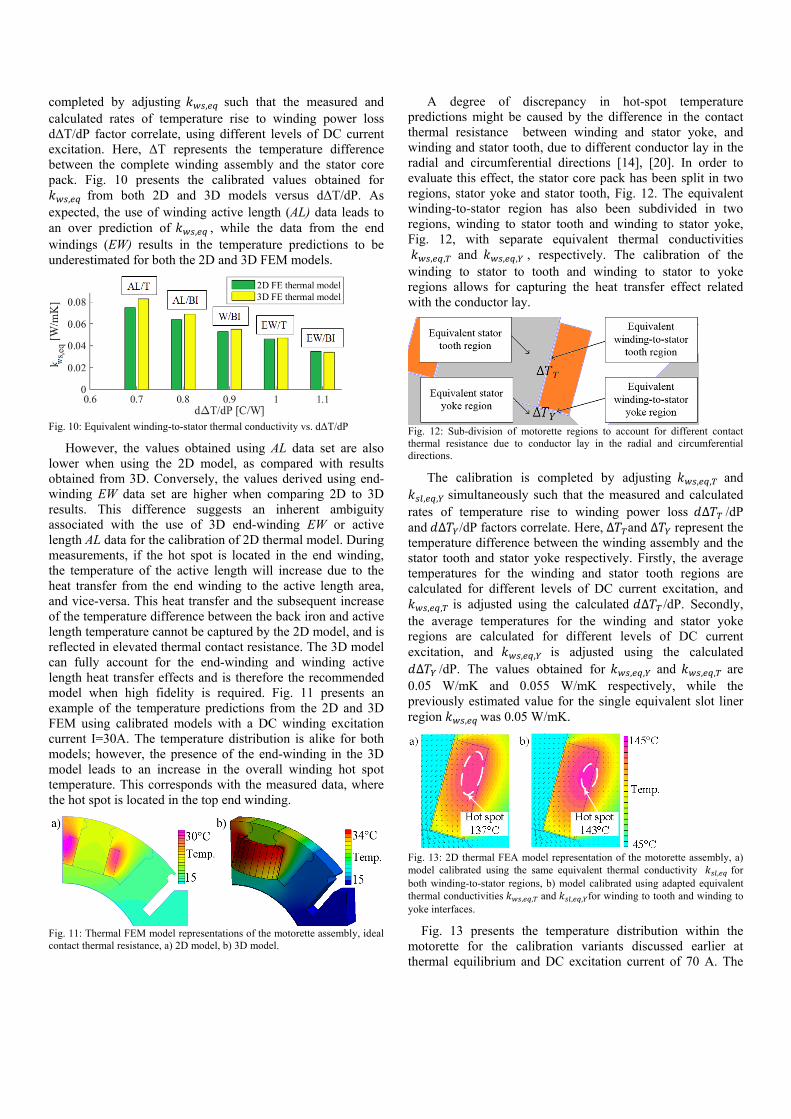
completed by adjusting , such that the measured and calculated rates of temperature rise to winding power loss dΔT/dP factor correlate, using different levels of DC current excitation. Here, ΔT represents the temperature difference between the complete winding assembly and the stator core pack. Fig. 10 presents the calibrated values obtained for , from both 2D and 3D models versus dΔT/dP. As expected, the use of winding active length (AL) data leads to an over prediction of , , while the data from the end windings (EW) results in the temperature predictions to be underestimated for both the 2D and 3D FEM models.
Fig. 10: Equivalent winding-to-stator thermal conductivity vs. dΔT/dP
However, the values obtained using AL data set are also lower when using the 2D model, as compared with results obtained from 3D. Conversely, the values derived using end-winding EW data set are higher when comparing 2D to 3D results. This difference suggests an inherent ambiguity associated with the use of 3D end-winding EW or active length AL data for the calibration of 2D thermal model. During measurements, if the hot spot is located in the end winding, the temperature of the active length will increase due to the heat transfer from the end winding to the active length area, and vice-versa. This heat transfer and the subsequent increase of the temperature difference between the back iron and active length temperature cannot be captured by the 2D model, and is reflected in elevated thermal contact resistance. The 3D model can fully account for the end-winding and winding active length heat transfer effects and is therefore the recommended model when high fidelity is required. Fig. 11 presents an example of the temperature predictions from the 2D and 3D FEM using calibrated models with a DC winding excitation current I=30A. The temperature distribution is alike for both models; however, the presence of the end-winding in the 3D model leads to an increase in the overall winding hot spot temperature. This corresponds with the measured data, where the hot spot is located in the top end winding.
Fig. 11: Thermal FEM model representations of the motorette assembly, ideal contact thermal resistance, a) 2D model, b) 3D model.
A degree of discrepancy in hot-spot temperature predictions might be caused by the difference in the contact thermal resistance between winding and stator yoke, and winding and stator tooth, due to different conductor lay in the radial and circumferential directions [14], [20]. In order to evaluate this effect, the stator core pack has been split in two regions, stator yoke and stator tooth, Fig. 12. The equivalent winding-to-stator region has also been subdivided in two regions, winding to stator tooth and winding to stator yoke, Fig. 12, with separate equivalent thermal conductivities , , and , , , respectively. The calibration of the winding to stator to tooth and winding to stator to yoke regions allows for capturing the heat transfer effect related with the conductor lay.
Fig. 12: Sub-division of motorette regions to account for different contact thermal resistance due to conductor lay in the radial and circumferential directions.
The calibration is completed by adjusting , , and , , simultaneously such that the measured and calculated rates of temperature rise to winding power loss ∆ /dP and ∆ /dP factors correlate. Here, ∆ and ∆ represent the temperature difference between the winding assembly and the stator tooth and stator yoke respectively. Firstly, the average temperatures for the winding and stator tooth regions are calculated for different levels of DC current excitation, and , , is adjusted using the calculated ∆ /dP. Secondly, the average temperatures for the winding and stator yoke regions are calculated for different levels of DC current excitation, and , , is adjusted using the calculated ∆ /dP. The values obtained for , , and , , are 0.05 W/mK and 0.055 W/mK respectively, while the previously estimated value for the single equivalent slot liner region , was 0.05 W/mK.
Fig. 13: 2D thermal FEA model representation of the motorette assembly, a) model calibrated using the same equivalent thermal conductivity , for both winding-to-stator regions, b) model calibrated using adapted equivalent thermal conductivities , , and , , for winding to tooth and winding to yoke interfaces.
Fig. 13 presents the temperature distribution within the motorette for the calibration variants discussed earlier at thermal equilibrium and DC excitation current of 70 A. The

temperature predictions indicate a discrepancy between the models with the alternative equivalent slot liner region definitions. The more detailed model suggests higher hot spot temperature as compared with the counterpart with single value equivalent contact thermal conductivity. The impact of model calibration using adapted equivalent thermal conductivity for the winding to tooth and winding to yoke interfaces is expected to be more prominent for in the complete machine assembly, due to the presence of the AC power loss effects, which affect the hot spot to the winding active length region. These effects are illustrated in the next session in the paper of inhomogeneous winding power loss distribution.
V. ILLUSTRATION
The winding power loss repartition in a complete machine assembly is frequently inhomogeneous due to AC effects. In this investigation, the selected machine comprises an open-slot stator along with concentrated edge-wound winding. This configuration has the advantage of combining a high conductor fill factor, compact end-windings along with an ease of manufacture and assembly of the edge-wound coils. However, the open-slot topology can lead to significant AC effects, due to high exposure of the conductor to the highly fluctuation of the magnetic field from the PM rotor. Consequently, the winding power loss distribution requires careful evaluation in this context. Moreover, the eddy current and hysteresis iron losses in the stator core pack needs to be accounted for.
In order to evaluate the effects due to the AC loss, the machine power loss have been derived for the rated operating point, Table I. A detailed description of the method used for the loss calculation is presented at [17]. The temperature dependence for AC loss is not the same as for DC, as the electrical resistivity increases with temperature leads to a decrease in the AC component of the winding loss. The change in the winding power loss due to the temperature is described as follows: ¦ = ¦ 1 + ( − ) + ¦ ( )¦( ( )) , (3)
where β is the temperature coefficient for the ac loss
component. The ( )¦ ratio can be derived using FE [16],
experimental [17] or analytical [25] approaches while is usually derived from a curve fit of (3) to the winding ac loss data derived from FE [16]. Here, the active-length and end-winding factors are equal to 1.83 and 1.11 respectively.
The iron power losses are assumed temperature-independent.
When comparing the FE temperature predictions it is evident that results from 2D and 3D analyses correlate relatively well, despite the fact that 2D model does not account for the end-winding region. It is important to note that the analyzed machine has relatively short end-winding region,
which results in small temperature difference between both the active and end-winding parts. For machine designs where the end-winding loss contribution is high, e.g. distributed wound machines, the difference is expected to be more prominent. Also, it is clear that the reduced order TEC models are unable to provide the same degree of accuracy as the FE equivalents. However, considering the reduced order of the models, the average temperature predictions from TEC correlate rather well with FE findings.
TABLE VI: TEMPERATURE PREDICTIONS FOR THE DIFFERENT MODELS Predicted average temperature (hot spot) [°C]
Sub-region W AL EW BI Y T
3D FEM 114 113 (121)
115 (125)
77 71 81
2D FEM - 115 (127)
- 74 69 76
TEC - Model 2 105 104 107 85 78 89
TEC - Model 1 103 - - 61 - -
The manner in which the reduced-order TEC models have been formulated does not allow for simple modification of the model parameters informed from physical changes made to the machine design. As it has been mentioned previously, a more complex model is usually required to generate the reduced-order models considered in this analysis. This limits applicability of the reduced-order TEC in design process and high-order TEC is usually needed to allow for design changes to be accounted for in a simple manner.
VI. CONCLUSION
This paper has highlighted the impact of the measured data from alternative sensor locations on the quality of the model calibration and consequently temperature predictions. The analysis of the experimental data has shown that the resolution used to calibrate a particular thermal model should match or exceed the model fidelity. The calibration of high-fidelity models using a limited set of thermal data can introduce some degree of uncertainty in the temperature predictions, as a number of model configurations may match the measurements.
Considering that the machine hardware is usually instrumented with a few thermal sensors, it is important to locate them in the appropriate regions. These would include the parts with the main heat flux, e.g. winding active length and end regions, stator back iron and tooth, machine housing and others depending on the machine construction. For the averaged per region temperature measurements used in the DC model calibration, the temperature sensors located in the mid distance of the heat flux path or half region thickness/length seems adequate.
The contact thermal resistance between the winding and stator core pack can be derived relatively accurately using reduced number of thermocouples and DC resistance measurements. The DC resistance measurements have been shown to provide a good estimate of the average winding temperature, and a limited number of thermocouples located on the back iron allows for a reliable contact resistance

derivation. The use of supplementary sensors located on the winding region might provide additional insight into the end-winding and active length heat distribution together with the hot spot location.
If inhomogeneous AC loss effects are expected to be prominent the high fidelity thermal model definition is recommended in order to accurately predict the absolute and hot spot temperatures within the machine body, in particular the winding region.
ACKNOWLEDGMENT
The authors would like to thank the European Union for their funding to this research (FP7 ITN Project 607361 ADEPT) [26]. The authors also thank Mat Johnson from the Department of Electrical and Electronic Engineering at the University of Bristol for his assistance with manufacture of the motorette hardware exemplar.
REFERENCES [1] A. Boglietti, A. Cavagnino, D. Staton, “Determination of critical
parameters in electrical machine thermal models,” IEEE Trans. Ind. Appl., vol. 44, no. 4, pp. 1150–1159, Jul./Aug. 2008.
[2] D. Staton, A. Boglietti, A. Cavagnino, “Solving the More Difficult Aspects of Electric Motor Thermal Analysis in Small and Medium Size Induction Motors,” IEEE Transaction on Energy Conv., vol. 20, no. 3, pp. 620 -628, September 2005.
[3] R. Wrobel, S. Williamson, J. Booker, P. H. Mellor, "Characterising the performance of selected electrical machine insulation systems." in Energy Conv. Congress and Exposition (ECCE 2015), pp.4857-4864.
[4] R. Wrobel, P. H. Mellor, N. McNeill, D. A. Staton, “Thermal Performance of an Open-Slot Modular-Wound Machine with External Rotor,” IEEE Transactions on Energy Conv., vol. 25, no. 2, pp. 403-411, June 2010.
[5] N. Simpson, R. Wrobel, J.D. Booker, P. Mellor, “Multi-physics experimental investigation into stator-housing contact interface”, in 8th IET International Conference on Power Electronics, Machines and Drives (PEMD), Glasgow, April 2016.
[6] R. Wrobel, S.J. Williamson, N. Simpson, S. Ayat, J. Yon, P.H. Mellor, "Impact of slot shape on loss and thermal behaviour of open-slot modular stator windings" in Energy Conv. Congress and Exposition (ECCE), 2015 IEEE, pp. 4433-4440.
[7] J. Godbehere, R. Wrobel, D. Drury, P. H. Mellor, “Experimentally Calibrated Thermal Stator Modelling of AC Machines for Short-Duty Transient Operation”, in International Conference on Electrical Machine (ICEM), 2016 – under press.
[8] D. Howey, A. S. Holmes, K. R. Pullen. "Measurement of stator heat transfer in air-cooled axial flux permanent magnet machines", 35th IEEE Conference of Industrial Electronics (IECON), 2009.
[9] G. Guemo, P. Chantrenne, J. Jac, “Parameter identification of a lumped parameter thermal model for a permanent magnet synchronous machine” in IEEE International Electric Machines & Drives Conference (IEMDC 13), pp. 1316 – 1320, May 2013.
[10] P. H. Mellor, D. Roberts, D. R. Turner, “Lumped Parameter Thermal Model for Electrical Machines of TEFC Design,” IEEE Electric Power Applications, vol. 138, no. 5, pp. 205-218, 1991.
[11] Camilleri, R., Beard, P., Howey, D.A., McCulloch, M.D., “Measuring the Heat Transfer Coefficient in a Direct Oil-Cooled Electrical Machine using Thin Film Heat Flux Gauge”s, 14th UK Heat Transfer Conference, UKHTC2015, 7-8 September 2015, Edinburgh, Scotland.
[12] R. Wrobel, P. H. Mellor, “A General Cuboidal Element for Three-Dimensional Thermal Modelling,” IEEE Transactions on Magnetics, vol. 46, no. 8, pp. 3197-3200, August 2010.
[13] S. Ayat, R. Wrobel, J. Goss, D. Drury, “Estimation of Equivalent Thermal Conductivity for Impregnated Electrical Windings Formed from Profiled Rectangular Conductors”, in 8th IET International Conference on Power Electronics, Machines and Drives (PEMD), Glasgow, April 2016.
[14] S. Ayat, R. Wrobel, J. Goss, D. Drury, “Experiment Informed Methodology for Thermal Design of PM Machines”, Eleventh International Conference on Ecological Vehicles and Renewable Energies (EVER), Monaco, April 2016.
[15] A. Boglietti, E. Carpaneto, M. Cossale, A. Lucco Borlera, D. Staton, M. Popescu, “Electrical Machine First Order Short-Time Thermal Transient Model: Measurements and Parameters Evaluation”, IEEE-IECON, pp. 555-561, 2014.
[16] R. Wrobel, D. Salt, A. Griffo, N. Simpson, P. H. Mellor, “Derivation and Scaling of AC Copper Loss in Thermal Modeling of Electrical Machines,” IEEE Transactions on Industrial Electronics, vol. 61, no. 8, pp. 4412-4419, August 2014.
[17] R. Wrobel, D. Staton, R. Lock, J. Booker, D. Drury, “Winding Design for Minimum Power Loss and Low-Cost Manufacture in Application to Fixed-Speed PM Generator,” IEEE Energy Conv. Congress and Exposition, (ECCE2014), Pittsburgh, Pennsylvania, USA, pp. 1806-1813, 14-18 September 2014.
[18] R. Wrobel, A. Mlot, P. H. Mellor, “Contribution of End-Winding Proximity Losses to Temperature Variation in Electromagnetic Devices,” IEEE Transactions on Industrial Electronics, vol. 59, no. 2, pp. 848-857, February 2012.
[19] R. Wrobel, G. Vainel, C. Copeland, T. Duda, D. Staton, P. Mellor, “Investigation of mechanical loss and heat transfer in an axial-flux PM machine,” IEEE Energy Conv. and Exposition (ECCE), 2013, pp. 4372-4379.
[20] J. Baker, R. Wrobel, D. Drury. P. Mellor, “A Methodology for Predicting the Thermal Behaviour of Modular-Wound Electrical Machines”, IEEE Energy Conv. and Exposition (ECCE), pp. 5176-5183, 2014.
[21] C. Kral, A. Haumer, M. Haigis, H. Lang, and H. Kapeller, “Comparison of a CFD analysis and a thermal equivalent circuit model of a TEFC induction machine with measurements,” IEEE Transactions on Energy Conv., vol. 24, no. 4, pp. 809–818, Dec. 2009.
[22] F.Bosenuik, B. Ponick, “Parametrization of Transient Thermal Models for Permanent Magnet Synchronous Machine Exclusively Based on Measurements”, Conf. Rec IEEE SPEEDAM, pp. 295-301, 2014.
[23] S. Mezani, N. Takorabet, and B. Laporte, “A combined electromagnetic and thermal analysis of induction motors,” IEEE Trans. Magn., vol. 41, no. 5, pp. 1572–1575, May 2005.
[24] http://www.dupont.com/ (Date viewed: 05/07/2016)
[25] P. Mellor, R. Worbel, N. Simpson, “AC losses in high frequency electrical machine winding formed from large section conductors”, IEEE- ECCE, September 2014.
[26] A. Stefanskyi, A. Dziechciarz, F. Chauvicourt, G. E. Sfakianakis, K. Ramakrishnan, K. Niyomsatian, M. Curti, N. Djukic, P. Romanazzi, S. Ayat, S. Wiedemann, W. Peng, S. Stipetic, A. Horatiu, "Researchers within the EU funded Marie Curie ITN project ADEPT, grant number 607361," 2013 - 2017