Embed Size (px)
Citation preview
Lecture on Valuation by
Samit Vartak, CFA
Founding Partner & CIO
July 16, 2017
Investment Advisors LLP
www.SageOneInvestments.com
FLAME Investment Lab With The Masters - 2017
FLAME Investment Lab With The Masters - 2017
www.SageOneInvestments.com
What I Plan to Cover Today
• Mathematics behind valuation multiples
• Drivers of valuation multiples
– Sensitivity Analysis
• Examples/case studies
• View on current market valuations
• Pockets of under valuation
• Can we time the markets to generate superior returns?
2
FLAME Investment Lab With The Masters - 2017
www.SageOneInvestments.com
Valuation as a Profession
• Tragedy: The value gets set first and Valuation exercise happens to fit the number
• Is value real or in the eyes of the beholder?
– Only reality is that there is no fixed valuation of an asset?
– M&A, Diversified Portfolio Manager, Concentrated Investor, Foreign buyer.
• Is there bias in valuation?
– All valuations are biased. The only question is by how much and in which direction. E.g. TCS
– The direction and magnitude of the bias in your valuation is directly proportional to who pays you and how much you are paid.
• Does complexity mean precision
– Understanding of a valuation model is inversely proportional to the number of inputs required for the model.
– Simpler valuation models do much better than complex ones.
3
FLAME Investment Lab With The Masters - 2017
www.SageOneInvestments.com
ROCE > Exp Return
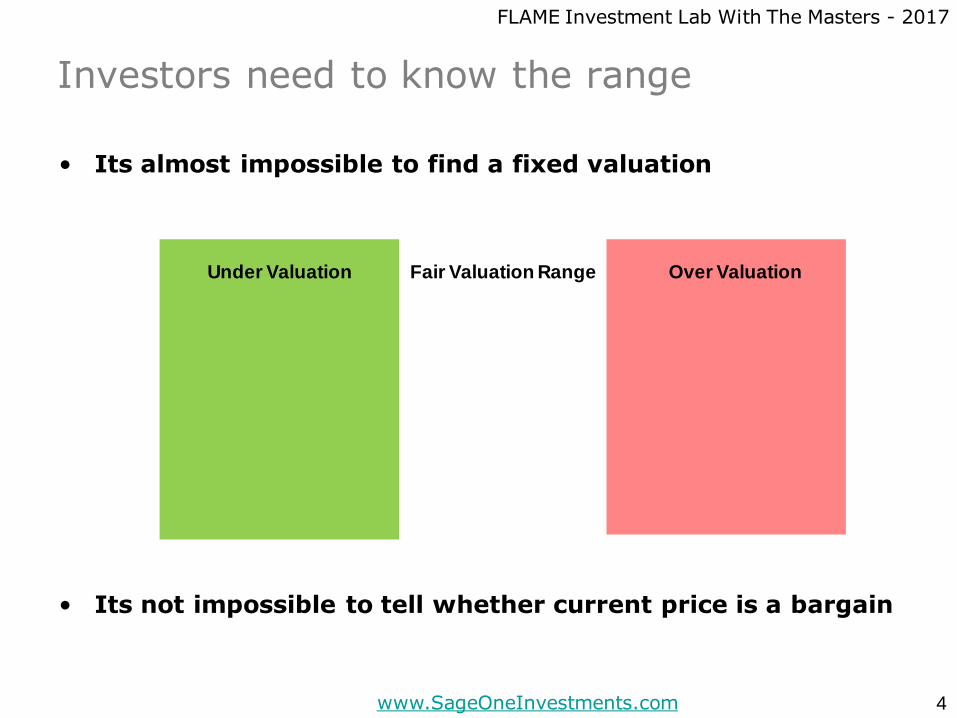
Investors need to know the range
• Its almost impossible to find a fixed valuation
• Its not impossible to tell whether current price is a bargain
4
Fair Valuation Range Over ValuationUnder Valuation
FLAME Investment Lab With The Masters - 2017
www.SageOneInvestments.com
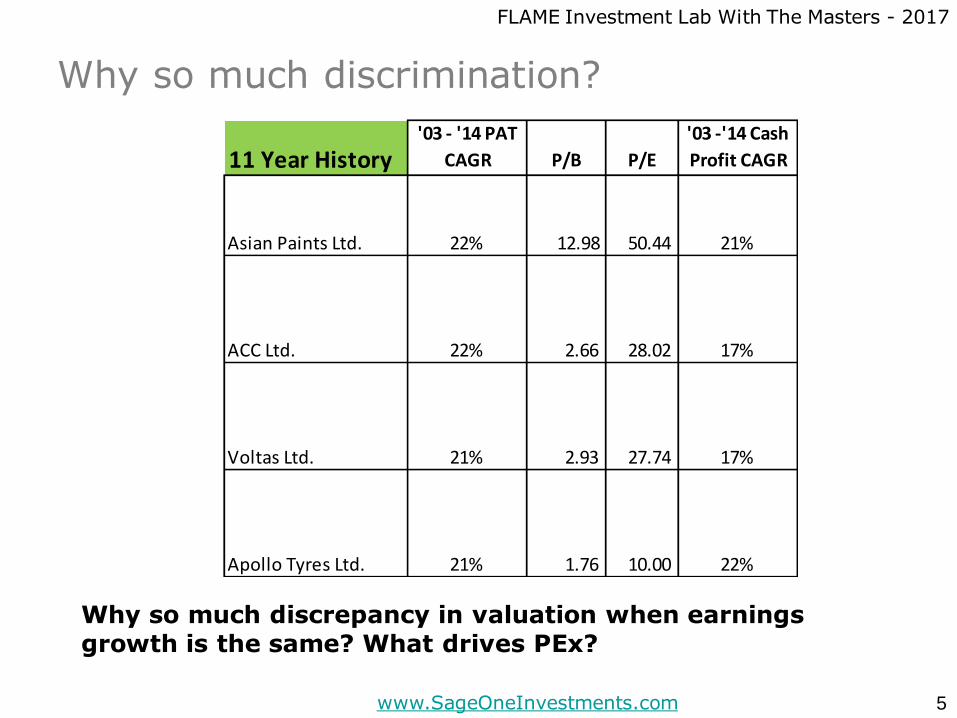
Why so much discrimination?
5
Why so much discrepancy in valuation when earningsgrowth is the same? What drives PEx?
11 Year History'03 - '14 PAT
CAGR P/B P/E
'03 -'14 Cash
Profit CAGR
Asian Paints Ltd. 22% 12.98 50.44 21%
ACC Ltd. 22% 2.66 28.02 17%
Voltas Ltd. 21% 2.93 27.74 17%
Apollo Tyres Ltd. 21% 1.76 10.00 22%
FLAME Investment Lab With The Masters - 2017
www.SageOneInvestments.com
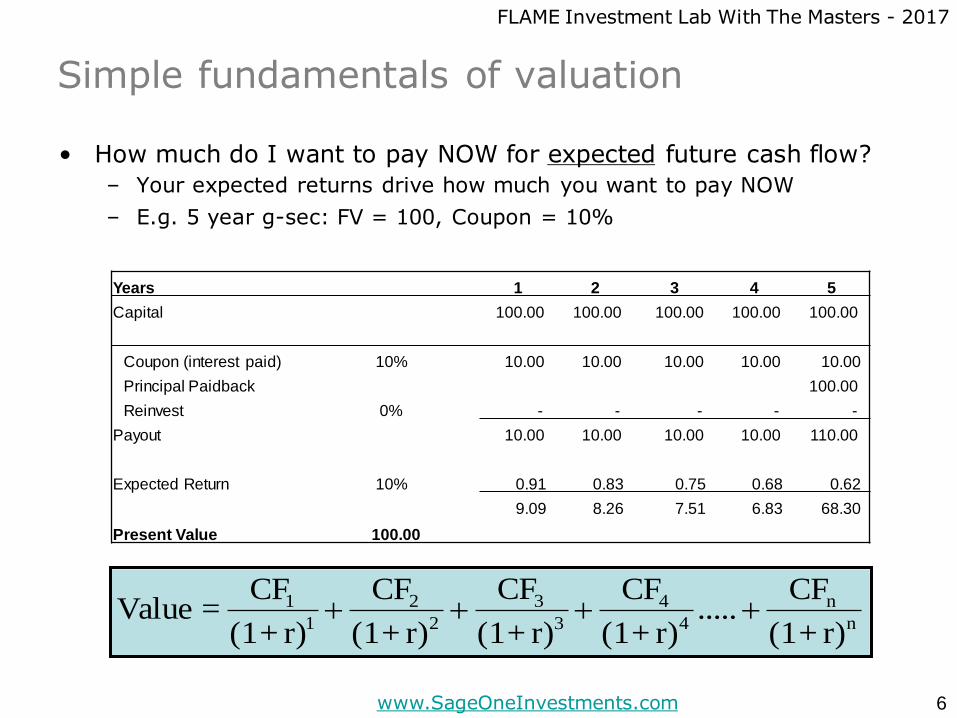
Simple fundamentals of valuation
• How much do I want to pay NOW for expected future cash flow?
– Your expected returns drive how much you want to pay NOW
– E.g. 5 year g-sec: FV = 100, Coupon = 10%
6
Years 1 2 3 4 5
Capital 100.00 100.00 100.00 100.00 100.00
Coupon (interest paid) 10% 10.00 10.00 10.00 10.00 10.00
Principal Paidback 100.00
Reinvest 0% - - - - -
Payout 10.00 10.00 10.00 10.00 110.00
Expected Return 10% 0.91 0.83 0.75 0.68 0.62
9.09 8.26 7.51 6.83 68.30
Present Value 100.00
n
n
4
4
3
3
2
2
1
1
r)+(1
CF.....
r)+(1
CF
r)+(1
CF
r)+(1
CF
r)+(1
CF = Value
FLAME Investment Lab With The Masters - 2017
www.SageOneInvestments.com
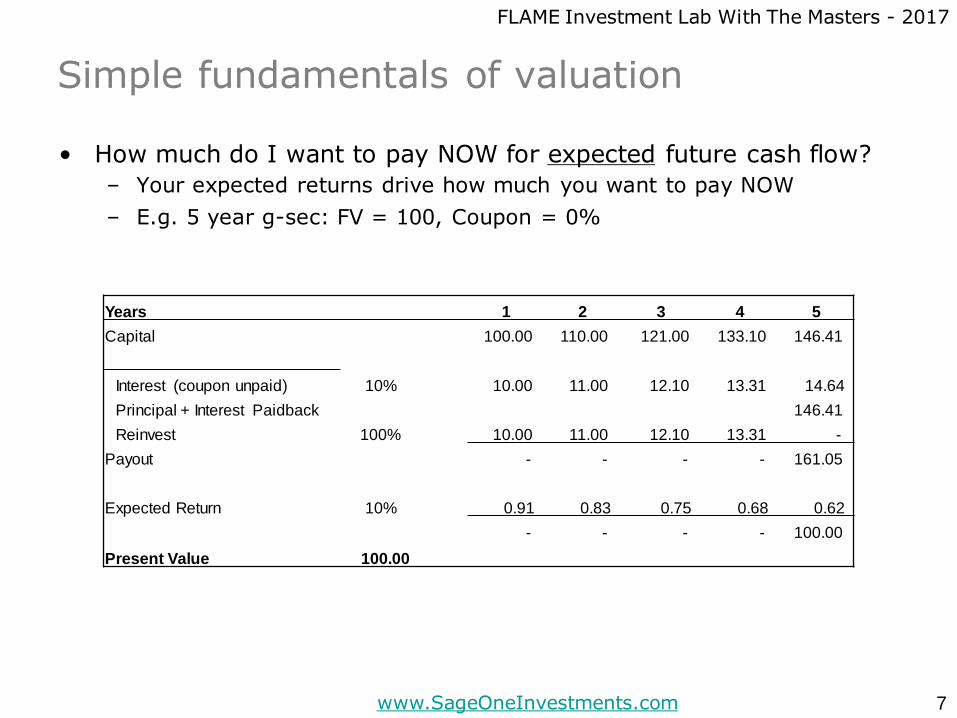
Simple fundamentals of valuation
• How much do I want to pay NOW for expected future cash flow?
– Your expected returns drive how much you want to pay NOW
– E.g. 5 year g-sec: FV = 100, Coupon = 0%
7
Years 1 2 3 4 5
Capital 100.00 110.00 121.00 133.10 146.41
Interest (coupon unpaid) 10% 10.00 11.00 12.10 13.31 14.64
Principal + Interest Paidback 146.41
Reinvest 100% 10.00 11.00 12.10 13.31 -
Payout - - - - 161.05
Expected Return 10% 0.91 0.83 0.75 0.68 0.62
- - - - 100.00
Present Value 100.00
FLAME Investment Lab With The Masters - 2017
www.SageOneInvestments.com
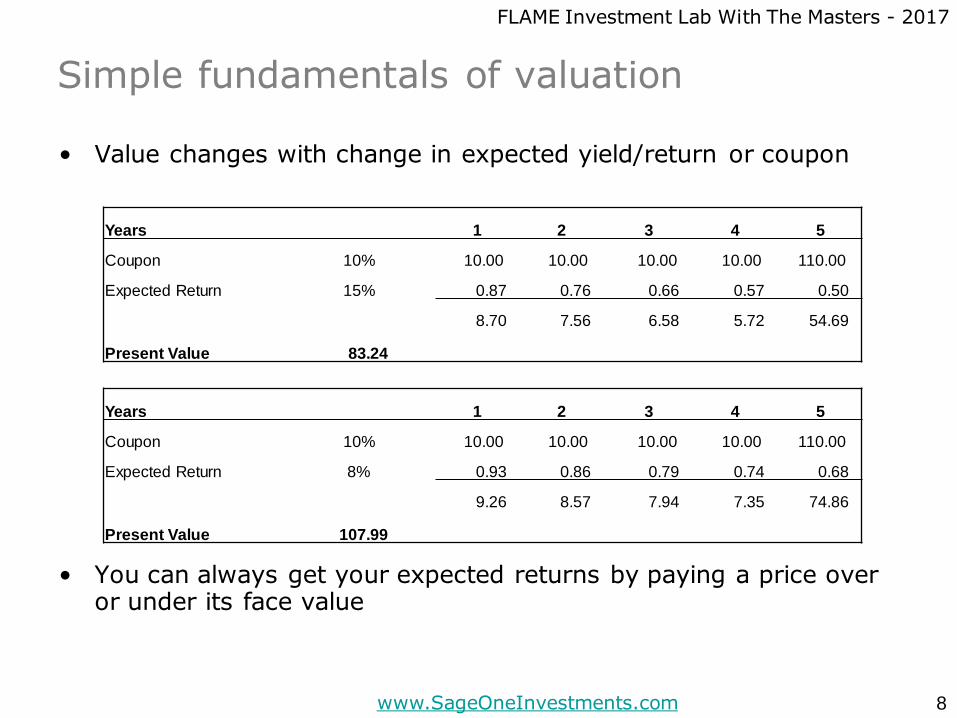
Simple fundamentals of valuation
• Value changes with change in expected yield/return or coupon
• You can always get your expected returns by paying a price over or under its face value
8
Years 1 2 3 4 5
Coupon 10% 10.00 10.00 10.00 10.00 110.00
Expected Return 15% 0.87 0.76 0.66 0.57 0.50
8.70 7.56 6.58 5.72 54.69
Present Value 83.24
Years 1 2 3 4 5
Coupon 10% 10.00 10.00 10.00 10.00 110.00
Expected Return 8% 0.93 0.86 0.79 0.74 0.68
9.26 8.57 7.94 7.35 74.86
Present Value 107.99
FLAME Investment Lab With The Masters - 2017
www.SageOneInvestments.com
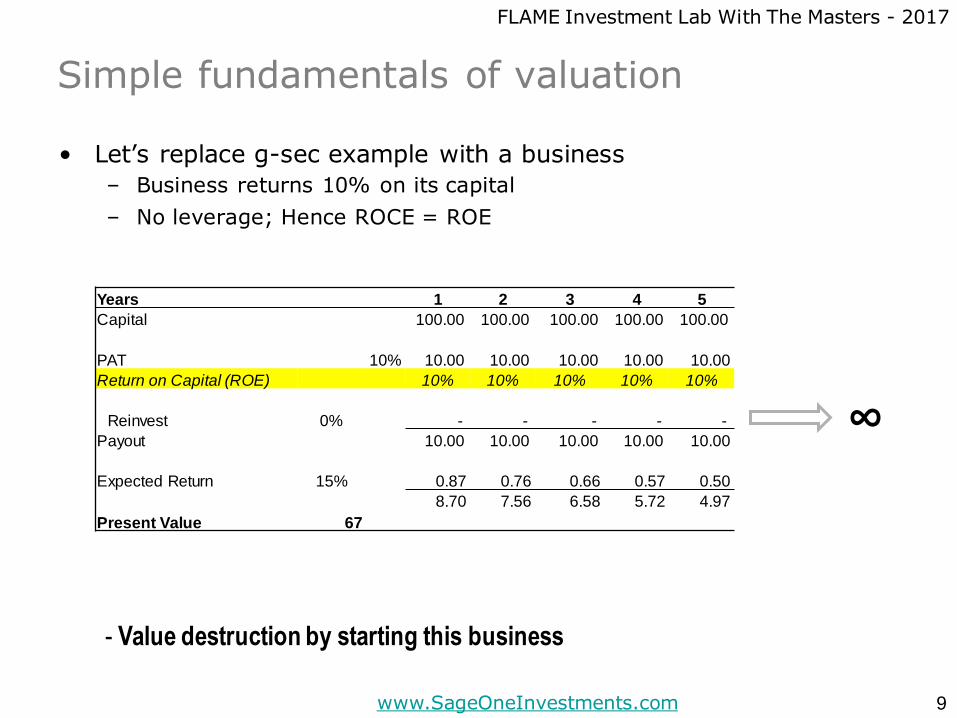
Simple fundamentals of valuation
• Let’s replace g-sec example with a business
– Business returns 10% on its capital
– No leverage; Hence ROCE = ROE
9
∞
Years 1 2 3 4 5
Capital 100.00 100.00 100.00 100.00 100.00
PAT 10% 10.00 10.00 10.00 10.00 10.00
Return on Capital (ROE) 10% 10% 10% 10% 10%
Reinvest 0% - - - - -
Payout 10.00 10.00 10.00 10.00 10.00
Expected Return 15% 0.87 0.76 0.66 0.57 0.50
8.70 7.56 6.58 5.72 4.97
Present Value 67
- Value destruction by starting this business
FLAME Investment Lab With The Masters - 2017
www.SageOneInvestments.com
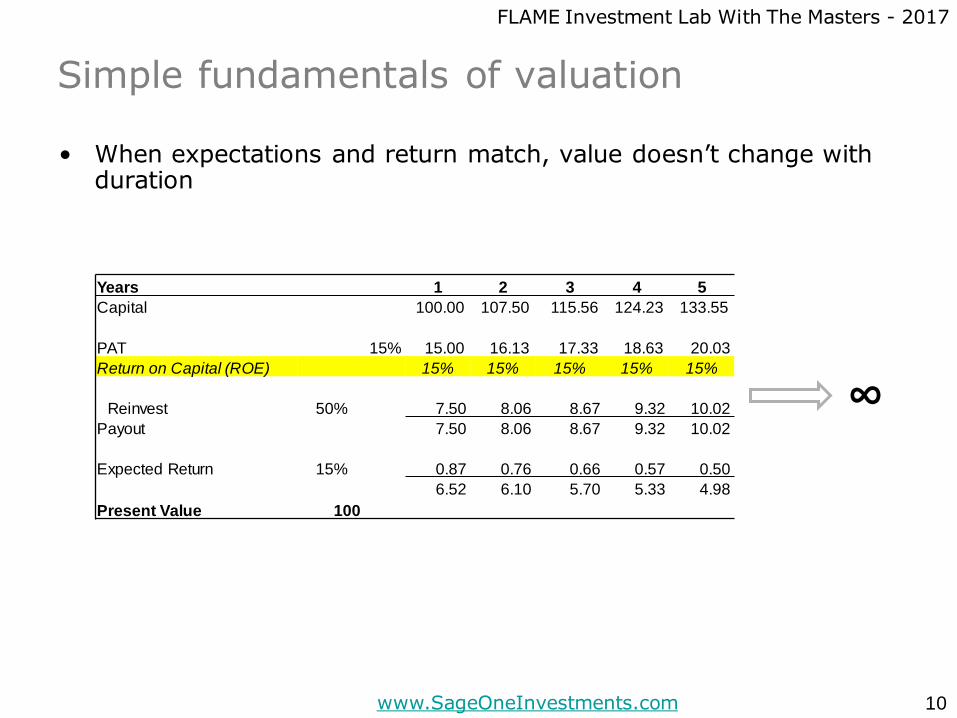
Simple fundamentals of valuation
• When expectations and return match, value doesn’t change with duration
10
∞
Years 1 2 3 4 5
Capital 100.00 107.50 115.56 124.23 133.55
PAT 15% 15.00 16.13 17.33 18.63 20.03
Return on Capital (ROE) 15% 15% 15% 15% 15%
Reinvest 50% 7.50 8.06 8.67 9.32 10.02
Payout 7.50 8.06 8.67 9.32 10.02
Expected Return 15% 0.87 0.76 0.66 0.57 0.50
6.52 6.10 5.70 5.33 4.98
Present Value 100
Money invested at returns > expected return
generates value (i.e. MV > BV)
Money invested at returns < expected returns
destroys value (i.e. MV < BV)
11
Does earnings growth create value?
12
FLAME Investment Lab With The Masters - 2017
www.SageOneInvestments.com
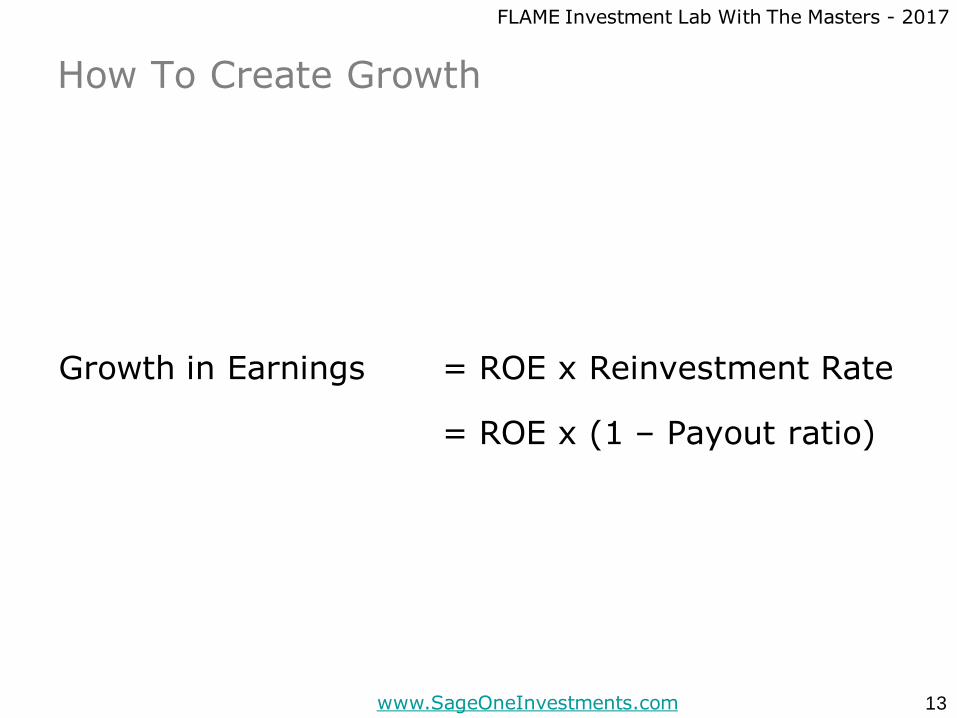
How To Create Growth
Growth in Earnings = ROE x Reinvestment Rate
= ROE x (1 – Payout ratio)
13
FLAME Investment Lab With The Masters - 2017
www.SageOneInvestments.com
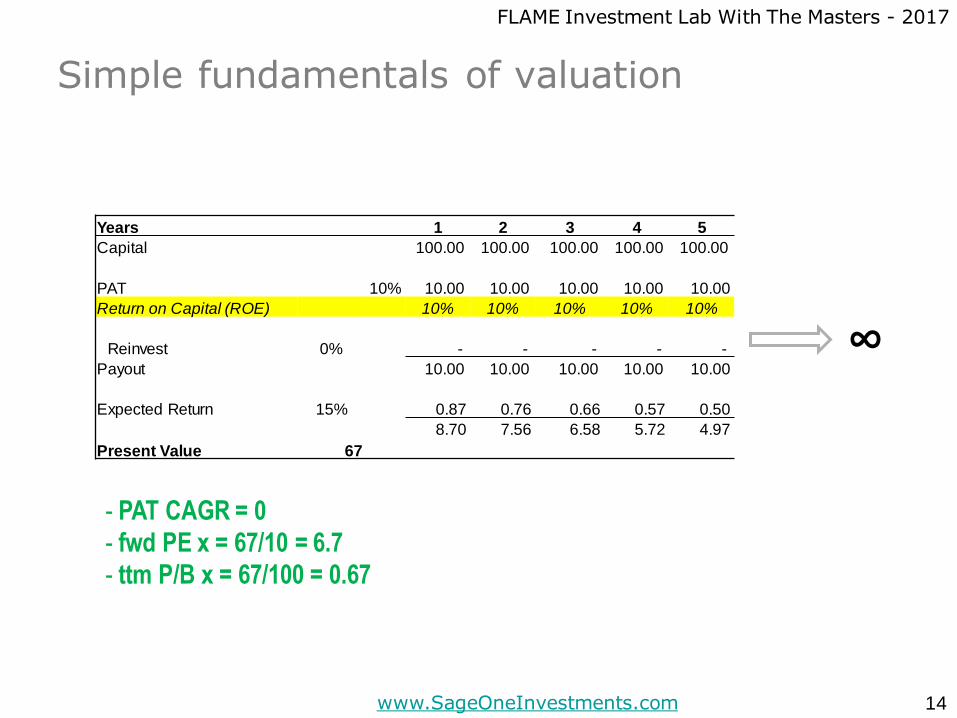
Simple fundamentals of valuation
14
∞
Years 1 2 3 4 5
Capital 100.00 100.00 100.00 100.00 100.00
PAT 10% 10.00 10.00 10.00 10.00 10.00
Return on Capital (ROE) 10% 10% 10% 10% 10%
Reinvest 0% - - - - -
Payout 10.00 10.00 10.00 10.00 10.00
Expected Return 15% 0.87 0.76 0.66 0.57 0.50
8.70 7.56 6.58 5.72 4.97
Present Value 67
- PAT CAGR = 0
- fwd PE x = 67/10 = 6.7
- ttm P/B x = 67/100 = 0.67

FLAME Investment Lab With The Masters - 2017
www.SageOneInvestments.com
Simple fundamentals of valuation
15
∞
Years 1 2 3 4 5
Capital 100.00 105.00 110.25 115.76 121.55
PAT 10% 10.00 10.50 11.03 11.58 12.16
Return on Capital (ROE) 10% 10% 10% 10% 10%
Reinvest 50% 5.00 5.25 5.51 5.79 6.08
Payout 5.00 5.25 5.51 5.79 6.08
Expected Return 15% 0.87 0.76 0.66 0.57 0.50
4.35 3.97 3.62 3.31 3.02
Present Value 50
- PAT CAGR = 5%
- fwd PE x = 50/10 = 5
- ttm P/B x = 50/100 = 0.5
-e.g. Bajaj Electricals
FLAME Investment Lab With The Masters - 2017
www.SageOneInvestments.com
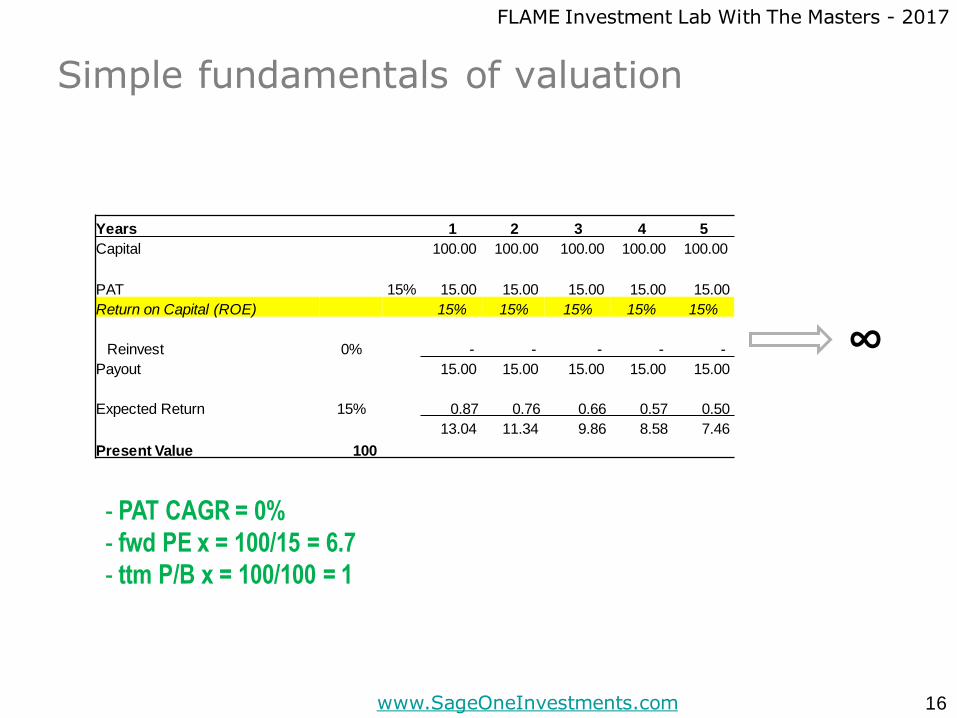
Simple fundamentals of valuation
16
∞
- PAT CAGR = 0%
- fwd PE x = 100/15 = 6.7
- ttm P/B x = 100/100 = 1
Years 1 2 3 4 5
Capital 100.00 100.00 100.00 100.00 100.00
PAT 15% 15.00 15.00 15.00 15.00 15.00
Return on Capital (ROE) 15% 15% 15% 15% 15%
Reinvest 0% - - - - -
Payout 15.00 15.00 15.00 15.00 15.00
Expected Return 15% 0.87 0.76 0.66 0.57 0.50
13.04 11.34 9.86 8.58 7.46
Present Value 100
FLAME Investment Lab With The Masters - 2017
www.SageOneInvestments.com
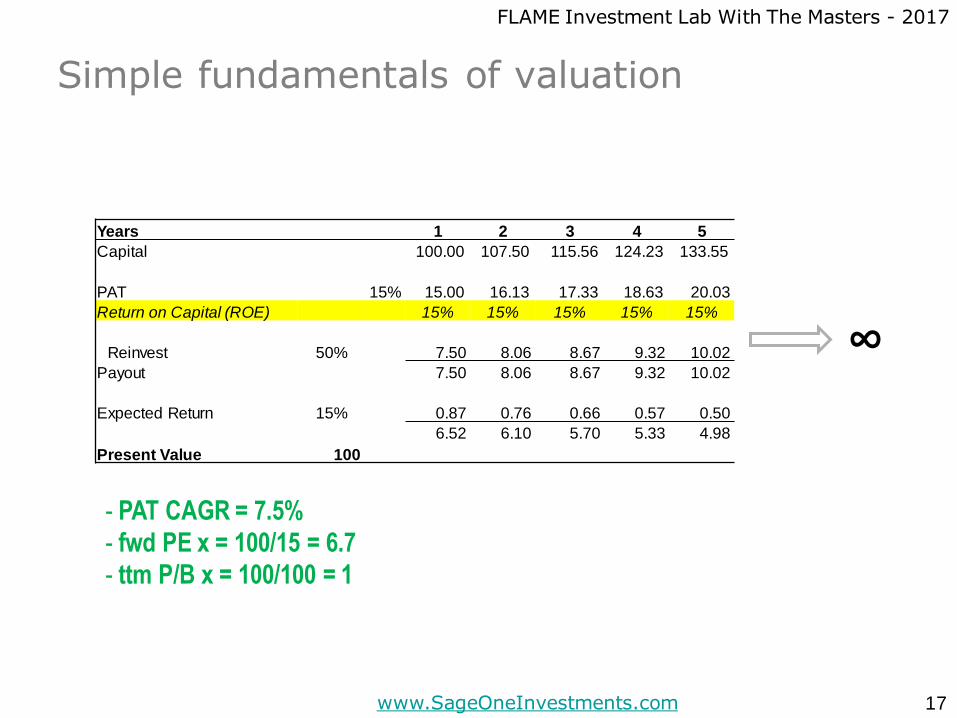
Simple fundamentals of valuation
17
∞
- PAT CAGR = 7.5%
- fwd PE x = 100/15 = 6.7
- ttm P/B x = 100/100 = 1
Years 1 2 3 4 5
Capital 100.00 107.50 115.56 124.23 133.55
PAT 15% 15.00 16.13 17.33 18.63 20.03
Return on Capital (ROE) 15% 15% 15% 15% 15%
Reinvest 50% 7.50 8.06 8.67 9.32 10.02
Payout 7.50 8.06 8.67 9.32 10.02
Expected Return 15% 0.87 0.76 0.66 0.57 0.50
6.52 6.10 5.70 5.33 4.98
Present Value 100
FLAME Investment Lab With The Masters - 2017
www.SageOneInvestments.com
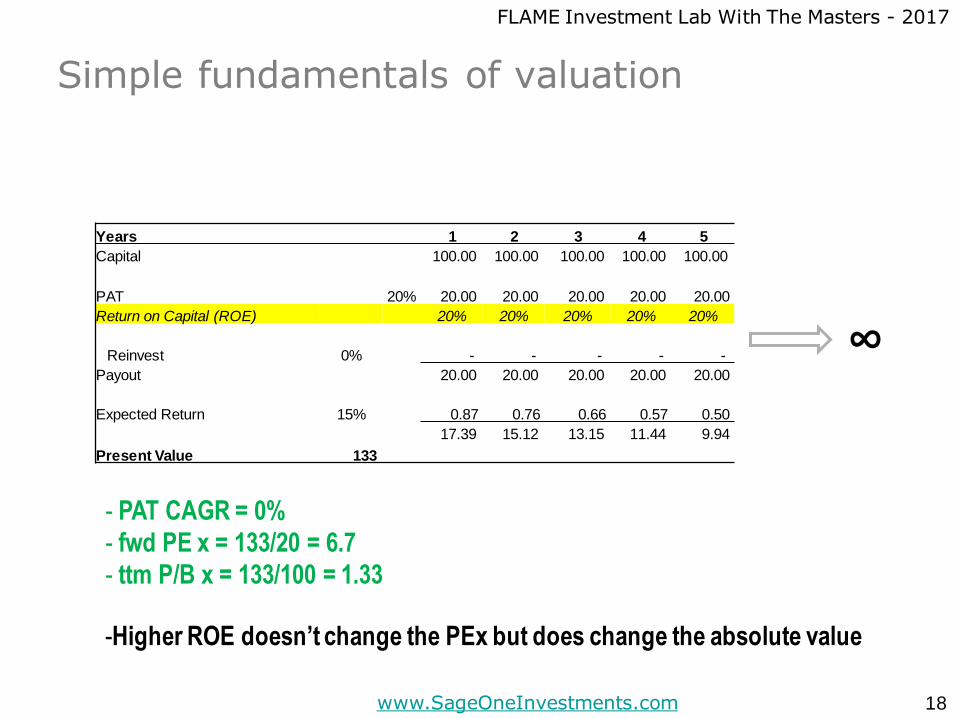
Simple fundamentals of valuation
18
∞
- PAT CAGR = 0%
- fwd PE x = 133/20 = 6.7
- ttm P/B x = 133/100 = 1.33
Years 1 2 3 4 5
Capital 100.00 100.00 100.00 100.00 100.00
PAT 20% 20.00 20.00 20.00 20.00 20.00
Return on Capital (ROE) 20% 20% 20% 20% 20%
Reinvest 0% - - - - -
Payout 20.00 20.00 20.00 20.00 20.00
Expected Return 15% 0.87 0.76 0.66 0.57 0.50
17.39 15.12 13.15 11.44 9.94
Present Value 133
-Higher ROE doesn’t change the PEx but does change the absolute value

FLAME Investment Lab With The Masters - 2017
www.SageOneInvestments.com
Simple fundamentals of valuation
19
∞
- PAT CAGR = 10%
- fwd PE x = 200/20 = 10
- ttm P/B x = 200/100 = 2
Years 1 2 3 4 5
Capital 100.00 110.00 121.00 133.10 146.41
PAT 20% 20.00 22.00 24.20 26.62 29.28
Return on Capital (ROE) 20% 20% 20% 20% 20%
Reinvest 50% 10.00 11.00 12.10 13.31 14.64
Payout 10.00 11.00 12.10 13.31 14.64
Expected Return 15% 0.87 0.76 0.66 0.57 0.50
8.70 8.32 7.96 7.61 7.28
Present Value 200
FLAME Investment Lab With The Masters - 2017
www.SageOneInvestments.com
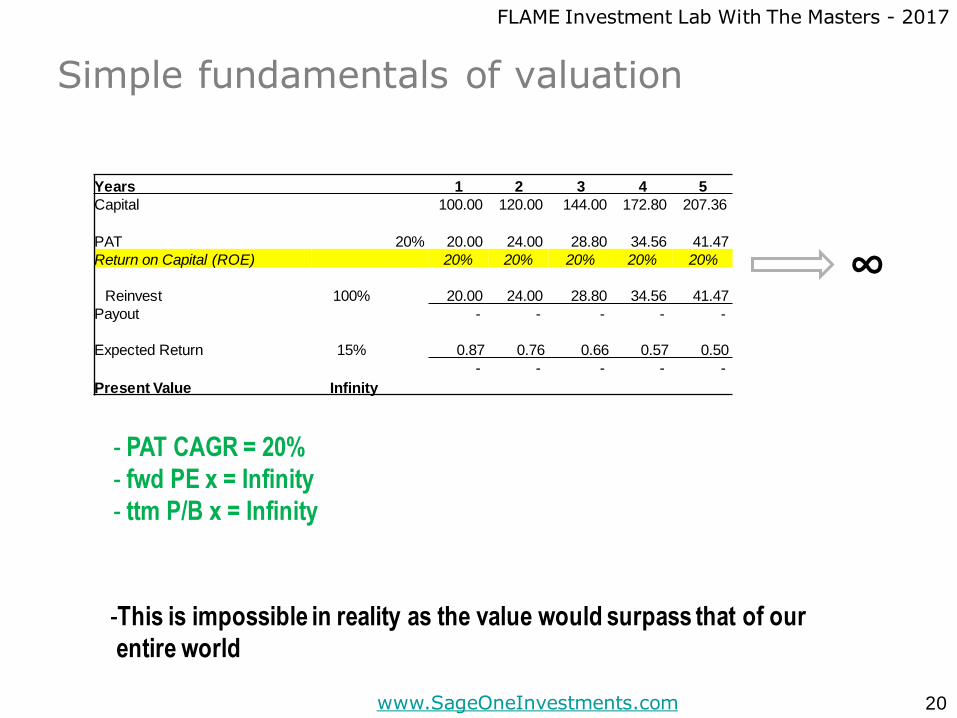
Simple fundamentals of valuation
20
∞
- PAT CAGR = 20%
- fwd PE x = Infinity
- ttm P/B x = Infinity
Years 1 2 3 4 5
Capital 100.00 120.00 144.00 172.80 207.36
PAT 20% 20.00 24.00 28.80 34.56 41.47
Return on Capital (ROE) 20% 20% 20% 20% 20%
Reinvest 100% 20.00 24.00 28.80 34.56 41.47
Payout - - - - -
Expected Return 15% 0.87 0.76 0.66 0.57 0.50
- - - - -
Present Value Infinity
-This is impossible in reality as the value would surpass that of our
entire world
Growth can be increased by increasing
investments
Growth will increase value ONLY IF the returns
earned on the new investments exceed
expected return
21
FLAME Investment Lab With The Masters - 2017
www.SageOneInvestments.com
Simple fundamentals of valuation
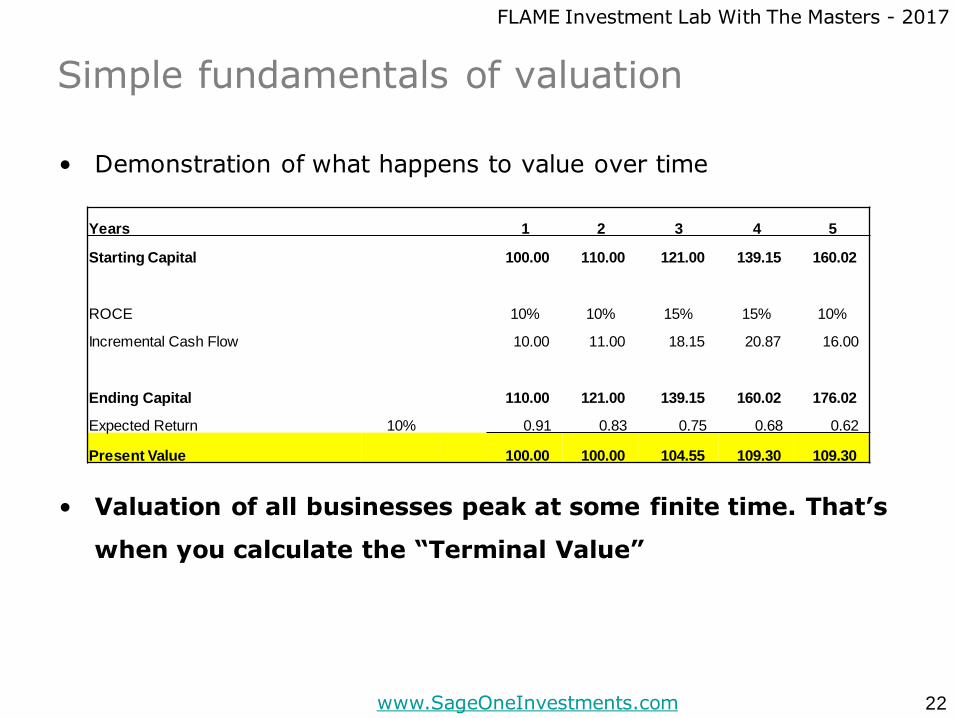
• Demonstration of what happens to value over time
• Valuation of all businesses peak at some finite time. That’s
when you calculate the “Terminal Value”
22
Years 1 2 3 4 5
Starting Capital 100.00 110.00 121.00 139.15 160.02
ROCE 10% 10% 15% 15% 10%
Incremental Cash Flow 10.00 11.00 18.15 20.87 16.00
Ending Capital 110.00 121.00 139.15 160.02 176.02
Expected Return 10% 0.91 0.83 0.75 0.68 0.62
Present Value 100.00 100.00 104.55 109.30 109.30

FLAME Investment Lab With The Masters - 2017
www.SageOneInvestments.com
Simple fundamentals of valuation
• Graph of Present Value over Time
• Valuation of all businesses peak at some finite time
23
95
100
105
110
115
120
125
1 2 3 4 5 6 7 8 9 10
ROCE > Exp Return ROCE = Exp Return ROCE < Exp Return
Sensitivity of Valuations
(PE x and PB x)
24
FLAME Investment Lab With The Masters - 2017
www.SageOneInvestments.com
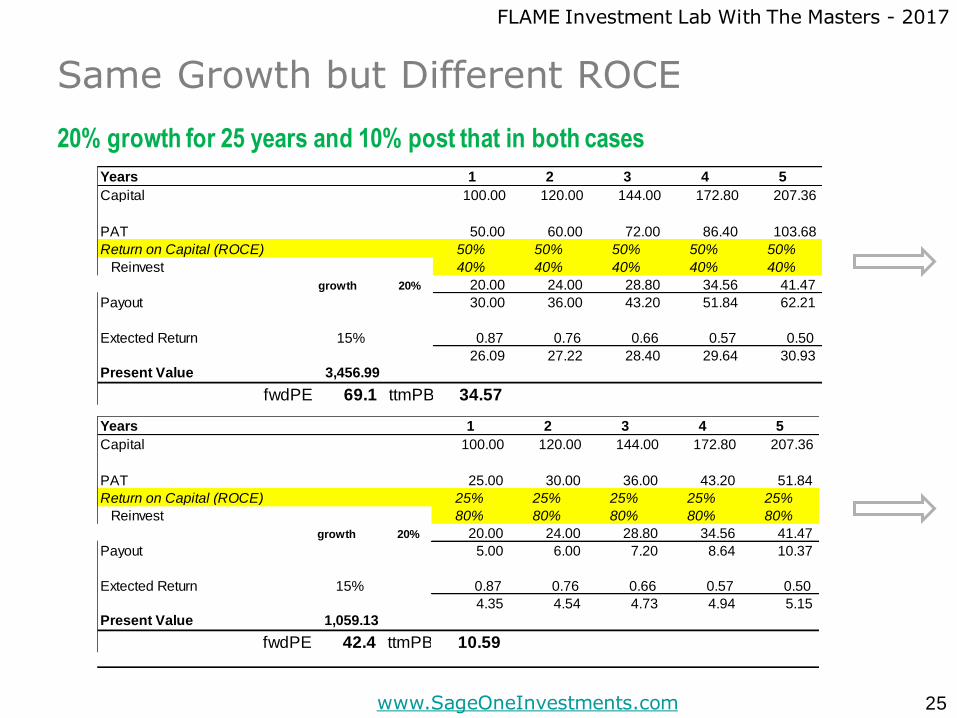
Same Growth but Different ROCE
25
Years 1 2 3 4 5
Capital 100.00 120.00 144.00 172.80 207.36
PAT 50.00 60.00 72.00 86.40 103.68
Return on Capital (ROCE) 50% 50% 50% 50% 50%
Reinvest 40% 40% 40% 40% 40%
growth 20% 20.00 24.00 28.80 34.56 41.47
Payout 30.00 36.00 43.20 51.84 62.21
Extected Return 15% 0.87 0.76 0.66 0.57 0.50
26.09 27.22 28.40 29.64 30.93
Present Value 3,456.99
fwdPE 69.1 ttmPB 34.57
Years 1 2 3 4 5
Capital 100.00 120.00 144.00 172.80 207.36
PAT 25.00 30.00 36.00 43.20 51.84
Return on Capital (ROCE) 25% 25% 25% 25% 25%
Reinvest 80% 80% 80% 80% 80%
growth 20% 20.00 24.00 28.80 34.56 41.47
Payout 5.00 6.00 7.20 8.64 10.37
Extected Return 15% 0.87 0.76 0.66 0.57 0.50
4.35 4.54 4.73 4.94 5.15
Present Value 1,059.13
fwdPE 42.4 ttmPB 10.59
20% growth for 25 years and 10% post that in both cases
FLAME Investment Lab With The Masters - 2017
www.SageOneInvestments.com
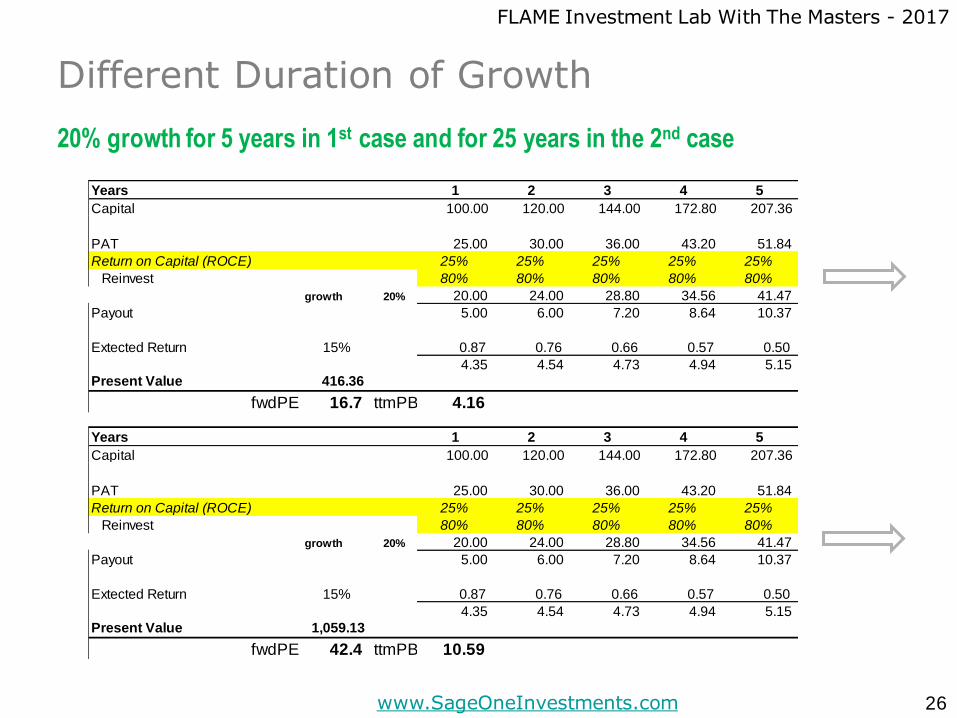
Different Duration of Growth
26
20% growth for 5 years in 1st case and for 25 years in the 2nd case
Years 1 2 3 4 5
Capital 100.00 120.00 144.00 172.80 207.36
PAT 25.00 30.00 36.00 43.20 51.84
Return on Capital (ROCE) 25% 25% 25% 25% 25%
Reinvest 80% 80% 80% 80% 80%
growth 20% 20.00 24.00 28.80 34.56 41.47
Payout 5.00 6.00 7.20 8.64 10.37
Extected Return 15% 0.87 0.76 0.66 0.57 0.50
4.35 4.54 4.73 4.94 5.15
Present Value 416.36
fwdPE 16.7 ttmPB 4.16
Years 1 2 3 4 5
Capital 100.00 120.00 144.00 172.80 207.36
PAT 25.00 30.00 36.00 43.20 51.84
Return on Capital (ROCE) 25% 25% 25% 25% 25%
Reinvest 80% 80% 80% 80% 80%
growth 20% 20.00 24.00 28.80 34.56 41.47
Payout 5.00 6.00 7.20 8.64 10.37
Extected Return 15% 0.87 0.76 0.66 0.57 0.50
4.35 4.54 4.73 4.94 5.15
Present Value 1,059.13
fwdPE 42.4 ttmPB 10.59
FLAME Investment Lab With The Masters - 2017
www.SageOneInvestments.com
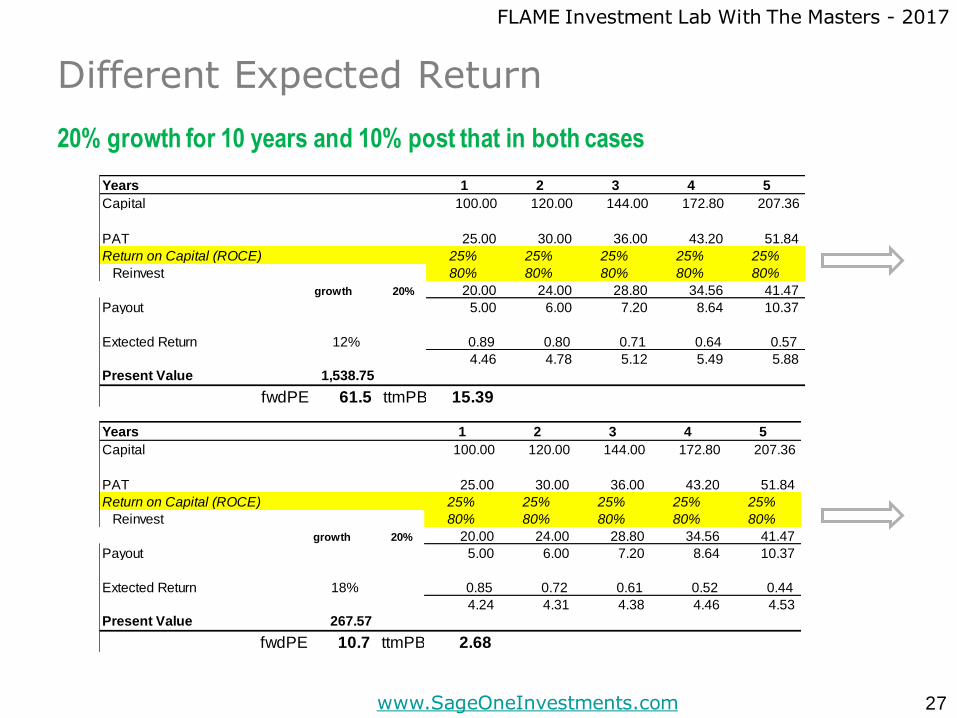
Different Expected Return
27
20% growth for 10 years and 10% post that in both cases
Years 1 2 3 4 5
Capital 100.00 120.00 144.00 172.80 207.36
PAT 25.00 30.00 36.00 43.20 51.84
Return on Capital (ROCE) 25% 25% 25% 25% 25%
Reinvest 80% 80% 80% 80% 80%
growth 20% 20.00 24.00 28.80 34.56 41.47
Payout 5.00 6.00 7.20 8.64 10.37
Extected Return 12% 0.89 0.80 0.71 0.64 0.57
4.46 4.78 5.12 5.49 5.88
Present Value 1,538.75
fwdPE 61.5 ttmPB 15.39
Years 1 2 3 4 5
Capital 100.00 120.00 144.00 172.80 207.36
PAT 25.00 30.00 36.00 43.20 51.84
Return on Capital (ROCE) 25% 25% 25% 25% 25%
Reinvest 80% 80% 80% 80% 80%
growth 20% 20.00 24.00 28.80 34.56 41.47
Payout 5.00 6.00 7.20 8.64 10.37
Extected Return 18% 0.85 0.72 0.61 0.52 0.44
4.24 4.31 4.38 4.46 4.53
Present Value 267.57
fwdPE 10.7 ttmPB 2.68
Gresham's Law says "bad money drives out good."
When paper money appeared, gold disappeared. It
works in investing too: bad investors drive out good.
When undemanding investors appear, they'll buy
anything.
- Howard Marks
28
FLAME Investment Lab With The Masters - 2017
www.SageOneInvestments.com
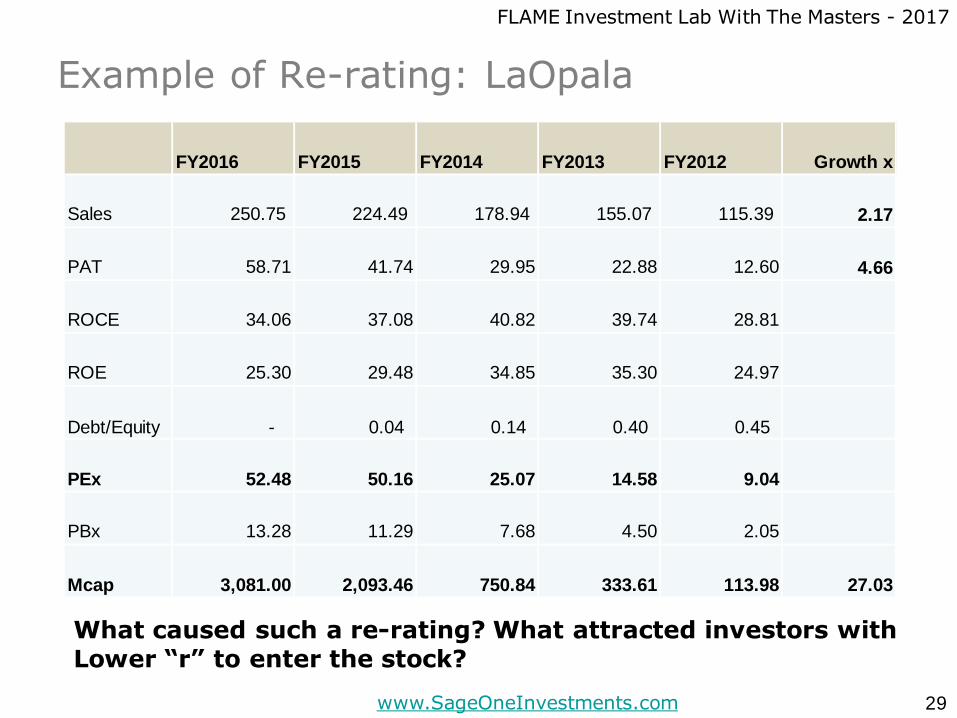
Example of Re-rating: LaOpala
29
What caused such a re-rating? What attracted investors withLower “r” to enter the stock?
FY2016 FY2015 FY2014 FY2013 FY2012 Growth x
Sales 250.75 224.49 178.94 155.07 115.39 2.17
PAT 58.71 41.74 29.95 22.88 12.60 4.66
ROCE 34.06 37.08 40.82 39.74 28.81
ROE 25.30 29.48 34.85 35.30 24.97
Debt/Equity - 0.04 0.14 0.40 0.45
PEx 52.48 50.16 25.07 14.58 9.04
PBx 13.28 11.29 7.68 4.50 2.05
Mcap 3,081.00 2,093.46 750.84 333.61 113.98 27.03
FLAME Investment Lab With The Masters - 2017
www.SageOneInvestments.com
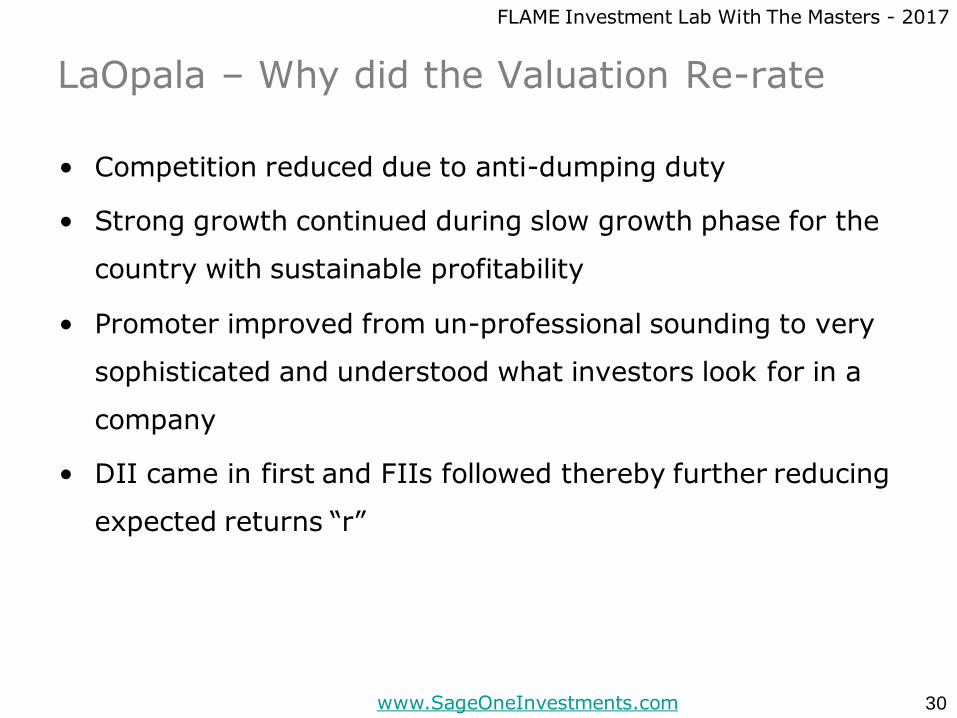
LaOpala – Why did the Valuation Re-rate
• Competition reduced due to anti-dumping duty
• Strong growth continued during slow growth phase for the
country with sustainable profitability
• Promoter improved from un-professional sounding to very
sophisticated and understood what investors look for in a
company
• DII came in first and FIIs followed thereby further reducing
expected returns “r”
30
FLAME Investment Lab With The Masters - 2017
www.SageOneInvestments.com
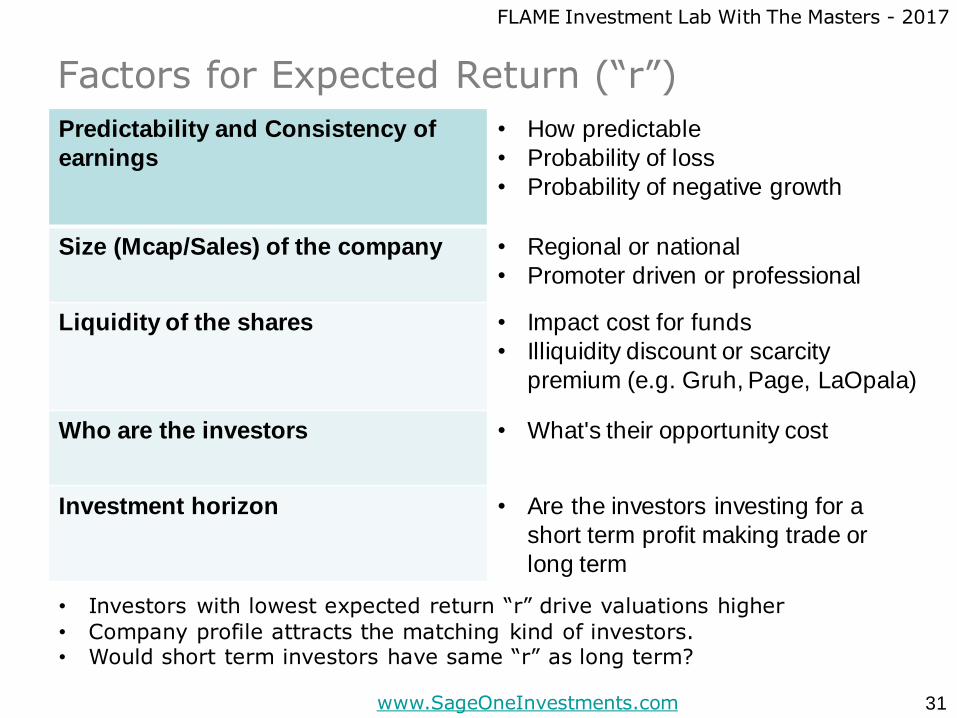
Factors for Expected Return (“r”)
31
Predictability and Consistency of
earnings
• How predictable
• Probability of loss
• Probability of negative growth
Size (Mcap/Sales) of the company • Regional or national
• Promoter driven or professional
Liquidity of the shares • Impact cost for funds
• Illiquidity discount or scarcity
premium (e.g. Gruh, Page, LaOpala)
Who are the investors • What's their opportunity cost
Investment horizon • Are the investors investing for a
short term profit making trade or
long term
• Investors with lowest expected return “r” drive valuations higher
• Company profile attracts the matching kind of investors.• Would short term investors have same “r” as long term?
FLAME Investment Lab With The Masters - 2017
www.SageOneInvestments.com
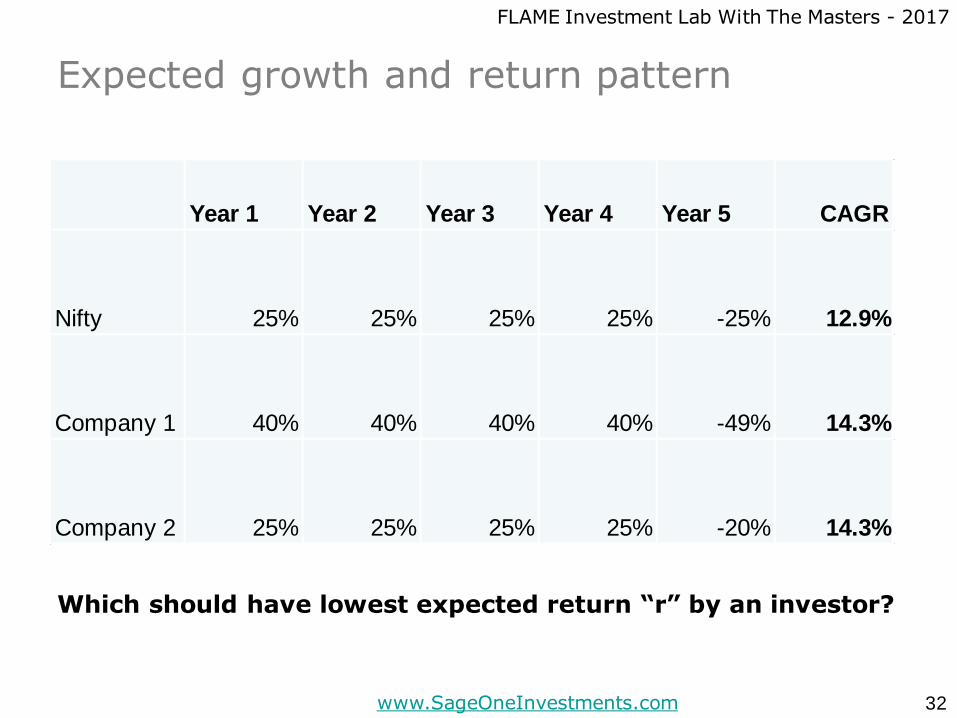
Expected growth and return pattern
32
Which should have lowest expected return “r” by an investor?
Year 1 Year 2 Year 3 Year 4 Year 5 CAGR
Nifty 25% 25% 25% 25% -25% 12.9%
Company 1 40% 40% 40% 40% -49% 14.3%
Company 2 25% 25% 25% 25% -20% 14.3%
What drives long-term growth “g” and its
duration?
33
FLAME Investment Lab With The Masters - 2017
www.SageOneInvestments.com
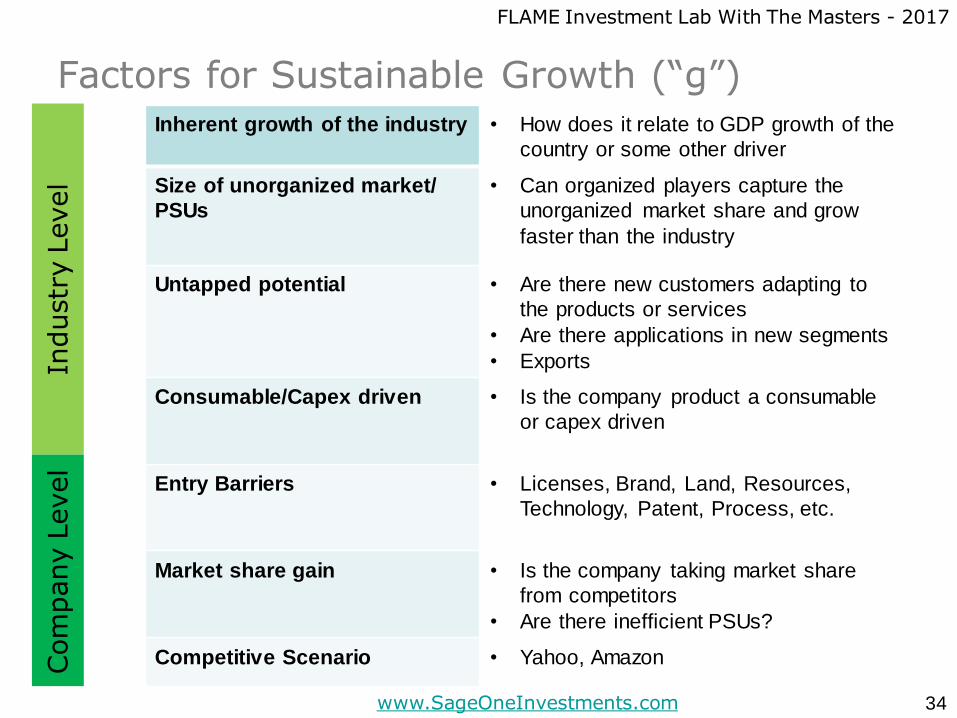
Factors for Sustainable Growth (“g”)
34
Inherent growth of the industry • How does it relate to GDP growth of the
country or some other driver
Size of unorganized market/
PSUs
• Can organized players capture the
unorganized market share and grow
faster than the industry
Untapped potential • Are there new customers adapting to
the products or services
• Are there applications in new segments
• Exports
Consumable/Capex driven • Is the company product a consumable
or capex driven
Entry Barriers • Licenses, Brand, Land, Resources,
Technology, Patent, Process, etc.
Market share gain • Is the company taking market share
from competitors
• Are there inefficient PSUs?
Competitive Scenario • Yahoo, Amazon
Industr
y L
evel
Com
pany L
evel
FLAME Investment Lab With The Masters - 2017
www.SageOneInvestments.com
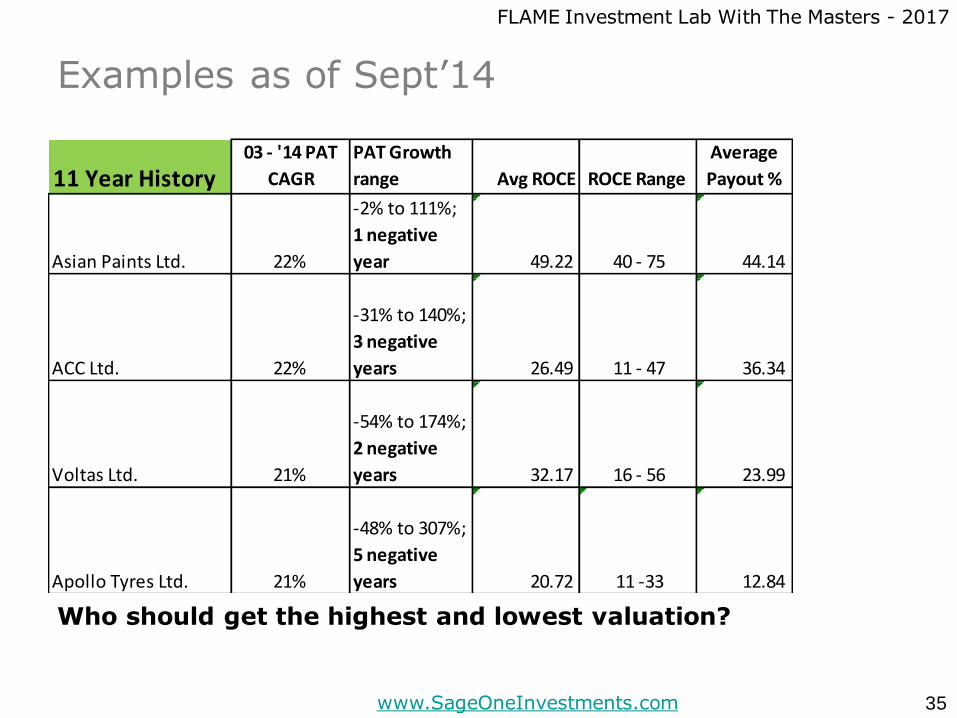
Examples as of Sept’14
35
11 Year History03 - '14 PAT
CAGR
PAT Growth
range Avg ROCE ROCE Range
Average
Payout %
Asian Paints Ltd. 22%
-2% to 111%;
1 negative
year 49.22 40 - 75 44.14
ACC Ltd. 22%
-31% to 140%;
3 negative
years 26.49 11 - 47 36.34
Voltas Ltd. 21%
-54% to 174%;
2 negative
years 32.17 16 - 56 23.99
Apollo Tyres Ltd. 21%
-48% to 307%;
5 negative
years 20.72 11 -33 12.84
Who should get the highest and lowest valuation?
FLAME Investment Lab With The Masters - 2017
www.SageOneInvestments.com
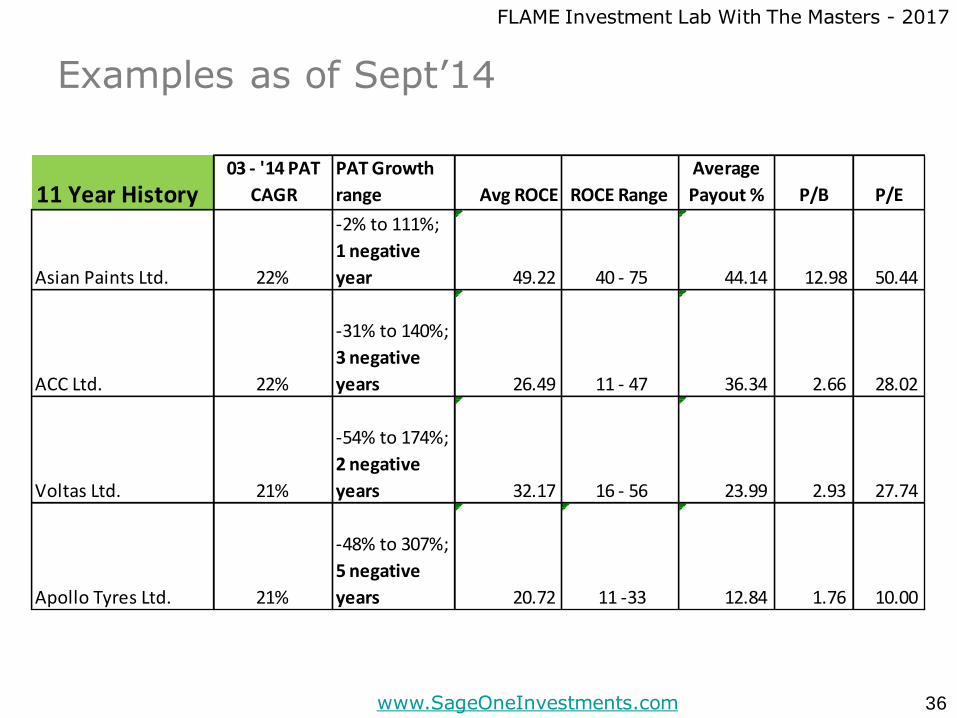
Examples as of Sept’14
36
11 Year History03 - '14 PAT
CAGR
PAT Growth
range Avg ROCE ROCE Range
Average
Payout % P/B P/E
Asian Paints Ltd. 22%
-2% to 111%;
1 negative
year 49.22 40 - 75 44.14 12.98 50.44
ACC Ltd. 22%
-31% to 140%;
3 negative
years 26.49 11 - 47 36.34 2.66 28.02
Voltas Ltd. 21%
-54% to 174%;
2 negative
years 32.17 16 - 56 23.99 2.93 27.74
Apollo Tyres Ltd. 21%
-48% to 307%;
5 negative
years 20.72 11 -33 12.84 1.76 10.00
FLAME Investment Lab With The Masters - 2017
www.SageOneInvestments.com
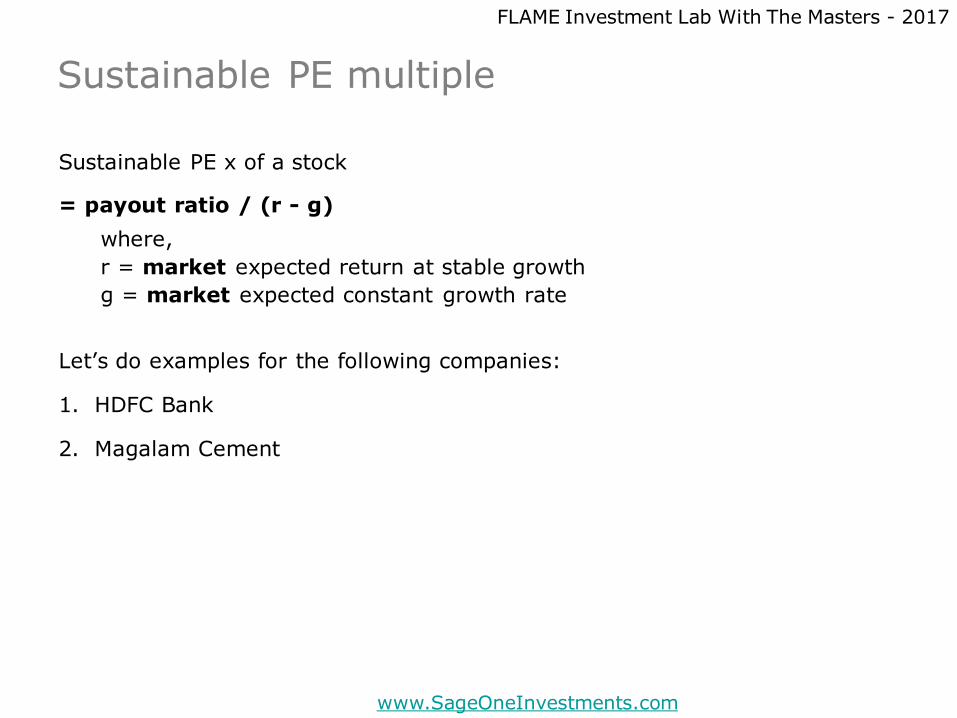
Sustainable PE multiple
Sustainable PE x of a stock
= payout ratio / (r - g)
where,
r = market expected return at stable growth
g = market expected constant growth rate
Let’s do examples for the following companies:
1. HDFC Bank
2. Magalam Cement
FLAME Investment Lab With The Masters - 2017
www.SageOneInvestments.com
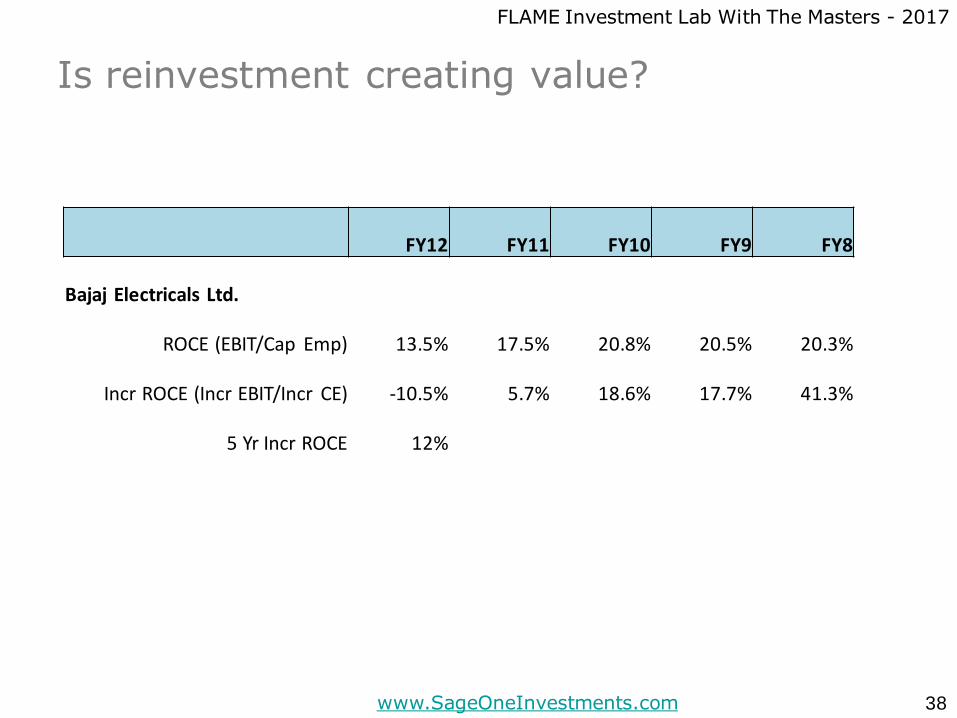
Is reinvestment creating value?
38
FY12 FY11 FY10 FY9 FY8
Bajaj Electricals Ltd.
ROCE (EBIT/Cap Emp) 13.5% 17.5% 20.8% 20.5% 20.3%
Incr ROCE (Incr EBIT/Incr CE) -10.5% 5.7% 18.6% 17.7% 41.3%
5 Yr Incr ROCE 12%
FLAME Investment Lab With The Masters - 2017
www.SageOneInvestments.com
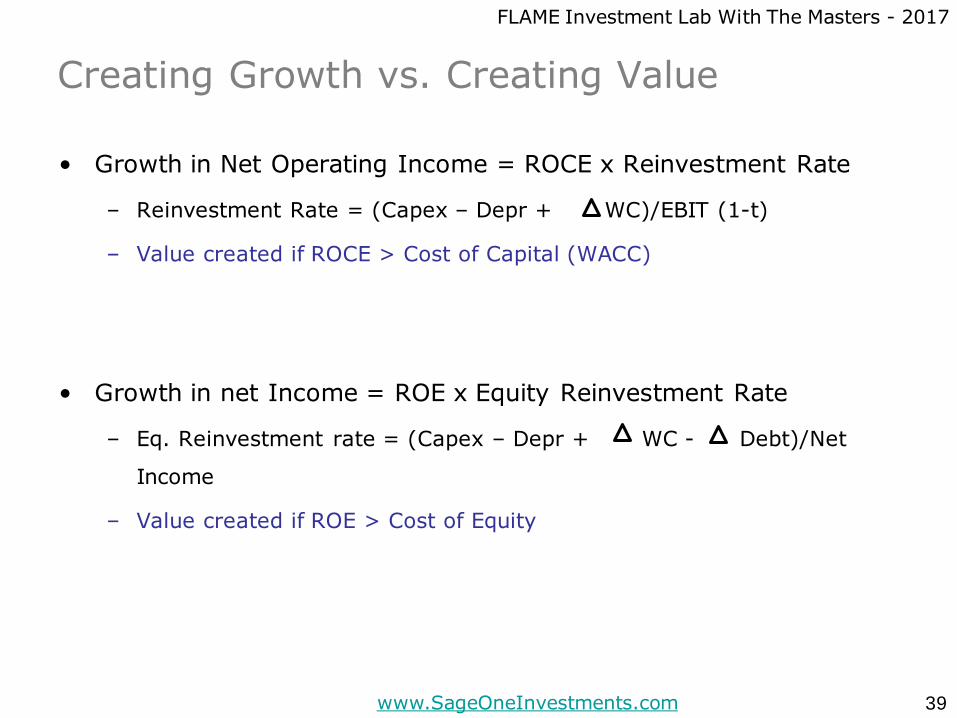
Creating Growth vs. Creating Value
• Growth in Net Operating Income = ROCE x Reinvestment Rate
– Reinvestment Rate = (Capex – Depr + WC)/EBIT (1-t)
– Value created if ROCE > Cost of Capital (WACC)
• Growth in net Income = ROE x Equity Reinvestment Rate
– Eq. Reinvestment rate = (Capex – Depr + WC - Debt)/Net
Income
– Value created if ROE > Cost of Equity
39
FLAME Investment Lab With The Masters - 2017
www.SageOneInvestments.com
Bottomline: Simple fundamentals of
valuation
• Value of perpetual (to infinity) growth above expected return
results in INFINITE value
• Any company who is capable of doing that will itself become the
entire economy and hence impossible
• Question is how long does the higher returning growth sustain
• After this, the return (from the business) falls below or at
expected returns level
• That’s the time to end forecast and calculate “Terminal Value”
40
FLAME Investment Lab With The Masters - 2017
www.SageOneInvestments.com
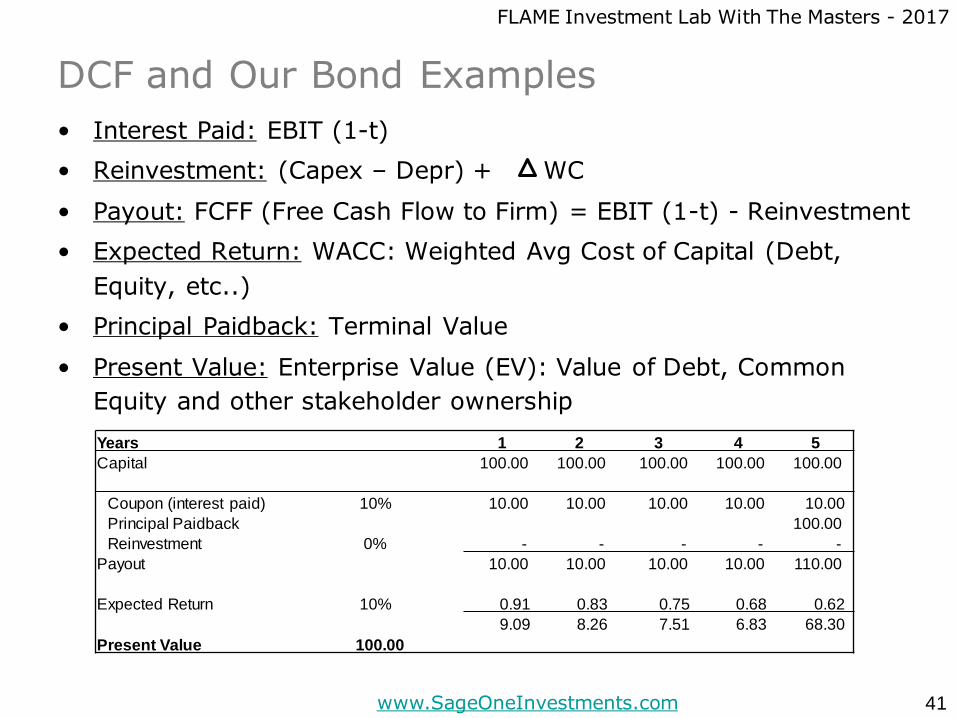
DCF and Our Bond Examples
• Interest Paid: EBIT (1-t)
• Reinvestment: (Capex – Depr) + WC
• Payout: FCFF (Free Cash Flow to Firm) = EBIT (1-t) - Reinvestment
• Expected Return: WACC: Weighted Avg Cost of Capital (Debt,
Equity, etc..)
• Principal Paidback: Terminal Value
• Present Value: Enterprise Value (EV): Value of Debt, Common
Equity and other stakeholder ownership
41
Years 1 2 3 4 5
Capital 100.00 100.00 100.00 100.00 100.00
Coupon (interest paid) 10% 10.00 10.00 10.00 10.00 10.00
Principal Paidback 100.00
Reinvestment 0% - - - - -
Payout 10.00 10.00 10.00 10.00 110.00
Expected Return 10% 0.91 0.83 0.75 0.68 0.62
9.09 8.26 7.51 6.83 68.30
Present Value 100.00
Valuation Case Studies
42
FLAME Investment Lab With The Masters - 2017
www.SageOneInvestments.com
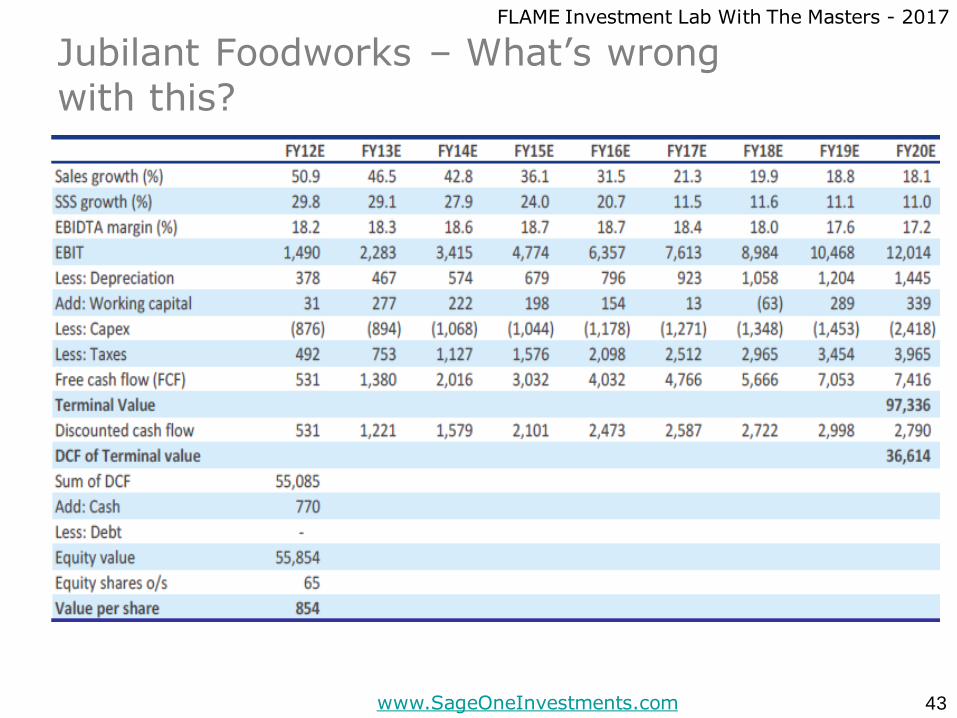
Jubilant Foodworks – What’s wrong
with this?
43
FLAME Investment Lab With The Masters - 2017
www.SageOneInvestments.com
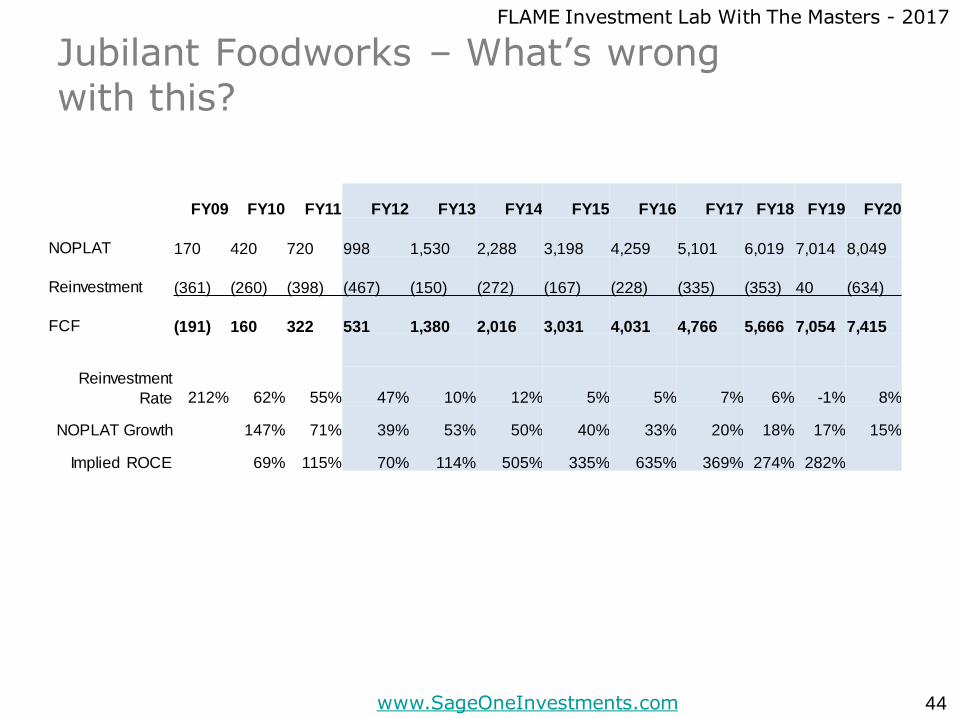
Jubilant Foodworks – What’s wrong
with this?
44
FY09 FY10 FY11 FY12 FY13 FY14 FY15 FY16 FY17 FY18 FY19 FY20
NOPLAT 170 420 720 998 1,530 2,288 3,198 4,259 5,101 6,019 7,014 8,049
Reinvestment (361) (260) (398) (467) (150) (272) (167) (228) (335) (353) 40 (634)
FCF (191) 160 322 531 1,380 2,016 3,031 4,031 4,766 5,666 7,054 7,415
Reinvestment
Rate 212% 62% 55% 47% 10% 12% 5% 5% 7% 6% -1% 8%
NOPLAT Growth 147% 71% 39% 53% 50% 40% 33% 20% 18% 17% 15%
Implied ROCE 69% 115% 70% 114% 505% 335% 635% 369% 274% 282%
FLAME Investment Lab With The Masters - 2017
www.SageOneInvestments.com
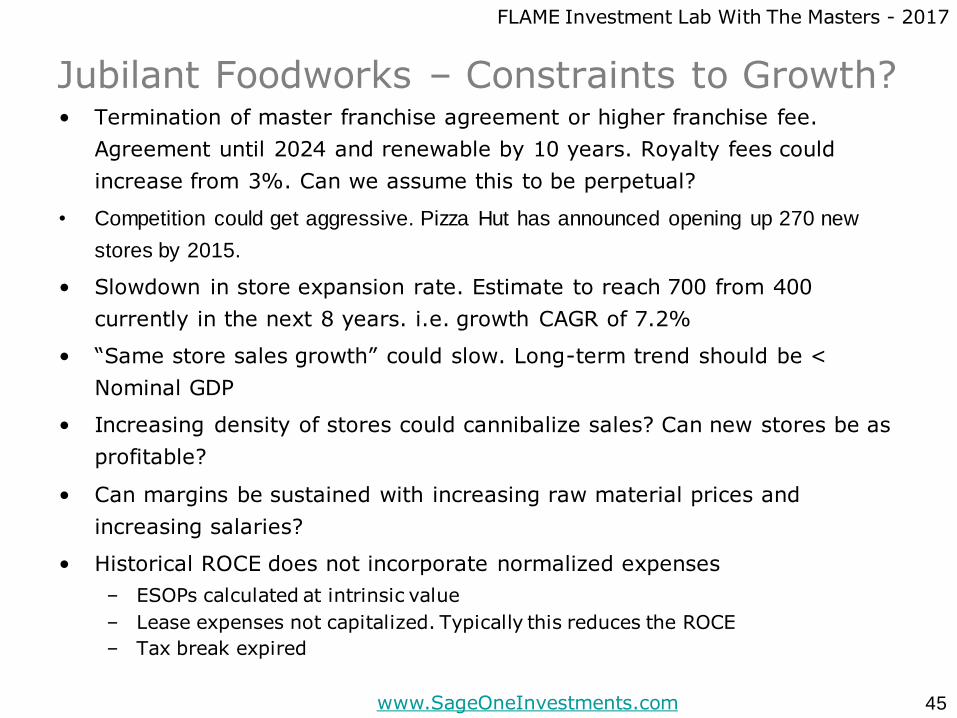
Jubilant Foodworks – Constraints to Growth?• Termination of master franchise agreement or higher franchise fee.
Agreement until 2024 and renewable by 10 years. Royalty fees could
increase from 3%. Can we assume this to be perpetual?
• Competition could get aggressive. Pizza Hut has announced opening up 270 new
stores by 2015.
• Slowdown in store expansion rate. Estimate to reach 700 from 400
currently in the next 8 years. i.e. growth CAGR of 7.2%
• “Same store sales growth” could slow. Long-term trend should be <
Nominal GDP
• Increasing density of stores could cannibalize sales? Can new stores be as
profitable?
• Can margins be sustained with increasing raw material prices and
increasing salaries?
• Historical ROCE does not incorporate normalized expenses
– ESOPs calculated at intrinsic value
– Lease expenses not capitalized. Typically this reduces the ROCE
– Tax break expired
45
FLAME Investment Lab With The Masters - 2017
www.SageOneInvestments.com
Jubilant Foodworks – Positives for Growth
• Dunkin’ Donuts store growth rate higher than estimated. Current
expectation of 80 stores in 5 years.
• Management able to sign more big master franchisee agreements.
• EBITDA margins expand above 19% currently (which management
indicated are not sustainable) driving ROCE higher.
• Smaller towns respond well and higher growth rate sustain over longer
duration.
46
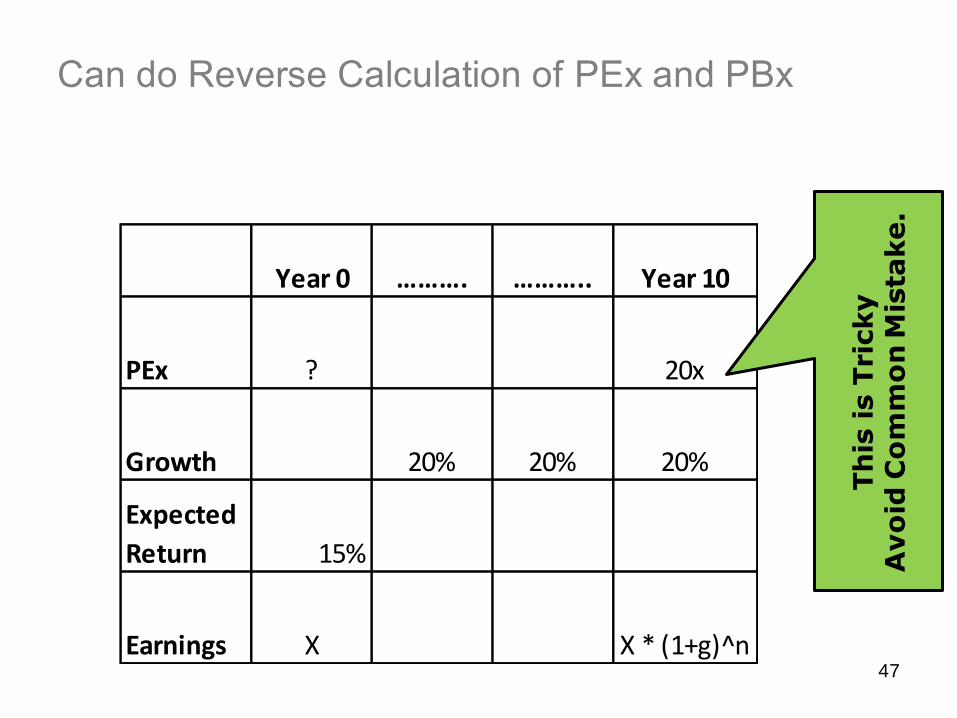
Can do Reverse Calculation of PEx and PBx
47
Year 0 ………. ……….. Year 10
PEx ? 20x
Growth 20% 20% 20%
Expected
Return 15%
Earnings X X * (1+g)^n
Th
is is T
ricky
Avo
id C
om
mo
n M
ista
ke.
View on Current Market Valuations
48
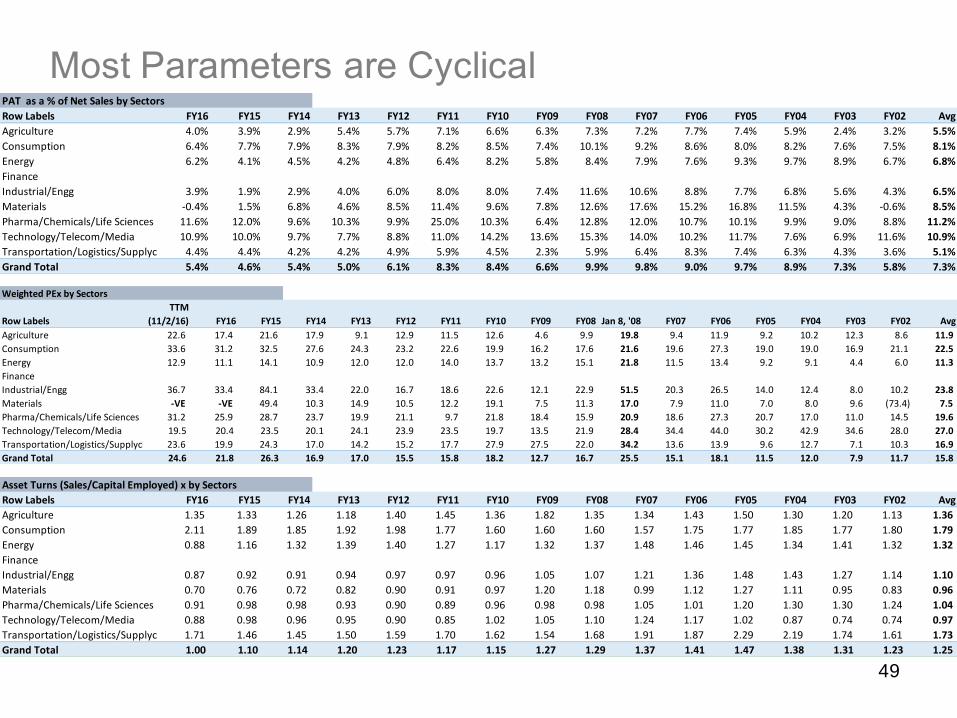
Most Parameters are Cyclical
49
PAT as a % of Net Sales by Sectors
Row Labels FY16 FY15 FY14 FY13 FY12 FY11 FY10 FY09 FY08 FY07 FY06 FY05 FY04 FY03 FY02 Avg
Agriculture 4.0% 3.9% 2.9% 5.4% 5.7% 7.1% 6.6% 6.3% 7.3% 7.2% 7.7% 7.4% 5.9% 2.4% 3.2% 5.5%
Consumption 6.4% 7.7% 7.9% 8.3% 7.9% 8.2% 8.5% 7.4% 10.1% 9.2% 8.6% 8.0% 8.2% 7.6% 7.5% 8.1%
Energy 6.2% 4.1% 4.5% 4.2% 4.8% 6.4% 8.2% 5.8% 8.4% 7.9% 7.6% 9.3% 9.7% 8.9% 6.7% 6.8%
Finance
Industrial/Engg 3.9% 1.9% 2.9% 4.0% 6.0% 8.0% 8.0% 7.4% 11.6% 10.6% 8.8% 7.7% 6.8% 5.6% 4.3% 6.5%
Materials -0.4% 1.5% 6.8% 4.6% 8.5% 11.4% 9.6% 7.8% 12.6% 17.6% 15.2% 16.8% 11.5% 4.3% -0.6% 8.5%
Pharma/Chemicals/Life Sciences 11.6% 12.0% 9.6% 10.3% 9.9% 25.0% 10.3% 6.4% 12.8% 12.0% 10.7% 10.1% 9.9% 9.0% 8.8% 11.2%
Technology/Telecom/Media 10.9% 10.0% 9.7% 7.7% 8.8% 11.0% 14.2% 13.6% 15.3% 14.0% 10.2% 11.7% 7.6% 6.9% 11.6% 10.9%
Transportation/Logistics/Supplychain 4.4% 4.4% 4.2% 4.2% 4.9% 5.9% 4.5% 2.3% 5.9% 6.4% 8.3% 7.4% 6.3% 4.3% 3.6% 5.1%
Grand Total 5.4% 4.6% 5.4% 5.0% 6.1% 8.3% 8.4% 6.6% 9.9% 9.8% 9.0% 9.7% 8.9% 7.3% 5.8% 7.3%
Asset Turns (Sales/Capital Employed) x by Sectors
Row Labels FY16 FY15 FY14 FY13 FY12 FY11 FY10 FY09 FY08 FY07 FY06 FY05 FY04 FY03 FY02 Avg
Agriculture 1.35 1.33 1.26 1.18 1.40 1.45 1.36 1.82 1.35 1.34 1.43 1.50 1.30 1.20 1.13 1.36
Consumption 2.11 1.89 1.85 1.92 1.98 1.77 1.60 1.60 1.60 1.57 1.75 1.77 1.85 1.77 1.80 1.79
Energy 0.88 1.16 1.32 1.39 1.40 1.27 1.17 1.32 1.37 1.48 1.46 1.45 1.34 1.41 1.32 1.32
Finance
Industrial/Engg 0.87 0.92 0.91 0.94 0.97 0.97 0.96 1.05 1.07 1.21 1.36 1.48 1.43 1.27 1.14 1.10
Materials 0.70 0.76 0.72 0.82 0.90 0.91 0.97 1.20 1.18 0.99 1.12 1.27 1.11 0.95 0.83 0.96
Pharma/Chemicals/Life Sciences 0.91 0.98 0.98 0.93 0.90 0.89 0.96 0.98 0.98 1.05 1.01 1.20 1.30 1.30 1.24 1.04
Technology/Telecom/Media 0.88 0.98 0.96 0.95 0.90 0.85 1.02 1.05 1.10 1.24 1.17 1.02 0.87 0.74 0.74 0.97
Transportation/Logistics/Supplychain 1.71 1.46 1.45 1.50 1.59 1.70 1.62 1.54 1.68 1.91 1.87 2.29 2.19 1.74 1.61 1.73
Grand Total 1.00 1.10 1.14 1.20 1.23 1.17 1.15 1.27 1.29 1.37 1.41 1.47 1.38 1.31 1.23 1.25
Weighted PEx by Sectors
Row Labels
TTM
(11/2/16) FY16 FY15 FY14 FY13 FY12 FY11 FY10 FY09 FY08 Jan 8, '08 FY07 FY06 FY05 FY04 FY03 FY02 Avg
Agriculture 22.6 17.4 21.6 17.9 9.1 12.9 11.5 12.6 4.6 9.9 19.8 9.4 11.9 9.2 10.2 12.3 8.6 11.9
Consumption 33.6 31.2 32.5 27.6 24.3 23.2 22.6 19.9 16.2 17.6 21.6 19.6 27.3 19.0 19.0 16.9 21.1 22.5
Energy 12.9 11.1 14.1 10.9 12.0 12.0 14.0 13.7 13.2 15.1 21.8 11.5 13.4 9.2 9.1 4.4 6.0 11.3
Finance
Industrial/Engg 36.7 33.4 84.1 33.4 22.0 16.7 18.6 22.6 12.1 22.9 51.5 20.3 26.5 14.0 12.4 8.0 10.2 23.8
Materials -VE -VE 49.4 10.3 14.9 10.5 12.2 19.1 7.5 11.3 17.0 7.9 11.0 7.0 8.0 9.6 (73.4) 7.5
Pharma/Chemicals/Life Sciences 31.2 25.9 28.7 23.7 19.9 21.1 9.7 21.8 18.4 15.9 20.9 18.6 27.3 20.7 17.0 11.0 14.5 19.6
Technology/Telecom/Media 19.5 20.4 23.5 20.1 24.1 23.9 23.5 19.7 13.5 21.9 28.4 34.4 44.0 30.2 42.9 34.6 28.0 27.0
Transportation/Logistics/Supplychain 23.6 19.9 24.3 17.0 14.2 15.2 17.7 27.9 27.5 22.0 34.2 13.6 13.9 9.6 12.7 7.1 10.3 16.9
Grand Total 24.6 21.8 26.3 16.9 17.0 15.5 15.8 18.2 12.7 16.7 25.5 15.1 18.1 11.5 12.0 7.9 11.7 15.8
FLAME Investment Lab With The Masters - 2017
www.SageOneInvestments.com
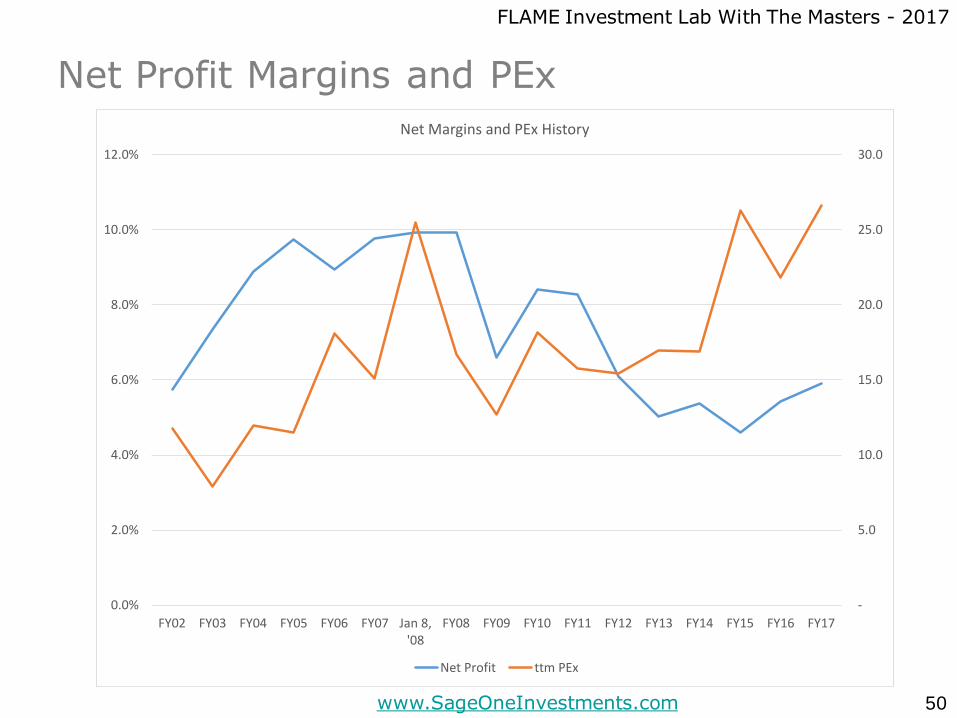
Net Profit Margins and PEx
50
-
5.0
10.0
15.0
20.0
25.0
30.0
0.0%
2.0%
4.0%
6.0%
8.0%
10.0%
12.0%
FY02 FY03 FY04 FY05 FY06 FY07 Jan 8,'08
FY08 FY09 FY10 FY11 FY12 FY13 FY14 FY15 FY16 FY17
Net Margins and PEx History
Net Profit ttm PEx
FLAME Investment Lab With The Masters - 2017
www.SageOneInvestments.com
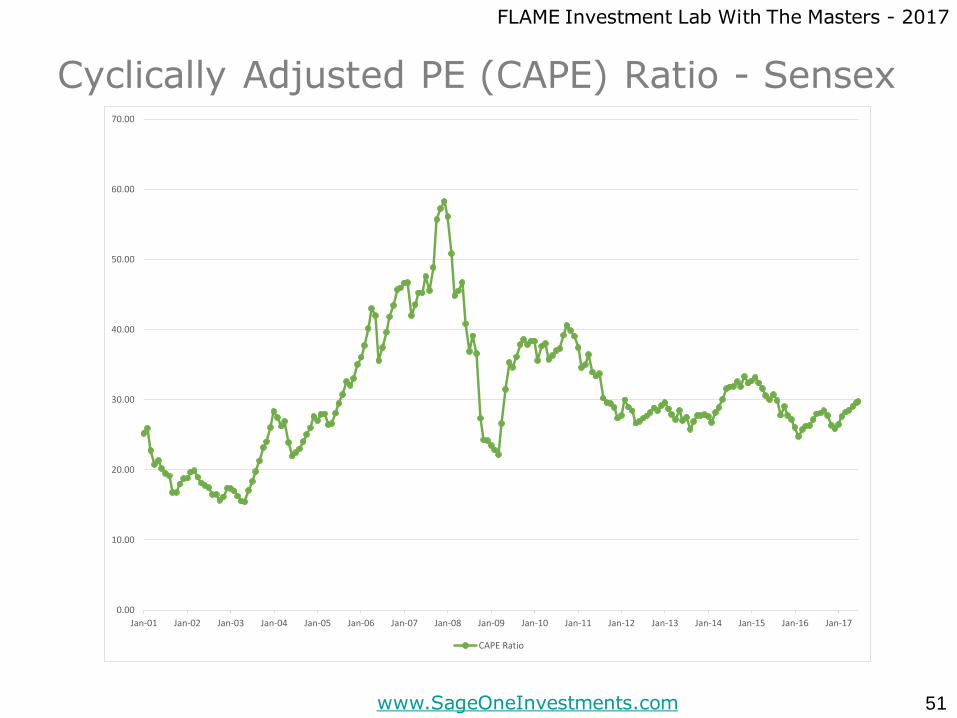
Cyclically Adjusted PE (CAPE) Ratio - Sensex
51
0.00
10.00
20.00
30.00
40.00
50.00
60.00
70.00
Jan-01 Jan-02 Jan-03 Jan-04 Jan-05 Jan-06 Jan-07 Jan-08 Jan-09 Jan-10 Jan-11 Jan-12 Jan-13 Jan-14 Jan-15 Jan-16 Jan-17
CAPE Ratio
FLAME Investment Lab With The Masters - 2017
www.SageOneInvestments.com
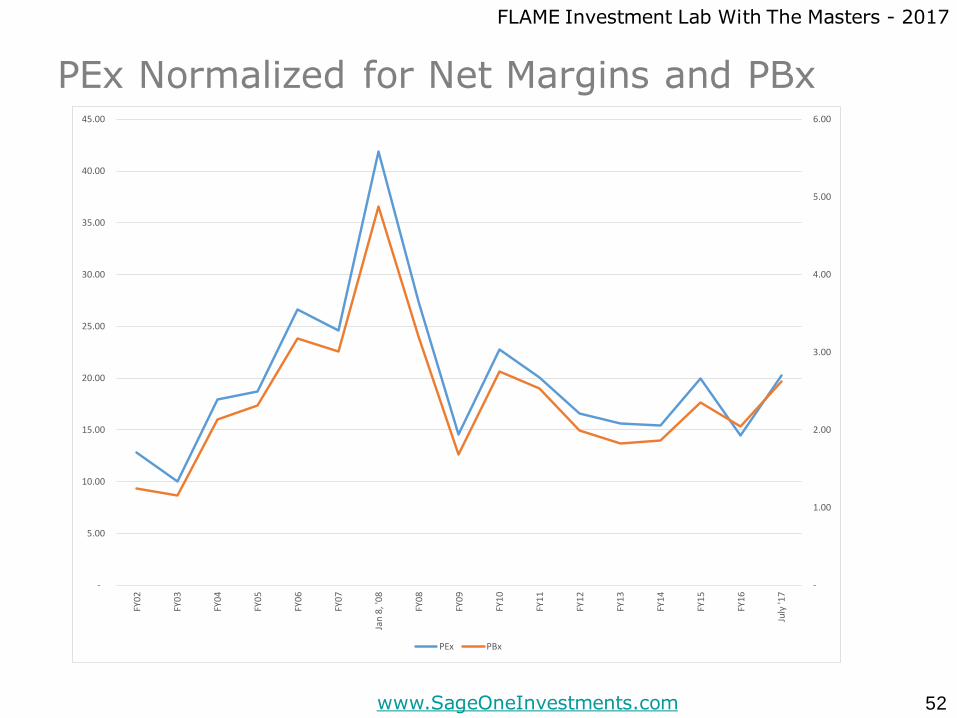
PEx Normalized for Net Margins and PBx
52
-
1.00
2.00
3.00
4.00
5.00
6.00
-
5.00
10.00
15.00
20.00
25.00
30.00
35.00
40.00
45.00
FY0
2
FY0
3
FY0
4
FY0
5
FY0
6
FY0
7
Jan
8, '
08
FY0
8
FY0
9
FY1
0
FY1
1
FY1
2
FY1
3
FY1
4
FY1
5
FY1
6
July
'17
PEx PBx
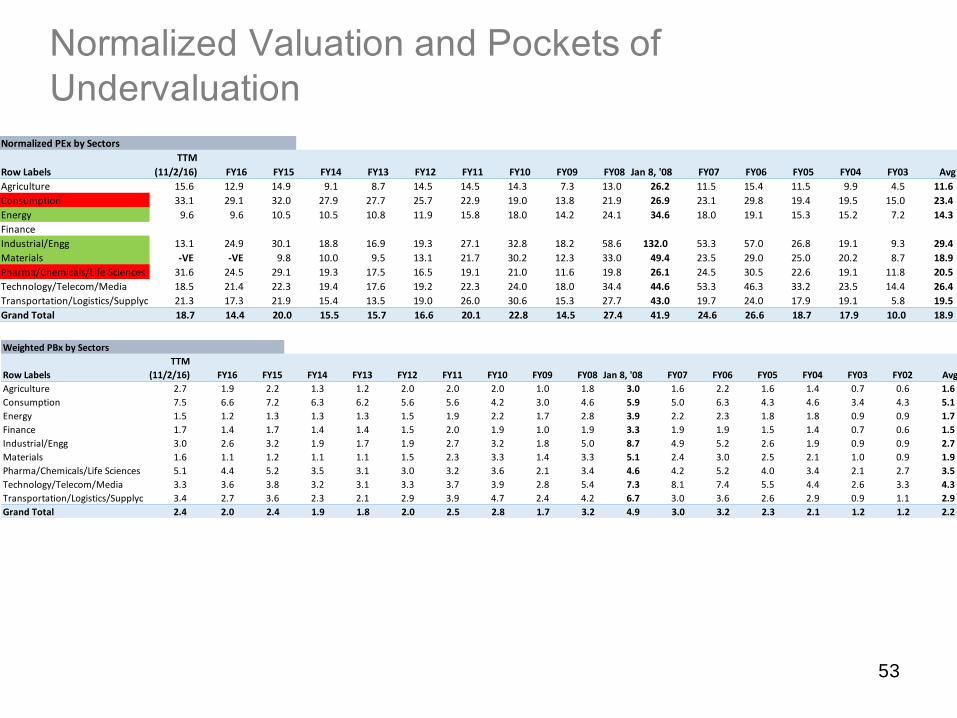
Normalized Valuation and Pockets of
Undervaluation
53
Normalized PEx by Sectors
Row Labels
TTM
(11/2/16) FY16 FY15 FY14 FY13 FY12 FY11 FY10 FY09 FY08 Jan 8, '08 FY07 FY06 FY05 FY04 FY03 Avg
Agriculture 15.6 12.9 14.9 9.1 8.7 14.5 14.5 14.3 7.3 13.0 26.2 11.5 15.4 11.5 9.9 4.5 11.6
Consumption 33.1 29.1 32.0 27.9 27.7 25.7 22.9 19.0 13.8 21.9 26.9 23.1 29.8 19.4 19.5 15.0 23.4
Energy 9.6 9.6 10.5 10.5 10.8 11.9 15.8 18.0 14.2 24.1 34.6 18.0 19.1 15.3 15.2 7.2 14.3
Finance
Industrial/Engg 13.1 24.9 30.1 18.8 16.9 19.3 27.1 32.8 18.2 58.6 132.0 53.3 57.0 26.8 19.1 9.3 29.4
Materials -VE -VE 9.8 10.0 9.5 13.1 21.7 30.2 12.3 33.0 49.4 23.5 29.0 25.0 20.2 8.7 18.9
Pharma/Chemicals/Life Sciences 31.6 24.5 29.1 19.3 17.5 16.5 19.1 21.0 11.6 19.8 26.1 24.5 30.5 22.6 19.1 11.8 20.5
Technology/Telecom/Media 18.5 21.4 22.3 19.4 17.6 19.2 22.3 24.0 18.0 34.4 44.6 53.3 46.3 33.2 23.5 14.4 26.4
Transportation/Logistics/Supplychain 21.3 17.3 21.9 15.4 13.5 19.0 26.0 30.6 15.3 27.7 43.0 19.7 24.0 17.9 19.1 5.8 19.5
Grand Total 18.7 14.4 20.0 15.5 15.7 16.6 20.1 22.8 14.5 27.4 41.9 24.6 26.6 18.7 17.9 10.0 18.9
Weighted PBx by Sectors
Row Labels
TTM
(11/2/16) FY16 FY15 FY14 FY13 FY12 FY11 FY10 FY09 FY08 Jan 8, '08 FY07 FY06 FY05 FY04 FY03 FY02 Avg
Agriculture 2.7 1.9 2.2 1.3 1.2 2.0 2.0 2.0 1.0 1.8 3.0 1.6 2.2 1.6 1.4 0.7 0.6 1.6
Consumption 7.5 6.6 7.2 6.3 6.2 5.6 5.6 4.2 3.0 4.6 5.9 5.0 6.3 4.3 4.6 3.4 4.3 5.1
Energy 1.5 1.2 1.3 1.3 1.3 1.5 1.9 2.2 1.7 2.8 3.9 2.2 2.3 1.8 1.8 0.9 0.9 1.7
Finance 1.7 1.4 1.7 1.4 1.4 1.5 2.0 1.9 1.0 1.9 3.3 1.9 1.9 1.5 1.4 0.7 0.6 1.5
Industrial/Engg 3.0 2.6 3.2 1.9 1.7 1.9 2.7 3.2 1.8 5.0 8.7 4.9 5.2 2.6 1.9 0.9 0.9 2.7
Materials 1.6 1.1 1.2 1.1 1.1 1.5 2.3 3.3 1.4 3.3 5.1 2.4 3.0 2.5 2.1 1.0 0.9 1.9
Pharma/Chemicals/Life Sciences 5.1 4.4 5.2 3.5 3.1 3.0 3.2 3.6 2.1 3.4 4.6 4.2 5.2 4.0 3.4 2.1 2.7 3.5
Technology/Telecom/Media 3.3 3.6 3.8 3.2 3.1 3.3 3.7 3.9 2.8 5.4 7.3 8.1 7.4 5.5 4.4 2.6 3.3 4.3
Transportation/Logistics/Supplychain 3.4 2.7 3.6 2.3 2.1 2.9 3.9 4.7 2.4 4.2 6.7 3.0 3.6 2.6 2.9 0.9 1.1 2.9
Grand Total 2.4 2.0 2.4 1.9 1.8 2.0 2.5 2.8 1.7 3.2 4.9 3.0 3.2 2.3 2.1 1.2 1.2 2.2
Can we Create Superior Returns
by Market Timing?
54
FLAME Investment Lab With The Masters - 2017
www.SageOneInvestments.com
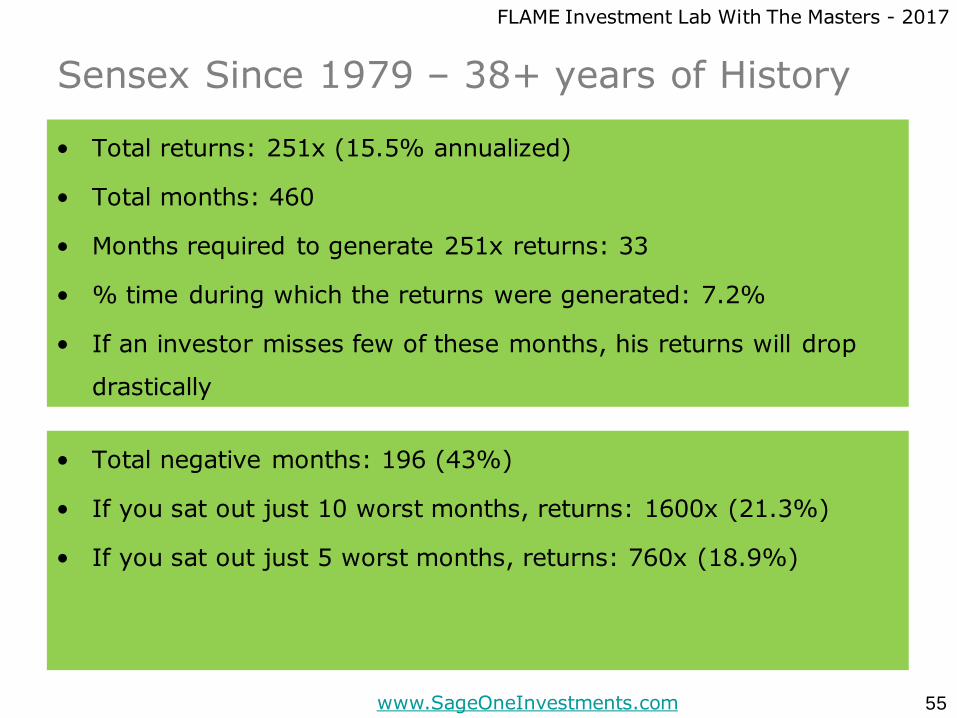
Sensex Since 1979 – 38+ years of History
• Total returns: 251x (15.5% annualized)
• Total months: 460
• Months required to generate 251x returns: 33
• % time during which the returns were generated: 7.2%
• If an investor misses few of these months, his returns will drop
drastically
55
• Total negative months: 196 (43%)
• If you sat out just 10 worst months, returns: 1600x (21.3%)
• If you sat out just 5 worst months, returns: 760x (18.9%)

FLAME Investment Lab With The Masters - 2017
www.SageOneInvestments.com
Sensex last 10 years of History
• Total returns: 2.1x (7.5% annualized)
• Total months: 120
• Months required to generate 2.1x returns: 5
• % time during which the returns were generated: 4.1%
56
• Total negative months: 55 (46%)
• If you sat out just 5 worst months, returns: 4.8x (17%)
• If you sat out just 2 worst months, returns: 3.3x (12.7%)
But can you time such months?
FLAME Investment Lab With The Masters - 2017
www.SageOneInvestments.com
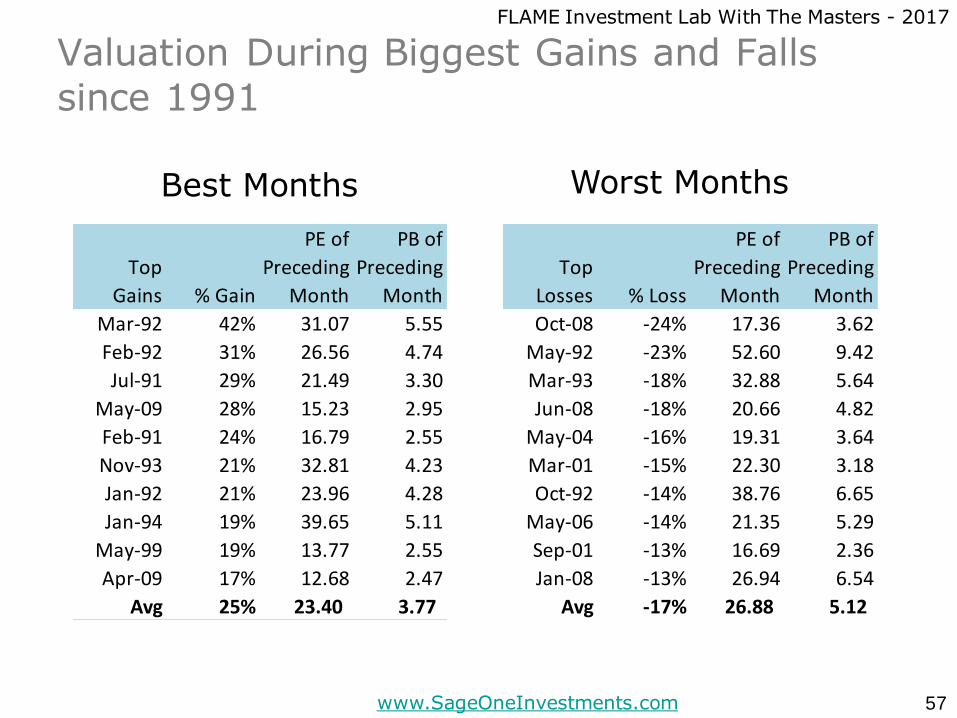
Valuation During Biggest Gains and Falls
since 1991
57
Top
Gains % Gain
PE of
Preceding
Month
PB of
Preceding
Month
Mar-92 42% 31.07 5.55
Feb-92 31% 26.56 4.74
Jul-91 29% 21.49 3.30
May-09 28% 15.23 2.95
Feb-91 24% 16.79 2.55
Nov-93 21% 32.81 4.23
Jan-92 21% 23.96 4.28
Jan-94 19% 39.65 5.11
May-99 19% 13.77 2.55
Apr-09 17% 12.68 2.47
Avg 25% 23.40 3.77
Top
Losses % Loss
PE of
Preceding
Month
PB of
Preceding
Month
Oct-08 -24% 17.36 3.62
May-92 -23% 52.60 9.42
Mar-93 -18% 32.88 5.64
Jun-08 -18% 20.66 4.82
May-04 -16% 19.31 3.64
Mar-01 -15% 22.30 3.18
Oct-92 -14% 38.76 6.65
May-06 -14% 21.35 5.29
Sep-01 -13% 16.69 2.36
Jan-08 -13% 26.94 6.54
Avg -17% 26.88 5.12
Best Months Worst Months
FLAME Investment Lab With The Masters - 2017
www.SageOneInvestments.com
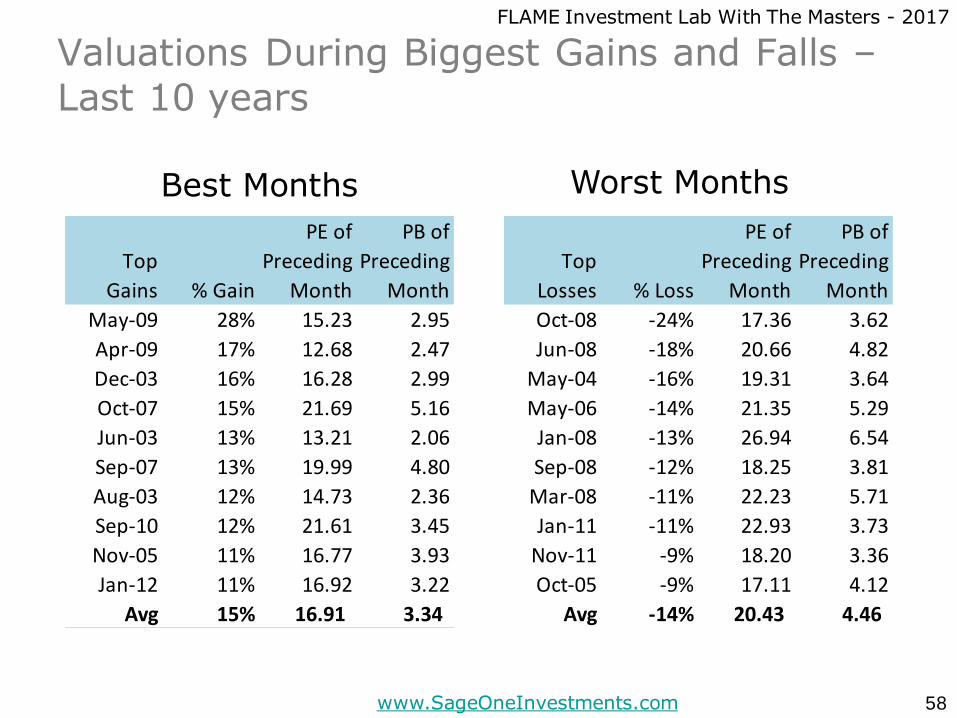
Valuations During Biggest Gains and Falls –
Last 10 years
58
Top
Losses % Loss
PE of
Preceding
Month
PB of
Preceding
Month
Oct-08 -24% 17.36 3.62
Jun-08 -18% 20.66 4.82
May-04 -16% 19.31 3.64
May-06 -14% 21.35 5.29
Jan-08 -13% 26.94 6.54
Sep-08 -12% 18.25 3.81
Mar-08 -11% 22.23 5.71
Jan-11 -11% 22.93 3.73
Nov-11 -9% 18.20 3.36
Oct-05 -9% 17.11 4.12
Avg -14% 20.43 4.46
Top
Gains % Gain
PE of
Preceding
Month
PB of
Preceding
Month
May-09 28% 15.23 2.95
Apr-09 17% 12.68 2.47
Dec-03 16% 16.28 2.99
Oct-07 15% 21.69 5.16
Jun-03 13% 13.21 2.06
Sep-07 13% 19.99 4.80
Aug-03 12% 14.73 2.36
Sep-10 12% 21.61 3.45
Nov-05 11% 16.77 3.93
Jan-12 11% 16.92 3.22
Avg 15% 16.91 3.34
Best Months Worst Months

FLAME Investment Lab With The Masters - 2017
www.SageOneInvestments.com
Big Losses & Gains vs Valuation
59
0.00
1.00
2.00
3.00
4.00
5.00
6.00
7.00
8.00
9.00
10.00
0.00
10.00
20.00
30.00
40.00
50.00
60.00Ja
n-9
1
Jan
-92
Jan
-93
Jan
-94
Jan
-95
Jan
-96
Jan
-97
Jan
-98
Jan
-99
Jan
-00
124% Gain in 3 mos
Earnings Trippled. PEx corrected butmarkets not as much
FLAME Investment Lab With The Masters - 2017
www.SageOneInvestments.com
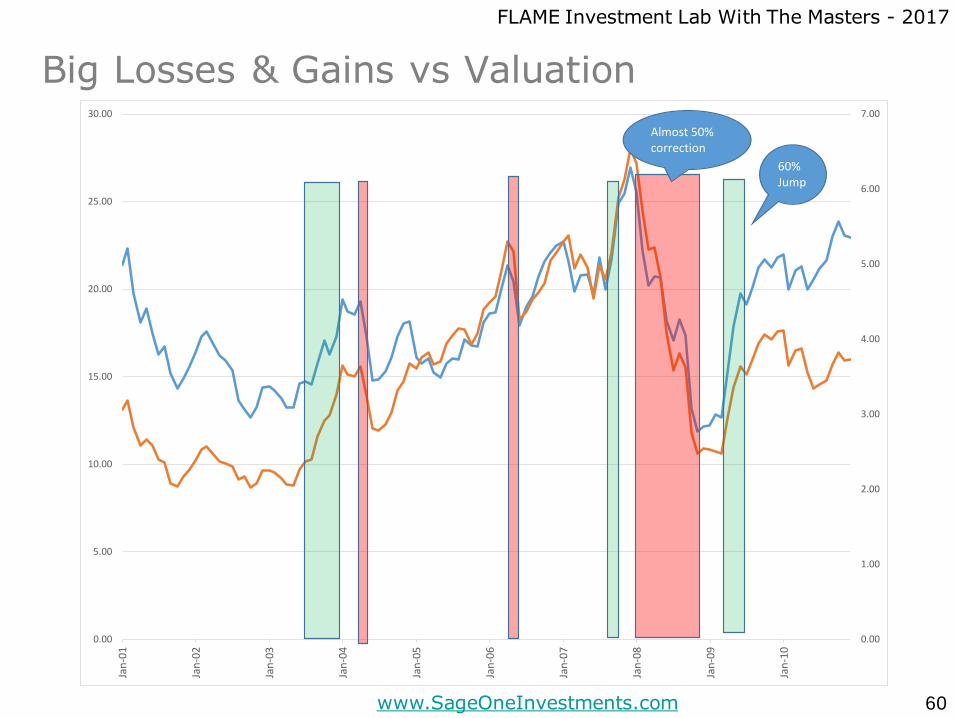
Big Losses & Gains vs Valuation
60
0.00
1.00
2.00
3.00
4.00
5.00
6.00
7.00
0.00
5.00
10.00
15.00
20.00
25.00
30.00Ja
n-0
1
Jan
-02
Jan
-03
Jan
-04
Jan
-05
Jan
-06
Jan
-07
Jan
-08
Jan
-09
Jan
-10
Almost 50% correction
60% Jump
FLAME Investment Lab With The Masters - 2017
www.SageOneInvestments.com
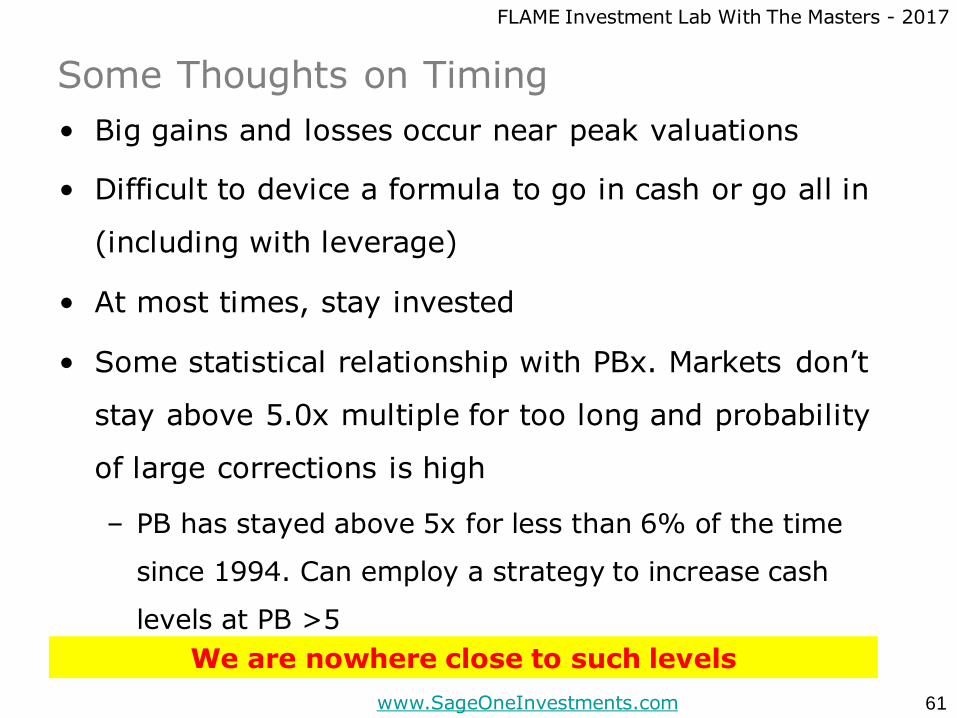
Some Thoughts on Timing
• Big gains and losses occur near peak valuations
• Difficult to device a formula to go in cash or go all in
(including with leverage)
• At most times, stay invested
• Some statistical relationship with PBx. Markets don’t
stay above 5.0x multiple for too long and probability
of large corrections is high
– PB has stayed above 5x for less than 6% of the time
since 1994. Can employ a strategy to increase cash
levels at PB >5
61
We are nowhere close to such levels
Access detailed analysis (under “Newsletters & Presentation”) @ www.SageOneInvestments.com
Email: [email protected]
: @SamitVartak
62