Embed Size (px)
Citation preview

This product is suitable for investors who are
seeking*:
• Capital appreciation over long term
• Investment in stocks based on special situations theme.
* Investors should consult their financial advisers if in
doubt about whether the product is suitable for them.
Axis Special Situations Fund(An open ended equity scheme following special
situations theme)
Target the Power of
Disruptive Growth^
^There are no guarantee/assurance of returns.

2
How do we define Special Situations?
Opportunities presented by
changing business environment
Looking at change agents
over multiple horizons
Long Term
Medium Term
Short Term
Disruption
Sector
Dynamics Shifts
Event Based
1
2
3

3
An opportunity to capture the value created by
disruptive growth
Disruption begets innovation, innovation
creates disruption
Disruptive growth is an opportunity for investors
to capture significant value creation over time
Disruption is all around us and accelerating

4
Markets are inefficient at factoring in
disruptive change
Financial Markets are slow
to recognize disruptive
innovation
The impact of
unanticipated change is
often overlooked
Can lead to a gap between
market expectations and
actual growth potential
Creates
potential for
Mispricing
Sector
Dynamics
Company
Specific
Events
New
Technolo
gies Global
Events
Consumer
Behaviour
Changes
New
Business
Models
Regulatory
Changes
The above list is illustrative and not exhaustive; there are several other opportunities that may give rise to special situations

5
Accelerated Adoption of digital platforms
Source: Goldman Sachs, Axis AMC Research. Data as on 30th October 2020.
The sector(s)/stock(s)/issuer(s) mentioned in this presentation are for the purpose of illustration only and should not be construed as any research
report/recommendation to buy / sell / hold. The Fund manager may or may not choose to have any future position in these sector(s)/stock(s)/issuer(s).
Indian economy primed for Disruption
Pandemic has changed the narrative
High User Engagement: App Downloads Now Vs Pre-Covid Levels (3QCY20 vs 1QCY20)
0.3x
0.5x0.6x
0.8x0.9x
1.0x1.1x 1.2x
1.3x 1.4x
1.6x
2.0x2.1x
0%
10%
20%
30%
40%
50%
60%
70%
Air Travel Payments* Advertisment Hotels E-Commerce Food Services FMCG/Grocery
Current India (FY25E)

6
Disrupting the way we transact
UPI Share of Transactions Monthly Active Users for key payment and bank apps
Government push helping India being ahead of the world
Digital Payments are rising as people enjoy their convenience
Source: NPCI, Axis MF Research
Data as of 30th October 2020. The sector(s)/stock(s)/issuer(s) mentioned in this presentation are for the purpose of illustration only and should not be
construed as any research report/recommendation to buy / sell / hold. The Fund manager may or may not choose to have any future position in these
sector(s)/stock(s)/issuer(s).
1%
9%
38%
54%
69%
2017 2018 2019 2020 2021 YTD
34
17
6.6
1.4 1.1 1
Google Pay Phone Pe SBI YONO HDFC Bank BajajFinserv
ICICI Bank
Million Users

7
Disrupting the way we eat/shop
Source: Goldman Sachs, Bernstein, Bloomberg, Axis AMC Research. Data as on 30th October 2020. GS Report on India Internet -The curve continues to steepen.
The sector(s)/stock(s)/issuer(s) mentioned in this presentation are for the purpose of illustration only and should not be construed as any research
report/recommendation to buy / sell / hold. The Fund manager may or may not choose to have any future position in these sector(s)/stock(s)/issuer(s).
Post COVID, Average Order Value has
increased, Promotions have reduced, and
Profitability has risen
E-grocery penetration is <0.5% in India,
significantly lower than other categories
India (Zomato/Swiggy) vs Global Players Online Grocery Number of app downloads
(3 month average indexed to DMART)

8
Future Market Potential
Source: Bernstein, Bloomberg, Axis AMC Research. Data as on 30th October 2020. The sector(s)/stock(s)/issuer(s) mentioned in this presentation are for the
purpose of illustration only and should not be construed as any research report/recommendation to buy / sell / hold. The Fund manager may or may not
choose to have any future position in these sector(s)/stock(s)/issuer(s).
Segment Revenue Size in 2020 Revenue Size in 2030
Online Food Delivery 1.0 10.0
Shared Mobility: 0.7 1.8
E-Commerce Logistcs 2.0 15.4
Online Education 1.0 19.7
Ecommerce Retail 3.9 37.7
Unorganized Retail (Digital) 0.0 25.1
Renewable Power 10.0 30.0
OTT 0.2 1.2
Online Gaming 0.9 9.2
- in $bn including EVs and Renewables 20 180
Target market influenced by new economy in $bn 83 1,324
Current size of Indian Economy pegged at
US$2.8 trillion. In effect new economy is likely
to influence/create ~46% of India current
GDP value terms

9
Company SegmentValuation
($bn)*Global major peers
Market Cap
( $ bn)
Delhivery Ecommerce logistics 1.5 ZTO Express 26
Flipkart Ecommerce 25.0 Amazon US 1,560
Ola Ride Hailing service 6.5 Uber 81
Zomato Online food delivery 3.3 Meituan 230
Byju's EdTech 10.8 Yuanfudao* 7.8
Paytm FinTech 16.0 Ant Financials* 279
Policybazar Online Insurance 1.5 ZhongAn 7.5
Bigbasket Inline Grocery 1.2 Sun Art* 10.1
Pepperfry Online furniture 0.5
Oyo Online Hotel Aggregator 8.4 AirBnb 18
Opportunity in the Indian Disruptors
Potential Future Listed Players
Source: Bernstein, Axis AMC Research. Data as on 20th November, 2020.
*Sun Art is mix of online + offline grocery retail, Valuation of Ant Financials is based on IPO price, Yuanfudao is not listed. For all unlisted players valuation
is as of last funding date. The sector(s)/stock(s)/issuer(s) mentioned in this presentation are for the purpose of illustration only and should not be construed
as any research report/recommendation to buy / sell / hold. The Fund manager may or may not choose to have any future position in these
sector(s)/stock(s)/issuer(s).

10
How do you capture value
of disruptive growth?

11
Capturing the value of disruptive growth
Tip of the Iceberg
Often overlooked when
we think of disruptors,
but can be just as big beneficiaries.
The source, or cause of
innovative disruption
The conduit for change
The positive respondent
The incumbent going
down/losing ground
Beneficiaries Future Laggards
Disrupter
Adaptor
Enablers
Denier
12
Innovation in existing business
Reliance disrupting telecom and now other industries
A case study for illustration purpose only. Not intended as advise / recommendation
Past performance may or may not be sustained in future. The sector(s)/stock(s)/issuer(s) mentioned in this presentation should not be construed as any research
report/recommendation to buy / sell / hold. The Fund manager may or may not choose to have any future position in these sector(s)/stock(s)/issuer(s).
Source: Reliance Annual Report, Bloomberg, Axis AMC Research. Data as on 30th October 2020.
Disruptor
2019-2020 Reliance IndustriesRevenue ($ bn)
Jio Platforms Ownership
Case Study
Facebook 9.99%
Silverlake 1.15%
Vista 2.32%
General Atlantic 1.34%
KKR 2.32%
Mubadala 1.85%
Silverlake 0.93%
ADIA 1.16%
TPG 0.93%
L Catterton 0.39%
PIF 2.32%
Google 7.7%

13
Dexcom Continuous Glucose Monitoring SystemA radical improvement in Diabetes Management
A case study for illustration purpose only. Not intended as advise / recommendation
The sector(s)/stock(s)/issuer(s) mentioned in this presentation should not be construed as any research report/recommendation to buy / sell / hold. The Fund
manager may or may not choose to have any future position in these sector(s)/stock(s)/issuer(s). Source: Company data, as at 31st December 2019.
Drug delivery
– Pens
– Disposable pumps
– Durable pumps and
supplies
Drugs
– Insulins– Other T2 compounds– Other medications
Service
– Clinicians
– Hospitals
– Education
Analytics
– Algorithms
– Outcome measurement
– Decision support and
coaching
Global Disruptor
Case Study

14
Enabling digital disruption
Indian Information Technology
A case study for illustration purpose only. Not intended as advise / recommendation
Past performance may or may not be sustained in future. The sector(s)/stock(s)/issuer(s) mentioned in this presentation should not be construed as any
research report/recommendation to buy / sell / hold. The Fund manager may or may not choose to have any future position in these
sector(s)/stock(s)/issuer(s). Source: Goldman Sachs, Motilal, Bloomberg, Axis AMC Research. Data as on 30th October 2020.
Infosys and TCS has helped with large scale transformation of companies.
Enabled clients to effectively manage disruptions like the Covid-19 pandemic.
13%16%
19%
25%
32%
0%
5%
10%
15%
20%
25%
30%
35%
1Q
FY1
6
2Q
FY1
6
3Q
FY1
6
4Q
FY1
6
1Q
FY1
7
2Q
FY1
7
3Q
FY1
7
4Q
FY1
7
1Q
FY1
8
2Q
FY1
8
3Q
FY1
8
4Q
FY1
8
1Q
FY1
9
2Q
FY1
9
3Q
FY1
9
4Q
FY1
9
1Q
FY2
0
2Q
FY2
0
24%28%
36%
45%
0%
5%
10%
15%
20%
25%
30%
35%
40%
45%
50%TCS: % of Revenue from Digital Infosys: % of Revenue from Digital
Enabler Case Study

15
Enablers in Transportation: the shift to electric vehiclesServing a pool of potential winners, not a single name
A case study for illustration purpose only. Not intended as advise / recommendation
The sector(s)/stock(s)/issuer(s) mentioned in this presentation should not be construed as any research report/recommendation to buy / sell / hold. The Fund
manager may or may not choose to have any future position in these sector(s) /stock(s) / issuer(s) Source: Schroders, as at 31st January 2020. Values are market
caps is USD billions.
$7.40bnHigh-performance fiber laser developer and manufacturer
$29.57bnSpecialist battery
manufacturer
$123.22bnSemiconductor design
and manufacturer
$31.18bnDesigner and producer
of connectivity andsensor products
Samsung SDI
Texas Instruments IPG Photonics
TE Connectivity
Global Enabler
Case Study
16
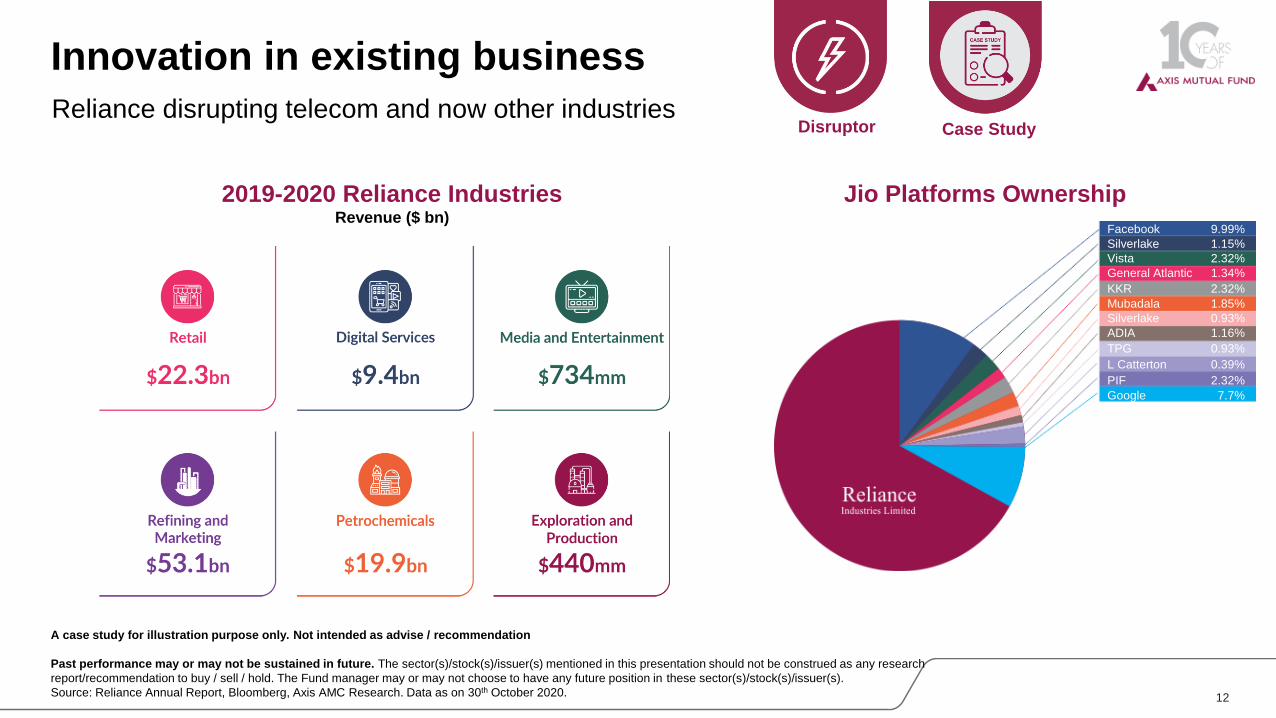
Adapting to new age distribution
HDFC Life adapted to the coming times in life insurance sector
A case study for illustration purpose only. Not intended as advise / recommendation
Past performance may or may not be sustained in future. The sector(s)/stock(s)/issuer(s) mentioned in this presentation should not be construed as any
research report/recommendation to buy / sell / hold. The Fund manager may or may not choose to have any future position in these
sector(s)/stock(s)/issuer(s). Source: Axis AMC Research, as at 30th September 2020.
0%
4%
8%
12%
16%
20%
FY17 FY18 FY19 FY20 YTD FY21
Market Share
Amongst Private players Amongst all players
HDFC Life was the first to identify the distribution opportunity in new age channels like Web aggregators such as Ola/Uber, Payments ecosystem like PayTM, & Telecom companies like Airtel.
Adaptor Case Study

17
Adapting to disruptive change
Microsoft successfully transitions to the Cloud
A case study for illustration purpose only. Not intended as advise / recommendation
Past performance may or may not be sustained in future. The sector(s)/stock(s)/issuer(s) mentioned in this presentation should not be construed as
any research report/recommendation to buy / sell / hold. The Fund manager may or may not choose to have any future position in these
sector(s)/stock(s)/issuer(s). Source: Thomson DataStream, as at 30th September 2020.
0
150
300
450
600
750
900
1,050
Dec 2008 Dec 2009 Dec 2010 Dec 2011 Dec 2012 Dec 2013 Dec 2014 Dec 2015 Dec 2016 Dec 2017 Dec 2018 Dec 2019
Microsoft IBM
Satya Nadella appointed
CEO
Global Adaptor
Case Study

18
Sector Dynamic Shifts
Cyclical: Bharat Forge and Cycles
A case study for illustration purpose only. Not intended as advise / recommendation
Past performance may or may not be sustained in future. The sector(s)/stock(s)/issuer(s) mentioned in this presentation should not be construed as any
research report/recommendation to buy / sell / hold. The Fund manager may or may not choose to have any future position in these
sector(s)/stock(s)/issuer(s). Source: Bloomberg, Axis AMC Research. Data as on 30th September, 2020.
250
350
450
550
650
750
850
2030405060708090
Ja
n-1
5
Ma
y-1
5
Sep
-15
Ja
n-1
6
Ma
y-1
6
Sep
-16
Ja
n-1
7
Ma
y-1
7
Sep
-17
Ja
n-1
8
Ma
y-1
8
Sep
-18
Ja
n-1
9
Ma
y-1
9
Sep
-19
Ja
n-2
0
Ma
y-2
0
Sep
-20
Brent Oil Price BHFC Stock Price- RHS
Structural: Divi’s Laboratories
COVID-19 led supply disruption from China is a tailwind for Indian API companies including Divi’s as global pharmaceutical companies look to diversify their sourcing vendors and reduce
dependency on a single country
0
1,000
2,000
3,000
4,000
5,000
6,000
2016 2017 2018 2019 2020
Proven track record, well positioned for the shift
Revenue Net Profit
Strong link with the cyclical nature of US and India commercial vehicles sales and global economic cycles (Oil)
Case Study

19
Event Based
Wipro change in management
Wipro has announced a new operating model and structure
40
60
80
100
120
140
160
Dec-19 Jan-20 Feb-20 Mar-20 Apr-20 May-20 Jun-20 Jul-20 Aug-20 Sep-20 Oct-20
A case study for illustration purpose only. Not intended as advise / recommendation
Past performance may or may not be sustained in future. The sector(s)/stock(s)/issuer(s) mentioned in this presentation should not be construed as any
research report/recommendation to buy / sell / hold. The Fund manager may or may not choose to have any future position in these sector(s)/stock(s)/issuer(s)
Source: Bloomberg, Axis AMC Research. Data as on 30th September 2020. Price Movement (Rebased to 100)
New CEO appointed
Wipro NIFTY 50
Case Study

About the Fund
20

21
Fund Construct
Multi Faceted, Multi Cap, Multi Sector
As per suitable
opportunities
Portfolio Build
Events Based
Disruption(Core)
(Including upto
30% Global
Disruptors)
Sector Dynamic
Shifts
Adaptor
Enabler
Disruptor
As per suitable
opportunities
Please refer to the Scheme Information document for detailed asset allocation and investment strategy.

22
How will we manage overseas allocation?
Multi Faceted, Multi Cap, Multi Sector
INVESTMENT
Invest directly in overseas securities
GLOBAL ADVICE
Overseas investments will be advised by Schroder Investment Management Limited based on their disruption philosophy
EXECUTION
Transaction executed through key intermediaries
(broking/custody) across major global markets
PHILOSOPHY
Aligned with domestic investment philosophy of looking for opportunities across disruptors, enablers & adapters
Please refer to the Scheme Information document of the document for detailed asset allocation and investment strategy. Axis AMC may appoint investment advisors for
overseas investments. Axis AMC proposes to appoint Schroders to provide investment advice for investment in foreign securities. The scheme will Invest directly in
overseas securities

23
Schroder Global Disruption Team
Portfolio managementAlex Tedder + Team
Global Sector specialist and
analysis
Disruption Advisory Group
Data Insights Unit team of
Over 20 Data scientists / analysis
Private Equity team sharing insights
from early and late stageventure investing across sector
Team of
90+Local analysis
Across
11 countries
Quantitative Screening Tools

Fund Facts
24
Name Category Fund Manager
Minimum Application Benchmark NFO Period
Axis Special
Situation FundThematic Scheme Mr. Ashish Naik &
Mr. Hitesh Das (For foreign securities)
Rs. 5,000 and
in multiples of Rs. 1 thereafter4th December 2020
18th December 2020
NIFTY 500 TRI

Annexure
25

26
Tech in the forefront of global equities
9
11
13
15
17
19
21
23
25
199
0
199
2
199
4
199
6
199
8
200
0
200
2
200
4
200
6
200
8
201
0
201
2
201
4
201
6
201
8
202
0
202
2
Top 5 companies % of S&P500 market cap
2000: Microsoft, GE, Cisco, Intel, Walmart
2020: Microsoft, Apple, Amazon, Alphabet, Facebook
Source: BofA Global Investment Strategy, Bloomberg. As at 30 th September 2020.
The sector(s)/stock(s)/issuer(s) mentioned in this presentation are for the purpose of illustration only and should not be co nstrued as any research report/recommendation to buy / sell / hold. The Fund manager may or may not choose to have any future position in th ese sector(s)/ stock(s)/issuer(s).
27
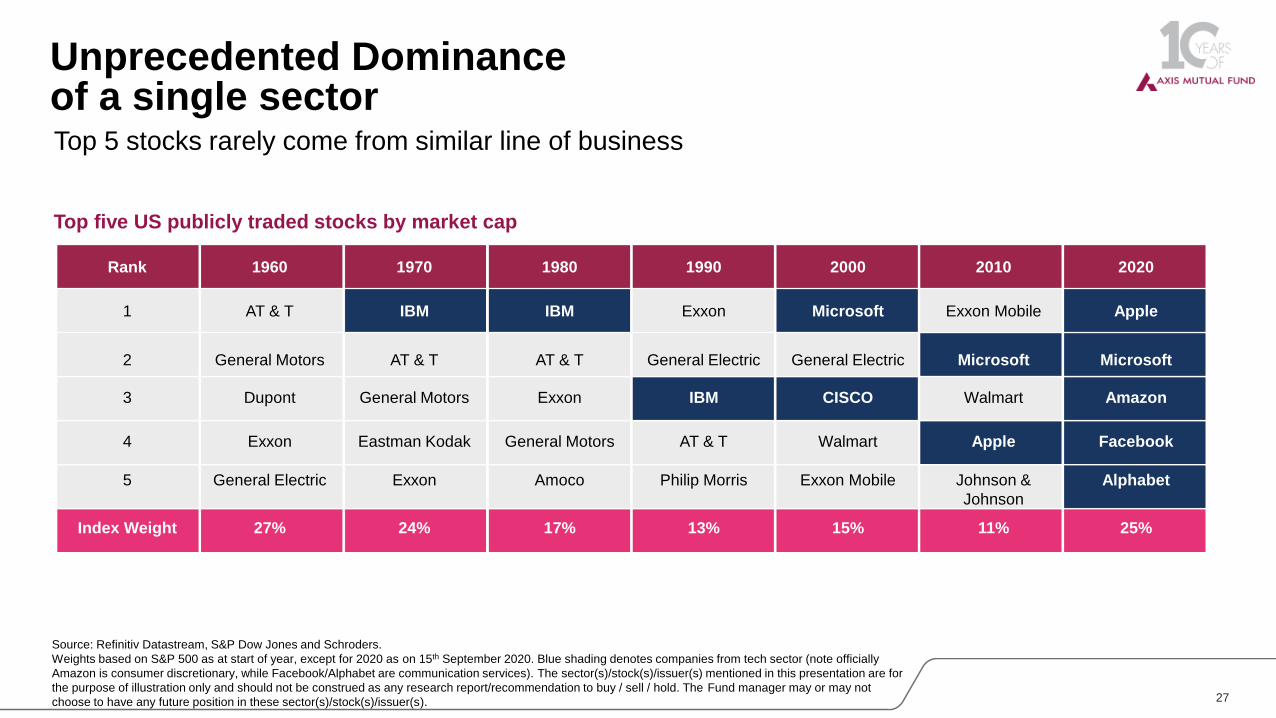
Rank 1960 1970 1980 1990 2000 2010 2020
1 AT & T IBM IBM Exxon Microsoft Exxon Mobile Apple
2 General Motors AT & T AT & T General Electric General Electric Microsoft Microsoft
3 Dupont General Motors Exxon IBM CISCO Walmart Amazon
4 Exxon Eastman Kodak General Motors AT & T Walmart Apple Facebook
5 General Electric Exxon Amoco Philip Morris Exxon Mobile Johnson &
Johnson
Alphabet
Index Weight 27% 24% 17% 13% 15% 11% 25%
Unprecedented Dominance of a single sectorTop 5 stocks rarely come from similar line of business
Top five US publicly traded stocks by market cap
Source: Refinitiv Datastream, S&P Dow Jones and Schroders.
Weights based on S&P 500 as at start of year, except for 2020 as on 15th September 2020. Blue shading denotes companies from tech sector (note officially
Amazon is consumer discretionary, while Facebook/Alphabet are communication services). The sector(s)/stock(s)/issuer(s) mentioned in this presentation are for
the purpose of illustration only and should not be construed as any research report/recommendation to buy / sell / hold. The Fund manager may or may not
choose to have any future position in these sector(s)/stock(s)/issuer(s).

Past performance may or may not be sustained in the future.
The data/statistics / information given are to explain various concepts and general market trends in the securities market.
The information on sector(s)/stock(s)/issuer(s) mentioned in this presentation is provided on the basis of publicly available information illustration purpose only and
should not be construed as any investment advice / research report/recommendation to buy / sell / hold securities by Axis AMC / Axis Mutual Fund. The Fund
manager may or may not choose to have any present / future position in these sector(s)/stock(s)/issuer(s).
The AMC acts as Investment Manager to schemes of Axis Mutual Fund (AMF) and schemes of Axis Alternative Investment Fund – Category II & III (AIF) and also
provides Portfolio Management Services (PMS). The schemes of AMC / AIF and/ or clients under PMS may from time to time hold long/ short positions in stock(s)
referred in the presentation. For details of holdings of schemes of AMF, please visit www.axismf.com.
Statutory Details: Axis Mutual Fund has been established as a Trust under the Indian Trusts Act, 1882, sponsored by Axis Bank Ltd. (liability restricted to ` 1 Lakh).
Trustee: Axis Mutual Fund Trustee Ltd. Investment Manager: Axis Asset Management Co. Ltd. (the AMC). Risk Factors: Axis Bank Limited is not liable or
responsible for any loss or shortfall resulting from the operation of the scheme.
This document represents the views of Axis Asset Management Co. Ltd. and must not be taken as the basis for an investment decision. Neither Axis Mutual Fund, Axis
Mutual Fund Trustee Limited nor Axis Asset Management Company Limited, its Directors or associates shall be liable for any damages including lost revenue or lost
profits that may arise from the use of the information contained herein. No representation or warranty is made as to the accuracy, completeness or fairness of the
information and opinions contained herein. The AMC reserves the right to make modifications and alterations to this statement as may be required from time to time.
Mutual Fund Investments are subject to market risks, read all scheme related
documents carefully.
Disclaimer & Risk Factors
28

29
Important information
Past performance is not a guide to future performance and may not be repeated. The value of investments and the income from them may go down as well asup and investors may not get back the amount originally invested. Exchange rate changes may cause the value of any overseas investments to rise or fall.
Schroders has expressed its own views and opinions in this document and these may change.
This information is not an offer, solicitation or recommendation to buy or sell any financial instrument or to adopt any investment strategy. Nothing in this materialshould be construed as advice or a recommendation to buy or sell. Information herein is believed to be reliable but we do not warrant its completeness or accuracy.
Any data has been sourced by us and is provided without any warranties of any kind. It should be independently verified before further publication or use. Third partydata is owned or licenced by the data provider and may not be reproduced, extracted or used for any other purpose without the data provider’s consent. Neither we,nor the data provider, will have any liability in connection with the third party data.
The material is not intended to provide, and should not be relied on for accounting, legal or tax advice. Reliance should not be placed on any views or information inthe material when taking individual investment and/or strategic decisions. No responsibility can be accepted for error of fact or opinion.
The forecasts included in this presentation should not be relied upon, are not guaranteed and are provided only as at the date of issue. Our forecasts are based onour own assumptions which may change. We accept no responsibility for any errors of fact or opinion and assume no obligation to provide you with any changes toour assumptions or forecasts. Forecasts and assumptions may be affected by external economic or other factors.
Any references to securities, sectors, regions and/or countries are for illustrative purposes only.
Schroders will be a data controller in respect of your personal data. For information on how Schroders might process your personal data, please view our PrivacyPolicy available at www.schroders.com/en/privacy-policy or on request should you not have access to this webpage.
For your security, communications may be recorded or monitored.
Our Schroders sustainability accreditation helps investors distinguish how ESG factors are considered across our products. This fund has beenawarded an Integrated accreditation. ESG factors are embedded into the investment process and can be clearly evidenced. There is a strongcommitment to stewardship and company engagement. For further information about our Schroders Sustainability Accreditation please visitwww.schroders.lu/sustainabilityaccreditation

Thank You