Embed Size (px)
Citation preview

Journal of Engineering Science and Technology Vol. 12, No. 5 (2017) 1280 - 1294 © School of Engineering, Taylor’s University
1280
AWARENESS ON ENERGY MANAGEMENT IN RESIDENTIAL BUILDINGS: A CASE STUDY IN KAJANG AND PUTRAJAYA
MAYTHAM S. AHMED1,4,
*, AZAH MOHAMED1 , RAAD Z. HOMOD
2,
HUSSAIN SHAREEF3, KHAIRUDDIN KHALID
1
1Department of Electrical, Electronic and Systems Engineering, Faculty of Engineering
and Built Environment, Universiti Kebangsaan Malaysia, 43600 Bangi, Selangor, Malaysia 2Department of Oil and Gas Engineering, Basrah University for Oil and Gas, Qarmat Ali
Campus, 61004 Basrah, Iraq 3Department of Electrical Engineering, United Arab Emirates University, 155511Al-Ain
4General Directorate of Electrical Energy Production- Basrah, Ministry of Electricity, Iraq
*Corresponding Author: [email protected]
Abstract
This paper presents a case study on a survey and measurement being carried out
for the purpose of determining residential electric power consumption and
awareness toward smart energy management system in the areas of Putrajaya
and Kajang, Malaysia. Questionnaires were developed with 37 questions
grouped in 5 different sections related to home appliance information. Data was
collected from a sample size of 384 respondents with confidence level of 95%.
The accuracy of the percentage energy usage data were analysed by applying
the SPSS software. Actual residential electric power consumption was
measured by using a power quality analyser to determine the total power
consumption at weekday and weekend and power consumption of each
electrical appliance. The measurement results showed that the average energy
consumption is 25.8 kWh/day during weekend and 21.9 kWh/day during
weekdays with 11.5 kWh/day for the air conditioner only. The survey results
revealed that 89.06% of the respondents expressed awareness toward household
power consumption and that they are willing to install home automation system
to reducing their electricity bill.
Keywords: Energy consumption level, Home appliances, Home energy management,
Feed in tariff, Energy saving, Energy policy.
1. Introduction
The use of electrical energy has increased in recent years and the demand for
electrical energy in developing countries, in particular, is expected to increase

Awareness on Energy Management in Residential Buildings: A Case study . . . . 1281
Journal of Engineering Science and Technology May 2017, Vol. 12(5)
Abbreviations
DR Demand Response
HEMS Home Energy Management System
KWH Kilowatt hour
RE Renewable Energy
TNB Tenaga Nasional Berhad
rapidly in line with economic and population growth [1]. In the developed
countries such as the UK and US, the power consumption for households are 30%
and 25% respectively, of the total energy consumption[2]. In Malaysia, electric
power consumption by the residential sector has increased significantly over the
year, which has caused high demand in electricity to meet increasing social and
economic activities [3]. In addition, carbon dioxide (CO2) and greenhouse gas
(GHG) emission problems have emerged and thus motivated many governments
and researchers to focus on the development of smart buildings and home energy
management systems (HEMSs) utilizing renewable energy (RE) sources [4]. The
combustion of fossil fuel affects climate change, contributes to global warming,
and is regarded as one of the main sources of atmospheric CO2 production [5].
The Economic Planning Unit reports indicate that Malaysia has become the 26th
largest GHG emitter in the world [6]. It was predicted that the GHG emissions in
Malaysia will increase from 43 Mt in 2005 to 110 Mt in 2020 [7]. Hence, due to
climate variability, the temperature will rise from 0.5℃ to 1℃ in East Malaysia
and from 0.5℃ to 1.5 ℃ in Peninsular Malaysia [8].
To address the problem of increased environmental pollution, the Malaysian
authorities has included in the 8th Malaysian Plan (2001–2005) the goal to make RE
source as 5% of the total energy generated in the country [9]. However, the share of
RE in the total energy generated in Malaysia is currently less than 0.5% [10].
Studies showed that presently the efficiency of solar energy has reached 40%,
which is higher than its efficiency level in the past [11]. The RE strategy, as
required by Malaysia 2020, aims to start the move toward sustainable energy
development. The aims of this strategy are to reduce the use of conventional energy
and decrease the amount of CO2 emissions by 40% in 2020 [12]. In Malaysia, the
total electrical energy consumptions in 2010 and 2013 were 104.59 and 123.16
GWh, respectively, whereas the total energy generations were 113.86 GWh in 2010
and 140.18 GWh in 2013 [13]. Furthermore, Malaysia targets to increase the
installed capacity for its RE from 217 MW in 2011 to 11.5 GW by 2050 [14]. In
2012, the electricity in Malaysia was generated from power plants that use fuel in
the form of coal (48%), natural gas (40%), hydropower (7%), diesel (3%), fuel oil
(2%), and RE (0.2%). The main electricity generators in Malaysia are co-generators
(4%), hydropower (7%), and thermal (89%) power plants [15]. The residential
sector in Peninsular Malaysia in 2012 was responsible for 21% of the total power
consumption, which was utilized for cooling systems and other household
appliances [16]. The CO2 emission by the Malaysian residential sector in 2008 was
2,347,538 T and is expected to increase up to 11,689,308 T by 2020 [17]. The
electricity consumption of the residential sector is also estimated to increase from
29.02 GWh in 2008 to 51.14 GWh in 2020 [18]. Thus, the residential sector has a
high potential in helping to reduce electricity consumption [19]. Due to increase in
tariff rates, which were imposed on January 1, 2014, residential customers face an
average increase of 10.6% in electricity consumption [20]. The electricity tariff
rates and costs of electricity generation in Malaysia have increased in the last

1282 M. S. Ahmed et al.
Journal of Engineering Science and Technology May 2017, Vol. 12(5)
decade. In this regard, RE resources have become a good solution to achieve
sustainable energy development in Malaysia [21].
Smart buildings can be supported by RE sources and active communication
technology managed via the internet through smartphones or computers [22].
Through communication technology, power consumption of household appliances
can be monitored for optimal and efficient usage [23]. Smart buildings with
HEMSs can reduce the peak demand and electric bill of consumers [24]. HEMS
can assist in reducing overall energy consumption by means of optimal residential
load scheduling of appliances and allowing achieving various goals and functions
inside the homes such as automatic control, and shifting or curtailing the demand
consumption [25, 26]. Consequently, with reduced demand during peak hours, the
electricity generated by power plants and thus GHG emissions are also reduced.
These emissions are regarded as a major driver of climate change and
environmental pollution [27, 28]. In order to consider customers limitations and
preferences and to get the benefits of reduced power consumption, a survey on
household power consumption usage is required.
In the interest of power consumers in both residential and commercial sectors,
power usage reduction is promoted in Malaysia. In this study, a survey and
measurement related to power consumption are carried out by considering two
objectives. The first objective is to estimate the daily household power
consumption usage and the electrical appliances used in homes through collection
of data from various residential buildings such as apartments, terrace houses,
semi-D homes, and bungalows in the areas of Putrajaya and Kajang, Selangor.
The second objective is to investigate resident’s willingness toward the use of
common electrical appliances and awareness toward smart HEMS for reducing
electricity consumption.
2. Questionnaires and Data Collection
The questionnaires used as the survey instrument, consist of 37 questions grouped
into 5 different sections, i.e., information about house, use of electrical
appliances, awareness on energy consumption and RE, awareness on new
technology for homes and personal information. Both Malay and English
languages were used in the questionnaires. The participants considered in the
study were residents of Putrajaya and Kajang and of age more than 18 years.
Putrajaya is a planned city located 25 km south of Kuala Lumpur, which serves as
the federal government center of Malaysia. Putrajaya has a total population of
72,413 and has a total land area of 49 km², whereas Kajang is a town in the
eastern part of Selangor with a total area of 787.6 km² and a population of
342,657 [29, 30]. The data collection for this study focused on the types of
appliances used by the respondents, the characteristics of household appliances,
electricity consumption, customer behavior, and factors that can affect household
electricity consumption. A sample of the questionnaire can be found at
http://goo.gl/forms/oKaf10bCmUVzk5bp1.
The survey was circulated through a mailing list and interview that included
various participants, such as lecturers, students, and employees living in these two
regions, to ensure a wide and balanced distribution of the respondents. After
gathering all data from the survey, the dataset was screened carefully and all data

Awareness on Energy Management in Residential Buildings: A Case study . . . . 1283
Journal of Engineering Science and Technology May 2017, Vol. 12(5)
anomalies were removed to have accurate data analysis. Particular attention was
also given while entering the data manually. An efficient method was needed to
obtain the data sample because the sample played an important role in validating
the study. In addition, the sample size depends on many factors, such as the
population sample size, the accepted sampling error, the study limitations, and the
aims of the study. The required sample volume size ( Sm ) is given by [31, 32]:
)()1(
)(222
22
PPxNd
PPNxSm
(1)
where Sm , 2x , N, P, and
2d are the required sample size, the table value of chi-
square for the desired confidence level (3.84=0.5), the population size, the
population proportion (assumed to be 0.50 because this will provide the
maximum sample size), and the degree of accuracy expressed as a proportion
(0.05), respectively.
Referring to [32], we derive a table that determines the sampling size for the
population using Eq. (1). Based on the table, the sample size that represents a
population of more than 415,070 is 384, with a confidence level of 95% for the
total inhabitants, as in our case study. Our data analysis process shows that the
inhabitants in the areas of Kajang outnumber those of Putrajaya. An important
concern in this survey is that the sample size has a low marginal error and a high
confidence level.
In this paper, we estimate the daily household energy consumption by
collecting data from the homes in Putrajaya and Kajang, investigating the reaction
of the respondents toward the use of common electrical appliances, and exploring
the reasons that may cause inefficient energy management by homeowners. Table
1 shows the specific questions used to explore the two research questions.
Table 1. Survey questions used to explore the research questions.
Research questions Q1 Research questions Q2 1- Appliances used in the kitchen, e.g.,
dishwasher, refrigerator and oven
1-Information about smart homes
2- Laundry times per week and appliances
used, i.e., laundry, washing machine, dryer
2-Owner’s willingness to use a home
automation system
3-Presence of water heaters in the building 3- Awareness of means to reduce energy
4-Presence of air conditioners in the building 4- Using devices with low energy and
price
5-Use of electric water heater per day 5-Switching off bulbs to reduce energy
consumption
6-Electricity bill per month 6-Using appliances that considerably
affect the electric bill
7-Habit of leaving devices on standby 7-Replacing old devices with new ones
8-Number of water heaters 8-Leaving the lights on although no one is
in the room/at home
9- Presence of electronic devices 9-Using a photovoltaic renewable energy
system
Therefore, the following research questions are formulated:

1284 M. S. Ahmed et al.
Journal of Engineering Science and Technology May 2017, Vol. 12(5)
Question1: What is the level of energy consumption of Putrajaya and Kajang,
Selangor customers?
Question2: What is reaction of the residents of Putrajaya and Kajang,
Selangor toward energy consumption, RE, and new technology for homes?
3. Measurement and Survey Results
The data were obtained from 403 respondents in the two areas in Malaysia;
Putrajaya and Kajang. The data were arranged in such a way that anomalies and
contradictions could be addressed. Valid responses, i.e., 384 samples from 403,
were obtained, with a completion rate of 95%. The respondents from the Kajang
area were 227 (59.1%), whereas those from the Putrajaya area were 157 (40.9%).
Furthermore, 210 respondents were males, and 174 respondents were female. The
collected data was analysed by using the SPSS software. The employment status of
the participants in the survey is shown in Fig. 1. A similar survey that analysed and
investigated the electricity profile in Malaysia has been conducted by Ponniran et al.
[33]. The investigation was conducted through monitoring of several appliances that
consumed high power in residential sectors such as air conditioner.
Fig. 1. Employment status of the participants.
Table 2 shows the level of education of the participants, i.e., primary school,
bachelor’s degree, diploma, junior high school, high school, master’s degree, PhD
and others.
In our survey, questionnaires were also used to collect data from the
respondents concerning the appliances that consumed high and low power so as to
estimate the household power consumption usage, the amount of electricity bill
per month and the daily electrical appliances used in homes from the different
residential buildings in Malaysia. The characteristics of every load were analysed,

Awareness on Energy Management in Residential Buildings: A Case study . . . . 1285
Journal of Engineering Science and Technology May 2017, Vol. 12(5)
and the potential energy saved was compared with that obtained from the use of
efficient electrical appliances to determine the effective energy consumption.
Table 2. Demographic analysis of the conducted survey.
Gender Respondent Percentage
Female 174 45.3%
Male 210 54.7%
Participants’ age
18–35 years old 97 25.3%
36–45 years old 195 50.8%
46–65 years old 80 20.8%
More than 65 years old 12 3.1%
Level of education
Primary school 62 16.1%
Bachelor’s degree or diploma 67 17.4%
High school 46 12%
Junior high school 34 8.9%
Master’s degree 51 13.3%
PhD 54 14.1%
Others 70 18.2%
Measurement of total electricity consumption of appliances at weekdays
and weekends with the use of a power quality
Measured data were obtained in May 2015 by using a power quality analyser to
measure the total power consumption of a sample apartment house in the Kajang
area during weekday and weekend. The power consumption data were measured
in 1 second interval for 24 hours. The results of the 24 h measured data are shown
in Fig. 2. As shown in Fig. 2(a), the household power consumption during a
weekday morning (7AM to 8:15 AM) was about 2 kW. The electricity consumed
by heating appliances, such as electric iron, water heater, microwave, and
refrigerator, from 8:15 AM to 4 PM was only about 0.5 kW because the users
were not at home, and only the refrigerator, fan and TM system were working. In
the evening, from 4 PM to 11 PM, the power consumption increased to 4 kW
because the users were at home and using their electric appliances. As shown in
Fig. 2(b), the users were at home during weekend and were using many electric
appliances, thus resulting in high electricity consumption. The two figures show
that the two peak periods of electricity consumption in Malaysia during weekday
from 4 PM to 11 PM and weekend at different time of the day.
The powers consumed by the common electric appliances used by the
respondents were also measured with daily average usage for each device shown
in Table 3.
According to the collected data from various homes in Putrajaya and Kajang,
the respondents were asked about the common electrical appliances used in their
house so as to estimate the daily household energy consumption.
Figure 3 shows the measured energy consumptions during weekend and
weekday which were 25.8 kWh/day and 21.9 kWh/day, respectively. The data
shown in Table 3 indicated that the air conditioner, water heater and electric kettle
consumed high electricity usage compared to all the other appliances.

1286 M. S. Ahmed et al.
Journal of Engineering Science and Technology May 2017, Vol. 12(5)
(a) Weekday power consumption pattern.
(b) Weekend power consumption pattern.
Fig. 2. Total power consumption pattern of households
during weekday and weekend.
Fig. 3. Energy consumption pattern of households with
outdoor and indoor temperature during weekdays and weekends.
0 1 2 3 4 5 6 7 8 9 10 11 noon 13 14 15 16 17 18 19 20 21 22 23 240
0.5
1
1.5
2
2.5
3
3.5
4
Hour of the day
Pow
er
Consum
ption (K
w)
20
22
24
26
28
30
32
34
36
Tem
pera
ture
, C
(T
r, T
o )
a
Indoor temperature
Outdoor temperature
Power Consumption
0 1 2 3 4 5 6 7 8 9 10 11 noon 13 14 15 16 17 18 19 20 21 22 23 240
0.5
1
1.5
2
2.5
3
3.5
4
Hour of the day
Pow
er
Co
nsu
mp
tion
(K
w)
20
22
24
26
28
30
32
34
36
Tem
pera
ture
, C
(T
r, T
o )
b
Indoor temperature
Outdoor temperature
Power Consumption
0 1 2 3 4 5 6 7 8 9 10 11 noon 13 14 15 16 17 18 19 20 21 22 23 240
2
4
6
8
10
12
14
16
18
20
22
24
26
28
Ene
rgy c
on
sum
ptio
n,
(kW
h)
0 1 2 3 4 5 6 7 8 9 10 11 noon 13 14 15 16 17 18 19 20 21 22 23 2422
23
24
25
26
27
28
29
30
31
32
33
34
35
36
Tem
pera
ture
, C
(T
r, T
o )
Hour of the day
Weekend Energy
Weekday Energy
Outdoor Temp.
Indoor Temp.

Awareness on Energy Management in Residential Buildings: A Case study . . . . 1287
Journal of Engineering Science and Technology May 2017, Vol. 12(5)
Table 3. Common appliances used in households based on survey results.
NO Appliance Measured
Power in (kW)
Weekday
Energy
(kWh/day)
Weekend
Energy
(kWh/day)
1 Air conditioner 1.2 6.06 9.69
2 Water heater 2 0.32 3
3 Electric kettle (5 L) 2–2.2 1.056 0.968
4 Electric Iron 1.4 0.742 0.644
5 Hair dryer 1.2 0.12 0.06
6 Microwave 1–1.1 0.198 0.187
7 Washing machine (5
kg)
0.85 0.884 0.884
8 Rice cooker 0.7–0.8 0.576 0.584
9 Computer 0.75 1.4775 1.365
10 Fridge 0.5 2.5 4
11 Exhaust hood 0.212 0.00424 0.0212
12 Blinder 0.205 0.0546 0.03895
13 Laptop 0.1 0.287 0.382
14 Fan (ceiling) 0.1 1.155 1.8
15 Television 0.08 0.456 0.652
16 Printer 0.05 0.001 0.0045
17 Florescent light 0.04 0.4 0.52
18 TM system (receiver +
phone + wireless
0.03 0.57 0.72
In general, the power consumption depends on the frequency of usage of the
appliances involved. For instance, appliances, such as oven, microwave, exhaust
hood, and electric kettle are assumed to be operated in the morning and during
dinnertime while the freezer and refrigerator are assumed to be operated
continuously. Other appliances, such as electronic appliances, air conditioner,
iron, rice cooker, washing machine, and water heater are assumed to be operated
at various times during the day.
4. Residential Energy Consumption of Putrajaya and Kajang
To address the survey questions shown in Table 1, we asked the respondents
about 9 issues. The respondents were asked to provide information about their
electrical appliances and the number of air conditioners and water heaters used
in their homes. Table 4 shows the survey results in terms of energy usage of
water heater and air conditioner. The results show that water heater and air
conditioner appliances consumed most of the energy in their buildings. Some of
the respondents used two or more types of devices or even more energy sources
for air conditioning and water heating. Furthermore, 81.3% of the respondents
use electric water heaters, whereas 3.1% say that they do not have a water
heater at home. Only 14.3% use solar water heaters and 1.3% use gas water
heaters. The respondents were also asked about the availability of air
conditioners in their buildings, as well as to provide information about the
frequency of their usage of these devices.

1288 M. S. Ahmed et al.
Journal of Engineering Science and Technology May 2017, Vol. 12(5)
In Table 4, 93% of the respondents say that they have air conditioners in their
houses, and 63% say that they have more than one air conditioner at home; 55.5%
say that they use their air conditioning units for more than 2h per day. To estimate
the power consumption of home appliances in each residential building, the
respondents were asked the about appliances that they own. The home appliances
are as listed in Table 5.
Table 4. Energy usage of water heater and air conditioner.
Water heater Percentage % Air conditioner Percentage %
None 3.1% Those who do not have 7%
Electric water
heater
81.3% Those who have 93%
Solar water heater 14.3% Operation time
Gas water heater 1.3% Less than 2 h per day 22.9%
Number of water
heaters
Occasionally, not every
day
14.6%
None 3.1% More than 2 h per day 55.5%
1–2 70.3% Number of air
conditioners
More than 2 26.6% None 7%
1–2 63%
More than 2 30%
The percentages of energy usage data were obtained by applying the SPSS
software on the survey questions. According to Tenaga Nasional Berhad (TNB)
[20, 34], the latest adjustment to electricity tariff rates was implemented on
January 1, 2014 as shown in Table 6. The Malaysian government also announced
that goods and services tax (GST) of 6% will be charged on the electricity unit
consumed monthly by the residential sector beginning April 1, 2015 [35]. The
GST will certainly increase consumers’ electricity bill and therefore consumers
are encouraged to save electricity. From the survey, the respondents were also
asked about their power consumption per month and the average monthly
electricity bill for different types of houses. From this information and
considering the electricity tariff rates in Malaysia, the monthly bill and electricity
consumption of the home appliances devices were calculated as shown in Table 7.
Considering the TNB residential tariff, the electricity bill per month for a
bungalow house consuming 985 kWh/month can be calculated as; 200 kWh *
21.8 sen + 100 kWh * 33.40 sen + 300 kWh * 51.60 sen + 300 kWh * 54.60 sen +
85 kWh * 57.10 sen = 44413.5 sen/month.
The final total electricity bill/month for a bungalow house = 444.135+ 26.648
(GST %) + 3(additional tax) = 473.783 RM.
The actual data measured in the residential buildings during weekday and
weekend as shown in Figs. 2 and 3 were compared with the survey data shown in
Tables 5 and 7. The daily load demand consumption and the daily electricity bill
are calculated for various types of buildings in Malaysia. According to the survey
the air conditioner unit consumed most of the energy in the buildings. Figure 4
shows the real data for air conditioner power consumption of households within 1
second interval for 24 hours with the measured indoor and outdoor temperatures
according to the weather in Malaysia.
Awareness on Energy Management in Residential Buildings: A Case study . . . . 1289
Journal of Engineering Science and Technology May 2017, Vol. 12(5)
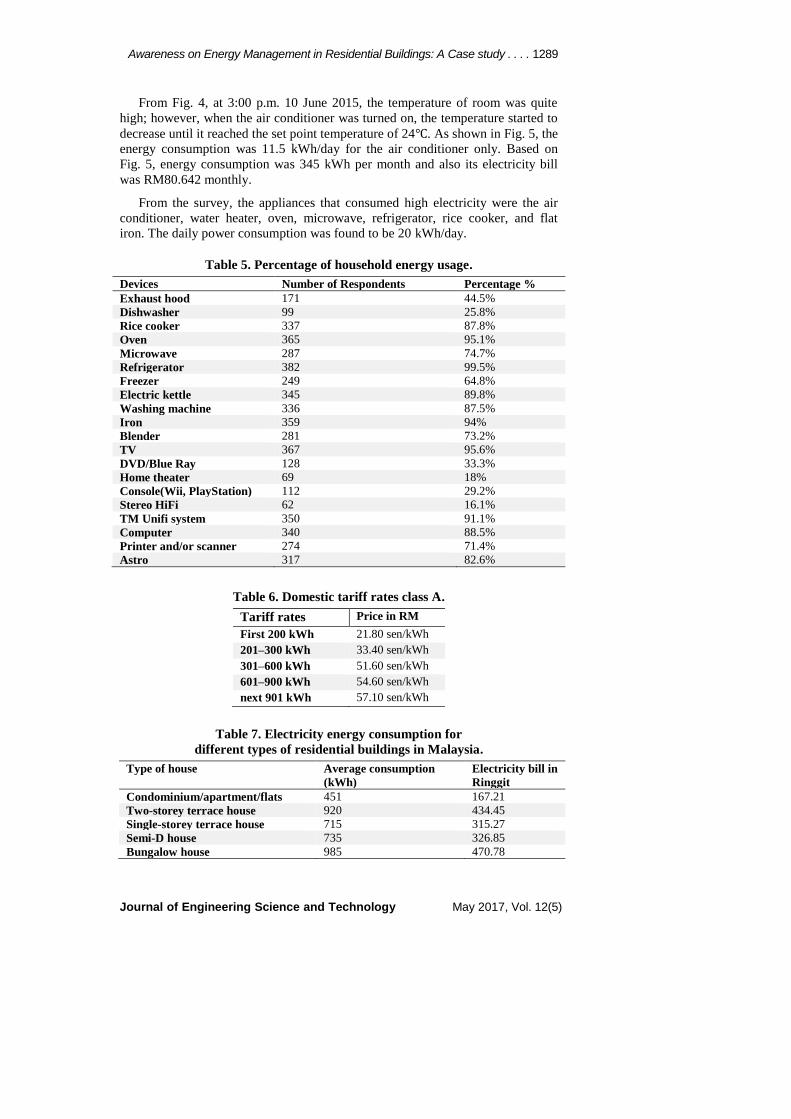
From Fig. 4, at 3:00 p.m. 10 June 2015, the temperature of room was quite
high; however, when the air conditioner was turned on, the temperature started to
decrease until it reached the set point temperature of 24℃. As shown in Fig. 5, the
energy consumption was 11.5 kWh/day for the air conditioner only. Based on
Fig. 5, energy consumption was 345 kWh per month and also its electricity bill
was RM80.642 monthly.
From the survey, the appliances that consumed high electricity were the air
conditioner, water heater, oven, microwave, refrigerator, rice cooker, and flat
iron. The daily power consumption was found to be 20 kWh/day.
Table 5. Percentage of household energy usage.
Devices Number of Respondents Percentage %
Exhaust hood 171 44.5%
Dishwasher 99 25.8%
Rice cooker 337 87.8%
Oven 365 95.1%
Microwave 287 74.7%
Refrigerator 382 99.5%
Freezer 249 64.8%
Electric kettle 345 89.8%
Washing machine 336 87.5%
Iron 359 94%
Blender 281 73.2%
TV 367 95.6%
DVD/Blue Ray 128 33.3%
Home theater 69 18%
Console(Wii, PlayStation) 112 29.2%
Stereo HiFi 62 16.1%
TM Unifi system 350 91.1%
Computer 340 88.5%
Printer and/or scanner 274 71.4%
Astro 317 82.6%
Table 6. Domestic tariff rates class A.
Tariff rates Price in RM
First 200 kWh 21.80 sen/kWh
201–300 kWh 33.40 sen/kWh
301–600 kWh 51.60 sen/kWh
601–900 kWh 54.60 sen/kWh
next 901 kWh 57.10 sen/kWh
Table 7. Electricity energy consumption for
different types of residential buildings in Malaysia.
Type of house Average consumption
(kWh)
Electricity bill in
Ringgit
Condominium/apartment/flats 451 167.21
Two-storey terrace house 920 434.45
Single-storey terrace house 715 315.27
Semi-D house 735 326.85
Bungalow house 985 470.78

1290 M. S. Ahmed et al.
Journal of Engineering Science and Technology May 2017, Vol. 12(5)
Fig. 4. Real temperature and power consumption for AC load.
Fig. 5. Energy consumption of AC with outdoor and indoor temperature.
The collected data from the respondents can be used to determine their daily
power consumption and load demand. The survey data was applied in [24] to
develop home appliance models for HEMS with demand response (DR) for
residential buildings in Malaysia. DR application is designed to reduce peak
demand, increase power system stability, and improve efficiency of electricity
usage with the availability of RE. Moreover, DR enabled load models at residential
sectors encourage end users to reduce their electric bill with the use of intelligent
HEMS that can control household loads with smart meters and smart appliances
[24]. With HEMS, home appliances can be controlled, and power consumption by
end users can be monitored. HEMS enables scheduling of the switching on/off of
home appliances so as to reduce electric bills and improve customer comfort [36].
The scheduling algorithm considers household loads according to comfort level and
customer preference setting, and appliance use can be managed at a given time.
5. Survey Results on the Attitude of Residents Toward Home
Automation System
In this part of the survey, the respondents were asked about their reaction toward
energy consumption and RE. The respondents from Kajang and Putrajaya
expressed that they were interested in the home automation system in their homes.
15 17 19 21 23 1 3 5 7 9 11 noon 13 15
3
6
9
12
Pow
er,
(K
w)
15 17 19 21 23 1 3 5 7 9 11 noon 13 1521
23
25
27
29
31
33
35
37
Hour of the day
Tem
pera
ture
, C
(T
r, T
o )
setpoint tem.
Outdoor Temp.
Indoor Temp.
AC Power
15 17 19 21 23 1 3 5 7 9 11 noon 13 150
2
4
6
8
10
12
Energ
y c
onsum
ption, (k
Wh)
15 17 19 21 23 1 3 5 7 9 11 noon 13 1521
23
25
27
29
31
33
Hour of the day
Tem
pera
ture
, C
(T
r, T
o )
setpoint tem.
Outdoor Temp.
Indoor Temp.
AC Energy

Awareness on Energy Management in Residential Buildings: A Case study . . . . 1291
Journal of Engineering Science and Technology May 2017, Vol. 12(5)
The appliances that significantly affect the respondents’ electricity bill in both
regions were air conditioner (93%), water heater (82.8%), oven (71.9%), dryer
(71.4%), microwave oven (62.8%), washing machine (60.9%), lighting (42.7%),
and other devices that consume less than 40% of their total household energy use,
such as flat iron, exhaust hood, computer, and vacuum cleaner. The electrical
devices that the owners agreed to discontinue using to reduce energy consumption
were lights (94.5%), air conditioner (91.4%), television (89.8%), water heater
(75.3%), and flat iron (51.8%). Moreover, the respondents were asked about their
willingness to have a home automation system. The results of the survey data
indicates that 89.06% of the respondents were willing to install such a system in
their homes to reduce their electric bill and only 10.94% are unwilling to install as
shown in Fig. 6. However, 59.38% of the respondents have no idea about
automation systems and smart homes and the number of RE devices installed in
homes was low, with only 6.5% for a photovoltaic system and 2.6% for a solar
thermal system. As previously mentioned, this survey shows that most residents
of Kajang and Putrajaya expressed interest on energy management in their
households to reduce their electricity bill, but most of them are not aware about
smart homes and automation systems.
Fig. 6. Awareness about home automation systems for smart homes.
From the aforementioned results, it is clear that there is low awareness on home
automation system. Lack of awareness can prevent customers from investing in new
energy efficient technologies. The current policy of applying high discount rates to
make trade-offs between savings and initial investment also prevents customers
from any investment in energy efficient technologies. Moreover, the lack of new
technology development is considered as a structural barrier that prevents customers
from investing on smart technologies. Therefore, government should implement
policies that encourage energy efficiency by introducing smart technologies in
residential buildings such as home automation system or intelligent HEMS which
can be used to control the controllable loads that consume high energy consumption
such as air conditioner, water heater, washing machine, and refrigerator in order to
reduce the energy consumption and electricity bill. With the use of intelligent
HEMS with demand response (DR), home appliances can be controlled, and
power consumption by end users can be monitored. HEMS enables scheduling of
the switching on/off of home appliances so as to reduce electric bills and improve
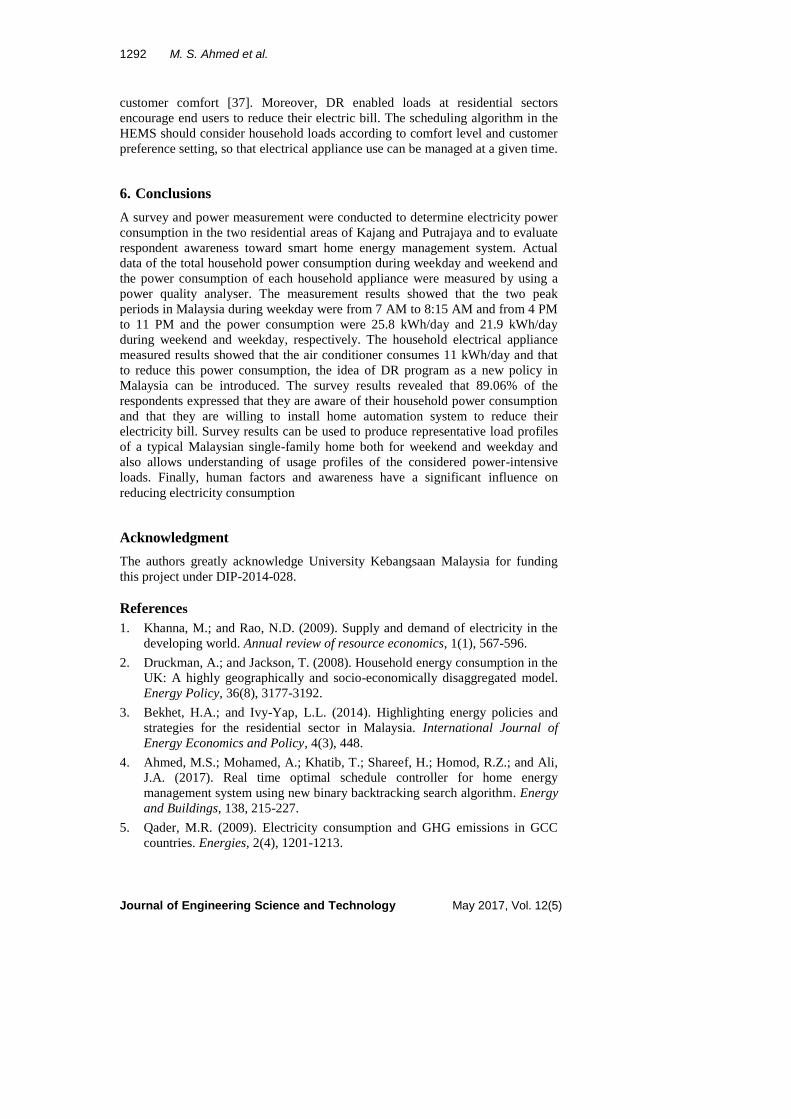
1292 M. S. Ahmed et al.
Journal of Engineering Science and Technology May 2017, Vol. 12(5)
customer comfort [37]. Moreover, DR enabled loads at residential sectors
encourage end users to reduce their electric bill. The scheduling algorithm in the
HEMS should consider household loads according to comfort level and customer
preference setting, so that electrical appliance use can be managed at a given time.
6. Conclusions
A survey and power measurement were conducted to determine electricity power
consumption in the two residential areas of Kajang and Putrajaya and to evaluate
respondent awareness toward smart home energy management system. Actual
data of the total household power consumption during weekday and weekend and
the power consumption of each household appliance were measured by using a
power quality analyser. The measurement results showed that the two peak
periods in Malaysia during weekday were from 7 AM to 8:15 AM and from 4 PM
to 11 PM and the power consumption were 25.8 kWh/day and 21.9 kWh/day
during weekend and weekday, respectively. The household electrical appliance
measured results showed that the air conditioner consumes 11 kWh/day and that
to reduce this power consumption, the idea of DR program as a new policy in
Malaysia can be introduced. The survey results revealed that 89.06% of the
respondents expressed that they are aware of their household power consumption
and that they are willing to install home automation system to reduce their
electricity bill. Survey results can be used to produce representative load profiles
of a typical Malaysian single-family home both for weekend and weekday and
also allows understanding of usage profiles of the considered power-intensive
loads. Finally, human factors and awareness have a significant influence on
reducing electricity consumption
Acknowledgment
The authors greatly acknowledge University Kebangsaan Malaysia for funding
this project under DIP-2014-028.
References
1. Khanna, M.; and Rao, N.D. (2009). Supply and demand of electricity in the
developing world. Annual review of resource economics, 1(1), 567-596.
2. Druckman, A.; and Jackson, T. (2008). Household energy consumption in the
UK: A highly geographically and socio-economically disaggregated model.
Energy Policy, 36(8), 3177-3192.
3. Bekhet, H.A.; and Ivy-Yap, L.L. (2014). Highlighting energy policies and
strategies for the residential sector in Malaysia. International Journal of
Energy Economics and Policy, 4(3), 448.
4. Ahmed, M.S.; Mohamed, A.; Khatib, T.; Shareef, H.; Homod, R.Z.; and Ali,
J.A. (2017). Real time optimal schedule controller for home energy
management system using new binary backtracking search algorithm. Energy
and Buildings, 138, 215-227.
5. Qader, M.R. (2009). Electricity consumption and GHG emissions in GCC
countries. Energies, 2(4), 1201-1213.

Awareness on Energy Management in Residential Buildings: A Case study . . . . 1293
Journal of Engineering Science and Technology May 2017, Vol. 12(5)
6. Malaysia, p.m. (2010).Tenth Malaysia Plan 2011–2015. The economic
planning unit (EPU).
7. Saidur, R.; Hasanuzzaman, M.; Yogeswaran, S.; Mohammed, H.A.; and
Hossain, M.S. (2010). An end-use energy analysis in a Malaysian public
hospital. Energy, 35(12), 4780-4785.
8. Al-Amin, A.Q.; Rasiah, R.; and Chenayah, S. (2015). Prioritizing climate
change mitigation: An assessment using Malaysia to reduce carbon emissions
in future. Environmental Science & Policy, 50, 24-33.
9. Malaysia, p.m. (2000). Eights Malaysia Plan 2001–2005. The economic
planning unit (EPU).
10. Bujang, A.S.; Bern, C.J.; and Brumm, T.J. (2016). Summary of energy
demand and renewable energy policies in Malaysia. Renewable and
Sustainable Energy Reviews, 53, 1459-1467.
11. Wong, S.L.; Ngadi, N.; Abdullah, T.A.T.; and Inuwa, I.M. (2015). Recent
advances of feed-in tariff in Malaysia. Renewable and Sustainable Energy
Reviews, 41, 42-52.
12. Raman, A.A.A.; and Mahmood, N.Z. (2010). Carbon Accounting Initiatives:
Case Study of a Petroleum Refinery in Malaysia to Prepare for Future Carbon
Market. Journal of Engineering Science and Technology, 5(2) 223 – 231.
13. Muhammad-Sukki, F.; Abu-Bakar, S.H.; Munir, A.B.; Mohd Yasin, S.H.;
Ramirez-Iniguez, R.; McMeekin, S.G.; Stewart, B.G., and Abdul Rahim,
R.(2014). Progress of feed-in tariff in Malaysia: A year after. Energy Policy,
67, 618-625.
14. Basri, N.A.; Ramli, A.T.; and Aliyu, A.S. (2015). Malaysia energy strategy
towards sustainability: a panoramic overview of the benefits and challenges.
Renewable and Sustainable Energy Reviews, 42, 1094-1105.
15. Suruhanjaya Tenaga. (2015). Malaysia Energy Statistics Handbook.
16. Khor, C.S.; and Lalchand, G. (2014). A review on sustainable power
generation in Malaysia to 2030: Historical perspective, current assessment, and
future strategies. Renewable and Sustainable Energy Reviews, 29, 952-960.
17. Bari, M.A.; Pereira, J.J.; Begum, R.A.; Abidin, R.D.Z.R.Z.; and Jaafar, A.H.
(2012). The Role of CO2 Emission in Energy Demand and Supply. American
Journal of Applied Sciences, 9 (5), 641.
18. Payamnejata, F.J.; Mohammad Mahdi Taherib, Mohammad Goharic, Muhd
Zaimi Abd. Majidd. (2015). A global review of energy consumption, CO2
emissions and policy in the residential sector (with an overview of the top ten
CO 2 emitting countries). Renewable and Sustainable Energy Reviews, 43,
843-862.
19. Saleh, A.A.; Asri, M.; and Sinin, H. (2011). Electricity savings by
implementing energy efficiency standards and labels for clothes washers in
Malaysia. Journal of Engineering Science and Technology, 6(1), 29-38.
20. Tenaga Nasional Berhad (2013). Malaysian Industry Energy Tariffs.
21. Bakhtyar, B.; Zaharim, A.; Asim, N., Sopian, K.; and Lim, C.H. (2012).
Renewable energy in Malaysia: Review on energy policies and economic
growth. International Conference on Development, Energy, Environment,
Economics, 146-153.
1294 M. S. Ahmed et al.
Journal of Engineering Science and Technology May 2017, Vol. 12(5)
22. Karfopoulos, E.; Tena, L.; Torres, A.; Salas, P.; Jorda, J.G.; Dimeas, A.; and
Hatziargyriou, N. (2015). A multi-agent system providing demand response
services from residential consumers. Electric Power Systems Research, 120,
163-176.
23. Shafie, S.M.; Mahlia, T.M.; Masjuki, H.H.; and Andriyana, A. (2011).
Current energy usage and sustainable energy in Malaysia: A review.
Renewable and Sustainable Energy Reviews,15 (9), 4370-4377.
24. Ahmed, M.S.; Shareef, H.; Mohamed, A.; Ali, J.A.; and Mutlag, A.H. (2015).
Rule Base Home Energy Management System Considering Residential
Demand Response Application. Applied Mechanics & Materials, 785, 526-531.
25. Ahmed, M.S.; Mohamed, A.; Homod, R.Z.; Shareef, H.; Sabry, A.H.; and
Khalid, K.B. (2015). Smart plug prototype for monitoring electrical
appliances in Home Energy Management System. In IEEE Student
Conference on Research and Development (SCOReD), 32-36.
26. Rastegar, M.; Fotuhi-Firuzabad, M.; and Zareipour, H. (2016). Home energy
management incorporating operational priority of appliances. International
Journal of Electrical Power & Energy Systems, 74, 286-292
27. Ahmed, M.S.; Mohamed, A.; Shareef, H.; Homod, R.Z.; and Ali, J.A. (2016).
Artificial neural network based controller for home energy management
considering demand response events. International Conference on Advances
in Electrical, Electronic and Systems Engineering (ICAEES), 506-509.
28. Abushnaf, J.; Rassau, A.; and Górnisiewicz, W. (2015). Impact of dynamic
energy pricing schemes on a novel multi-user home energy management
system. Electric Power Systems Research, 125, 124-132.
29. MPKJ. (2015). Population and Housing Census 2010. (Malaysia, o. p. o. K.
M. C., Ed.). Malaysia, official portal of Kajang Municipal Council Malaysia.
30. PJH. (2015). Putrajaya Facts. Local Council Putrajaya Corporation.
Retrieved May 25, 2015, from http://www.ppj.gov.my.
31. Krejcie, R.V.; and Morgan, D.W. (1970). Determining sample size for research
activities. Educational and Psychological Measurement, 30, 607-610.
32. Merriam, S.B. (2014). Qualitative research: A guide to design and
implementation. John Wiley & Sons.
33. Ponniran, A.; Mamat, N.A.; and Joret, A. (2013). Electricity profile study for
domestic and commercial sectors. International Journal of Integrated
Engineering, 4(3), 8-12.
34. SEDA (2015). History of FiT in Malaysia. Electronic source.
35. Ministry of Finance (2015). Malaysia Budget 2015. Putrajaya. Retrieved May
5, 2015, from http://www.treasury.gov.my.
36. Shariatzadeh, F.; Mandal, P.; and Srivastava, A.K. (2015). Demand response
for sustainable energy systems: A review, application and implementation
strategy. Renewable and Sustainable Energy Reviews, 45, 343-350.
37. Ahmed, M.S.; Mohamed, A.; Homod, R.Z.; and Shareef, H. (2016). Hybrid
LSA-ANN based home energy management scheduling controller for
residential demand response strategy. Energies, 9(9), 716.