Embed Size (px)
Citation preview

1
www.ssijmar.in
AWARENESS OF LIFE INSURANCE- A
STUDY OF JAMMU AND KASHMIR
STATE
Altaf Ahmad Dar*
* Department the Business. The University of Kashmir, Hazratbal, Srinagar Kashmir (J&K),
India .Email: [email protected]
SHIV SHAKTI
International Journal in Multidisciplinary and Academic Research (SSIJMAR) Vol. 1, No. 3, September-October (ISSN 2278 – 5973)
ABSTRACT
To find out the awareness of life insurance in the population of J and K state, a community-based cross-sectional
study was carried out. A total number of 242 respondents from 242 households were interviewed by using a
pretested questionnaire after obtaining informed consent from the participants. The awareness of life insurance was
found to be 64.0 per cent. Around 45.0 per cent of the respondents came to know about life insurance from the
media which played an important role in the dissemination of information. The mean premium amount agreeable
to be paid by the respondents for life insurance was found to be Rs 1804.00; even the low socio-economic group of
people was also willing to part with a reasonable amount of Rs. 697.00 annually for life insurance. The middle and
low socio-economic groups favored government life insurance compared to private life insurance as they have
more faith on Government Company. The findings indicate that government should come out with a policy, where
the public can be made to contribute to a life insurance scheme to ensure unnecessary events and also better
utilization of life insurance facilities
Key words: Life insurance, Awareness, Determinants

2
www.ssijmar.in
AWARENESS OF LIFE INSURANCE- A STUDY OF Jammu And Kashmir
STATE
Introduction
Life insurance plays an important role in individuals’ and families’ financial lives because it is a
hedge against the loss of income following the death of an earner. Premature death of a family
head can bring serious financial consequences for the surviving family members because the
family head’s earnings are lost forever leaving unfulfilled financial obligations, such as
dependents to support, children to educate, and a mortgage to repay. Life insurance allows
individuals and families to share the risk of premature death with many others and to alleviate
the financial loss from the premature death of the primary wage earner (Garman & Forgue,
2006). Thus, the main reason for the purchase of life insurance is to provide financial security for
the family. There is more to it, however; people also buy life insurance as a medium to long-term
tax favored savings and investment vehicle. Life insurance is fast emerging as an important
mechanism to finance the needs of the people. The need for an insurance system that works on
the basic principle of pooling of risks of unexpected costs of persons falling ill and needing
hospitalization by charging premium from a wider population base of the same community. With
improved literacy, modest rise in incomes, and rapid spread of print and electronic media, there
is greater awareness and increasing demand for better services of insurance. There is growing
evidence that the level of insurance spending in India – currently at over 7 per cent of its total
GDP – is considerably higher than that in many other developing countries. This evidence also
suggests that more than three-quarters of this spending includes private out-of-pocket expenses.
There is a vast untapped insurance market in India (Roy and Vishal, 2007). India accounts for
16% of the world population, but accounts for only 1.68% of the world life insurance market in
2006 (World Insurance Report 2008). India is also far behind world averages in terms of
insurance penetration, and insurance density.
The opening up of the insurance to the private sector by the Insurance Regulatory Development
Authority (IRDA) Act 2000 has provided immense opportunities for both the public and the

3
www.ssijmar.in
private industry for better utilization of insurance facilities. With this kind of situation prevailing,
there has not been much progress in the coverage of our population within this system of
insurance; only a meagre per cent coverage has been reported. Whether this is due to lack of
awareness on part of the public is to be determined.
Review of Literature
Bhat, (2005) Professor, Finance and Accounting at IIM, Ahmedabad writes that the penetration
of insurance critically depends on the availability of insurance products and services. He further
explains that huge untapped market, proliferation of schemes, new product innovations,
perception of insurable risks of Indian consumers, competitive pressures arising from integration
of bank and insurance, impact of information technology, and the role of insurance industry in
financial services industry are some of the forces which shape the competitive structure of the
insurance industry. Based on empirical studies, Krishnamurthy (2005) confirms that awareness
of insurance in India has improved substantially. A recent nationwide survey of over 60,000
households (Shukla, 2007) by National Council of Applied Economic Research (NCAER), New
Delhi and Max New York Life has revealed awareness about insurance is quite high in India.
The study clearly indicates that there is a definite scope for increasing the volume of savings in
life insurance even at the existing levels of income, given its distribution and the employment
structure. The world insurance report (2008) reveals that in India, reforms have helped to foster
growth, but the insurance sector still remains mostly under-penetrated. It further finds that the
average number of policies (life and non-life) held by an Indian consumer is just 1.33, compared
with the average of 5.2 policies per client for mature markets. Thus the penetration of insurance
is very low in India. Kannan and Thangavel (2008) state that life insurance has today become a
mainstay of any market economy since it offers plenty of scope for garnering large sums of
money for long periods of time. A well-regulated life insurance industry which moves with the
times by offering its customers tailor-made products to satisfy their financial needs is, therefore,
essential if we desire to progress towards a worry-free future. Sastry (2010) says that India is
among the important emerging insurance markets in the world and that life insurance will grow
very rapidly over the next decades in India. He reveals that the major drivers of this growth

4
www.ssijmar.in
include sound economic fundamentals, a rising middle class, an improving regulatory
framework, and rising risk awareness.Presently, life insurance is seen as a mechanism through
which investors can receive a tax break only. Often, these considerations act as incentives to buy
life insurance policies but people need to look at insurance as a long term saving instrument.
There is a great need to study the awareness of the society on insurance to improve this situation.
Though there are studies from other parts of India on this topic, there is hardly a study in
Tamilnadu which focuses on the awareness of insurance among the public.
Research Methodology
The Jammu and Kashmir State has a geographical spread of 2, 22,236 Sq. Kms, (including an
area of 1, 20,849 Sq Kms under illegal occupation of Pakistan & China), accounting for 7.02%
of total area of the country, making it the 6th largest state in the country. With 101.44 lakh
population, as per census 2001, it ranks 19th
state in India and constitutes approximately 1% of
the country’s population. Density (100 persons per sq.km.) places it to be the 31st populous state
among the states/UTs of India. The population of the state in 2011 is projected as 125.11 lakh.
The literacy rate of J&K stood at 55.52% with male literacy of 66.6% and female literacy of
43.00% (census 2001) and as per Literacy survey 2008 the literacy rate of J&K has increased to
65.67% with male literacy of 73.30% and female literacy of 57.11%.
The study was carried out in and around the Srinagar City of J and K state. The socio economic
status and awareness pattern of the people was studied.
Objective of the study
1. To understand and determine the awareness of people under study on insurance.
Sampling
The sample size was 242 respondents from state.

5
www.ssijmar.in
Collection of Data
During the visit, the purpose of the study was explained to the people and informed consent was
taken from them. The tool used for data collection was questionnaire which was explained to
them in their native language. This was pre-tested by conducting a pilot study through which
primary data was collected from the respondents. Analysis was done and changes were made to
overcome the errors. The final data were collected by a modified questionnaire from a
respondent group of 242. From each selected family the required information was collected by
the investigator himself from the head of the family or any other responsible member of the
family. From each family only one member was interviewed. The socio-economic status of the
family was assessed.
The statistical tools employed Chi-square test for association and linear trend were used and p
value less than 0.05 was considered as significant.
Statistical Analysis
Data were entered into the computer database and statistical package of social sciences (spss)
version 16 was used for analyzing data. Data were analyzed to find out the association between
awareness of life insurance and independent variables like, socio-economic status and religion.
Data were further analyzed to find out the association between awareness and other variables.
FINDINGS AND DISCUSSION
A total of 242 respondents were interviewed, one from each household.

6
www.ssijmar.in
TABLE 1
SOCIO-DEMOGRAPHIC CHARACTERISTICS OF THE RESPONDENTS
Characteristics of the
Respondent
Number Percentage
Age (years)
25 – 34 66 27.3
35 – 44 82 33.9
45 – 54 36 14.9
55 – 64 36 14.9
>= 65 22 9.1
Sex
Male 93 61.6
Female 149 38.4
Religion
Muslim 201 83.1
Non-Muslims 41 16.9
Type of family
Nuclear 150 62.0
Joint 92 38
Socio-economic status
High 22 9.1
Middle 131 54.1
Low 89 36.8
Family income (Rs.)
monthly
1000 – 5000 93 42.1
5001 – 10000 65 29.4
10001 – 15000 32 14.5
15001 – 20000 16 7.2
20001 – 25000 7 3.2
> = 250001 8 3.6
Source: Survey data collected by the scholar for the present.
Majority of the respondents were in the age group of 35–44 years of age (33.9%) followed by
25–34 years of age (27.3%). Only 9.1 per cent of respondents were in the age group of >=65
years of age. Males constituted 61.6 per cent and females 38.4 per cent of the respondents. 83.1
per cent of respondents were Muslims while 16.9 were Non-Muslims. 62 per cent of the
respondents stayed in nuclear family and 38 per cent in the joint family, 54.1 per cent of the
respondents belonged to middle socio-economic status. 36.8 per cent and 9.1 per cent of the

7
www.ssijmar.in
respondents belonged to low and high and low socioeconomic status respectively. 42.1 per cent
of the respondents had monthly family income between Rs. 1000 and 5000 and 3.6 per cent
respondents had an income of >= Rs. 25001.
TABLE 2
AWARENESS AND SOURCE OF INFORMATION ABOUT LIFE INSURANCE
AMONG THE RESPONDENTS
Awareness Number Percentage
Yes 155 64.0
No 87 46
Total 242 100
Source of Information
Television 25 10.3
Radio 6 2.48
Newspaper 72 30
Family/Friends 24 9.9
Internet 43 17.76
Insurance agents 72 29.75
Total 242 100
Source: Survey data collected by the scholar for the present
The whole study was based on the awareness of the respondents. 64 per cent of the respondents
were aware of life insurance. Of the total 242 respondents, 64 per cent of the respondents were
aware of life insurance whereas 36 per cent of them had no idea about it (Table 2). In a similar
study done by Patro8 et al only 22.7 per cent of the study population was aware of insurance.
The high awareness in the present study may be attributed to the high literacy percentage among
the respondents.
Table 2 depicts the source of information and awareness of life insurance. 9.9 per cent of the
respondents said that family/friends were the source of information followed by from newspaper
(30%), television (10.3%) and radio (2.48%). A good number of respondents also got to know
about it from insurance agents (29.75%), and from the internet (17.76%).
Gumber and Kulkarni in their study found out that the need for education for rural and urban
population was alike on the concept of information which is a crucial aspect on extending
8
www.ssijmar.in
awareness about insurance on a large-scale. This calls for an effective information, education and
communication activities which will improve the understanding of the people about insurance.
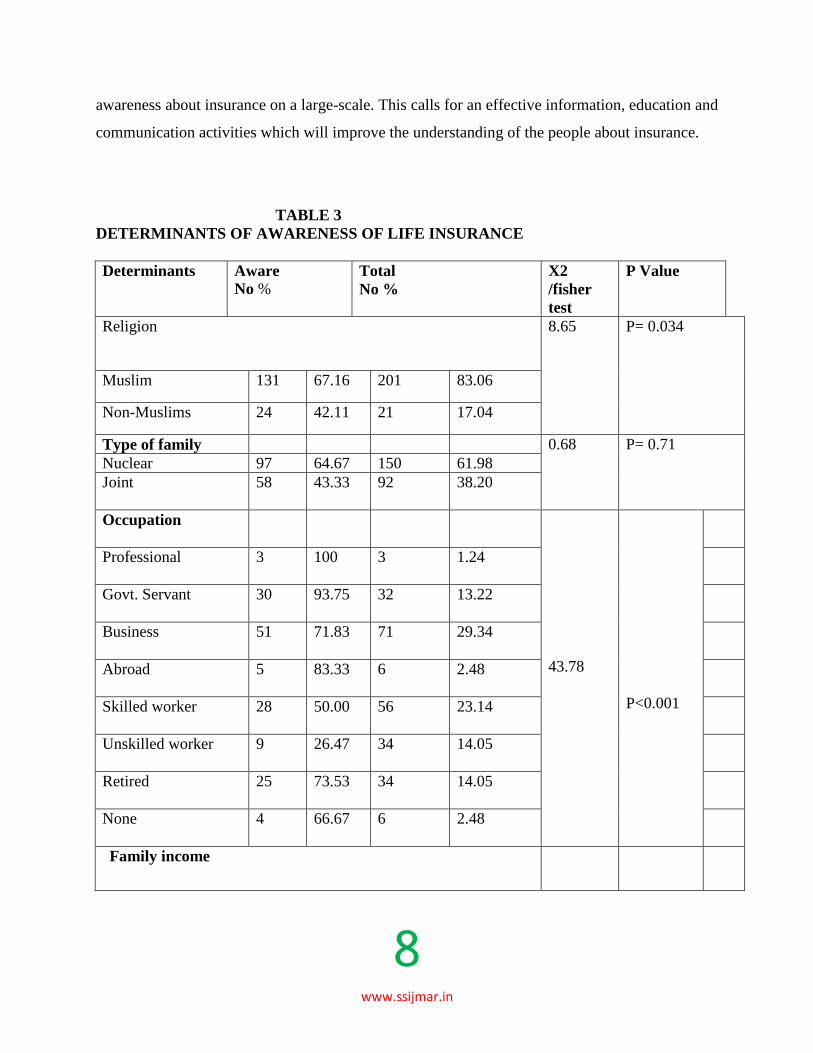
TABLE 3
DETERMINANTS OF AWARENESS OF LIFE INSURANCE
Determinants Aware
No % Total
No %
X2
/fisher
test
P Value
Religion 8.65 P= 0.034
Muslim 131 67.16 201 83.06
Non-Muslims 24 42.11 21 17.04
Type of family 0.68 P= 0.71
Nuclear 97 64.67 150 61.98
Joint 58 43.33 92 38.20
Occupation
43.78
P<0.001
Professional 3 100 3 1.24
Govt. Servant 30 93.75 32 13.22
Business 51 71.83 71 29.34
Abroad 5 83.33 6 2.48
Skilled worker 28 50.00 56 23.14
Unskilled worker 9 26.47 34 14.05
Retired 25 73.53 34 14.05
None 4 66.67 6 2.48
Family income

9
www.ssijmar.in
1000–5000 38 40.86 93 42.08
40.72
P<0.001
5001–10000 46 70.77 65 29.41
10001–15000 28 87.50 32 14.48
15001–20000 15 93.75 16 7.24
20001–25000 7 100 7 3.17
25001 & Above 6 75.00 8 3.62
Literacy status
Illiterate 2 25 8 3.31
Primary 6 14.28 42 17.36 83.07 P<0.001
Secondary 42 59.15 71 29.34
Higher Sec 26 72.22 36 14.88
Graduate 66 92.96 71 29.34
Post-graduate 13 92.86 14 5.79
Socio-economic status 76.94 P<0.001
High 22 100 22 9.09
Middle 107 81.68 131 54.13
Low 26 29.21 89 36.78
Source: Survey data collected by the scholar for the present
The determinants of awareness were religion, type of family, occupation, family income per
month, educational status and socio-economic status, when considered except family type, the
other determinants had a statistically significant association. A large number of professionals
were aware of life insurance (93.75%). While taking the educational background into
consideration, 93 per cent of graduates and above were aware of life insurance. Socio-economic
status had better awareness of life insurance. Results of studies carried out elsewhere were also
in agreement with the findings of the present study. Mathiyazhagan and Patro et al concluded in
their respective studies that their study population had reasonable knowledge about insurance
(Table 3).

10
www.ssijmar.in
TABLE 4
PERCEIVED PURPOSE AND BENEFITS OF TAKING LIFE INSURANCE V/S
SOCIO-ECONOMIC STATUS OF THE RESPONDENTS
Purpose
Socio-economic Status
High Middle Low Total
Tax gains 2 (10%) 9 (7.6%) - 11 (4.9%)
Risk cover 14 (70%) 83 (69.7%) 26 (31%) 123
(55.2%)
Compulsion from
employers
- - 2 (1.7%) 2 (0.9%)
Others 1 (5%) 4 (3.4%) 2 (2.4%) 7 (3.1%)
No Idea 3 (15%) 21 (17.6%) 56 (66.7%) 80 (35.9%)
Chi Square/Fischer = 58.9 P = 0.001
Benefits
Saving tool 10 (52.6%) 43
(44.3%)
11 (28.2%) 64 (41.3%)
Protection tool
6 (31.6%) 43
(44.3%)
23 (59%) 72 (46.5%)
Both
2 (10.5%) 6 (6.2%) 3 (7.7%) 11 (7.1%)
others 1 (5.3%) 2 (2.1%) - 3 (1.9%)
No idea - - 3 (3.1%) 2 (5.1%) 5 (3.2%)
Chi Square / Fischer = 8.09 P = 0.424
Source: Survey data collected by the scholar for the present
Table 4 depicts the purpose and benefits of life insurance as perceived by the respondents when
they were queried on their awareness and knowledge of life insurance. A good majority of the
respondents (69.7%) belonged to the middle socioeconomic group was of the opinion that the
life insurance would risk cover. When asked about the benefits of life insurance, an equal 44.3
per cent each of the middle socio-economic group respondents stated that it is a saving tool and
the other group opined that it is a protection tool. About 31 per cent of the low socio economic
group also felt that the benefit of life insurance would help in both.

11
www.ssijmar.in
TABLE 5
SOCIO-ECONOMIC STATUS OF THE RESPONDENTS AND MEAN PREMIUM
AGREED TO PAY
Socio-
economic
Status
N Mean
Premium in
Rs. Agreed
to
Pay/Year
F value P value
Low 58 697 9.75 0.0001
Middle 177 1271
High 13 3444
Total 188 1804
Source: Survey data collected by the scholar for the present
Table 5 shows the mean premium amount agreed to be paid by the different socio-economic
groups. The result was found to be statistically significant. It is important to note that the low
socio-economic group of people were also willing to part with a reasonable amount of Rs.
697.00 annually for a family of 4-5 members to cover their life insurance in case of any
unexpected event. Patro et al 8 has reported similar findings from their study involving different
socio-economic strata of the study population and found that most of them agreed to pay a
premium between Rs.600.00 and1000.00 for a family of five per annum.
CONCLUSION
The study reveals that the awareness about insurance is low. Insurance companies should reach
out to those who are uneducated and the lower age group people, by awareness campaigns like
radio (jingles) and television advertisements. The insurance companies should concentrate more
on improving their services. The real growth in life insurance will occur when customers realize
the true value of life insurance beyond tax saving. The awareness of insurance as a long term

12
www.ssijmar.in
saving should be created both by the government, among the uneducated, low income group and
the households having more earning members.
In conclusion, saving can be promoted by insurance companies both government and private
companies by building a relationship of trust. This can be only achieved if the insurance
companies show the people that they are there not only to do business but that they care for the
welfare of all types of the people. The life insurance companies should come out with clear cut
policy details, as many of the respondents had vague ideas about the various benefits and risks
involved in a policy. The middle and low socio-economic groups are a potential market to be
tapped as they are ready to spend a reasonable amount as premium payable per annum. If the
private insurance players want to venture in the market, they should try to imbibe trust in the
people as most of the respondents preferred government life insurance schemes, the reason being
guarantee for their capital. To develop a viable life insurance scheme, it is important to
understand people’s perceptions and develop a package that is accessible, available, affordable
and acceptable to all sections of the society.
REFERENCES
1.Bhat, R (2005) Insurance Industry in India: Structure, Performance, and Future Challenges
Vikalpa Vol. 30, No. 3 pp. 94-96
2.Kannan, N. and Thangavel, N. (2008) Overview of Indian Insurance Sector. Academic Open
Internet Journal. www.acadjournal.com Volume 22. ISSN 1311-4360
3. Krishnamurthy, S (2005) Insurance Sector: Challenges of Competition and Future Scenario.
Vikalpa Vol. 30, No. 3 p.96-101.
4. Parekh Ashwin (2003). Appropriate Model for Health Insurance in India.
Presentation for Federation of Indian Chamber of Commerce and Industry.
5. . Patro Binod K, Anand K and Kapoor B.K (2004). Health Insurance: An

13
www.ssijmar.in
Assessment of Community Perception and Willingness to Pay in A Rural Area,
Unpublished Article. HIFCON.
6. Roy, S. and Vishal, (2007) Dynamics of Private Sector General Insurance in India: A Case
Study AIMS International Vol. 1, No.3, pp. 175-188
7. Saraogi, G (2009) Report on Comparative Analysis of Insurance Products Institute for
Technology and Management, Warangal
8. Sastry V. S. (2010) Indian Insurance Data Issues. Paper presented by Director General,
Insurance Regulatory and Development Authority, Hyderabad at the Seminar on ―Data Base
9. Issues in Financial Sector‖ at Mumbai on 13th March 2010
10. Shukla R (2007) How India Earns, Spends and Saves – Results from the Max New York Life-
NCAER India Financial Protection Survey, The Max New York Life Insurance Limited. New
Delhi. ISBN: 81-88830-10-0
11. Singh, B. K. (2009) An Empirical Study on Perception of Consumer in Insurance Sector E-
Journal of Business and Economic Issues, Vol. 4 No. 3. p.1-17.


![Jammu and Kashmir State Wide Area Network [JKSWAN] JAMMU & KASHMIR E-GOVERNANCE AGENCY (JAKEGA) 2012 Jammu and Kashmir State Wide Area Network [JKSWAN] [RFP Document] Jammu & Kashmir](https://img.pdfslide.us/doc/110x75/5e9b7eee40ad8c0e497a3606/jammu-and-kashmir-state-wide-area-network-jkswan-jammu-kashmir-e-governance.jpg)