Embed Size (px)
Citation preview
8/4/2019 Aware of LG
http://slidepdf.com/reader/full/aware-of-lg 1/6
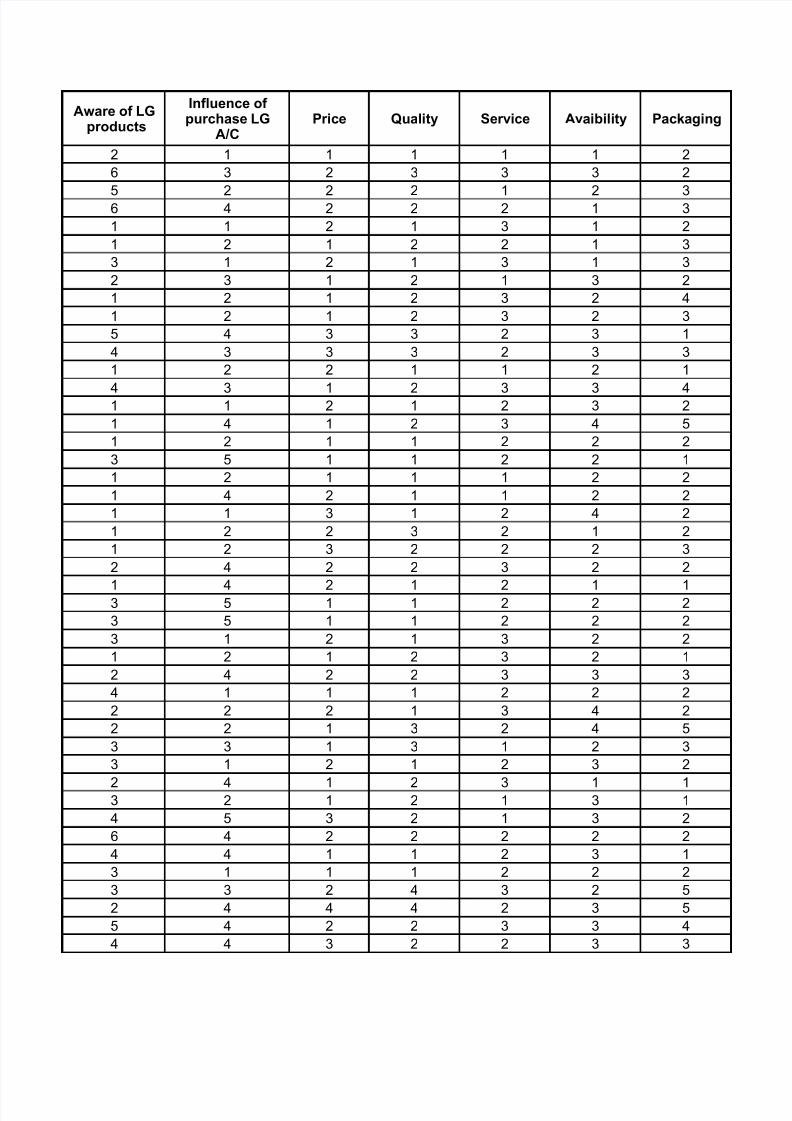
Aware of LGproducts
Influence of purchase LG
A/CPrice Quality Service Avaibility Packaging
2 1 1 1 1 1 2
6 3 2 3 3 3 2
5 2 2 2 1 2 36 4 2 2 2 1 3
1 1 2 1 3 1 2
1 2 1 2 2 1 3
3 1 2 1 3 1 3
2 3 1 2 1 3 2
1 2 1 2 3 2 4
1 2 1 2 3 2 3
5 4 3 3 2 3 1
4 3 3 3 2 3 3
1 2 2 1 1 2 14 3 1 2 3 3 4
1 1 2 1 2 3 2
1 4 1 2 3 4 5
1 2 1 1 2 2 2
3 5 1 1 2 2 1
1 2 1 1 1 2 2
1 4 2 1 1 2 2
1 1 3 1 2 4 2
1 2 2 3 2 1 2
1 2 3 2 2 2 3
2 4 2 2 3 2 2
1 4 2 1 2 1 1
3 5 1 1 2 2 2
3 5 1 1 2 2 2
3 1 2 1 3 2 2
1 2 1 2 3 2 1
2 4 2 2 3 3 3
4 1 1 1 2 2 2
2 2 2 1 3 4 2
2 2 1 3 2 4 5
3 3 1 3 1 2 33 1 2 1 2 3 2
2 4 1 2 3 1 1
3 2 1 2 1 3 1
4 5 3 2 1 3 2
6 4 2 2 2 2 2
4 4 1 1 2 3 1
3 1 1 1 2 2 2
3 3 2 4 3 2 5
2 4 4 4 2 3 5
5 4 2 2 3 3 4
4 4 3 2 2 3 3
8/4/2019 Aware of LG
http://slidepdf.com/reader/full/aware-of-lg 2/6
2 5 3 2 1 3 3
3 3 3 2 1 1 4
1 1 1 1 2 2 3
1 4 1 2 2 2 2
2 4 1 2 2 4 4
Television = 1 Quality = 1 VeryGood = 1 Very Good = 1 Very Good = 1 Very Good = 1 Very Good = 1
News Paper = 2 Price = 2 Good = 2 Good = 2 Good = 2 Good = 2 Good = 2
Internet = 3 Sales Promotion = 3 Okay = 3 Okay = 3 Okay = 3 Okay = 3 Okay = 3
Magazine = 4 Brand Image = 4 Bad = 4 Bad = 4 Bad = 4 Bad = 4 Bad = 4
Hoardings = 5 Service = 5 Very Bad = 5 Very Bad = 5 Very Bad = 5 Very Bad = 5 Very Bad = 5
Others = 6
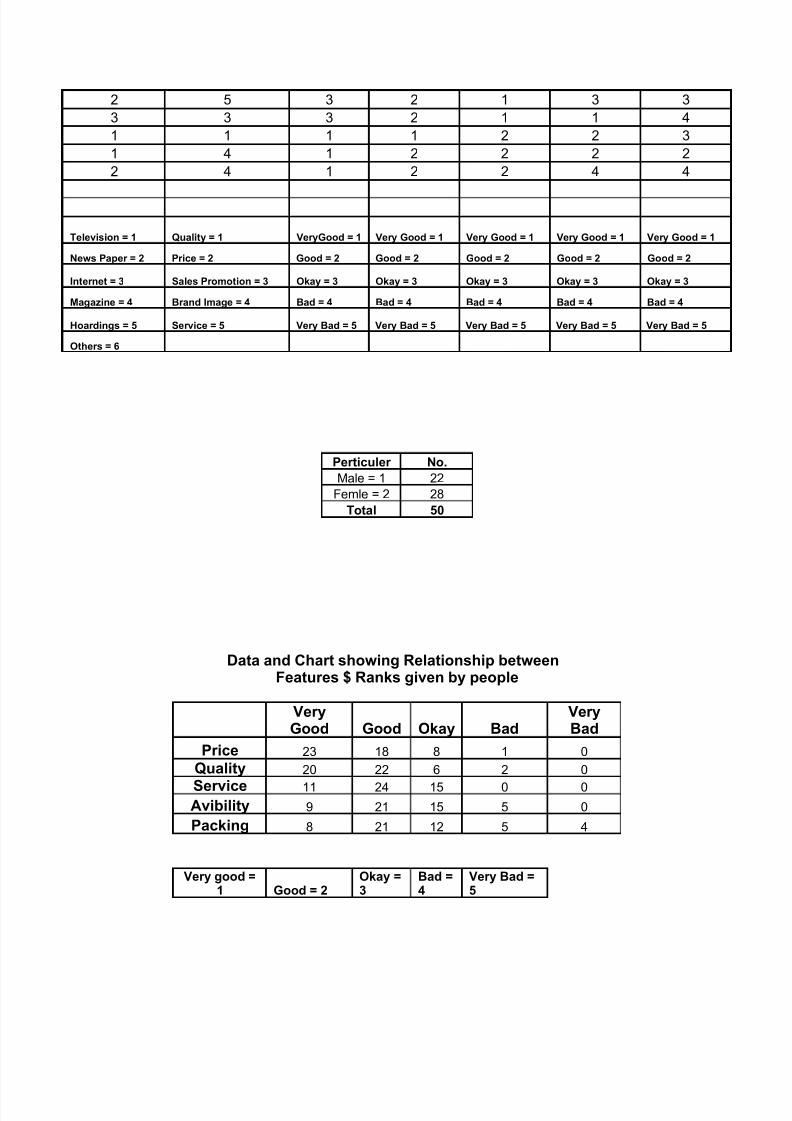
Perticuler No.
Male = 1 22
Femle = 2 28
Total 50
Data and Chart showing Relationship betweenFeatures $ Ranks given by people
VeryGood Good Okay Bad
VeryBad
Price 23 18 8 1 0
Quality 20 22 6 2 0
Service 11 24 15 0 0
Avibility 9 21 15 5 0
Packing 8 21 12 5 4
Very good =1 Good = 2
Okay =3
Bad =4
Very Bad =5
8/4/2019 Aware of LG
http://slidepdf.com/reader/full/aware-of-lg 3/6
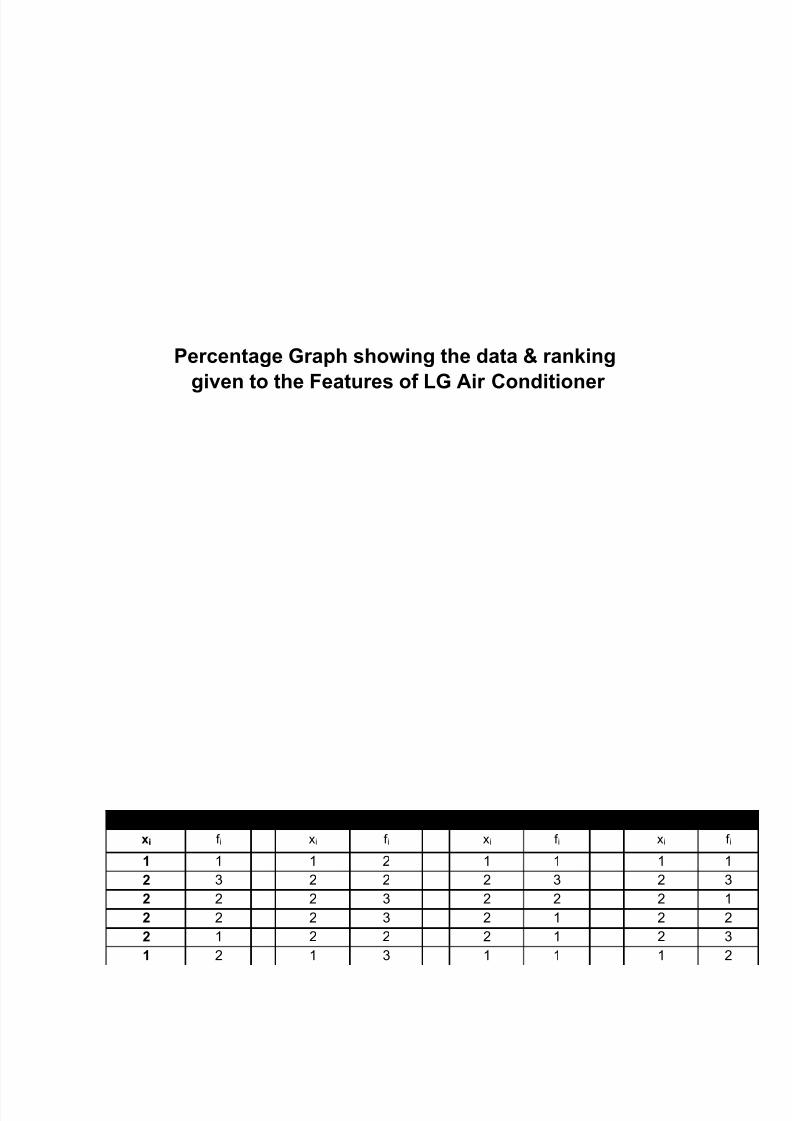
Percentage Graph showing the data & ranking
given to the Features of LG Air Conditioner
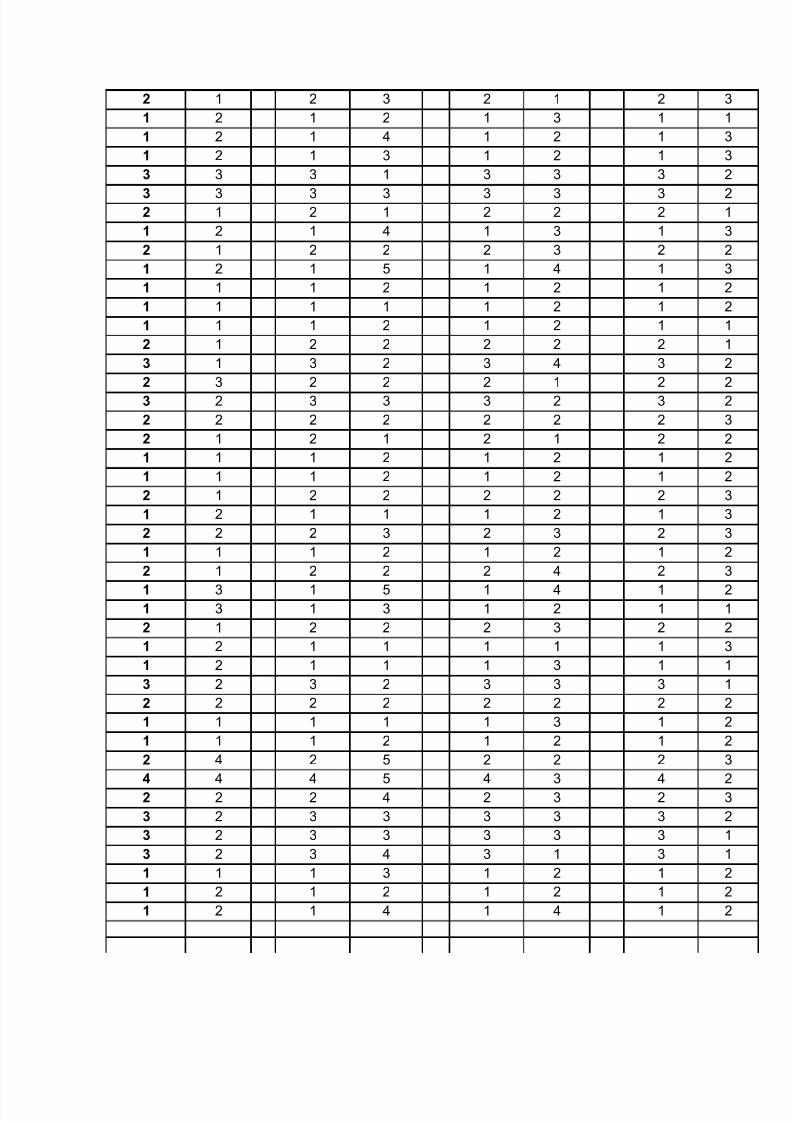
Price & Quality Price & Packging Price & Avaibility Price & Service
xi f i xi f i xi f i xi f i
1 1 1 2 1 1 1 1
2 3 2 2 2 3 2 3
2 2 2 3 2 2 2 1
2 2 2 3 2 1 2 2
2 1 2 2 2 1 2 31 2 1 3 1 1 1 2
8/4/2019 Aware of LG
http://slidepdf.com/reader/full/aware-of-lg 4/6
2 1 2 3 2 1 2 3
1 2 1 2 1 3 1 1
1 2 1 4 1 2 1 3
1 2 1 3 1 2 1 3
3 3 3 1 3 3 3 2
3 3 3 3 3 3 3 2
2 1 2 1 2 2 2 1
1 2 1 4 1 3 1 3
2 1 2 2 2 3 2 2
1 2 1 5 1 4 1 3
1 1 1 2 1 2 1 2
1 1 1 1 1 2 1 2
1 1 1 2 1 2 1 1
2 1 2 2 2 2 2 1
3 1 3 2 3 4 3 2
2 3 2 2 2 1 2 2
3 2 3 3 3 2 3 2
2 2 2 2 2 2 2 3
2 1 2 1 2 1 2 2
1 1 1 2 1 2 1 2
1 1 1 2 1 2 1 2
2 1 2 2 2 2 2 3
1 2 1 1 1 2 1 3
2 2 2 3 2 3 2 3
1 1 1 2 1 2 1 2
2 1 2 2 2 4 2 3
1 3 1 5 1 4 1 2
1 3 1 3 1 2 1 1
2 1 2 2 2 3 2 2
1 2 1 1 1 1 1 3
1 2 1 1 1 3 1 1
3 2 3 2 3 3 3 1
2 2 2 2 2 2 2 2
1 1 1 1 1 3 1 2
1 1 1 2 1 2 1 22 4 2 5 2 2 2 3
4 4 4 5 4 3 4 2
2 2 2 4 2 3 2 3
3 2 3 3 3 3 3 2
3 2 3 3 3 3 3 1
3 2 3 4 3 1 3 1
1 1 1 3 1 2 1 2
1 2 1 2 1 2 1 2
1 2 1 4 1 4 1 2
8/4/2019 Aware of LG
http://slidepdf.com/reader/full/aware-of-lg 5/6
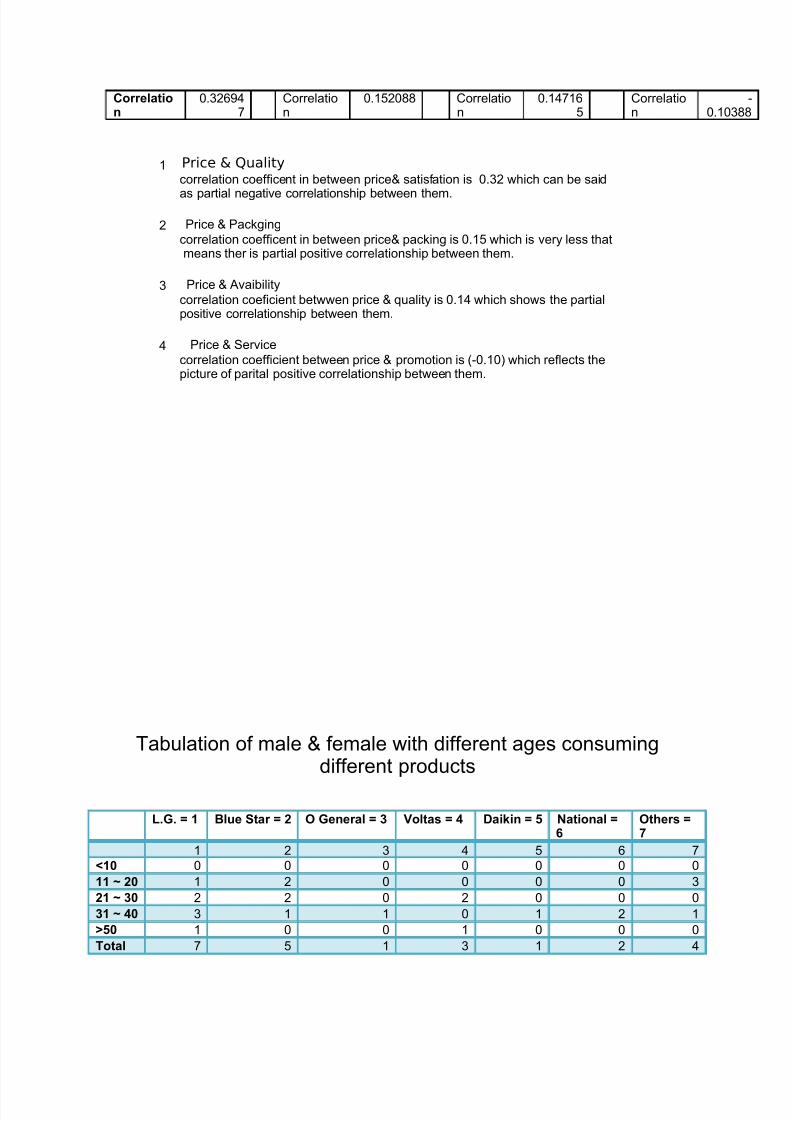
Correlation
0.326947
Correlation
0.152088 Correlation
0.147165
Correlation
-0.10388
1 Price & Qualitycorrelation coefficent in between price& satisfation is 0.32 which can be saidas partial negative correlationship between them.
2 Price & Packging
correlation coefficent in between price& packing is 0.15 which is very less thatmeans ther is partial positive correlationship between them.
3 Price & Avaibility
correlation coeficient betwwen price & quality is 0.14 which shows the partialpositive correlationship between them.
4 Price & Service
correlation coefficient between price & promotion is (-0.10) which reflects the
picture of parital positive correlationship between them.
Tabulation of male & female with different ages consumingdifferent products
L.G. = 1 Blue Star = 2 O General = 3 Voltas = 4 Daikin = 5 National =6
Others =7
1 2 3 4 5 6 7
<10 0 0 0 0 0 0 0
11 ~ 20 1 2 0 0 0 0 3
21 ~ 30 2 2 0 2 0 0 0
31 ~ 40 3 1 1 0 1 2 1
>50 1 0 0 1 0 0 0Total 7 5 1 3 1 2 4
8/4/2019 Aware of LG
http://slidepdf.com/reader/full/aware-of-lg 6/6
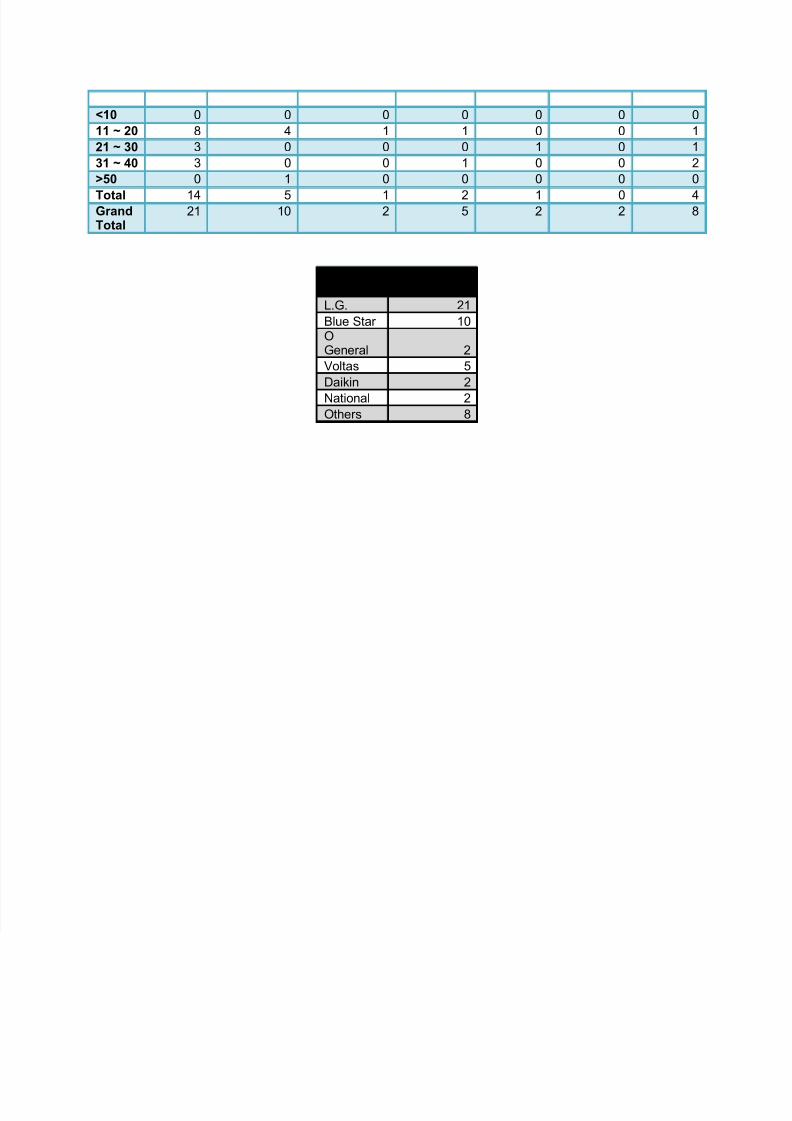
<10 0 0 0 0 0 0 0
11 ~ 20 8 4 1 1 0 0 1
21 ~ 30 3 0 0 0 1 0 1
31 ~ 40 3 0 0 1 0 0 2
>50 0 1 0 0 0 0 0
Total 14 5 1 2 1 0 4
GrandTotal
21 10 2 5 2 2 8
CompanyNo. Of Users
L.G. 21
Blue Star 10OGeneral 2
Voltas 5
Daikin 2
National 2
Others 8