Embed Size (px)
Citation preview

International Business Research; Vol. 9, No. 2; 2016
ISSN 1913-9004 E-ISSN 1913-9012
Published by Canadian Center of Science and Education
114
Aviation Risk Management to Comparative Performance in Air China
with American Airlines
Qussay A. B. Alnuaimi1, 2
, Xinping Xia1 & Firas Aziz M. Jawad
1, 3
1 School of Management, Huazhong University of Science and Technology, 1037 Luoyu Road, Wuhan, P. B.
430074, P. R. China
2 College of Administration and Economics, University of Diyala, Diyala, Iraq
3 College of Administration and Economics, University of Mosul, Mosul, Iraq
Correspondence: Qussay A. B. Alnuaimi, College of Administration and Economics, University of Diyala, Iraq.
E-mail: [email protected]
Received: November 25, 2015 Accepted: December 31, 2015 Online Published: January 25, 2016
doi: 10.5539/ibr.v9n2p114 URL: http://dx.doi.org/10.5539/ibr.v9n2p114
Abstract
This paper presents a model comparison between the Air China and American Airline. The aim of this study is to
research on strong and weak points of these companies on the grounds. Both the countries are from in the
continent of Asia and North America and the world. It also concentrates on the domestic and international
aviation sector to comparative both Air China and American Airline with political and economic volatility. The
sample of SWOT is used to test indexes and to measure volume of strengths and weakness to both the firms. The
model represents one of the tools of Aviation Risk Management to evaluate Air China through find all the
elements of development and address the weaknesses and shortcomings of the Chinese aviation company in
order to compete with the major international airlines.
Keywords: ARM comparative, methodology comparative, SWOT comparatives
1. Introduction
Given the magnitude level of economic and social backgrounds of China and America, The transport by airlines
can partly patterns progress country in different aspects that air companies transport are leading for
comprehensive transport access, mobility, and positive impacts as well as the information about networks
transport is for understanding and grasping airline companies behaviour and the kind of products and services
that they produce to people, tourism and economic. Aviation Risk Management measures operating efficiency for
Air China and American Airline as well as identifies the sources of efficiency, inefficiency within each airline So
that we conduct a research on comparison between both the two airlines companies. In this aspect Kun and
Xingli (2014) wrote last 20 years ago the airlines companies in China had wide growth skills that pushed the
country’s rapid expanding economy. In market volume, the number of air ridership grew at an annual average
around 15% among 1990 and 2010. In 2005 Chinese Airlines companies had been the world’s second-biggest
aviation market, after the United States. Chinese airlines are now between the most earnings airlines in the world.
Since 2011 the total profit reached more than (34.1 million RMB) about USD 5 billion representing around 60%
of the industry’s global gain. In 2013 the Chinese airlines earnings were twice those of airlines companies in the
USA. Laura (2012) adds although one of the joint characteristics between the carriers is the concentrate on
operating as a business in level first, the airline conducting the comparison between airlines companies the
means of achieving the firm’s goals. Barry and others,(2006) studied comparisons between various different
areas of aviation and goals achieved, where he says a lot of airlines in developed countries release regular reports
about their achievement in environmental in conjunction with the achievement of the basic goals of competition
and achieve growth and maintain market value improvements. In the literature of aircraft companies industry the
prime goal is to map the status of environmental reporting by airlines based in Europe and the Asia-Pacific
region to identify the major components of the reports and to examine the performance indicators comparisons
of the units operating in the Asia-Pacific and the with units in Europe. Winai and others (2013) argued
competition and comparative between airlines he said in 1970 Southwest Airlines in USA present the sample
commercial low-price carrier has been employed by airlines in much markets as a competitive alternative to the
traditional complete-service airline business pattern. On broadly (LPC) supply low-pay air journey services

www.ccsenet.org/ibr International Business Research Vol. 9, No. 2; 2016
115
without providing different (frills) like in-flight hospitality and free meals offered by these airlines. Cristina at al.
(2008) add analysis performance by comparative tools to show efficiency of airlines in big market looking at a
great model of airlines using different methods of measuring showing efficiency. In this study, we conduct a
comparison between two of the largest airlines in the world for the performance and the search for opportunities
and minimize the weaknesses to assess what is left in order to compete with international airlines. The residue of
the study is organized as follows: Section 2 reviews the related literature; Section 3 characterizes the study
methodology and the detail of the tests conducted; Section 4 presents the study’s results; and Section 5 summary
and conclusions.
Figure 1. ARM comparing between Air China and American Airline
2. Literature Review
Due to the importance of comparative studies between the different airlines in order to assess performance and
achieve the goals we review some of the previous studies and the task carried out by the risk management in this
task. McFadden (1996) wrote lately, investigators have begun treat the issue of how surely airline safety data
pattern. Although Former studies have discovered pilot-specific factors like driving background, a pilot’s gender,
and others using the comparison characteristics between of the company’s sections. Rico and others (2006)
studied advantages of allocative efficiency said main advantages of allocative efficiency compared to parametric
methods that it does not request any presumption on the functional form of product, results or cost frontiers, and
it also does not have to assume that firms always aim to minimize cost. Also does not request any information on
prices, which is the most useful in data base for example sensitive industries like airlines. Joyce (2013)
application a fuzzy multi-criteria decision-making method to evaluate the financial performance of local Taiwan
airlines based on clusters of financial ratios acquired from logical analysis by measuring volume comparative
study in period 2001-2005. Yee (2008) studied on competition and comparison in China’s domestic aviation
market airlines firms consecrate large magnitude of resources in provided high services to expand customer
satisfaction and increase their income and revenues. In the literature there is a few studies about customer
satisfaction regarding to the service quality of the airlines companies. In China aviation market changed in 2000
like carriers competing, ticket prices compete with service quality to gain customer satisfaction. Carlos (2015)
used analyses the efficiency and competence of airlines of Africa by Technique for Order Preference by
comparison to the Ideal Solution (TOPSIS). This studied of airline has adopted a lot of methods like factor
product, econometric border These studies have analyzed airlines from different countries and regions in the
world including African Airlines have yet to be fully analyzed for that this research give to airline efficiency by
analyzing (TOPSIS). Barros and others (2013) add a lot of cases have been addressed by this method in these
regions or countries like US Airlines, Canadian, European and Asian Airlines. Besides efficiency rankings,
regulatory measures on the execution and slack comparisons, the impact of network gage or volume was done.
Review Jiao et al. (2015) for competition and comparison they said In 1970, US has been Deregulation and in
other Anglo Saxon economies that means best quality airline services, achieve lower air fares and big
competition with the airlines of China have widely grown and tremendously in 1980 and expanded the ridership
size from 10.3 billion person-km to 499 billion person-km, between 1985 and 2012. The rapid growth of
passengers is a result of the increase in the numbers of flights, by using big airplanes. Fu and others (2010) add
Domestic American
Airline
Domestic Air china
International Air
china
Comparing & evaluating by
ARM
Results
International
American

www.ccsenet.org/ibr International Business Research Vol. 9, No. 2; 2016
116
China’s Airlines have market power nationally, internationally, more than mature airlines in the USA and the
Europe where liberalization began the latter two have a much more extensive international network of routes,
more market power, financial resources and the larger fleets. China wishes to create national champions
competing and comparing with internationally. On the other hand Fu (2012) wrote on the comparison of income
between Chinese Airlines with the US and Europe Airlines confirmed this paper by illustrative diagrams to
Chinese airline the top of the US and Europe domestic airline flight Unlike the US and Europe Airline they
achieve income profit more than international flights. In the same context Zhang (2009) study, confirmed that
there are some limitations still exist in China’s aviation industry and some airlines are still owned by the state
unlike European and American Airlines, but at the same time, Chinese airlines has significant growth rates,
which helps to the prosperity and development in this industry. The study of Rogers (1997), adopted the style of
the comparison between American Airlines and Air China to preserve the environment and the methods used for
this purpose. The results obtained from this study affirmed the obligation of environmental standards developed
by the United Nations, to maintain the integrity of the environment of air in both the countries and neighboring
countries to leave the environment through high levels of pollution and illustrations emphasize this fact, which
was used in this study.
Figure 2. Tools used in comparison between airlines
3. Comparative Studies
Research and Comparative studies of important scientific issues that built on the basis compared to the potential
and the ability of the company with a similar firm in order to discover the strengths and weaknesses of the
company and work to improve performance. The scientific comparison on the risk management tools of
aviation .we compare between Air China with American Airline in financial terms and submit a brief summary
about the stages of development of the two companies.
3.1 History of American Airlines
In April, 1926, an aviator named Charles A. Lindbergh a bag-mail and took off from Chicago to Louis St. 1929,
The Aviation Corporation was formed to gain aviation firm. In 1930 The Aviation Corporation’s airline merged
with American Airlines, 1934 American Airways became American Airlines. On June 25, 1936 became the first
airline to fly commercial service passenger. As well as in 1993 American Airlines began trading on the New York
Stock Exchange. In 1950, Americans operated American Overseas Airlines (AOA) in 1977. This company
introduced the more popular fare in its history and offering discount fares from New York and California and
expanded to all of America’s routes and then to Canada and Mexico. 1982 brought American its first 767 more
than 500 million ridership 1988, American acquired the Airbus A300 to serve its Caribbean mainland and in
1989 put its first Boeing 757 into service. 1994, American opened additional routes to London That became the
airline with more service to England 1994, American and additional routes to London to become the airline with
more service to Britain In2004 began daily service between Los Angeles-Tokyo with Boeing 777 airplane
nonstop. In 2008, this company became the first airline provide full internet in flights. In 2008 American airline
began an air cargo e-freight and use mobile phones and PDAs that service gives customers a choice airports the
choice to receive their boarding passes electronically in 2009, this company started to implement an Aviation
Performance
airline A
Stock exchange
airline A
-1 0 1
Performance airline
B
Airline B
Stock exchange
airline B
Airline A

www.ccsenet.org/ibr International Business Research Vol. 9, No. 2; 2016
117
Safety Action Program (ASAP) in conjunction with the Federal Aviation Administration.
3.2 History of Air China
As a result of the Chinese government’s decision Air China was formed in 1988. This divisions lead to six
separate airlines. One of them is Air China and this company was given the head responsibility for
intercontinental flights. According to merger plan, In January 2001 Air China acquired on China Southwest
Airlines in 2001. In this time this company have fourth largest domestic airline with assets of about 56 billion
Yuan (around USD $8.63 million) On 15 December 2004, Air China was successfully listed on the Hong Kong
and London Stock Exchanges in 2004 and listed its shares on the Shanghai Stock Exchange In 2006 In same year
signed an agreement to join the Star Alliance as well as it became a member of the alliance with Shanghai
Airlines. In 2009 this company gained ($19.3 million) of shares from Air Macau, rising from 51% to 80.9%. On
2010, Air China completed achieves a more balanced domestic network. As well as in same year it’s received
Spain’s highest tourism industry award (Plaque for Tourist Merit). On 2010, Air China became the first Chinese
airline to offer combined tickets that include domestic flights and bus services. In 2011 Air China began offering
Wi-Fi internet service on their aircraft that became the first carrier to offer this service in China. In 25th
anniversary to establish the company it made a tested Wireless LAN in flight. It was the first global satellite
Internet flight successfully in the end it was announced that the airline had selected the Boeing 737 Next
Generation and 737 MAX for its fleet renewal programme of about 60 aircraft as well as The Company’s slogan
is an artistic phoenix style.
3.3 SWOT Comparative
SWOT, one of the performance evaluation tools for businesses companies. It consists of four letters the first
letter symbolizes to the strength, the second symbolize to the weakness, the third symbolizes to the opportunities
and the last letter symbolizes to the threats. This tool can be used in the evaluation and comparison between
airlines and in our study between American Airline and Air China that can be considered one tools the risk
management of aviation for the diagnosis of vulnerability and threats in order to provide solutions to them and
also provide elements of power and opportunities for creative through comparisons with similar companies as
well as some times with another rival aircraft company. Figure 3 shows a matrix SOWT that containing four
parts. number one containing the elements of power held by the airline, the second contains elements of
weakness that could airline weaken, the third part consists of the available opportunities that can be developed
and used and the last part contains threats that could be exposed airline.
3.3.1 American Airline SWOT
Figure 3. SWOT American airline by author
Strengths
*Does American airline have
strength *evolution of
technology to comfort
travelers *open new air
routes * enhance efficiency of
pilot and staff
Weaknesses
*Does American airline
expose to weakness
*performance of airline
*Renewal of fleet of aircraft
Opportunities
*Does American airline have
opportunity to;
*maximize profit
*maximize shareholders
*financial position
Threats
*Does American airline expose
to threats;
*Delays in appointments
*Competition with other
airline *Achieving Loss
SWOT

www.ccsenet.org/ibr International Business Research Vol. 9, No. 2; 2016
118
According to Matrix SWOT Aviation we evaluate and compare the American Airline with Air China to get the
results of this study. In the first part we analyze American Airline through SWOT Matrix Aviation. Does
American Airline has elements of power and the technological development and is working to open new lines
and improved the efficiency of pilots and staff. Signal to American’s annual report at the end of the year to 2014
that this company on an ongoing basis to keep pace with the technological development in passenger service and
working to open new transmission lines and to develop and improve programs pilots and staff. The Department
of possession of opportunity in the aviation matrix we see that there is fluctuation in stock prices on the New
York Stock Exchange and the reason for that market factors. Some of these factors internal and some external
but the company at the end of 2014, operating profit has been achieved which shows the financial stability of the
company American Airline. The weak part in the Matrix Aviation, which may be exposed to the American airline,
is concerned with incidents of aviation and air disasters and the renewal of the air fleet. We note that the
company has been subjected to disasters aerial previously been incidents of air has endured losses corporeal
considerably exceeds millions of dollars and there are some older aircraft still working in some lines of the
Interior, which is a weakness in the company’s performance. We are in the final section of the Matrix Aviation,
called Threats. Is that the company is part exposed to threats and what are these threats. We see that the threats
come from customers and competitors when the complaints by customers against airlines and competition with
other airlines big threats are sizeable. In our study we do not have accurate statistics about the numbers of
complaints against the company. As competition with other Air companies in the strong market .the annual
American Airline report indicates that the American Airline is working with full force in order to remain a strong
competitor in the market and the aviation industry.
3.3.2 Air China SWOT
Figure 4. SWOT Air China by author
On the other hand the analysis data of Air China according to the SWOT that shows same characteristics of
American Airline within the same area of specialization and Industry flights. For example, the opportunities for
Air China are similar to the American Airline. It is possible to take advantage of these opportunities available.
Indicators of strong growth in Chinese aviation market demonstrated the existence of significant opportunities to
achieve the goals of Air China while the weaknesses points in the company by measured the performance; we
believe that the achievement of the company operating income shows the efficiency performance, However, in
the case of a certain weaknesses in performance we believe that use tool of SWOT is to assess the performance
of a good tool to detect vulnerabilities and work on it. In addition to the existing or anticipated threats they are
Strength
*Does Air China have
strength?
*evolution of technology and
comfort travelers
*open new air routes
*enhance efficiency of pilot
and staff
Weakness
*Does Air China exposure to
weakness *performance of
airline
*Renewal of fleet of aircraft
Opportunity
*Does Air China have
opportunity *maximize profit
*maximize shareholders
*financial position
Threats
*Does Air China exposure to
threats *Delays in
appointments *Competition
with other airline *Achieving
Loss
SWOT
T

www.ccsenet.org/ibr International Business Research Vol. 9, No. 2; 2016
119
found in the most of airlines and must the Air China to work on reduced or avoided. But there is a fundamental
difference between the two companies which share prices on the stock market .The Global American Airline
Company is much larger than Air China but the growth in Air China expansion and achieve operational profits is
the largest of American Airline.
3.4 Fleet Volume
Studies and Researches on comparison between airlines, among companies in the same country or different
countries provide an important analytical environment (Barbot et al., 2008). This style of research shows the
opportunities in order to optimize and diagnosis as well as the negatives in order to overcome on it. According to
the statistics Bureau of Air China and American Airline (World Economic Forum, 2009), the size of the air fleet
in the American Airline consists of the total 607 aircraft distributed as follows (Boeing 777-300ER ‘10 aircraft’,
Boeing 777-200ER’ 47 aircraft’, Boeing 767-300ER ‘58 aircraft’, Boeing 767-200ER ‘10 aircraft’, Boeing
757-200’ 93 aircraft’, Boeing 737-800’ 226 aircraft’, MD-80 ‘163 aircraft) while the air China fleet consists of
322 airplane distributed as follows (Airbus A319-100’ 32 airplane’, Airbus A320-200 ‘39 airplane’, Airbus
A321-200’ 51’ airplane’, Airbus A330-200’ 26 airplane’, Airbus A330-300’ 7 airplane’, Boeing 737-700 ‘21
airplane’, Boeing 737-800 ‘107 airplane’, Boeing 747-400 ‘3 airplane’, Boeing 747-81 ‘6 airplane’, Boeing
777-200 ‘10 airplane’, Boeing 777-300ER ‘20 airplane’). When studying the preparation and quality of aircraft
for both companies we note that Air China used Boeing 167 aircraft as percent 51.86% and 155 airbus airplane
as percent 48.14% while American Airlines used 444 Boeing airplanes as 73% and another type is 163 aircraft
MD as 27% percent.
3.4.1 Route of American Airline and Air China
American Airlines operate about 6,700 flights per day to 1000 routes in 150 countries from its hubs in
Washington D. C Charlotte, Chicago and Dallas. This company provides Miles programs for members vacation
packages, car rentals, miles for travel, buy tickets, hotel and purchases daily. While Air China its hubs in Beijing,
Chengdu, Hong Kong and Shanghai hub in order to enhance our control over the Southwestern China market
and consolidate its competitive edge as a regional hub. The revenue from transfer flights had a year-on-year
growth of 5%. End of 2014 increased of 24 from the previous year. Air China has 225 domestic routes to 159
cities and had grid covers 1,321 routes in 193 countries.
3.4.2 Number of Employees
Table 1 The number of employees in the air China and American Airline in the year 2014 as follows:
Table 1. Shows the number of employees in the air China and American Airlines
3.4.3 Financial Evaluation
According to the financial report of the Air China company at the end of 2014, which shows the financial
position that recorded an operating profit of RMB 7,262 million, representing an increase of RMB 3,144 million
or 76.34% as compared with last year and earnings per share RMB 3,817 that representing increase of 16.97% in
last year. Total share capital was RMB 105,884 million, representing an increase of RMB 7, 704 million
representing 7.85% as compared with last year. Income from our air traffic operations contributes RMB 101,385
million to the total turnover, representing an increase of RMB 6,782 million or 7.17% over last year. Other
operating income was RMB 4, 499 million representing as compared with last year that represents the increase
of RMB 922 million or 25.76%. Air passenger revenue was 92,599 billion RMB, representing an increase of
Air China American Airline
Management 6,451 Pilots 8,600
Marketing and Sales 1,922 Flight attendants 15,900
Operation 1,435 Maintenance personnel 10,800
Ground Handling 2,056 Fleet service personnel 8,600
Cabin Service 2,274 Passenger service personnel 9,100
Logistics and Support 3,239 Administrative and other 8,600
Flight Crew 3,656
Engineering 2,878
IT information 377
Others 1,918
Total 26,206 Total 61,600

www.ccsenet.org/ibr International Business Research Vol. 9, No. 2; 2016
120
5,872 million RMB over that of 2013. Among the air passenger revenues, the increase of capacity contributed
RMB 8, 864 million to the revenue, while the income of passengers in 2014 was less than 2013 at 1,918 million
RMB and 1,074 million RMB, respectively. Air cargo and yield was 8,786 million RMB, representing an
increase of 910 million RMB as compared with last year. Air China has operating expenses were RMB 98,623
million, representing an increase of 4.85% from RMB 94,063 million in 2013. Set out below:
Table 2. Air China operating expenses in 2014
Operating expenses 2014 percentage %
Jet fuel costs 34,542,440 35.02
Take-off, landing 10,566,490 10.71
Depreciation 11,322,989 11.48
Aircraft maintenance costs 3,587,507 3.64
Employee compensation costs 15,512,764 15.73
Air catering charges 2,755,640 2.79
Selling and marketing expenses 5,899,633 5.98
General and administrative expenses 568,136 0.58
Others 13,867,076 14.07
Total 98,622,675 100.00
On the other hand the financial statements of American Airline for the fiscal year ending show in 2014 (in
millions) in Table 3 as follows:
Table 3. American Airline operating expenses in 2014
Total operating revenues 42,650 26,743
Total operating expenses 38,401 25,344 24
Operating income (loss) 4,249 1,399
Reorganization items, net (1) - (2,655)
Net income (loss) 2,882 (1,834)
Earnings (loss) per common share:
Basic 4.02 (6.54)
Diluted 3.93 (6.54)
Shares used for computation (in thousands):
Basic 717,456 280,213
Diluted 734,016 280,213
Cash dividends declared per common share 0.20 -
Consolidated Balance Sheet data (at end of period): Total assets 43,771 42,278
Long-term debt and capital leases, net of current maturities 16,196 15,353 7
Pension and postretirement benefits (2) 7,562 5,828
Mandatorily convertible preferred stock 325 5,928
Liabilities subject to compromise - -
Stockholders’ equity (deficit) 2,021 (2,731)
Consolidated Statements of Operations data excluding special items (3) (Unaudited):
Operating income (loss) excluding special items 5,073 1,935
Net income (loss) excluding special items 4,184 1,244
American Airline provides investors the ability to measure the financial performance efficient and more
comparable to measures reported by other main airlines companies. American Airline reported that annual
revenues increased 4.2% and 1.8%, respectively, as compared to 2013. Domestic markets outperform
international markets. Atlantic and Latin America regions experienced year-over-year growth in passenger’s
income of 2.8% and 3.4%, respectively. Jet fuel costs were lower in 2014 as compared to 2013, pushed by a big
fall in fuel prices in the end of 2014.
Finally, when analyzing the financial statements for both companies note that the two companies have achieved
growth in the last two years and the high value of the shares and the addition of new transmission lines, whether

www.ccsenet.org/ibr International Business Research Vol. 9, No. 2; 2016
121
local or international lines that reflect the evolution of performance for both companies.
3.5 Aviation Risk Management
In 2001 Air China formed Aviation Risk Management operate that controlling of risk arising from the rise in fuel
price and engaging in transaction of fuel hedging of the hedging instruments used were mainly derivatives of
Brent crude oil and new York crude oil Singapore kerosene together which are closely linked to the price of jet
fuel. For that establishment this new position at present the Air China operates to develop its fuel edging
business with regulatory requirements so as to cope with changes in the jet fuel market. While the formation of
risk management in American Airline in the seventies of the last century, which was the basis of her work as well
as occupational safety and air insurance. In 1998 due to the high volatility of fuel prices, due to the threat of the
financial status of company and low price of shares for that this company has added another important work for
the risk management to hedge the price of fuel reserves to protect the company from the of high fuel price and
potential losses.
4. Methodology
The present study uses model comparison between Air China and American Airline using statistical models that
are using the comparative financial analysis of the prices of the shares of both companies listed on international
stock exchanges (Shanghai and New York). The results of the financial and statistical analysis of comparative
data provide a base from which to find out how much the link between global stock exchanges in the form of one
group or independently in addition to the knowledge of the best performance for both companies. After
comparative statistical we use( SWOT Airline) model, which contain four letter the first characters representing
the strength of the company, the second character is weak of the airline, the third characters represents the
company’s opportunities and the fourth is a threat the company. This model represents one of tools risk
management aviation to evaluate performance.
In this research we use scientific method (CORREL) to compare the Air China and American Airline stocks
prices. The correlation coefficient is a number between -1 and 1, which shows a linear relationship between two
variables and the direction of that relationship as follows: + 1 positive relationship means in the sense that the
more a plus b The smaller than b least a -1 Means the inverse relationship in the sense that the greater than and b
at least the less a than the b Zero means that there is no relationship between two variables. When approaching
the correlation coefficient of one of these values, it shows what is signified by these values, but to a lesser degree.
For example, 0.9 indicates a strong positive relationship between the two variables, but not absolute, such as
those that you would expect when the correlation coefficient is equal to + 1 in the following model:
CORREL = (1)
Where:
Xi= price Air China
Yi= price American airline
Numerator in this equation is the sum of the product of the difference between the value of the Air China,
American airline and the arithmetic average of the difference between the value of each variable and the second
arithmetic average. The primarily is multiplied by the standard deviation for each of the air china and American
Airline.
4.1 Comparative Results
The result in this study that American airline and Air china in stock exchange (shanghai and New York) in period
2014-February using comparative tools for both the companies that evaluate performance observation (60).
When we test a sample (airlines listed in stock shanghai and New York). This finding about our by the significant
statistically to analyze and take decision by aviation risk management. Table 1 and Table 2 show the result of this
study:
www.ccsenet.org/ibr International Business Research Vol. 9, No. 2; 2016
122
Table 4. Correlation between both companies
Airline Correl open price Correl close price
American and china 0.64 0.55
Note. *significant at level 0.1, **significant at level, 0.5, ** *significant at level1.0.
In Table 4, We note that the correlation coefficient between Air China with the Americans Airline at the open
price 0.64 efficient, close price 0.55 that mean both companies at 0.5 ** In other words, both companies that
affects the one on the other in the international stock markets at 0.5 when exposed International financial
variables. More clarify the link between the two companies in global markets after the second level of the
positive relationship.
Table 5. Financial statistics of Airlines Company by F-test, T-test
Airline F-Test T-test
American airline * * 0.89 * * 0.80
Air China *0.50 * 0.72
Note. *significant at 0.5 level, **significant 1 level.
In Table 5 shows us that the American lines have registered for the T-test at 0.80 and F-test at 0.89 respectively,
while Air China T-test recorded at 0.72 and at F-test at 0.50 .This means that the bonding strength between the
shares of American airline prices at the first level While the correlation shareholders price of Air China at the
second level.
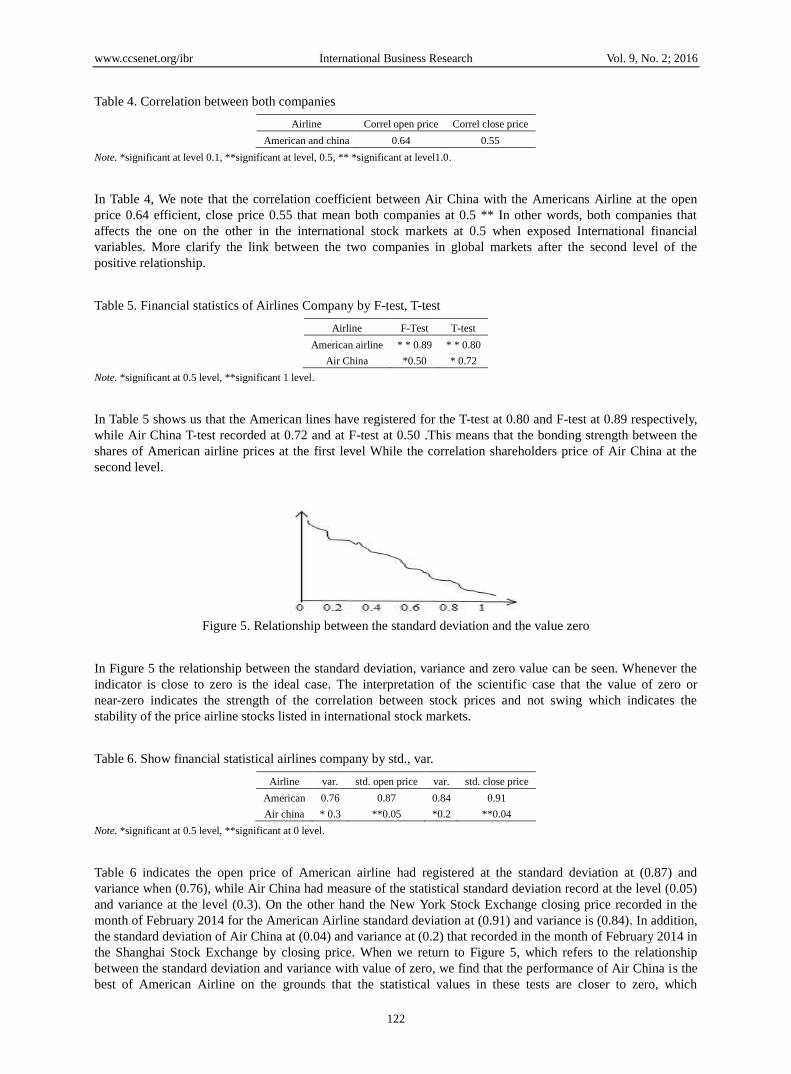
Figure 5. Relationship between the standard deviation and the value zero
In Figure 5 the relationship between the standard deviation, variance and zero value can be seen. Whenever the
indicator is close to zero is the ideal case. The interpretation of the scientific case that the value of zero or
near-zero indicates the strength of the correlation between stock prices and not swing which indicates the
stability of the price airline stocks listed in international stock markets.
Table 6. Show financial statistical airlines company by std., var.
Airline var. std. open price var. std. close price
American 0.76 0.87 0.84 0.91
Air china * 0.3 **0.05 *0.2 **0.04
Note. *significant at 0.5 level, **significant at 0 level.
Table 6 indicates the open price of American airline had registered at the standard deviation at (0.87) and
variance when (0.76), while Air China had measure of the statistical standard deviation record at the level (0.05)
and variance at the level (0.3). On the other hand the New York Stock Exchange closing price recorded in the
month of February 2014 for the American Airline standard deviation at (0.91) and variance is (0.84). In addition,
the standard deviation of Air China at (0.04) and variance at (0.2) that recorded in the month of February 2014 in
the Shanghai Stock Exchange by closing price. When we return to Figure 5, which refers to the relationship
between the standard deviation and variance with value of zero, we find that the performance of Air China is the
best of American Airline on the grounds that the statistical values in these tests are closer to zero, which

www.ccsenet.org/ibr International Business Research Vol. 9, No. 2; 2016
123
demonstrates the strength and unity of Air China shares prices more than American Airline.
Table 7. High and low price to both airline
Airline High Low open price High Low close price
American 36.1 33.4 36.17 33.8
Air China 3.87 3.71 3.9 3.74
Table 7 Shows higher and lower price for both companies to fly when the opening price and the closing price per
period of the test, in February 2014. Recorded the rates of American Airline high open price at 36.1, low price at
33.4 while the closing price at the highest value at 36.17, the lowest value at 33.8 Besides, Air China had
recorded a 3.87 price rise in the opening price and the lowest level at 3.71, while the highest closing price at 3.9,
the lowest at 3.74.
4.2 Comparative (RFTK) and (RPK)
According to the civil aviation authority in the United States of America and the Republic of China is different
Data Base on carriers in both countries, including financial statements and other transport. We offer (RFTK),
(RPK) a model of comparison between American Airline and Air China in this section for the period from 2007
to 2013 years. Note the numbers of thousands.
Figure 6. Income of travelers in American Airline and Air China (RPK)
Figure 6 shows the income of travelers in American Airline and Air China kilometers (RPK) for the period
(2007-2013). This figure indicates every two hundred thousand kilometers to Air China in 2007 to per four
hundred thousand kilometers in 2013, an increase of almost 200% illustrated on the strength of the company’s
growth and development. While the indicator to an American Airline in 2007 had entered one million and two
hundred thousand kilometer and one million and seven hundred thousand kilometers in 2013 up 45% is less than
that of the Air China.
Figure 7. Flight in American Airline and Air China (RFTK)
According to the Figure 6 which indicates the size of the local shipping by American Airline and Air China. In

www.ccsenet.org/ibr International Business Research Vol. 9, No. 2; 2016
124
2007 the volume of shipping by China one million and one hundred thousand tons and million and three fifty
thousand tons in 2013 volume of freight that increase of 22% tons On the other hand, American Airline freight
transport volume in 2007 was four million and one hundred thousand tons, five million and five hundred
thousand tons in 2013, an increase of volume of freight 34%.
4.3 Correlation Regression Comparative
We use correlation regression to analyze and compare relationship between American Airline and Air China.
However in our study the regression is better suited for studying functional dependencies between two factors
time and price exchange implies that the time independent and stock prices dependent because he was variable in
the time. The goal of this type of analysis shows the possibility of gains for the prices of shares of airlines in the
least possible time with the predictability of stock prices in the future in accordance with the data available the
results are of less value, the results are best viewed as gains can be achieved in less time. To obtain a simple
regression model is done by:
y = a + b x
y represents the predicted value
a represents the intercept of the best fitting line
b represents the slope of the line.
The above equation could be explained as in the Figure 8.
Figure 8. Simple regression equation which shows α represent the intercept and β represent the slope of the line
4.3.1 Air China Correlation Regression
Figure 9. Air China correlation regression
Figure 9 shows the simple regression coefficient for Air China, which shows us the stock price in the test period
February 2014. With blue spots represent stock price and this slope represents the best case can be obtained this
test by computer. By offsetting the values of β, α and rate stock prices in Air China we getting value of model
simple regression coefficient. The results obtained by simple regression shows that, predicted value 13.59 and
indicates that the stability, reliability and profits in 13.59 days in accordance with changes available.

www.ccsenet.org/ibr International Business Research Vol. 9, No. 2; 2016
125
4.3.2 American Airline Correlation Regression
Figure 10. American Airline correlation regression
Figure 10 shows the simple regression coefficient for American Airline that shows to the stock price in the test
period February 2014. Green spots refers to stock shareholders and this slope represents the best case can be
obtained this test by computer. By offsetting the values of β, α and rate stock prices in American Airline we
getting value of model simple regression coefficient. The findings refer to simple regression with the forecasting
value 10.04 and indicates that the stability, reliability and profits in 10.04 days in accordance to the effect
different factors.
5. Discussion
Basic functions of the Aviation Risk management is the financial and job situation for airlines to assess in
collaboration with senior management. We focus in this paper on the two companies in the field of aviation are
American and China, considering that both companies in two major countries such as the United States and
China. The purpose of this research is to research and analysis of the reality of the two companies from several
aspects, including the financial and service side and the size of both companies and services provided by both
local and international. We used the correlation coefficient between the American Airline and Air China to show
the affect both companies in the global stock markets. The statistical tests for each company individually show
that the central tendency of the Air China company standards are more stable and consistent than the American
airline, but the market value of stock prices for American line is the largest of China in global stock markets.
Both companies are working for the development of performance and keep pace with the evolution of the global
air services and the opening of new air routes and reducing errors that may occur to the lowest possible level.
Both companies prepared the report points at the end of 2014.They may have achieved operating income which
helps to strengthen the financial position and the market value for both companies. But when analyzing both the
reports of both the companies we found that Air China’s faster growth and expansion than of American Airline.
Finally, the Risk Management operates through comparative studies between companies using matrix SWOT to
assess the performance and the discovery of vulnerabilities and threats in order to find solutions to these
problems and to maximize the opportunities and strengths of the company to maintain the financial position and
to maximize the market value of the company. We find that there is a benefit of this study in comparing the
Aviation risk management tools to periodic review to assess the performance of air China.
Acknowledgments
Author is grateful to those who contributed to this research. Especially, the American airline company, Air China
and my colleagues in Huazhong University Science and Technology for the completion of this research. In spite
of your immense support this would have been a miracle.
References
Barbot, C., Costa, A., & Sochirca, E. (2008). Airlines performance in the new market context: A Comparative
Productivity and Efficiency analysis. Journal of Air Transport Management, 14(14), 270-274.
http://dx.doi.org/10.1016/j.jairtraman.2008.05.003
Barros, C. P., Liang, Q. B., & Peypoch, N. (2013). The technical efficiency of US Airlines. Transportation Research Part A Policy & Practice, 50(2), 139-148. http://dx.doi.org/10.1016/j.tra.2013.01.019
www.ccsenet.org/ibr International Business Research Vol. 9, No. 2; 2016
126
Barry, L. M. M., Wilco, W. H. C., Kevin, W., & Cong, Z. (2006). Comparative studies of standalone
environmental Reports-European and Asian airlines. Transportation Research Part D Transport &
Environment, 12(1), 45-52.
Carlos, P. B., & Peter, W. (2015). An analysis of African airlines efficiency with two-stage TOPSIS and neural
networks. Journal of Air Transport Management, 44-45, 90-102.
http://dx.doi.org/10.1016/j.jairtraman.2015.03.002
Cristina, B., Lvaro, C., & Elena, S. (2008). Airlines performance in the new market context: A comparative
productivity and efficiency analysis. Journal of Air Transport Management, 14(14), 270-274.
Fu, X., Oum, T., & Zhang, A. (2010). Air transport liberalization and its impacts on airline. Competition and air
passenger traffic. Transport. J. Fall, 24-41.
Fu, X. (2012). Will China’s airline survive the entry of high-speed rail. Research in Transportation Economics,
35(1), 13-25. http://dx.doi.org/10.1016/j.retrec.2011.11.006
Jiaoe, W., David, B., & David, B. (2015). Air deregulation in China and its impact on airline competition
1994-2012. Retrieved from http://creativecommons.org/licenses/by-nc-nd/4.0/
Joyce, M. W., Low, B., & Kwon, L. (2013). Effects of internal resources on airline competitiveness. Journal of Air Transport Management, 36(36), 23-32.
Kun, W., & Xingli, F. (2014). Benchmarking the performance of Chinese airlines: An investigation of
productivity, yield and cost competitiveness. Journal of Air Transport Management, 38(3), 3-14.
Laura, D. (2012). The evolution of the European low-Cost airline business models Ryan air case study.
Procedia-Social and Behavioral Sciences, 62, 342-346. http://dx.doi.org/10.1016/j.sbspro.2012.09.054
McFadden, K. L. (1996). Comparing pilot-error accident rates of male and female airline pilots. Omega, 24,
443-450. http://dx.doi.org/10.1016/0305-0483(96)00012-6
Rico, M., & David, A. H. (2006). The Impact of strategic management and fleet planning on airline efficiency-A
random effects Tobit model based on DEA efficiency scores. Transportation Research Part A Policy &
Practice, 45(7), 686-695.
Winai, H., Zheng, L., & Xiaowen, F. (2013). Competitive effects of the airlines-within-airlines strategy-Pricing
and route entry patterns. Transportation Research Part E Logistics & Transportation Review, 63(3), 1-16.
World Economic Forum. (2009). The travel and tourism competitiveness report. World Economic Forum,
Geneva, Switzerland.
Yee, R. W. Y., Yeung, A. C. L., & Cheng, E. (2008). The impact of employee satisfaction on quality and
profitability in high-contact service industries. Journal of Operations Management, 26(5), 651-668.
http://dx.doi.org/10.1016/j.jom.2008.01.001
Zhang, A. H. (2009). Low cost carriers in Asia deregulation, regional secondary airports. Transp. Econ, 36-50.
Copyrights
Copyright for this article is retained by the author(s), with first publication rights granted to the journal.
This is an open-access article distributed under the terms and conditions of the Creative Commons Attribution
license (http://creativecommons.org/licenses/by/3.0/).