Embed Size (px)
Citation preview
© 2021 Copyright owned by one or more of the KPMG International entities. KPMG International entities provide no services to clients. All rights reserved.
1
Aviation 2030Air Taxi Readiness Index (2021 edition)
Assessing the preparedness of 25 territories in the race for vertical take-off and landing air mobility

© 2021 Copyright owned by one or more of the KPMG International entities. KPMG International entities provide no services to clients. All rights reserved.
2
Reader guideThe Air Taxi Readiness Index (ATRI) is a tool to help measure the level of preparedness for the upcoming generation of passenger-carrying Vertical Take-off and Landing (VTOL) vehicles in 25 selected territories. It is a composite index that combines 34 individual, existing metrics from a range of sources that span those territories into a single score. The metrics are arranged across four pillars: consumer acceptance; infrastructure; policy and legislation; technology and innovation. Each territory receives a normalized score from zero to one across eight to nine metrics per pillar. For simplicity, no score is given where a territory is not ranked at all on the original international comparison. These scores are then aggregated into unweighted totals at the national level, 34 being the maximum possible score for any given territory. 1
Scores are based on normalized results from pre-existing KPMG and third-party secondary sources, with the volume of reasonable proxies used to give directional confidence in the resulting totals.
The index is to be used to form comparisons between territories’ preparedness levels for air taxi adoption. It is not meant to be exhaustive or definitive in terms of predicting air taxi adoption rates. Its intended audience is public and private bodies alike looking to understand the potential benefits of early adoption of this technology, and the suitability of different geographies for relevant pilot schemes and investment. This report will use ‘VTOL’ and ‘air taxi’ interchangeably throughout, referring to vehicles capable of short-haul airspace passenger transportation, piloted or unpiloted. 2 By the nature of available international rankings, these metrics tend to be backward looking, so this report has several territories as case studies to explore local nuance, including forward-looking developments. With future editions of this index, this research can explore the pace of change, which differs significantly by territory.
1 While urban centres will be a key driver in the VTOL roll-out, and we will therefore see intra-national disparities in market development, we think a national lens most relevant. This reflects the importance of national policies, national aviation authorities and air traffic management, as well as the potential for VTOL to go beyond intra-urban transport and be integrated airside as a regional connection network for traditional domestic and international aviation.
2 It is therefore a proxy for the wider and emerging ‘Advanced Air Mobility’ landscape, but we are aware adoption rates for cargo, utility, military and passenger use cases will also differ with local context, and therefore involve a different mix of metrics.

© 2021 Copyright owned by one or more of the KPMG International entities. KPMG International entities provide no services to clients. All rights reserved.
3
Index results
US
Singapore
Netherlands
UK
Australia
China
South Korea
Switzerland
Germany
Canada
UAE
Sweden
Japan
France
Ireland
New Zealand
Belgium
Spain
Israel
Italy
Saudi Arabia
Russia
Poland
India
Brazil
0 2 4 6 8 10 12 14 16 18 20 22 24 26 28

© 2021 Copyright owned by one or more of the KPMG International entities. KPMG International entities provide no services to clients. All rights reserved.
4
Introduction: the aerial mobility revolution
The global VTOL market is expected to blossom in coming decades, as congested cities look for new ways to cut journey times and commuters and tourists embrace the promise of piloted and then automated air taxi flight. Morgan Stanley has estimated that the market could be worth US$1 trillion by 2040. The sector has seen a gold rush of start-ups and investors, breathless media reportage and futuristic demos. Many operators are expecting to commercialize their first propositions within the next three years.
On the other hand, as of 2021, the level of investor interest risks creating a bubble and subsequent crash in financial interest. Morgan Stanley’s US$1 trillion estimate, for example, is downgraded from their original total addressable market estimate of US$1.5 trillion published back in 2018. Analysts at the bank cite a “regulatory Mount Everest” for the technology to climb and a number of risks around the speed of adoption, all of which suggest that investors may need to be prepared for a 20 to 30 year return on investment.3 However, even their most bearish predictions still estimate a multi-trillion dollar market globally by 2050.
Publicly available databases have begun tracking the maturity of the different VTOLs coming to market, with an emphasis on developer more than country of operation. KPMG’s global series ‘Aviation 2030’ and the KPMG Autonomous Vehicles Readiness Index have both furnished insights into aerial mobility and autonomous vehicle (AV) trends around the world, respectively. The ATRI is intended to build on that AV methodology to provide specific insight into the readiness by territory to embrace the new age of aerial mobility through VTOLs.
This report will now introduce the four pillars of the index in turn.
3 Morgan Stanley, 2021

© 2021 Copyright owned by one or more of the KPMG International entities. KPMG International entities provide no services to clients. All rights reserved.
5
Pill
ar s
core
s
Populations differ markedly in their willingness to accept VTOL technology. The consumer acceptance pillar aims to measure those differences through readily available proxies, aggregating data across eight internationally available measures for:
� Civil technology use 4 � Individual readiness to use technology 5 � Digital skills 6 � Market size 7
� Innovation capability 8
� Consumer ICT adoption rates 9 � Ride hailing & taxi market penetration 10 � Passenger air traffic volumes per capita 11
The US leads this pillar. Asian representation is strong while the Netherlands leads the European charge.
4 KPMG Change Readiness Index 20195 Portulans Institute Individual Readiness Index 20196 World Economic Forum, Global Competitiveness Report 20197 World Economic Forum, Global Competitiveness Report 20198 World Economic Forum, Global Competitiveness Report 20199 World Economic Forum Global Competitiveness Report 201910 Statista, 202111 Citypopulation, 2018
US
Chi
na
Sin
gapo
re
Net
herla
nds
Sou
th K
orea UK
UA
E
Can
ada
Ger
man
y
Aus
tral
ia
Switz
erla
nd
Swed
en
Japa
n
Irel
and
Fran
ce
Sau
di A
rabi
a
Isra
el
Spa
in
Rus
sia
New
Zea
land
Bel
gium Ital
y
Pola
nd
Indi
a
Bra
zil
7
6
5
4
3
2
1
0
Consumer acceptance01

© 2021 Copyright owned by one or more of the KPMG International entities. KPMG International entities provide no services to clients. All rights reserved.
6
Infrastructure
An extensive range of infrastructure is necessary to support widespread use of VTOL vehicles in urban environments. The infrastructure pillar incorporates nine metrics for:
� EV charging stations 12
� 4G coverage 13
� Quantity of air traffic 14
� Technology infrastructure change readiness 15
� Mobile connection speed (e.g. 4G, 5G) 16
� Broadband 17
� Climate suitability 18
� Ground congestion 19
� Skyscraper density 20 (as a proxy for downtown landing sites)
China and the US lead the pillar with few surprises elsewhere with the likes of South Korea, Australia, Switzerland, Singapore and the UAE all sharing high rankings.
12 Global EV Outlook 2020’, IEA Technology report, June 2020. 13 Sam Fenwick and Hardik Khatri, ‘The State of Mobile Network Experience 2020: One Year Into the 5G Era’, May 2020. 14 Air transport, passengers carried’, International Civil Aviation Organization and Civil Aviation Statistics of the World, 2019. 15 ‘2019 Change Readiness Index’, KPMG International, May 2019. 16 ‘Speedtest Global Index’, Speedtest Intelligence, February 2021 17 Global Connectivity Index’, Huawei, 2020 18 Global Residence Index, 2021 (with 18-30 degrees Celsius, sunny with low rain and humidity levels considered idea for VTOL use) 19 Tomtom, 202020 Council on Tall Buildings and Urban Habitat, 2021
Pill
ar s
core
s
US
Chi
na
Sou
th K
orea
Aus
tral
ia
UA
E
Sin
gapo
re
Switz
erla
nd
Net
herla
nds
Japa
n
UK
Swed
en
Can
ada
Ger
man
y
Fran
ce
New
Zea
land
Sau
di A
rabi
a
Bel
gium Ital
y
Indi
a
Pola
nd
Isra
el
Bra
zil
Irel
and
Rus
sia
Spa
in
6
5
4
3
2
1
0
02

© 2021 Copyright owned by one or more of the KPMG International entities. KPMG International entities provide no services to clients. All rights reserved.
7
21 ‘Corruption Perceptions Index’, Transparency International, 202022 Klaus Schwab, ‘The Global Competitiveness Report 2019’, World Economic Forum, 201923 KPMG Change Readiness Index 201924 World Economic Forum Global Competitiveness Report, 201925 ‘The Network Readiness Index 2019’, Portulans Institute, March 202026 World Economic Forum Global Competitiveness Report, 201927 RAND Corporation, 201728 World Bank Ease of Doing Business Rankings, 201929 Startup Blink, 2020
Policy and legislation
This pillar comprises nine metrics:
� Transparency 21
� Energy efficient regulation 22
� Government readiness for change 23
� Future orientation of government 24
� Data sharing environment 25
� Efficiency of the legal system in challenging regulations 26
� Drone regulation 27
� Ease of doing business 28
� Start-up business environment 29
Here the European states in the territory selection perform well. Sweden leads the ranking overall, with the Netherlands in second.
Pill
ar s
core
s
Swed
en
Net
herla
nds
Sin
gapo
re UK
Ger
man
y
Can
ada
Switz
erla
nd US
Aus
tral
ia
New
Zea
land
Japa
n
UA
E
Fran
ce
Irel
and
Spa
in
Ital
y
Sou
th K
orea
Bel
gium
Chi
na
Isra
el
Indi
a
Sau
di A
rabi
a
Rus
sia
Pola
nd
Bra
zil
8
7
6
5
4
3
2
1
0
03

© 2021 Copyright owned by one or more of the KPMG International entities. KPMG International entities provide no services to clients. All rights reserved.
8
Technology and innovation
The technology and innovation pillar comprises eight metrics:
� Availability of latest technology 30
� Innovation capability 31
� Cybersecurity 32
� Assessment of cloud computing 33
� Industry investment in drone technology 34
� Drone technology firm HQs 35
� Drone-related patents 36
� Drone market share 37
The US is the leader by a substantial margin in this pillar, significantly ahead of the Netherlands and Singapore and with a clear lead across many metrics. Ireland also scores comparatively higher here.
30 ‘BSA Global Cloud Computing Scorecard’, The Software Alliance, 201831 Soumitra Dutta, Bruno Lanvin and Sacha Wunsch-Vincent, ‘Global Innovation Index 2019’, Cornell University, 201932 ‘World Intellectual Property Indicators 2020’, World Intellectual Property Organization, 202033 Primarily based upon “Huawei 2020 GCI Ranking Table”, alongside: ‘Global Connectivity Index’, Huawei, 202034 Niall McCarthy, ‘The Countries Set To Dominate Drone Warfare’, Statista, 19 November 2019; Alex Irwin-Hunt, ‘The global map of venture capital-powered FDI’, FDI Intelligence, 201935 Crunchbase, 202136 PatSeer, 202137 Statista, 2021
Pill
ar s
core
s
US
Net
herla
nds
Sin
gapo
re
Aus
tral
ia
Irel
and
UK
Chi
na
Sou
th K
orea
Fran
ce
Japa
n
Ger
man
y
Spa
in
Bel
gium
Switz
erla
nd
Isra
el
Can
ada
UA
E
New
Zea
land
Rus
sia
Pola
nd
Ital
y
Swed
en
Sau
di A
rabi
a
Bra
zil
Indi
a
7
6
5
4
3
2
1
0
04

The view of Jono Anderson, Principal, KPMG in the US:
� The US leads the overall rankings by a considerable margin. Perhaps unsurprisingly, the US is at or above the mean in every metric across every pillar.
� The US has the highest air traffic volume of any country in the index, indicating strong consumer demand for air travel, as well as a highly developed air traffic control infrastructure, which should form a sound basis for VTOL regulation. Of all markets where VTOLs start to move beyond urban point-to-point travel, it’s predicted that the US represents a significant opportunity for airside regional connectivity into a developed airport market.
� Given the US’s wide variety of urban and rural environments and federal model, various players are already actively developing the frameworks within which VTOL will operate.
� With world-leading centers of technological innovation in both digital and aerospace, the US has produced some of the front runners in the VTOL space, such as Joby Aviation and Wisk Aero. The US is also a leader in terms of relevant patents filed.
� Conveniently, the west coast of the US also enjoys favorable climatic conditions for the regular use of VTOL technologies, with its relatively stable, dependable temperatures and (for the southwest) low rainfall.
Select national profilesHere this report profiles the top five territories in this ranking, with a sample of others in the wider index.
9
© 2021 Copyright owned by one or more of the KPMG International entities. KPMG International entities provide no services to clients. All rights reserved.
Policy and legislation
Technology and innovation
Infrastructure Consumer acceptance
8
7
6
5
4
3
2
1
0
Rank Country Total Score
1 US 26.11
6.94 6.57 5.78 6.82
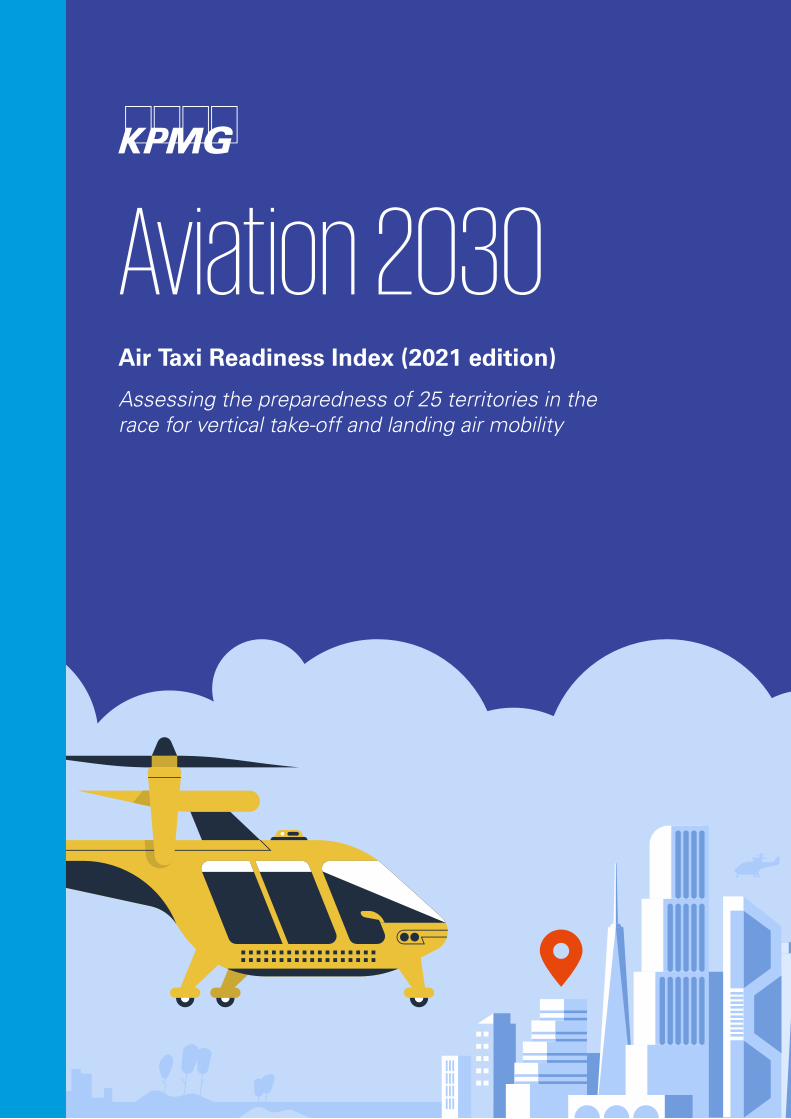
The view of Satyanarayan Ramamurthy, Partner, KPMG in Singapore:
� Singapore came second overall, second in consumer acceptance, sixth in infrastructure, third in technology and innovation, and third in policy and innovation. Within the pillars, it achieved especially high scores for user penetration, digital skills and individual readiness to use technology.
� Singapore has set out very deliberately to be a leader in the air taxi space as a complement to its bid to become the world’s first ‘smart’ nation. In recent years they have completed traffic management trials for drone-flying areas and launched the ‘Maritime Drone Estate’ to provide a test bed for drone technologies with maritime applications, working with a wide range of international companies. 38
� Singapore faces challenges in deploying air taxis including congested airspace, tropical climatic conditions, and a densely populated urban environment, but it has an open and progressive approach to regulating innovation, with government ministries and statutory boards keen to facilitate the deployment of new technologies. As a result, many companies see Singapore as a natural test bed for subsequent regional and global expansion.
� Leading players such as Bell Helicopter and Volocopter have announced intentions to begin commercial operations in Singapore before 2025, and the world’s first vertiport prototype was showcased in Singapore in 2019. 39
Policy and legislation
Technology and innovation
Infrastructure Consumer acceptance
8
7
6
5
4
3
2
1
0
Rank Country Total Score
2 Singapore 21.88
7.18 4.88 3.92 5.90
38 Maritime and Port Authority of Singapore, 202139 TransportUp, 2019
10
© 2021 Copyright owned by one or more of the KPMG International entities. KPMG International entities provide no services to clients. All rights reserved.
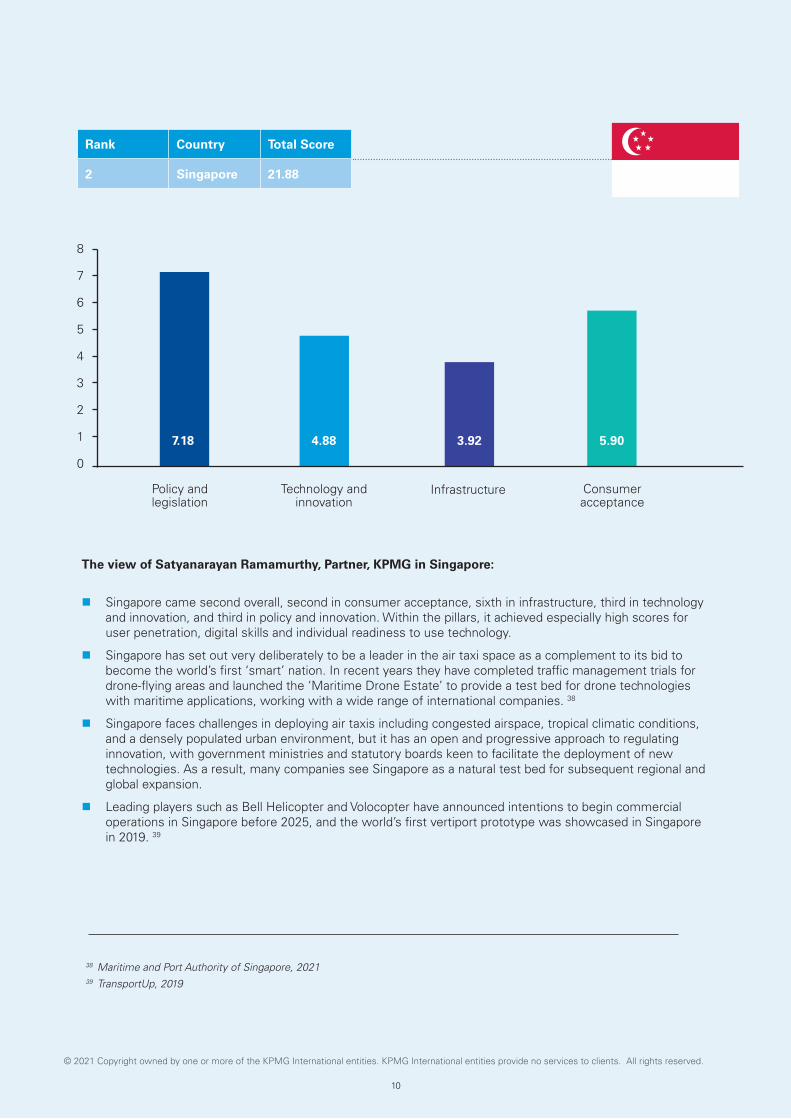
The view of Nils de Pee, Senior Consultant, KPMG in the Netherlands:
� The Netherlands placed third overall, coming top in policy and legislation, third in technology and innovation, second in consumer acceptance, and gaining its lowest score in infrastructure (eighth).
� This means that the Netherlands is the highest-ranking European country in the index.
� The Netherlands is one of three participants in the EU’s AMU-LED, a Horizon 2020 project aimed at understanding and proving the safety of a range of drone operations over European cities. This is one of the largest such demonstrations globally so far and the Netherlands hosts two key sites in Rotterdam and Amsterdam.
� Regulation will likely happen at the European level. EASA is aiming to deliver a regulatory package fit for manned VTOL air taxi operations by 2023. 40
� 2020 saw the launch of Dutch Drone Delta, an alliance whose goal is “creating sustainable social, economic and environmental impact through drones and Urban Air Mobility”. The alliance comprises 13 major organizations including KLM Royal Dutch Airlines, Royal Schiphol Group and Dutch air traffic control and is expected to accelerate the Netherlands’ journey to air taxi deployment. 41
Policy and legislation
Technology and innovation
Infrastructure Consumer acceptance
8
7
6
5
4
3
2
1
0
7.19 4.99 3.77 5.83
40 Urban Air Mobility News, 202141 Dutch Drone Delta, 2020
11
© 2021 Copyright owned by one or more of the KPMG International entities. KPMG International entities provide no services to clients. All rights reserved.
Rank Country Total Score
3 Netherlands 21.78

Policy and legislation
Technology and innovation
Infrastructure Consumer acceptance
8
7
6
5
4
3
2
1
0
Rank Country Total Score
4 UK 20.41
7.11 3.87 3.71 5.72
12
© 2021 Copyright owned by one or more of the KPMG International entities. KPMG International entities provide no services to clients. All rights reserved.
The view of Joe Taylor, Manager, KPMG in the UK:
� The UK is ranked fourth overall, coming fourth place in policy and legislation, sixth place technology and innovation and consumer acceptance categories, but only 10th in infrastructure.
� Policy and legislation is by far the top ranked pillar. The UK is leveraging mature regulatory functions and significant government investment, enabling upfront work to develop the overall business ecosystem for air taxis. Operators, aircraft manufacturers, air traffic management, physical assets and infrastructure providers are being encouraged to work together to create viable and sustainable concepts of operation.
� The country which safely develops this overall ecosystem, not the best aircraft, will likely win the race to a truly viable air taxi concept market, and so whilst it doesn’t score the highest in infrastructure or technology, the UK could still have the edge if it continues to focus on the whole picture.
� Aligning with ambitious targets for decarbonizing aviation by 2040, the government is investing GBP84m for new technology for green aviation to develop new aircraft and propulsion systems, and GBP125m in a future flight challenge, aiming to create the wider aviation infrastructure and systems of the future.
� The civil authority’s innovation sandbox and regulatory lab is already supporting several programs and successful demonstrations including dozens of companies. This initiative is complemented by a number of accelerators for start-ups, run by UK Research and Innovation and public sector catapults.
� The UK has a thriving aviation start up community, complementing a significant heritage in aerospace and defence. Leading unmanned aircraft system traffic management providers such as Altitude Angel are looking to automate air traffic control for autonomous vehicles, and manufacturers such as Vertical Aerospace are forging partnerships with the likes of Rolls Royce to develop the most advanced eVTOL, amongst many others.
� The geography and existing transport environment of the UK provides diverse use cases for the air taxi market. This includes shuttle services to complement ageing and complex city transport networks, improving regional and rural connectivity, and supporting coastal economic activity such as ports and oil and gas.

Policy and legislation
Technology and innovation
Infrastructure Consumer acceptance
8
7
6
5
4
3
2
1
0
6.77 4.06 4.08 5.22
42 Uber, 201943 New Atlas, 202044 Australian Government, 2021
13
© 2021 Copyright owned by one or more of the KPMG International entities. KPMG International entities provide no services to clients. All rights reserved.
The view of Munya Ahmed, Senior Consultant, KPMG in Australia:
� Australia ranked fifth in the index, narrowly behind the UK, achieving its highest rankings in both infrastructure (fourth) and technology and innovation, and its lowest in consumer acceptance (10th).
� Before stepping back from air mobility, Uber had announced in 2019 that Melbourne would be one of the launch cities for its proposed air taxi service, with a view to offering commercial operations by 2023. 42
� Eight cities account for 70% of the population of Australia, though very high population density is only found in Melbourne and Sydney. These cities will likely be the areas of highest demand and greatest potential for infrastructure integration with existing transport hubs.
� Australia aspires to be a global leader in the production of clean hydrogen by 2030, which may facilitate its adoption of next-gen VTOL aircraft operating hydrogen powertrains. At least one Australian start-up has already embarked on this route, which can in theory provide far greater ranges than battery-powered VTOL and therefore be particularly suitable for medical use cases in remote communities. 43
� In 2021, the Australian Government announced a two-year, AUD32.6 million ‘Emerging Aviation Technology Partnerships’ program, aimed at supporting “the use of emerging aviation technologies to address priority community, mobility, and cargo needs”. This will include work on VTOL aircraft. 44
Rank Country Total Score
5 Australia 20.13

The view of Norbert Meyring, Partner, KPMG in China:
� China ranked sixth overall, but is a clear leader in infrastructure, with high scores for prevalence of drone technology firms and drone-related patents registered. China also scored highest of all countries in its rate of user penetration for ride hailing and taxi services, indicating high levels of public acceptance.
� Guangzhou-based Ehang is one of the major global players, having performed numerous demo flights around the world. It is moving ahead with unmanned designs, both short-range for city travel and long-range for intercity travel.
� Ehang is also developing a network of vertiports in China and has this year unveiled plans to construct Europe’s first vertiport in Italy. 44
� In contrast to many other national approaches, Ehang and Chinese regulators are prioritizing the acceleration of unmanned drone designs over manned, civil aviation authority, implying unmanned aviation may become the primary form of air transportation in the future. 45
Policy and legislation
Technology and innovation
Infrastructure Consumer acceptance
8
7
6
5
4
3
2
1
0
Rank Country Total Score
6 China 20.00
4.66 3.86 5.58 5.90
44 Industry Europe, 202145 New Atlas, 2021
14
© 2021 Copyright owned by one or more of the KPMG International entities. KPMG International entities provide no services to clients. All rights reserved.
Policy and legislation
Technology and innovation
Infrastructure Consumer acceptance
8
7
6
5
4
3
2
1
0
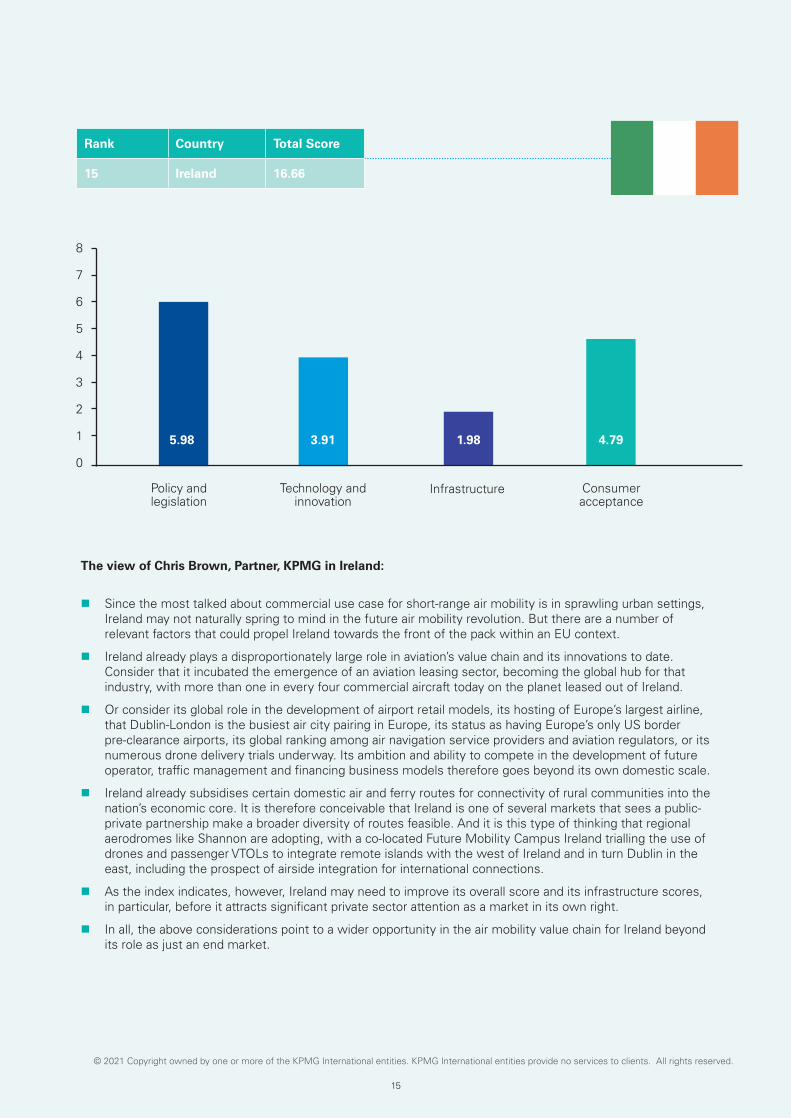
5.98 3.91 1.98 4.79
The view of Chris Brown, Partner, KPMG in Ireland:
� Since the most talked about commercial use case for short-range air mobility is in sprawling urban settings, Ireland may not naturally spring to mind in the future air mobility revolution. But there are a number of relevant factors that could propel Ireland towards the front of the pack within an EU context.
� Ireland already plays a disproportionately large role in aviation’s value chain and its innovations to date. Consider that it incubated the emergence of an aviation leasing sector, becoming the global hub for that industry, with more than one in every four commercial aircraft today on the planet leased out of Ireland.
� Or consider its global role in the development of airport retail models, its hosting of Europe’s largest airline, that Dublin-London is the busiest air city pairing in Europe, its status as having Europe’s only US border pre-clearance airports, its global ranking among air navigation service providers and aviation regulators, or its numerous drone delivery trials underway. Its ambition and ability to compete in the development of future operator, traffic management and financing business models therefore goes beyond its own domestic scale.
� Ireland already subsidises certain domestic air and ferry routes for connectivity of rural communities into the nation’s economic core. It is therefore conceivable that Ireland is one of several markets that sees a public-private partnership make a broader diversity of routes feasible. And it is this type of thinking that regional aerodromes like Shannon are adopting, with a co-located Future Mobility Campus Ireland trialling the use of drones and passenger VTOLs to integrate remote islands with the west of Ireland and in turn Dublin in the east, including the prospect of airside integration for international connections.
� As the index indicates, however, Ireland may need to improve its overall score and its infrastructure scores, in particular, before it attracts significant private sector attention as a market in its own right.
� In all, the above considerations point to a wider opportunity in the air mobility value chain for Ireland beyond its role as just an end market.
15
© 2021 Copyright owned by one or more of the KPMG International entities. KPMG International entities provide no services to clients. All rights reserved.
Rank Country Total Score
15 Ireland 16.66

Policy and legislation
Technical and innovation
Infrastructure Consumer acceptance
8
7
6
5
4
3
2
1
0
5.28 3.29 2.55 4.30
The view of Ozturk Taspinar, Partner, KPMG in Belgium:
� Belgium occupies a unique position as host of the EU legislative capital, with high population density, deep infrastructure networks, and a federated governance system, all of which facts have both upsides and downsides for its air taxi adoption.
� Belgium’s compact scale makes it a particularly suitable location to translate domestic flights into VTOL air mobility solutions, giving it the potential to attract significant global investment. However, the absence of quick wins to facilitate operational authorizations may dampen confidence.
� Belgium’s multi-layered government structures are complicating the governance framework for VTOL initiatives. One important indicator is the lack of a central (national) funding program. The implementation of the U-Space requires coordination by a national government entity (like the Federal Ministry of Transport).
� This has a knock-on effect on infrastructure. While dense and solid 4G/4G+ connectivity is available, all other infrastructure scores require coordinated investments to bring them up to speed with top performers on this indicator.
� Belgium hosts a number of technical and innovative initiatives that could boost its overall ranking in Technical & Innovation, such as the “Sixth Network”, a collaboration between Proximus (National Telecom operator), SkeyDrone (subsidiary of ANSP with ambition to become a USSP) and DroneMatrix (drone as a service provider). The Sixth Network is a platform to enable on-demand business drone missions, aiming to overcome Belgium’s institutional complexity and enable national, widespread VTOL use-cases across sectors.
� Belgian consumer acceptance has been positively influenced in recent times through the adoption of drones in a range of public security settings including medical, policing, crowd management, industrial, and flood response. However a more coordinated approach will likely be key to lift performance on this metric further.
� The adoption of the new European U-Space regulatory package is expected to be a key milestone for Belgium. The civil aviation authority has a key role to initiate an airspace risk assessment and concept of operations which should be critical to adoption of U-Space. Several established geo-zones have designated managers (Port of Antwerp, Droneport, skeyes/Brussels Airport Company) who are facilitating the use of drone applications and use case experimentation.
� Considering the above it is believed that the Belgian air mobility value chain has what it takes to become a global air taxi front runner, generating significant value to its citizens, economy, and sustainability agenda.
Rank Country Total Score
17 Belgium 15.41
16
© 2021 Copyright owned by one or more of the KPMG International entities. KPMG International entities provide no services to clients. All rights reserved.
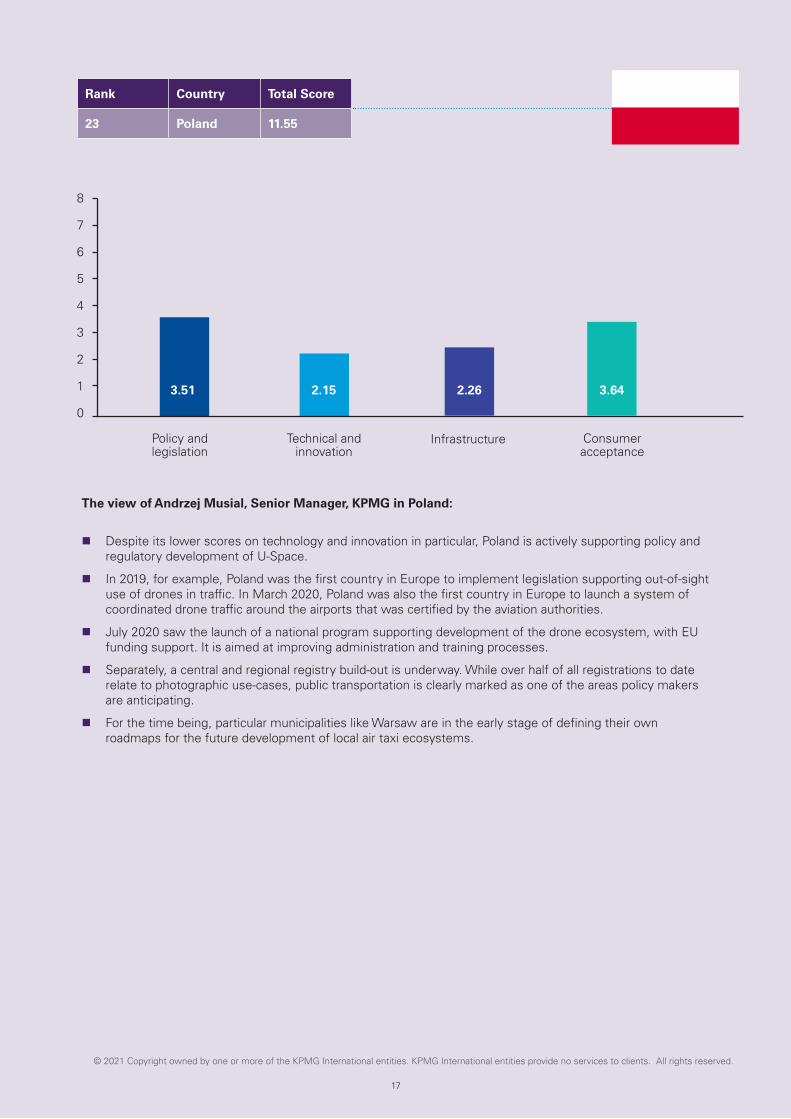
The view of Andrzej Musial, Senior Manager, KPMG in Poland:
� Despite its lower scores on technology and innovation in particular, Poland is actively supporting policy and regulatory development of U-Space.
� In 2019, for example, Poland was the first country in Europe to implement legislation supporting out-of-sight use of drones in traffic. In March 2020, Poland was also the first country in Europe to launch a system of coordinated drone traffic around the airports that was certified by the aviation authorities.
� July 2020 saw the launch of a national program supporting development of the drone ecosystem, with EU funding support. It is aimed at improving administration and training processes.
� Separately, a central and regional registry build-out is underway. While over half of all registrations to date relate to photographic use-cases, public transportation is clearly marked as one of the areas policy makers are anticipating.
� For the time being, particular municipalities like Warsaw are in the early stage of defining their own roadmaps for the future development of local air taxi ecosystems.
Policy and legislation
Technical and innovation
Infrastructure Consumer acceptance
8
7
6
5
4
3
2
1
0
Rank Country Total Score
23 Poland 11.55
3.51 2.15 2.26 3.64
17
© 2021 Copyright owned by one or more of the KPMG International entities. KPMG International entities provide no services to clients. All rights reserved.

Policy and legislation
Technology and innovation
Infrastructure Consumer acceptance
4.240.32
2.52 3.00
The view of Vasudevan S, Partner, KPMG in India:
� While India was included in the rankings, its rapid pace of socio-economic change means it more likely jumps around the rankings, depending on which exact metrics are taken and how up to date and / or forward looking those sources are.
� With one of the largest populations in the world and huge challenges around urban congestion, India’s potential as a market for next-generation mobility solutions is clear, but air taxi services are currently being held back by a range of obstacles.
� A new civil aviation policy in 2016 was aimed at supporting mass adoption of aviation. Key focus areas of the policy were augmenting regional airport infrastructure and enhancing air connectivity to Tier-2 and Tier-3 cities, with the government subsidizing operators for connecting remote regions. India’s first air taxi service (using a conventional four-seater plane) was inaugurated under the scheme in Chandigarh in January 2021.
� Current policy is geared towards making advanced light helicopters serve the demands of urban mobility gaps. For instance, creating a network of heliports. But these efforts could pivot easily to support the growth of new VTOL technologies.
� The civil aviation secretary aims to make helicopter operations viable and affordable for passengers, through policies such as reducing taxes on air turbine fuel, and boosting MRO activities for helicopters. These policies should encourage investment in the helicopter industry with knock-on effects for air taxis in the long run.
� India has recently allowed trials for drone deliveries but more work is needed to create the infrastructure, policy and technology to support widespread air-taxi operations. As per the recently released Drone Rules 2021, which aim to clarify the rules around UAVs (unmanned aerial vehicles), drone corridors will likely be developed for cargo deliveries and a drone promotion council should facilitate a drone-friendly regulatory regime in the country. This should promote integration of air-taxi services with UAVs, particularly for perishable and time-sensitive cargo for civil and defense purposes.
� There are indigenous organizations delivering drone technology and a host of medium and small enterprises are actively building component manufacturing capability, but a huge step up is required among the participants of the value chain to move from drones to air taxis.
Rank Country Total Score
24 India 10.08
© 2021 Copyright owned by one or more of the KPMG International entities. KPMG International entities provide no services to clients. All rights reserved.
18
8
7
6
5
4
3
2
1
0

19
© 2021 Copyright owned by one or more of the KPMG International entities. KPMG International entities provide no services to clients. All rights reserved.
Of course, this year’s index is only a portion of the territories with exciting developments in unmanned flight. Here this report briefly considers examples elsewhere, and their implications for air taxi markets in future.
Another European example: Hungary
How governments regulate smaller unmanned drones likely sets the picture for future air taxi and larger unmanned cargo VTOL. On this basis, Hungarian drone regulation is an example of a generally stricter environment. As a consequence, it tends to be larger enterprises in infrastructure and agriculture that have invested to date. It will be interesting to follow how this impacts the country’s future approach to air taxis. Is current regulation specifically attempting to mitigate the risks of widespread personal drone ownership? Or does it show a pragmatic desire to let the teething problems of new aviation sectors work themselves out elsewhere first?
Sub-Saharan Africa
With only around a third of Africa’s population living within 2km of an all-weather road, huge potential exists to overcome ground-based infrastructural challenges through drones. Several cross-border competitions and initiatives have been set up to explore this potential.
Many African countries have not yet begun to elaborate drone regulations, despite their everyday use, but Rwanda’s performance-based regulation has made it a leader and an attractive place for drone startups to prove concepts. Agriculture is a major use case, with an emphasis on crop monitoring and soil scanning.
In the small drone space, novel designs have already emerged for local physical conditions and purchasing power. That level of localization within air taxi designs, however, may be cost prohibitive. While global roll-out of air taxis for offshore oil and gas may mean more consistent adoption in Angola or Nigeria, for example, it will be interesting to see whether Asian or Western-led OEMs emerge in the wider market opportunity, and whether commercial models continue to emerge ahead of supporting regulation.

© 2021 Copyright owned by one or more of the KPMG International entities. KPMG International entities provide no services to clients. All rights reserved.
20
Concluding thoughts
Whatever the exact timescale, air taxis will likely revolutionize urban mobility around the world in the coming decades, but some countries are more ready than others for that revolution. To conclude, let’s consider some implications by stakeholder type.
OEMs and supply chain Investors and lessors
� OEMs looking to achieve dominance in the VTOL market need to actively drive high-level policy planning for integration of the technology across airspace management, infrastructure planning, and public acceptance.
� Particularly with the currently crowded field of aspirant OEMs and operators, consistency across borders is expected to help scale the commercial feasibility of air taxis generally.
� Existing aviation OEMs face competition not traditionally associated with aviation, including well-financed start-ups, tech companies and car manufacturers. Longer term, the crowded field is likely to consolidate.
� With many ‘national champions’ playing in this space, it’s expected for some countries to unofficially have preferred manufacturers from the outset. Choose your priority markets carefully.
� Much of the aerospace supply chain has had a disruptive reminder during the pandemic of its concentration risk with 1-2 OEMs. VTOLs offer a once-in-a-generation opportunity for revenue diversification. However, since many of today’s OEMs may not survive a future consolidation, cultivate multiple relationships while managing the time spent on any one OEM until firm income streams are in place.
� Some tempting markets, such as India or Brazil, will likely require a long-term perspective on returns; investors should look carefully and comprehensively at readiness of target markets, not only size.
� It is anticipated that a new cohort of VTOL-only lessors is drawn to this growing market – a mix of private capital and institutional sub-brands. The question is whether or not existing lessors want to be part of the air taxi value chain, with a customer base spanning tech giants, reimagined automotive brands, transport companies and local government.
� Exposure to air taxis as an asset class not only defends traditional aviation lessors from long-term cannibalization of regional aircraft, but with a vehicle size much more compatible with the limitations of battery technology, electric VTOLs offer an opportunity for lessors to ‘green’ their portfolio – monetizing a shift to sustainability as opposed to seeing it as just costs and risk management.

© 2021 Copyright owned by one or more of the KPMG International entities. KPMG International entities provide no services to clients. All rights reserved.
21
Infrastructure providers National policy makers
� Given the likely regulatory restrictions around VTOL mobility in the urban environment, mass adoption will likely require extensive bespoke vertiport infrastructure. Existing infrastructure providers (including airports, coach terminals, railway stations) have an opportunity to partner with VTOL players to service that need.
� A new market in asset repurposing is likely, as prime-located existing infrastructure (e.g. car parks) is repurposed to support vertiport operations.
� Much of the maintenance opportunity may be on the vertiport side, with high frequency turnarounds and urban operating environments meaning more intensive maintenance and repair budgets.
� Future proofing new landmark commercial, residential and mixed-use developments with landing sites for VTOLs will likely be in the interests of major developers in many cities.
� Policy makers will likely have widely different degrees of public acceptance and knowledge to contend with and may in many cases need to actively promote public acceptance if they wish to facilitate VTOL adoption. This may involve assuaging concerns around noise and environmental impact.
� Air Navigation Service Providers (ANSPs) will likely require investment to build suitable air traffic management infrastructure (see below).
� Best practice will be available through international fora such as the World Economic Forum’s recent ‘Seven UAM principles’.
� Policymakers who wish to accelerate the roll out of air taxis in their geography should first know which pillars of readiness are holding them back and address them accordingly. For some countries, the proxy approach suggests it is particular areas that bring down the overall average, and depending on which metrics those are, materially different strategies should be adopted. If, for example, cyber security scores poor nationally, this is, in relative terms, something that can be ‘bought in’ from a geopolitical ally at reasonable cost. If public attitudes to change or technology score low, a thoughtful and sustained communications campaign may help. Yet if climate conditions are challenging, for example, sub-national policy and incentive strategies may be required.
� Investment in the VTOL ecosystem (for passenger and cargo use cases) will likely bring large economic benefits to those regions they cover. Policy makers should weigh up the early mover advantage and potential to accelerate economic growth through connectivity, with the advantages of seeing teething problems elsewhere before learning from others’ mistakes.

© 2021 Copyright owned by one or more of the KPMG International entities. KPMG International entities provide no services to clients. All rights reserved.
22
� The need for regulators to engage is urgent in many jurisdictions to avoid unplanned deployment and the PR setbacks likely attendant on that.
� New players from tech, independent start-ups and space agencies entering the Unmanned Aircraft System Traffic Management (UTM) market should be expected.
� There will likely be new revenue opportunities from the provision of training, licensing and consultancy work in the area of airspace designs, systems integration and operations set-up, as well as UTM services to VTOL operators.
� Regulators are expected to be critical to the commercial viability of VTOL operators in each jurisdiction and should actively seek out global best practices to help ensure their home industry is not left behind.
� ANSPs should establish the costs of monetizing this opportunity. Leading ANSPs would like to increasingly digitize their offering this decade, with increased use of AI. But upgrading core systems at scale is tough – would it be better to trial automation in air traffic control first on UAVs, then passenger VTOLs? Once the system works, it can be scaled back up to conventional airspace. The investment in VTOLs would therefore not be an additional cost, but rather a lower risk approach to core air traffic control upgrades. In practice, however, this may not be led by many ANSPs given constraints of existing regulation, standards & unions. Digitalization of air traffic control is more likely to be led by tech start ups specifically for unmanned operations. These then provide use cases for expanding to traditional ANSP operations.
� Regulators will probably require bespoke frameworks around noise and designated rights of way in urban environments, as well as vertiport positioning and specs.
ANSPs and regulatorsOperators and Mobility-as-a-Service providers
� With infrastructure costs being substantially lower than road and rail, VTOL mobility has the potential to seriously disrupt existing urban and regional transport plans.
� Geographies with limited existing infrastructure may have an opportunity to leapfrog expensive ground-based development programs. Whether state led or merely state enabled, here is an opportunity to get more ‘bang for buck’ than high-speed rail and other infrastructure. Yet those countries with poorer ground infrastructure to date, also tend to have less of the required technology infrastructure.
� Joint ventures are likely needed between ground mobility / tech companies and OEMs looking to bridge the expertise and skills gap between urban mobility and air travel.
© 2021 Copyright owned by one or more of the KPMG International entities. KPMG International entities provide no services to clients. All rights reserved.
23
Local government, airports & public transport bodies
� Existing major airports will likely need substantial additional vertiport assets to service the anticipated demand for local and regional air taxi travel. Newbuild terminals can start incorporating vertiport design today, while existing operations should factor in the required build work to help minimize disruption.
� While some downtown vertiports could conceivably check passengers in for international connections, with full airside integration at the airport, many airports will still likely require security checks before passengers fully merge airside.
� Given the small size of VTOLs, heavy luggage for onward travel is impractical. Therefore, expect the roll-out of integrated luggage services already prominent in the likes of Japan. For example, drop your checked luggage in advance at the local shop or post office, for collection at your end destination.
� The workforce will likely need to be upskilled and their processes redesigned to manage VTOL maintenance in airports and vertiports, with increased volumes and faster turnarounds.
� When VTOL ranges grow to facilitate regional travel, local governments may find themselves required to regulate from a position of zero experience.
� Note that attracting private sector investment in the ecosystem does not necessarily involve a large public purse - rather, private participants tend to respond well to supportive, stable local government.

© 2021 Copyright owned by one or more of the KPMG International entities. KPMG International entities provide no services to clients. All rights reserved.
24
AppendixNormalized scores

© 2021 Copyright owned by one or more of the KPMG International entities. KPMG International entities provide no services to clients. All rights reserved.
25
Country Consumer acceptance Infrastructure
Australia 0.859 0.755 0.749 0.402 0.544 0.684 0.337 0.891 5.220 0.001 0.842 0.079 0.625 0.538 0.700 0.733 0.109 0.450 4.076
Belgium 0.719 0.550 0.674 0.330 0.594 0.575 0.116 0.744 4.301 0.003 0.792 0.011 0.500 0.297 0.580 0.233 0.131 0.000 2.547
Brazil 0.000 0.393 0.000 0.592 0.000 0.428 0.464 0.936 2.813 0.000 0.324 0.107 0.000 0.099 0.200 0.711 0.326 0.358 2.125
Canada 0.797 0.514 0.770 0.496 0.662 0.629 0.659 0.923 5.450 0.008 0.824 0.097 0.583 0.481 0.660 0.165 0.243 0.449 3.510
China 0.625 0.492 0.609 1.000 0.420 0.764 1.000 0.987 5.898 1.000 0.873 0.711 0.292 0.805 0.500 0.489 0.413 0.500 5.582
France 0.422 0.482 0.544 0.598 0.747 0.685 0.337 0.885 4.700 0.012 0.560 0.073 0.458 0.275 0.660 0.700 0.283 0.300 3.322
Germany 0.578 0.548 0.767 0.694 1.000 0.624 0.123 0.942 5.278 0.023 0.553 0.115 0.833 0.284 0.660 0.422 0.219 0.283 3.392
India 0.172 0.000 0.521 0.862 0.053 0.000 0.420 0.968 2.996 0.000 0.859 0.177 0.042 0.000 0.000 0.589 0.457 0.392 2.515
Ireland 0.641 0.530 0.737 0.227 0.438 0.568 0.667 0.981 4.789 0.001 0.000 0.180 0.417 0.126 0.640 0.267 0.348 0.000 1.979
Israel 0.703 0.538 0.935 0.122 0.668 0.585 0.395 0.667 4.613 0.001 0.165 0.003 0.375 0.097 0.760 0.211 0.305 0.292 2.208
Italy 0.594 0.532 0.421 0.548 0.438 0.534 0.004 0.801 3.871 0.008 0.687 0.026 0.125 0.178 0.460 0.667 0.196 0.208 2.554
Japan 0.313 0.746 0.521 0.714 0.776 0.891 0.000 0.853 4.813 0.069 1.000 0.137 0.542 0.169 0.760 0.189 0.392 0.467 3.723
Netherlands 0.891 0.671 0.984 0.439 0.723 0.728 0.482 0.910 5.828 0.007 0.908 0.046 0.708 0.501 0.760 0.511 0.152 0.175 3.769
New Zealand 0.828 0.636 0.714 0.000 0.309 0.751 0.315 0.756 4.309 0.002 0.408 0.015 0.750 0.352 0.700 0.200 0.435 0.233 3.096
Poland 0.359 0.612 0.458 0.434 0.021 0.549 0.504 0.699 3.636 0.003 0.620 0.007 0.208 0.175 0.280 0.100 0.500 0.367 2.260
Russia 0.359 0.471 0.721 0.655 0.106 0.740 0.435 0.930 4.415 0.000 0.419 0.121 0.083 0.067 0.260 0.476 0.215 0.339 1.981
Saudi Arabia 0.453 0.653 0.867 0.483 0.045 0.613 0.717 0.839 4.670 0.000 0.553 0.000 0.250 0.606 0.320 0.756 0.087 0.408 2.980
Singapore 0.563 0.751 0.967 0.378 0.694 0.906 0.801 0.840 5.899 0.014 0.849 0.042 0.875 0.317 0.880 0.244 0.240 0.458 3.919
South Korea 0.563 0.729 0.737 0.539 0.797 1.000 0.547 0.904 5.816 0.084 0.993 0.096 0.333 0.931 0.680 0.789 0.044 0.242 4.191
Spain 0.359 0.717 0.486 0.498 0.406 0.759 0.518 0.737 4.481 0.018 0.725 0.091 0.167 0.198 0.480 0.067 0.022 0.033 1.801
Sweden 0.578 0.686 1.000 0.245 0.797 0.918 0.087 0.808 5.118 0.010 0.824 0.008 0.958 0.416 0.860 0.333 0.174 0.025 3.610
Switzerland 0.719 0.533 0.921 0.262 0.852 0.766 0.130 0.962 5.145 0.014 0.810 0.029 1.000 0.468 0.880 0.289 0.065 0.330 3.885
UAE 0.594 1.000 0.865 0.352 0.090 0.985 0.710 0.923 5.518 0.002 0.761 0.096 0.917 1.000 0.500 0.322 0.000 0.475 4.073
UK 0.781 0.598 0.716 0.603 0.773 0.674 0.605 0.974 5.725 0.024 0.989 0.150 0.792 0.242 0.760 0.178 0.261 0.317 3.713
US 1.000 0.682 0.870 0.989 0.929 0.695 0.659 1.000 6.824 0.038 0.915 1.000 0.667 0.333 1.000 0.978 0.370 0.483 5.784
Normalized scores
With thanks to Debarun Das, Manager, Global Strategy Group, KPMG in Ireland, and to Conor Tuohy, Masters research student at University College Dublin
Civ
il te
chno
logy
use
Indi
vidu
al r
eadi
ness
Dig
ital s
kills
Mar
ket
size
Inno
vatio
n ca
pabi
lity
Rid
e-H
ailin
g &
Tax
i M
arke
t Pe
netr
atio
n
Volu
me
Air
Traf
fic
per
Cap
ita
Pill
ar S
core
4G c
over
age
Qua
ntity
of
air
traf
fic
Tech
nolo
gy
infr
astr
uctu
re c
hang
e re
adin
ess
Mob
ile c
onne
ctio
n sp
eed
Clim
ate
Bro
adba
nd
Gro
und
Con
gest
ion
kysc
rape
r D
ensi
ty
EV
cha
rgin
g st
atio
ns
Pill
ar S
core
Con
sum
er IC
T ad
optio
n

© 2021 Copyright owned by one or more of the KPMG International entities. KPMG International entities provide no services to clients. All rights reserved.
26
Policy and legislation Technology and innovation
0.810 0.884 0.692 0.371 0.852 0.561 0.750 0.931 0.917 6.769 0.844 0.826 0.345 0.699 0.469 0.581 0.234 0.063 4.061 20.126
0.793 0.613 0.501 0.262 0.345 0.620 0.500 0.762 0.880 5.277 0.875 0.809 0.358 0.583 0.330 0.312 0.014 0.009 3.290 15.415
0.138 0.118 0.000 0.000 0.426 0.077 0.750 0.349 0.587 2.444 0.000 0.524 0.128 0.200 0.510 0.020 0.008 0.014 1.404 8.786
0.810 0.965 0.718 0.447 0.869 0.680 0.750 0.869 0.904 7.013 0.100 0.862 0.440 0.679 0.629 0.166 0.135 0.042 3.053 19.026
0.207 0.630 0.580 0.413 0.102 0.584 0.750 0.841 0.549 4.657 0.437 0.879 0.822 0.345 0.504 0.012 0.104 0.759 3.862 19.998
0.672 0.604 0.562 0.397 0.801 0.682 0.750 0.836 0.837 6.141 0.733 0.885 0.505 0.683 0.340 0.242 0.148 0.127 3.665 17.827
0.862 0.889 0.800 0.537 0.562 0.842 0.750 0.889 0.893 7.024 0.759 0.934 0.550 0.681 0.157 0.114 0.107 0.103 3.405 19.100
0.172 0.462 0.555 0.425 0.392 0.559 0.500 0.672 0.507 4.244 0.051 0.000 0.038 0.000 0.217 0.007 0.004 0.006 0.323 10.078
0.724 0.908 0.510 0.455 0.382 0.552 0.750 0.878 0.816 5.976 0.710 0.876 0.488 0.639 0.182 1.000 0.017 0.000 3.911 16.655
0.517 0.080 0.319 0.468 0.362 0.667 0.500 0.820 0.829 4.564 0.641 0.884 0.249 0.427 0.745 0.000 0.165 0.003 3.113 14.497
0.397 1.000 0.471 0.872 0.426 0.000 1.000 0.698 0.747 5.610 0.516 0.708 0.228 0.092 0.440 0.044 0.007 0.038 2.073 14.108
0.759 0.512 0.636 0.439 0.733 0.714 0.750 0.852 0.917 6.312 0.737 0.869 0.452 0.762 0.336 0.148 0.137 0.060 3.501 18.349
0.897 0.866 0.753 0.591 0.851 0.938 0.500 0.979 0.819 7.193 1.000 0.970 0.492 0.770 0.672 0.064 1.000 0.022 4.989 21.779
1.000 0.000 0.793 0.505 0.733 0.898 0.750 1.000 0.648 6.325 0.712 0.774 0.229 0.707 0.148 0.068 0.012 0.006 2.656 16.386
0.448 0.068 0.399 0.127 0.152 0.026 0.750 0.794 0.741 3.506 0.514 0.658 0.310 0.094 0.431 0.104 0.022 0.015 2.147 11.549
0.000 0.292 0.275 0.290 0.443 0.224 0.750 0.857 0.584 3.715 0.346 0.585 0.496 0.265 0.602 0.000 0.043 0.021 2.357 12.469
0.397 0.283 0.471 0.674 0.000 0.731 0.750 0.677 0.021 4.004 0.394 0.507 0.003 0.327 0.515 0.010 0.000 0.005 1.760 13.414
0.948 0.656 0.953 0.834 0.472 0.753 0.750 0.995 0.819 7.179 0.961 0.934 0.377 0.884 0.740 0.844 0.141 0.002 4.882 21.880
0.534 0.953 0.443 0.362 0.801 0.354 0.500 0.847 0.797 5.590 0.917 0.925 0.538 0.679 0.473 0.218 0.054 0.018 3.823 19.420
0.552 0.561 0.308 0.189 0.824 0.324 1.000 0.952 1.000 5.710 0.777 0.751 0.310 0.517 0.739 0.196 0.018 0.013 3.321 15.313
0.948 0.493 0.960 1.000 1.000 0.693 0.750 0.815 0.968 7.627 0.400 0.661 0.000 0.493 0.431 0.000 0.030 0.009 2.024 18.379
0.948 0.519 1.000 0.590 0.553 1.000 0.750 0.783 0.869 7.013 0.344 0.802 0.481 0.417 0.745 0.346 0.019 0.022 3.177 19.219
0.707 0.434 0.923 0.752 0.020 0.987 1.000 0.921 0.541 6.285 0.940 0.698 0.736 0.501 0.000 0.133 0.000 0.001 3.009 18.886
0.810 0.882 0.755 0.456 0.869 0.746 0.750 0.963 0.875 7.107 0.878 0.987 0.574 0.760 0.493 0.000 0.090 0.087 3.869 20.413
0.64 0.830 0.606 0.656 0.66 0.898 0.750 0.974 0.920 6.936 0.982 1.000 1.000 1.000 1.000 0.393 0.199 1.00 6.574 26.118
Tran
spar
ency
Ene
rgy
Eff
cien
cy
Reg
ulat
ion
Ava
ilabi
lity
of la
test
te
chno
logy
Gov
ernm
ent
read
ines
s fo
r ch
ange
Inno
vatio
n C
apab
ility
Futu
re o
rient
atio
n of
go
vern
men
t
Cyb
er s
ecur
ity
Dat
a-sh
arin
g en
viro
nmen
t
Ass
esm
ent
of c
loud
co
mpu
ting
, AI..
.
Eff
cien
cy o
f th
e le
gal
syst
em in
cha
lleng
ing
regu
latio
ns
Indu
stry
Inve
stm
ents
in
Dro
ne t
echn
olog
y
Dro
ne R
egul
atio
n
Dro
ne Te
chno
logy
Fi
rm H
eadq
uart
ers
Eas
e of
Doi
ng
Bus
ines
s
Dro
ne-R
elat
ed
Pate
nts
Sta
rt-u
p B
usin
ess
Env
ironm
ent
Mar
ket
Sha
re o
f D
rone
s
Pill
ar s
core
Pill
ar s
core
Ove
rall
sco
re

© 2021 Copyright owned by one or more of the KPMG International entities. KPMG International entities provide no services to clients. All rights reserved.
27
Contact Us
The information contained herein is of a general nature and is not intended to address the circumstances of any particular individual or entity. Although we endeavor to provide accurate and timely information, there can be no guarantee that such information is accurate as of the date it is received or that it will continue to be accurate in the future. No one should act on such information without appropriate professional advice after a thorough examination of the particular situation.
© 2021 Copyright owned by one or more of the KPMG International entities. KPMG International entities provide no services to clients. All rights reserved.
KPMG refers to the global organization or to one or more of the member firms of KPMG International Limited (“KPMG International”), each of which is a separate legal entity. KPMG International Limited is a private English company limited by guarantee and does not provide services to clients. For more detail about our structure please visit home.kpmg/governance.
The KPMG name and logo are trademarks used under license by the independent member firms of the KPMG global organization.
Produced by: KPMG’s Creative Services. Publication Date: September 2021. (7298)
home.kpmg/strategy
Christopher BrownPartnerGlobal Strategy GroupKPMG in Ireland
e: [email protected] t: +353 1700 4453
Jono AndersonPrincipalGlobal Strategy GroupKPMG in the US
e: [email protected] t: +1 858 750 7330
Joe TaylorManagerInfrastructure Advisory Group KPMG in the UK
e: [email protected]: +44 207 3116665
Ozturk TaspinarPartnerAdvisoryKPMG in Belgium
e: [email protected]: +323 821 1792